Article

Air Pollution Associated with Total Suspended Particulate and Particulate Matter in Cement Grinding Plant in Vietnam

Faculty of Safety Engineering, VŠB-Technical University of Ostrava, 70030 Ostrava, Czech Republic
*
Author to whom correspondence should be addressed.
Atmosphere 2021, 12(12), 1707; https://doi.org/10.3390/atmos12121707
Submission received: 8 November 2021 / Revised: 17 December 2021 / Accepted: 17 December 2021 / Published: 20 December 2021
(This article belongs to the Special Issue Air Pollution, Air Quality and Human Health)

Abstract

:
Air pollution associated with suspended particles has become a significant concern in Vietnam recently. The study aimed to (1) investigate dust sources; (2) measure concentration levels of Total Suspended Particulate (TSP), Particulate Matter (PM) fractions; (3) identify silica levels and the correlation with respirable particles at a cement grinding plant in Vietnam. A total of 312 samples (52 TSP, 160 PMs) at 13 processes were measured using the direct-reading dust meter. The silica composition was analyzed in a certified laboratory using the X-ray fluorescence (XRF) technique. SPSS version 26 for Window was used to analyze the data. The operations of the cement grinding plant created multiple dust sources from the jetty to the cement dispatch process. The TSP levels ranged 0.06–38.24 mg m−3, and 40.38% (n = 21) TSP samples exceeded the Permissible Exposure Limit (PEL) for an 8-h working shift. Besides that, there was a wide range and significant concentration levels of PMs in the cement processes. The levels of PMs were PM1 (0.00–0.06 mg m−3), PM2.5 (0.01–0.83 mg m−3), PM4 (0.02–4.59 mg m−3), PM7 (0.03–16.94 mg m−3), and PM10 (0.04–26.85 mg m−3). The highest mean levels of PMs factions were measured at the pre-grinding process. The inefficient operation of the dust collector contributed a significant factor to the dust dispersion in this process. The silica’s mean (SD) composition in respirable dust was 20.4% (0.86) and was not significantly different amongst the processes. There was a significant correlation between the levels of respirable dust and silica exposure in the cement grinding plant (r = 0.99). The improvement of indoor air quality is needed to prevent health effects on cement workers.

1. Introduction

Air pollution is one of the most significant environmental risks to health globally, significantly affecting low and middle-income countries. The common indicators used for evaluating air quality and health effects are Total Suspended Particulate (TSP) and Particulate Matter (PM) [1]. According to the International Standardization Organization (ISO), “Dust is small solid particles, conventionally taken as those particles below 75 µm in diameter, which settle out under their own weight but which may remain suspended for some time” [2]. Dust is defined as small, dry, solid particles projected into the air by natural forces, such as wind, volcanic eruption, and by mechanical or artificial processes such as crushing, grinding, milling, drilling, demolition, shoveling, conveying, screening, bagging, and sweeping. Dust particles are usually in size range from about 1 to 100 µm in diameter, and they settle slowly under the influence of gravity [3]. Particulate matter is a mixture of solid and liquid particles in the air that is small enough not to settle onto the Earth’s surface under the influence of gravity, classified by aerodynamic diameter [1]. Depending on the aerodynamic diameter, the airborne particle fractions are inhaled and deposited in the various regions of the respiratory system. Inhalable particulate fraction is that fraction of a dust cloud that can be breathed into the nose and mouth. Thoracic particulate fraction is that fraction that can penetrate the head airways and enter the airways of the lung. The respirable particulate fraction is that fraction of inhaled airborne particles that can penetrate beyond the terminal bronchioles into the gas-exchange region of the lungs [2,4].
Silicon dioxide (SiO2), commonly knowns as silica, is one of the most prevalent chemical compounds in the earth’s crust. Materials containing silica are extensively used in various industries such as construction, cement industry, and mining [5]. Prolonged occupational exposure to silica has long been recognized as a threat to workers’ health, causing autoimmune diseases, silicosis, tuberculosis, and lung cancer [6,7,8,9]. Besides that, silica-exposed workers are at an increased risk of heart disease, especially pulmonary heart disease [10]. The cement industry is one of the significant emission sources of suspended particles containing silica. In the cement manufacturing line, suspended particles were generated and dispersed to the workplace environment from the crusher, packing, cement mill, and raw mill [11]. Typically, particle sizes of Portland cement vary from <1 µm to 100 µm in diameter [12]. The fine particles are potentially inhaled and penetrate deep into the respiratory system, causing health effects. The previous studies reported that the total dust and respirable dust concentration exceeded the Permissible Exposure Limit (PEL) in the cement manufacturing processes. These processes consisted of the crusher, raw mill, kiln, cement mill, and packing machine [11,13,14]. Prolonged exposure to cement dust can potentially lead to chronic bronchitis, respiratory diseases, and cancer [15,16,17,18,19,20,21,22,23]. Exposure to cement dust caused different effects on workers’ health, such as cough, chest tightness, impairment of lung function, irritation of eyes, runny eyes, skin irritation, stomachache, headache, and hemoglobin concentration [15,24,25].
In Vietnam, the cement industry has been developing since 1899 and plays an important role in economic development. In 2019, Vietnam was the third largest cement producer in the world with a production volume of 99 million tons. Until 2020, 90 cement manufacturing lines have been constructed and operated in the country with a capacity of 108 Mt [26]. Furthermore, the Vietnamese authorities have approved the development strategy of the cement industry from 2021 to 2030, with an increased capacity of 150 Mt per annum [27]. However, cement workers are exposed to various harmful factors in the workplace, which leads to occupational diseases. The typical harmful elements in the cement manufacturing processes were noise and particle matter [14,21,25,28,29].
Ho Chi Minh City (HCMC) is the largest city located in the South of Vietnam, where growing industrial activity contributed to air pollution. Air pollution is a significant issue reducing the quality of life of HCMC’s residents [30]. A limited number of studies reported the PM concentration levels in the ambient environment and their effects in HCMC. A study in HCMC in 2017 reported that the annual PM2.5 concentration level was 0.03 mg m−3, which exceeded the Vietnamese National Standard (0.025 mg m−3) for 14 days and exceeded the WHO guideline for PM2.5 (0.01 mg m−3) for 222 days [31]. Other studies published the adverse impact of coarse particulate matter (PM10) on the population health in HCMC [32,33,34,35]. However, these studies have just focused on the evaluation of the PMs in the ambient environment. There is currently no research to evaluate the different particle size distributions and silica concentration in the cement plant. This study aimed to identify dust sources, assess the distribution of TSP, and different PMs fraction sizes in the cement grinding processes. In addition, the study aimed to determine the correlation between respirable dust concentration levels and silica exposure.

2. Materials and Methods

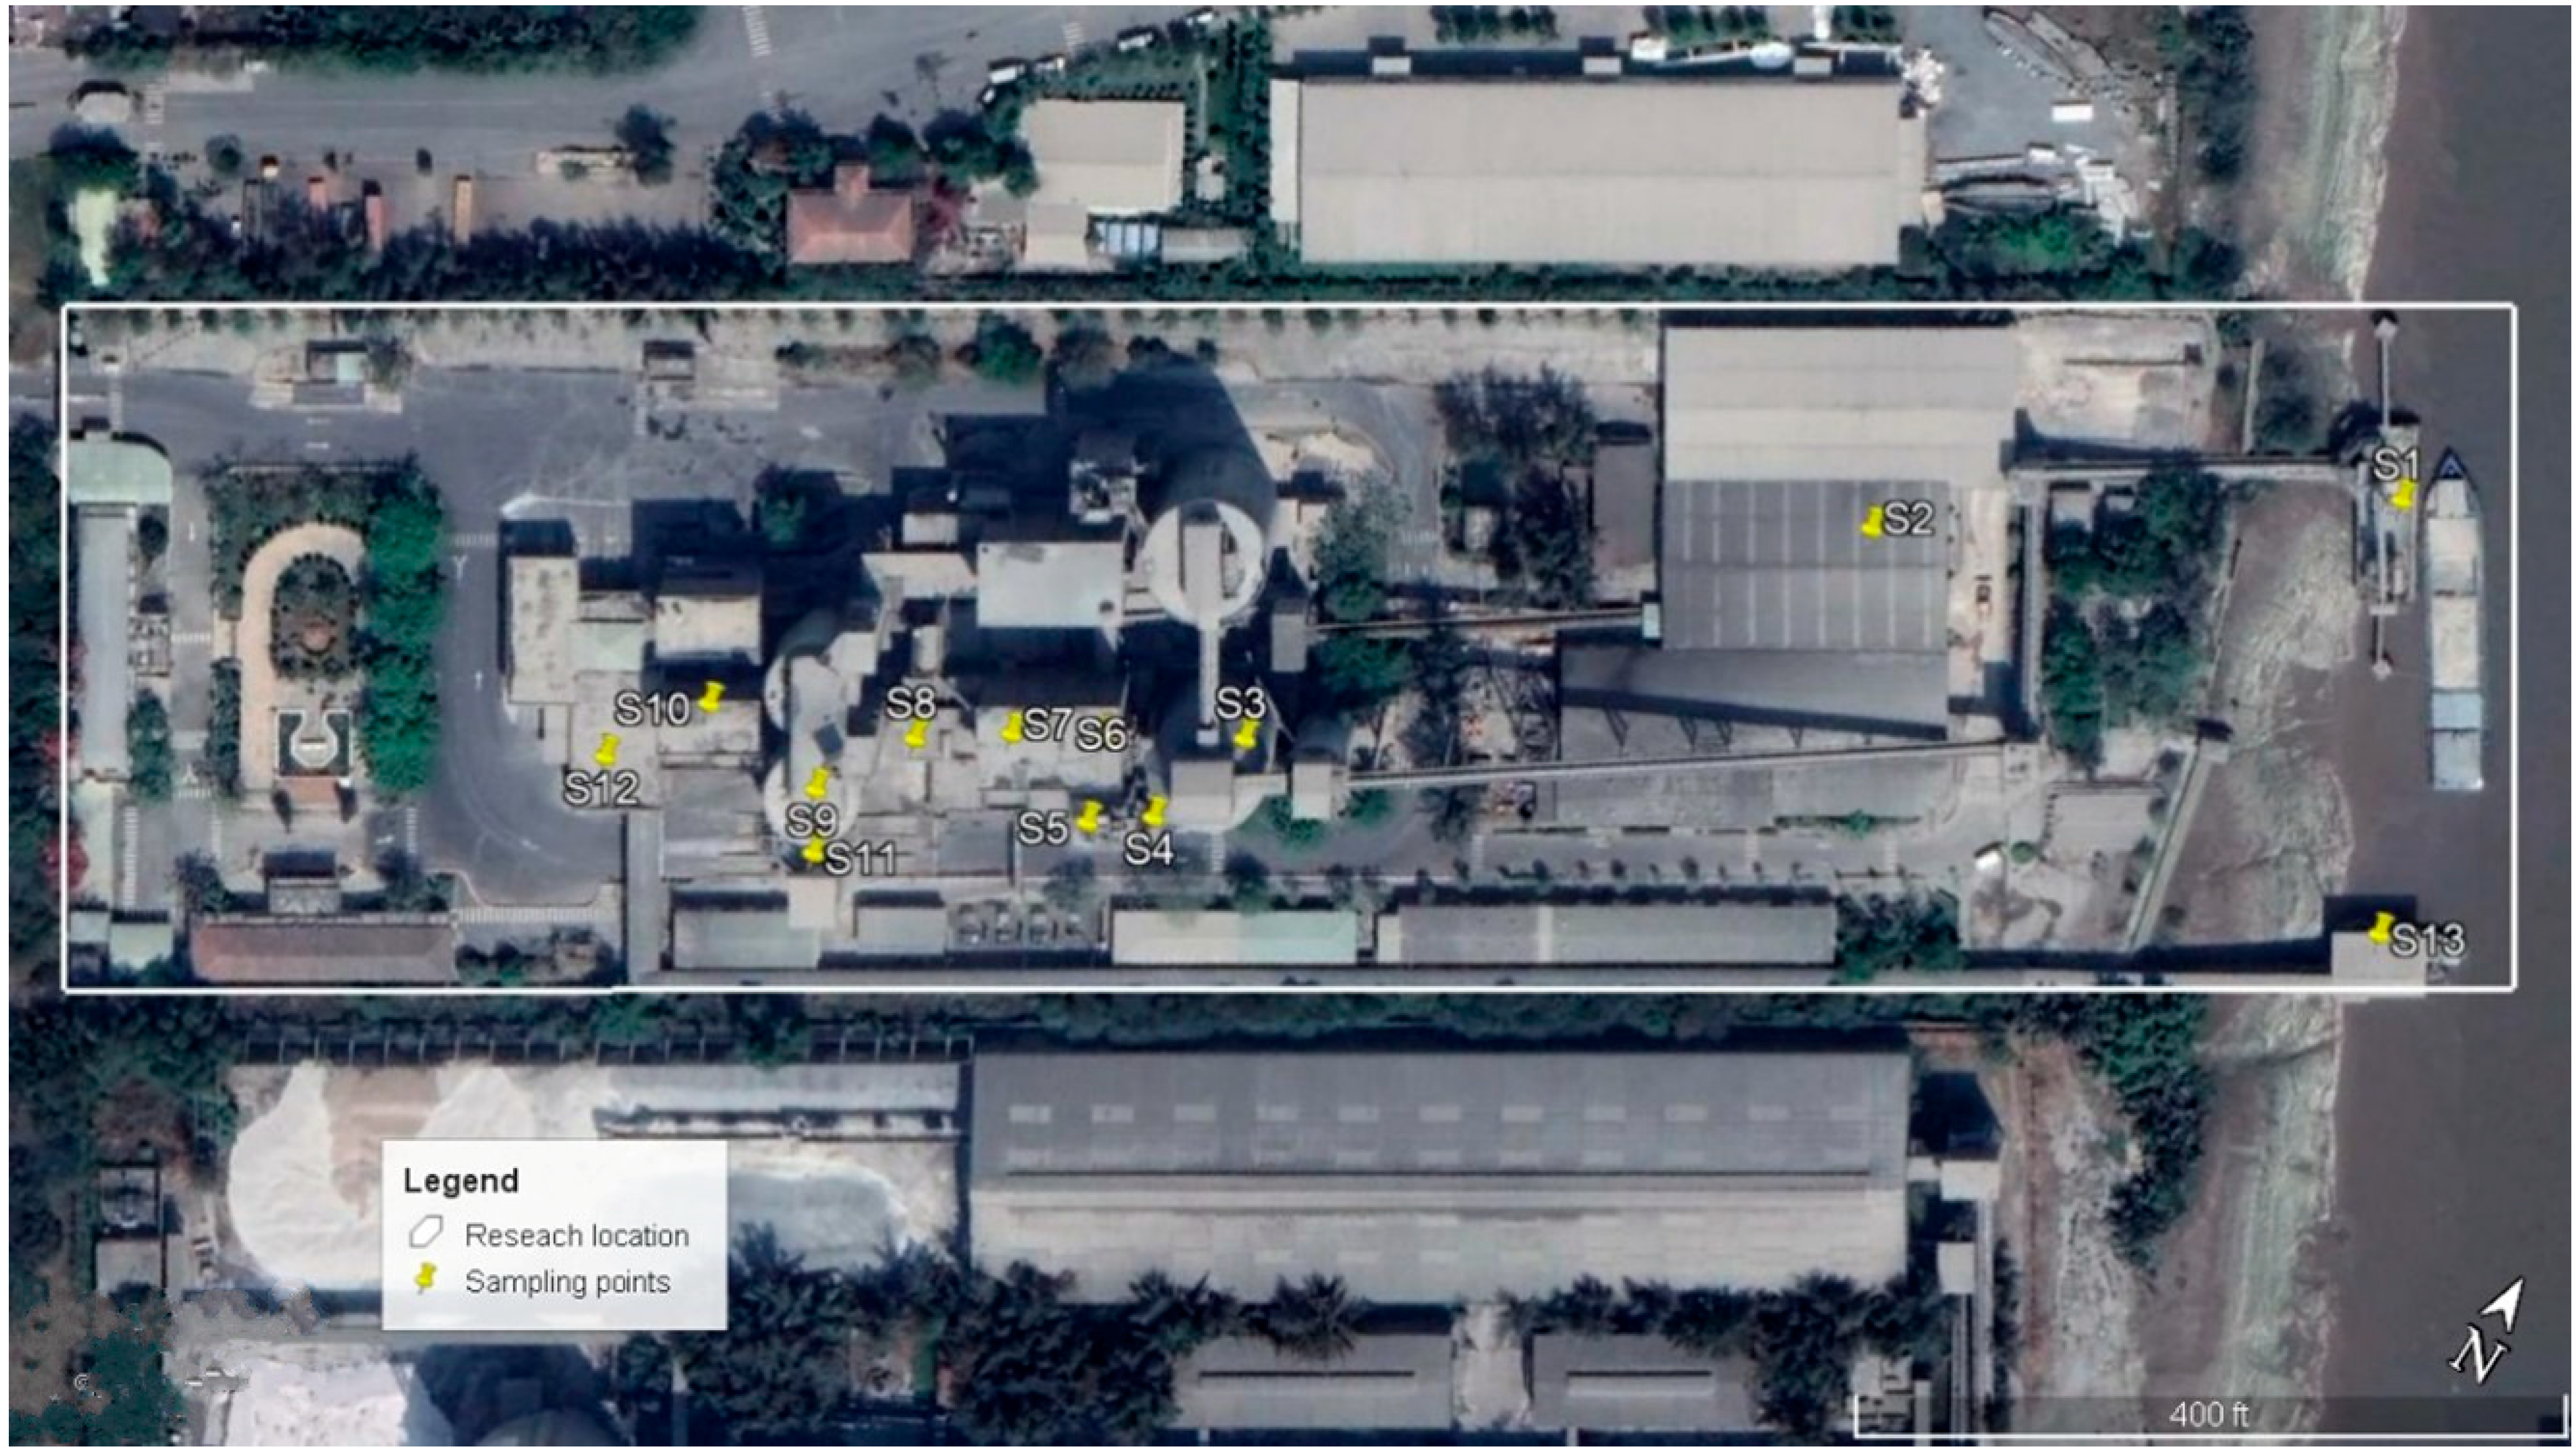
2.1. Study Site Information

This study was conducted in May 2021 at a cement grinding plant located in Ho Chi Minh City, in the South of Vietnam. The city consists of 19 urban and five suburban districts with a total area of 2061 km2 and more than 9 million people [36]. The city has a hot and humid climate year-round, with an average temperature of 27.5 °C. The city has two seasons which include the rainy season (May–November) and the dry season (December–April) [34]. The study site was established in 2003, and consists of 78 full-time employees with the capacity of 500,000 tons per annual. The operation of the plant involves the participation of direct workers from the production, maintenance, and logistic department.
The main processes of the cement grinding plant consist of unloading raw materials at the jetty, raw materials storage and handling, pre-grinding with crusher, cement grinding in the ball mill, cement storage, and cement dispatch. The raw materials used in the cement grinding plant are clinker, limestone, gypsum, pozzolana, and slag. At the study site, two cement products are produced, which include cement bag 50 kg with clinker factor (56%), limestone (19%), gypsum (4%), other additives, and bulk cement used for industrial purposes with clinker factor (73–75%), limestone (12.5%), gypsum (4%), and other additives.

2.2. Study and Sampling Design

The authors surveyed the cement grinding processes under the support of the process engineer and departments representatives to identify dust sources and job group characteristics (daily tasks, number of exposed workers, and duration) in a working shift. The mean duration of working in each process was calculated based on the actual operation hours in 2020 of the crane at the jetty, ball mill, packing machine, and bulk dispatch. Based on the dust sources in the cement grinding plant, a sampling map of the TSP and PM samples was designed using Google Earth Pro and presented in Figure 1.

2.3. Dust Monitoring Procedure

A total of 52 TSP samples and 260 samples of PM1, PM2.5, PM4, PM7, and PM10 were measured in 13 sub-processes of the grinding plant during the working shifts. At each measurement point, the dust concentration level was measured at the worker’s breathing zone during each of the four different working hours (7:30–9:30; 9:30–11:30; 12:30–14:30; 14:30–16:30). These hours cover the duration of the working shift and represent the dust mass concentration level for all workers at the site, since operational processes are the same for all shifts.
In order to measure the dust concentration in indoor workplaces, a direct-reading dust mass monitor (MET ONE AEROCET 531S (USA)) was used. The Aerocet 531S counts and sizes particles in different size ranges then use a proprietary algorithm to convert count data to mass measurement. The mass concentration precision of this equipment is 0.0001 mg m−3. Before measuring, the dust meter was fully charged, performed zero tests in a clean environment, was calibrated by a qualified center, and was valid until April 2022. Next, the dust meter was set up in mass mode, and the PM1, PM2.5, PM4, PM7, PM10, and TSP mass concentration levels were measured and recorded on the paper sheet for all processes. The measurement process complied with the dust measurement protocol regulated by the Vietnamese standards (QCVN 02:2019/BYT) [37].
The time-weighted average (TWA) concentration for an eight-hour working shift was calculated by using the Formula (1) [38].
T W A   ( m g   m 3 ) = C 1 × T 1 + C 2 × T 2 + + C n   × T n 8
where: TWA (mg m−3) is the equivalent exposure limit for an eight-hour working shift; C n (mg m−3), (n = 4) is the dust mass concentration level represents for a period of time (T); T n (hours) is the duration in hours of the exposure in the concentration (C).
The excessive TSP, PMs for an eight-hour working shift at the processes was identified by comparing to the Permissible Exposure Limit (PEL) regulated by the Vietnamese standard (QCVN 02:2019/BYT) [37].

2.4. Silica Analysis and Processing

In order to identify the silica concentration in respirable dust, five samples of accumulated dust that settled on the top surface of the machine or structure at the cement grinding, packing machine, truck dispatch, barge dispatch, and bulk dispatch were taken. Next, they were sealed in plastic bags and analyzed in the certified laboratory (Vilas 100). The ARL QUANT’X EDXRF analyzer (Thermo Scientific, Paisley, UK), operating using the X-ray fluorescence (XRF) technique was used to measure the composition of silica (silicon dioxide) with a minimum detection limit of 0.003%. Finally, the concentration of free silica in respirable dust was calculated using the Formula (2) [37].
C s i l i c a ( m g   m 3 ) = C r e s p i r a b l e   d u s t ( m g   m 3 ) × F r e e   s i l i c a   ( % ) 100
where: Csilica (mg m−3): concentration of free silica in respirable dust; Crespirable dust (mg m−3): concentration of respirable dust (PM4).
SPSS version 26 for Windows was used to analyze the data, and Pearson analysis was used to identify the correlation between the levels of respirable concentration and silica exposure in the cement grinding processes.

3. Results and Discussion

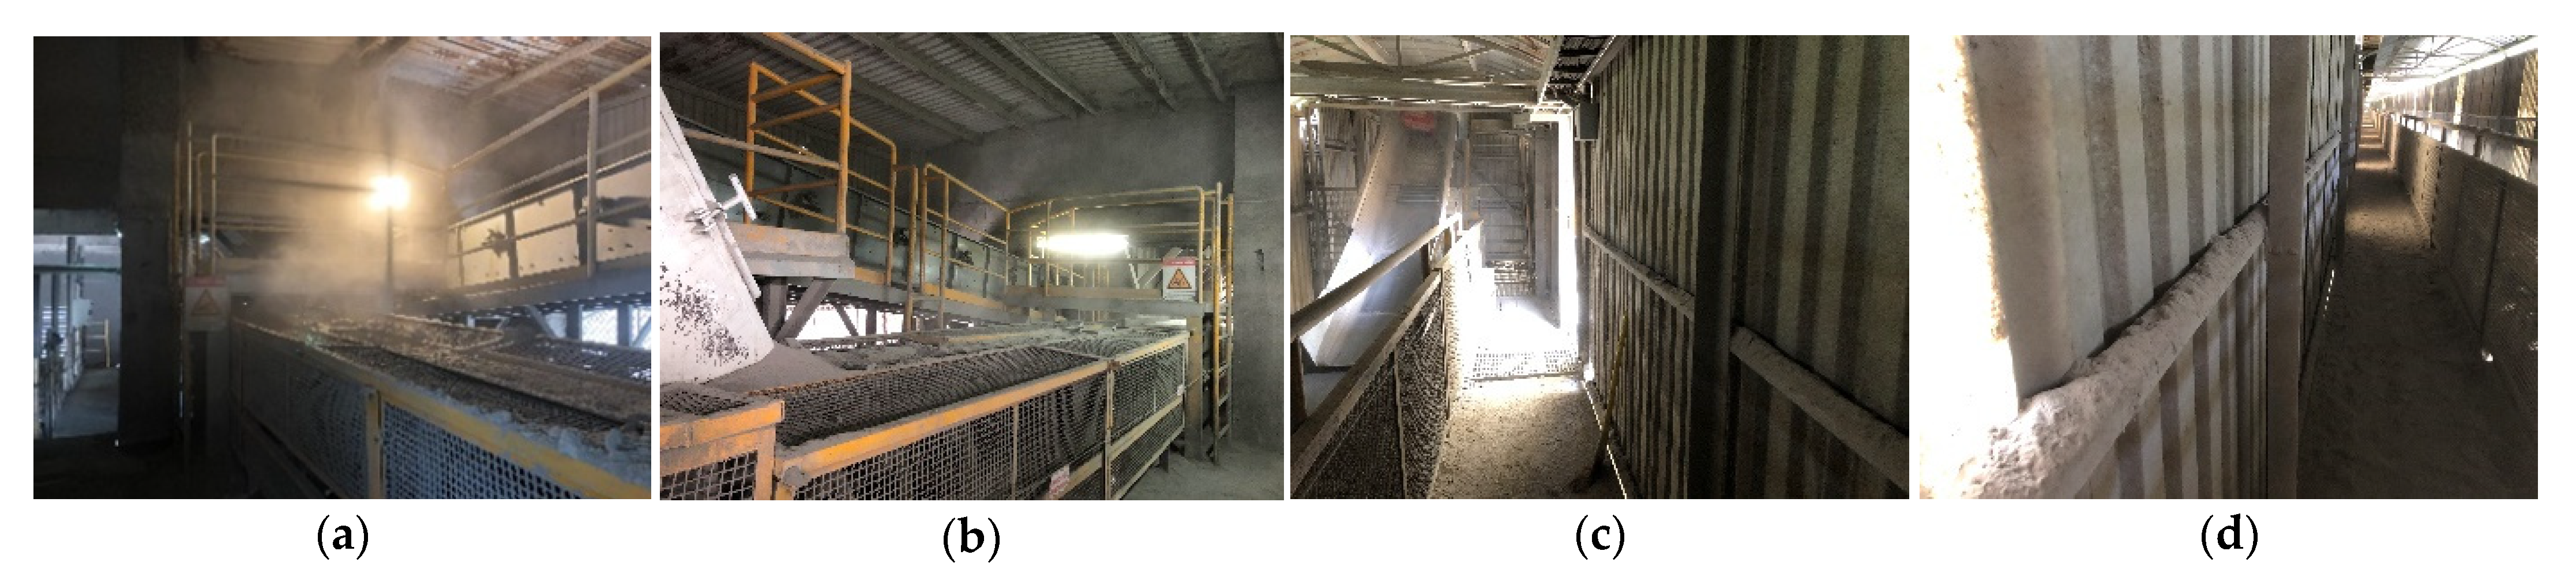
3.1. Dust Sources and Exposed Job Groups in the Cement Grinding Processes

The operation of the cement grinding plant generates suspended particulates from all processes. The survey-based-process observation revealed the various dust sources in the processes where cement workers are exposed daily. In the jetty, the dust was generated in the opening space of the hopper and dispersed to the surrounding areas during unloading raw materials. The belt conveyor system is typically used to transfer raw materials to the storage or silos. However, the transferring of raw materials generated suspended dust at the changing-direction points, which raw materials fall freely to a lower position. In the pre-grinding process, the crusher was used to reduce raw materials’ size before feeding the cement mill. In this process, dust came up at the changing-direction points underneath the feed bin connected to the belt conveyor. The efficient operational control of dust collectors in this process plays an essential role in controlling dust dispersion. After a long period of operation, raw materials shall build up inside the system that potentially reduces the airflow of the dust collector. In the cement grinding process, a closed system consists of ball mill, separator, primary bag filter, and air-slide was used. The main dust sources came from the primary bag filter’s stack, which mainly emitted the ambient environment. In the final process, the primary dust sources were generated while operating the packing machine and loading cement bags to customer’s truck or barge. While running the packing machine, cement leaked from the spout and fell freely to the ground, resulting in dust dispersion. The delivering of cement bags to a customer’s truck or barge generated dust. Some dust sources in the cement grinding processes are present in Figure 2.
In a basic working shift, cement workers in each job group are exposed to dust sources in the process. The operational control of the cement grinding processes from jetty to cement mill output was remotely performed by process operators in the central control room (CCR). During mill operation, process operators perform an interval inspection in the grinding processes every 60 min. In the dispatch process, the operation of the packing machine and delivery of cement bag to customer vehicles was manually performed by the operator and stevedore. The packer operator and stevedore were directly exposed to cement dust sources while operating the packing machine and the bag dispatch system. The job group characteristics and exposure duration in each process are summarized in Table 1.

3.2. Excessive Total Dust Concentration in the Cement Grinding Processes

The results of dust surveillance at the study site revealed that the TSP samples (40.38%, n = 21) in four out of six processes exceeded the PEL for an 8-h working shift, regulated by Vietnamese Standard (QCVN 02:2019/BYT, TWA = 4 mg m−3). The processes with the excessive TSP against the PEL consisted of raw material storage and handling (18.22 mg m−3); pre-grinding (under the feed bin connecting to the belt conveyor (25.62 mg m−3)); cement grinding (5.63 mg m−3), and cement dispatch (5.34 mg m−3 at packing machine; 11.55 mg m−3 at truck loader and 13.40 mg m−3 at barge loading system). The TSP at the remaining processes met the regulated PEL, and included unloading raw material at the jetty (0.21 mg m−3); raw material storage (0.83 mg m−3); mill output (0.57 mg m−3) at cement grinding process; cement transferring (0.21–0.45 mg m−3); and at the bulk dispatch (0.15 mg m−3). The TSP at the study site is given in Table 2.
The highest TSP concentration level was measured at the connecting point between the feed bin and the belt conveyor with 25.62 mg m−3 and was 6.4 times higher than the PEL for an 8-h working shift. The free-falling of raw materials from the feed-bin to the conveyor generated the pressure inside the belt conveyor. The dust collector is installed to balance the pressure inside the belt conveyor and control the dust emission. However, the inefficient operation of the dust collector contributed a significant factor to the dust dispersion in this process. The measurement in the bulk dispatch process recorded the lowest TSP concentration levels, with 0.15 mg m−3.
The packing operator exposed excessive TSP levels for an eight-hour working shift limit at two sub-processes of the packing dispatch process. The measured TSP at the truck and barge loading process was 11.55 mg m−3, 2.9 times higher than the PEL and 13.40 mg m−3, 3.4 times higher than the PEL, respectively. The dispatch process was operating outdoors and had no dust collector because of the initial design. When operators dropped the cement bag from the loading chute to the truck or the barge, it generated and dispersed cement dust to the environment. The particulate size distribution, cement bag quality, and the height of free falling of the cement bag were the significant factors that caused the dust dispersion.
Previous studies reported the excessive TSP in some cement manufacturing processes. A study conducted in 2005 at a cement factory in Tanzania showed that the TSP at some processes exceeded the PEL, such as crane (38.64 mg m−3), packing (21.30 mg m−3), and crusher (13.48 mg m−3). The TSP at other processes was lower than the PEL, which included cement mill (3.23 mg m−3), kiln (2.87 mg m−3), and raw mill (1.85 mg m−3) [39]. Another study conducted in a cement factory in Iran in 2009 presented that the total dust was at a high level in some processes, including crusher (20.84 mg m−3), packing (17.29 mg m−3), kiln (16.78 mg m−3), cement mill (14.90 mg m−3), and raw mill (10.44 mg m−3) [40]. Another study on cement dust published that the TSP in some processes exceeded the PEL and included crusher (27.49 mg m−3), packing (16.90 mg m−3), cement mill (13.07 mg m−3), and raw mill (10.31 mg m−3) [11]. The previous studies showed that the TSP at many processes in cement plants, such as cement mill, packing, raw mill, and crusher, exceeded the PEL, and these findings were comparable with the results in this study. In addition, the measurement results reported the TSP in other processes in a cement grinding plant such as jetty, material storage, pre-grinding, cement mill input and output, truck dispatch, and barge dispatch. The works provided the database of the TSP in all processes of the cement grinding plant for further research.

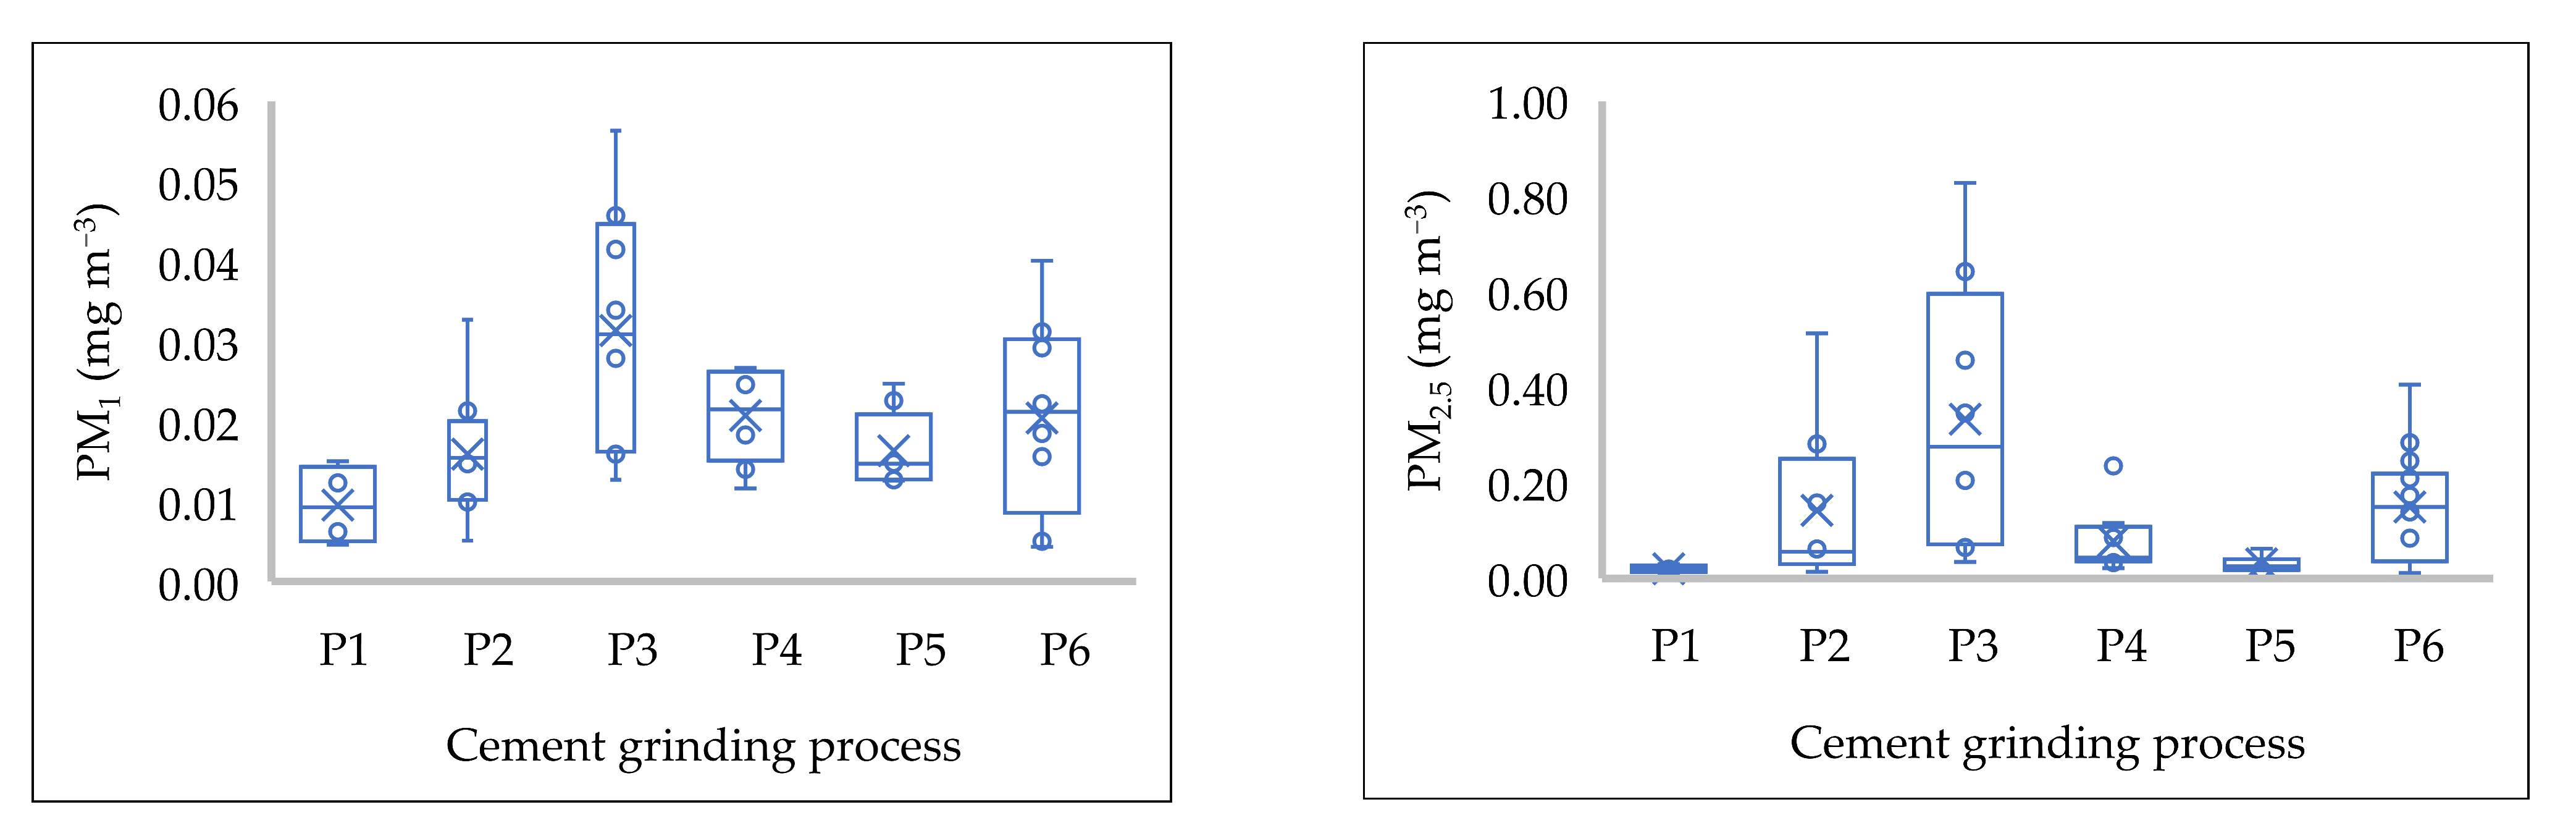
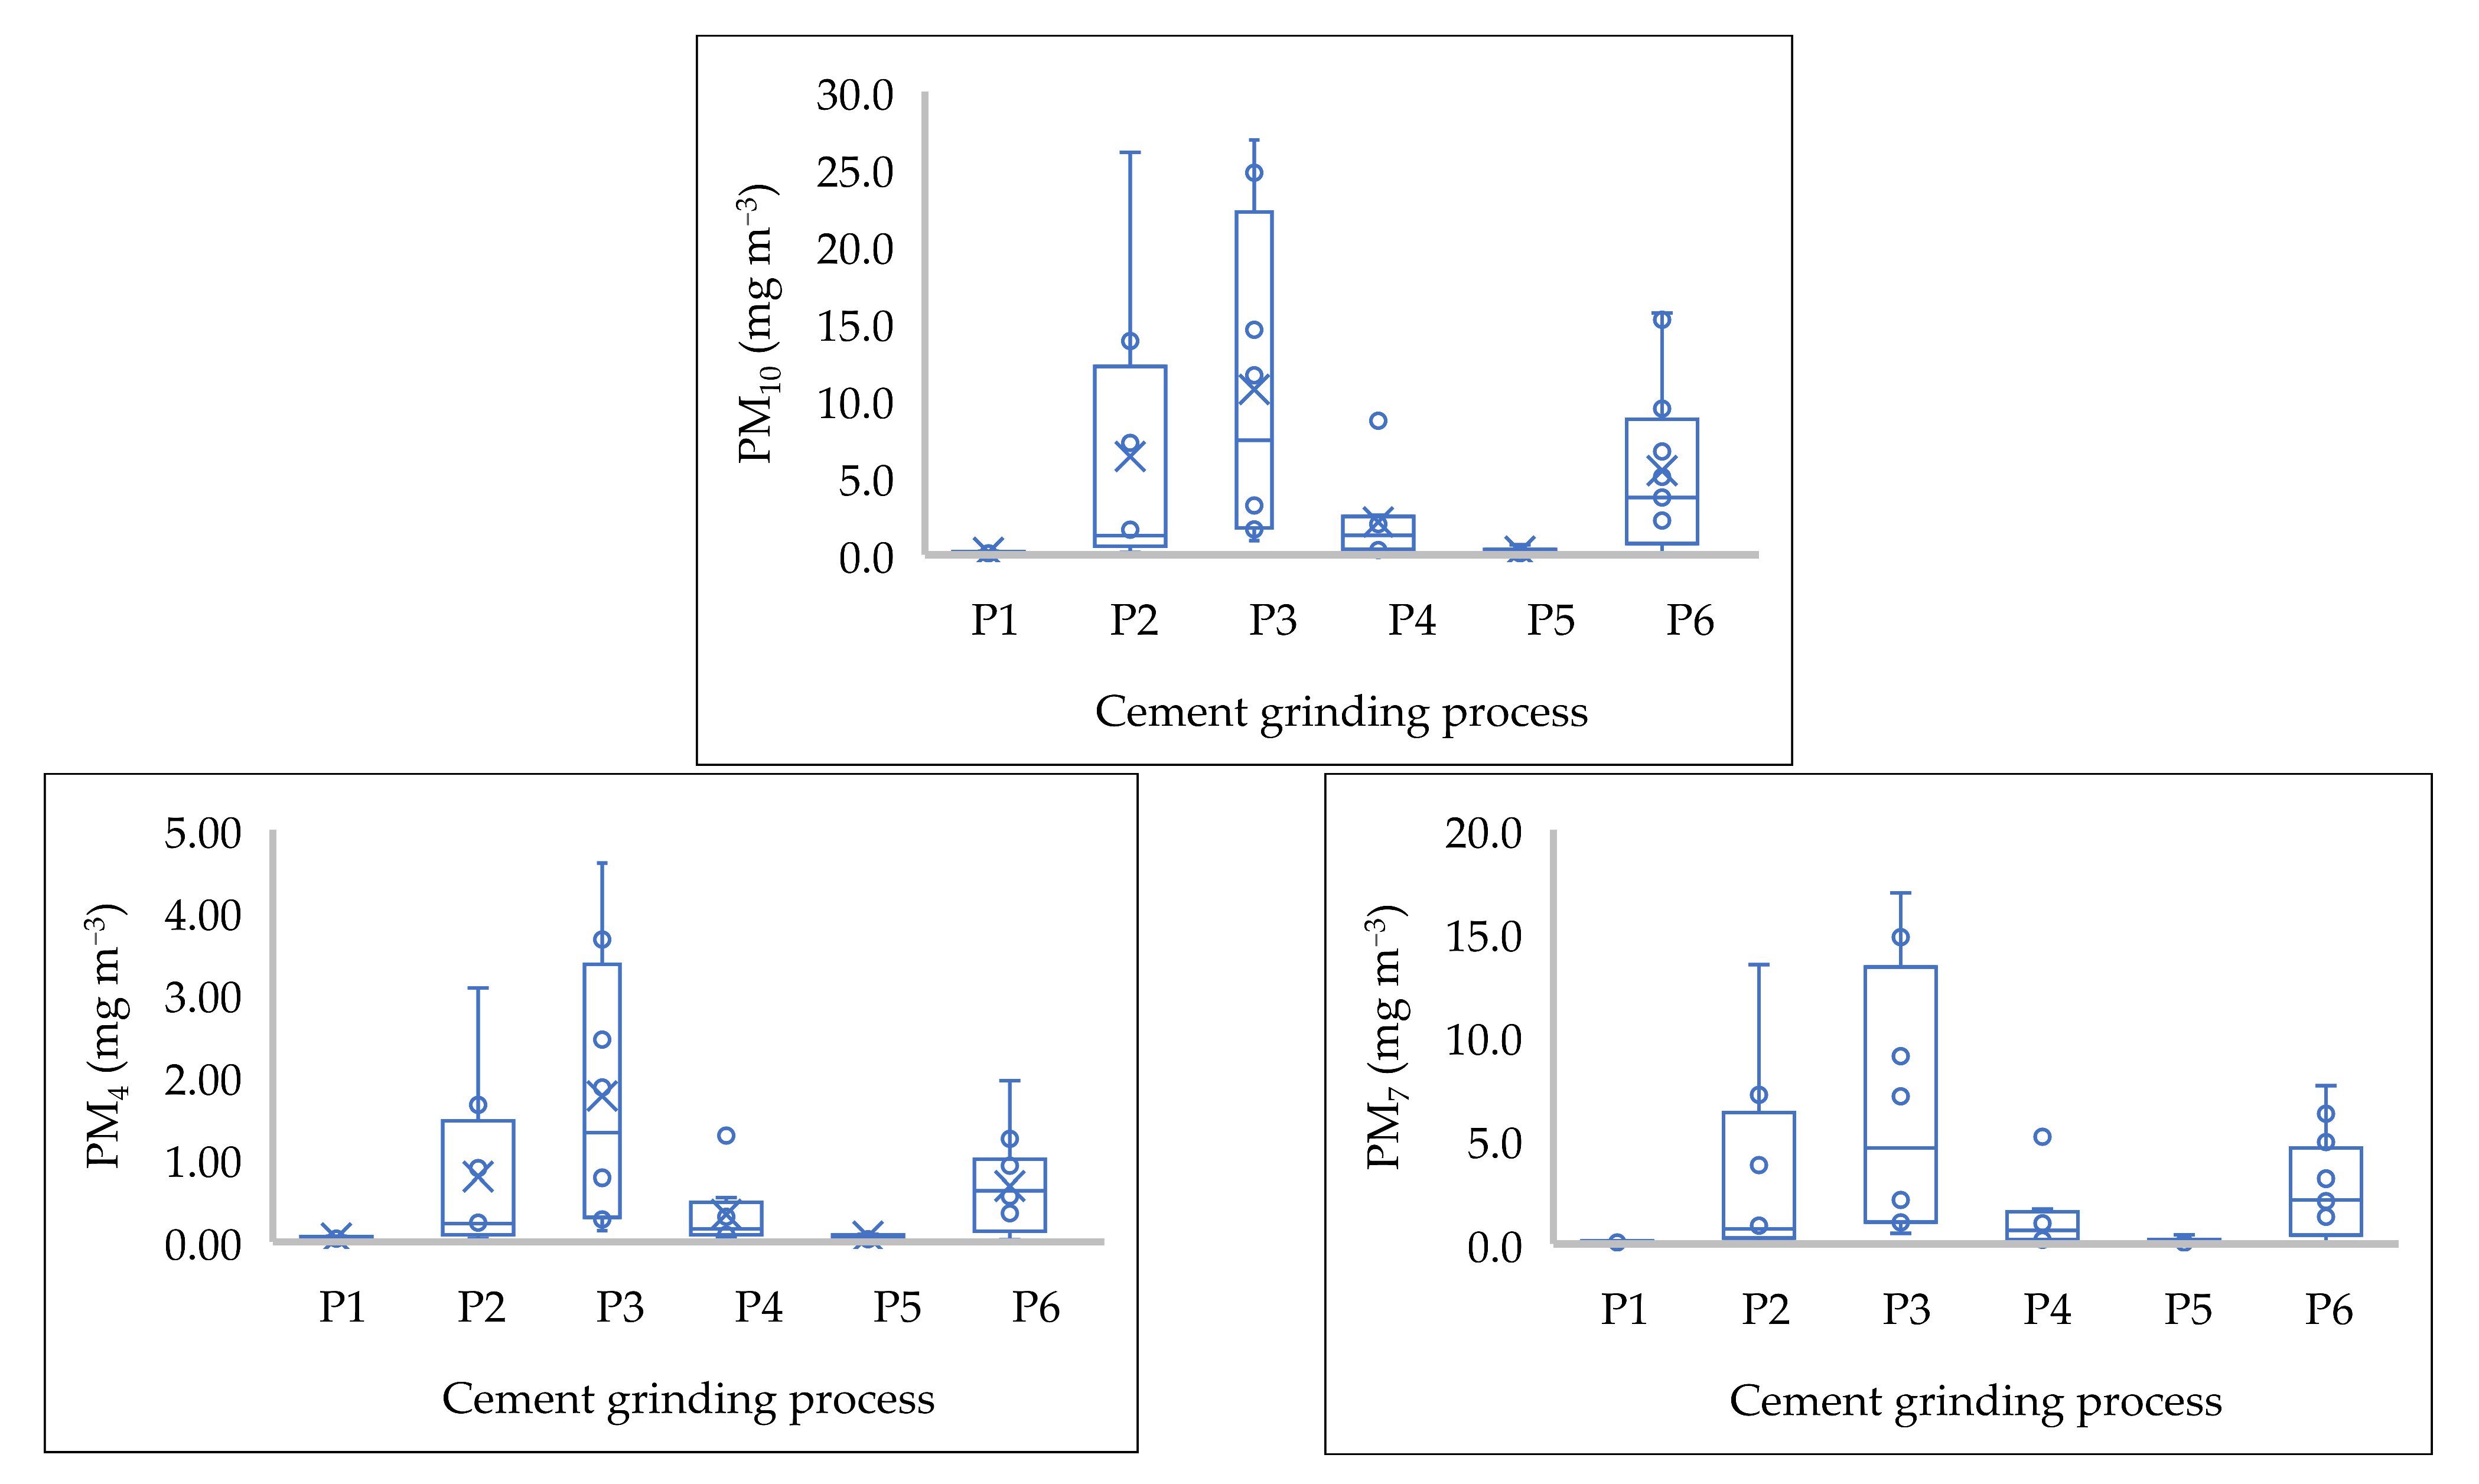
3.3. Wide Range Distribution of Particulate Matters in the Cement Grinding Process

Data obtained with this study showed a wide range distribution of particulate matter fractions in the workplace environment of the cement grinding plant. In addition, the measurements revealed the significant concentration levels of particulate matter in the whole process. The concentration levels of PMs were in the range of PM1 (0.004–0.06 mg m−3), PM2.5 (0.01–0.83 mg m−3), PM4 (0.02–4.59 mg m−3), PM7 (0.03–16.94 mg m−3), and PM10 (0.04–26.85 mg m−3). The distribution of the particulate matter fractions at the study site is presented in Figure 3.
The measurement results divided the PMs into two principal groups: coarse particles, mostly larger than 2.5 µm in aerodynamic diameter, and fine particles, mostly smaller than 2.5 µm in aerodynamic diameter (PM2.5).
The mean (SD) levels of PM2.5-1 were 0.14 (0.17) mg m−3, 0.02 (0.01) mg m−3, respectively. The lowest level of PM2.5-1 was recorded at the jetty and the bulk dispatch process, respectively. The highest level of PM2.5-1 was measured at the connecting point between the feeding bin and the belt conveyor, a sub-process of the pre-grinding process. The PM2.5-1 concentration levels were significantly different amongst processes. The mean (SD) PM2.5-1 level in the cement grinding processes was in jetty (0.02 (0.01), 0.01 (0.00) mg m−3, respectively); raw material storage and handling (0.14 (0.17), 0.02 (0.01) mg m−3, respectively); pre-grinding (0.33 (0.29), 0.03 (0.02) mg m−3, respectively); cement grinding (0.08 (0.07), 0.02 (0.01) mg m−3, respectively); cement transferring and storage (0.03 (0.02), 0.02 (0.00) mg m−3, respectively); and cement dispatch (0.15 (0.11), 0.02 (0.01) mg m−3, respectively).
The mean (SD) levels of PM10-7-4 were 4.67 (7.04), 2.56 (3.91) and 0.66 (0.98) mg m−3, respectively. The highest level of PM10-7-4 was measured at the connecting point between the feeding bin and the belt conveyor, a sub-process of pre-grinding process. The lowest level of PM10–7-4 was recorded at the bulk dispatch process. The mean (SD) PM10-7-4 level in the cement grinding processes was in jetty (0.15 (0.07), 0.10 (0.05), 0.05 (0.02) mg m−3, respectively); raw material storage and handling (6.36 (9.28), 3.33 (4.78), 0.79 (1.08) mg m−3, respectively); pre-grinding (10.69 (10.58), 6.58 (6.53), 1.76 (1.69) mg m−3, respectively); cement grinding (2.12 (2.82), 1.23 (1.68), 0.33 (0.42) mg m−3, respectively); cement transferring and storage (0.23 (0.19), 0.15 (0.13), 0.07 (0.05) mg m−3, respectively); and cement dispatch (5.44 (5.59), 2.64 (2.36), 0.67 (0.54) mg m−3, respectively).
The peak mean levels of PMs factions were measured at the connecting point between the feeding bin and the belt conveyor, a sub-process of the pre-grinding process. The significant mean levels and wide range distribution of PM fractions were mainly measured at the pre-grinding, cement grinding, and cement dispatch process. In these processes, raw materials were crushed into small particles by the crusher and ball mill. In addition, the operation of the equipment in these processes generates heat, which reduces the moisture of the raw materials. These factors, in combination with the inefficient operation of the dust collectors, significantly contributed to the wide range distribution and levels of the PM fractions in cement grinding processes. There is currently no Vietnamese standard regulated for fine particles level in the indoor air environment.
The published works on the different fractions of particulate matter in the cement workplace environment are limited. Some researchers have reported the levels of PM10 and PM2.5 in the cement processes. A study reported the levels of PM10–2.5 in cement mill (2.15, 0.03 mg m−3, respectively), loading area (0.03, 0.02 mg m−3, respectively), and crusher (0.25, 0.07 mg m−3, respectively) [41]. Another researcher reported the level of PM10-2.5 in the cement processes included cement mill (0.59, 0.87 mg m−3, respectively), packing (0.51, 0.50 mg m−3, respectively), and crusher (1.55, 1.80 mg m−3, respectively) [42]. The levels of PM10-2.5 in this study were significantly higher than in the reported studies. Other researchers reported the level of PM10, PM2.5 in the ambient environment nearby the cement plants. The PM2.5 level was 0.03 ± 0.01 mg m−3 and was in the range of 0.04–0.05 mg m−3 [43,44]. The PM10 level was 0.03 mg m−3 and was in the range of 0.004–0.17 mg m−3 [45,46]. Therefore, the mentioned PM10–2.5 levels in the surrounding areas of the cement plant were significantly lower than the PM10–2.5 levels in the cement grinding processes in this study. For the PM in the ambient environment, a study reported the excessive PM10–2.5 concentrations were in the range of 0.06–0.10, 0.02–0.04 mg m−3, respectively, and were associated with health risks [47]. Other work reported the highest average monthly concentrations of PM10-2.5 during dusty days were 0.3, 0.07 mg m−3, respectively [48]. However, the concentration levels of PM10-2.5 in this study were much higher than the mentioned reports.
Cement workers are exposed to a wide range and significant levels of PM fractions during the working shift. The coarse fraction with a dynamic diameter between 10 and 2.5 µm (PM10-2.5) remains in the upper part of the respiratory tract, and the fine particles (PM2.5) can penetrate deeper into the lung system and cause health effects [49]. Prolonged exposure to particulate matter, especially fine particles, has been proven to have negative health effects on the exposed group [46,50,51,52]. Implementing an exposure reduction program to PM is needed to minimize the negative effects on workers’ health.

3.4. The Correlation between Concentration Levels of Respirable Dust and Silica Exposure

The analysis results of the compositions and silica concentrations in the respirable dust samples at the study site are presented in Table 3.
The measurement of silica (silicon dioxide) in respirable dust in the cement grinding processes showed that the range of silica content fluctuated between 19.35% and 21.29%, and the mean (SD) composition of silicon dioxide was 20.4% (0.86). This finding was comparable with other studies in which silica composition in cement fluctuated from 21–22%, and from 17–25% [53,54]. In this study, the silica composition was not significantly different between the processes. The highest silica content was measured at the bulk dispatch (21.29%), and followed by the truck loading (20.97%), packing machine (20.77%), cement mill (19.62%), and barge dispatch (19.35%). Because the silica composition is not significantly different amongst cement grinding processes or types of cement products, the level of silica exposure mainly depends on the concentration levels of respirable particles.
In this study, the respirable dust concentration level (PM4) ranged between 0.02 and 4.59 mg m−3. The measurement recorded the highest level of respirable particles at the feeding bin and belt conveyor, which exceeded the PEL for an eight-hour working shift. The respirable concentration level at other processes was below the regulated exposure limit. Other studies published high concentration levels of the respirable dust concentration, such as packing machine (4.5 mg m−3), loading (4.2 mg m−3), crushing (23 mg m−3), mill (6.7–7.1 mg m−3), and raw mill (43–47.6 mg m−3) [13,14]. A study conducted in a cement factory in Iran in 2019 figured out the range of respirable dust concentration was from 1.77 mg m−3 at cement mill to 6.12 mg m−3 at the crusher, packing and loading (3.4 mg m−3), raw mill (2.92 mg m−3) [55]. The respirable dust concentration levels in this study were lower than the same processes in mentioned studies. However, the concentration levels of respirable dust can be significantly fluctuated within cement grinding processes depending on the level of operational control.
The results of Pearson analysis showed that there was a positive and significant correlation between the concentration levels of respirable dust and silica exposure in the cement grinding plant (r = 0.99).

4. Conclusions

The study shows that the cement grinding plant has various dust sources that cement workers potentially expose daily. The TSP concentration in this study was in the range of 0.15 and 25.62 mg m−3. The results of the TSP measurement reveal that four out of six processes in the cement grinding plant exceeded the PEL for an 8-h working shift. The excessive processes include the storage and handling of raw materials, pre-grinding, cement grinding, and cement dispatch processes. Besides that, the study reports a wide range and significant levels of particulate matter fractions in the cement grinding processes. The peak mean levels of PMs factions were measured at the connecting point between the feeding bin and the belt conveyor, a sub-process of the pre-grinding process. The inefficient operation of the dust collector significantly contributed to the PM dispersion in this process. In addition, the study reveals a significant correlation between the concentration levels of respirable dust and silica exposure in the cement grinding plant (r = 0.99). Prolonged exposure to respirable particles containing silica and fine particles caused negative health effects on cement workers [56,57]. Therefore, the improvement of indoor air quality is needed to prevent negative health effects on cement workers. Firstly, the maintenance of the dust collectors, ducting hoods, needs to be addressed to reduce the dispersion of particulate matter fractions in cement grinding processes. Secondly, the automatic bag applicator is recommended to reduce the manual work and dust exposure for packer operators and stevedores. Thirdly, a complete dust management plan should be implemented to enhance the air quality in the workplace environment and prevent health effects on cement workers. The elements of a dust management plant include surveillance of dust source, dust measurement and monitoring, health surveillance, maintenance of dust collector and relevant equipment, housekeeping, training, working procedures, and provision of personal protective equipment.

Author Contributions

The study was designed by T.T.; data collection, analysis, interpretation, and draft manuscript preparation were undertaken by T.T.; manuscript review and editing by P.K. and A.B. All authors have read and agreed to the published version of the manuscript.

Funding

This work was supported by VŠB-Technical University of Ostrava, Czech Republic, under Grant no. 2202 “Cooperation on the Disaster Prevention Community Project No. VJ01030011”.

Institutional Review Board Statement

Not applicable.

Informed Consent Statement

Not applicable.

Data Availability Statement

Data from this study are available upon request.

Acknowledgments

The authors extend our sincere gratitude to the management of the study site for supporting this research. The authors would like to thank department representatives, the Quality Assurance team for their support in the data analysis of silica composition.

Conflicts of Interest

The authors have no conflict of interest to declare.

References

  1. WHO Global Air Quality Guidelines. Particulate Matter (PM2.5 and PM10), Ozone, Nitrogen Dioxide, Sulfur Dioxide and Carbon Monoxide. Geneva: World Health Organization; 2021. Licence: CC BY-NC-SA 3.0 IGO. Available online: https://apps.who.int/ (accessed on 6 October 2021).
  2. WHO—Occupational and Environmental Health Department of Protection of the Human Environment World Health Organization. WHO/SDE/OEH/99.14, Hazard Prevention and Control in the Work Environment: Airborne Dust; Occupational and Environmental Health Department of Protection of the Human Environment World Health Organization: Geneva, Switzerland, 1999. [Google Scholar]
  3. Calvert, J.G. Glossary of atmospheric chemistry terms. Pure Appl. Chem. 1990, 62, 2167–2219. [Google Scholar] [CrossRef] [Green Version]
  4. European Committee for Standardization. EN 481:1993-09, Workplace Atmospheres: Size Fraction Definitions for Measurement of Airborne Particles; Brussels: European Committee for Standardization: Brussels, Belgium, 1993. [Google Scholar]
  5. Rushton, L. Chronic obstructive pulmonary disease and occupational exposure to silica. Rev. Environ. Health 2007, 22, 255–272. [Google Scholar] [CrossRef]
  6. Anlar, H.G.; Bacanli, M.; İritaş, S.; Bal, C.; Kurt, T.; Tutkun, E.; Yilmaz, O.H.; Basaran, N. Effects of occupational silica exposure on oxidative stress and immune system parameters in ceramic workers in turkey. J. Toxicol. Environ. Health A 2017, 80, 688–696. [Google Scholar] [CrossRef]
  7. Vacek, P.M.; Verma, D.K.; Graham, W.G.; Callas, P.W.; Bibbs, G.W. Mortality in Vermont granite workers and its association with silica exposure. Occup. Environ. Med. 2011, 68, 312–318. [Google Scholar] [CrossRef] [Green Version]
  8. Park, R.; Rice, F.; Stayner, L.; Smith, R.; Gilbert, S.; Checkoway, H. Exposure to crystalline silica, silicosis, and lung disease other than cancer in diatomaceous earth industry workers: A quantitative risk assessment. Occup. Environ. Med. 2002, 59, 36–43. [Google Scholar] [CrossRef] [Green Version]
  9. Parks, C.G.; Conrad, K.; Cooper, G.S. Occupational exposure to crystalline silica and autoimmune disease. Environ. Health Perspect. 1999, 107, 793–802. [Google Scholar]
  10. Liu, K.; Mu, M.; Fang, K.; Qian, Y.; Xue, S.; Hu, W.; Ye, M. Occupational exposure to silica and risk of heart disease: A systematic review with meta-analysis. BMJ Open 2020, 10, e029653. [Google Scholar] [CrossRef] [Green Version]
  11. Poornajaf, A.; Kakooei, H.; Hosseini, M.; Ferasati, F.; Kakaei, H. The Effect of Cement Dust on the Lung Function in a Cement Factory, Iran. Int. J. Occup. Hyg. 2010, 2, 74–78. [Google Scholar]
  12. Mehta, P.; Monteiro, P. Concrete: Structure, Properties, and Materials, 2nd ed.; Prentice-Hall: Hoboken, NJ, USA, 1993. [Google Scholar]
  13. Ballal, S.G.; Ahmed, H.O.; Ali, B.A.; Albar, A.A.; Alhasan, A.Y. Pulmonary Effects of Occupational Exposure to Portland Cement: A Study from Eastern Saudi Arabia. Int. J. Occup. Environ. Health 2004, 10, 272–277. [Google Scholar] [CrossRef]
  14. Mirzaee, R.; Kebriaei, A.; Hashemi, S.; Sadeghi, M.; Shahrakipour, M. Effects of exposure to Portland cement dust on lung function in Portland cement factory workers in Khash, Iran. Iranian J. Environ. Health Sci. Eng. 2008, 5, 201–206. [Google Scholar]
  15. Oleru, U.G. Pulmonary function and symptoms of Nigerian workers exposed to cement dust. Environ. Res. 1984, 33, 379–385. [Google Scholar] [CrossRef]
  16. Vyskocil, J. The problem of chronic bronchitis in cement workers. Rev. Czechoslov. Med. 1962, 8, 38–52. [Google Scholar]
  17. Izycki, J.; Gielec, L.; Sulkowski, W.; Kowalska, S. Respiratory tract in workers chronically exposed to cement dust. Med. Pr. 1979, 30, 241–246. [Google Scholar]
  18. Laraqui Hossini, C.H.; Laraqui Hossini, O.; Rahhali, A.E.; Tripodi, D.; Caubet, A.; Belamallem, I.; Verger, C.; Hakam, K.; Alaoui Yazidi, A. Respiratory symptoms and ventilatory disorders among a group of cement workers in Morocco. Rev. Mal. Respir. 2002, 19, 183–189. [Google Scholar] [PubMed]
  19. MacieJewska, A.; Bielichowska-Cybula, G. Biological effects of cement dust. Med. Pr. 1991, 42, 281–290. [Google Scholar]
  20. Vestbo, J.; Knudsen, K.M.; Raffn, E.; Korsgaard, B.; Rasmussen, F.V. Exposure to cement dust at a Portland cement factory and the risk of cancer. Br. J. Ind. Med. 1991, 48, 803–807. [Google Scholar] [CrossRef]
  21. Maier, H.; Gewelke, U.; Dietz, A.; Thamm, H.; Heller, W.D.; Weidauer, H. Laryngeal cancer and occupation: Results of the Heidelberg laryngeal cancer study. HNO 1992, 40, 44–51. [Google Scholar] [PubMed]
  22. Noor, H.; Yap, C.L.; Zolkepli, O.; Faridah, M. Effect of exposure to dust on lung function of cement factory workers. Med. J. Malaysia 2000, 55, 51–57. [Google Scholar]
  23. Meo, S.A. Chest radiological findings in Pakistani cement mill workers. Saudi Med. J. 2003, 24, 287–290. [Google Scholar]
  24. Abou-Taleb, A.N.M.; Musaiger, A.O.; Abdelmoneim, R.B. Health status of cement workers in the United Arab Emirates. J. R. Soc. Health 1995, 115, 378–381. [Google Scholar] [CrossRef]
  25. Ahmad, R.; Akhter, S. Effects of exposure to cement dust on hemoglobin concentration and total count of RBC in cement factory workers. J. Bangladesh Soc. Physiol. 2018, 13, 68–72. [Google Scholar] [CrossRef] [Green Version]
  26. Initial Cement Industry Report. Available online: http://www.fpts.com.vn/FileStore2/ (accessed on 20 February 2021).
  27. Decision No. 1266/QĐ-TTg. Approval of Construction Material Development Strategy in the Period from 2021 to 2030 in Vietnam. Available online: https://thuvienphapluat.vn/Quyet-dinh-1266-QD-TTg-2020 (accessed on 29 December 2020).
  28. Fuente, A.; Hickson, L. Noise-induced hearing loss in Asia. Int. J. Audiol. 2011, 50, 3–10. [Google Scholar] [CrossRef]
  29. Thai, T.; Kučera, P.; Bernatik, A. Noise Pollution and Its Correlations with Occupational Noise-Induced Hearing Loss in Cement Plants in Vietnam. Int. J. Environ. Res. Public Health 2021, 18, 4229. [Google Scholar] [CrossRef]
  30. Nguyen, D.T.; Pham, T.T. Air pollution in Ho Chi Minh City, Vietnam. In Proceedings of the Conference on Better Air Quality in Asian and Pacific Rim Cities (BAQ 2002), Hong Kong, China, 16–18 December 2002. [Google Scholar]
  31. GeenID. Air Quality in Vietnam in 2017. Available online: http://en.greenidvietnam.org.vn/ (accessed on 8 October 2021).
  32. Ho, B.Q. Modeling PM10 in Ho Chi Minh City, Vietnam and evaluation of its impact on human health. Sustain. Environ. Res. 2017, 27, 95–102. [Google Scholar] [CrossRef]
  33. Kim, K.H.; Kabir, E.; Kabir, S. A review on the human health impact of airborne particulate matter. Environ. Int. 2015, 74, 136–143. [Google Scholar] [CrossRef]
  34. Luong, L.T.M.; Dang, T.N.; Huong, N.T.T.; Phung, D.; Tran, L.K.; Dung, D.V.; Thai, P.K. Particulate air pollution in Ho Chi Minh city and risk of hospital admission for acute lower respiratory infection (ALRI) among young children. Environ. Pollut. 2019, 257, 113424. [Google Scholar] [CrossRef] [PubMed]
  35. Phung, D.; Hien, T.T.; Linh, H.N.; Luong, L.M.; Morawska, L.; Chu, C.; Binh, N.D.; Thai, P.K. Air pollution and risk of respiratory and cardiovascular hospitalizations in the most populous city in Vietnam. Sci. Total Environ. 2016, 557, 322–330. [Google Scholar] [CrossRef] [PubMed] [Green Version]
  36. General Statistics Office. Ho Chi Minh Population 2020. Available online: https://www.gso.gov.vn/en/ (accessed on 8 October 2021).
  37. National Technical Regulation. Permissible Exposure Limit Value of Dust at the Workplace: QCVN 02:2019/BYT. Available online: https://thuvienphapluat.vn/QCVN02:2019/BYT (accessed on 17 May 2021).
  38. OHSA. Occupational Safety and Health Standards No. 1910.1000—Air Contaminant. Available online: https://www.osha.gov/laws-regs/regulations/standardnumber/1910/1910.1000 (accessed on 5 July 2021).
  39. Mwaiselage, J.; Bråtveit, M.; Moen, B.; Yost, M. Variability in dust exposure in a cement factory in Tanzania. Ann. Occup. Hyg. 2005, 49, 511–519. [Google Scholar] [PubMed] [Green Version]
  40. Kakooei, H.; Kakouei, A.A.; Poornajaf, A.; Ferasaty, F. Variability in total dust exposure in a cement factory. Ind. Health 2012, 50, 64–68. [Google Scholar] [CrossRef] [Green Version]
  41. Al-Zboon, K.K. Indoor air quality in cement industry. Res. J. Chem. 2019, 9, 8–13. [Google Scholar]
  42. Ahmad, W.; Nisa, S.; Nafees, M.; Hussain, R. Assessment of Particulate Matter (PM10 & PM2.5) and Associated Health Problems in Different Areas of Cement Industry, Hattar, Haripur. J. Sci. Technol. 2015, 37, 7–15. [Google Scholar]
  43. Mbelambela, E.P.; Muchanga, S.M.J.; Villanueva, A.F.; Eitoku, M.; Yasumitsu-Lovell, K.; Hirota, R.; Shimotake, Y.; Sokolo, G.J.; Mori, A.; Suganuma, N. Biomass energy, particulate matter (PM2.5), and the prevalence of chronic obstructive pulmonary disease (COPD) among Congolese women living near of a cement plant, in Kongo Central Province. Environ. Sci. Pollut. Res. Int. 2020, 27, 40706–40714. [Google Scholar] [CrossRef] [PubMed]
  44. Anchez-Sober, F.; Rovira, J.; Mari, M.; Sierra, J.; Nadal, M.; Domingo, J.; Schuhmacher, M. Main components and human health risks assessment of PM10, PM2.5, and PM1 in two areas influenced by cement plants. Atmos. Environ. 2015, 120, 109–116. [Google Scholar] [CrossRef]
  45. Marcon, A.; Pesce, G.; Girardi, P.; Marchetti, P.; Blengio, G.; de Zolt Sappadina, S.; Falcone, S.; Frapporti, G.; Predicatori, F.; de Marco, R. Association between PM10 concentrations and school absences in proximity of a cement plant in northern Italy. Int. J. Hyg. Environ. Health 2014, 217, 386–391. [Google Scholar] [CrossRef]
  46. Nkhama, E.; Ndhlovu, M.; Dvonch, J.T.; Lynam, M.; Mentz, G.; Siziya, S.; Voyi, K. Effects of Airborne Particulate Matter on Respiratory Health in a Community near a Cement Factory in Chilanga, Zambia: Results from a Panel Study. Int. J. Environ. Res. Public Health 2017, 14, 1351. [Google Scholar] [CrossRef] [PubMed] [Green Version]
  47. Masud, Y.; Roohollah, R.; Ahmad, Z.; Mehdi, F.; Hosna, J. Exposure to high levels of PM2.5 and PM10 in the metropolis of Tehran and the associated health risks during 2016–2017. Microchem. J. 2019, 150, 104174. [Google Scholar] [CrossRef]
  48. Ali, A.; Mehdi, F.; Ahmad, J.; Ahmad, Z.; Sajad, M. Particulate matter and bioaerosols during Middle East dust storms events in Ilam, Iran. Microchem. J. 2020, 152, 104280. [Google Scholar] [CrossRef]
  49. Anderson, J.O.; Thundiyil, J.G.; Stolbach, A. Clearing the air: A review of the effects of particulate matter air pollution on human health. J. Med. Toxicol. 2012, 8, 166–175. [Google Scholar] [CrossRef] [Green Version]
  50. Kim, S.H.; Lee, C.G.; Song, H.S.; Lee, H.S.; Jung, M.S.; Kim, J.Y.; Park, C.H.; Ahn, S.C.; Yu, S.D. Ventilation impairment of residents around a cement plant. Ann. Occup. Environ. Med. 2015, 27, 3. [Google Scholar] [CrossRef] [Green Version]
  51. Eom, S.Y.; Cho, E.B.; Oh, M.K.; Kweon, S.S.; Nam, H.S.; Kim, Y.D.; Kim, H. Increased incidence of respiratory tract cancers in people living near Portland cement plants in Korea. Int. Arch. Occup. Environ. Health 2017, 90, 859–864. [Google Scholar] [CrossRef]
  52. Garcia-Perez, J.; Morales-Piga, A.; Gomez-Barroso, D.; Tamayo-Uria, I.; Pardo Romaguera, E.; Lopez-Abente, G.; Ramis, R. Risk of bone tumors in children and residential proximity to industrial and urban areas: New findings from a case-control study. Sci. Total Environ. 2017, 579, 333–1342. [Google Scholar] [CrossRef]
  53. Ali, M.; Khan, I.; Hossain, M. Chemical Analysis of Ordinary Portland Cement of Bangladesh. Chem. Eng. Res. Bull. 2008, 12, 7–10. [Google Scholar] [CrossRef]
  54. Health and Safety Executive. Portland Cement Dust. Criteria for an Occupational Exposure Limit; HSE Books: Suffolk, UK, 1994.
  55. Omidianidost, A.; Gharavandi, S.; Azari, M.R.; Hashemian, A.H.; Ghasemkhani, M.; Rajati, F.; Jabari, M. Occupational Exposure to Respirable Dust, Crystalline Silica and Its Pulmonary Effects among Workers of a Cement Factory in Kermanshah, Iran. Tanaffos 2019, 18, 157–162. [Google Scholar] [PubMed]
  56. Kakooei, H.; Gholami, A.; Ghasemkhani, M.; Hosseini, M.; Panahi, D.; Pouryaghoub, G. Dust exposure and respiratory health effects in cement production. Acta Med. Iran. 2012, 50, 122–127. [Google Scholar] [PubMed]
  57. Johnson, C.R.; Knowles, J.; Rønnekleiv, B. Addressing the Health Risks of Silica Cement: A Custom Solution for Norway. In Proceedings of the SPE Bergen One Day Seminar, Bergen, Norway, 20 April 2016. [Google Scholar] [CrossRef]
Figure 1. The layout of dust sampling.
Atmosphere 12 01707 g001
Figure 2. Some dust sources in the cement grinding plant: (a) mill inlet; (b) underneath of feed-bin; (c) at changed-direction point; (d) accumulated dust along dispatch belt conveyor.
Atmosphere 12 01707 g002
Figure 3. PM10-7-4-2.5-1 distribution in the cement grinding processes.
Atmosphere 12 01707 g003aAtmosphere 12 01707 g003b
Table 1. Job group characteristics and exposure duration in the cement grinding process.
ProcessJob GroupDepartmentNo. Exposed WorkerExposure Duration in 2020 (hrs/Shift)Key Daily Tasks
Mean (SD)Range
JettyCrane operatorProduction42.17 (0.77)0.93–3.55Operation of the crane to unload raw materials from the barges;
Pre-grindingProcess operatorProduction84.01 (1.36)1.69–5.97Ensure the stable operation of the crusher and other equipment; Remotely control from CCR;
Cement millProcess operatorProduction84.01 (1.36)1.69–5.97Ensure the stable operation of the mill and equipment; Remotely control from CCR;
Cement
dispatch
Packing
machine
Packer operatorProduction121.80 (0.65)0.35–2.34Operation of the packing machine manually to pack cement bag as customer’s request;
Cement bag
dispatch
StevedoreLogistics (third-party)121.80 (0.65)0.35–2.34Loading cement bag to customer’s trucks and barges;
Bulk dispatch systemLogistic operatorLogistics82.56 (0.96)1.23–4.40Remotely operating the bulk dispatch system in CCR;
StevedoreLogistics (contractor)22.56 (0.96)1.23–4.40Manually opening and closing the cap of the bulk tanker;
Table 2. The TSP at the cement grinding plant.
ProcessSub-ProcessTSP (mg m−3)PEL
(mg m−3)
Mean (SD)Range
P1JettyS1Unloading raw material0.21 (0.11)0.11–0.314.0
P2Raw materials storage and handlingS2Raw material storage and preparation0.83 (0.42)0.21–1.144.0
S3Connecting point between clinker silo and belt conveyor18.22 (15.16)3.11–38.244.0
P3Pre-grindingS4Roller press2.93 (1.28)1.55–4.284.0
S5Feeding bin and conveyor25.62 (9.49)15.58–35.134.0
P4Cement grindingS6Mill input5.63 (3.95)3.42–11.544.0
S7Mill output0.57 (0.29)0.21–0.814.0
P5Cement transferring and siloS8Air-slide0.45 (0.34)0.12–0.844.0
S9Cement silo0.21 (0.08)0.11–0.294.0
P6Cement dispatchS10Packing machine5.34 (1.67)3.52–7.454.0
S11Bulk dispatch0.15 (0.11)0.06–0.314.0
S12Bag dispatch by truck11.55 (7.74)4.13–18.844.0
S13Bag dispatch by barge13.40 (7.30)5.81–23.004.0
Table 3. The compositions and silica concentrations in the respirable dust samples.
Sampling LocationRespirable Dust Composition (%)Respirable Dust Concentration (mg m−3)Silica
Concentration (mg m−3)
SiO2Al2O3Fe2O3CaOMgOSO3K2ONa2OTiO2MnOP2O5Cl
Bulk dispatch 21.295.233.9055.952.122.070.710.220.370.100.100.030.030.01
Packing machine20.775.753.7352.572.592.240.640.380.470.100.310.140.660.14
Barge bag dispatch19.355.335.1450.792.332.340.630.320.450.110.310.161.220.24
Truck bag dispatch20.975.773.4051.872.642.310.640.380.440.110.300.180.770.16
Cement grinding19.624.892.8855.882.121.660.720.270.340.080.300.250.330.06
Publisher’s Note: MDPI stays neutral with regard to jurisdictional claims in published maps and institutional affiliations.

