3.4. Rainfall and Atmospheric Circulation Correlations
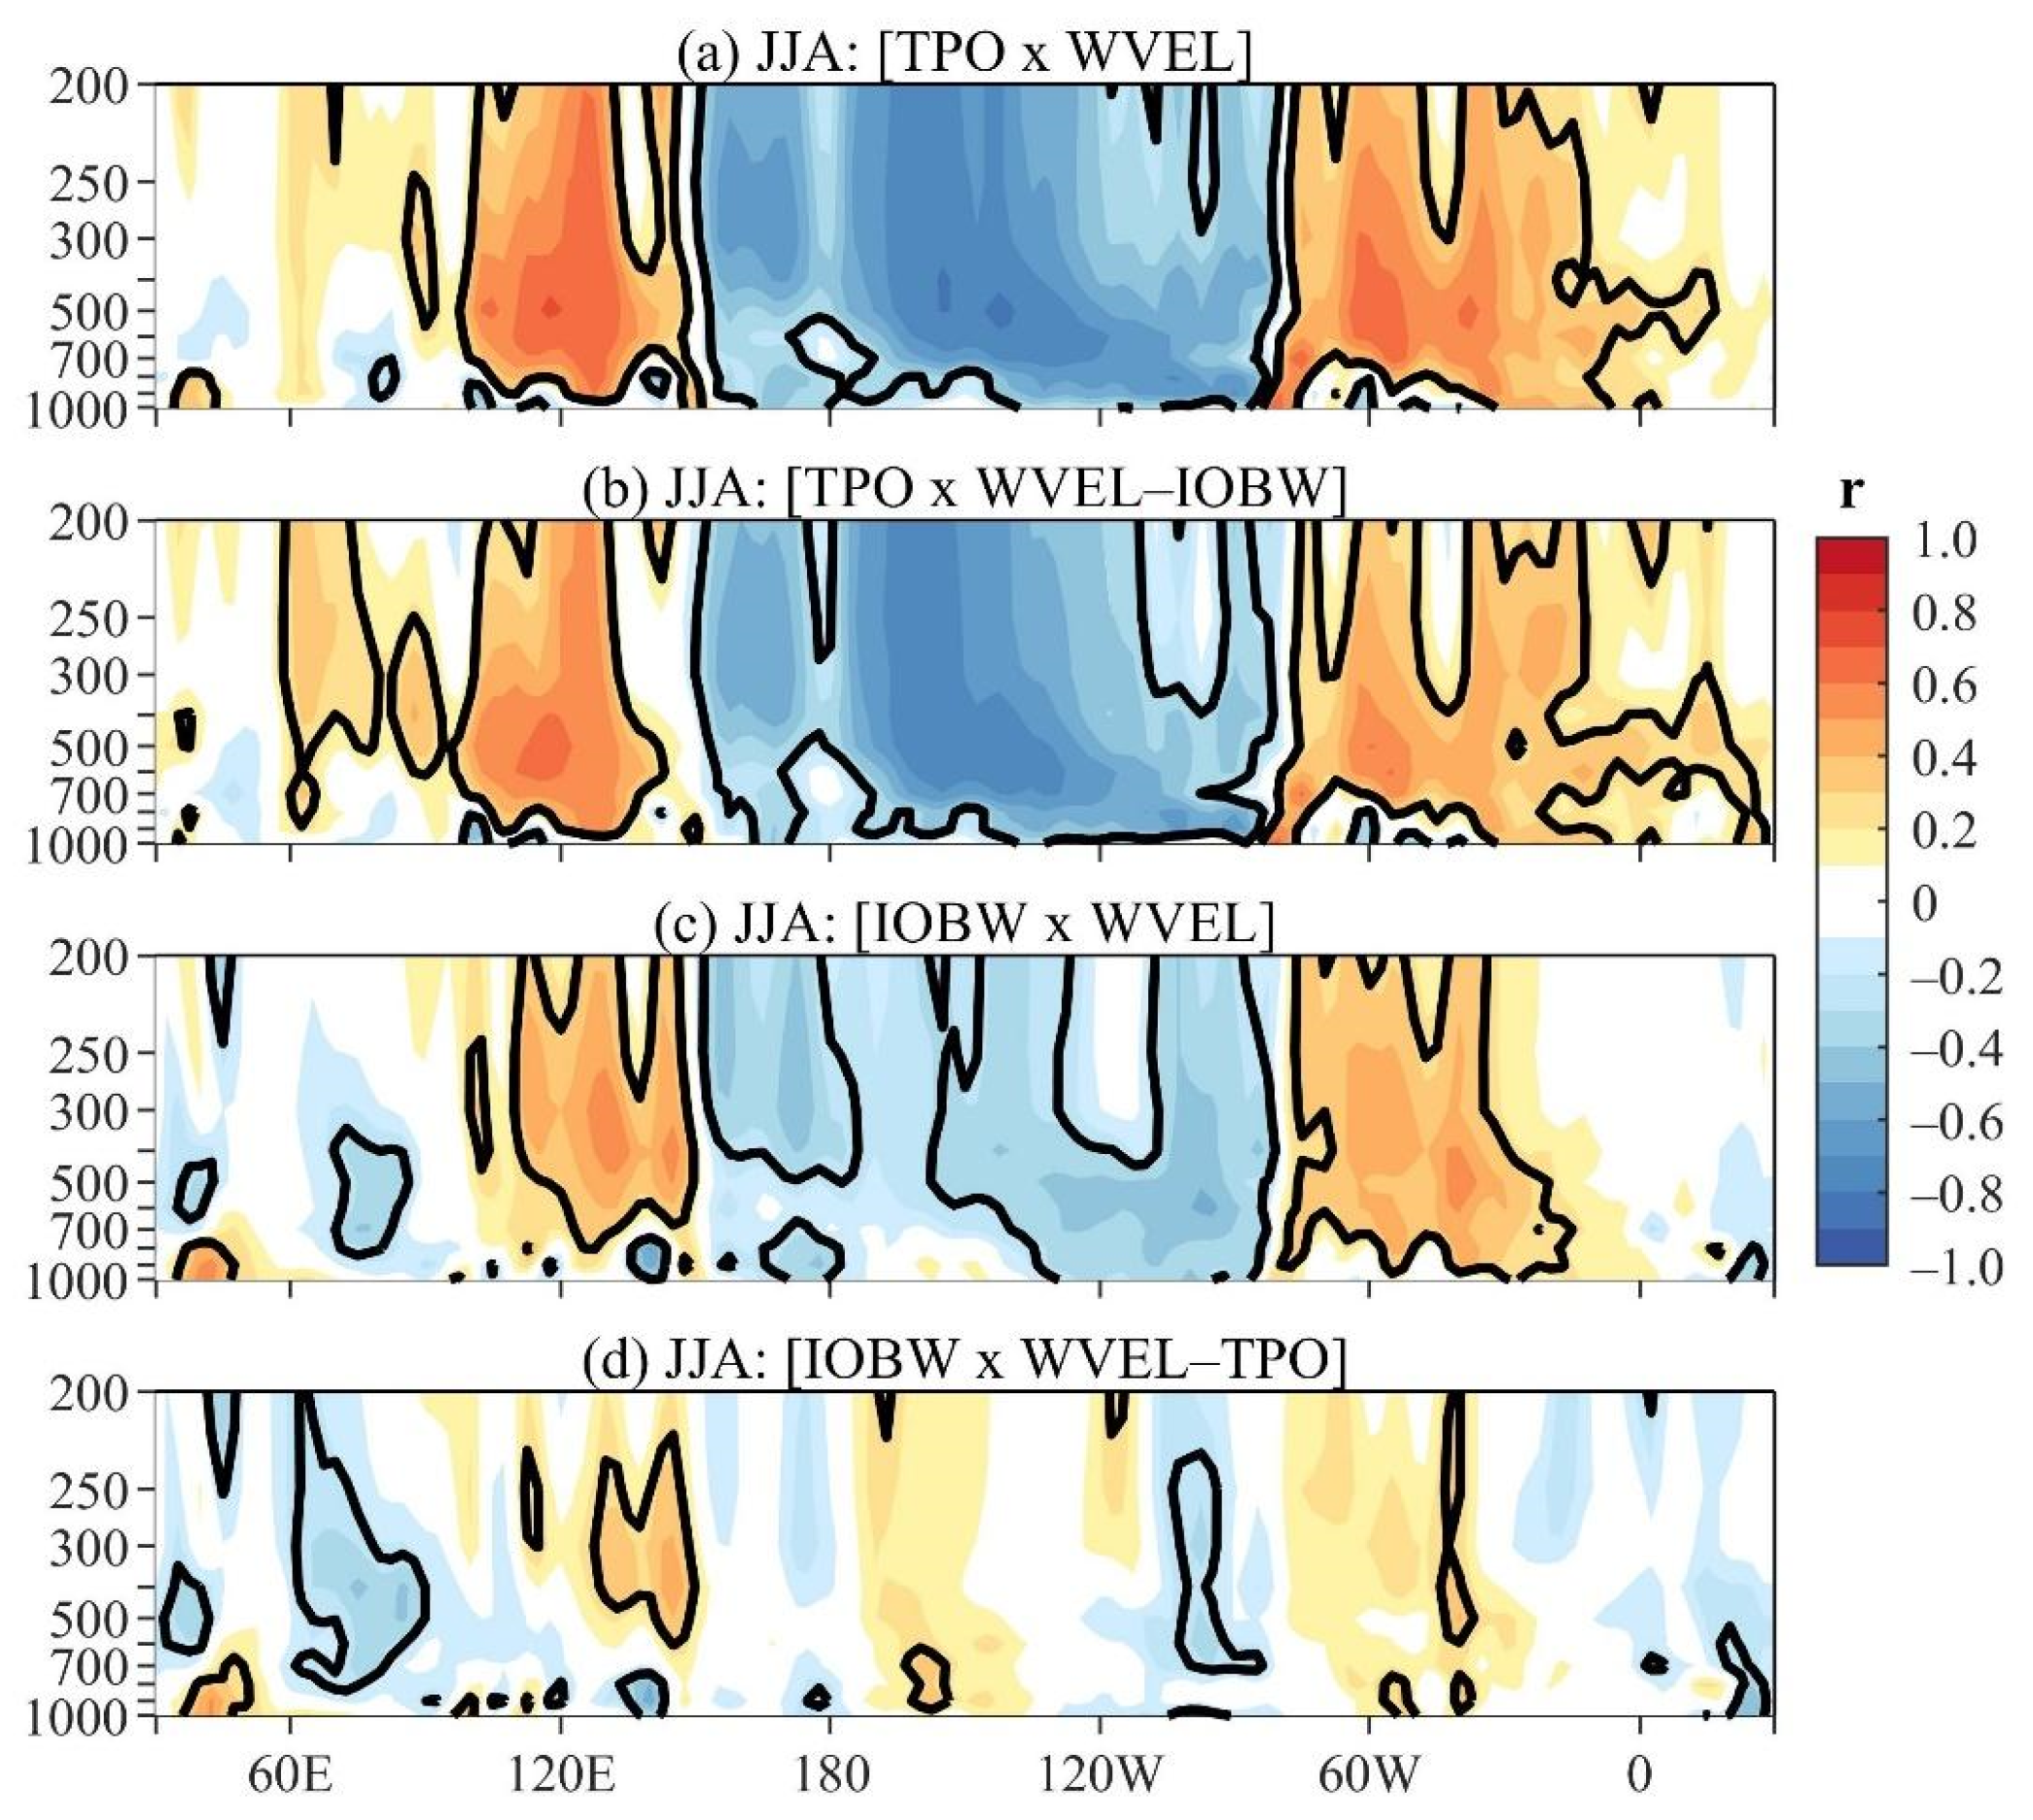
Figure 5 illustrates the longitude vertical cross-sections of the total and partial correlations for the WVEL. Significant [TPO × WVEL] correlations appear in most tropospheric levels with the negative ones in the central and eastern Pacific (150° E–75° W) flanked by positive correlations to the east between the eastern Pacific and the Atlantic (75° W–0° W) and to the west in the western Pacific (105° E–150° E) (
Figure 5a). For positive TPO, there is an eastward-displaced Walker cell associated with EN occurrences [
29], such that negative correlations reflect anomalous rising motions, and the positive ones, anomalous sinking motions. Similar features are observed for the [TPO × WVEL minus IOBW] correlations, except for positive correlations in larger bands, with the band in the western Pacific extending to the central Indian Ocean in the middle and upper tropospheric levels and that in the eastern Pacific/Atlantic, extending to western Africa (0° E–30° E) in lower to upper tropospheric levels (
Figure 5b). Therefore, when the warm IOBW effect is removed, the EN-induced sinking motions are intensified over the Indian and western African longitudes.
For positive IOBW, the [IOBW × WVEL] correlations describe an anomalous tripolar Walker cell, with sinking motions in most tropospheric levels in the western Pacific (110° E–150° E) and South American/Atlantic (80° W–15° W) bands and in the lower-tropospheric levels in the equatorial-western Indian Ocean, and rising motions in the lower to middle tropospheric levels of the eastern Indian Ocean/Indonesia (80° E–90° E) and in most equatorial longitudes of the Pacific Ocean (
Figure 5c). The corresponding partial correlations when the EN effect is removed feature anomalous rising motions in a larger longitudinal band of the Indian Ocean/Indonesia (60° E–90° E), and in two narrow bands, one in the eastern Pacific/South America (100° W–90° W) and another in Africa, and anomalous sinking motions in the middle and upper tropospheric levels of the western Pacific (120° E–150° E) (
Figure 5d). In this case, it is noteworthy that the sinking motions over the South American/Atlantic sector are reduced (
Figure 5d). When the EN effect is removed, the warm IOBW event favors a tripolar east-west cell with its rising motions approximately in the longitudes of the climatological tropical convection [
30] and sinking motions in the western Pacific (130° E–140° E) where is a climatologically upwelling region (
Figure 5d). For positive IOBW, the branches of the tripolar east-west cells inferred from the [IOBW × WVEL] and [IOBW × WVEL minus TPO] correlations show nearly coincident positions, except for some differences in their longitudinal and/or vertical extensions (
Figure 5c,d).
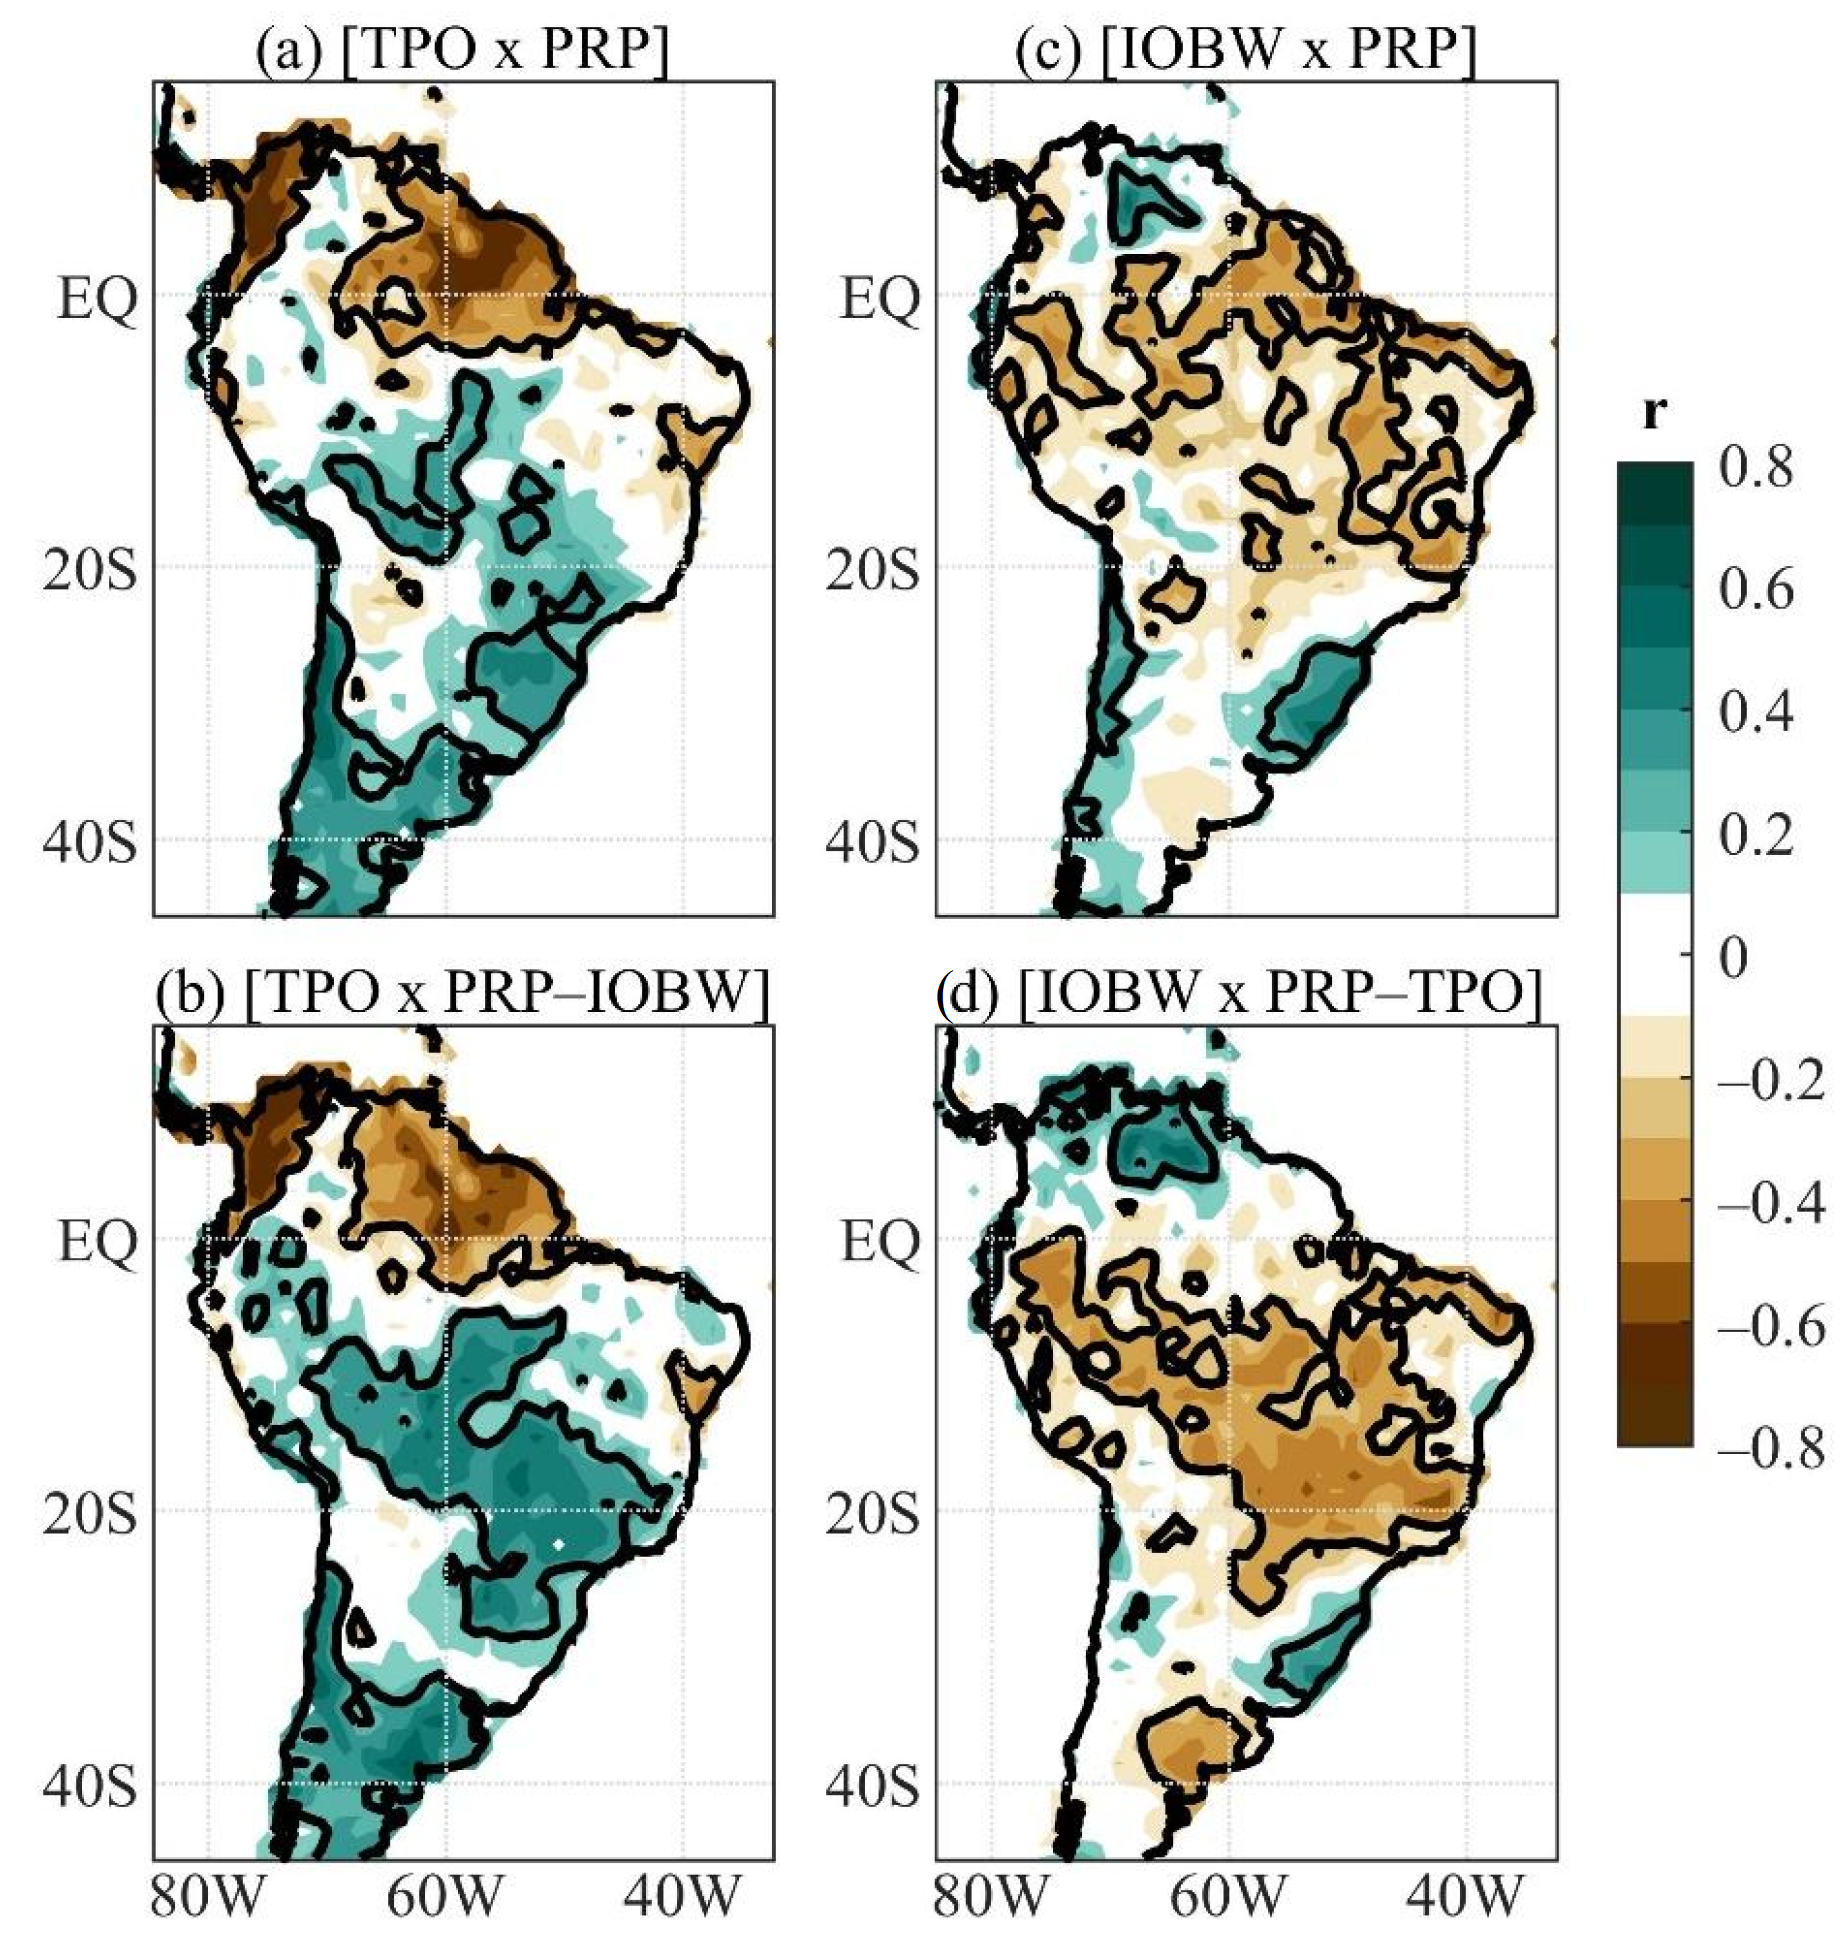
In order to examine the effects of the vertical velocity anomalies over the South American climate, correlation maps were also obtained for precipitation. The [TPO × PRP] and [TPO × PRP minus IOBW] correlation maps show similar patterns, except for well-organized positive partial correlations in central and eastern South America (
Figure 6a,b). The following interpretation of the correlations refers to the positive TPO. The correlation patterns represent the EN-related precipitation deficits in northwestern and northern South America and excessive rainfall in SESA and are consistent with previous findings [
13,
14]. On the other hand, the significant positive correlations in central and eastern South America represent EN-related positive precipitation anomalies, but their magnitudes might not be large because these regions are under the dry season. The precipitation deficits in equatorial South America are closely linked to the EN-related significant anomalous sinking motions in these longitudes, which are associated with an eastward-displaced Walker cell (
Figure 5a,b,
Figure 6a,b). These results are consistent with earlier findings on the EN effects on rainfall in equatorial South America [
13]. The excessive rainfall in SESA was previously attributed to the EN-related intensified subtropical jet stream [
9,
10].
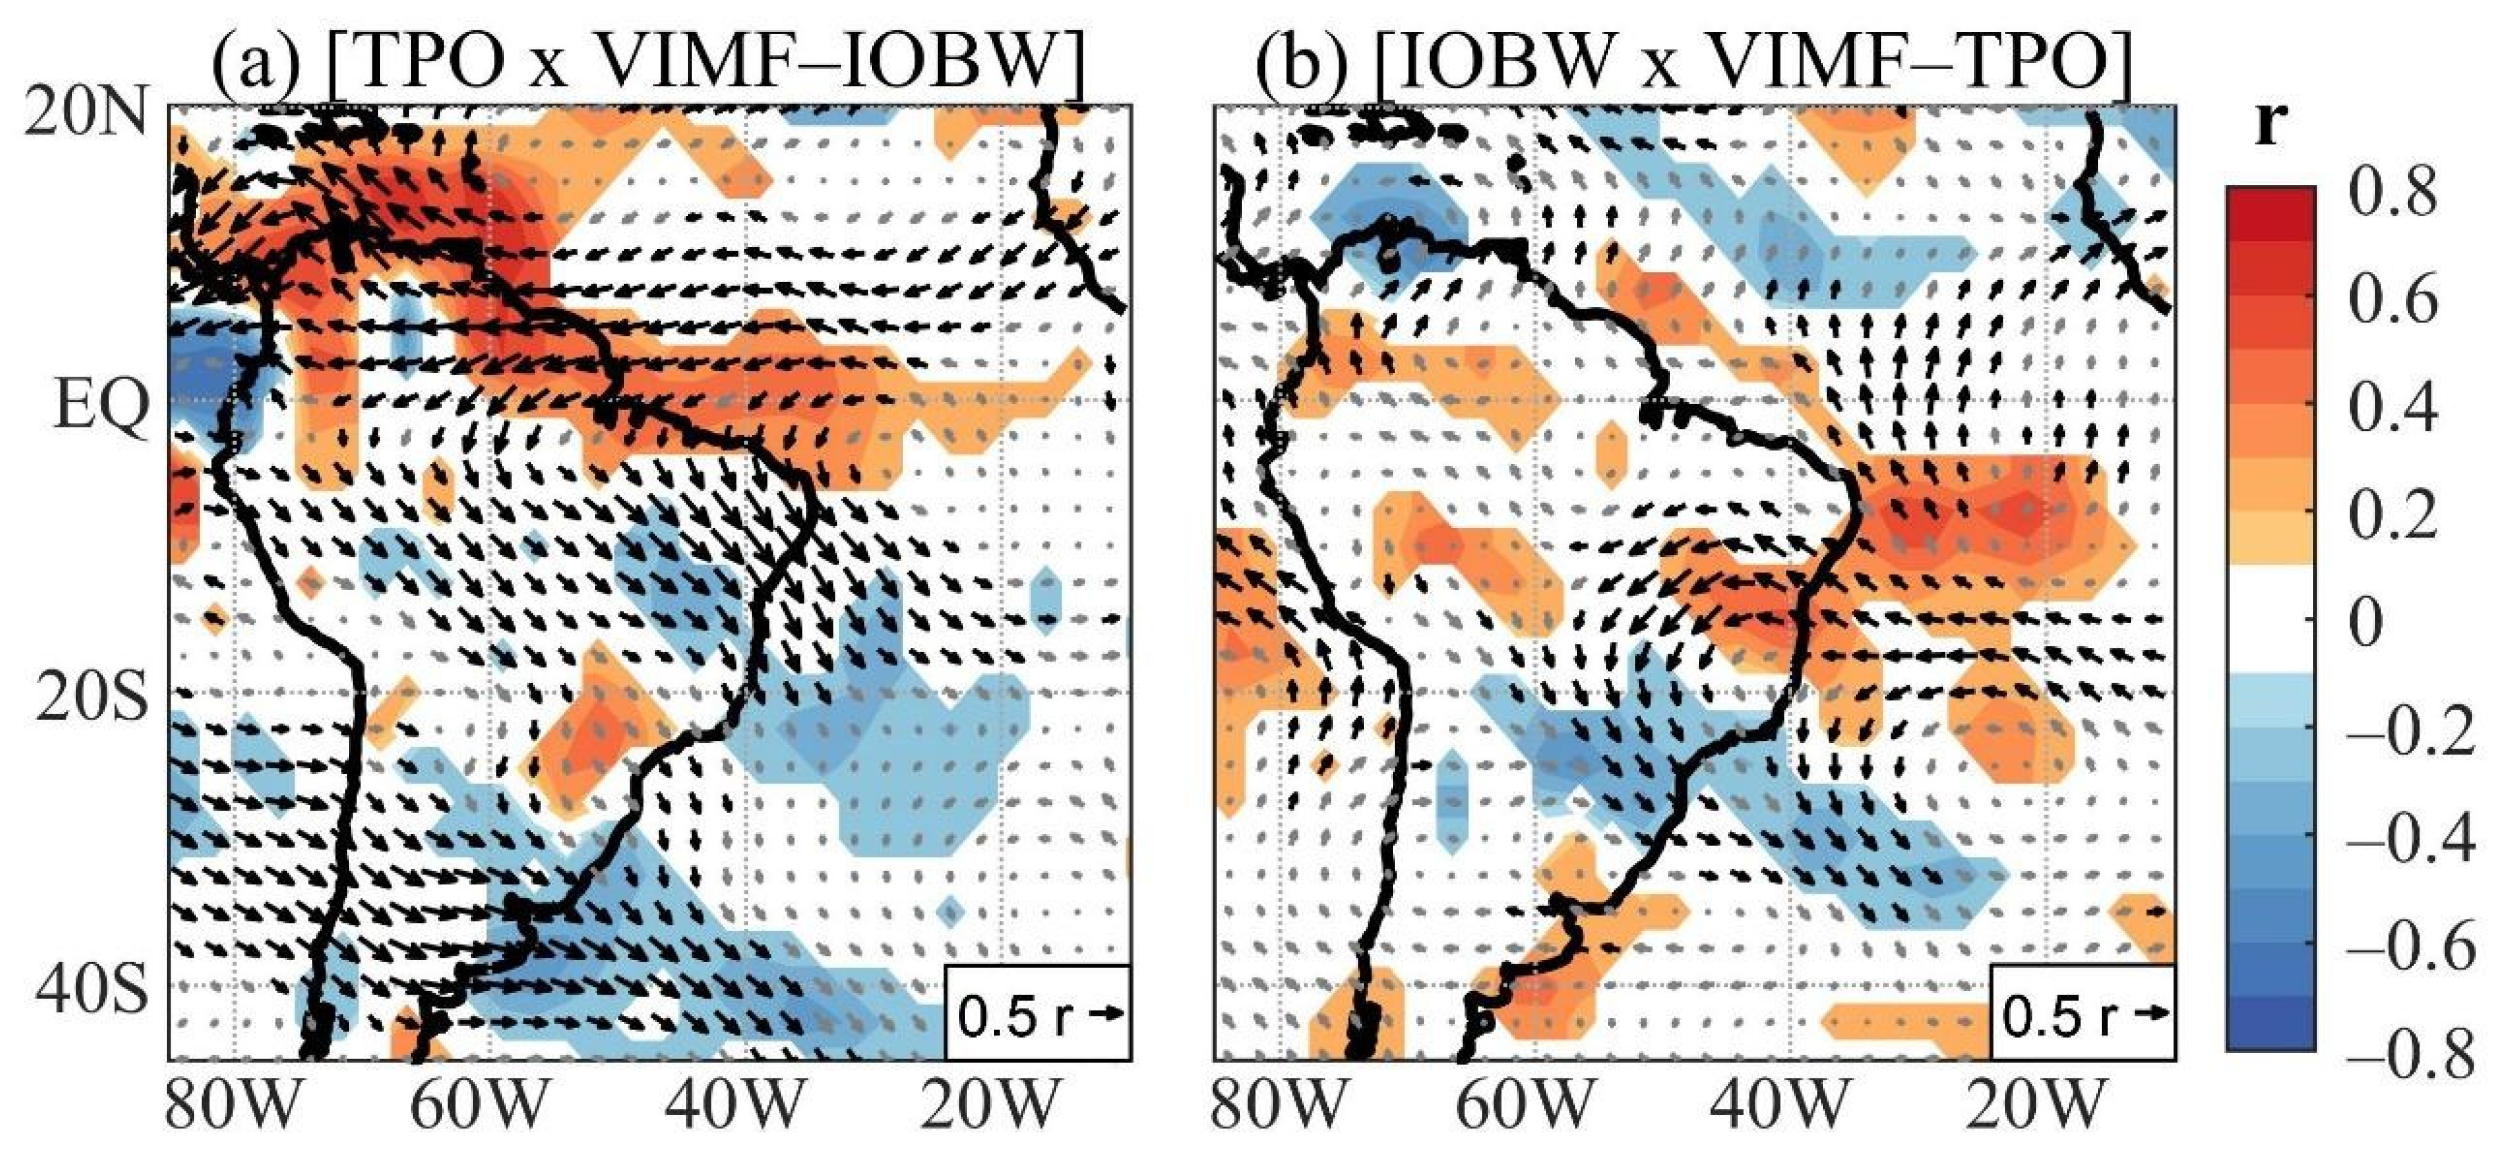
Connections between the regional circulation and rainfall anomalies during winter are examined here using the VIMF components and their divergence. The total and partial correlations show similar patterns, so only partial correlations are presented. For positive TPO, the [TPO × VIMF minus IOBW] correlation map represents a moisture divergent flow in the TNA and northern South America, where it splits into three parts, one continues westward, another curves northwestward, and the last one blows southeastward over the sector between the equator and 20° S (
Figure 7a). In addition, a flow in the southeastern Pacific blows southeastward in central-western South America between 20° S and 40° S, crosses SESA, and converges with the flow coming from the Amazon in southern Brazil and Uruguay (
Figure 7a). In addition, two anticyclones in the tropical South Atlantic (TSA), one centered at (30° S, 20° W) and another off the NEB coast, are evident (
Figure 7a). Considering the positive TPO, the partial correlation map indicates moisture convergence over SESA and the continental sector between 5° S and 20° S (
Figure 7a).
The [IOBW × PRP] map shows significant negative correlations in scattered areas of South America north of 20° S, except for central Venezuela, and positive ones in southern Brazil and along the western coast of subtropical South America (
Figure 6c). Moreover, the [IOBW × PRP minus TPO] map shows well-organized negative correlations in an extensive area between the equator and 25° S in central and eastern South America and an area in eastern Argentina centered at (38° S, 65° W), and the positive correlations over central and northern Venezuela and in a small area of southern Brazil (
Figure 6c,d). Regarding the warm IOBW phase, the [IOBW × VIMF minus TPO] correlation map represents a moisture divergent flow in the equatorial Atlantic, splitting into two branches, one northward into the TNA, and another crossing NEB, where in association with an anticyclone in TSA it acquires an anticyclonic curvature and reaches central-eastern Brazil (
Figure 7b). Still, for the positive IOBW, a southeastward flow transports moisture from the southwestern Amazon into southern and southeastern Brazil, where moisture convergence is noted (
Figure 7b). Regarding the warm IOBW, centers of moisture divergence appear in the Amazon, southern NEB, and the southwest Atlantic off the Argentinian coast.
The regional atmospheric circulations inferred from the partial correlations between the oceanic indices and the VIMF components and their divergence in some regions contribute to defining the rainfall anomaly patterns, such that negative precipitation anomalies are related to the moisture divergence and positive precipitation anomalies, to the moisture convergence. Consistent relationships between [TPO × PRP minus IOBW] and [TPO × VIMF minus IOBW] are conspicuous in northern South America and SESA (
Figure 6b and
Figure 7a). For the [IOBW × PRP minus TPO] and [IOBW × VIMF minus TPO] maps, consistent relationships are more evident in areas of central South America between 5° S and 15° S (
Figure 6d and
Figure 7b). Nevertheless, the partial correlations for the VIMF components and their divergence and for the precipitation do not show consistent relations in some areas. This is particularly noticeable in the inner side of southeastern Brazil where the significant positive [TPO × PRP minus IOBW] and [TPO × VIMF minus IOBW] correlations do not combine, and neither the significant negative [IOBW × PRP minus TPO] and [IOBW × VIMF minus TPO] correlations (
Figure 6b,d and
Figure 7a,b). In addition, in the South American band between 5° S and 15° S, the anomalous westerly flow relates to positive precipitation anomalies for the positive TPO, and IOBW the anomalous easterly flow relates to negative precipitation anomalies for the warm IOBW (
Figure 6b,d and
Figure 7a,b). These relationships between the zonal winds and rainfall variations in central-western Brazil during winter, which is the dry season in this region, have correspondences with the previously shown dry and wet periods within the wet season of this same region [
31].
The contrasting patterns of the [TPO × PRP minus IOBW] and [IOBW × PRP minus TPO] maps (
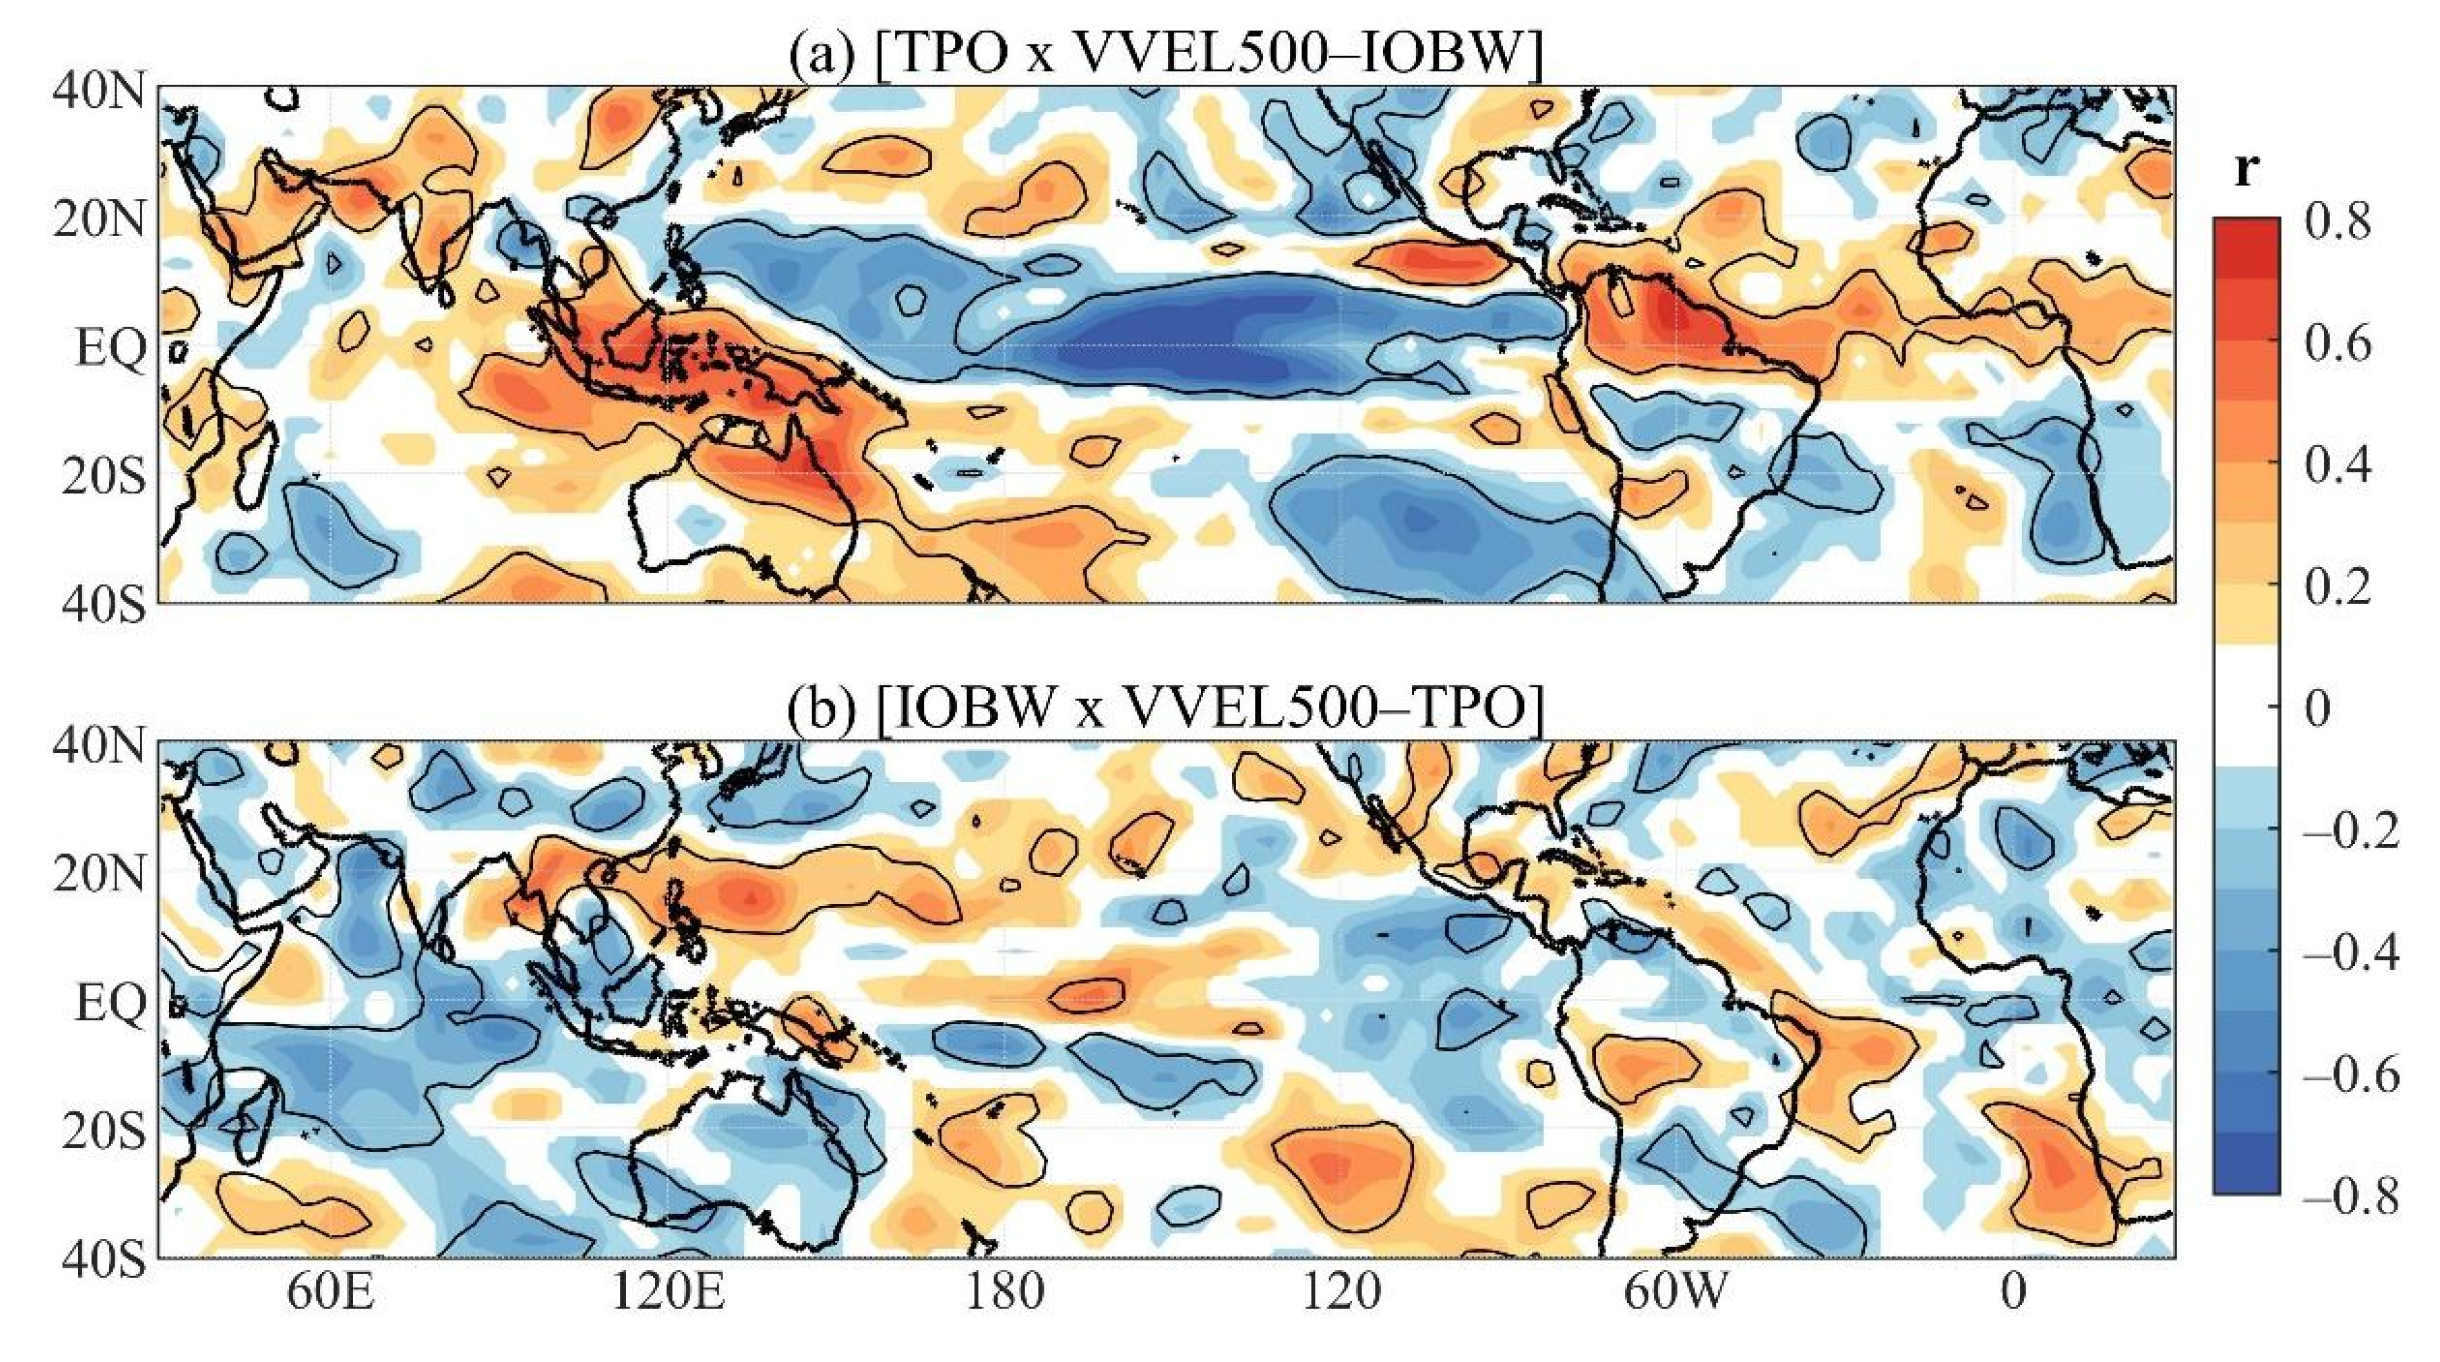
Figure 6b,d), particularly conspicuous in central and eastern South America, suggest that the regional Hadley cell might also contribute to these differences. The [TPO × VVEL500 minus IOBW] map shows significant positive correlations over South America to the north of 5° S and the adjacent Atlantic Ocean and the negative ones over the equatorial Pacific, which for positive TPO represent an anomalously eastward-shifted Walker cell associated with the EN (
Figure 8a). This map also shows negative correlations between 5° S and 20° S in most of central and eastern South America and positive correlations between 20° S and 30° S over central-western South America (
Figure 8a). Consistent relationships between the positive [TPO × PRP minus IOBW] correlations and negative [TPO × VVEL500 minus IOBW] correlations, and vice versa, can be interpreted in terms of the circulation and rainfall anomalies. For the positive TPO, the anomalous sinking motions relate to the negative precipitation anomalies in an extensive area in northern South America (northern Brazil, Venezuela, Guiana, Suriname, and French Guiana), and anomalous rising motions in central and eastern South America, the positive precipitation anomalies in this area (
Figure 6b and
Figure 8a). The consistent vertical velocity and precipitation relations are also illustrated with the averaged vertical velocities along 60° W (
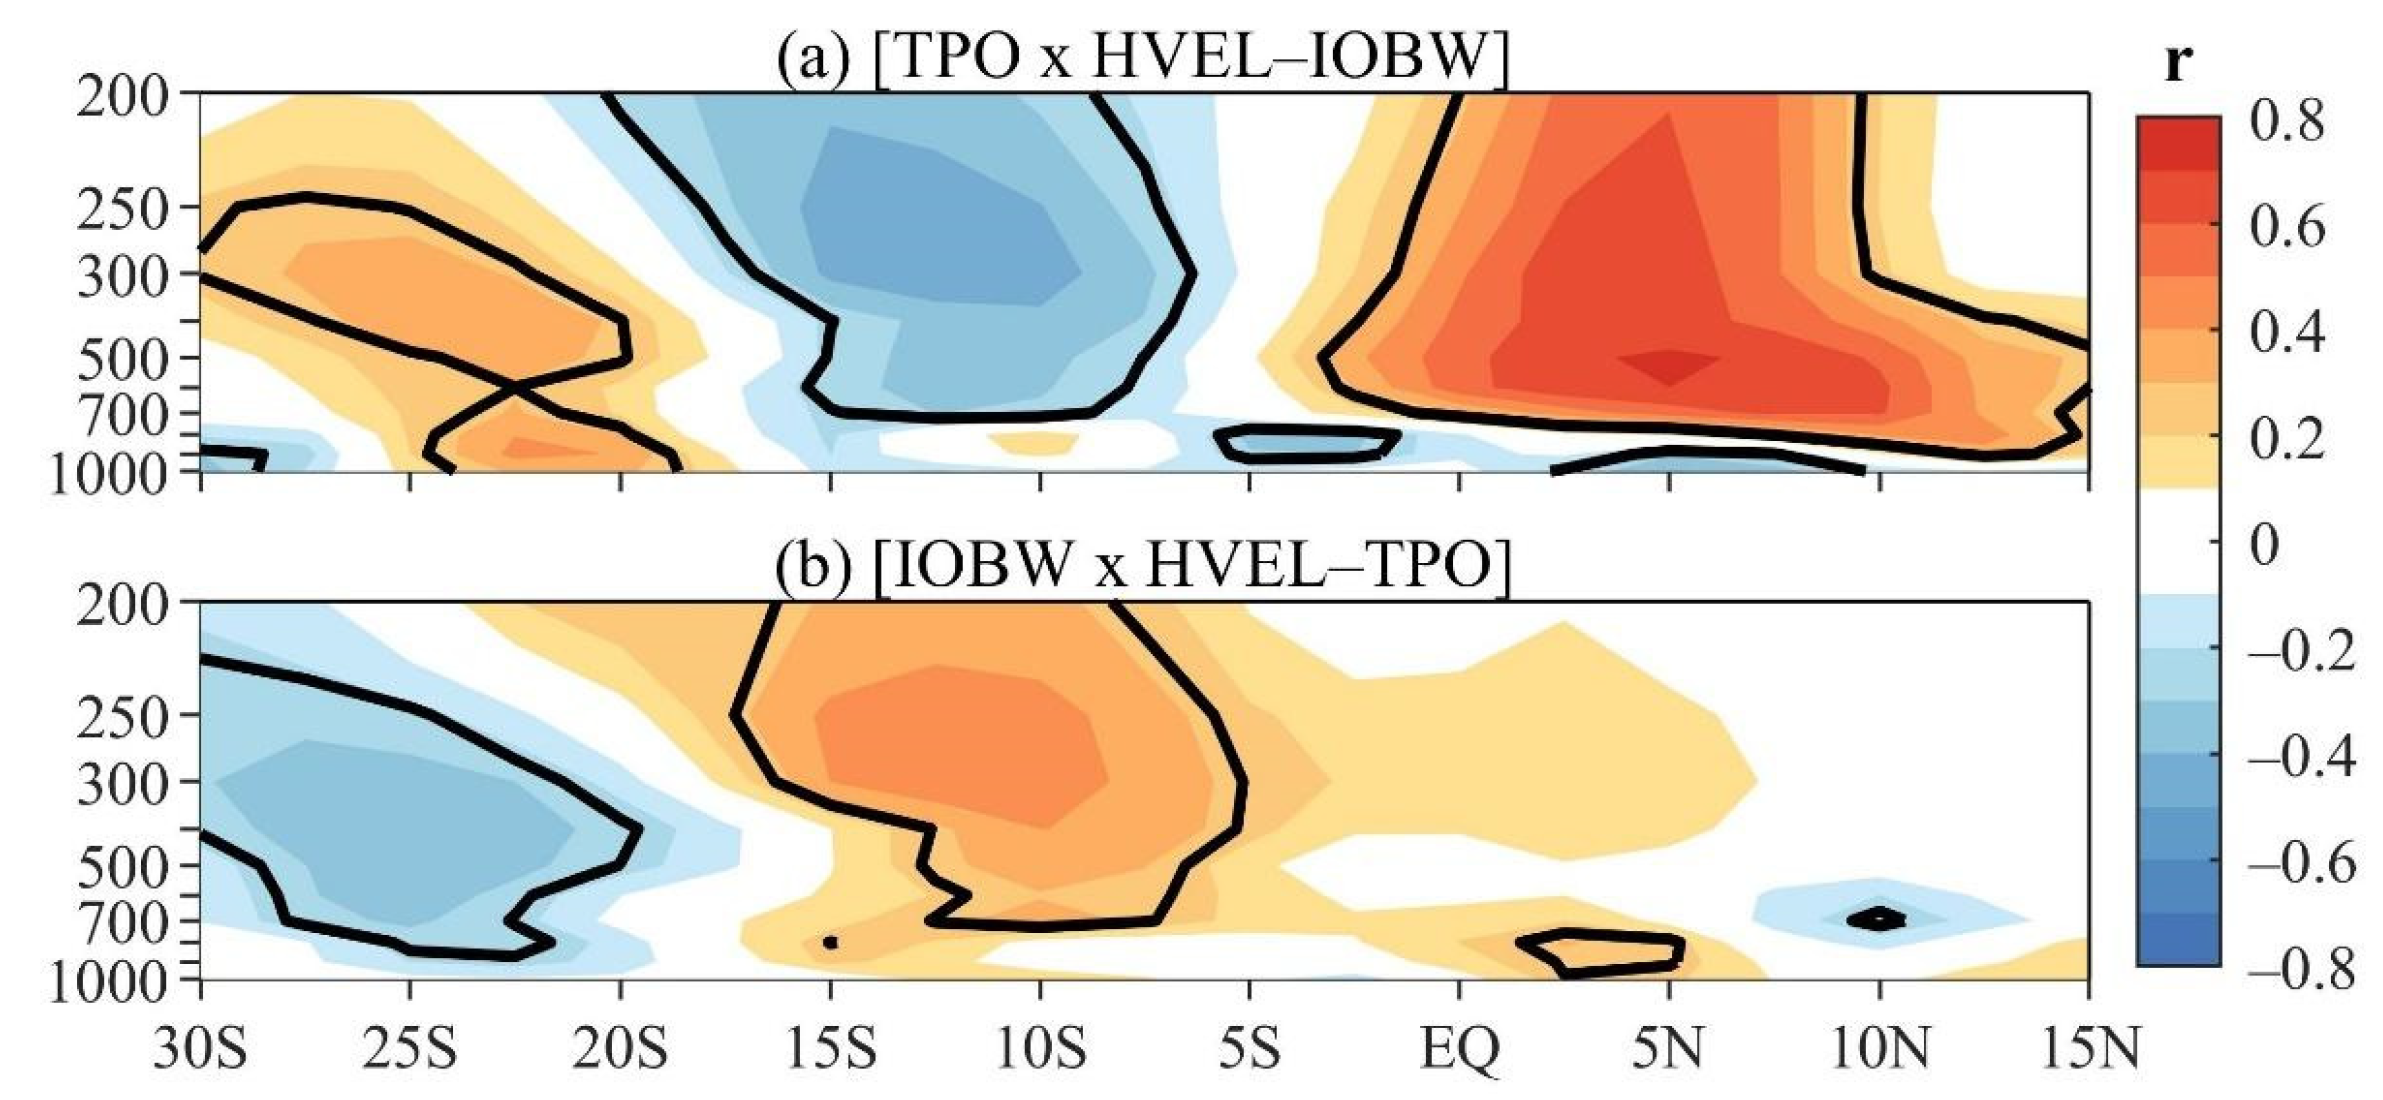
Figure 9a). In this case, the latitude vertical cross-section of the [TPO × HVEL minus IOBW] panel shows in most tropospheric levels significant positive correlations in the 15° N–5° S and 20° S–30° S bands, and significant negative correlations in the 7.5° S–17.5° S band (
Figure 9a). For positive TPO, these correlations represent an anomalous regional Hadley cell and are consistent with a dipole-like pattern between northern and central and eastern South America in the corresponding partial correlations of the TPO and precipitation (
Figure 6a and
Figure 9a).
On the other hand, the [IOBW × VVEL500 minus TPO] map shows significant negative correlations in northernmost South America and in an area including southern Bolivia, northern Argentina, Paraguay, and southern Brazil, and the positive ones in the band between 5° S and 20° S, which are better defined in central-western South America, and over coastal areas of NEB (
Figure 8b). In this case, the consistent relations between the [IOBW × VVEL500 minus TPO] and [IOBW × PRP minus TPO] correlations occur in northernmost South America, in the area between 5° S and 20° S in central-western South America and in coastal southern Brazil (
Figure 6d and
Figure 8b). It is remarkable that most of the extensive area with negative [IOBW × PRP minus TPO] correlations in central-eastern South America does not show positive [IOBW × VVEL500 minus TPO] correlations (
Figure 6d and
Figure 8b). This result indicates that the correlation analysis should be taken with caution. In particular, the negative [IOBW × PRP minus TPO] correlations in easternmost South America might not represent large magnitude precipitation anomalies. In addition, the latitude vertical cross-section of the [IOBW × HVEL minus TPO] correlations show almost opposite sign values to those for the [TPO × HVEL minus IOBW] correlations, while the negative correlations to the north of 5° S are not well-defined (
Figure 9a,b).
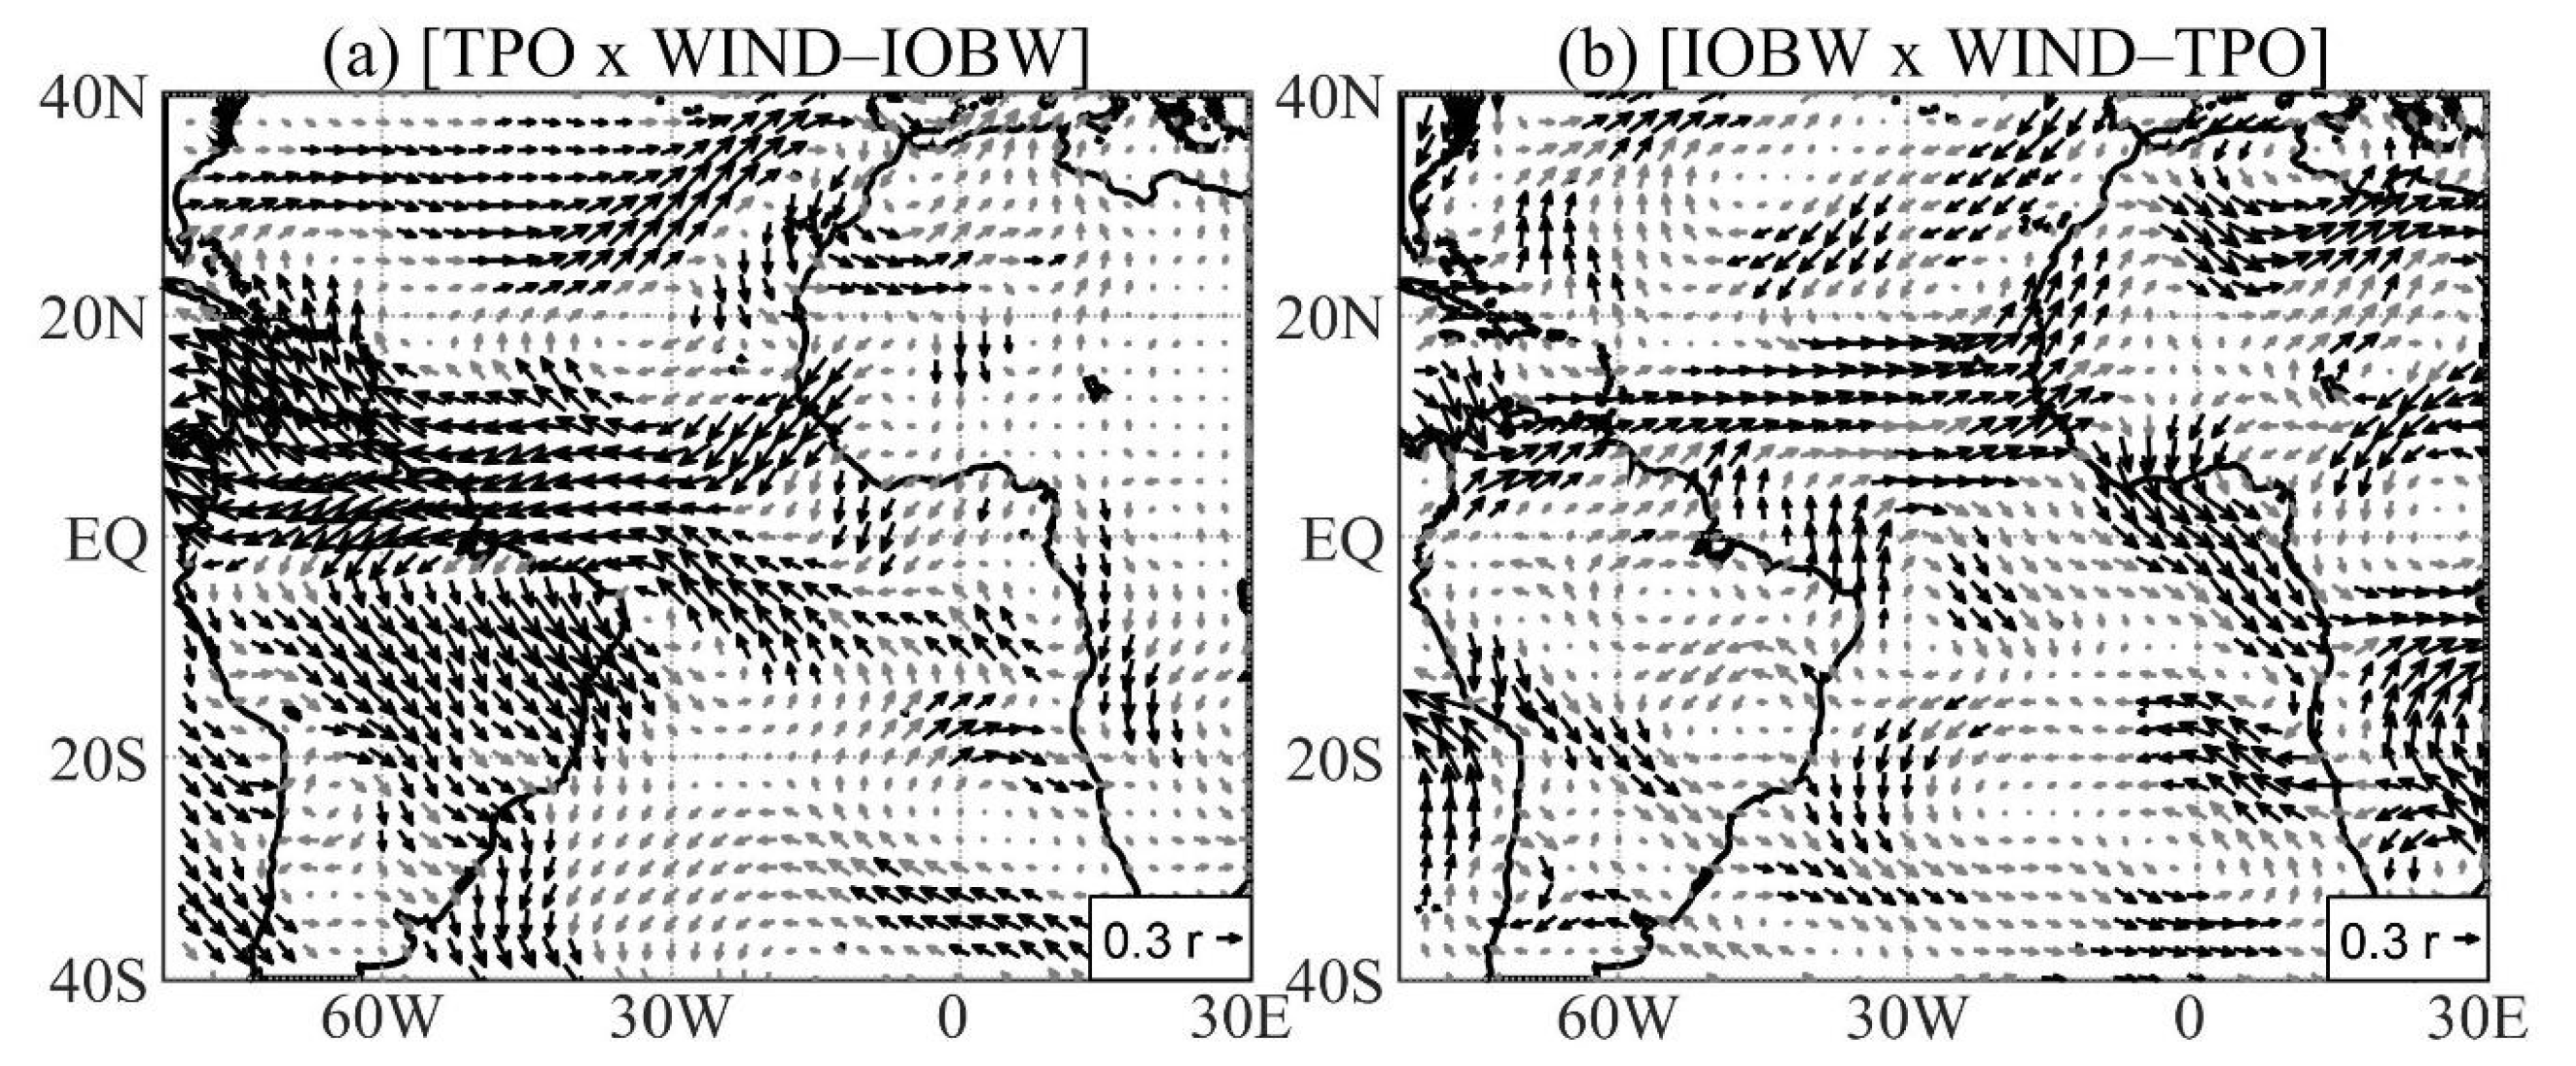
The [TPO × WIND minus IOBW] map shows similar patterns as those for the [TPO × VIMF minus IOBW] and for the positive TPO it depicts an intensified South Atlantic subtropical high-pressure system, which is typical of EN, and two anomalous anticyclones, one centered at (20° N, 30° W), and another over NEB and the adjacent Atlantic, and between them accelerated trade winds along the equatorial Atlantic (
Figure 10a). On the other hand, [IOBW × WIND minus TPO] and [IOBW × VIMF minus TPO] show similar features with a quite complex horizontal structure with several vortexes over the study domain (
Figure 7b and
Figure 10b). For positive IOBW, the most outstanding feature is the dominance of anomalous westerlies in the tropical Atlantic band between 20° N and 5° N (
Figure 10b).
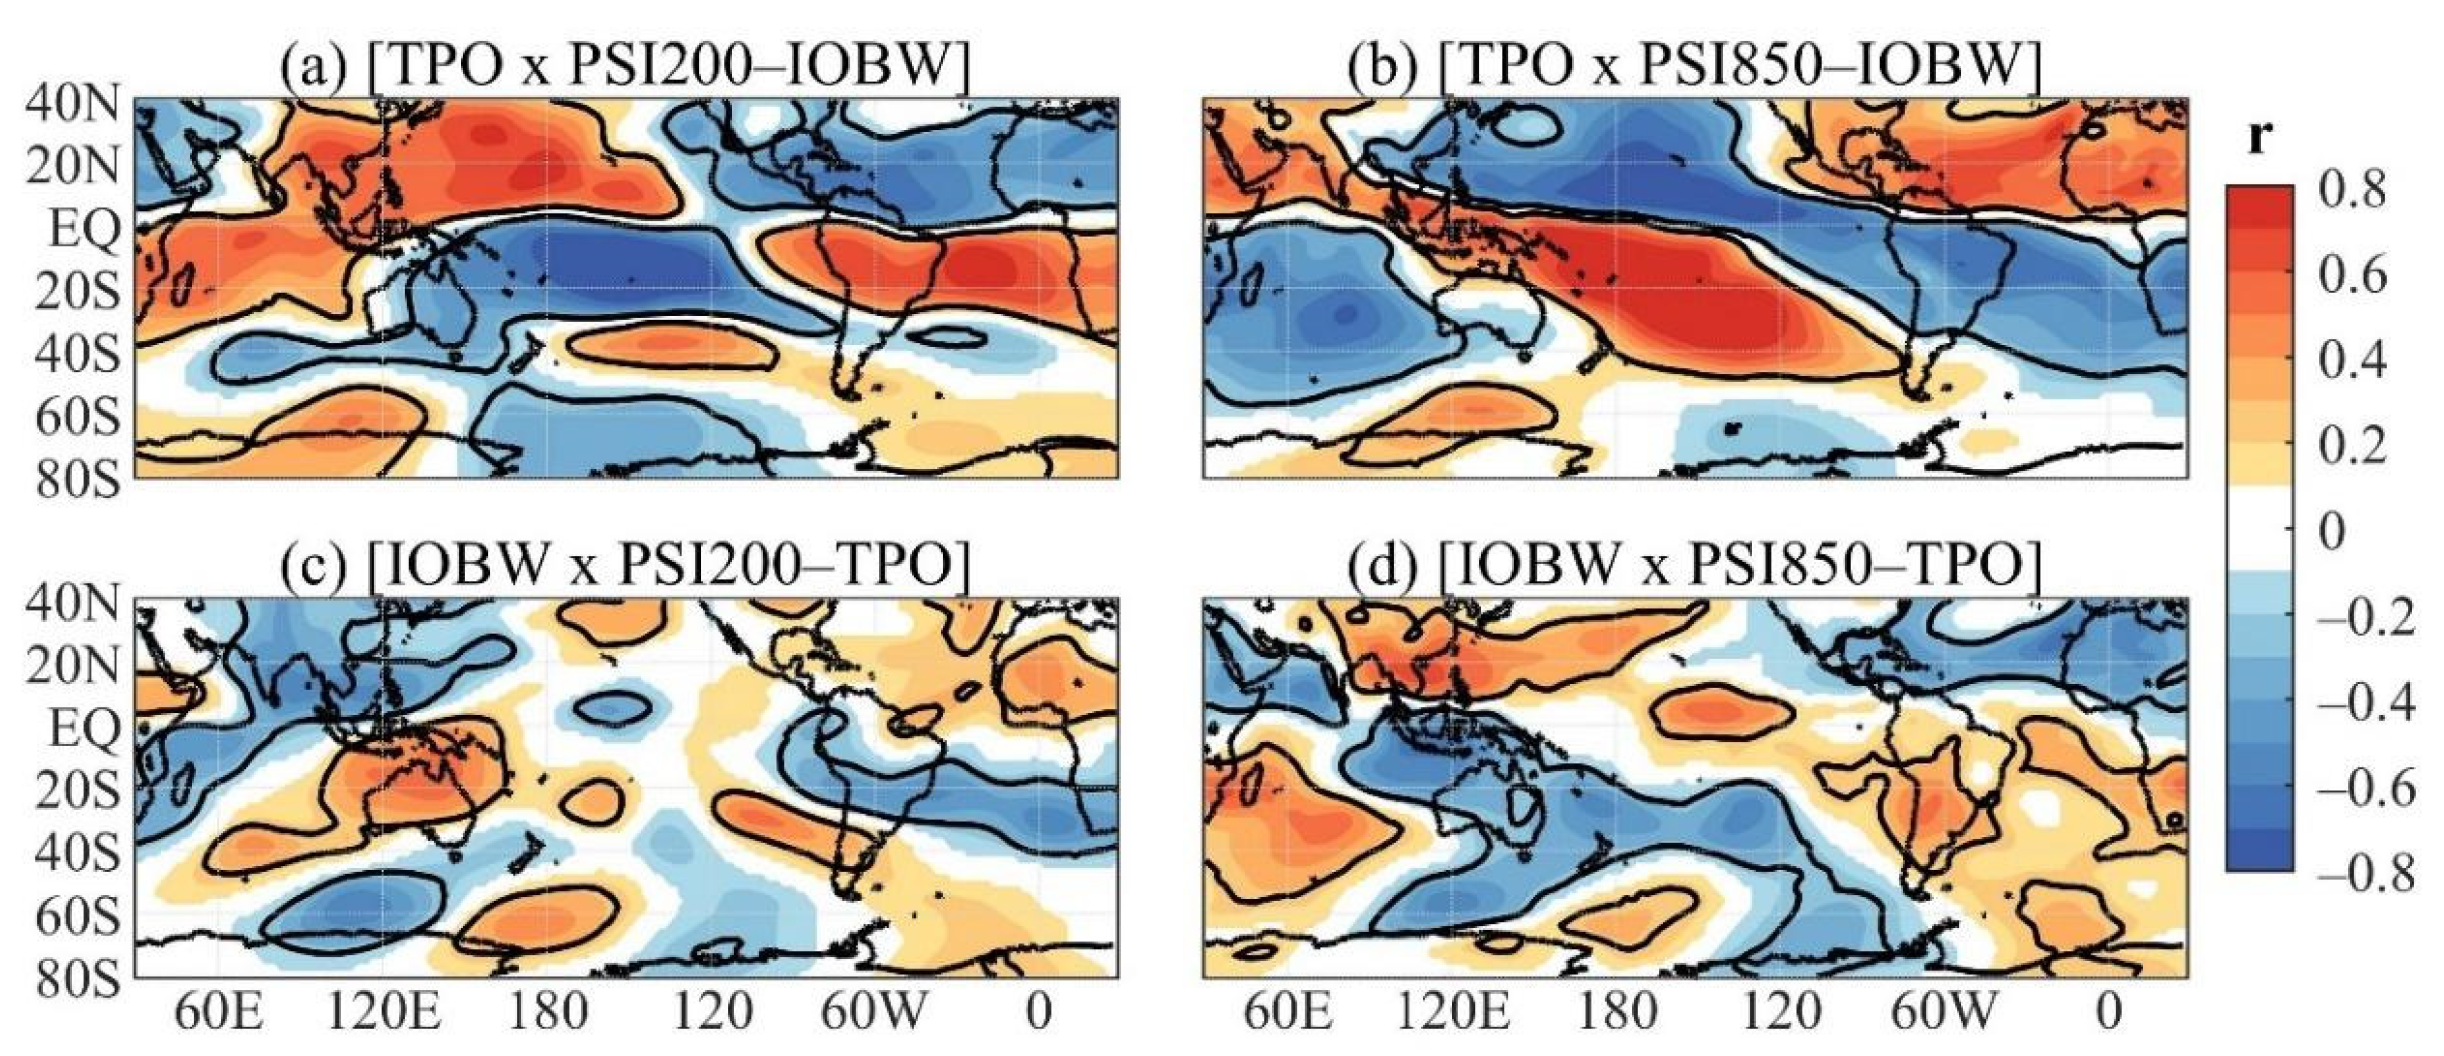
As for the other variables, only the partial correlation maps for the 200 hPa and 850 hPa asymmetric streamfunction are examined. Correlations in the two levels show centers with opposite signs in the tropics and the same sign in the subtropics and extratropics, which for a given phase of the mode (TPO or IOBW) can be interpreted as circulation pattern with baroclinic structure in the tropics and nearly equivalent barotropic structure in the subtropics and extratropics (
Figure 11) [
32]. For the EN without the warm IOBW event effect, the 200 hPa tropical circulation reflects the theoretical atmospheric response to the equatorial Pacific warming with an anomalous anticyclone in the central-western Pacific and anomalous cyclones in the Indo-Asian and the South American/Atlantic/African regions (
Figure 11a) [
33,
34]. In addition, for the EN, the Pacific-South American (PSA) teleconnection pattern is evident and has an equivalent barotropic anticyclone in subtropical South Atlantic, which is consistent with the moisture transport into SESA (
Figure 6b,
Figure 7a and
Figure 11a,b). On the other hand, the [IOBW × PSI200 minus TPO] and [IOBW × PSI850 minus TPO] maps illustrate centers of alternated sign correlations connecting the Indo-western Pacific Ocean and South America through the extratropical Southern Hemisphere (
Figure 11c,d). For the positive IOBW, this pattern represents an anomalous anticyclone over the Bellingshausen Sea and an anomalous cyclone over SESA (
Figure 11c,d). The cyclone over SESA contributes to the moisture transport into southern Brazil (
Figure 6d,
Figure 7b and
Figure 11c,d).
A careful comparison of the [TPO × PSI850 minus IOBW] and [IOBW × PSI850 minus TPO] correlation maps indicates that the tropical patterns have a phase difference of approximately 90° in longitude such that over South America, these maps show reversed sign correlations, which for positive TPO and positive IOBW represent, respectively, an anomalous anticyclone centered in eastern South America and anomalous cyclone centered over subtropical South America (
Figure 11b,d). This might be the main cause of the differences in the rainfall anomalies over South America associated with the EN and warm IOBW events (
Figure 6b,d).
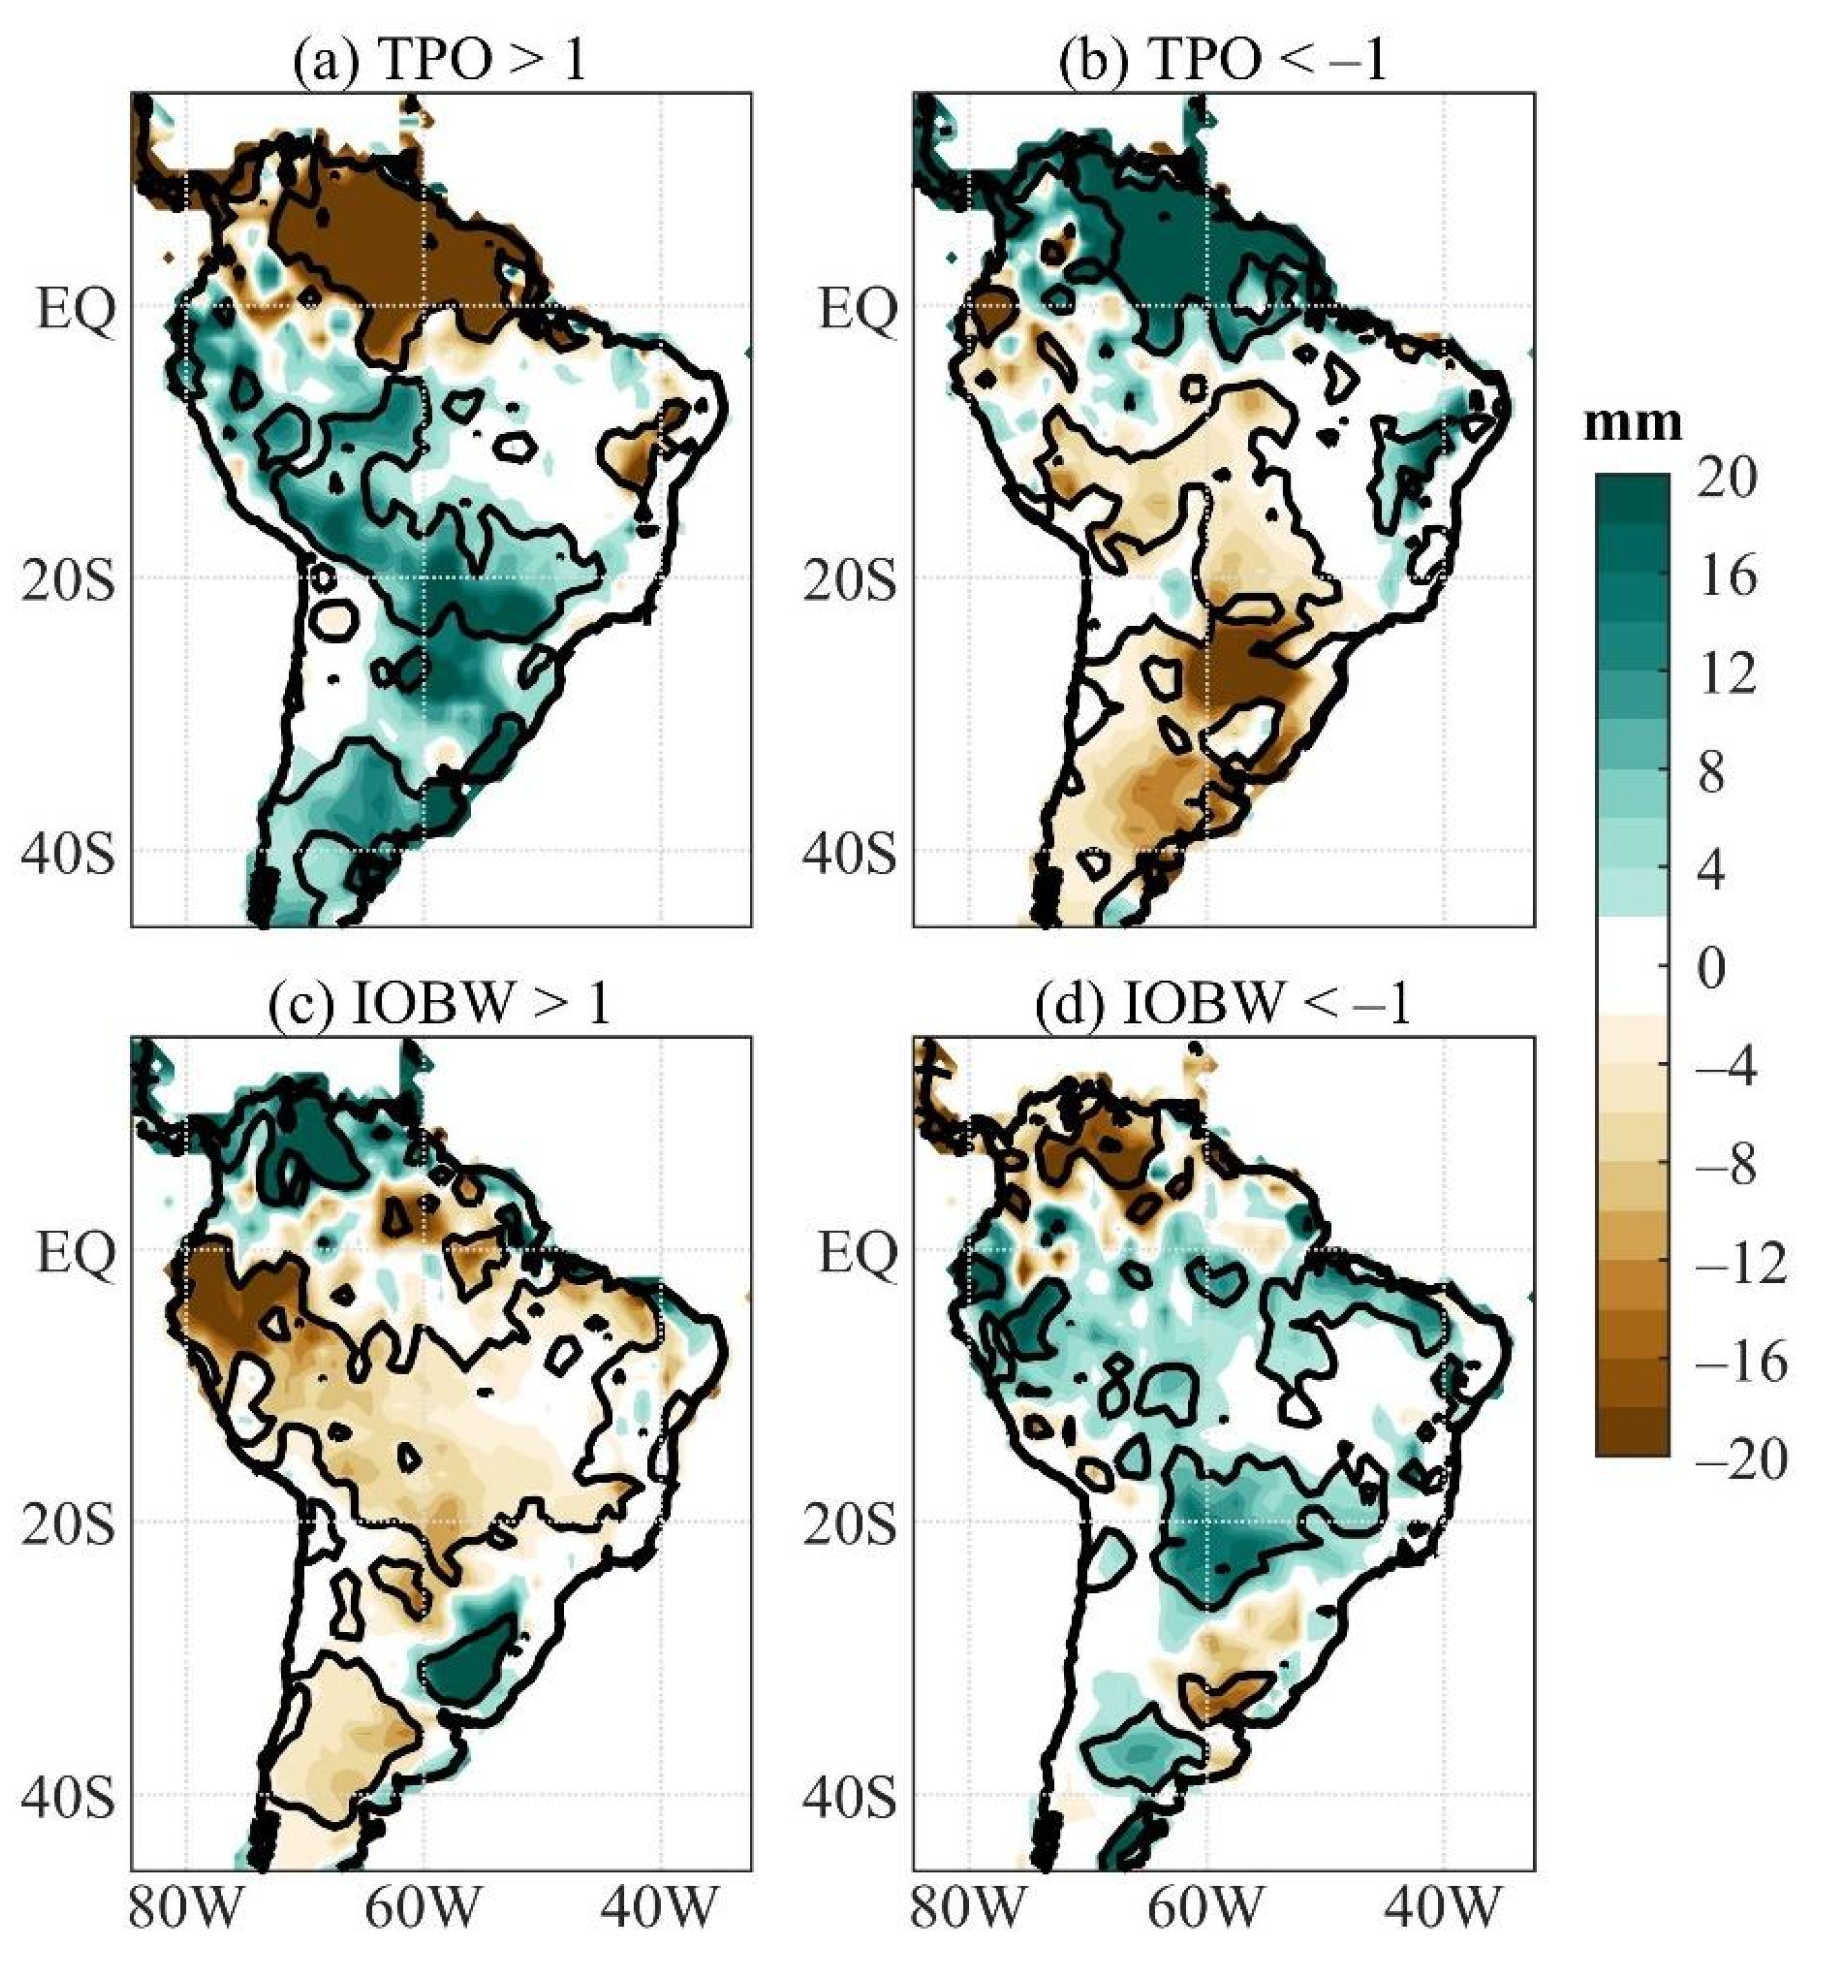
Since previous studies have shown little winter precipitation in central-eastern South America, approximately between 5° S and 25° S [
15], and the amount of rainfall anomalies can not be inferred from correlation maps, the ENSO and IOBW impacts on precipitation are examined further with composite analyses. Residual oceanic indices and the corresponding residual precipitation anomalies without standardization (mm/month) are used in these analyses. In the composite analyses, six years were included for the TPO > 1 composite and eight years for the other composites (TPO < −1, IOBW > 1, and IOBW < −1). The precipitation composites show non-linearities in some areas for both oceanic indices, more accentuated for the IOBW index. The TPO > 1 composite shows a rainfall anomaly pattern very similar to the [TPO × PRP minus IOBW] map when considering the EN event, with the largest anomalies exceeding 10 mm/month in magnitude in northern South America, SESA, and in areas of central and central-eastern South America (
Figure 6b and
Figure 12a). The TPO < −1 composite features a nearly reversed sign precipitation anomaly pattern, but with the largest anomalies exceeding 15 mm/month in magnitude in northern South America, inner southeastern Brazil, and part of the Mato Grosso do Sul state (approximately between 22° S and 30° S to the east of 60° W) (
Figure 12b). This explains the inconsistency between [TPO × PRP minus IOBW] and [TPO × VIMF minus IOBW] in inner southeastern Brazil (
Figure 6b and
Figure 7a). In addition, negative precipitation anomalies exceeding 10 mm/month in magnitude are found in small areas of central-western South America (
Figure 12b).
For the IOBW > 1 composite, negative anomalies are found in an extensive area in the equator-25° S band and west of SESA. The positive ones are in northern Colombia, western Venezuela, western Uruguay, and southern Brazil (
Figure 12c). For the IOBW < −1 composite, positive precipitation anomalies are noted in a small area in central-eastern Argentina and areas in the equator-25° S band, and the negative ones in Venezuela, a small area in western Uruguay and central-eastern Argentina (
Figure 12d). Concerning the pattern of the [IOBW × PRP minus TPO] correlations for the warm IOBW event, the precipitation anomaly pattern of the IOBW > 1 composite presents similar features in the equator-30° S band, and the centers in northern South America and SESA are slightly westward positioned (
Figure 6d and
Figure 12c). A similar comparison between the [IOBW × PRP minus TPO] correlations for the negative IOBW event and the IOBW < −1 composite indicates almost coincident positions of the anomaly centers in northern South America and SESA (
Figure 6d and
Figure 12d). For the IOBW > 1 composite, the negative precipitation anomalies to the east of 50° W in the 5° S–15° S band are quite reduced, and for the IOBW < −1 composite, the expressive positive anomalies are found in small scattered areas to the northwest of the equator-25° S band, in the 15° S–25° S band in central South America and along the northern Brazil coast between 50° W and 40° W (
Figure 12d). These results indicate that the partial correlations of the IOBW and precipitation can be considered for practical application, except in the area between 5° S and 15° S and east of 50° W (
Figure 6d and
Figure 12c,d).


 ,
, 


