Article

Health Risk Assessment of Toxic and Harmful Air Pollutants Discharged by a Petrochemical Company in the Beijing-Tianjin-Hebei Region of China

1
School of Chemical & Environmental Engineering, China University of Mining & Technology (Beijing), Beijing 100083, China
2
State Key Laboratory of Petroleum Pollution Control, Beijing 102206, China
*
Author to whom correspondence should be addressed.
Atmosphere 2021, 12(12), 1604; https://doi.org/10.3390/atmos12121604
Submission received: 12 November 2021 / Revised: 26 November 2021 / Accepted: 29 November 2021 / Published: 30 November 2021

Abstract

:
Monitoring of toxic and hazardous air pollutants (HAPs) in a petrochemical company in the Beijing-Tianjin-Hebei region of China to assess the impact of HAPs on the health risks of workers in the petrochemical company. The samples were tested by solid-phase adsorption thermal desorption/gas chromatography-mass spectrometry (HJ734-2014), and the pollutant emission list was obtained. According to the pollutant emission inventory, it can be seen that benzene, toluene and xylene are the main components of toxic and harmful air pollutants emitted by the petrochemical enterprise. The method of combining actual monitoring and CALPUFF model prediction was used to evaluate the impact of the toxic and harmful air pollutants emitted by the enterprise on the health of workers. The risk characterization results show that when benzene is the maximum concentration value predicted by the model, it will pose a carcinogenic risk to the factory workers. Therefore, based on the results of this study, it is recommended not to allow residents to live within the predicted concentration range of the model. The results of this study can enable China’s oil refining industry to better understand the characteristics of pollutant emissions from petrochemical companies in the Beijing-Tianjin-Hebei region. Moreover, the results of this study can be used as a policy basis for improving the health of workers in petrochemical enterprises, and are of great significance to the protection of public health.

1. Introduction

Toxic and harmful air pollutants [1,2,3] (HAPs) refer to pollutants that are harmful to human health and the ecological environment when the concentration in the atmosphere reaches a certain value. When people are exposed to a sufficient concentration of toxic air pollutants for a period of time, the chance of cancer or other serious health problems may increase. The first country to start research on toxic and harmful air pollutants and achieve good control effects is the United States. American researchers [4,5,6,7,8] have put forward a list of 189 toxic and harmful air pollutants by using a method of combining practice and science. Through a series of targeted measures, these toxic and harmful air pollutants have been effectively prevented and controlled. Research on environmental risk assessment and risk management in China started late, so most of the research in China so far [9,10,11] is based on foreign research results. China’s Atmospheric Law requires the release of a list of toxic and harmful air pollutants, and has begun to implement risk management for toxic and harmful air pollutants. Therefore, in order to assess environmental risks and potential hazards to the human body, we need to regularly monitor the pollutants discharged by some enterprises, clarify the emission of pollutants and conduct risk assessment. So far, the most widely used risk assessment method [12,13] in the world is the four-step method. The four-step method [14,15] includes the following: hazard identification, dose response assessment, exposure assessment (exposure assessment and dose response assessment are carried out at the same time), and risk characterization.
The processing industry that uses oil and natural gas as raw materials to produce petroleum and petrochemical products is called the petrochemical industry [16,17,18]. The petrochemical industry is an indispensable part of the chemical industry and an important part of China’s supporting industries. It has a significant impact on China’s national economy. Its status in the development of China’s national economy is irreplaceable and indispensable. According to relevant investigations and studies, petrochemical companies are an important source of atmospheric pollution in the ambient air. The emissions of 9 toxic and harmful air pollutants discharged by petrochemical industries such as petroleum processing, coking and nuclear fuel processing industries account for about 82% of the total pollutant emissions in the “Atmospheric Catalogue”. Therefore, if we have a deeper understanding and mastery of the petrochemical industry, it will be of great significance to the protection and improvement of human health [19,20,21].
The main refineries of China petrochemical corporations are mainly distributed in eight regions, such as the Beijing-Tianjin-Hebei region, the Pearl River Delta, the Yangtze River Delta, the southwest coast, the regions along the Yangtze River, and the Luyu region. Zhang Zhijuan [22] team monitored the specific process emission of volatile organic compounds from a refinery in the Pearl River Delta, China, and assessed the health risks of VOCs to the refinery workers. Through the United States Environmental Protection Agency (USEPA) method, it was found that all monitored areas had a clear cancer risk. Tong ruipeng [23] team analyzed and evaluated the emission sources and health risks of volatile organic compounds (VOCs) from a typical petrochemical refinery in Hainan. The research results show that the main pollutants in the refinery are benzene, toluene, ethylbenzene and xylene. These substances pose a potential carcinogenic risk to workers. Lu Daqi [24] team conducted research on the source profile, emission factors and secondary pollution contribution of volatile organic compounds (VOCs) emitted by a petrochemical company in Shandong. However, the impact of pollutants on the health of workers in the company has not been studied. Although Chinese researchers have attached great importance to the HAPs emissions of petrochemical corporations in recent years, they have rarely studied the HAPs pollution of petrochemical companies in the Beijing-Tianjin-Hebei region. Moreover, research on the health effects of workers in petrochemical companies is even rarer. Wei Wei [25] team conducted research on the emissions of volatile organic compounds from an oil refinery in Beijing. The study found that the petrochemical company is dominated by alkanes and benzene pollutants. However, the researchers did not conduct health risk assessments of the company’s employees. Lu Daqi [26] conducted a study on volatile organic compounds in a typical refinery in Hebei. The study found that the company’s main pollutant emissions are ethane, propylene, propane, isopentane and toluene. It is worth noting that the researchers did not conduct health risk assessments on company workers. In this study, the HAPs pollutant emissions of a petrochemical company in Tianjin in the Beijing-Tianjin-Hebei region were monitored and studied. More importantly, this study conducted a health risk assessment on the health of workers in petrochemical companies. The results of this study can enable China’s petrochemical industry to better understand the characteristics of pollutant emissions from petrochemical companies in the Beijing-Tianjin-Hebei region. In addition, the results of this study can serve as a policy basis for improving the health of workers in petrochemical enterprises, and are of great significance to the protection of public health.

2. Research Methods

Based on the emission inventory data of a typical petrochemical company in Tianjin Dagang District and the CALPUFF model simulation to obtain the concentration of characteristic pollutants of the company, this study carried out a risk assessment and calculated its risk value.

2.1. Sampling

For the Tianjin area, since the petrochemical enterprises in the jurisdiction are mainly crude oil refining industries, the technology related to crude oil processing is the focus of this work. Waste gas emissions include atmospheric distillation, vacuum distillation, reforming, hydrocracking, petroleum coking, refinery gas treatment, catalytic cracking, and petroleum product refining. The 11 organized discharge fixed pollution sources in the plant area are used as monitoring objects, as shown in Table 1. The “Solid Phase Adsorption Thermal Desorption/Gas Chromatography-Mass Spectrometry” (HJ734-2014) was used to determine the volatile organic compounds in the exhaust gas of stationary emission sources. Three full coverage monitoring were selected in March, June and September 2019.
According to the test results in Table S1 (in the Supplementary Materials), in the company’s organized emissions, the main substances that constituted HAPs were benzene, toluene, and xylene. The sum of the mass concentrations of these three types of substances accounted for more than 75% of the total concentration of VOCs, and the sum of detection frequencies accounted for more than 85% of the total number of detections, far greater than the sum of other detected monomers. From this we can see that benzene, toluene, and xylene are the main substances that constitute HAPs in this factory and the typical representatives of HAPs in this factory. More importantly, due to the limited workload, this study can only use benzene, toluene, and xylene as the main pollutants to participate in data statistics and risk assessment. The minimum, maximum, and average emission rates of each fixed emission source can be accumulated to get the minimum, maximum, and average emission rates of the whole plant, as shown in Table 2.

2.2. CALPUFF Model Prediction

The CALPUFF model is an unsteady multi-layer and multi-species three-dimensional Lagrangian smoke mass transport model, which can simulate the spatial and temporal variation of pollutants in the atmospheric environment with the flow field. Since the sampling was done in 2019, this study used 2019 as the base year of the model’s operation. Benzene, toluene, and xylene were the characteristic pollutants simulated by the model. We chose a petrochemical company located in Dagang District, Tianjin. The factory is located at 117.4667 east longitude and 38.85 north latitude in Dagang District. And this research uses the “Adsorption Tube Sampling Thermal Desorption Gas Chromatography-Mass Spectrometry Method” (HJ644-2013) to detect the pollutant emission rate in the ambient air of the factory. The detection limit of this method was 0.004mg/m3. Select March, June, and September 2019 as the inspection time period for factory air pollutants. Measure 5 times at one location, and take the average value as the sampling data for that month. The set grid was 15 × 20 m, so it was 300 grids.
The operation of the CALPUFF model requires preprocessing and pollution source parameter settings. Data preprocessing mainly includes five aspects: terrain data, land use data, precipitation data, ground weather data and high-altitude weather data. Since the CALPUFF model has terrain and land use data, we do not need to obtain these two data. The ground weather data contains 7 items of data. Hourly wind speed, wind direction, low cloud cover, cloud base height (km), relative humidity (%), dry bulb temperature (℃), and sea level pressure (hPa) for each day of the year. The high-altitude weather data contains 6 items of data. Air pressure (hPa), wind direction, wind speed, dew point temperature (°C), ground clearance (m), and dry bulb temperature (°C) at 8 o’clock and 20 o’clock every day of the year. Rainfall data only needs 1 item of data. Rainfall (mm/h) for 24 h a day. The ground weather data, upper air weather data, and rainfall data all come from the weather data station. We chose a petrochemical company located in Dagang District, Tianjin’s jurisdiction. So we chose the weather station in Dongba District. The radiosonde data station number in Dagang District, Tianjin is 54645.
The pollution source parameter setting mainly includes the standard limit of the ambient air function zone, deposition parameters, and pollution point source parameters. The source of the standard limit value of the ambient air function zone is data search. This research focuses on volatile organic compounds. Since the volatilization effect of volatile organic compounds is far greater than the sedimentation effect, we do not need to set sedimentation parameters. The pollution point source, line source, and non-point source parameters are provided by the enterprise. A total of 10 items of data are required for pollution point sources. Pollutant emission rate (see Table S1), smoke speed 15 m/s, chimney height 100 m, chimney inner diameter 2 m, flue gas temperature 323 K, etc.

2.3. Health Risk Assessment

Risk assessment includes hazard identification, dose (concentration)-response (effect) assessment, exposure assessment and risk characterization. In addition, health risk assessment is divided into two parts: carcinogenic risk assessment and non-carcinogenic risk assessment. A complete risk assessment should include both.

2.3.1. Hazard Identification

Hazard identification refers to the qualitative assessment of the nature of pollutants harmful to human health based on the collection of pollutant data and monitoring data in the study area. In addition, hazard identification also needs to assess the degree of harm that may be caused to the human body. The purpose is to determine whether toxic and harmful air pollutants are carcinogenic to humans. In other words, when people are exposed to certain toxic and harmful air pollutants, will these toxic and harmful air pollutants cause harm to human health or adversely affect health? The 2019 International Agency for Research on Cancer (IARC) special report [27] divided carcinogens into three categories and four groups (category 1, category 2A, category 2B, and category 3), as shown in Table 3. According to Section 2.1 of this thesis, we can see that this thesis takes benzene, toluene, and xylene as research objects. According to the 2019 IARC special report, benzene belongs to category 1, and benzene is carcinogenic to humans. Toluene and xylene belong to three categories. The carcinogenicity of toluene and xylene to humans cannot be classified yet.

2.3.2. Concentration-Effect Evaluation

The purpose of concentration-effect evaluation is to determine the relationship between the exposure dose of a certain pollutant and the adverse reactions of humans or animal groups. This relationship is used to evaluate the toxicity of pollutants later, and this relationship is a decisive step in the process of health risk assessment. The carcinogenic effects are mainly determined by the Inhalation Unit Risk [28] (IUR) of toxic and harmful air pollutants. The non-carcinogenic effects are mainly determined by the Reference Concentration (RfC) of toxic and harmful air pollutants. The IUR value and RfC value can be obtained through data query. Table 4 lists the parameters that are needed for carcinogenic and non-carcinogenic risk assessment. The parameters come from the USEPA Integrated Risk Information System (IRIS).

2.3.3. Exposure Assessment

Exposure assessment is to determine the exposure concentration of different pollutants through the atmospheric diffusion model based on monitoring data. The monitoring data includes two parts: emission source monitoring data and atmospheric environment monitoring data. The first part is to obtain emission source monitoring data. We obtain the emission rate (exhaust cylinder, kg/h) of toxic and harmful air pollutants through on-site monitoring (see Section 2.1). Then, we input the monitoring data into the atmospheric dispersion model (CALPUFF model). The second part is to obtain atmospheric environmental monitoring data (refer to Section 2.2).

2.3.4. Risk Characterization

Risk characterization is the last and critical step of risk assessment. It is a comprehensive evaluation of all the information of the previous three steps. It synthesizes a comprehensive conclusion on risk, and is complete, informative, and useful to decision makers. The risk characterization is to convey the results of the health risk assessment.
(1) Carcinogenic risk
On the basis of hazard assessment and exposure assessment, the product of the risk of the inhalation unit and the exposure concentration is used to characterize the carcinogenic risk of each single pollutant entering the human body through the respiratory route. The calculation formula is shown in Equations (1) and (2).
E C = ( C A × E T × E F × E D ) A T
Note: EC is the exposure concentration (μg/m3). CA is the concentration of pollutants in the air (μg/m3), which can be obtained through monitoring analysis or model prediction. ET is the estimated exposure time (8 h/day). EF is the number of exposures (250 days/year). ED is the duration of exposure (30 years). AT is the average exposure time (exposure years (years) × 250 days/year × 8 h/day). Since the worker’s exposure period is the worker’s working period, the exposure period in AT is 30 years.
R i s k = I U R × E C
Note: Risk is the estimated inhalation cancer risk. IUR is the estimated inhalation unit risk (m3/μg) (from US EPA IRIS or OEHHA), which is the excess lifetime cancer risk estimated to result from continuous exposure to an individual VOC via inhalation per μg/m3. EC is the exposure concentration (μg/m3). When Risk ≥ 106, it indicates that there is a carcinogenic risk to the human body. when Risk < 106, it indicates that there is no carcinogenic risk to the human body.
(2) Non-carcinogenic risk
On the basis of hazard assessment and exposure assessment, the quotient method is used to characterize the non-carcinogenic risk of each single pollutant entering the human body through the respiratory route, namely the Hazard Quotient (HQ). The calculation formula is shown in Equation (3).
H Q = E C R f C × 1000
Note: HQ is the hazard quotient. EC is the exposure concentration (μg/m3). RfC is the reference concentration (mg/m3). HQ above 1 indicates a probable adverse affect; HQ below 1 indicates that adverse effects are less probable. Namely, cancer risks no higher than 1 × 10⁻⁶ for an “ample margin of safety” and non-cancer hazard risk<1 are regarded as acceptable.

3. Results and Discussion

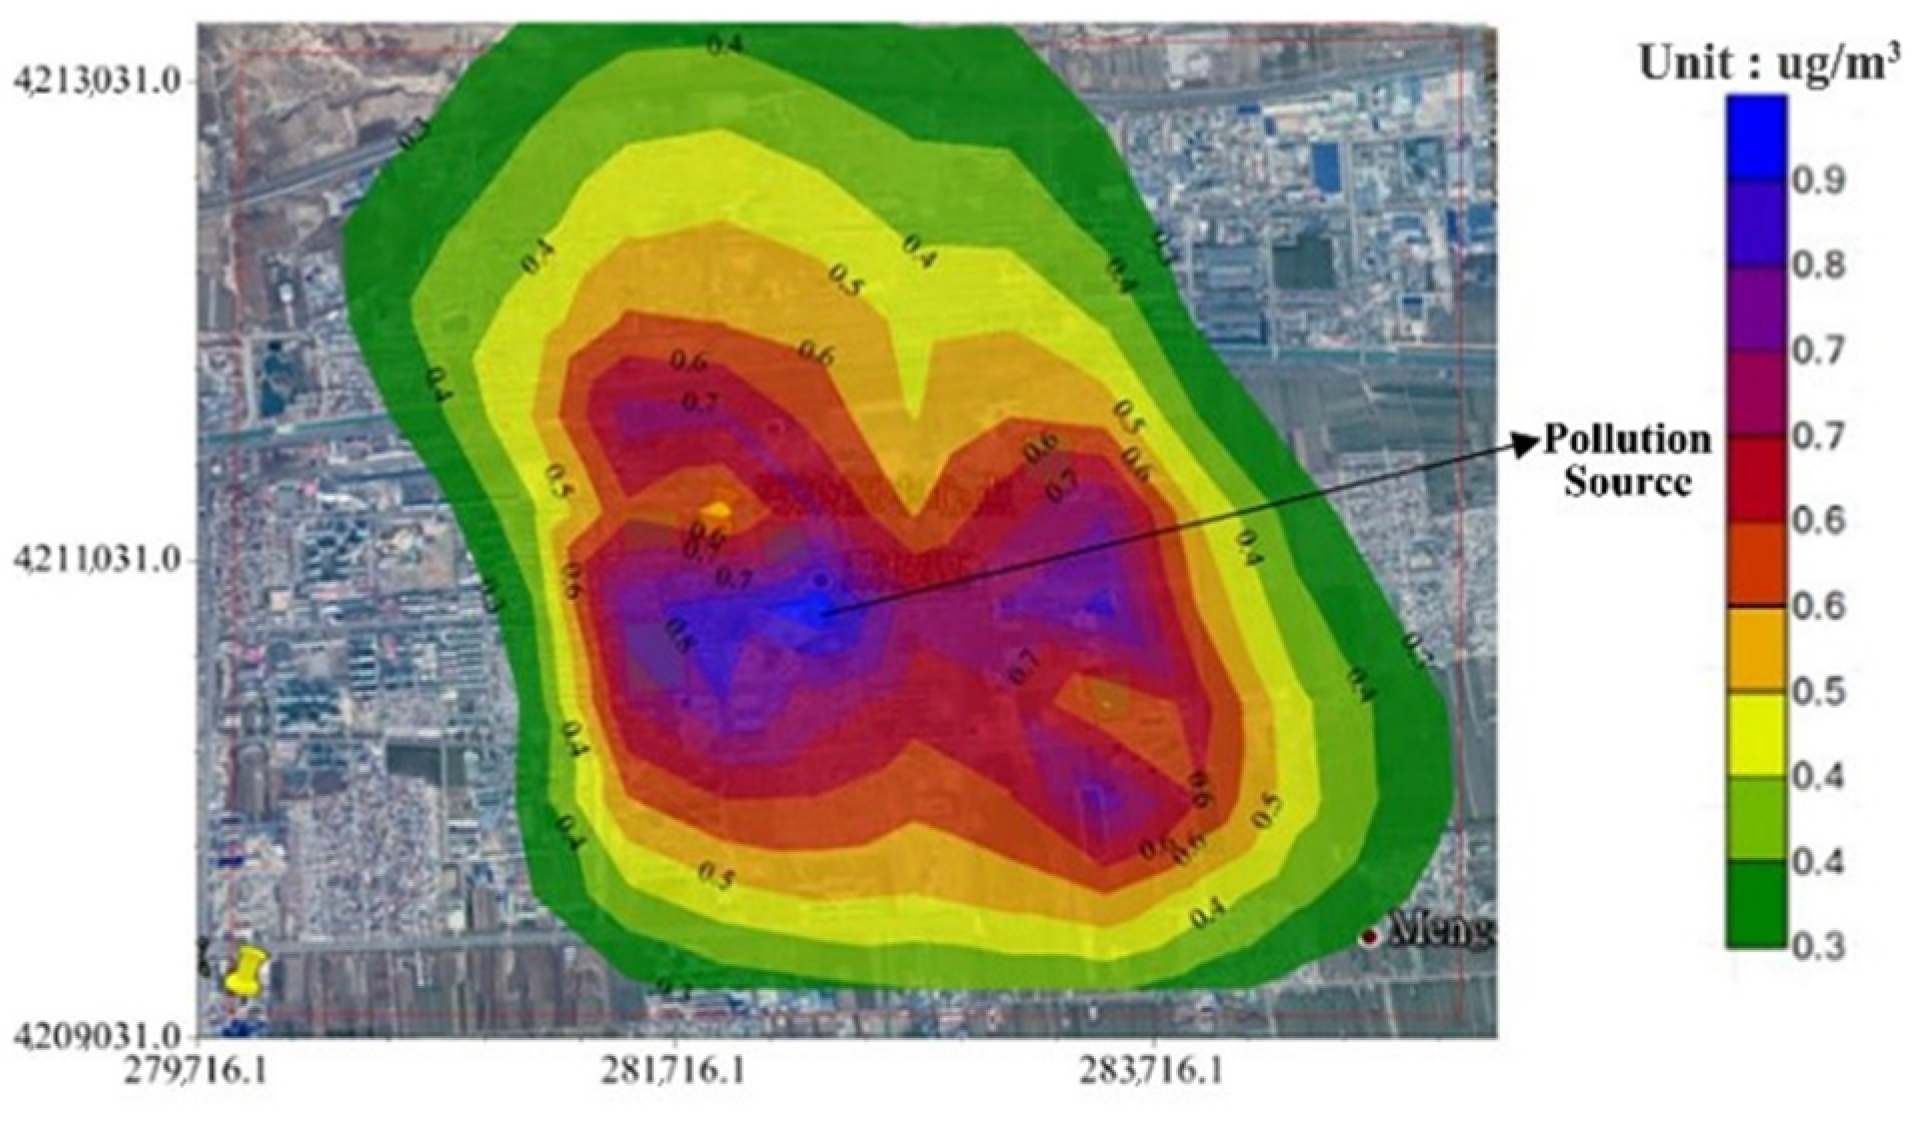
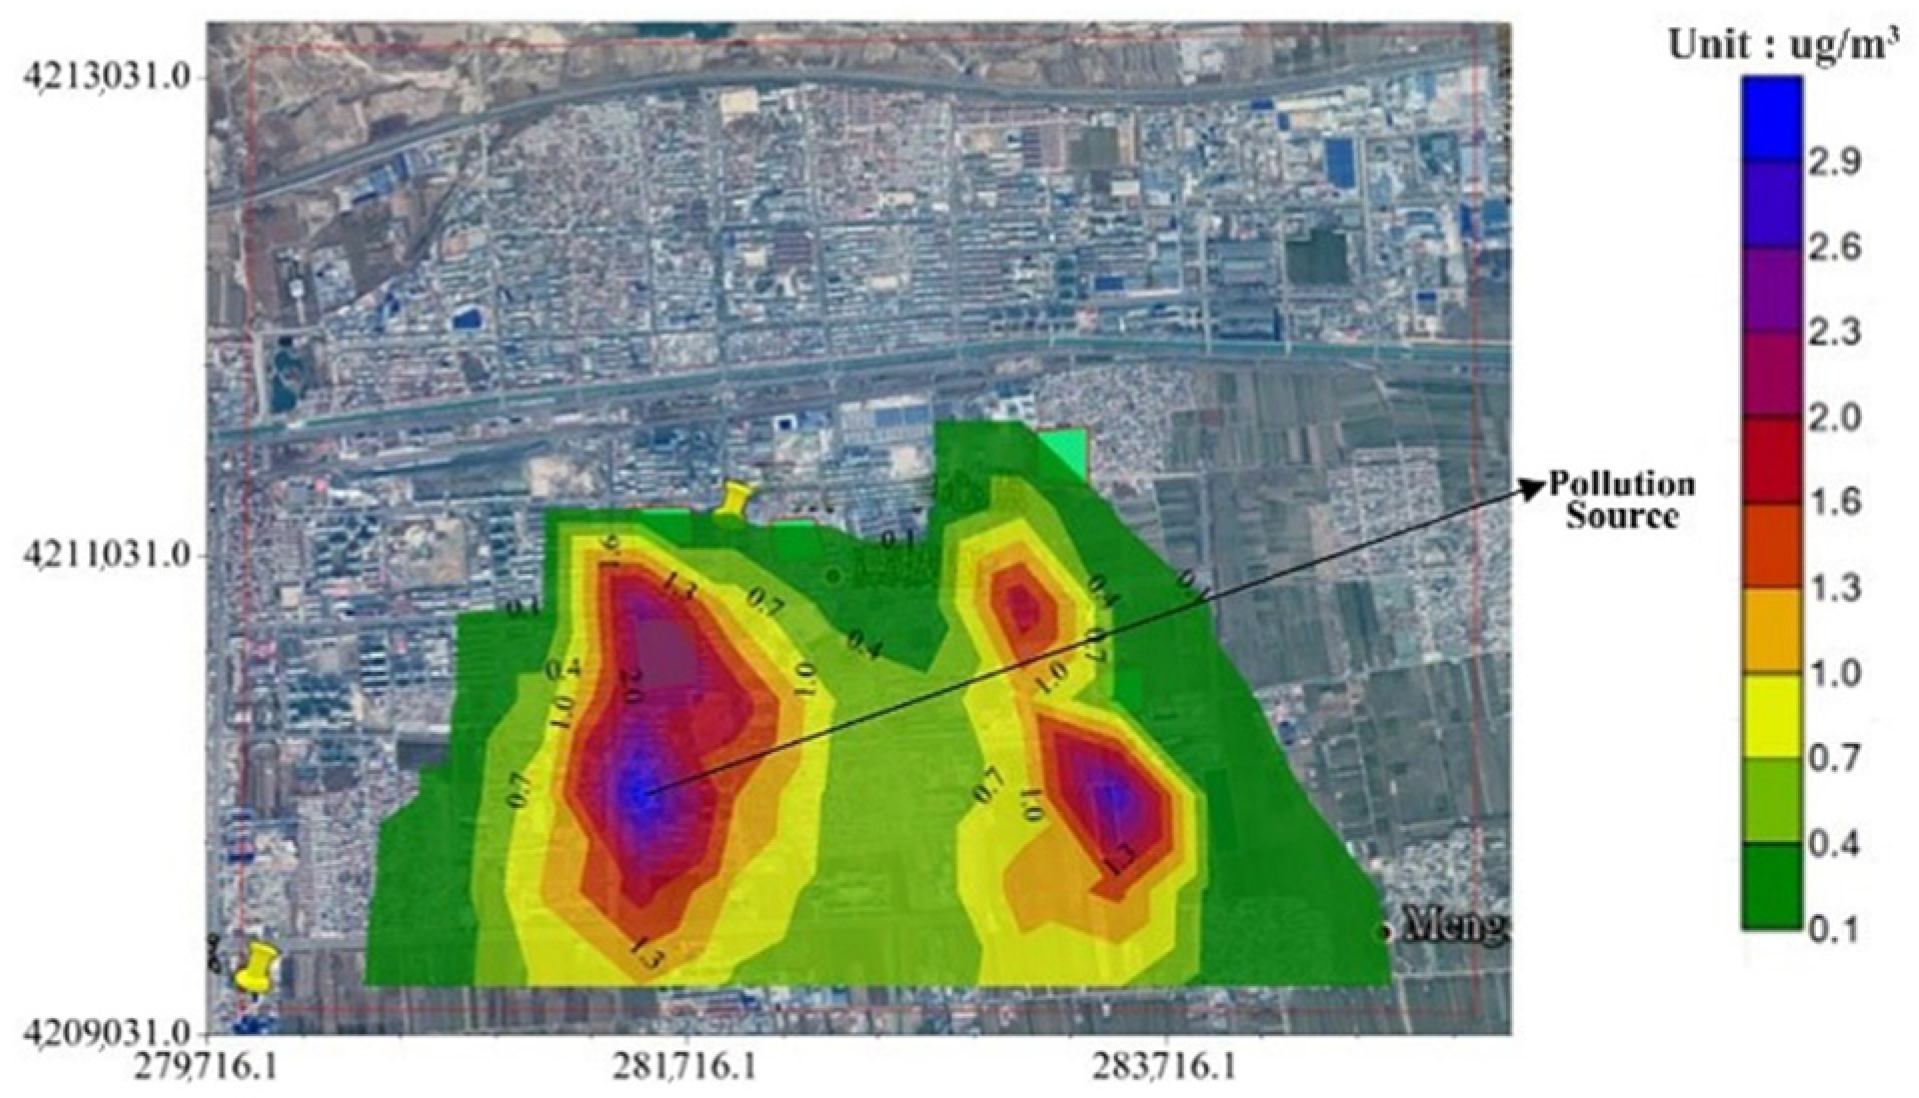
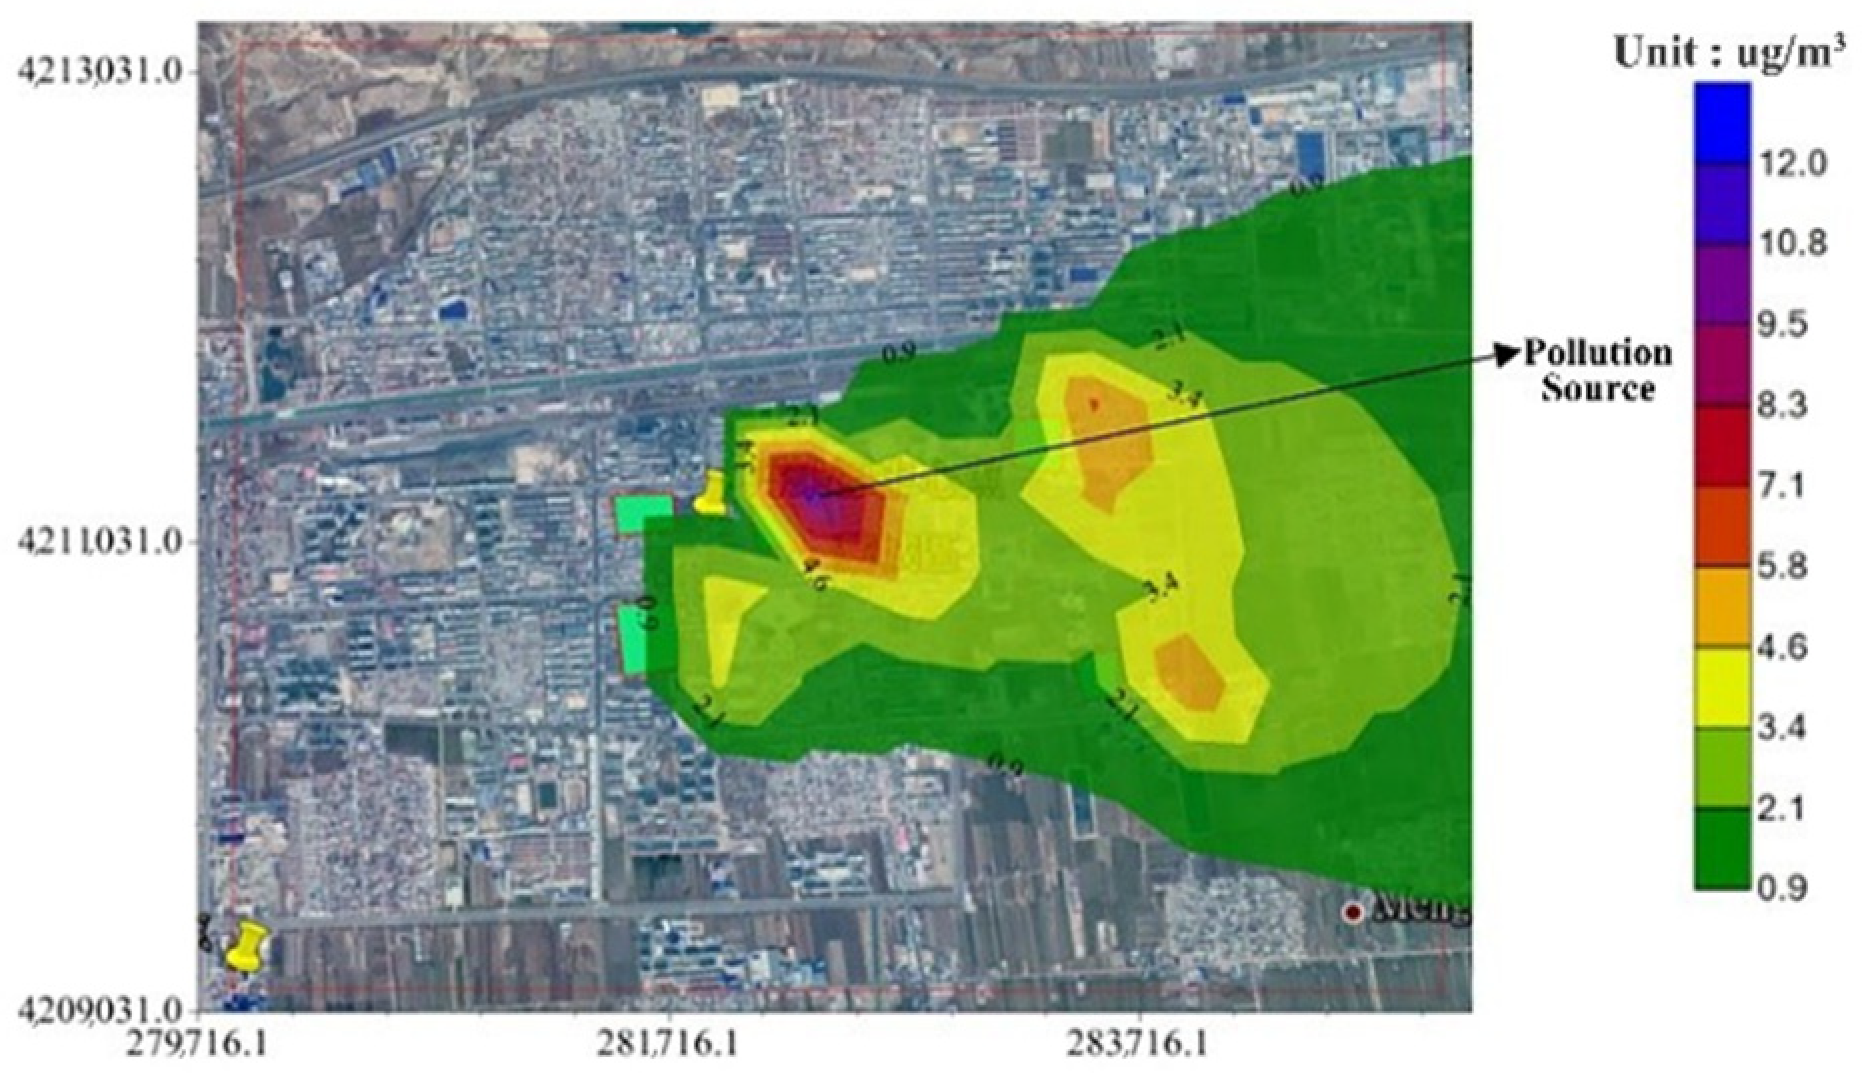
3.1. CALPUFF Model Prediction Results

Using the CALPUFF model to predict the concentration of three pollutants, the diffusion diagram of the three pollutants is as follows (Figure 1, Figure 2 and Figure 3):
The simulation result of the CALPUFF model was the diffusion of a single pollutant, not a combination of three pollutants into a diffusion result. In addition, the emission rate of pollutants would also affect the simulation results of the model. According to Figure 1, Figure 2 and Figure 3 and Table 5, the average maximum diffusion concentration of benzene in 24 h was 0.9µg/m3, the average minimum diffusion concentration was 0.3 µg/m3, and the average diffusion concentration was 0.6 µg/m3. The average maximum diffusion concentration of toluene in 24 h was 12 µg/m3, the average minimum diffusion concentration was 0.9 µg/m3, and the average diffusion concentration was 6.45 µg/m3. The average maximum diffusion concentration of xylene in 24 h was 2.9 µg/m3, the average minimum diffusion concentration was 0.1 µg/m3, and the average diffusion concentration was 1.5 µg/m3.

3.2. Risk Characterization

According to the formulas of carcinogenic risk (1) (2) and non-carcinogenic risk (3), Table 6 was obtained. For the characterization of carcinogenic risk, the Risk of benzene is between 1.98 × 10⁻⁶ to 6.6 × 10⁻⁷. Therefore, we can see that when benzene is the minimum concentration value predicted by the model, it will not cause cancer risk to humans. However, when benzene is the maximum concentration value predicted by the model, it poses a risk of cancer in humans. The assessment of the carcinogenic risk of toluene and xylene to humans was not conducted due to insufficient information. For non-carcinogenic risk characterization, the HQ of benzene, toluene, and xylene is significantly less than 1. Therefore, the concentration of benzene, toluene, and xylene released by the factory is unlikely to cause a “non-carcinogenic risk” to humans, so there is no need to think about it. According to the research results, it is recommended that the company improve the air environment of the factory and provide regular physical examinations to workers.

4. Conclusions

In order to better manage the risk of toxic and hazardous air pollutants in the Beijing-Tianjin-Hebei region of China, this study selected a petrochemical company in Dagang District of Tianjin, clarified the company’s toxic and hazardous air pollutant emissions, and obtained a pollutant emission list. The analysis of monitoring data showed that benzene, toluene, and xylene were the main components that constituted the toxic and harmful pollutants of this petrochemical enterprise. The sum of the content of these three indicators accounted for 50% to 90% of the total VOC. Using the CALPUFF model to simulate the environmental concentration of toxic and harmful air pollutants, it was concluded that the 24-h average diffusion concentration of benzene was between 0.9 µg/m3 and 0.3 µg/m3. The 24-h average diffusion concentration of toluene was between 12 µg/m3 and 0.9 µg/m3. The 24-h average diffusion concentration of xylene was between 2.9 µg/m3 and 0.1 µg/m3. This study evaluated the human health risk of the pollutants discharged by this petrochemical enterprise from both carcinogenic and non-carcinogenic aspects. According to the results of carcinogenic and non-carcinogenic calculations, it can be seen that benzene has the risk of causing cancer to humans in the range of the largest concentration predicted by the model. The results of this study can be used as an example of the petrochemical industry in the Beijing-Tianjin-Hebei region, enabling China’s petrochemical industry to better understand the discharge characteristics of pollutants in the petrochemical industry in the Beijing-Tianjin-Hebei region. Although the results of this study cannot represent the overall level of health risks for workers in Sinopec companies, this study can be used as a case for the health risk assessment of workers in petrochemical companies in the region.

Supplementary Materials

The following are available online at www.mdpi.com/article/10.3390/atmos12121604/s1, Figure S1: Distribution of VOCs emission concentration, Figure S2: Distribution of benzene emission concentration, Figure S3: Concentration distribution of toluene emission, Figure S4: Distribution of xylene emission concentration, Figure S5: Distribution of VOCs emission rate, Figure S6: Distribution of benzene emission rate, Figure S7: Distribution of toluene emission rate, Figure S8: Xylene emission rate distribution, Figure S9: Stationary pollution source discharge point, Table S1: The total amount of organized emissions of fixed sources of VOC and the test results of major pollutants, Table S2: Statistics of the maximum emission concentration of benzene, toluene and xylene, Table S3: Statistics of maximum emission intensity of benzene, toluene and xylene.

Author Contributions

Conceptualization, T.Z. and F.L.; methodology, F.L. and W.N.; software, F.L. and W.N.; writing—original draft, F.L.; writing—review and editing, T.Z., F.L., Z.G., Y.H. and X.Z. All authors have read and agreed to the published version of the manuscript.

Funding

This work was supported by the Open Project Program of State Key Laboratory of Petroleum Pollution Control (Grant No. PPC2019013), CNPC Research Institute of Safety and Environmental Technology, and the Major Science and Technology Projects of Shanxi Province (20181102017), and the Shanxi Province Unveiled the List of Bidding Projects (20191101007) and the Fundamental Research Funds for the Central Universities (2021YJSHH14).

Institutional Review Board Statement

Not applicable.

Informed Consent Statement

Not applicable.

Data Availability Statement

The datasets supporting the conclusions of this article are included within the article and its additional file.

Conflicts of Interest

The authors declare no conflict of interest.

References

  1. Bilsback, K.R.; Dahlke, J.; Fedak, K.M.; Good, N.; Hecobian, A.; Herckes, P.; L’Orange, C.; Mehaffy, J.; Sullivan, A.; Tryner, J.; et al. A laboratory assessment of 120 air pollutant emissions from biomass and fossil fuel cookstoves. Environ. Sci. Technol. 2019, 53, 7114–7125. [Google Scholar] [CrossRef]
  2. Woodruff, T.J.; Caldwell, J.; Cogliano, V.J.; Cogliano, V.J.; Axelrad, D.A. Estimating cancer risk from outdoor concentrations of hazardous air pollutants in 1990. Environ. Res. 2000, 82, 194–206. [Google Scholar] [CrossRef]
  3. Baek, K.M.; Kim, M.J.; Kim, J.Y.; Seo, Y.K.; Baek, S.O. Characterization and health impact assessment of hazardous air pollutants in residential areas near a large iron-steel industrial complex in Korea. Atmos. Pollut. Res. 2020, 11, 1754–1766. [Google Scholar] [CrossRef]
  4. Anderson, C.M.; Kissel, K.A.; Field, C.B.; Anderson, C.M.; Kissel, K.A.; Field, C.B.; Mach, K.J. Climate change mitigation, air pollution, and environmental justice in California. Environ. Sci. Technol. 2018, 52, 10829–10838. [Google Scholar] [CrossRef] [PubMed]
  5. Wu, C.F.; Wu, S.Y.; Wu, Y.H.; Cullen, A.C.; Larson, T.V.; Williamson, J.; SallyLiu, L.J. Spatial–temporal and cancer risk assessment of selected hazardous air pollutants in Seattle. Environ. Int. 2011, 37, 11–17. [Google Scholar] [CrossRef]
  6. Windham, G.C.; Zhang, L.; Gunier, R.; Croen, L.A.; Grether, J.K. Autism spectrum disorders in relation to distribution of hazardous air pollutants in the San Francisco Bay area. Environ. Health Perspect. 2006, 114, 1438–1444. [Google Scholar] [CrossRef] [PubMed] [Green Version]
  7. Henderson, D.E.; Milford, J.B.; Miller, S.L. Prescribed burns and wildfires in Colorado: Impacts of mitigation measures on indoor air particulate matter. J. Air Waste Manag. Assoc. 2005, 55, 1516–1526. [Google Scholar] [CrossRef] [PubMed]
  8. Miller, S.L.; Scaramella, P.; Campe, J.; Goss, C.W.; Castillo, S.D.; Hendrikson, E.; DiGuiseppi, C.; Litt, J. An assessment of indoor air quality in recent Mexican immigrant housing in Commerce City, Colorado. Atmos. Environ. 2009, 43, 5661–5667. [Google Scholar] [CrossRef]
  9. Huang, Y.; Su, T.; Wang, L.; Wang, N.; Xue, Y.; Dai, W.; Lee, S.C.; Cao, J.; Ho, S.S.H. Evaluation and characterization of volatile air toxics indoors in a heavy polluted city of northwestern China in wintertime. Sci. Total Environ. 2019, 662, 470–480. [Google Scholar] [CrossRef] [PubMed]
  10. Liu, H.; Wu, B.; Liu, S.; Shao, P.; Liu, X.; Zhu, C.; Wang, Y.; Wu, Y.; Xue, Y.; Gao, J.; et al. A regional high-resolution emission inventory of primary air pollutants in 2012 for Beijing and the surrounding five provinces of North China. Atmos. Environ. 2018, 181, 20–33. [Google Scholar] [CrossRef]
  11. Lyu, X.; Guo, H.; Wang, Y.; Zhang, F.; Nie, K.; Dang, J.; Liang, Z.; Dong, S.; Zeren, Y.; Zhou, B.; et al. Hazardous volatile organic compounds in ambient air of China. Chemosphere 2020, 246, 125731. [Google Scholar] [CrossRef]
  12. Hong, S.H.; Shin, D.C.; Lee, Y.J.; Kim, S.H.; Lim, Y.W. Health risk assessment of volatile organic compounds in urban areas. Hum. Ecol. Risk Assess. 2017, 23, 1454–1465. [Google Scholar] [CrossRef]
  13. Burzoni, S.; Duquenne, P.; Mater, G.; Ferrari, L. Workplace Biological Risk Assessment: Review of Existing and Description of a Comprehensive Approach. Atmosphere 2020, 11, 741. [Google Scholar] [CrossRef]
  14. Buchanan, R.L.; Smith, J.L.; Long, W. Microbial risk assessment: Dose-response relations and risk characterization. Int. J. Food Microbiol. 2000, 58, 159–172. [Google Scholar] [CrossRef]
  15. Ferguson, A.; Penney, R.; Solo-Gabriele, H. A review of the field on children’s exposure to environmental contaminants: A risk assessment approach. Int. J. Environ. Res. Public Health 2017, 14, 265. [Google Scholar] [CrossRef] [PubMed]
  16. DeRosa, S.E.; Allen, D.T. Impact of New Manufacturing Technologies on the Petrochemical Industry in the United States: A Methane-to-Aromatics Case Study. Ind. Eng. Chem. Res. 2016, 55, 5366–5372. [Google Scholar] [CrossRef] [Green Version]
  17. Garcia-Gonzales, D.A.; Shonkoff, S.B.C.; Hays, J.; Jerrett, M. Hazardous air pollutants associated with upstream oil and natural gas development: A critical synthesis of current peer-reviewed literature. Annu. Rev. Publ. Health 2019, 40, 283–304. [Google Scholar] [CrossRef] [Green Version]
  18. Sun, D.; Shao, S.; Zhang, Y.; Yang, Q.; Hou, H.; Quan, X. Integrated analysis of the water–energy–environmental pollutant nexus in the petrochemical industry. Environ. Sci. Technol. 2020, 54, 14830–14842. [Google Scholar] [CrossRef]
  19. Chen, Y.; Shen, G.; Huang, Y.; Zhang, Y.; Han, Y.; Wang, R.; Shen, H.; Su, S.; Lin, N.; Zhu, D.; et al. Household air pollution and personal exposure risk of polycyclic aromatic hydrocarbons among rural residents in Shanxi, China. Indoor Air 2016, 26, 246–258. [Google Scholar] [CrossRef] [PubMed]
  20. Liu, Y.; Tao, S.; Yang, Y.; Dou, H.; Yang, Y.; Coveney, R.M. Inhalation exposure of traffic police officers to polycyclic aromatic hydrocarbons (PAHs) during the winter in Beijing, China. Sci. Total Environ. 2007, 383, 98–105. [Google Scholar] [CrossRef]
  21. Cao, Z.; Zhao, L.; Zhang, Y.; Ren, M.; Zhang, Y.; Liu, X.; Jie, J.; Wang, Z.; Li, C.; Shen, M.; et al. Influence of air pollution on inhalation and dermal exposure of human to organophosphate flame retardants: A case study during a prolonged haze episode. Environ. Sci. Technol. 2019, 53, 3880–3887. [Google Scholar] [CrossRef] [PubMed]
  22. Zhang, Z.; Yan, X.; Gao, F.; Thai, P.; Wang, H.; Chen, D.; Zhou, L.; Gong, D.; Li, Q.; Morawska, L.; et al. Emission and health risk assessment of volatile organic compounds in various processes of a petroleum refinery in the Pearl River Delta, China. Environ. Pollut. 2018, 238, 452–461. [Google Scholar] [CrossRef] [PubMed] [Green Version]
  23. Tong, R.; Yang, Y.; Shao, G.; Zhang, Y.; Dou, S.; Jiang, W. Emission sources and probabilistic health risk of volatile organic compounds emitted from production areas in a petrochemical refinery in Hainan, China. Hum. Ecol. Risk Assess. Int. J. 2019, 1407–1427. [Google Scholar] [CrossRef]
  24. Lv, D.; Lu, S.; Tan, X.; Shao, M.; Xie, S.; Wang, L. Source profiles, emission factors and associated contributions to secondary pollution of volatile organic compounds (VOCs) emitted from a local petroleum refinery in Shandong. Environ. Pollut. 2021, 274, 116589. [Google Scholar] [CrossRef]
  25. Wei, W.; Cheng, S.; Li, G.; Wang, G.; Wang, H. Characteristics of volatile organic compounds (VOCs) emitted from a petroleum refinery in Beijing, China. Atmos. Environ. 2014, 89, 358–366. [Google Scholar] [CrossRef]
  26. Lv, D.; Lu, S.; He, S.; Song, M.; Xie, S.; Gong, Y. Research on accounting and detection of volatile organic compounds from a typical petroleum refinery in Hebei, North China. Chemosphere 2021, 281, 130653. [Google Scholar] [CrossRef] [PubMed]
  27. Smith, C.J.; Perfetti, T.A. An approximated one-quarter of IARC Group 3 (unclassifiable) chemicals fit more appropriately into IARC Group 4 (probably not carcinogenic). Toxicol. Res. Appl. 2019, 3, 2397847319840645. [Google Scholar] [CrossRef]
  28. Dai, H.; Jing, S.; Wang, H.; Ma, Y.; Li, L.; Song, W. VOC characteristics and inhalation health risks in newly renovated residences in Shanghai, China. Sci. Total Environ. 2017, 577, 73–83. [Google Scholar] [CrossRef]
  29. Adami, G.; Larese, F.; Venier, M.; Barbiert, P.; Lo Coco, F.; Reisenhofer, E. Penetration of benzene, toluene and xylenes contained in gasolines through human abdominal skin in vitro. Toxicol. In Vitro 2006, 20, 1321–1330. [Google Scholar] [CrossRef]
Figure 1. 24 h pollutant diffusion diagram of benzene.
Atmosphere 12 01604 g001
Figure 2. 24 h pollutant diffusion diagram of toluene.
Atmosphere 12 01604 g002
Figure 3. 24 h pollutant diffusion diagram of xylene.
Atmosphere 12 01604 g003
Table 1. Organized emission of fixed pollution sources.
Pollution SourceNumberTest ItemsFrequency
Atmospheric heating furnace emission portAVOCsChoose March, June and September 2019 as the factory inspection time period. Measure 5 times at one location, and take the average value as the sampling data for that month.
Decompression heating furnace emission portB
Coking heating furnace emission portC
Emission outlet of hydrocracking furnaceD
Emission port of hydrogen production heating furnaceE
Gasoline hydrogenation heating furnace emission portF
Continuous reforming furnace emission portG
Gasoline and diesel hydrogenation heating furnace emission portH
Boiler exhaust gas outletI
Catalytic flue gas desulfurization emission portJ
Sulfur recovery unit tail gas emission portK
Note: March, June, and September are Tianjin quarterly representative months. And March, June, and September are factory stable production months. Therefore, we choose to monitor in March, June and September.
Table 2. Emission rate of VOC, benzene, toluene and xylene.
TypeMinMaxAverage
VOC emission rate (kg/h)0.0430.5800.270 ± 0.042
Benzene emission rate (kg/h)0.0220.1300.061 ± 0.015
Toluene emission rate (kg/h)0.0010.0350.014 ± 0.004
Xylene emission rate (kg/h)0.00530.2700.100 ± 0.038
Table 3. IARC classification of carcinogens.
TypeDefinitionClassification Standard
Class 1It is carcinogenic to humansThere is sufficient evidence to prove that it is carcinogenic to humans; There is strong evidence of human exposure, and at the same time it shows important carcinogen characteristics and sufficient evidence of carcinogenicity in laboratory animals.
Class 2AIt is very likely to cause cancerPerform at least the following two evaluations, including at least one evaluation involving the human body, human cells or tissues:
1. Limited evidence for human carcinogenicity;
2. There is sufficient evidence of carcinogenesis in laboratory animals;
3. There is strong evidence that it has the key characteristics of carcinogens.
Such substances or mixtures are more likely to cause cancer to humans. Sufficient evidence of carcinogenicity has been found in animal experiments. Although there is theoretical carcinogenicity to humans, experimental evidence is limited.
Class 2BIt may cause cancer to humansOne of the following evaluations exists in this category:
1. Limited evidence for human carcinogenicity;
2. There is sufficient evidence of carcinogenesis in laboratory animals;
3. There is strong evidence that it has key characteristics of carcinogens (whether exposed to humans or human cells)
Class 3Its carcinogenicity to humans cannot be classified yetFactors that do not fall into any of the above categories are usually placed in this category. When there is insufficient evidence of carcinogenicity in animal experiments and humans, it is usually placed in this category. When there is strong evidence that there is a carcinogenic mechanism in laboratory animals but it does not work in humans or the evidence in humans is insufficient, it is placed in this category.
Table 4. Parameters of carcinogenic and non carcinogenic risk assessment [29].
TypeBenzeneTolueneXylene
CASRN71-43-2108-88-31330-20-7
RfC (mg/m3)3 × 10−21 × 10−11 × 10−1
IUR (µg/m3)12.2 × 10−6Not evaluated according to the IRIS planNot evaluated according to the IRIS plan
SystemImmuneNerveNerve
Note: IUR is unit risk (µg/m3)−1. IUR is an estimated upper limit that exceeds the lifetime cancer risk when continuously exposed to a concentration of 1 µg in the air. RfC (mg/m3) is the reference concentration of continuous inhalation exposure for a specific VOC. They come from the USEPA Integrated Risk Information System (IRIS).
Table 5. Statistics of maximum and minimum concentrations of benzene, toluene and xylene.
TypeBenzeneTolueneXylene
Max (µg/m3)0.9122.9
Min (µg/m3)0.30.90.1
Table 6. Risk value of benzene, toluene and xylene.
RiskHQEC
TypeC6H6C7H8C8H10C6H6C7H8C8H10C6H6C7H8C8H10
Max1.98 × 10−6//3 × 10−20.122.9 × 10−20.9122.9
Min6.6 × 10−7//1 × 10−29 × 10−31 × 10−30.30.90.1
Mean1.32 × 10−6//2 × 10−26.45 × 10−21.5 × 10−20.66.51.5
Publisher’s Note: MDPI stays neutral with regard to jurisdictional claims in published maps and institutional affiliations.

