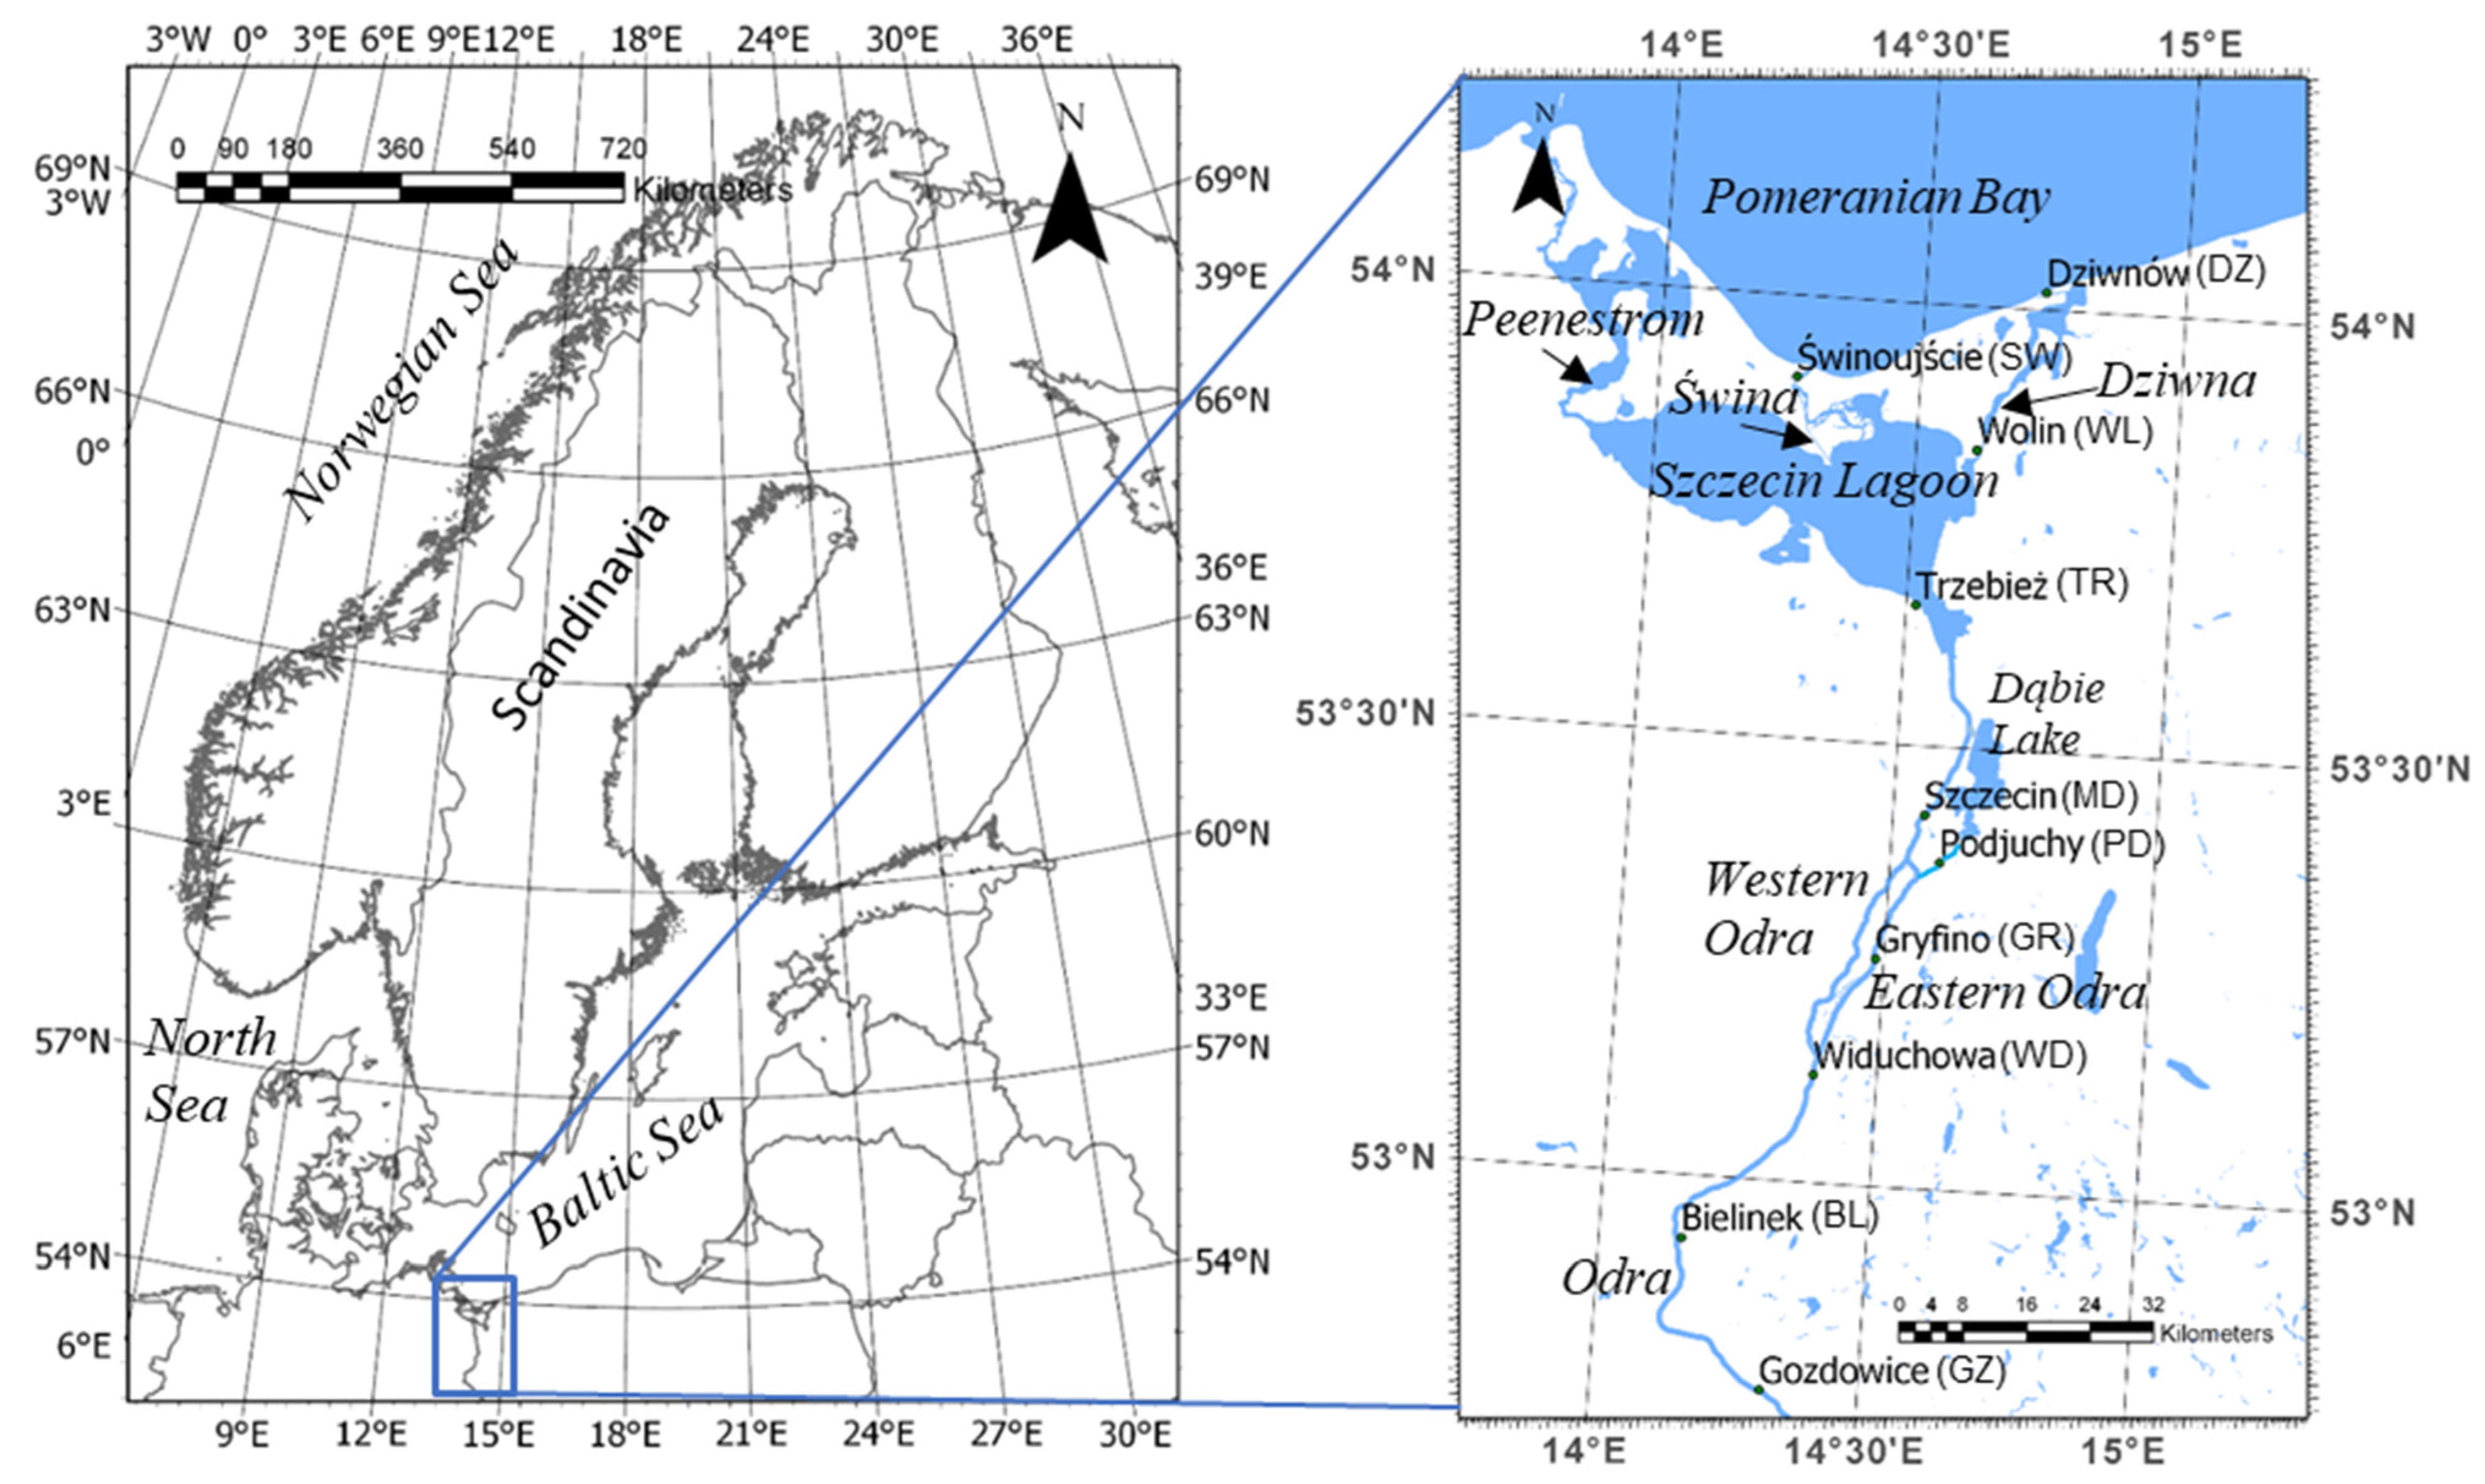
Figure 1.
The Odra River mouth area, with the location of water level stations.
Figure 1.
The Odra River mouth area, with the location of water level stations.
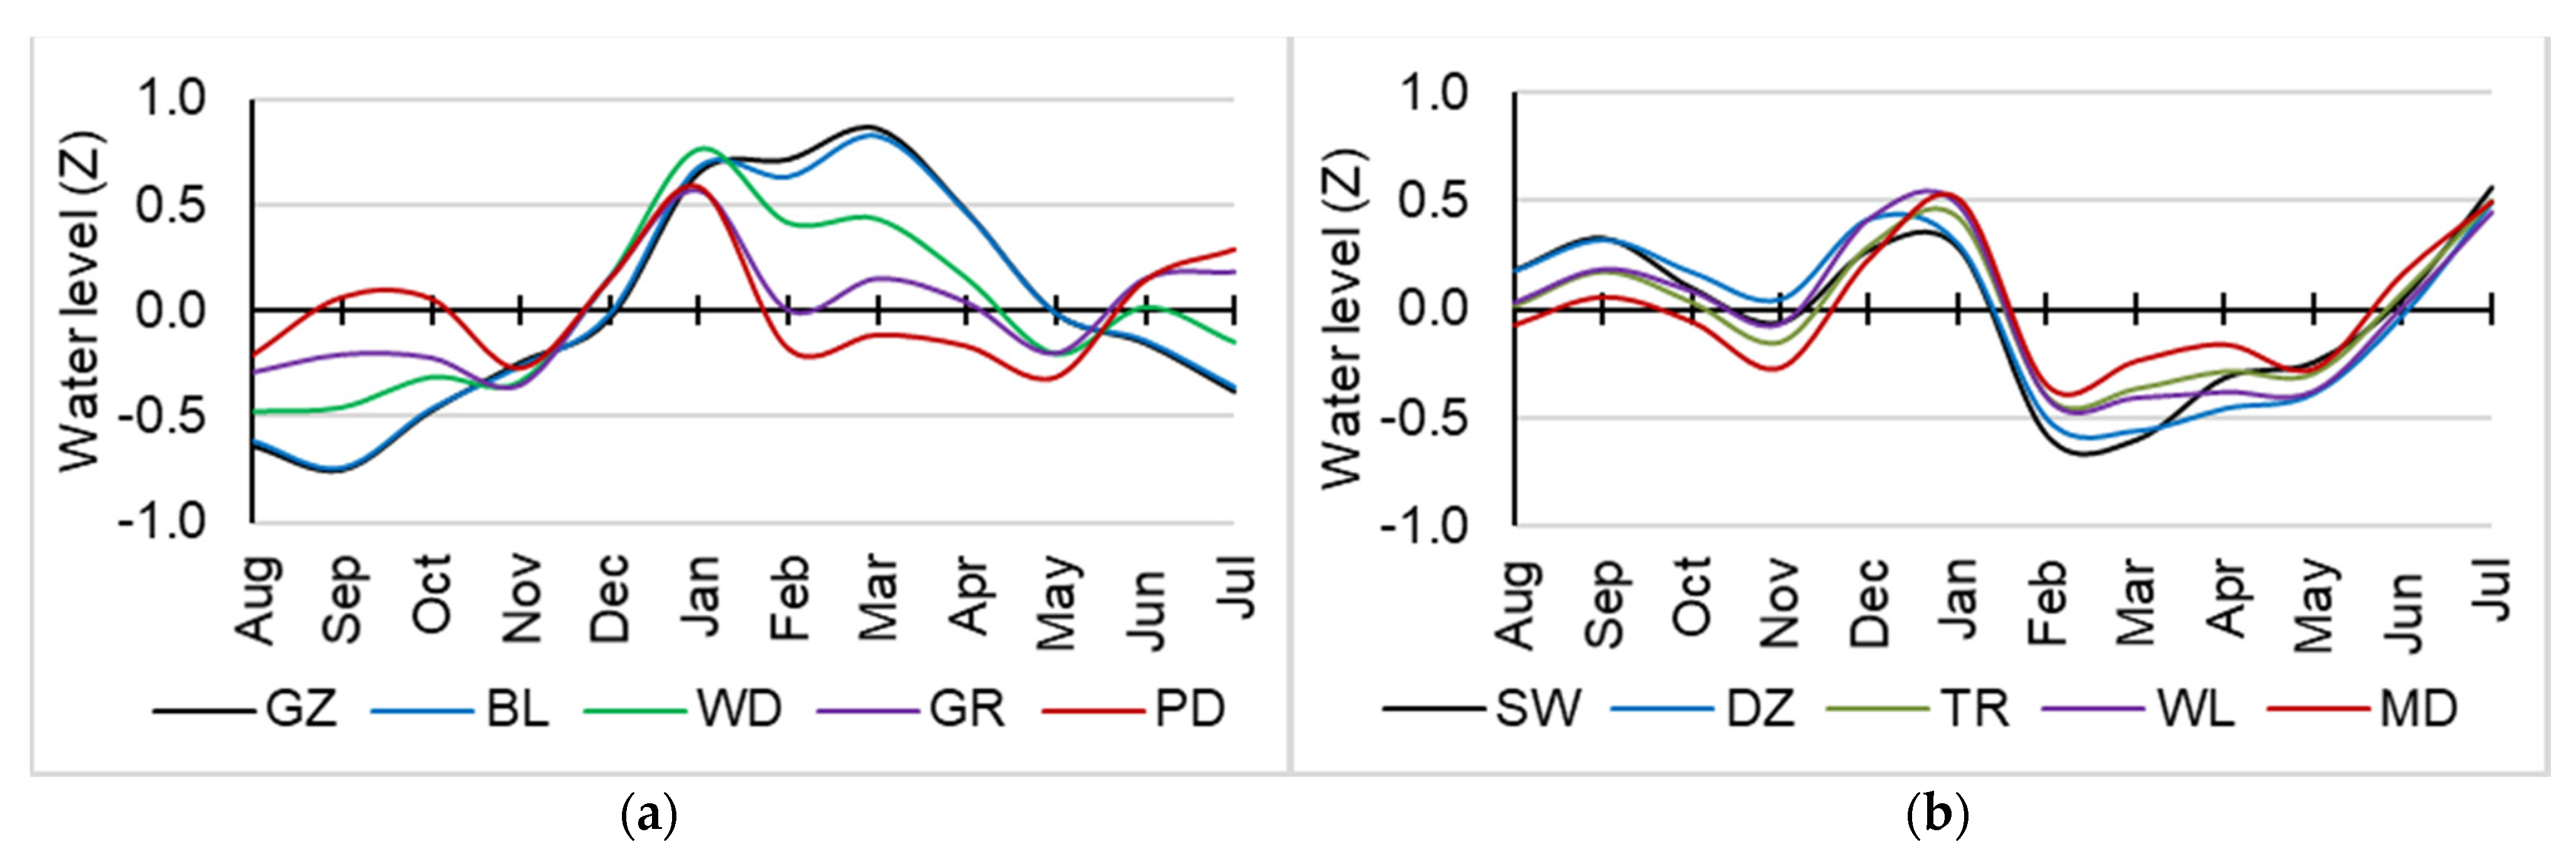
Figure 2.
Average monthly water levels at: (a) GZ, BL, WD, GR, and PD and (b) SW, DZ, TR, WL, and MD in years 2008/09−2019/20 (Z—standardized water level values).
Figure 2.
Average monthly water levels at: (a) GZ, BL, WD, GR, and PD and (b) SW, DZ, TR, WL, and MD in years 2008/09−2019/20 (Z—standardized water level values).
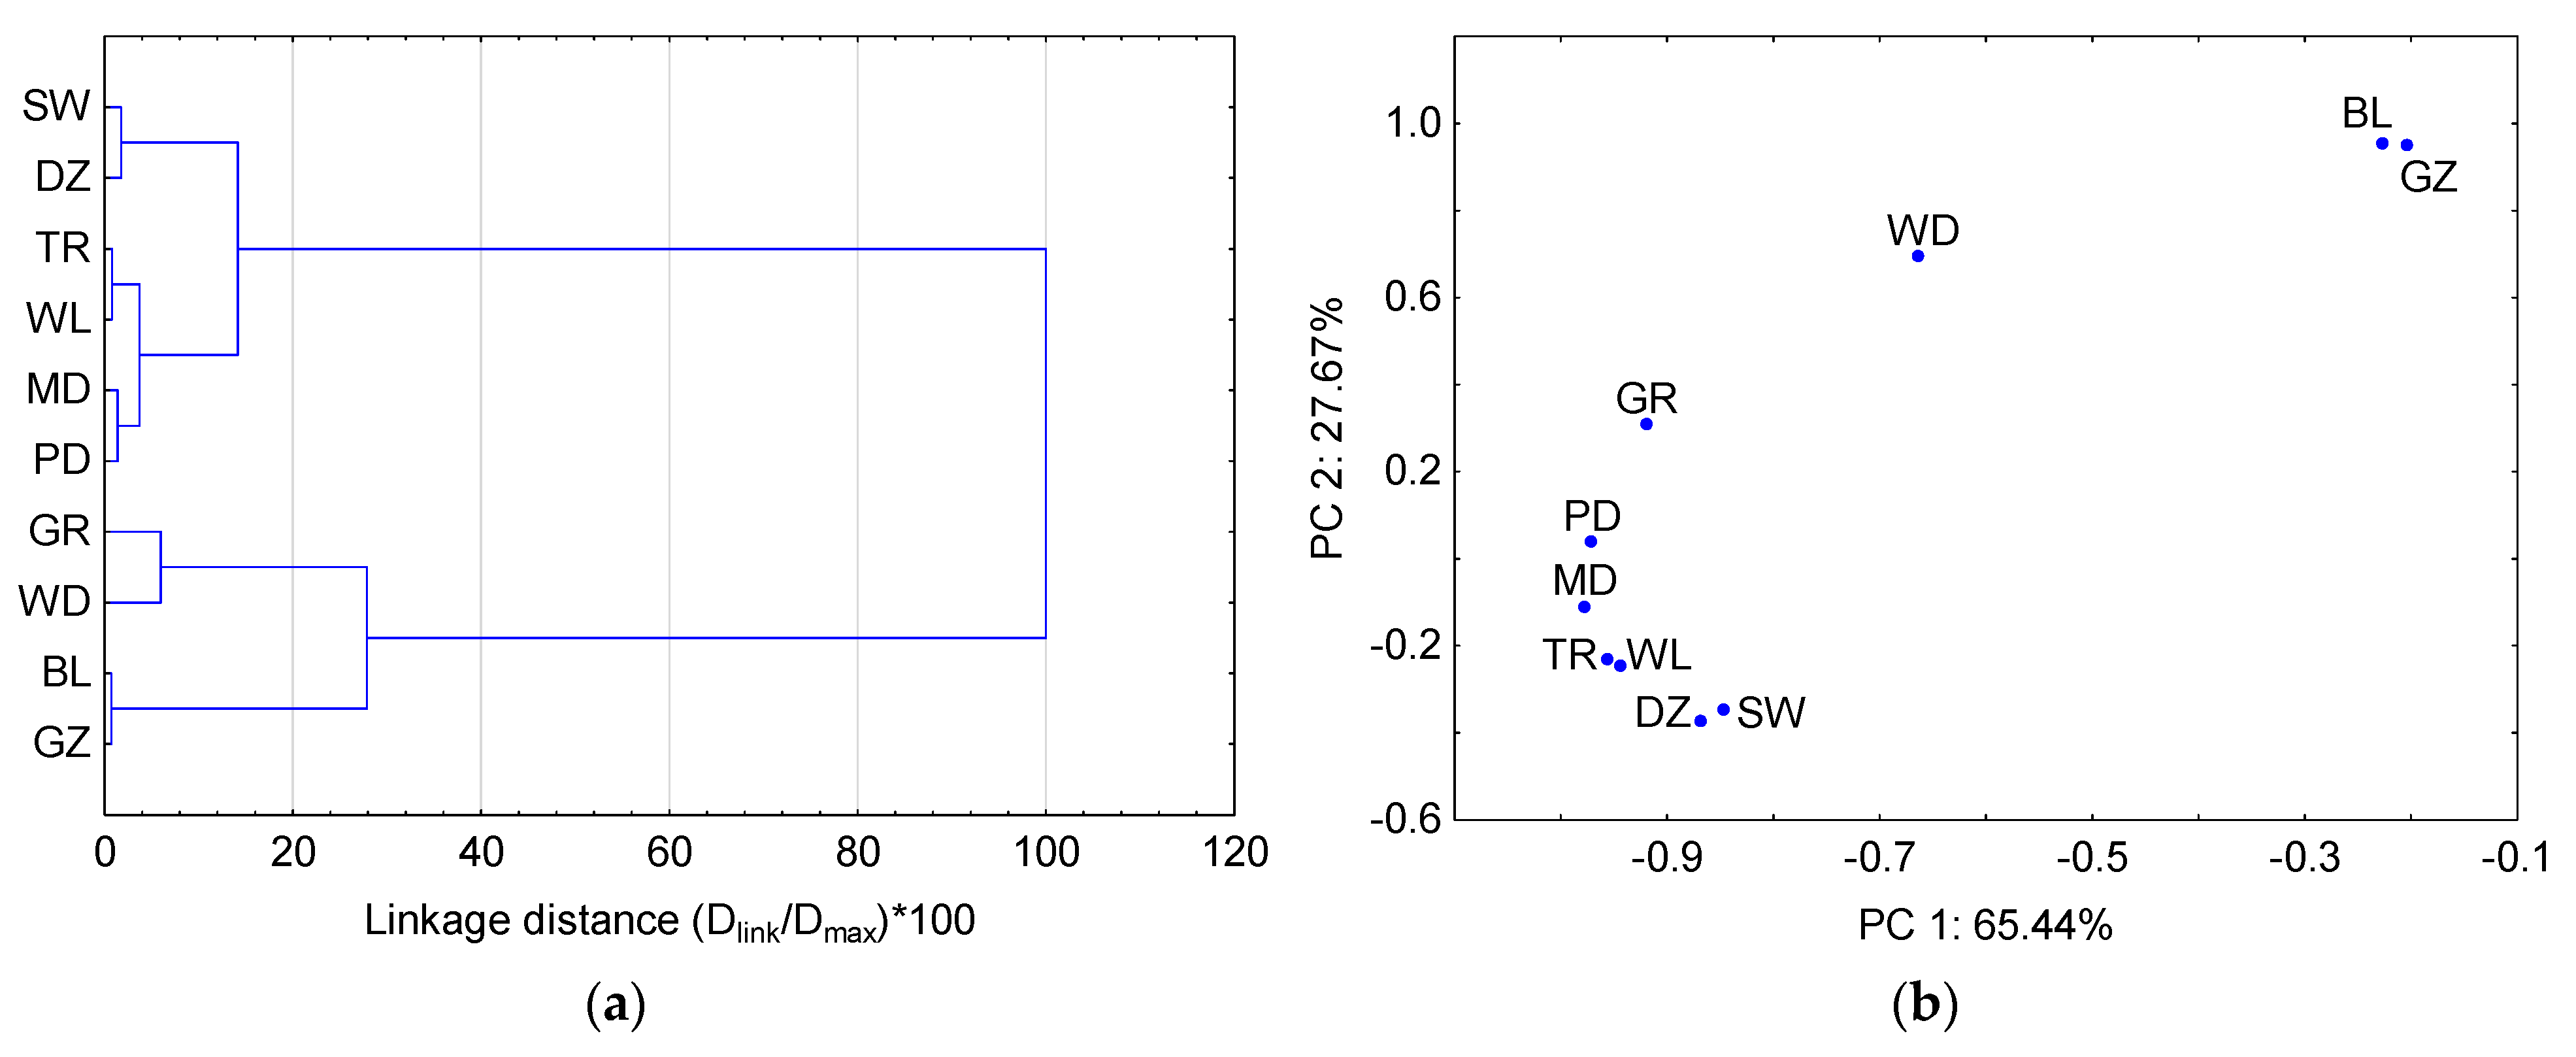
Figure 3.
Relationships between water levels in the Odra River mouth area in years 2008/2009–2019/2020: (a) dendrogram and (b) loading scatter plot for PC1 (principal component 1) versus PC2 (principal component 2), along with percentage of total variance explained by PC1 and PC2.
Figure 3.
Relationships between water levels in the Odra River mouth area in years 2008/2009–2019/2020: (a) dendrogram and (b) loading scatter plot for PC1 (principal component 1) versus PC2 (principal component 2), along with percentage of total variance explained by PC1 and PC2.
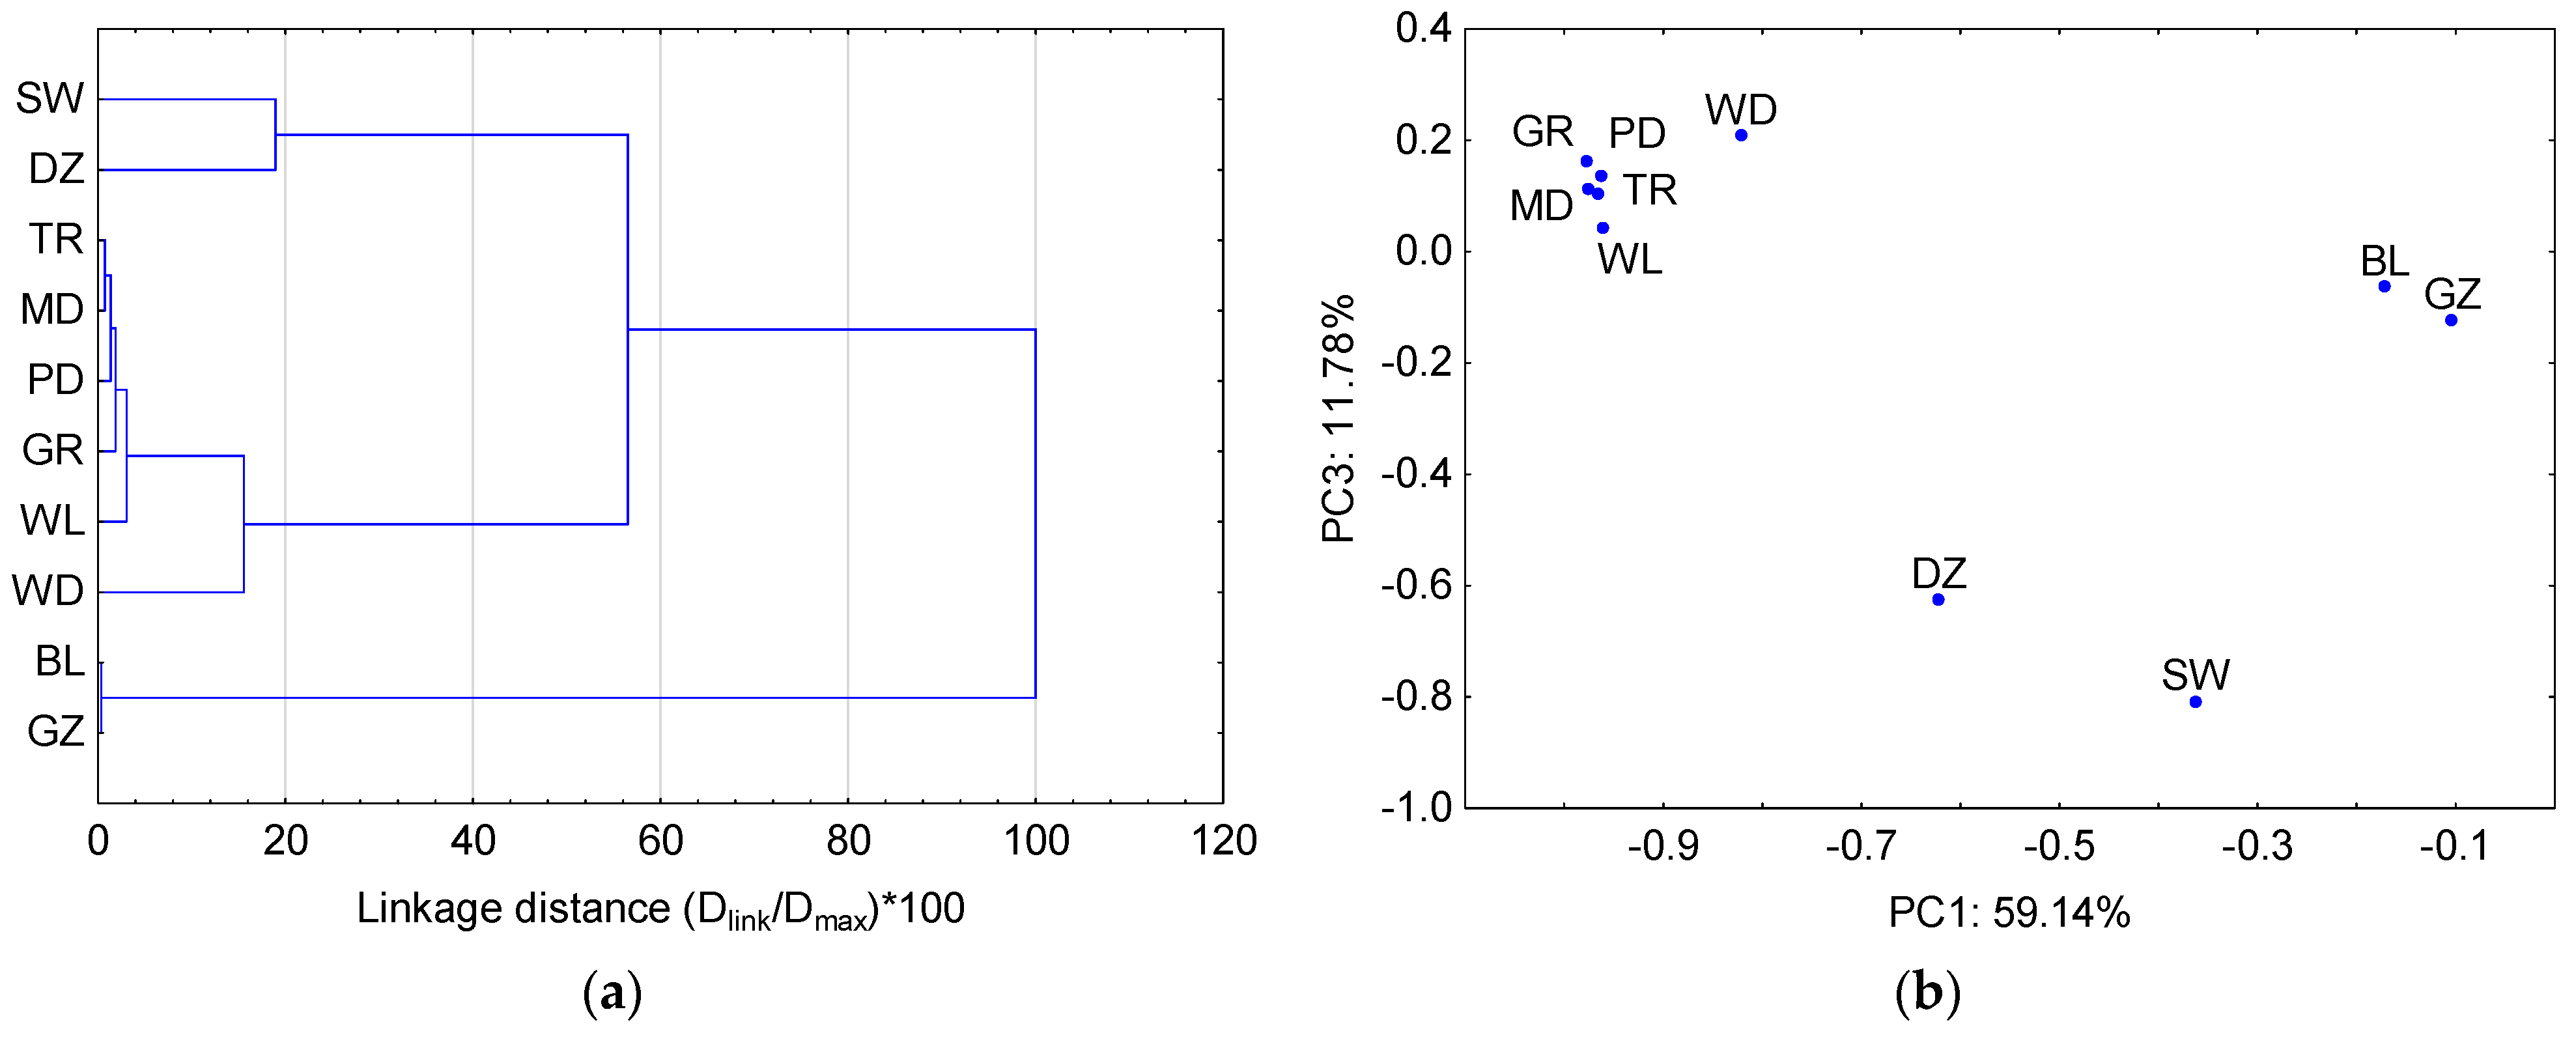
Figure 4.
Relationships between water levels in the Odra River mouth area during periods with exceeded alarm sea level at Świnoujście: (a) dendrogram and (b) loading scatter plot for PC1 (principal component 1) versus PC3 (principal component 3), along with a percentage of total variance explained by PC1 and PC3.
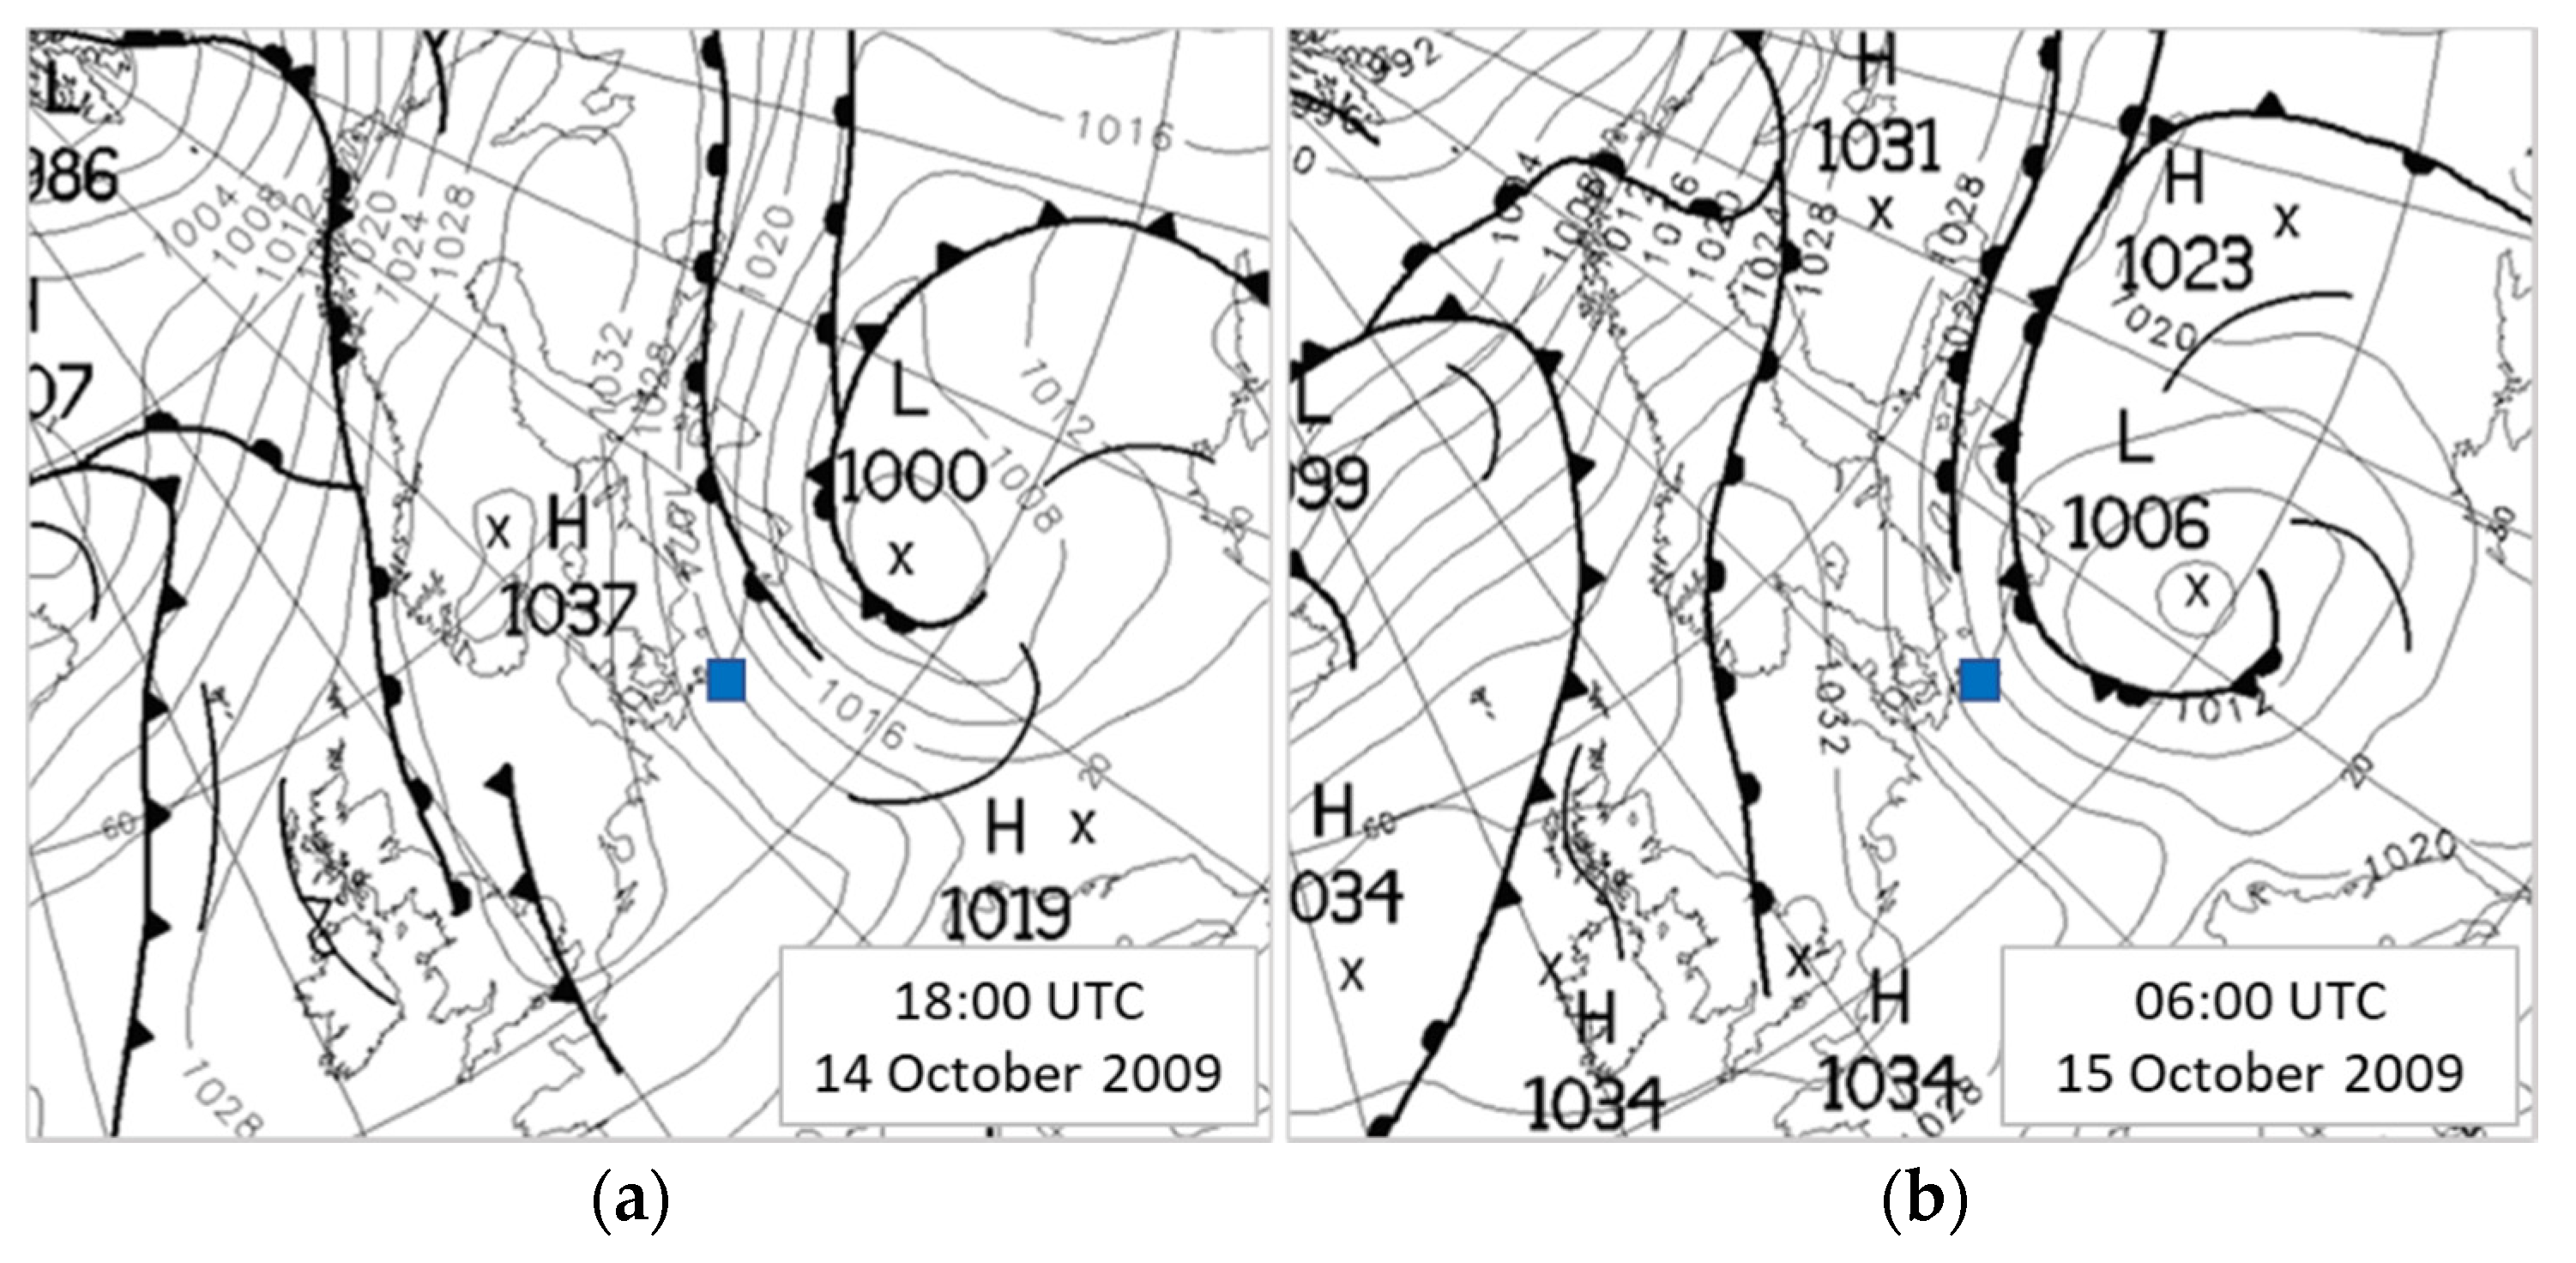
Figure 5.
Synoptic situation during the October 2009 storm surge on: (a) 14 October, 18:00 UTC; (b) 15 October, 6:00 UTC (published with permission, ©British Crown copyright 2009, the Met Office) (blue square: study area).
Figure 5.
Synoptic situation during the October 2009 storm surge on: (a) 14 October, 18:00 UTC; (b) 15 October, 6:00 UTC (published with permission, ©British Crown copyright 2009, the Met Office) (blue square: study area).
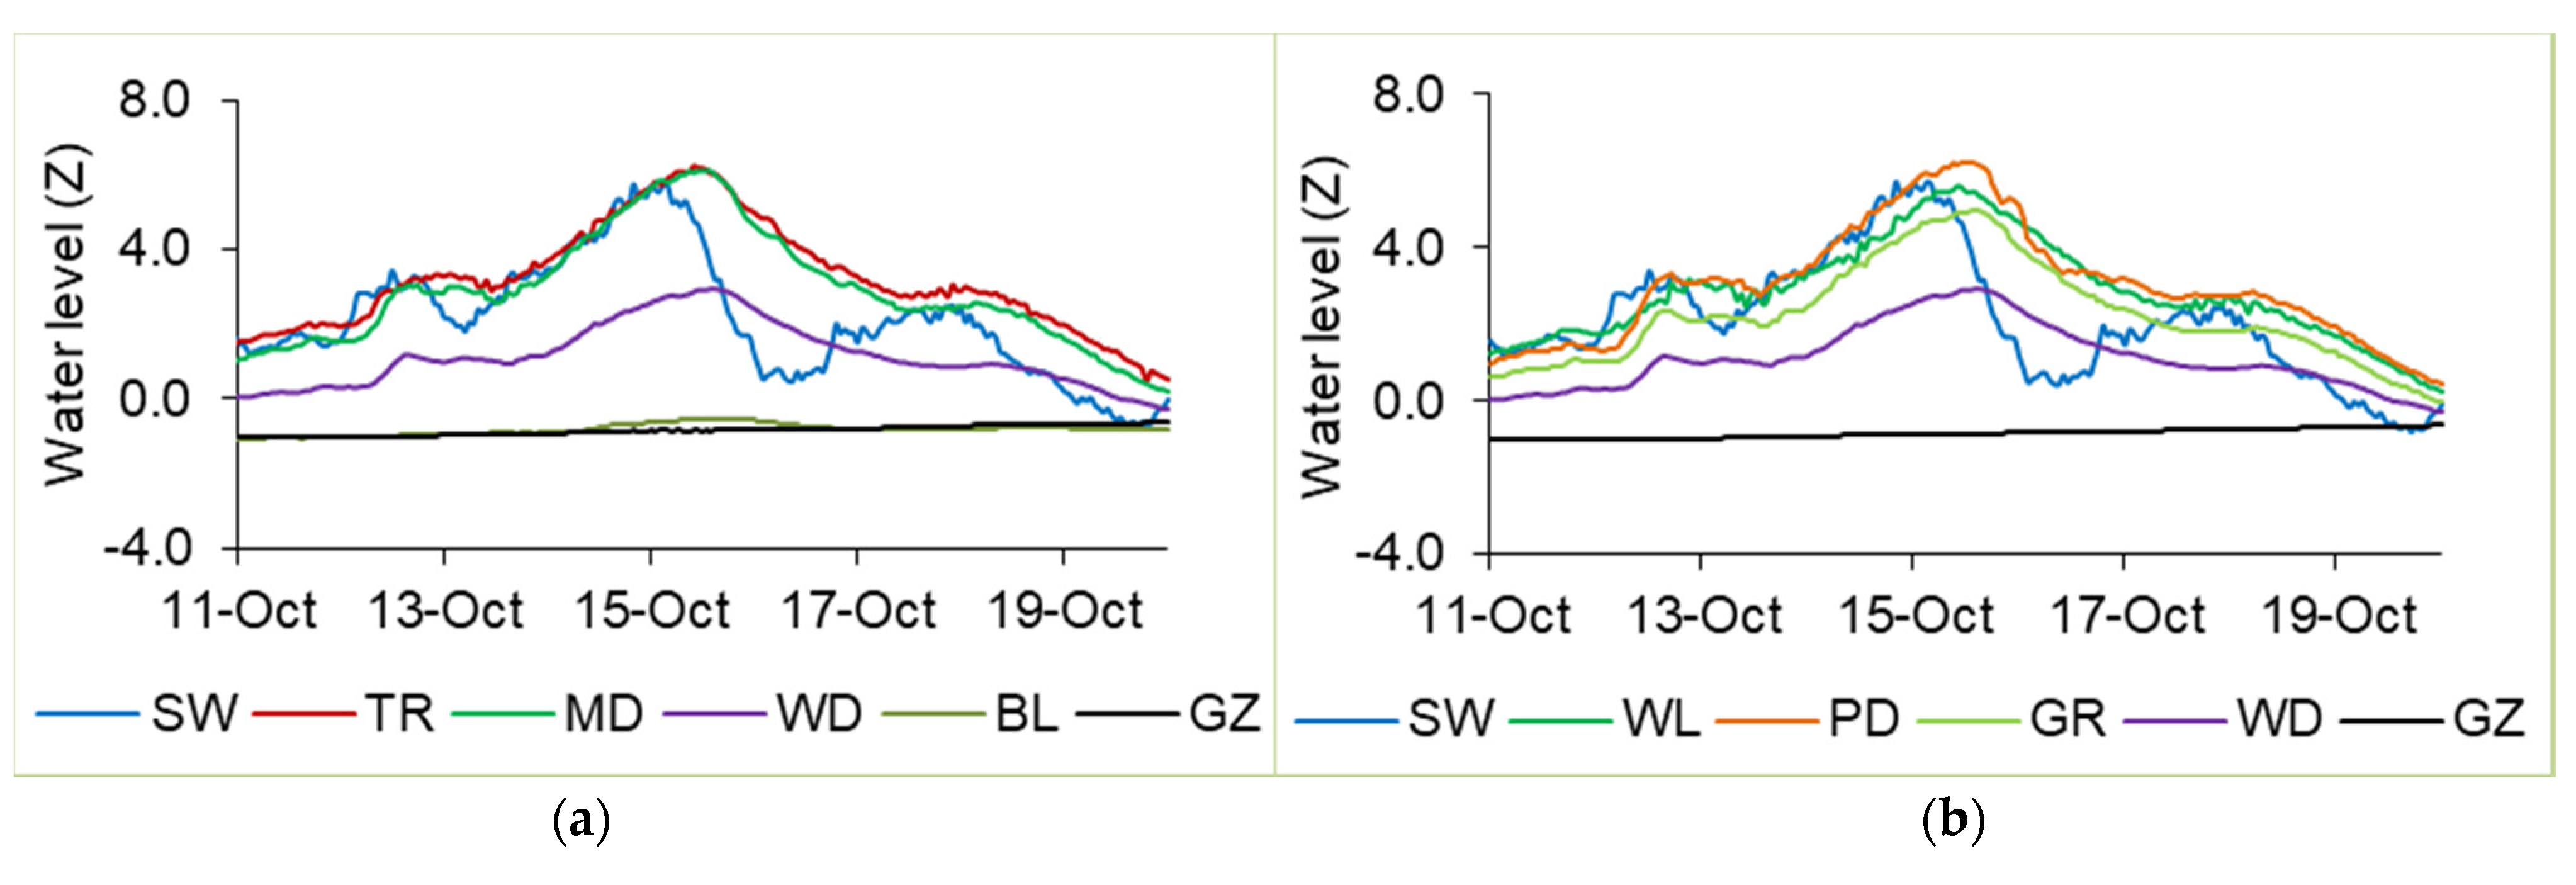
Figure 6.
Water level changes in the Odra River mouth area on 11–19 October 2009: (a) the western track, (b) the eastern track (water level readings were converted to standardized values—Z).
Figure 6.
Water level changes in the Odra River mouth area on 11–19 October 2009: (a) the western track, (b) the eastern track (water level readings were converted to standardized values—Z).
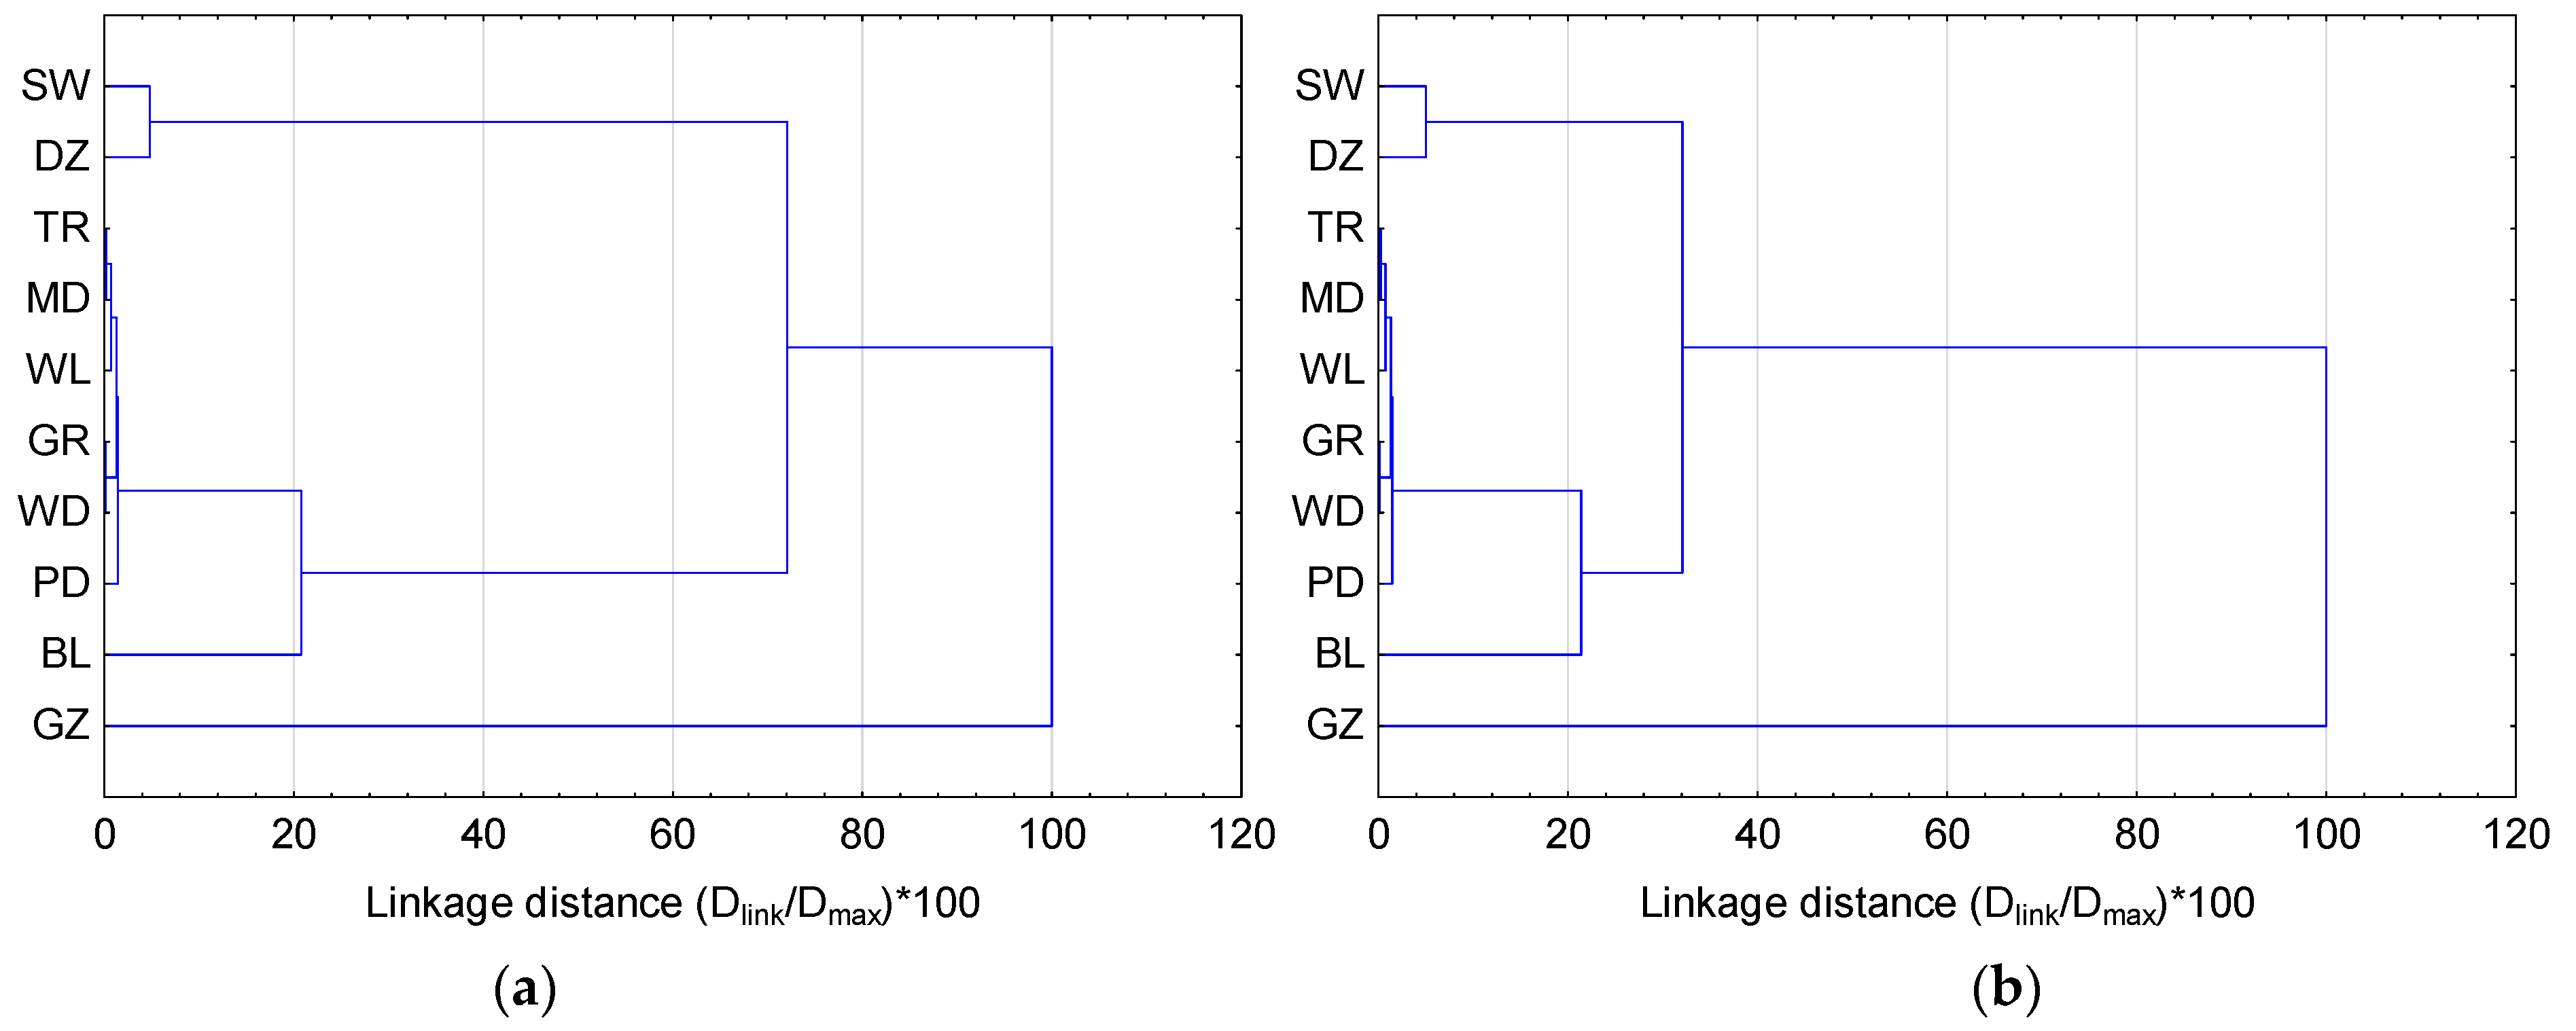
Figure 7.
Dendrograms of water levels in the Odra River mouth area during the October 2009 storm surge: (a) synchronous water level clustering (b) water level clustering with k = 10 h offset for SW series and k = 5 h offset for DZ series.
Figure 7.
Dendrograms of water levels in the Odra River mouth area during the October 2009 storm surge: (a) synchronous water level clustering (b) water level clustering with k = 10 h offset for SW series and k = 5 h offset for DZ series.
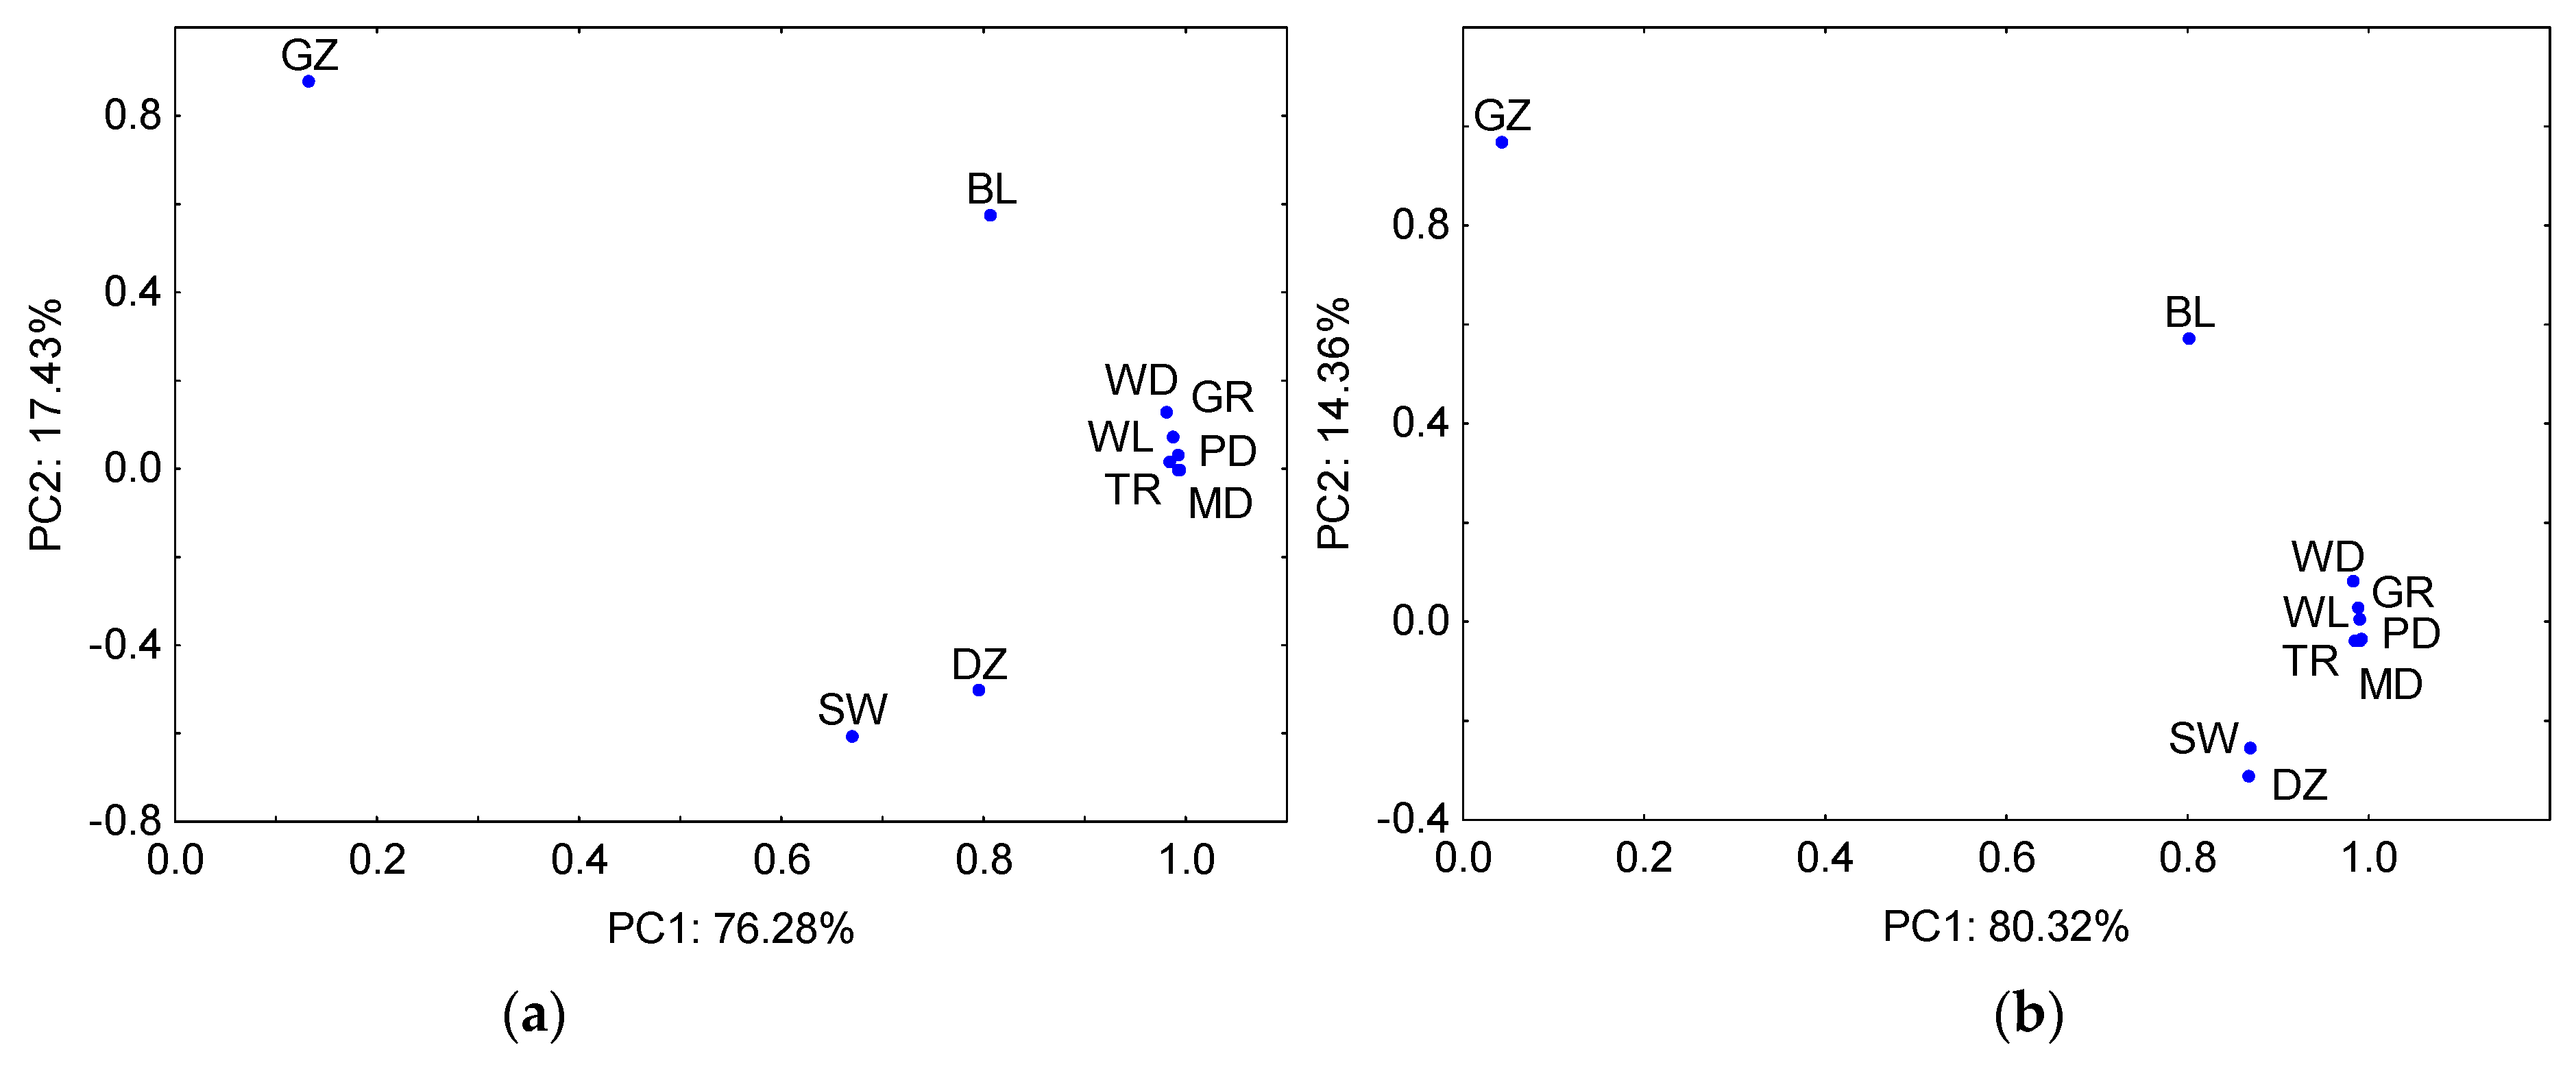
Figure 8.
Loading scatter plot (PC1 versus PC2) of water levels in the Odra River mouth area during the October 2009 storm surge, along with percentage of total variance explained by PC1 and PC2: (a) synchronous correlations (b) correlations incorporating k = 10 h offset for SW series and k = 5 h offset for DZ series.
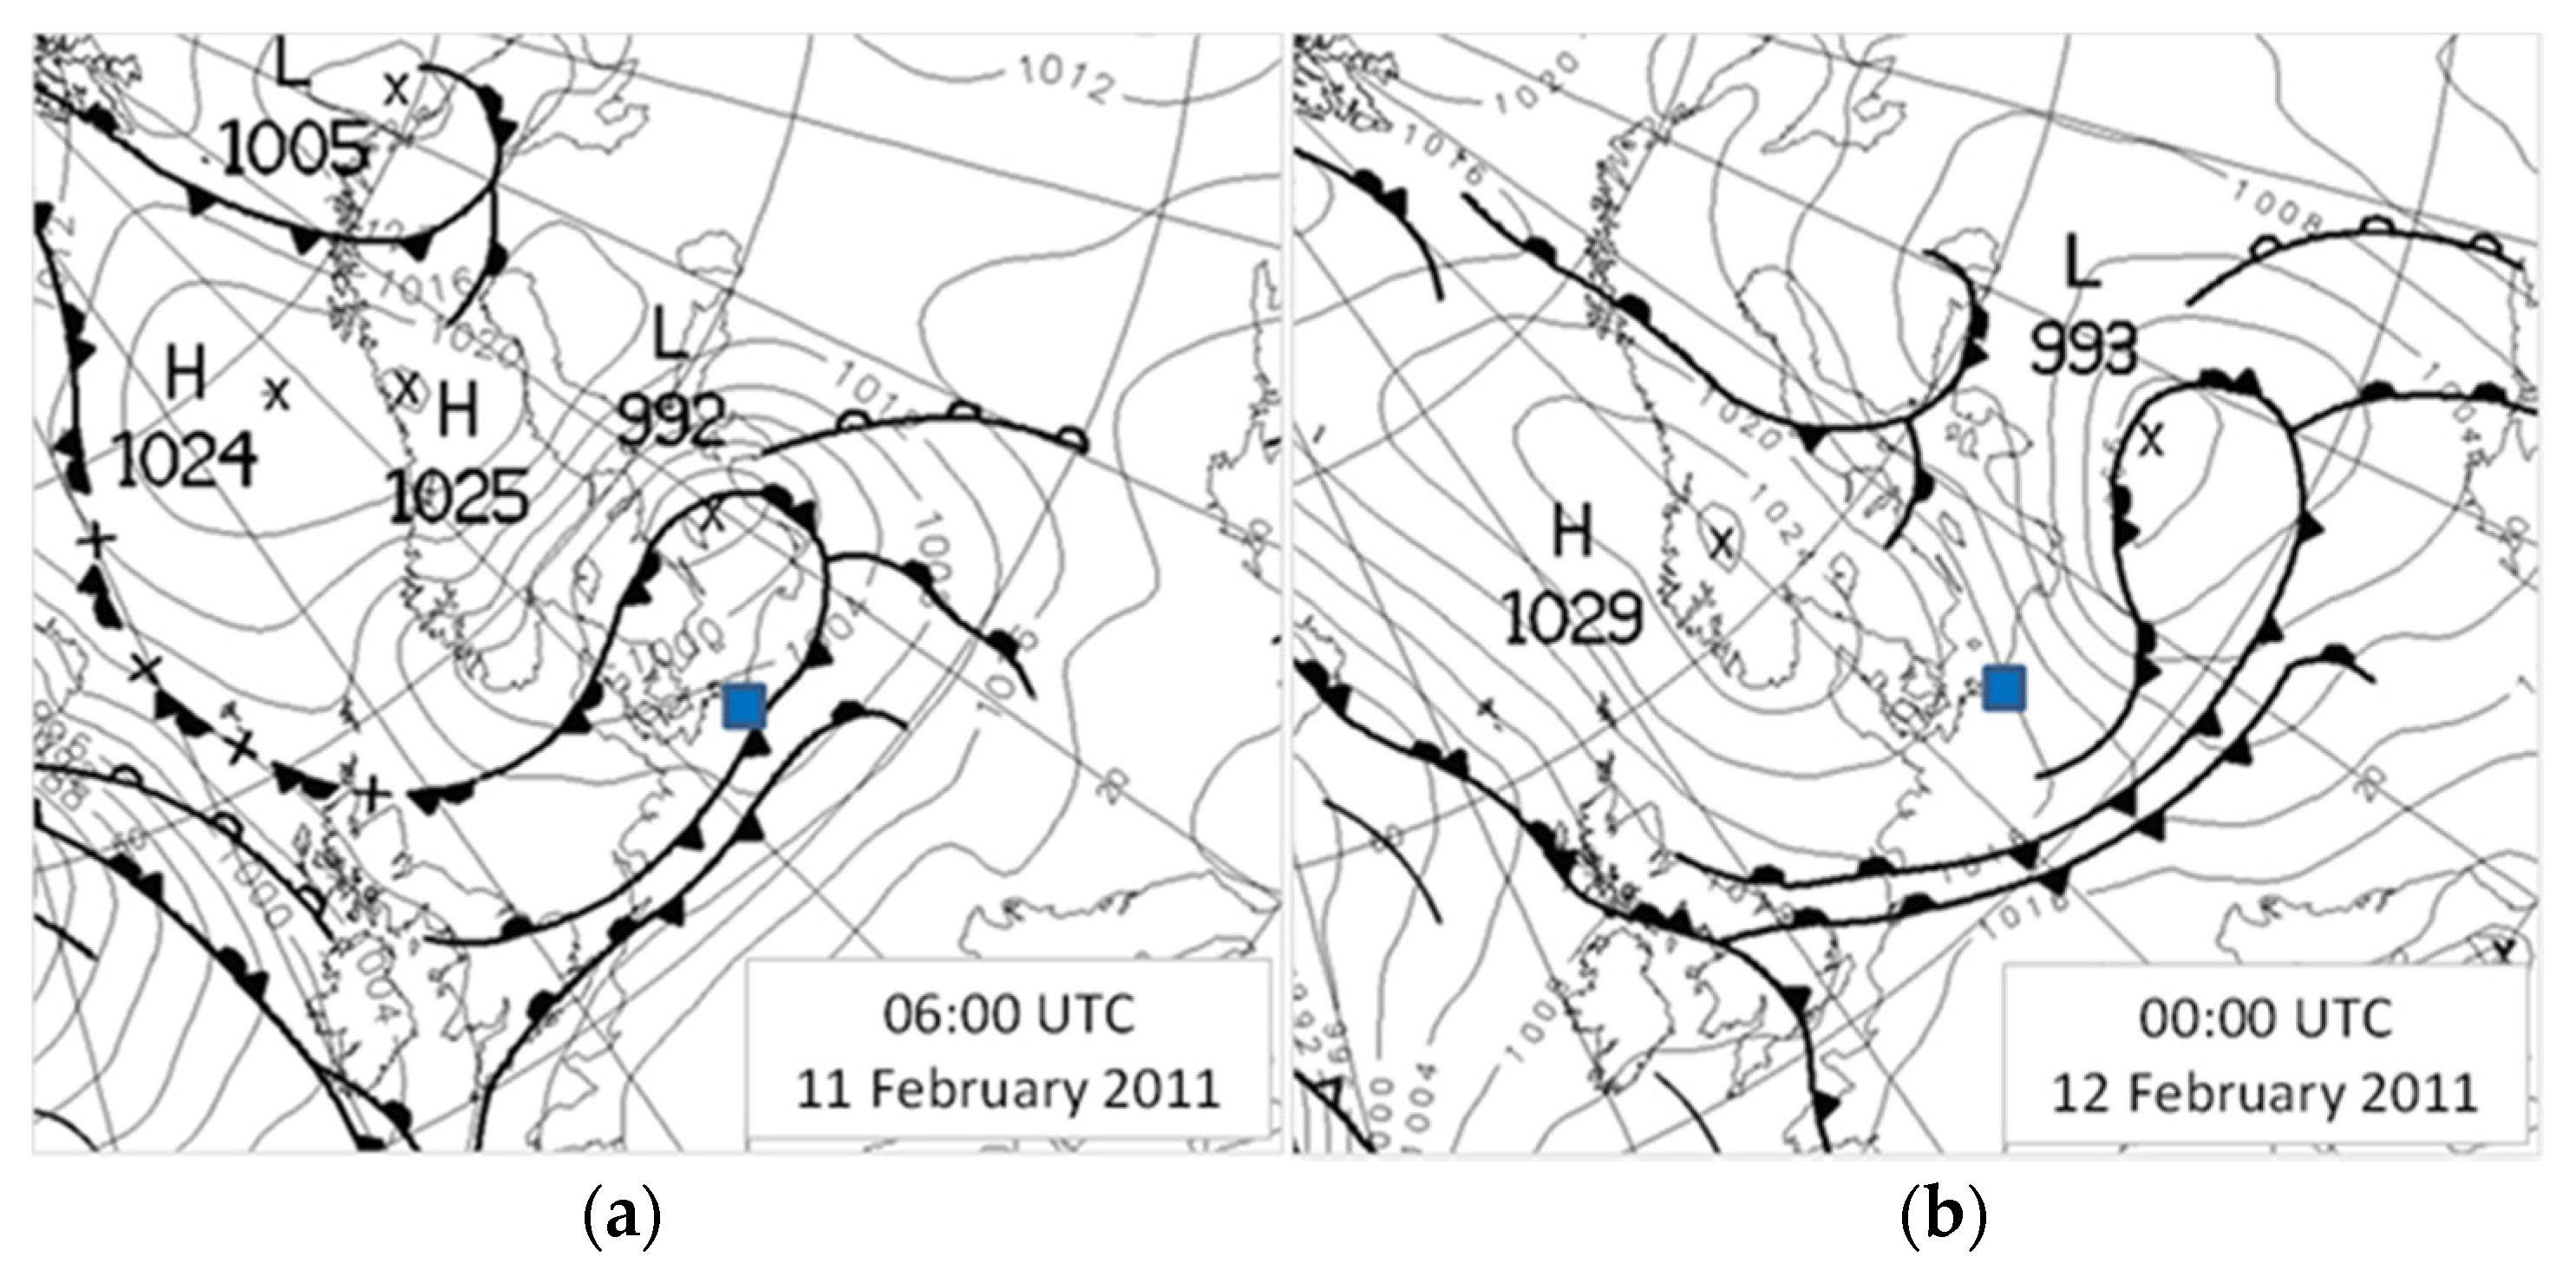
Figure 9.
Synoptic situation during the February 2011 storm surge on: (a) 11 February, 6:00 UTC; (b) 12 February, 00:00 UTC (published with permission, ©British Crown copyright 2011, the Met Office) (blue square: study area).
Figure 9.
Synoptic situation during the February 2011 storm surge on: (a) 11 February, 6:00 UTC; (b) 12 February, 00:00 UTC (published with permission, ©British Crown copyright 2011, the Met Office) (blue square: study area).
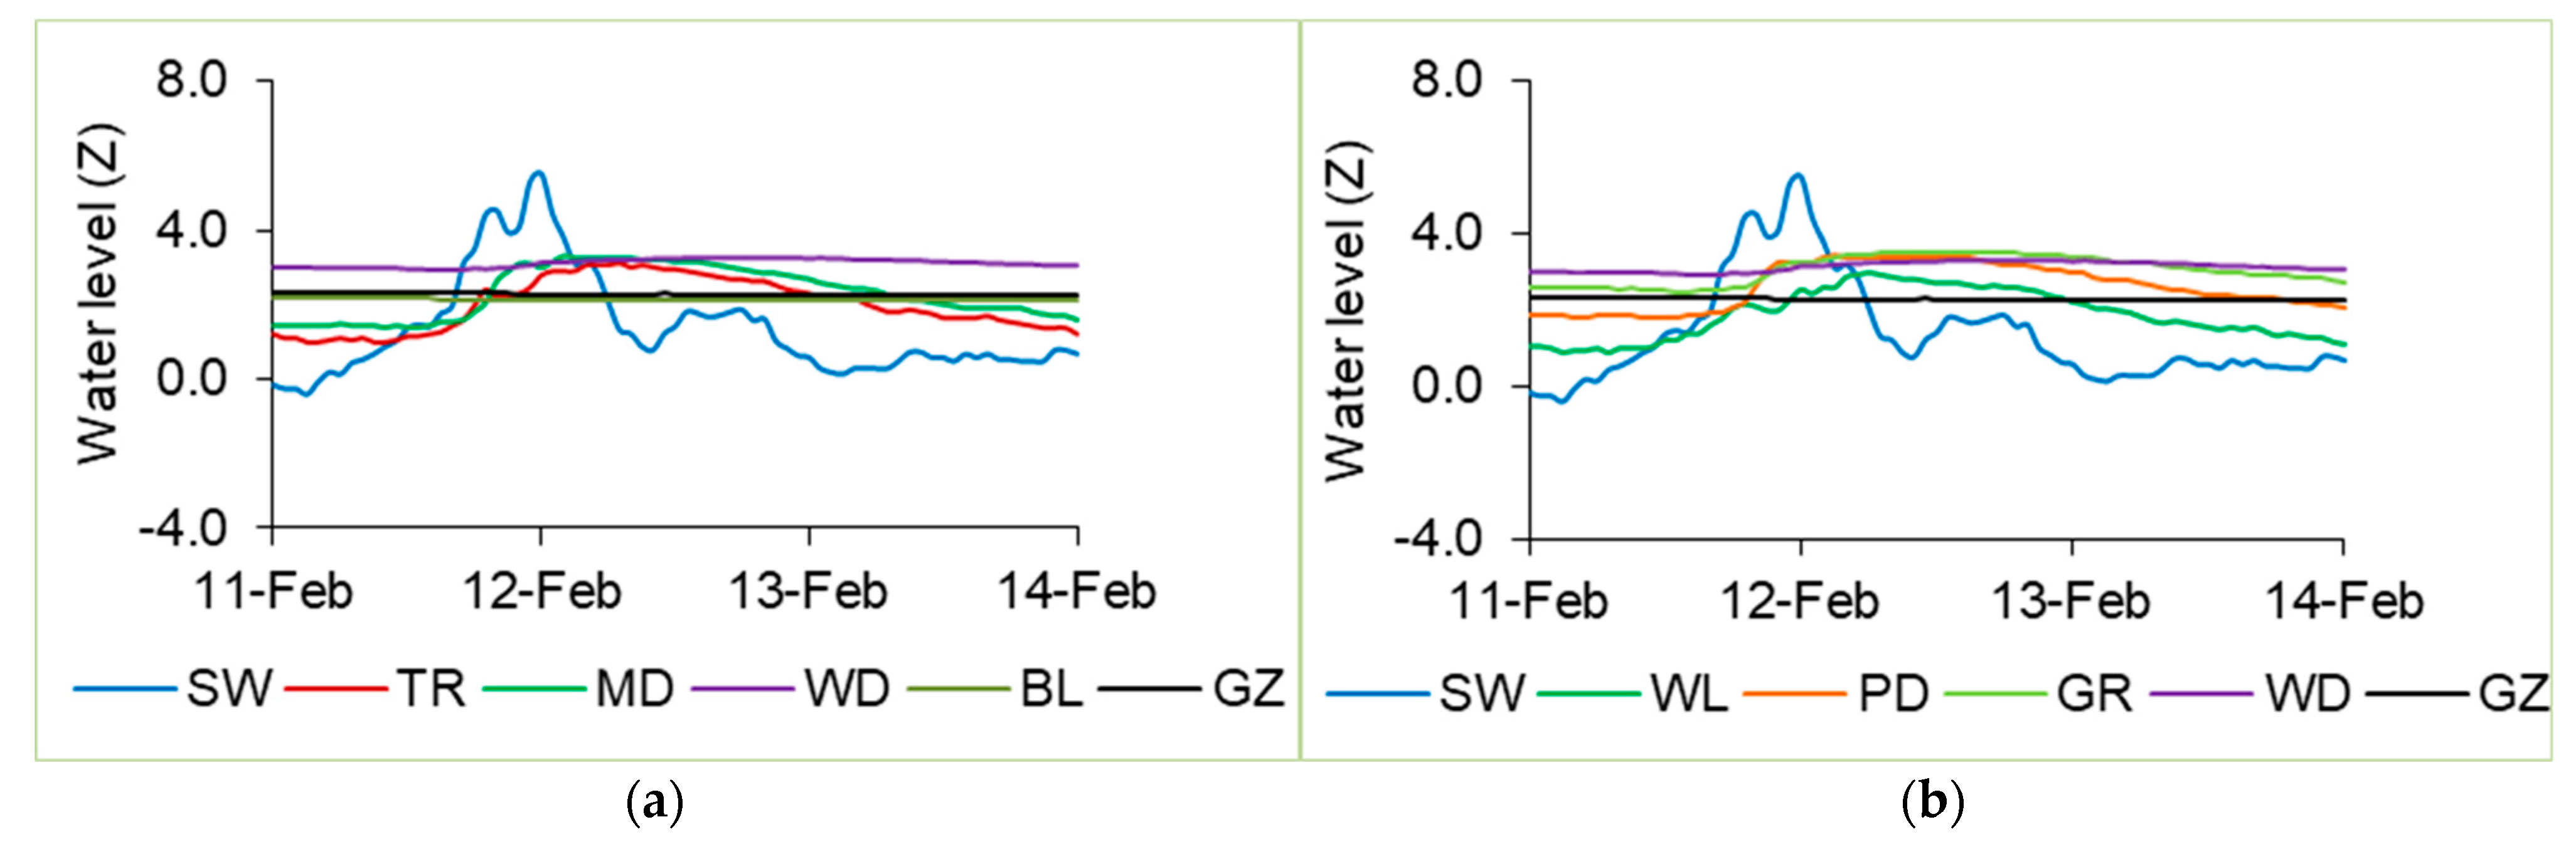
Figure 10.
Water level changes in the Odra River mouth area on 11–13 February 2011: (a) the western track; (b) the eastern track (water level readings were converted to standardized values—Z).
Figure 10.
Water level changes in the Odra River mouth area on 11–13 February 2011: (a) the western track; (b) the eastern track (water level readings were converted to standardized values—Z).
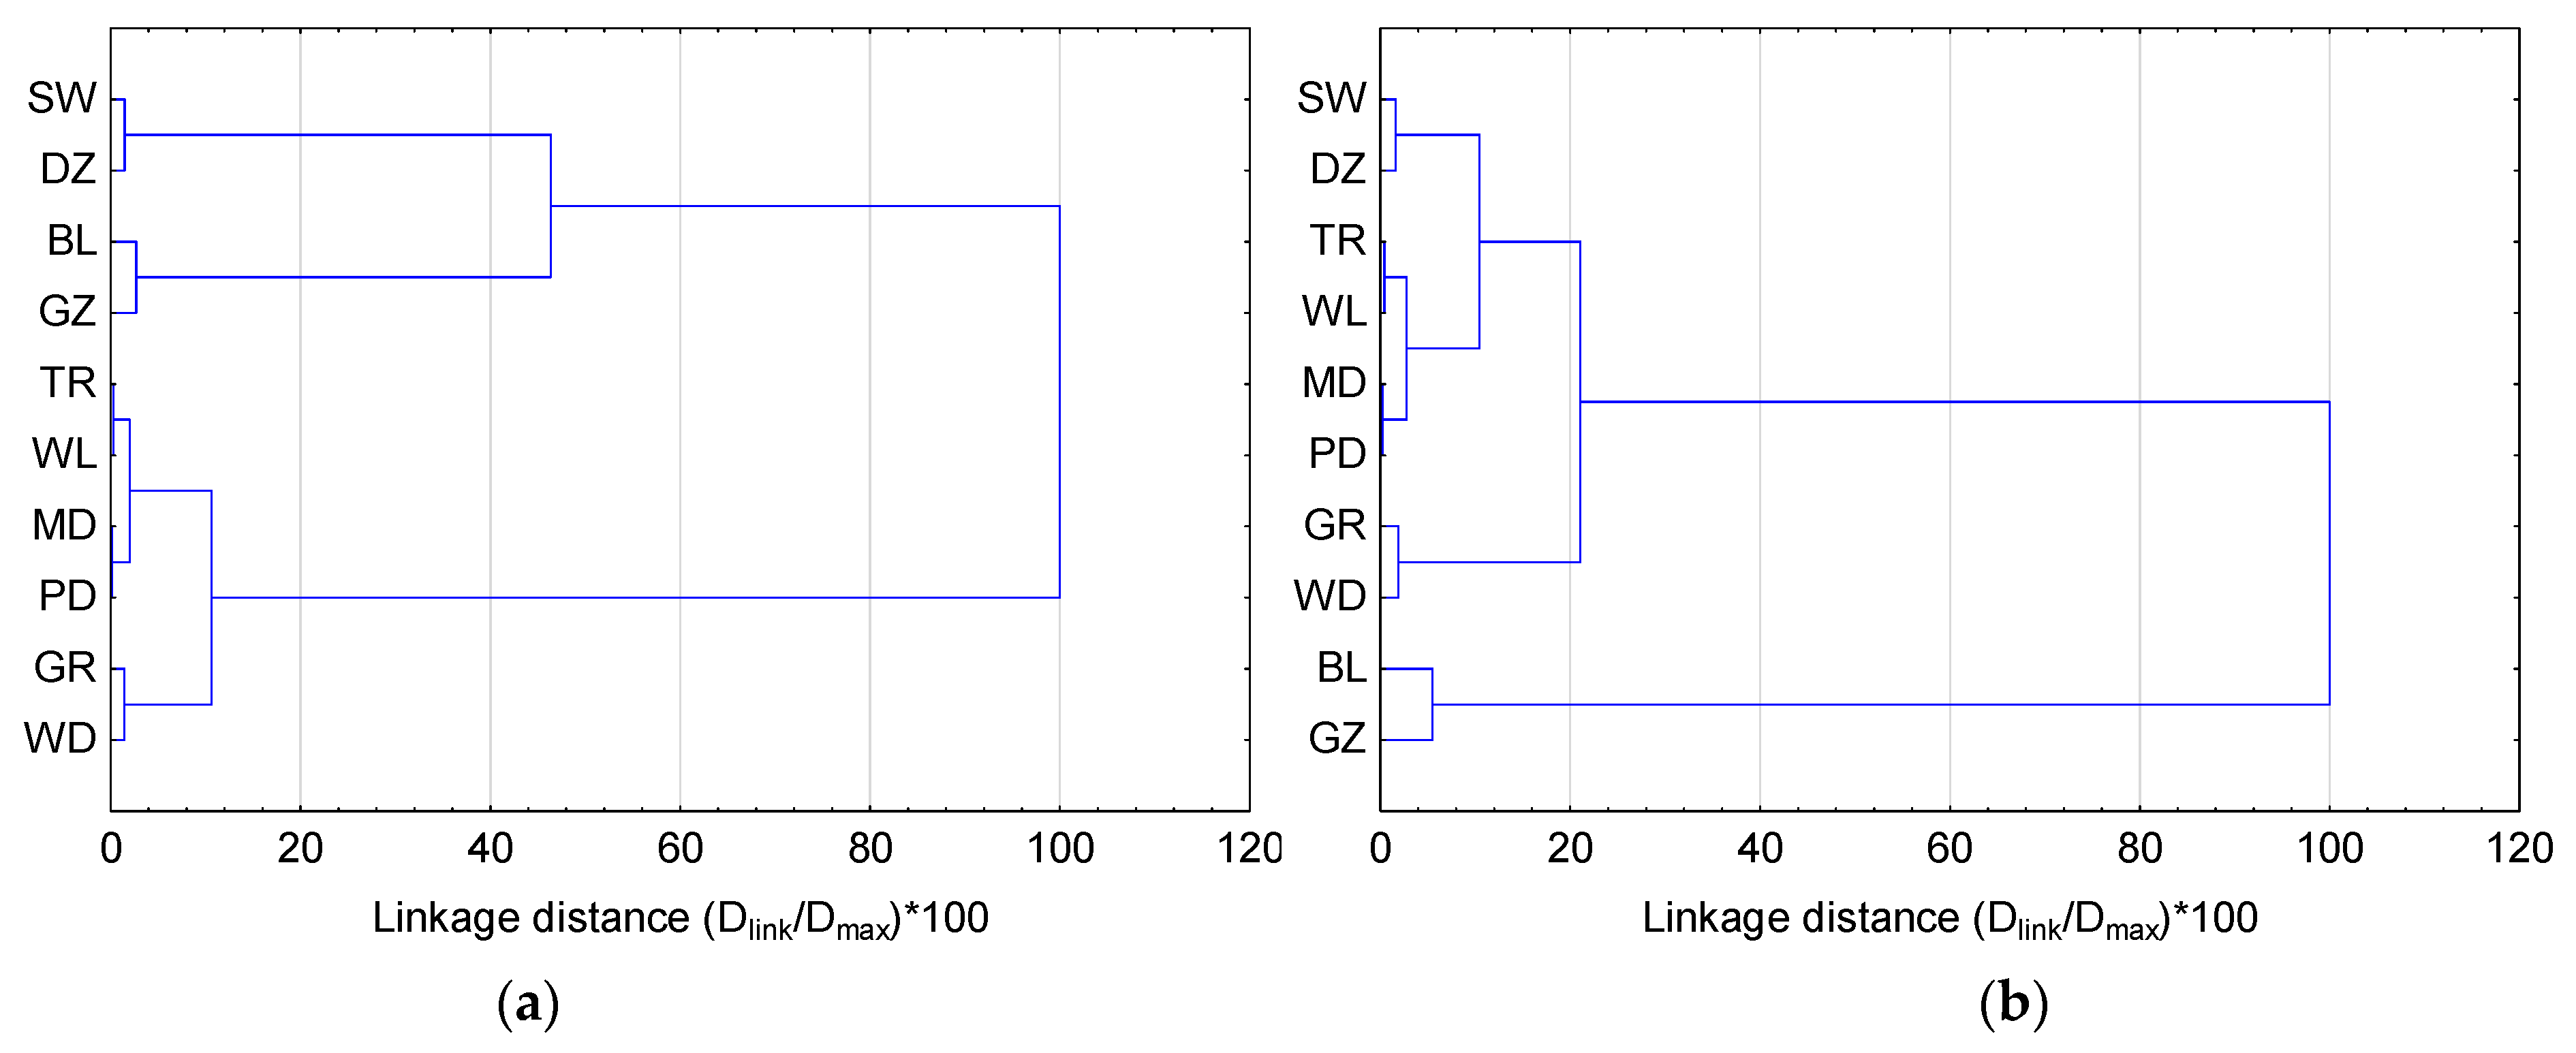
Figure 11.
Dendrograms of water levels in the Odra River mouth area during the February 2011 storm surge: (a) synchronous water level clustering (b) water level clustering incorporating k = 7 h offsets for SW and DZ series.
Figure 11.
Dendrograms of water levels in the Odra River mouth area during the February 2011 storm surge: (a) synchronous water level clustering (b) water level clustering incorporating k = 7 h offsets for SW and DZ series.
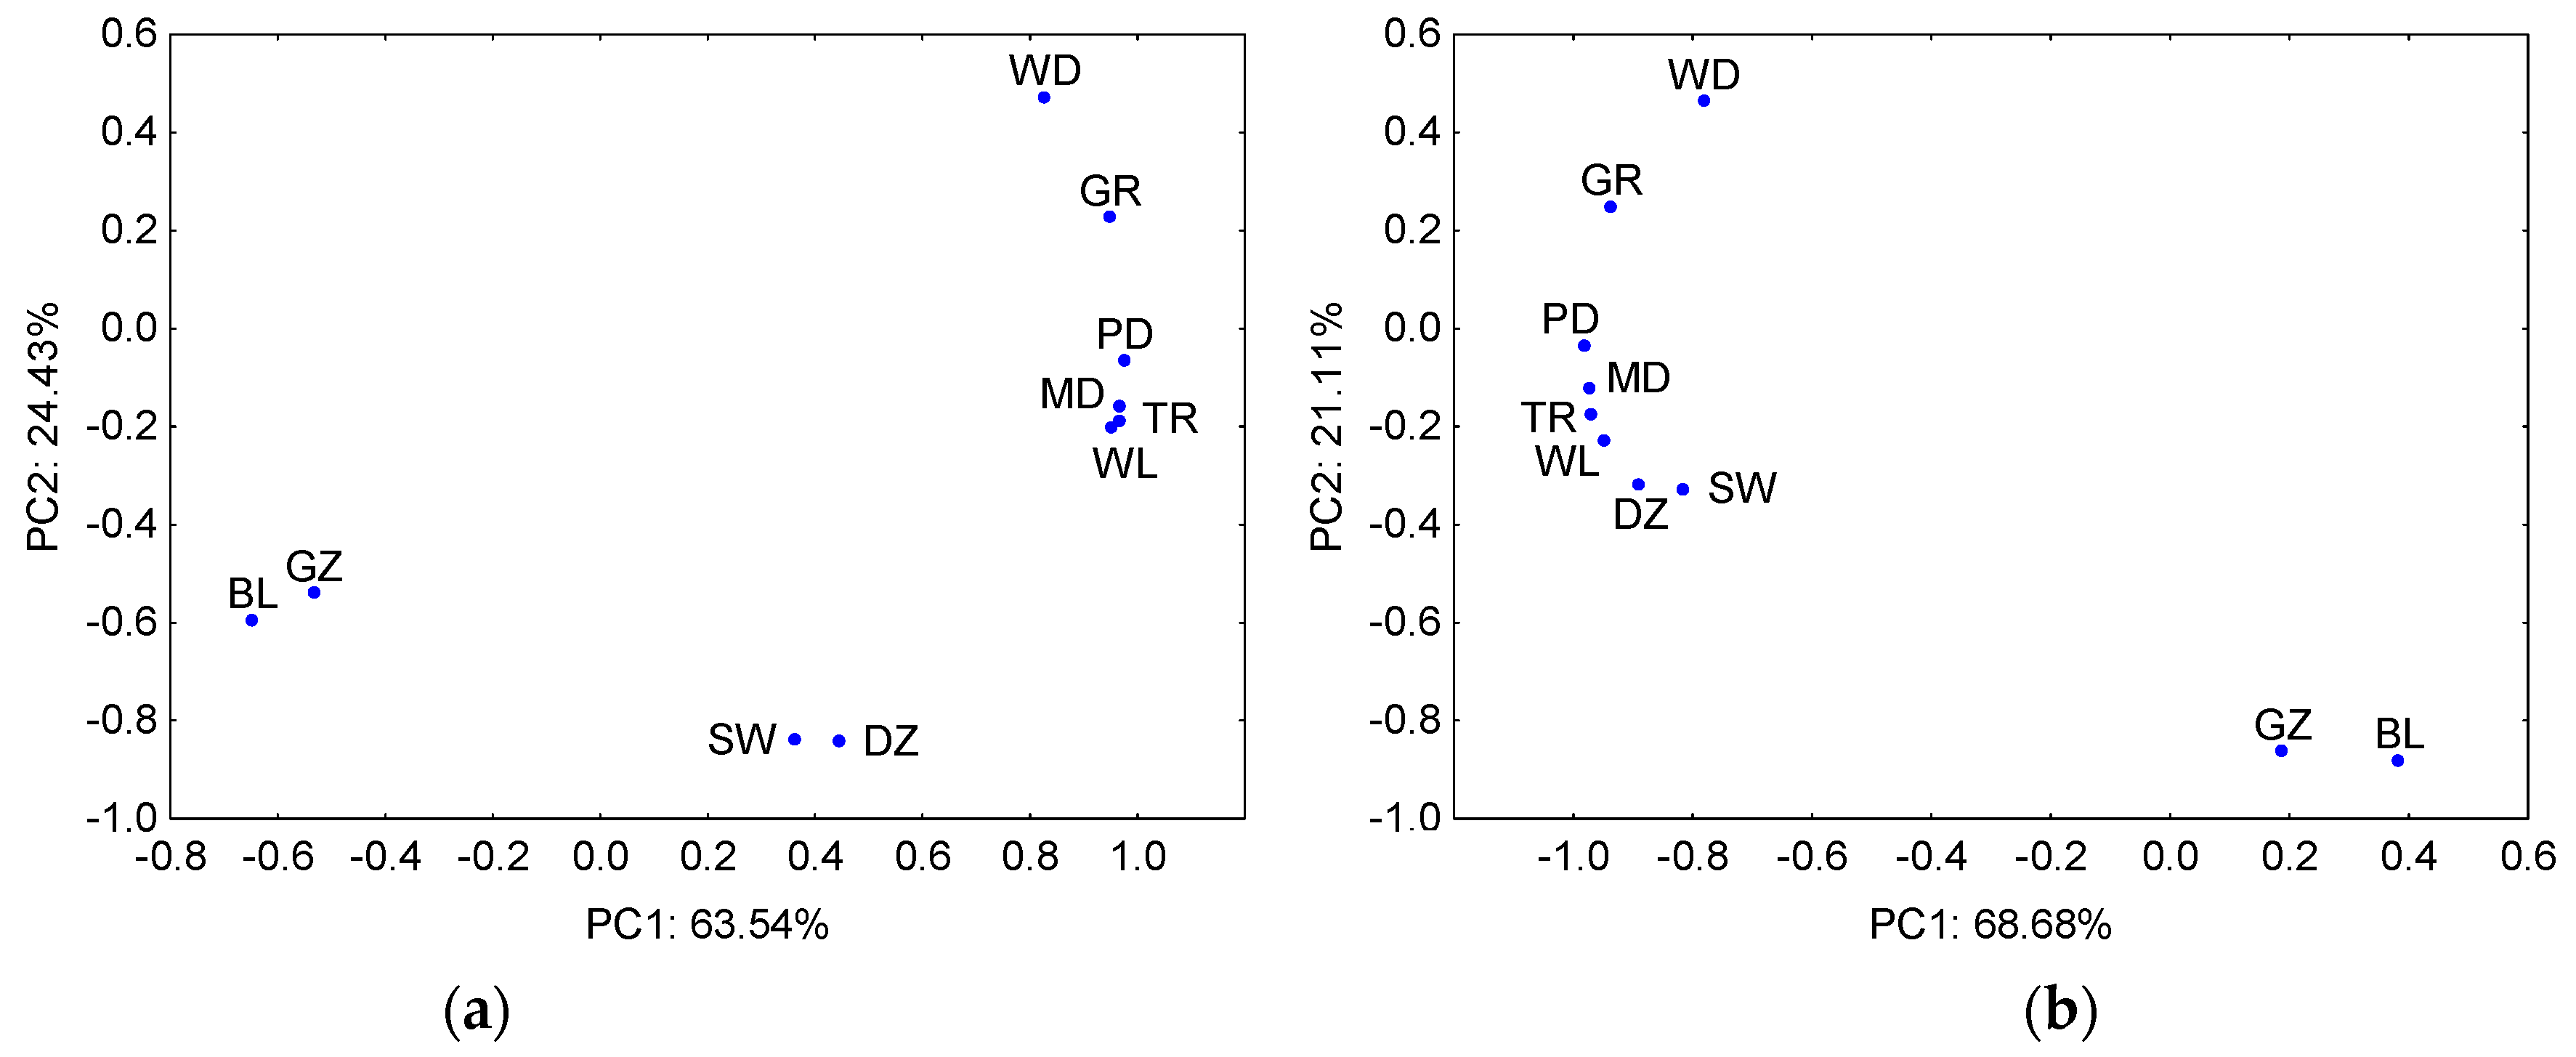
Figure 12.
Loading scatter plot (PC1 versus PC2) of water levels in the Odra River mouth area during the February 2011 storm surge, along with the percentage of total variance explained by PC1 and PC2: (a) synchronous correlations (b) correlations incorporating k = 7 h offsets for SW and DZ series.
Figure 12.
Loading scatter plot (PC1 versus PC2) of water levels in the Odra River mouth area during the February 2011 storm surge, along with the percentage of total variance explained by PC1 and PC2: (a) synchronous correlations (b) correlations incorporating k = 7 h offsets for SW and DZ series.
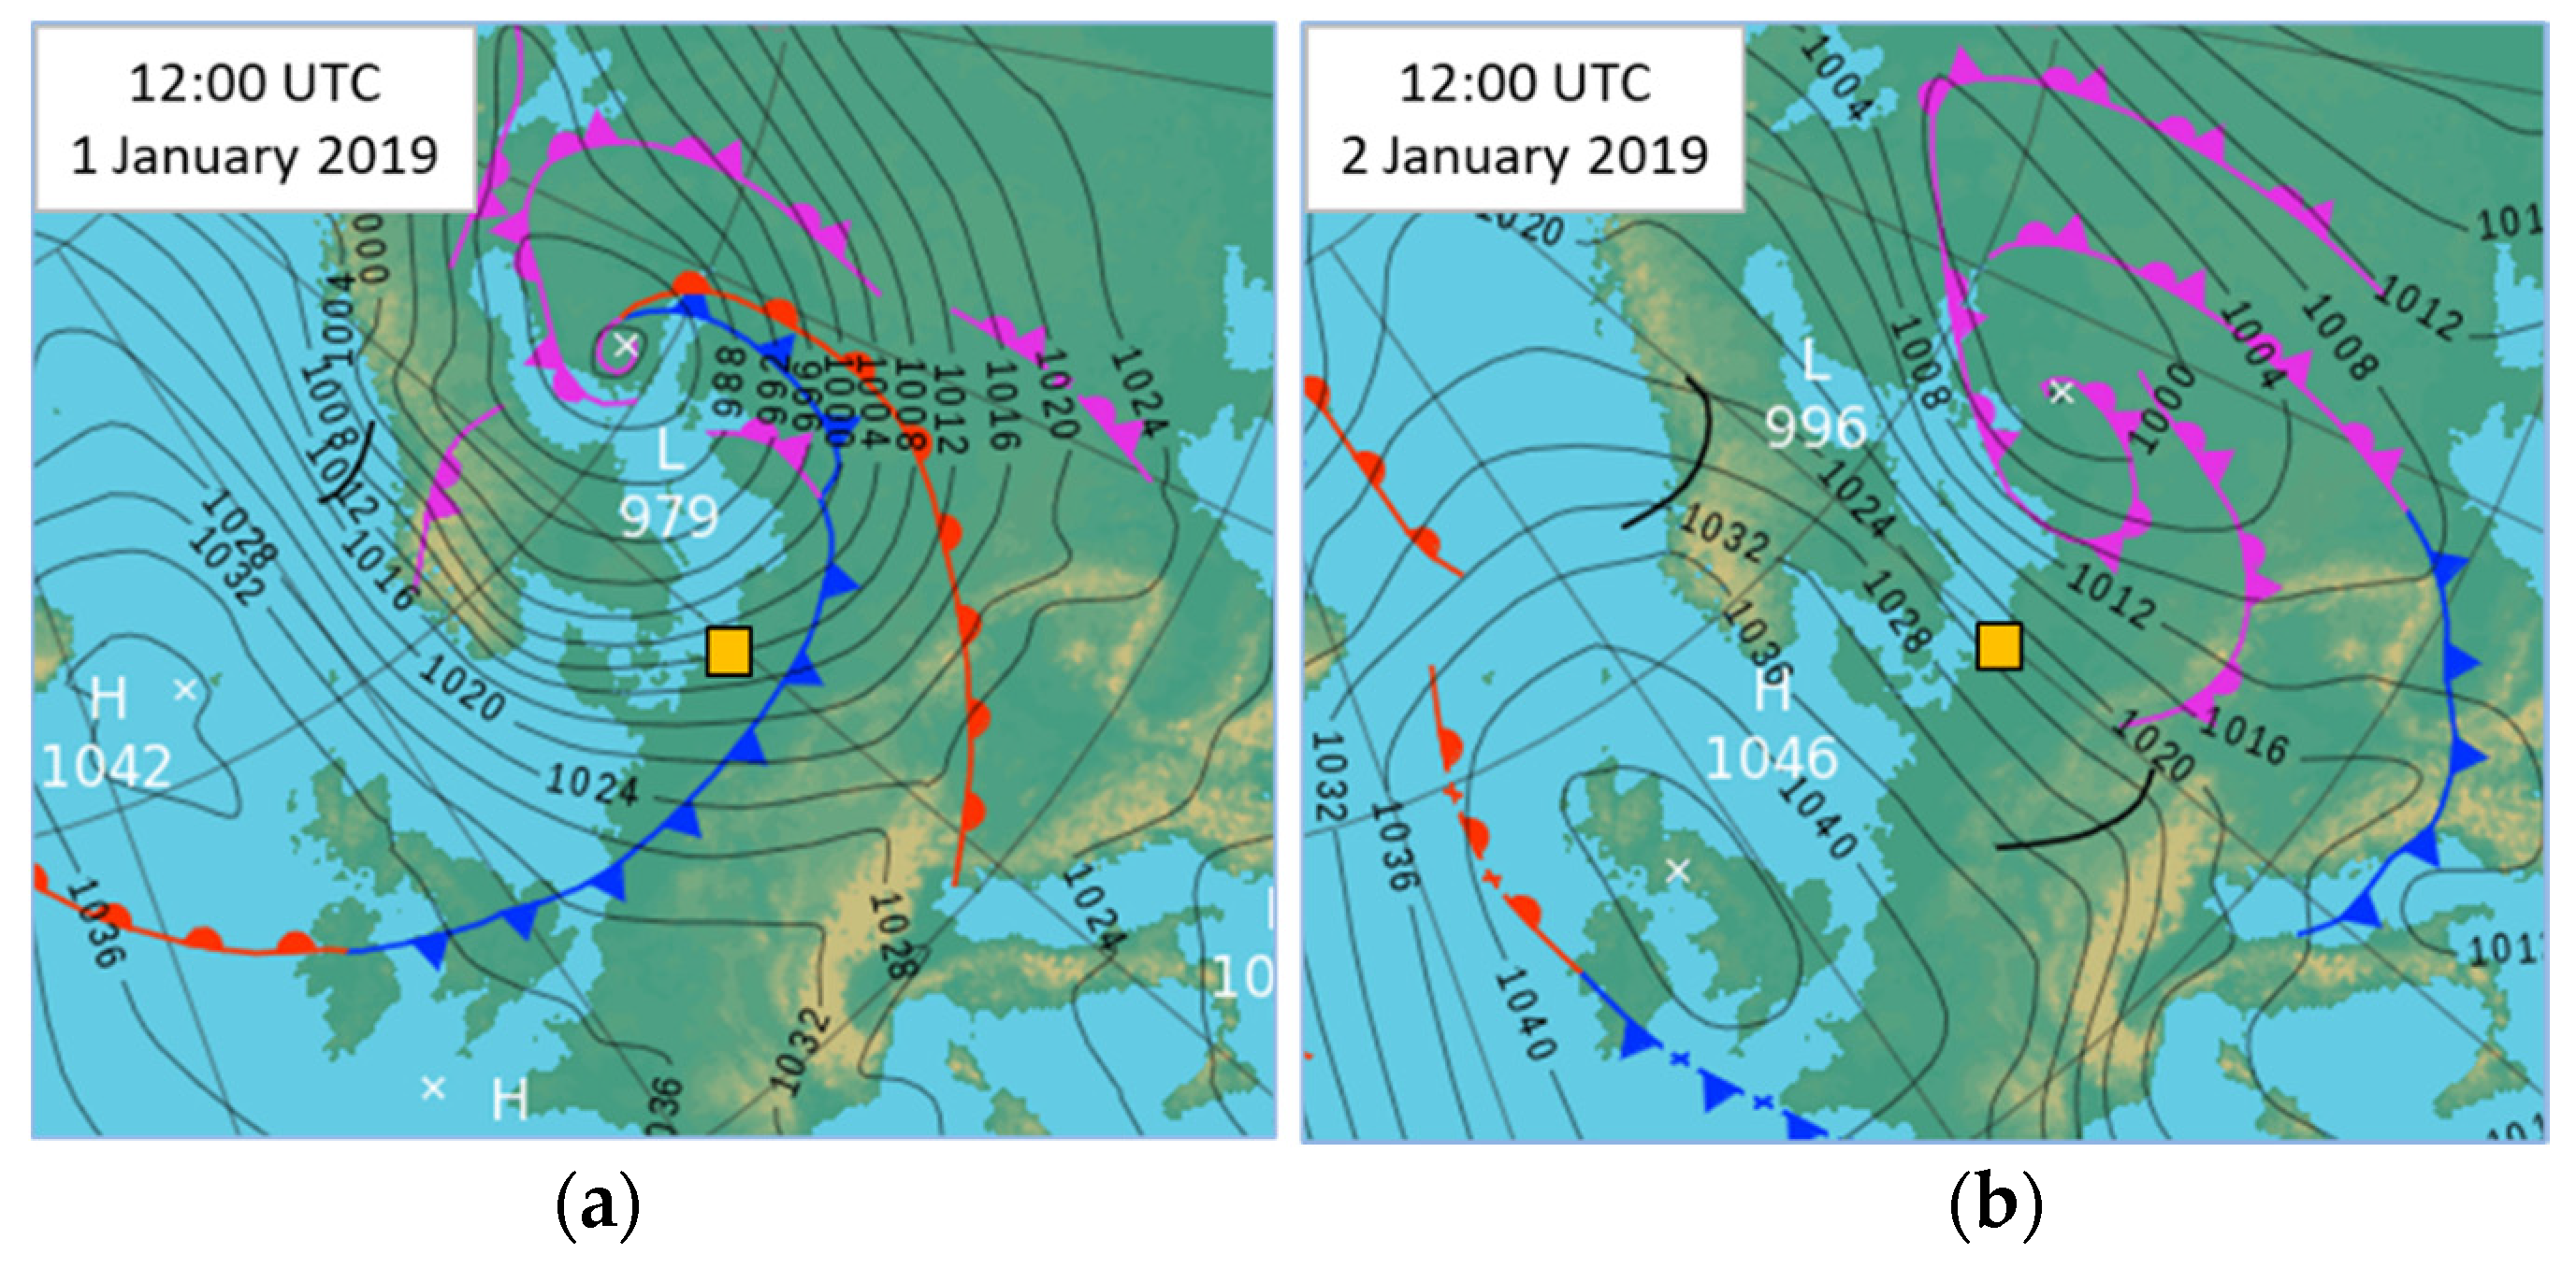
Figure 13.
Synoptic situation during the January 2019 storm surge on: (a) 1 January, 12:00 UTC; (b) 2 January, 12:00 UTC (published with permission, ©British Crown copyright 2019, the Met Office) (orange square: study area).
Figure 13.
Synoptic situation during the January 2019 storm surge on: (a) 1 January, 12:00 UTC; (b) 2 January, 12:00 UTC (published with permission, ©British Crown copyright 2019, the Met Office) (orange square: study area).
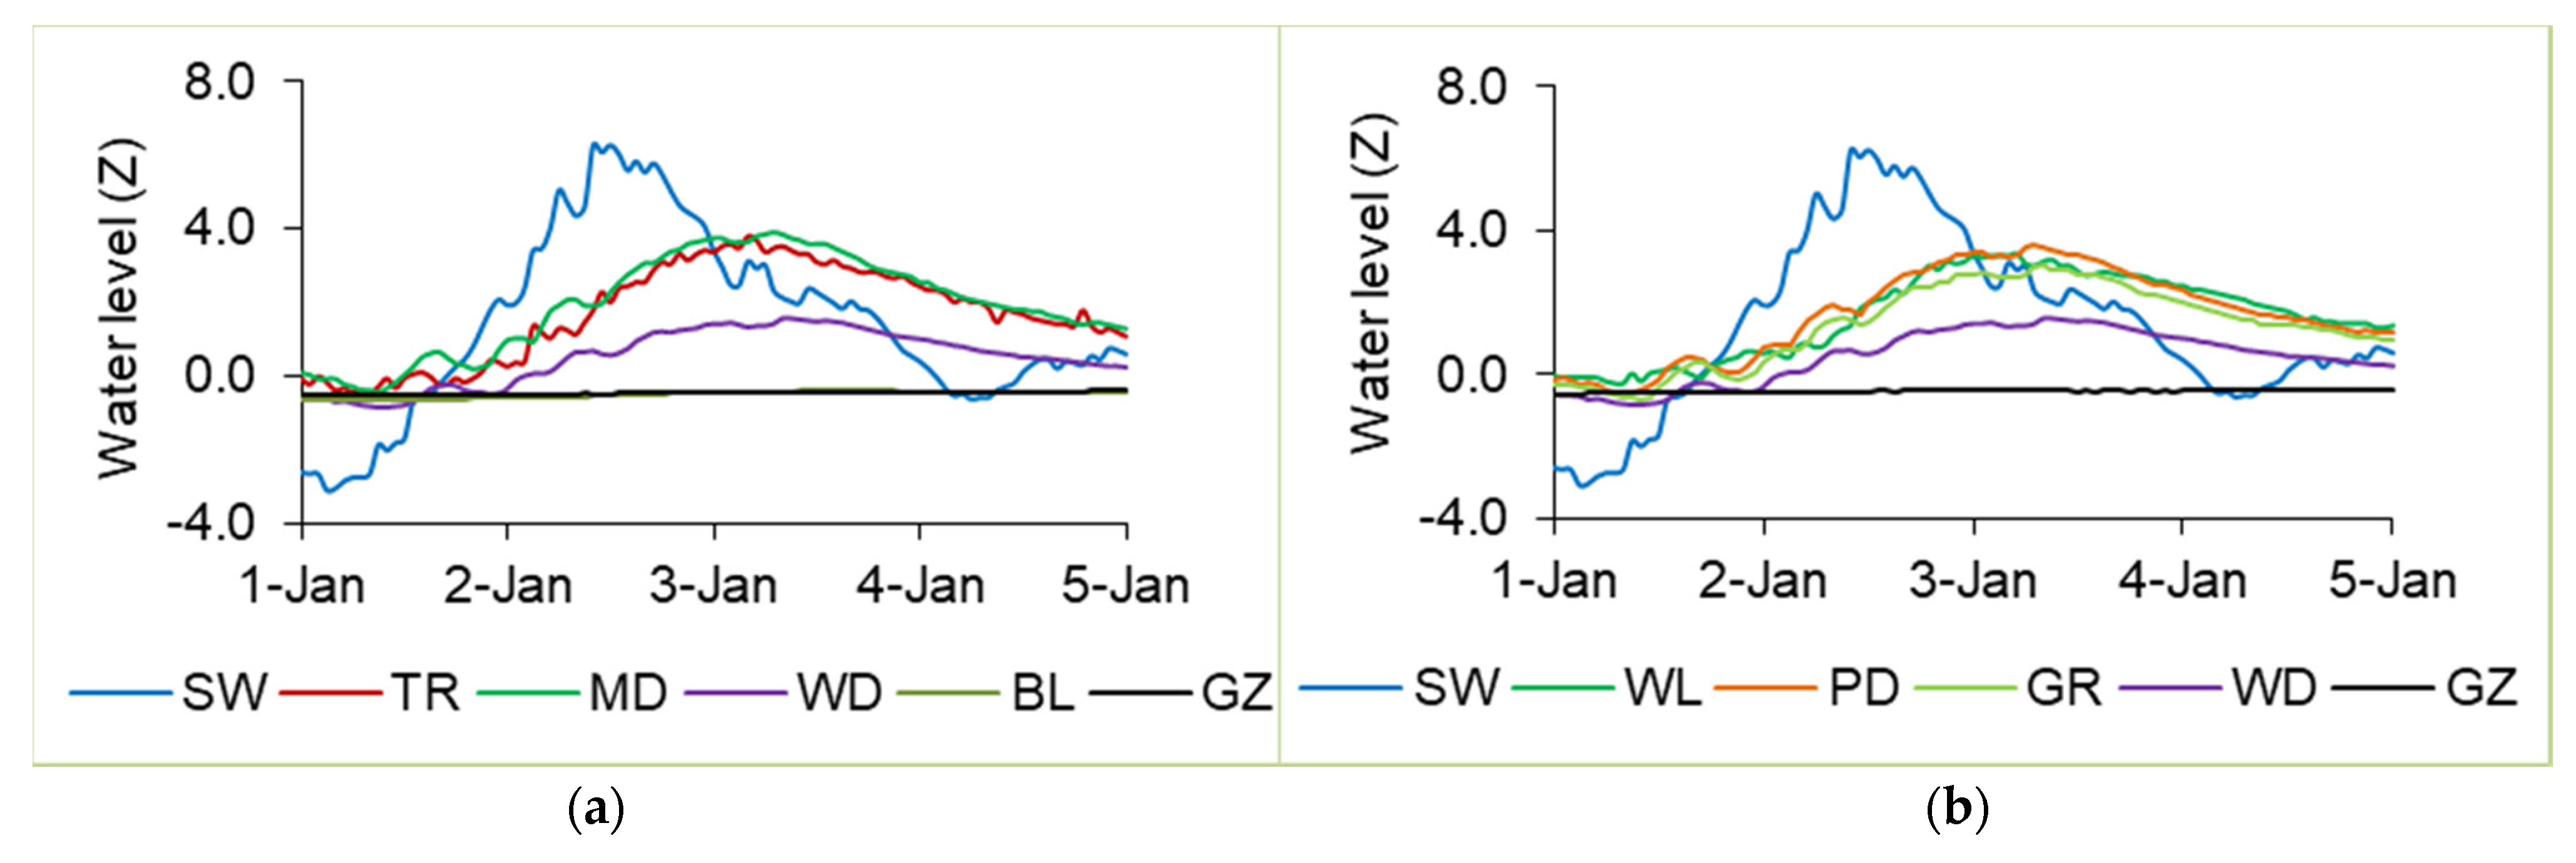
Figure 14.
Water level changes in the Odra River mouth area on 1–4 January 2019: (a) the western track; (b) the eastern track (water level readings were converted to standardized values—Z).
Figure 14.
Water level changes in the Odra River mouth area on 1–4 January 2019: (a) the western track; (b) the eastern track (water level readings were converted to standardized values—Z).
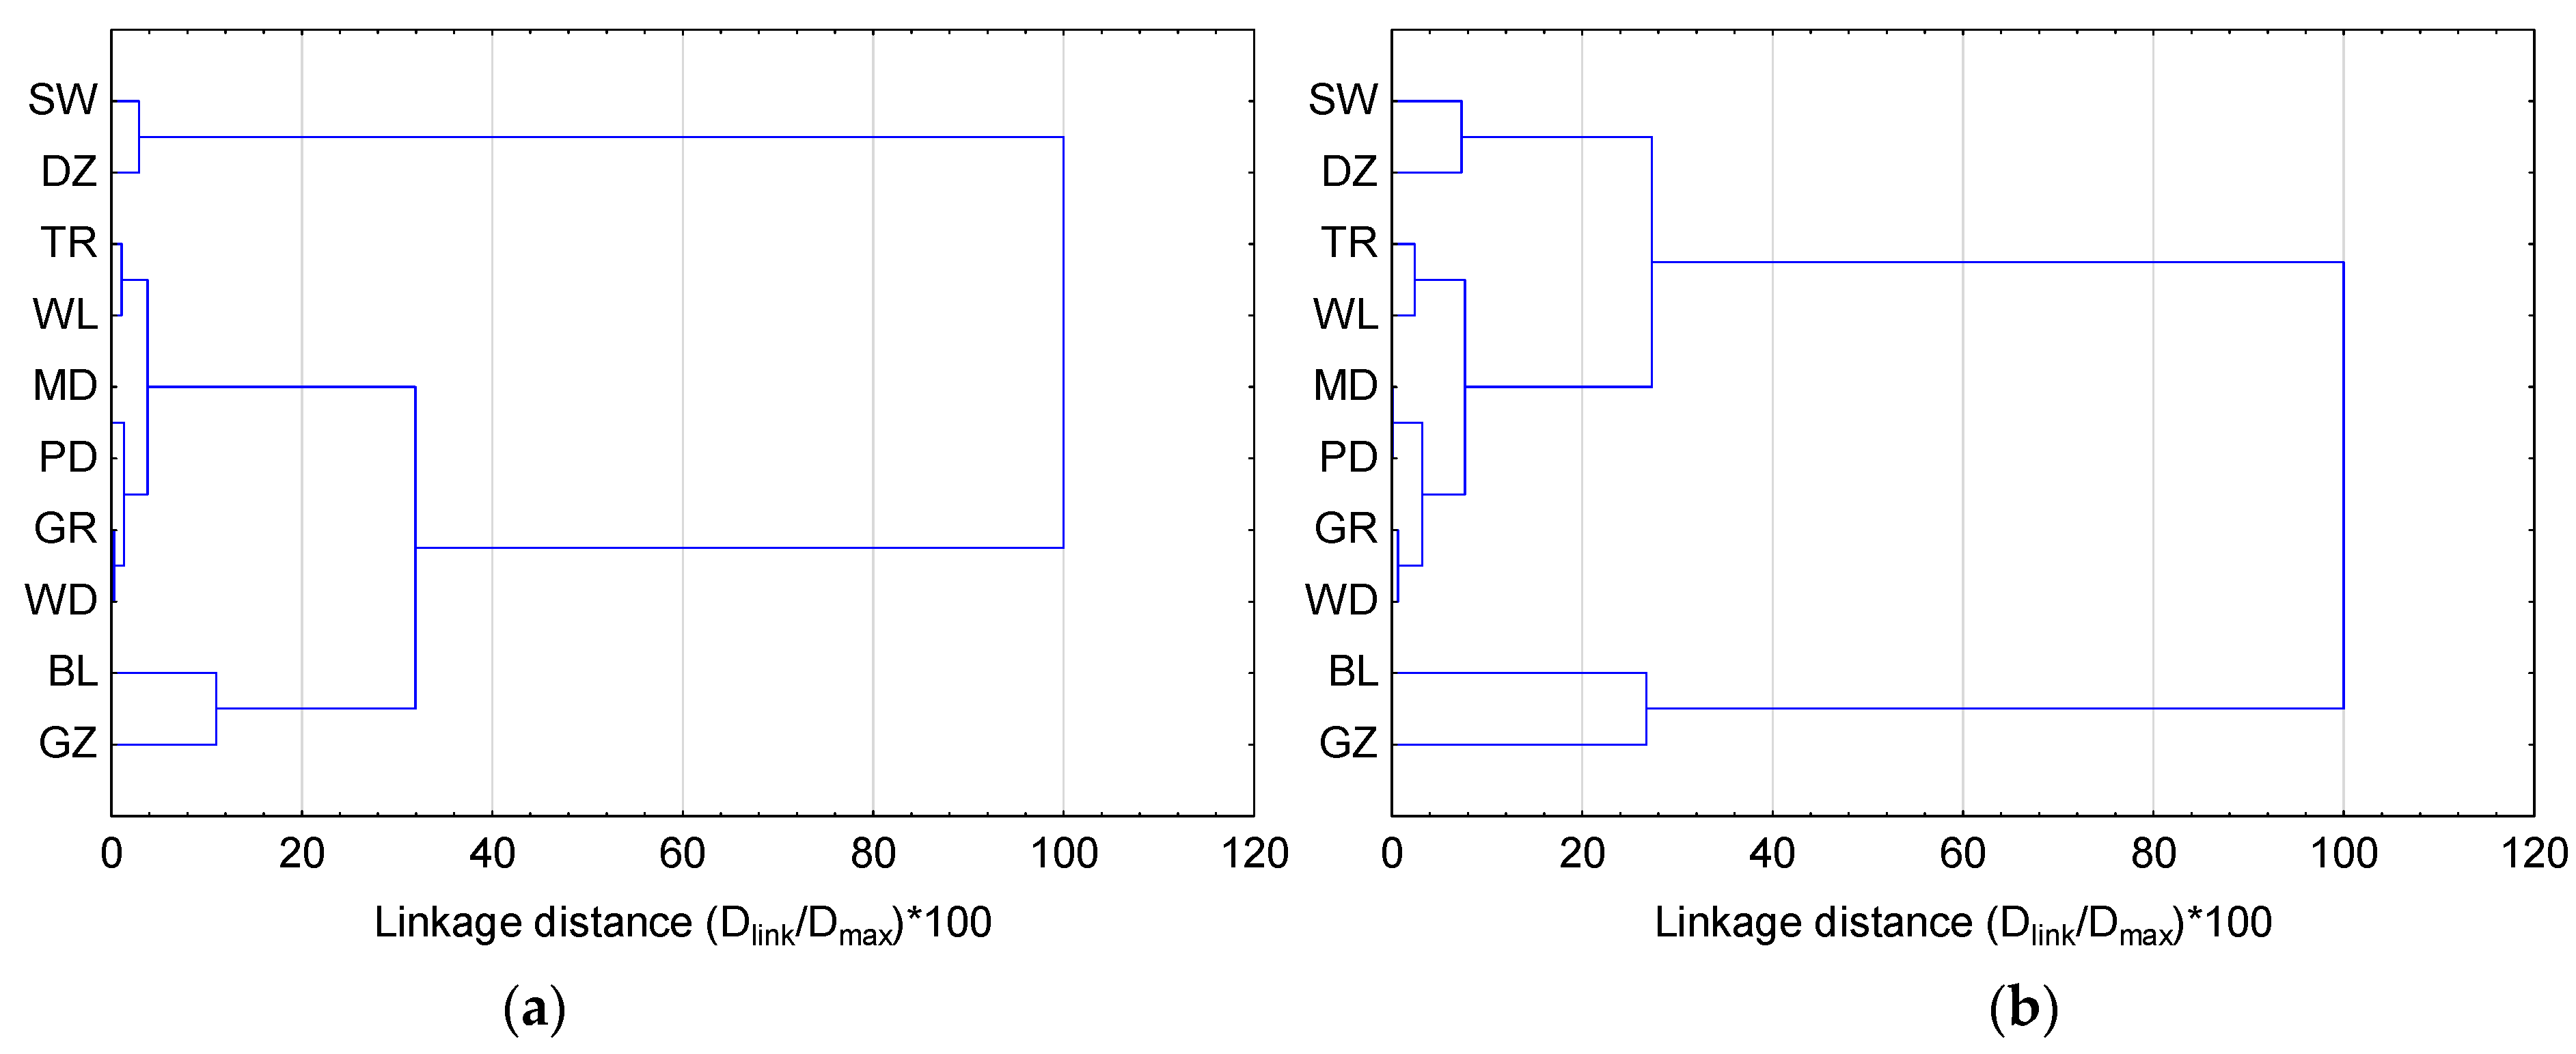
Figure 15.
Dendrograms of water levels in the Odra River mouth area during the January 2019 storm surge: (a) synchronous water level clustering (b) water level clustering with k = 11 h offset for SW series and k = 8 h offset for DZ series.
Figure 15.
Dendrograms of water levels in the Odra River mouth area during the January 2019 storm surge: (a) synchronous water level clustering (b) water level clustering with k = 11 h offset for SW series and k = 8 h offset for DZ series.
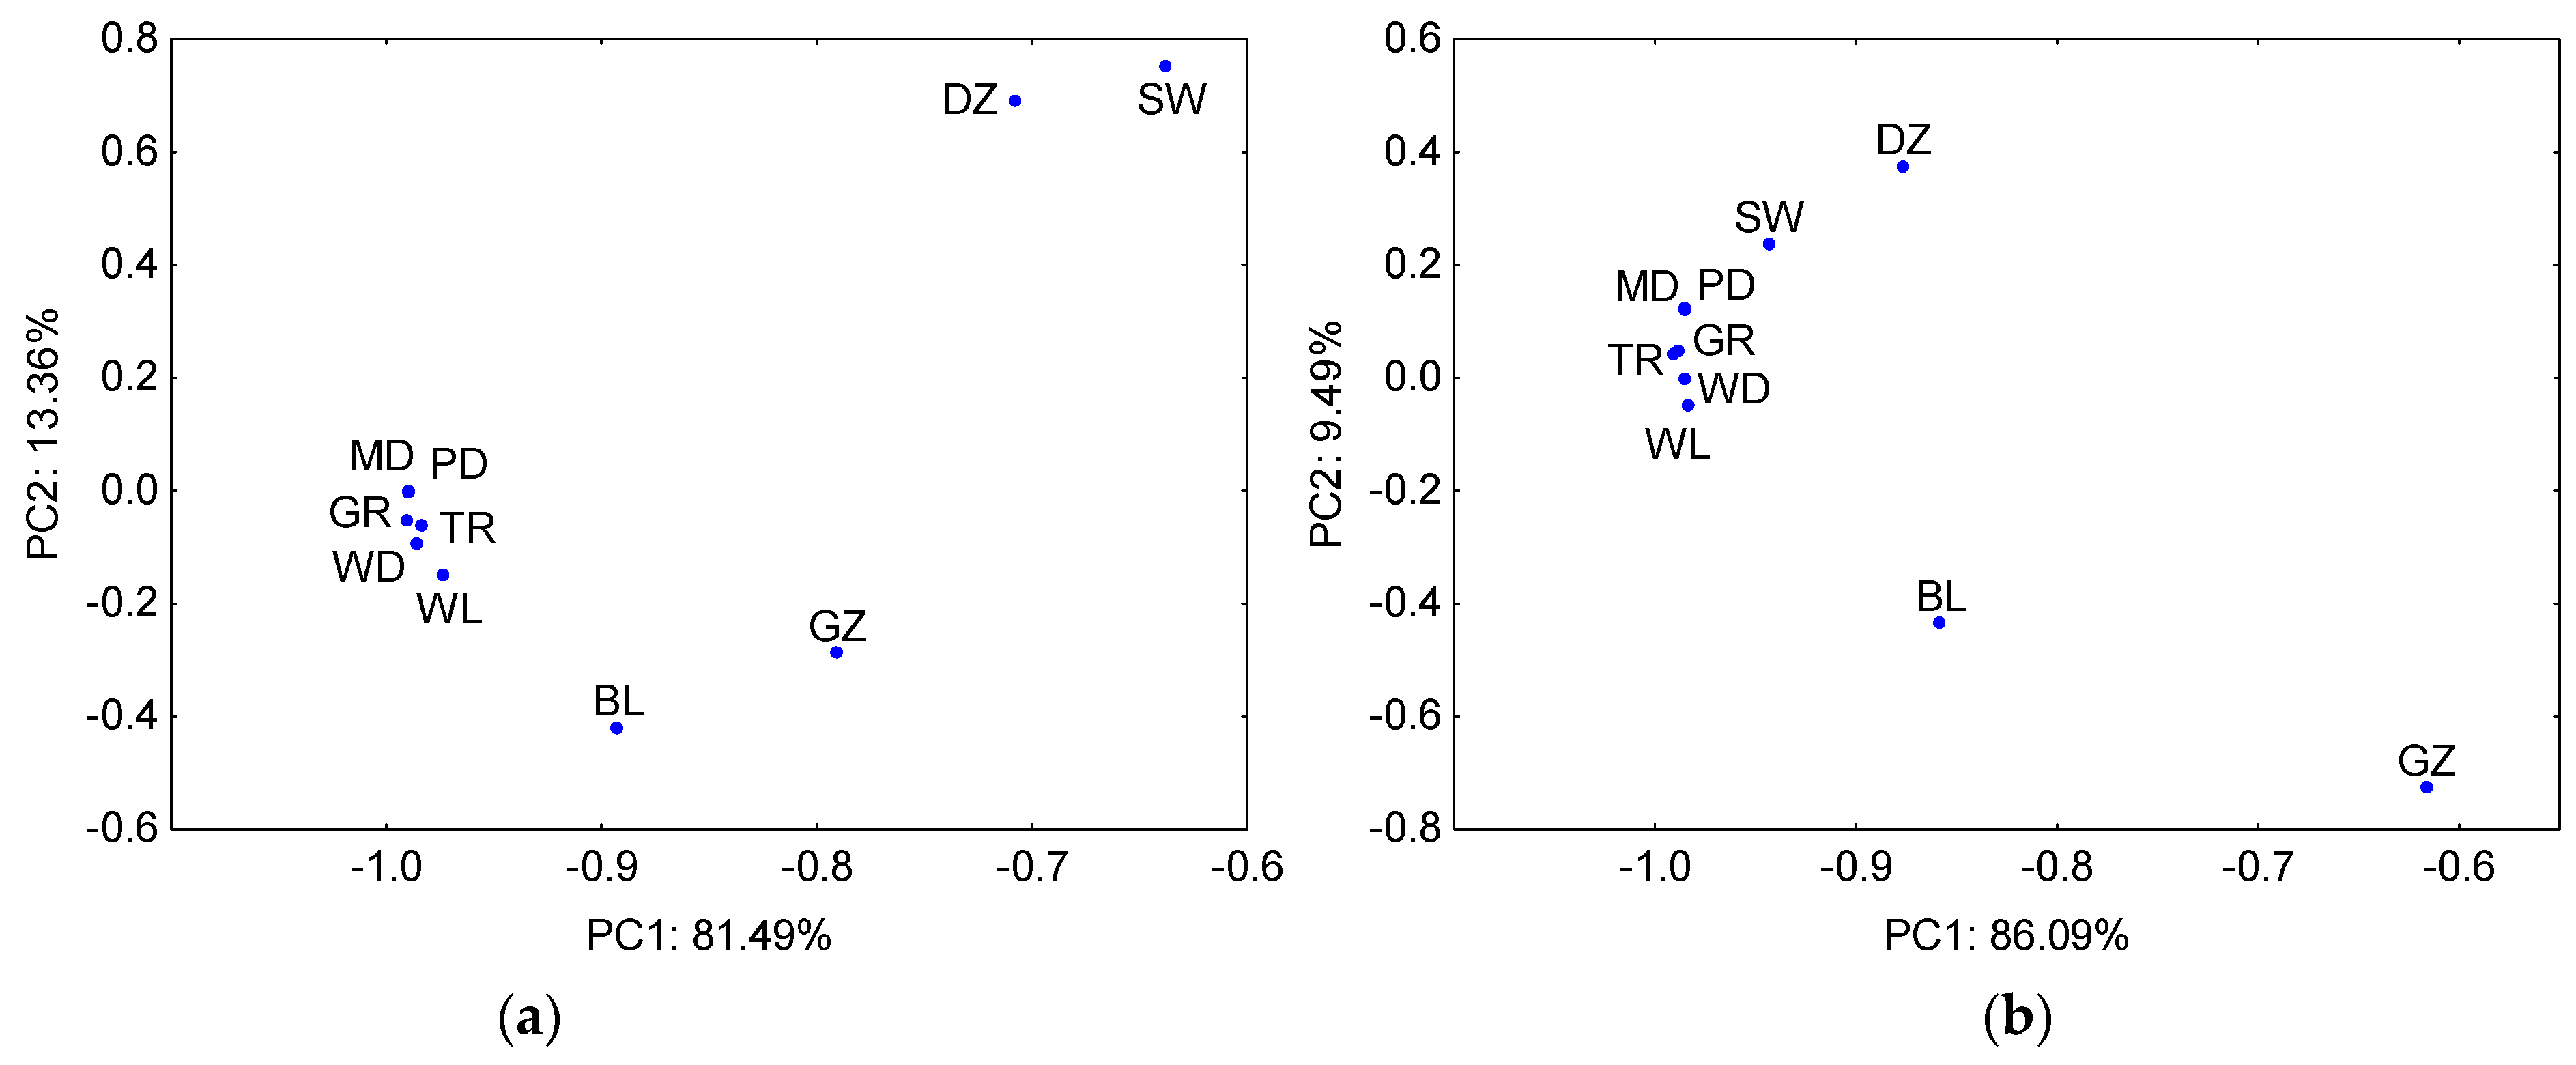
Figure 16.
Loading scatter plot (PC1 versus PC2) of water levels in the Odra River mouth area during the January 2019 storm surge, along with the percentage of total variance explained by PC1 and PC2: (a) synchronous correlations (b) correlations incorporating k = 11 h offset for SW series and k = 8 h offset for DZ series.
Table 1.
The highest storm surges at the coast of the Pomeranian Bay in Świnoujście in years 2008/2009−2019/2020.
Table 1.
The highest storm surges at the coast of the Pomeranian Bay in Świnoujście in years 2008/2009−2019/2020.
| No. | Low Pressure System 1 | Date | Maximum Sea Level (cm amsl) | Number of Hours with Alarm Level Exceeded 2 | Relative Sea Level Rise (cm) | Average Sea Level over 30 Days Preceding a Surge
(cm amsl) | Average Sea Level over 7 Days Preceding a Surge
(cm amsl) |
|---|
| 1 | Yulietta | 30 October 2008 | 101 | 10 | 105 | −4 | 4 |
| 2 | Wimar | 15 October 2009 | 122 | 34 | 80 | 12 | 32 |
| 3 | Olaf | 11 February 2011 | 120 | 8 | 120 | 4 | 8 |
| 4 | Joahim | 17 December 2011 | 107 | 11 | 109 | −6 | 3 |
| 5 | Elfriede | 14 January 2012 | 132 | 38 | 149 | 31 | 48 |
| 6 | Xaver | 7 December 2013 | 100 | 18 | 171 | 17 | 11 |
| 7 | Zofia | 5 October 2016 | 105 | 20 | 79 | 9 | −5 |
| 8 | Axel | 4 January 2017 | 142 | 38 | 124 | 14 | 26 |
| 9 | Herwart | 30 October 2017 | 112 | 37 | 122 | 10 | 15 |
| 10 | Zeetje | 2 January 2019 | 133 | 19 | 190 | −3 | −1 |
Table 2.
Triangular matrix of correlation of water levels in the Odra River mouth area in years 2008/09 to 2019/20.
Table 2.
Triangular matrix of correlation of water levels in the Odra River mouth area in years 2008/09 to 2019/20.
| | SW | DZ | TR | WL | MD | PD | GR | WD | BL | GZ |
|---|
| SW | 1.000 | | | | | | | | | |
| DZ | 0.955 | 1.000 | | | | | | | | |
| TR | 0.849 | 0.886 | 1.000 | | | | | | | |
| WL | 0.846 | 0.902 | 0.979 | 1.000 | | | | | | |
| MD | 0.815 | 0.844 | 0.976 | 0.952 | 1.000 | | | | | |
| PD | 0.752 | 0.778 | 0.924 | 0.900 | 0.964 | 1.000 | | | | |
| GR | 0.621 | 0.637 | 0.805 | 0.774 | 0.882 | 0.927 | 1.000 | | | |
| WD | 0.300 | 0.297 | 0.461 | 0.435 | 0.570 | 0.672 | 0.847 | 1.000 | | |
| BL | −0.091 | −0.115 | −0.008 | −0.015 | 0.099 | 0.228 | 0.462 | 0.772 | 1.000 | |
| GZ | −0.106 | −0.129 | −0.027 | −0.031 | 0.077 | 0.207 | 0.434 | 0.736 | 0.981 | 1.000 |
Table 3.
The highest storm surges at the coast of the Szczecin Lagoon in Trzebież in years 2008/2009−2019/2020.
Table 3.
The highest storm surges at the coast of the Szczecin Lagoon in Trzebież in years 2008/2009−2019/2020.
| No. | Date | Maximum Water Level (cm amsl) | Number of Hours with Alarm Level Exceeded 1 | Relative Water Level Rise (cm) |
|---|
| 1 | 15 October 2009 | 126 | 146 | 90 |
| 2 | 14 January 2012 | 110 | 91 | 74 |
| 3 | 5 October 2016 | 92 | 68 | 69 |
| 4 | 4 January 2017 | 107 | 63 | 71 |
| 5 | 30 October 2017 | 106 | 62 | 82 |
Table 4.
Variability of correlation coefficients (R) between variables characterizing storm surges at the coast of the Pomeranian Bay and maximum water levels in the Odra mouth area.
Table 4.
Variability of correlation coefficients (R) between variables characterizing storm surges at the coast of the Pomeranian Bay and maximum water levels in the Odra mouth area.
| | Max (SW) | Max (DZ) | Ave7 | Alarm (SW) |
|---|
| Max (TR) | 0.685 | 0.690 | 0.533 | 0.832 |
| Max (WL) | 0.630 | 0.761 | 0.626 | 0.784 |
| Max (MD) | 0.697 | 0.642 | 0.519 | 0.843 |
| Max (PD) | 0.668 | 0.605 | 0.469 | 0.770 |
| Max (GR) | 0.470 | 0.442 | 0.340 | 0.550 |
| Max (WD) | 0.105 | 0.149 | 0.083 | 0.109 |
Table 5.
Triangular matrix of correlation of water levels in the Odra River mouth area during periods with exceeded alarm sea level at Świnoujście in years 2008/09 to 2019/20.
Table 5.
Triangular matrix of correlation of water levels in the Odra River mouth area during periods with exceeded alarm sea level at Świnoujście in years 2008/09 to 2019/20.
| | SW | DZ | TR | WL | MD | PD | GR | WD | BL | GZ |
|---|
| SW | 1.000 | | | | | | | | | |
| DZ | 0.535 | 1.000 | | | | | | | | |
| TR | 0.304 | 0.521 | 1.000 | | | | | | | |
| WL | 0.283 | 0.618 | 0.971 | 1.000 | | | | | | |
| MD | 0.305 | 0.514 | 0.982 | 0.948 | 1.000 | | | | | |
| PD | 0.290 | 0.489 | 0.964 | 0.929 | 0.977 | 1.000 | | | | |
| GR | 0.250 | 0.472 | 0.947 | 0.914 | 0.974 | 0.960 | 1.000 | | | |
| WD | 0.099 | 0.351 | 0.709 | 0.701 | 0.744 | 0.748 | 0.863 | 1.000 | | |
| BL | −0.080 | 0.154 | −0.016 | 0.044 | 0.030 | 0.005 | 0.186 | 0.526 | 1.000 | |
| GZ | −0.070 | 0.162 | −0.089 | −0.020 | −0.044 | −0.067 | 0.108 | 0.448 | 0.991 | 1.000 |
Table 6.
Values of coefficients of maximum correlation between sea levels in Świnoujście and the Szczecin Lagoon and lower Odra water levels during periods with exceeded alarm sea level at Świnoujście.
Table 6.
Values of coefficients of maximum correlation between sea levels in Świnoujście and the Szczecin Lagoon and lower Odra water levels during periods with exceeded alarm sea level at Świnoujście.
| Station | R(k0) | R(kmax) | kmax(hours) | ∆R |
|---|
| TR | 0.304 | 0.495 | 7 | 0.191 |
| WL | 0.283 | 0.499 | 7 | 0.216 |
| MD | 0.305 | 0.486 | 7 | 0.180 |
| PD | 0.290 | 0.455 | 6 | 0.165 |
| GR | 0.250 | 0.422 | 7 | 0.172 |
| WD | 0.099 | 0.217 | 6 | 0.118 |
Table 7.
Triangular matrix of correlation of water levels in the Odra River mouth area during the October 2009 storm surge.
Table 7.
Triangular matrix of correlation of water levels in the Odra River mouth area during the October 2009 storm surge.
| | SW | DZ | TR | WL | MD | PD | GR | WD | BL | GZ |
|---|
| SW | 1.000 | | | | | | | | | |
| DZ | 0.929 | 1.000 | | | | | | | | |
| TR | 0.630 | 0.762 | 1.000 | | | | | | | |
| WL | 0.589 | 0.742 | 0.993 | 1.000 | | | | | | |
| MD | 0.639 | 0.766 | 0.996 | 0.989 | 1.000 | | | | | |
| PD | 0.648 | 0.770 | 0.985 | 0.975 | 0.990 | 1.000 | | | | |
| GR | 0.573 | 0.713 | 0.993 | 0.989 | 0.995 | 0.986 | 1.000 | | | |
| WD | 0.534 | 0.681 | 0.986 | 0.983 | 0.988 | 0.981 | 0.998 | 1.000 | | |
| BL | 0.200 | 0.364 | 0.794 | 0.799 | 0.796 | 0.812 | 0.835 | 0.862 | 1.000 | |
| GZ | −0.258 | −0.209 | 0.088 | 0.081 | 0.093 | 0.156 | 0.139 | 0.183 | 0.611 | 1.000 |
Table 8.
Triangular matrix of correlation of water levels in the Odra River mouth area during the February 2011 storm surge.
Table 8.
Triangular matrix of correlation of water levels in the Odra River mouth area during the February 2011 storm surge.
| | SW | DZ | TR | WL | MD | PD | GR | WD | BL | GZ |
|---|
| SW | 1.000 | | | | | | | | | |
| DZ | 0.944 | 1.000 | | | | | | | | |
| TR | 0.465 | 0.567 | 1.000 | | | | | | | |
| WL | 0.452 | 0.578 | 0.988 | 1.000 | | | | | | |
| MD | 0.443 | 0.518 | 0.974 | 0.951 | 1.000 | | | | | |
| PD | 0.365 | 0.443 | 0.963 | 0.940 | 0.994 | 1.000 | | | | |
| GR | 0.100 | 0.184 | 0.882 | 0.866 | 0.910 | 0.946 | 1.000 | | | |
| WD | −0.166 | −0.071 | 0.724 | 0.716 | 0.741 | 0.799 | 0.945 | 1.000 | | |
| BL | 0.112 | 0.095 | −0.476 | −0.456 | −0.463 | −0.516 | −0.661 | −0.724 | 1.000 | |
| GZ | 0.034 | 0.073 | −0.348 | −0.314 | −0.361 | −0.406 | −0.514 | −0.538 | 0.898 | 1.000 |
Table 9.
Triangular matrix of correlation of water levels in the Odra River mouth area during the January 2019 storm surge.
Table 9.
Triangular matrix of correlation of water levels in the Odra River mouth area during the January 2019 storm surge.
| | SW | DZ | TR | WL | MD | PD | GR | WD | BL | GZ |
|---|
| SW | 1.000 | | | | | | | | | |
| DZ | 0.962 | 1.000 | | | | | | | | |
| TR | 0.570 | 0.640 | 1.000 | | | | | | | |
| WL | 0.494 | 0.579 | 0.986 | 1.000 | | | | | | |
| MD | 0.612 | 0.688 | 0.982 | 0.970 | 1.000 | | | | | |
| PD | 0.611 | 0.685 | 0.981 | 0.968 | 0.999 | 1.000 | | | | |
| GR | 0.576 | 0.654 | 0.980 | 0.970 | 0.994 | 0.995 | 1.000 | | | |
| WD | 0.548 | 0.622 | 0.976 | 0.971 | 0.984 | 0.987 | 0.996 | 1.000 | | |
| BL | 0.268 | 0.349 | 0.891 | 0.922 | 0.868 | 0.870 | 0.897 | 0.918 | 1.000 | |
| GZ | 0.349 | 0.406 | 0.737 | 0.766 | 0.718 | 0.720 | 0.746 | 0.756 | 0.856 | 1.000 |


