Article

Aerosol Light Absorption at 1064 nm: Pollution Sources, Meteorological Parameters and Gas Pollutants in Qingdao Coastal Area, China

1
Key Laboratory of Atmospheric Optics, Anhui Institute of Optics and Fine Mechanics, HFIPS, Chinese Academy of Sciences, Hefei 230031, China
2
Science Island Branch of Graduate School, University of Science and Technology of China, Hefei 230026, China
3
Advanced Laser Technology Laboratory of Anhui Province, Hefei 230037, China
*
Authors to whom correspondence should be addressed.
Atmosphere 2021, 12(12), 1553; https://doi.org/10.3390/atmos12121553
Submission received: 17 October 2021 / Revised: 10 November 2021 / Accepted: 20 November 2021 / Published: 24 November 2021
(This article belongs to the Special Issue Atmospheric Aerosol Optical Properties)

Abstract

:
A two-month sampling campaign was carried out from 1 November to 30 December 2019, to investigate the light absorption of aerosols at coastal sites in Qingdao. The average values and standard deviations of the absorption coefficient (OAC) at λ = 1064 nm during the measurement period were 18.52 ± 13.31 Mm−1. Combined with the backward trajectory model, the aerosol absorption coefficient and gas pollution concentration of six possible air mass trajectories were obtained and calculated. The maximum absorption coefficient of local air masses was approximately 20.4 Mm−1 and anthropogenic pollution originated from mainly local sources in the Jiaozhou area. In our measurements at this site, the results also showed that there was a positive correlation between relative humidity (RH) and aerosol absorption. Without considering other factors, the size of aerosol particles grew with the increasing of RH, which changed the nonlinear relationship between the size and the absorption cross section of aerosol particles subsequently. In addition, the correlations between gas pollutants and OAC were calculated. The atmospheric environment is complex in sea–land intersection areas, especially in coastal cities. Analysis of various aerosol sources, meteorological conditions, and gas precursors enhances the study of aerosol optical absorption.

1. Introduction

Aerosol light absorption plays an important role in the Earth’s radiation budget in terms of direct and semidirect radiative forcing [1,2,3,4]. In addition, it is responsible for climate change and visibility impairment through the scattering and absorption of solar and terrestrial radiations at regional and global scales [5,6]. The characteristics of aerosol light absorption are largely dependent on its size and chemical composition [7,8,9], which are further modified by several factors, including aerosol sources, morphology, and secondary aerosol production [3,10,11]. Over the past several decades, massive quantities of pollutants have been unavoidably emitted into the atmosphere in China due to the rapid development of urbanization and industrial activities [12]. However, little attention has been paid to aerosol light absorption by direct measurement, especially in coastal cities of China.
Aerosols can be divided into anthropogenic aerosols and naturally produced aerosols according to their sources, of which anthropogenic aerosols are primarily from biomass burning and fossil fuel combustion in power plants/vehicles [13,14]. Ref. [15] separated aerosols into three quasi-independent classes: maritime sea salt, dust, and anthropogenic aerosols. Aerosols with anthropogenic characteristics can also result from natural sources such as naturally occurring forest fires, volcanic eruptions, and the emission of dimethyl sulfide from biological sources [16]. Carbonaceous aerosols include anthropogenic aerosols, which consist of two major components: black carbon (BC) and organic aerosol (OC) [17]. Both BC and OC are predominantly the result of traffic and wood burning, particularly in urban areas during wintertime, when biological and photochemical activities are negligible [18]. Therefore, major efforts to assess aerosol characteristics have focused on urban fields [19,20,21,22,23]. Dust aerosols derived from the Gobi and Tengger Deserts in northwest China [24,25] are dominant components of natural aerosols in the atmosphere. The effects of aerosols are also closely related to their physical properties and diameter, and the dominant component in the desert is always larger dust particles [25]. Sea salt is estimated to account for ~30% of global aerosol optical depth [26]. One important aspect of atmospheric sea salt requiring further research is its mixing with gaseous pollutants [27].
East Asia is a prime candidate region for the study of these topics due to extensive issues with air pollution and numerous growing coastal megacities in this area. One such coastal megacity is Qingdao, China, with a population of 10.07 million [28]. Qingdao is located on the southeast coast of Shandong Peninsula and east of Jiaodong Peninsula, bordering the Yellow Sea and facing the Korean Peninsula across the sea. Atmosphere aerosols in the coastal area of Qingdao are affected by many polluted air masses originating from different sources.
Aerosols affect the Earth’s radiation balance and climate change by absorbing radiation from the sun and the Earth. However, there is no clear understanding of aerosol light absorption in different regions, especially in coastal cities. Although many studies have focused on aerosols under urban conditions worldwide [19,20,21,22,23], aerosol light absorbing properties in coastal areas still need to be analyzed comprehensively and systematically. In this paper, directly measured data of the aerosol light absorption coefficient on the Qingdao coast from 1 November to 30 December 2019, are presented. A homemade photoacoustic spectrometer (PAS) and optical particle counter (OPC) were used to measure the aerosol light absorption coefficient and size distribution. Air mass back trajectories were used to identify the sources of aerosols. Meteorological data (including relative humidity and wind) and the composition of pollutant gases (SO2, NO2, CO, O3) were combined to determine the effects of meteorological factors and gas precursors on aerosol light absorption. The aims of this study were to gain insights into the light absorption characteristics of coastal aerosols in the near-infrared band (1064 nm) and their influencing factors, such as pollutant sources, precursor gases, and meteorological parameters.

2. Methodology

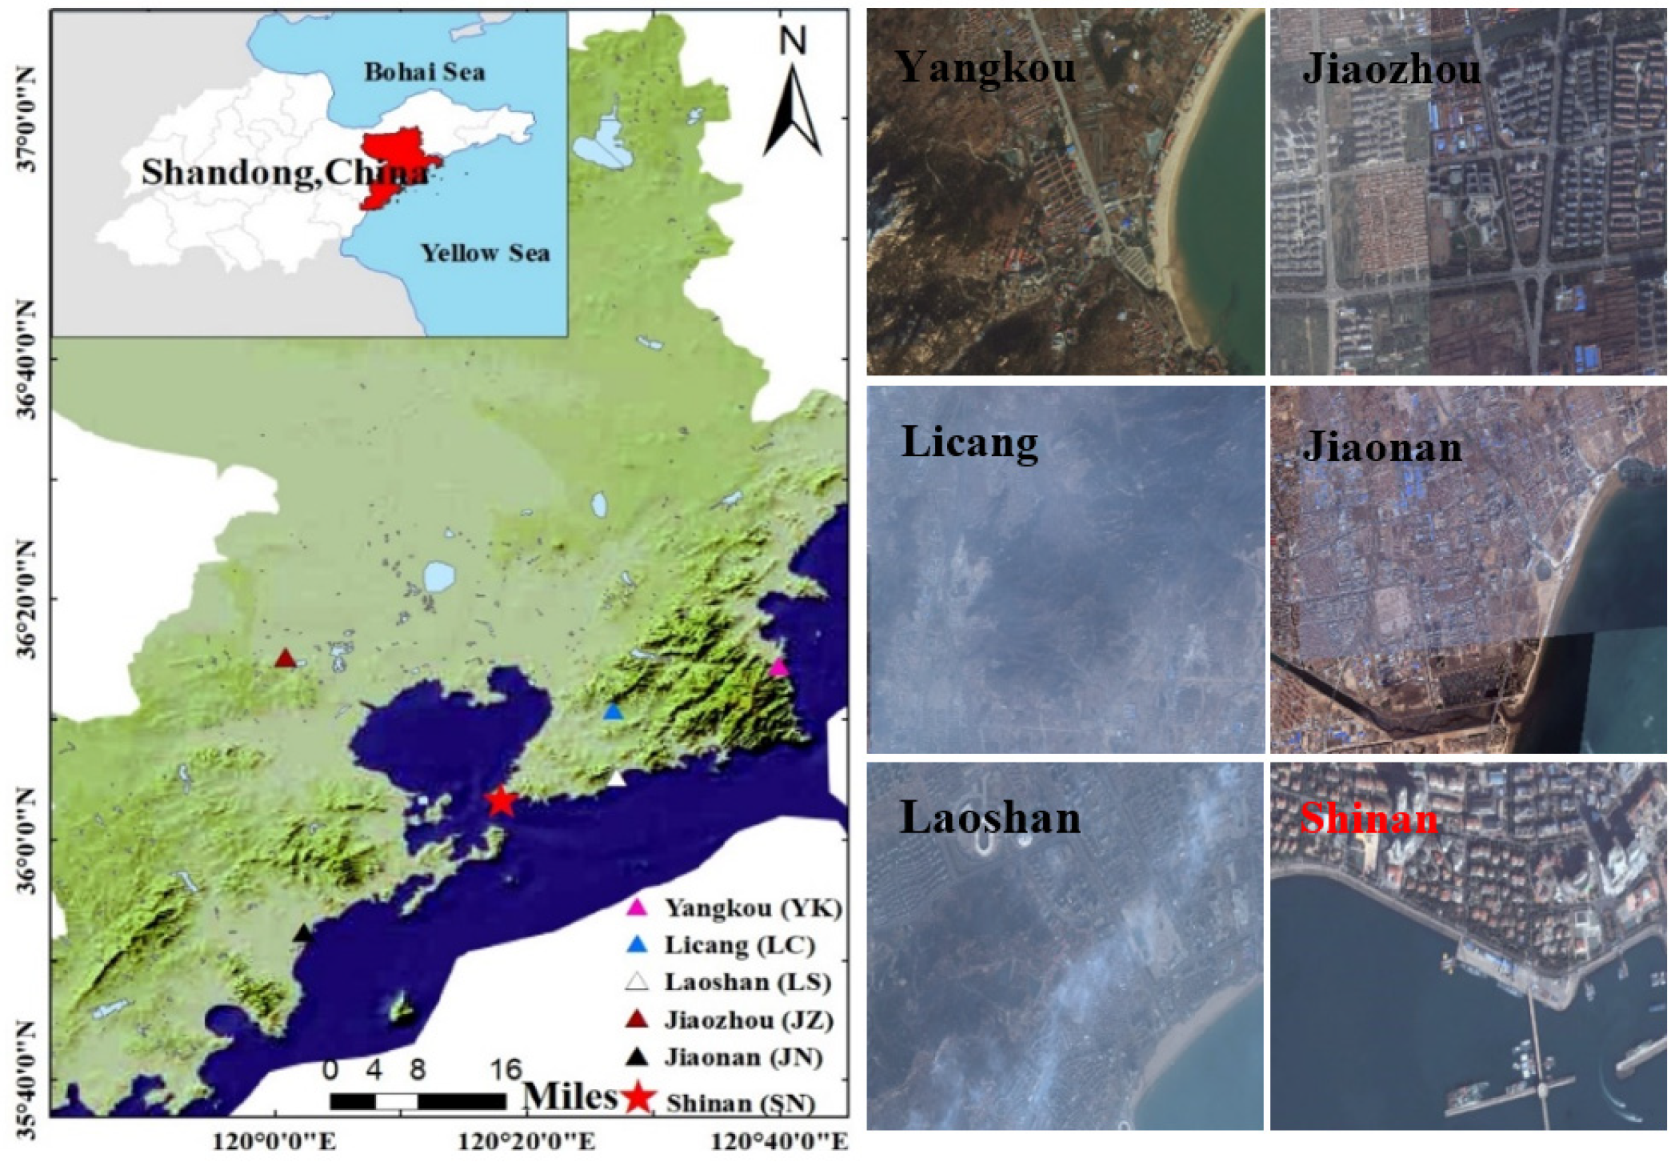
2.1. Measurement Site

The observation site is located in the port of Qingdao (36°2′60″ N, 120°17′60″ E), which is surrounded by the sea and residential districts with no intense industrial activities nearby. As a typical sea–land intersection city, Qingdao is affected by both ocean and land climatic environments. The automatic weather station, which consists of a WXT526 (Vaisala, Helsinki, Finland) multifunctional weather sensor and data collector, can automatically collect, store, and convert six kinds of meteorological data, namely, wind speed, wind direction, precipitation, pressure (P), temperature (T), and relative humidity (RH). Visibility was observed with a visibility monitor (Belfort, Maryland, USA). The sampling rates of the automatic weather station and visibility monitor were 5 s and 1 min, respectively. Air quality data of the six national meteorological stations, namely, Jiaonan (JN), Jiaozhou (JZ), Laoshan (LS), Licang (LC), Shinan (SN) and Yangkou (YK), were obtained as auxiliary sets (Figure 1). Among them, the Shinan meteorological station is closest to the measurement location, and approximate pollutant data can be obtained and used.

2.2. Instrumentation Deployment and Data Processing

The aerosol light absorption coefficient (OAC) was measured by a homemade photoacoustic spectrometer (PAS) operating at 1064 nm. The data acquisition rate of the equipment was 1 Hz, and the detection sensitivity was better than 0.5 Mm−1 at an average of 100 s. The flow rate was controlled at 0.6 L/min to reduce the influence of flow noise. The details of the scheme and performance of the device have been published previously [29,30,31]. A homemade optical particle counter (OPC) based on the light scattering characteristics of particles, having 90 s data acquisition, was used. When aerosol particles pass through the illumination area, the scattered light signal is received by the photomultiplier tube and converted into an electric pulse. The particle size (optical equivalent particle size) is determined by the amplitude of the electric pulse, and the particle concentration is determined by the counting of the electric pulse. The sample flow rate was 300 mL/min, and particles with diameter (D) of 0.2 to 12 μm were measured. The OPC was calibrated with standard polystyrene spheres before measurement. The details of the device have been presented previously [32,33]. The aerosol particle sampling ports of PAS and OPC equipment were placed 2 m above the ground. The meteorological station and visibility meter were fixed at a height of about 6 m from the ground to complete the monitoring of meteorological parameters and visibility. All measuring equipment was integrated into a centralized platform for observation of atmospheric parameters.
The field campaign was conducted from 1 November to 30 December 2019. Aerosol properties, including the absorption coefficient, size distribution, and meteorological parameters, were measured simultaneously. Gaseous pollutants, including SO2, NO2, CO, O3, PM2.5, and PM10, were obtained from the national air quality monitoring station in Qingdao. In this work, the time resolution of the data obtained by each device is different; for the convenience of analysis, data averaged over one hour were used.

3. Results and Discussion

OAC with one hour averaging is shown in Figure 2. Size segregated particulate concentrations (PM2.5, PM10) and gaseous pollutant concentrations (NO2, O3, SO2, and CO) were studied together with meteorological data (T, RH, and visibility) which helped us to better understand the observed variations during the field campaign. Visibility, a visual indicator of air quality [34], is also presented in Figure 2. The average visibility (±1 standard deviation) was 17 ± 12 km, varying from 0.4 to 65 km, indicating that an unstable atmospheric environment frequently occurred during the sampling period. The mass concentrations of PM2.5 and PM10 were 31 ± 26 μg/m3 and 83 ± 52 μg/m3, respectively. In addition, from November to December, T decreased with seasons, and RH varied from 35% to 85%. As important reactants of photochemical reactions, a strong negative correlation between O3 and NO2 is also shown in Figure 2. The mean concentrations of SO2 and CO were 2.45 and 632 ppb, respectively, which were lower than the national annual average values of 2.8 ppb and 1.2 ppm. A large number of studies on aerosol light absorption, including this study, are listed in Table 1. As seen in Table 1, devices used to obtain aerosol absorption coefficients mainly include PASs, aethalometers, and particle soot absorption photometers (PSAPs). In addition, the previous research objectives were mainly focused on the visible light band. From the comparison, it can be found that the light absorption coefficient of urban aerosols was the largest, whereas the absorption intensity of dust aerosols and marine aerosols was far less than that of urban aerosols. Urban aerosols have been an important part of many previous studies, but the absorption properties of aerosols at the confluence of land and sea rarely have been mentioned. Therefore, we need to study the aerosol optical properties in the sea–land intersection area to enhance the understanding of aerosol optical properties in coastal areas.

3.1. Regional Source

The Hybrid Single-Particle Lagrangian Integrated Trajectory model (HYSPLIT) has proven useful for exploring air particle trajectories, in addition to complex transport, dispersion, chemical transformation, and deposition simulations [40]. In this study, 36 h backward trajectories ending at 10 m above ground level were performed at 4:00, 10:00, 16:00, and 22:00 every day using data from the National Oceanic and Atmospheric Administration (NOAA). The resulting backward trajectories were then subjected to cluster analysis, producing six clusters (Figure 3a). According to the results of the backward trajectory model, the proportions of six kinds of air masses during the statistical measurement period were 31%, 19%, 26%, 15%, 4%, and 6%, respectively. Air mass 1 accounted for the largest proportion. It mainly reflected the local input and was also the top source of pollution in Qingdao. Clusters 2 and 3 in northern China contained fewer trajectories than local air masses and were also important sources for assessing the pollution level of sites. The air masses in Clusters 4 and 5 originated from long-distance transport in central and northern Asia. Marine air Cluster 6 was transported from the Yellow Sea to the measurement site at a lower transport height. All air masses were at relatively low altitudes (<1500 m) and remained within the boundary layer over this 36 h period. Figure 3b displays the concentrations of gaseous pollutants (SO2, CO, NO2, PM2.5, and PM10). According to the calculation results, from air mass 1 to air mass 6, except PM10, the concentration of all pollutants decreased in turn. The concentration of PM10 in air mass 5 was only lower than that in air mass 1, although the concentration of other pollutants, including PM2.5, remained at a very low level. In Figure 3a, the concentration of air mass 5 was the highest in the coarse-sized section (diameter > 4 μm), which was consistent with the change in PM10. This may be because air mass 5 came from the long-distance transported dust air mass in the desert area of Inner Mongolia, and the dust aerosol contained in the dust air mass usually has a large particle size [24]. As shown in Figure 3c, the aerosol absorption coefficient measured and calculated by us was highly consistent with the variation of various pollutants.
The aerosol absorption coefficients of various pollution sources were in the order of local source, pollution source from the middle and north of China, long-distance transportation source, dust source, and marine source. Among these, the local source contained the highest concentration of pollutants, and the absorption coefficient was the largest at 20.4 Mm−1. In addition, the absorption intensity of the aerosols transported from the central and northern regions of China was second only to that of the local sources because they may come from the heavily polluted areas of China. Long-distance transportation also brought some dust sources to the Qingdao coast, although the proportion of such sources was very low. It is also obvious that the sampling area was affected by marine air masses. The number of marine air masses (15%) was higher than that of dust air mases (6%), whereas its absorption coefficient was weaker than that of dust air mass, which was probably because the absorption of sand dust aerosols was weaker than that of marine aerosols.

3.2. Wind Dependence of Local Gas Pollutants

From the above analysis, it can be seen that the measurement site was affected by both local and regional sources. As the most important source of pollution in Qingdao, local sources must be further analyzed. Figure 4a–f shows the wind speed and direction dependence map of gas concentration and RH at the measurement site. To assess the sources of components of local pollution, the concentration of pollutants obtained from six meteorological stations in Qingdao is also shown in Figure 4g–j. The locations of the six meteorological stations are shown in Figure 1. As shown in Figure 1, Yangkou station is located in the northeast of the sampling point (Shinan district), and its surrounding area is mainly covered by human settlements and coastlines, with a small number of plants. The area of Licang station is mainly inhabited by plants and human beings. Laoshan station is situated east of the sampling point, and its surrounding area is inhabited by plants, human beings, and coastlines. Jiaozhou is primarily a human settlement in Qingdao that is an important possible source of pollution. As shown in Figure 1, it lies in the northwest of the sampling site. Jiaonan station is located in the southwest of the sampling point, surrounded by a dense human population and coastlines. It is worth noting that our sampling point is very close to the Shinan meteorological station. Here, we consider that the two places are in approximately the same area to facilitate the analysis of pollutant sources.
The prevailing wind direction is NW in winter for Qingdao (Figure 4e). SO2 emissions are mainly due to domestic heating and coal combustion in power plants in the winter [41,42]. High SO2 concentrations could be detected only in the NW sector and SW sector under westerly wind directions. Heating in the winter may be the reason why the concentrations of SO2 in these two directions were higher than those in other directions. Relating to the average concentration of SO2 measured at the six weather stations shown in Figure 4g, it is highly possible that the NW source was Jiaozhou and the SW source was Jiaonan. The wind dependency maps of NO2 and CO are also shown in Figure 4b,c. Similar to SO2, NO2 and CO were mainly affected by the wind from the NW and SW directions. Especially in the NW directions, the concentration of pollutants (SO2, NO2 and CO) was high under low wind speeds (<2 m∙s−1) but decreased when the wind increased to 6 m∙s−1. For wind speeds lower than 6 m∙s−1, the local dilution of pollutants became more effective with rising wind speed, whereas transport may also stem from locations farther away. When the wind speed further increased, gas pollutant concentrations should have decreased; thus, the increase instead indicated sources of pollutants situated in those directions, which suggests that under persistent slow wind, pollutants were being transported from regions lying in those directions and increased in Shinan due to the addition of regional sources (Jiaozhou) to local sources. In the W and SE directions, when the wind speed reached 4 m∙s−1, the concentration of NO2 decreased, which indicates that the wind from the SE may bring fresh pollution-free gas. Relating to the location, the source from the W and SE directions may come from the sea. It can be seen from the location of the sampling point in Figure 1 that the marine environment mainly affects the measurement location through the wind direction from the south. Therefore, the RH distribution in the south was also significantly higher than that in the west (Figure 4d). O3 (Figure 4f) was a relatively well mixed trace gas under low wind speeds. When the wind speed increased, the southerly wind brought higher O3. In contrast to other pollutants, the concentration of O3 was higher along the coast. Licang and Jiaozhou are far from the ocean, which made the O3 concentration the lowest (Figure 4j). These results show that human activities in the Jiaozhou area may be an important source of local pollution. In addition, the marine environment and surrounding pollution may add more pollution components to local sources under high wind speeds.

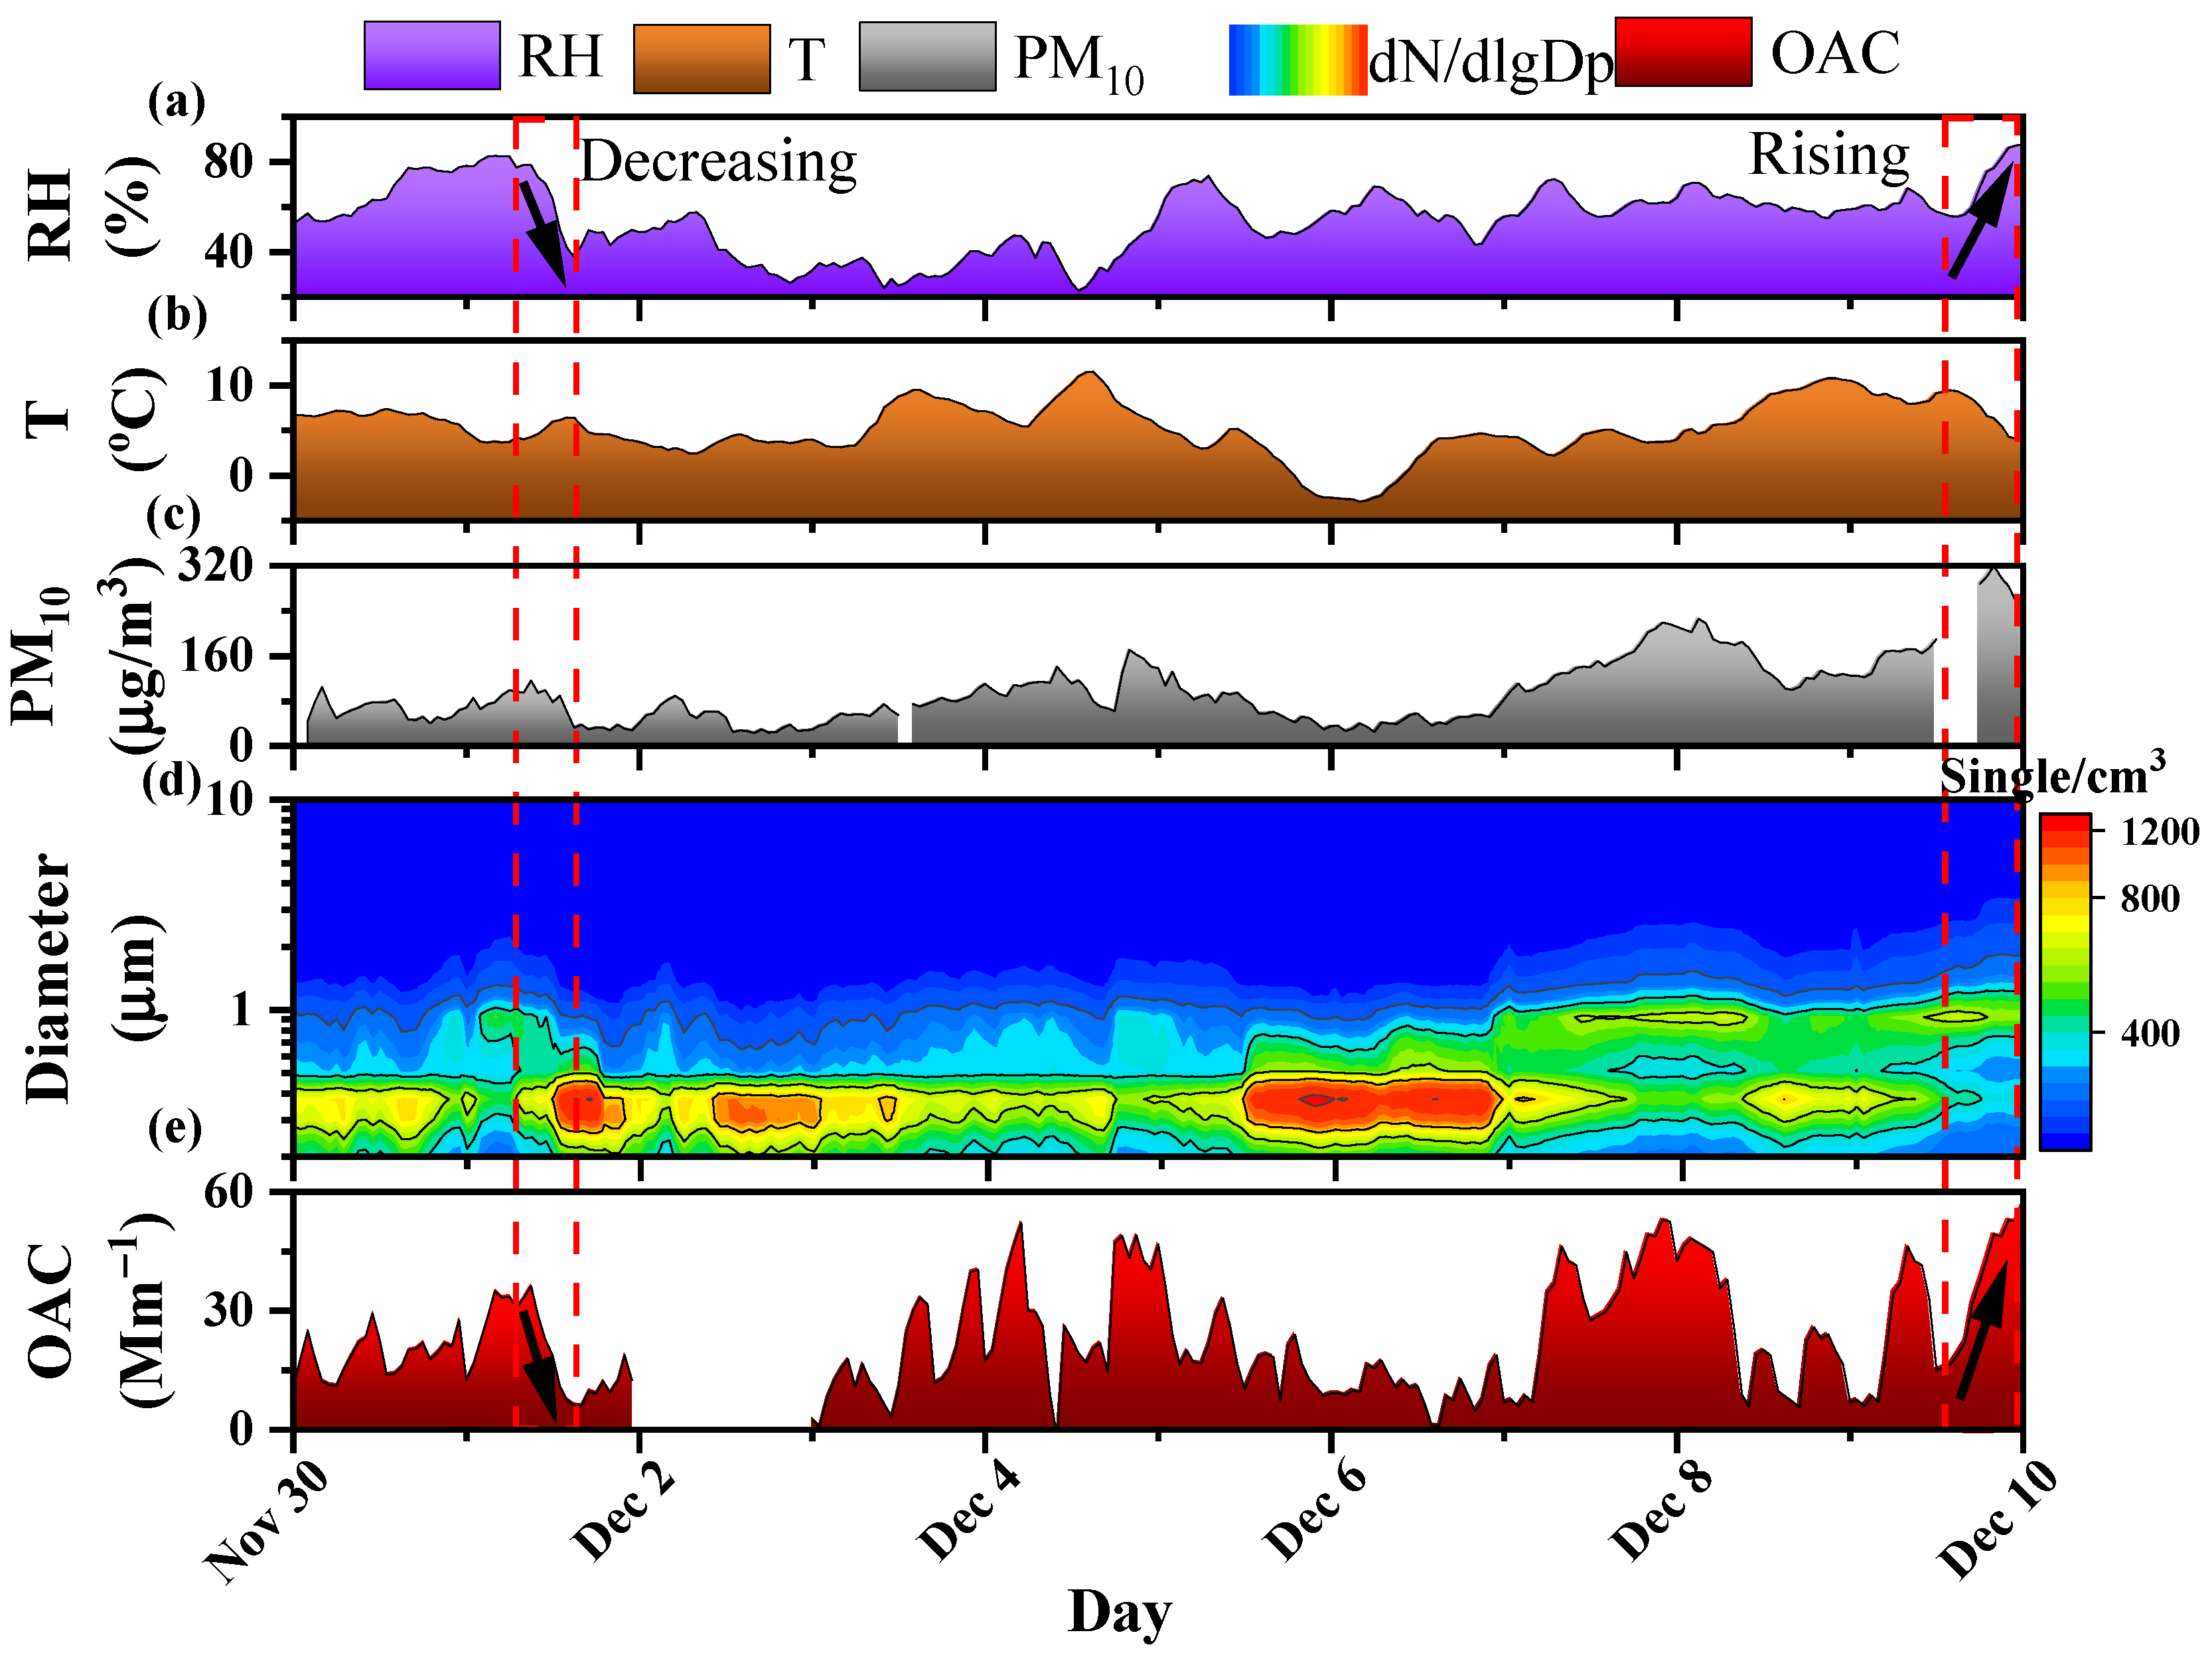
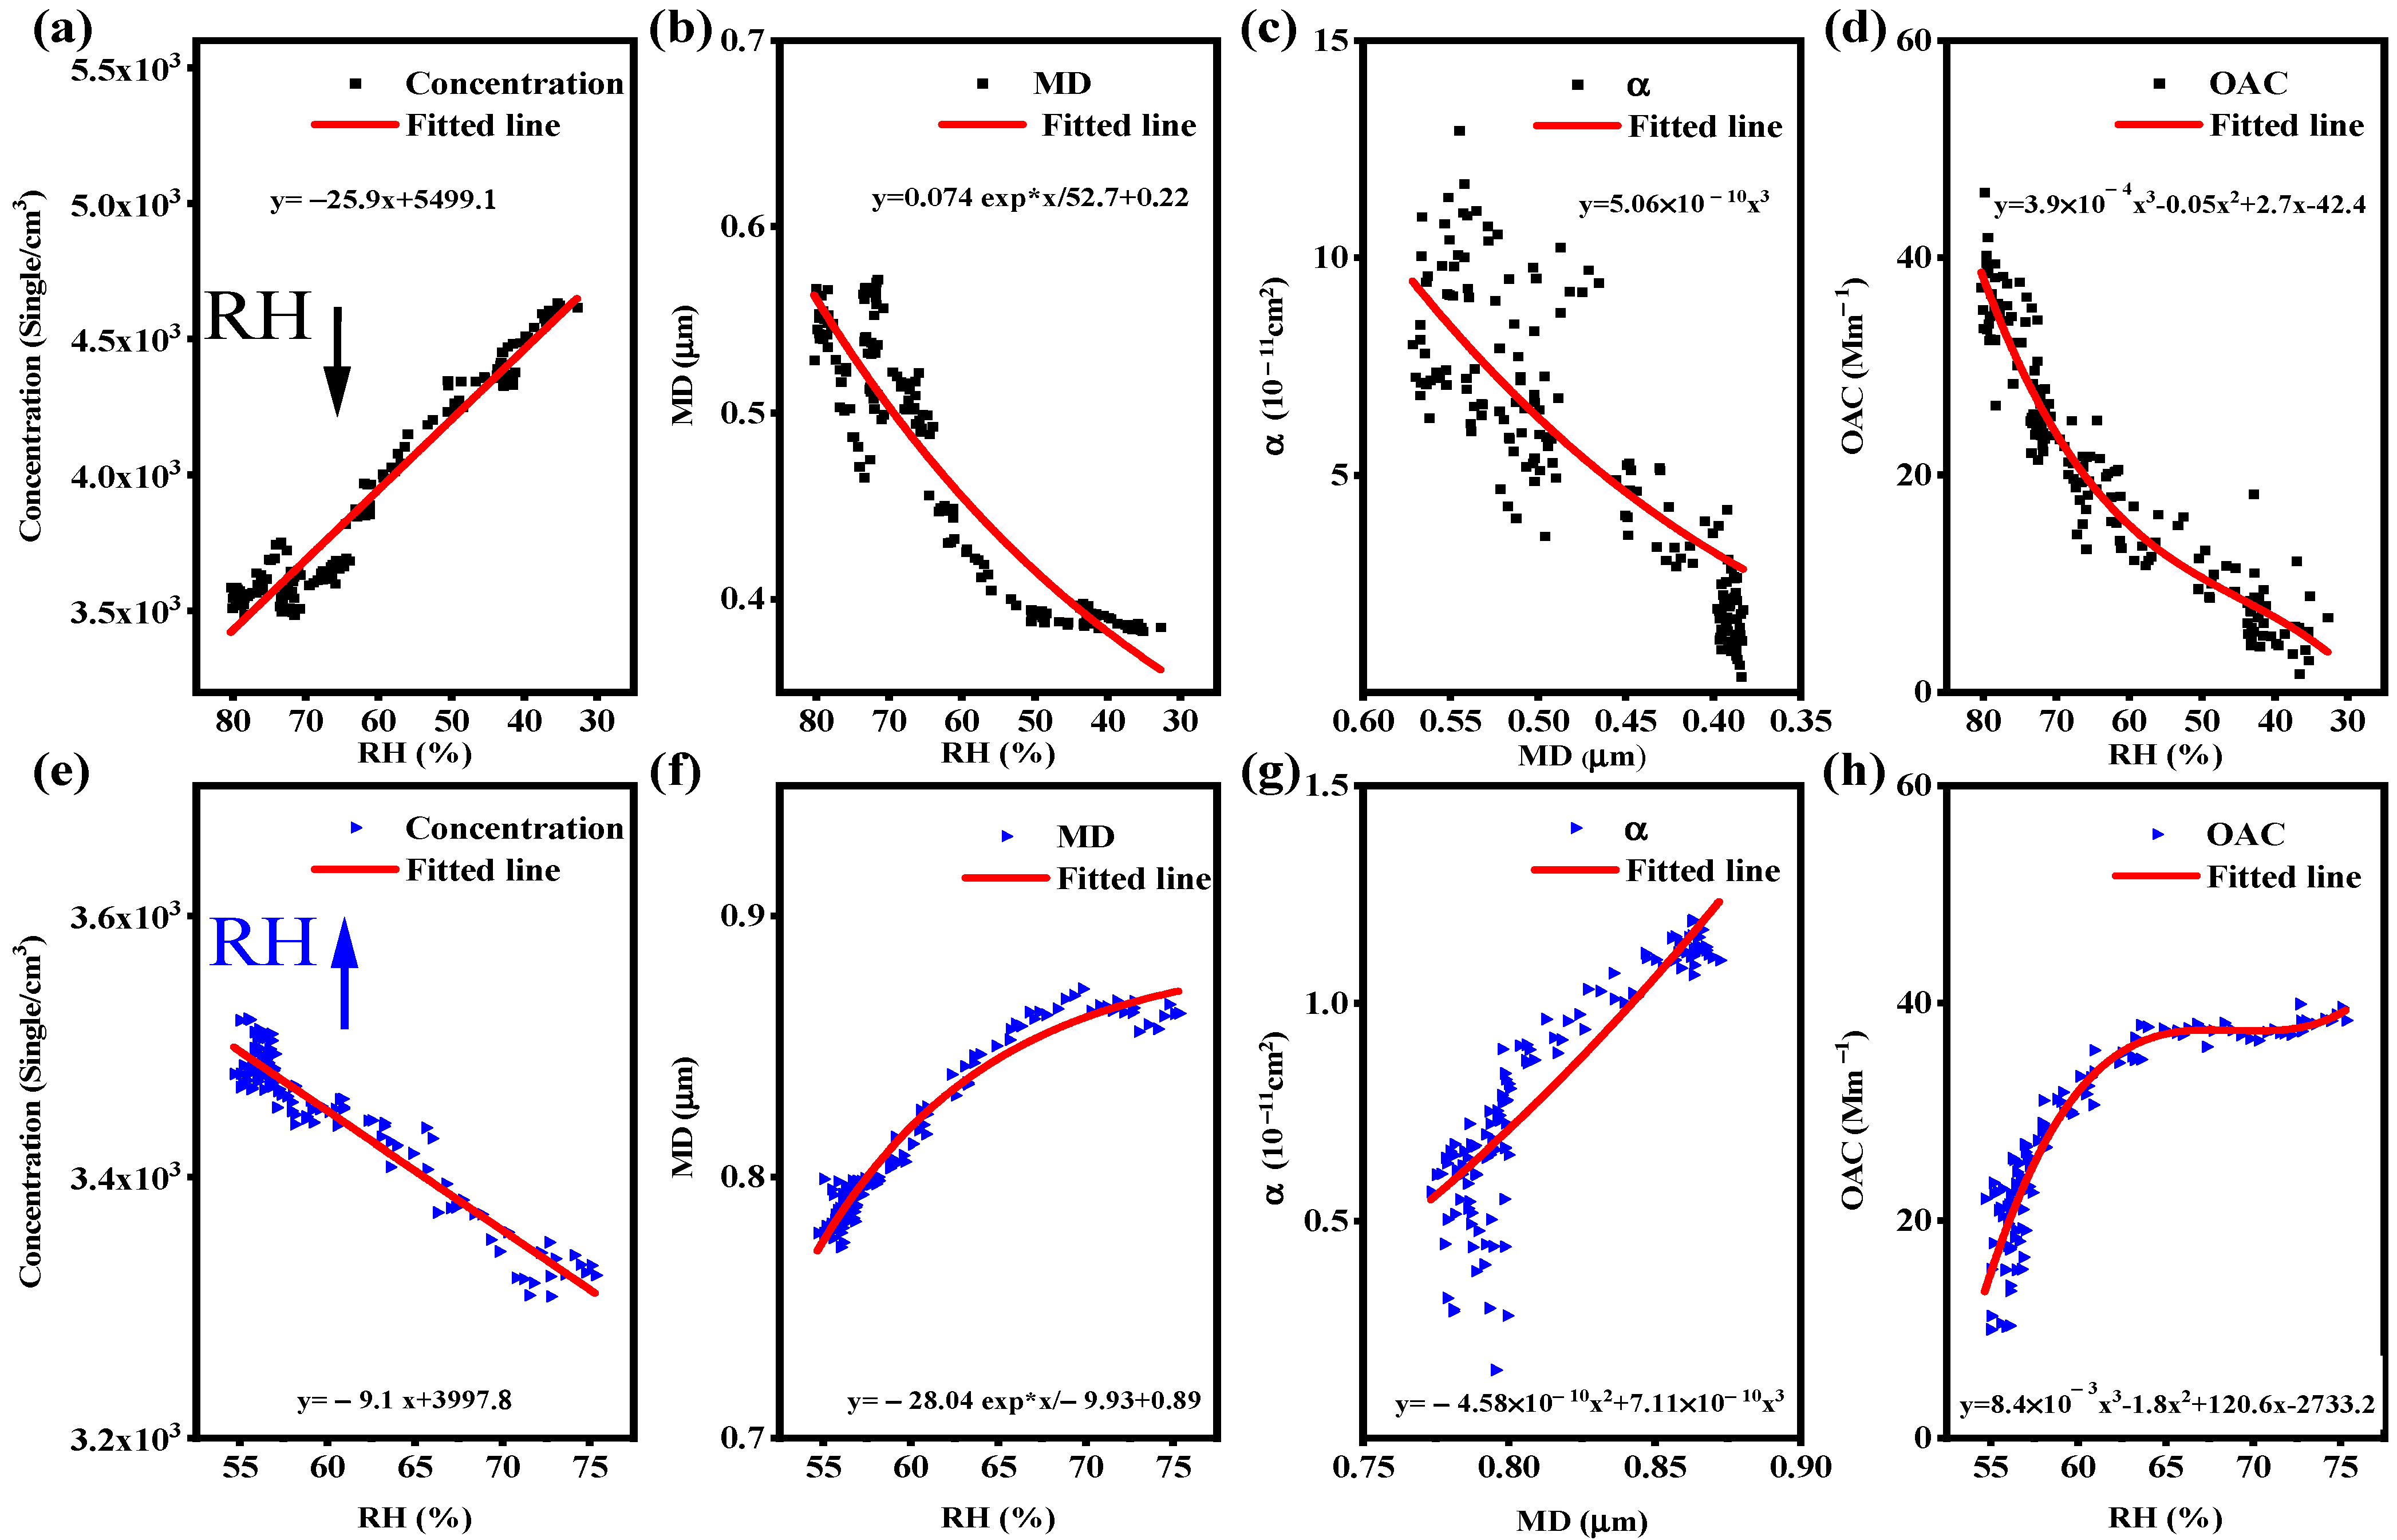
3.3. Meteorological Influence on OAC: Relative Humidity

Aerosols enlarge their size by attaching water vapor on the surface of particles and then affect light absorption and atmospheric visibility [43,44]. To gain preliminary insights into the impacts of RH on aerosol light absorption, the visibility and OAC plotted against PM10 color under different RHs are presented in Figure 5. It can be clearly seen in Figure 5a that when PM10 mass concentrations were below 200 μg/m3, the variation in visibility was sensitive to PM10, and when PM10 was higher than 200 μg/m3, visibility showed a low relevance to PM10. Furthermore, the relationship no longer followed an exponentially decreasing trend when RH > 80%. In particular, when RH was higher than 80%, the visibility was mostly kept below 10 km. This was in good agreement with the conclusion of the early literature [34,44,45]. The aerosol mass absorbing efficiency (Eabs), the ratio of OAC to PM10 mass concentration, is also shown in Figure 5b and depends on several factors, including particle size, chemical composition, morphology, RH, and the wavelength of light [25]. Although Figure 5 shows the obvious positive correlation dependence of aerosol mass absorption efficiency with RH, the influence mechanism of RH on light absorption is not clear. Therefore, we performed the following specific analysis.
The temporal variations in RH, T, PM10, aerosol particle number size distribution, and OAC from 30 November to 10 December, 2019, are presented. To avoid the influence of rainfall on RH, we chose to analyze the influence of RH on OAC in the period of 1 December to 9 December, 2019. When RH decreased from 85% to 35%, the changes in T and PM10 were not obvious. However, the particle size distribution changed significantly and the aerosol absorption coefficient decreased sharply. Similarly, the increase in RH was accompanied by a series of variations, as shown in Figure 6.
As shown in Figure 7a, the particle number concentration exhibits a clearly increasing trend of approximately 500 cm3 for every 20% in RH during the decrease process, which is mostly due to the reduction in RH promoting the formation of new particles in ambient air. The change in aerosol particle size is an important reason for the effect of RH on aerosol optical properties. We can see the exponential relationship between the particle mean diameter (MD) and RH in Figure 7b. Here, for the convenience of fitting, we regard aerosol particles as spherical particles, although this is not entirely accurate. Considering the possible relationship between aerosol particles and absorption cross section [46], we used a cubic nonlinear curve to fit the particle diameter and absorption cross section to obtain the fitting line shown in Figure 7c. OAC, as the most intuitive embodiment of the influence of RH on aerosol physical properties, is also shown in Figure 7d. With increasing RH, adverse variations in particle number concentration, MD, absorption cross section, and even OAC are also shown in Figure 7e–h. The growth in the particle diameter results in the increase in the absorption cross section and OAC. In addition, the drop in RH may lead to the gradual dispersion of aerosol clusters into small particles, as the particle size of aerosol particles decreases and the total number of aerosol particles increases in a short time. In a certain range of particle sizes, the absorption cross section drives aerosol absorption to decrease. In conclusion, RH and aerosol absorption maintain a positive correlation in a certain range of aerosol particle sizes. Whether RH rises or falls, the shift of RH on aerosol absorption may be affected by changing the particle size of aerosol particles.

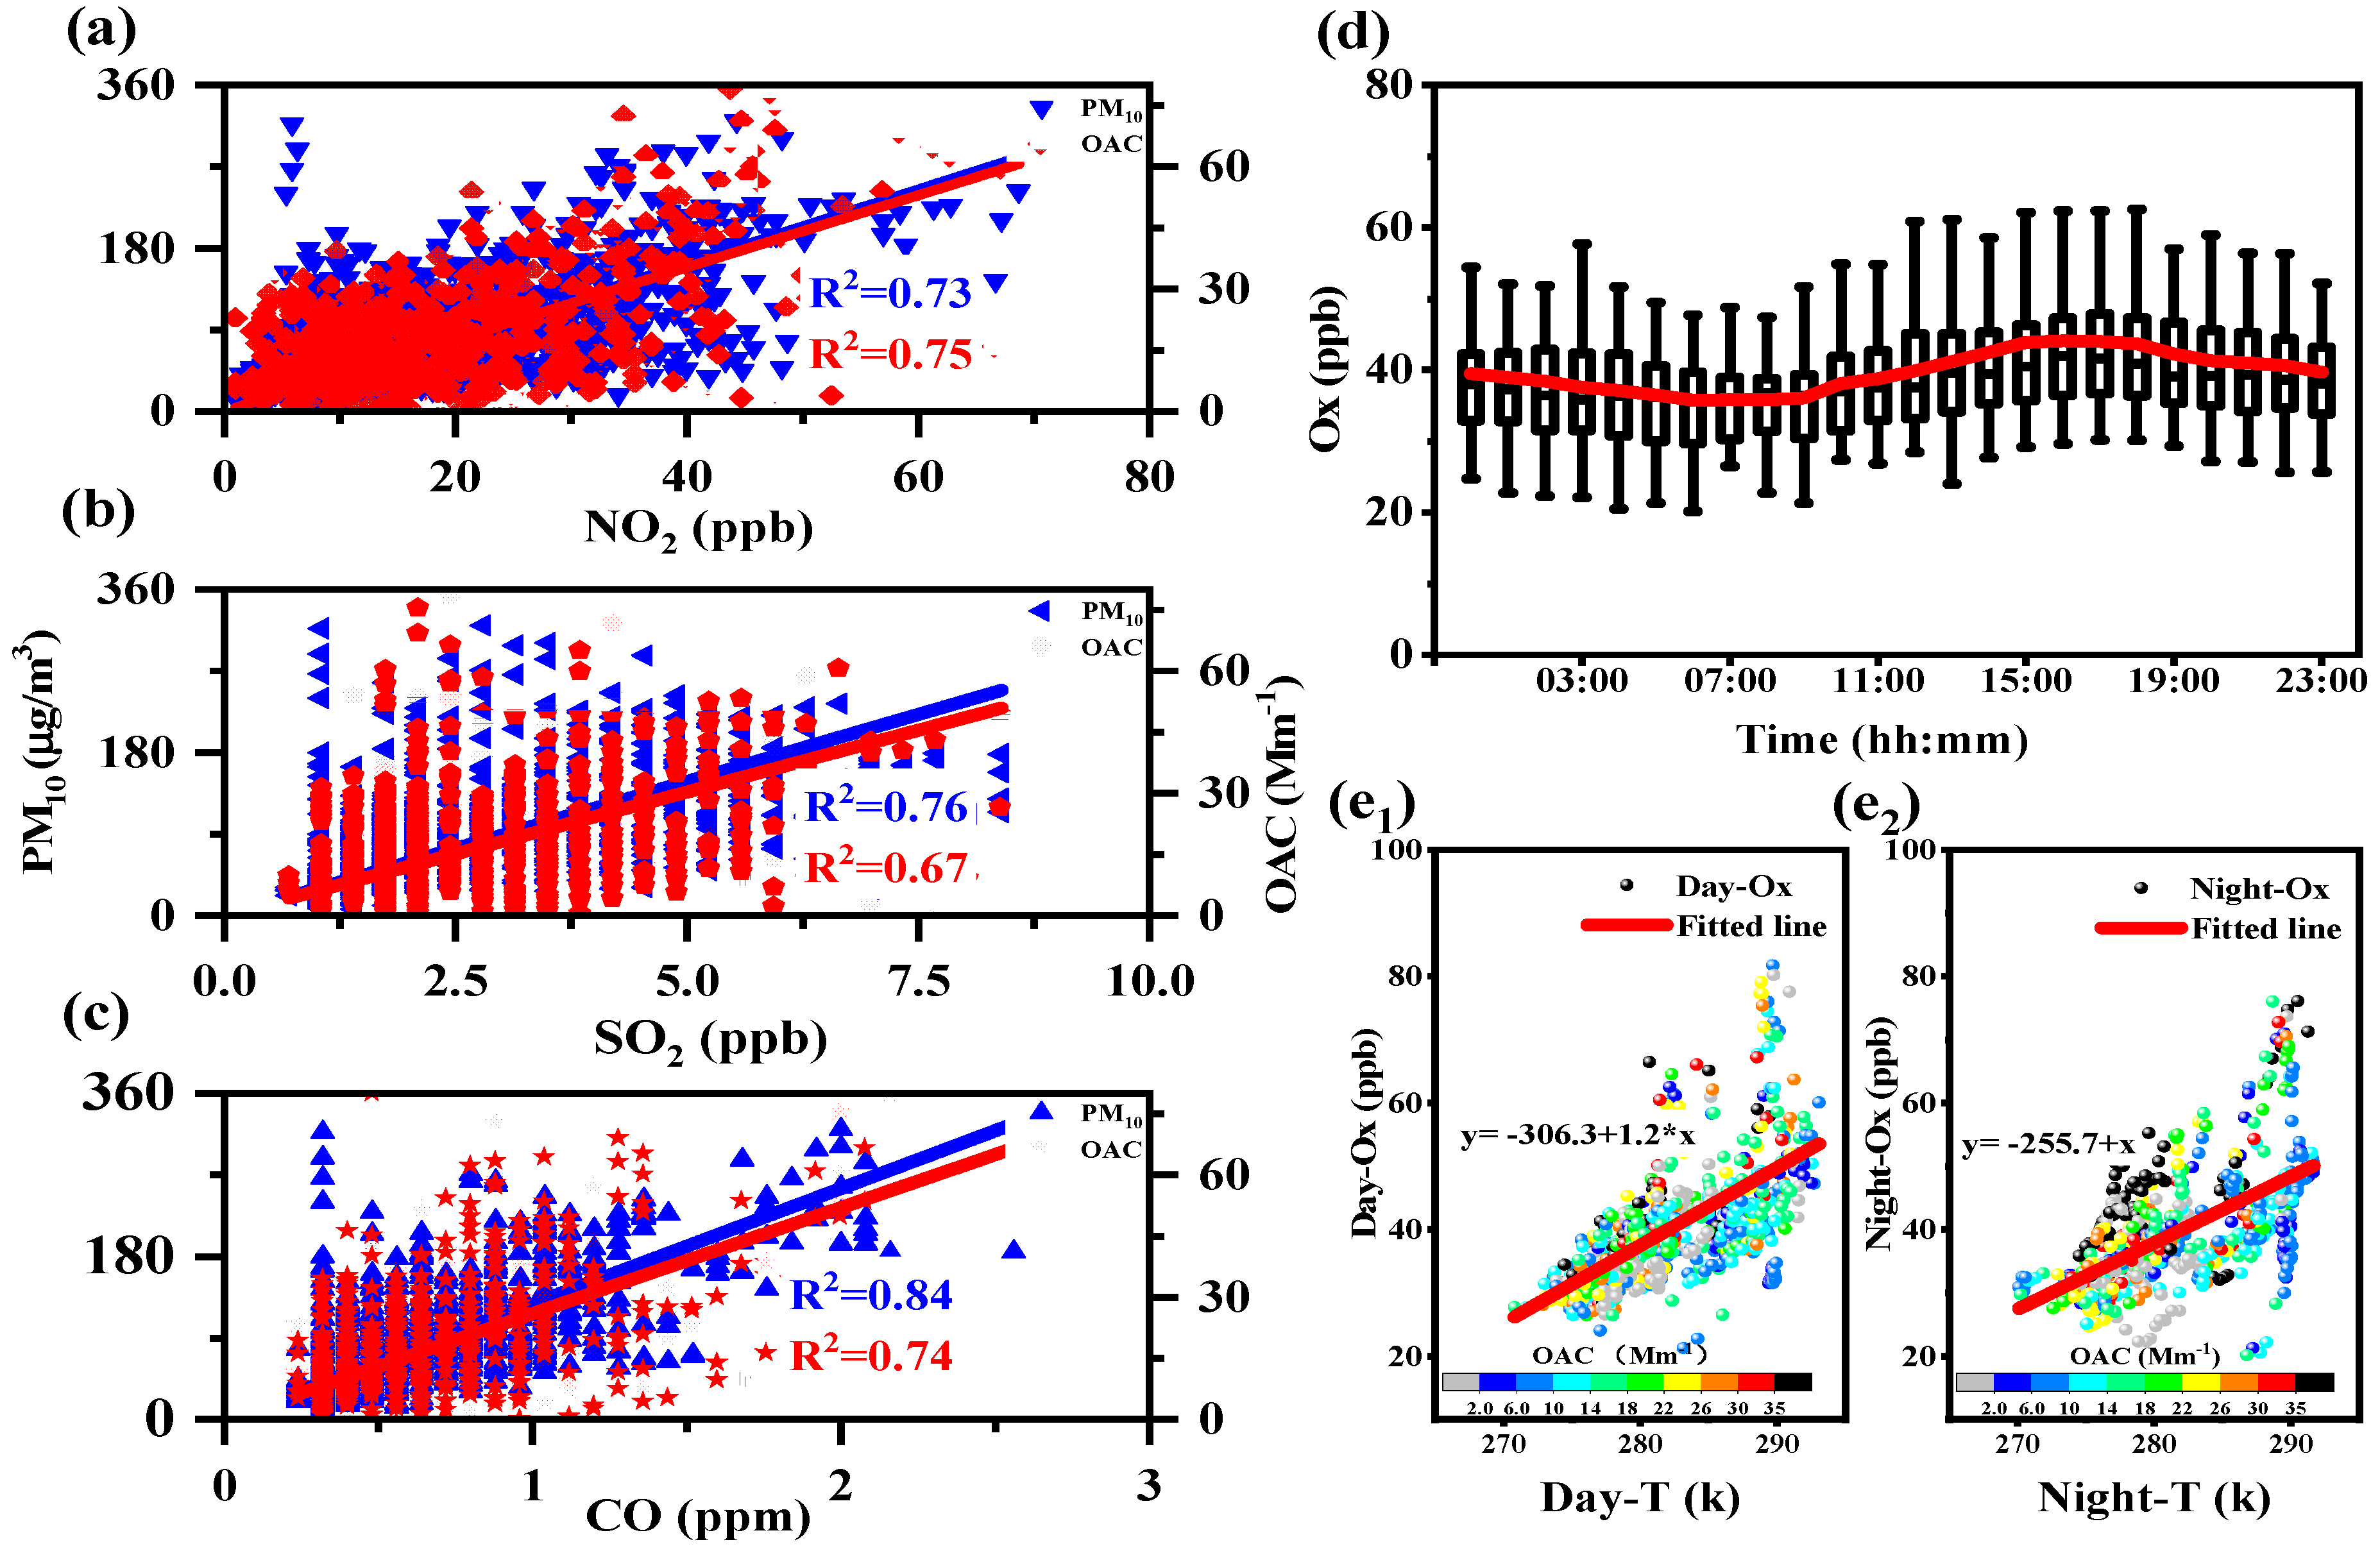
3.4. Trace Gases and Photochemical Oxidants on OACs

Atmospheric trace gases (SO2, NO2, CO) not only affect environmental governance but are also precursors of secondary aerosols [47]. Ozone (O3) plays an important role in aerosol aging and is formed by photochemical reactions involving nitrogen oxides, volatile organic compounds, and carbon monoxide [48,49]. Therefore, it is necessary to analyze the contribution of atmospheric pollutants to aerosol light absorption. The average concentration of SO2 was only 2.45 ppb, which was lower than the national average of 3.85 ppb, indicating that SO2 was not the major gaseous pollutant emitted on the Qingdao coast. As shown in Figure 4g, the maximum value of SO2 appeared between 9:00 a.m. and 10:00 a.m., which was probably due to the short-term increase in SO2 concentration caused by traffic emissions [50]. There was almost no obvious difference between NO2 and CO in the diurnal variation trend, so we can infer that NO2 and CO had similar emission sources. O3 shows an obvious diurnal variation in Figure 4j, reaching its maximum value at approximately 15:00.
Figure 8a–c demonstrates the linear relationship between gaseous pollutants and PM10 and OAC. Significant dependences between gaseous pollutants and PM10 were observed with correlation coefficients (R2) higher than 0.7. As precursors of nitrate and sulfate, the correlations between NO2 and PM10 were predictable, which corroborated the correlation coefficient of 0.75 between NO2 and OAC shown in Figure 8a. Similarly, as an important precursor of secondary inorganic aerosols, SO2 also has a strong correlation (R2 = 0.67) with the aerosol absorption coefficient (Figure 8b). By comparison, although CO could not act as a precursor of secondary aerosols, we still found its high correlation with PM10 (R2 = 0.77). This is because the variation tendency of CO highly resembles that of NO2, as stated above, which indirectly links CO to PM10. In addition, studies have shown that CO is highly correlated with organic aerosols, and CO is regarded as representative of organic aerosols caused by biomass combustion [51]. The dependence between CO and OAC shown in Figure 8c may be the reason. In contrast to trace gases, ozone mainly affects the aging process of aerosols by participating in photochemical reactions.
The concentration of Ox (OX = O3 + NO2) is used as a proxy for atmospheric photochemical aging [38,43,52,53]. As shown in Figure 8d, although the diurnal variation in O3 was obvious, the photochemical oxidant (OX) had little difference between daytime and nighttime. The average concentrations of OX in these two periods were 40 and 39 ppb, respectively. This may indicate that there is no obvious difference in the photochemical aging process between daytime and nighttime in Qingdao. Atmospheric temperature directly affects the frequency of intermolecular collisions dependent on chemical reactions. Indirectly, it may complicate the chemical reaction process of OX by affecting VOC emissions [54]. Therefore, it is of great significance to analyze the relationship among temperature, OX and aerosol light absorption. Figure 8e1,e2 shows that OX increased almost linearly with temperature, with slopes of 1.2 and 1 ppb∙K−1 at daytime and nighttime, respectively. However, there was no obvious dependence between OX and aerosol absorption.

4. Conclusions

The light absorption characteristics of atmospheric aerosols are a necessary factor in the study of atmospheric radiative forcing. Based on our PAS and OPC data, combined with automatic weather station, visibility meter, and other meteorological station data, aerosol light absorption in the sea–land intersection area of Qingdao was measured and analyzed for two months. The effects of aerosol sources, meteorological factors, and pollutant gases on aerosol light absorption along the Qingdao coast were analyzed. First, we used a backward trajectory model to analyze the pollution sources along the coast of Qingdao. The results revealed that OAC from local areas was the largest and that of marine sources was the smallest. Second, according to the wind speed and direction, the local pollution sources were analyzed. The results showed that the local pollution source mainly comes from the northwest (Jiaozhou). Moreover, quantitative analysis of the RH shift process during the measurement period was carried out. The results showed that the positive correlation between the aerosol absorption coefficient and RH was mainly because RH directly affects the particle size, which indirectly leads to a change in the aerosol absorption coefficient. Finally, trace gases are important precursors of aerosol generation and aging and have a high correlation with the aerosol absorption coefficient. In addition, analysis of the relationship between photochemical oxides and temperature reveals an obvious temperature dependence.
A limitation of this study was that, when analyzing the relationship between gaseous pollutants and aerosol absorption, we analyzed only the correlation, and the specific process was not clear, so the work in this section needs to be improved. Despite its limitations, the study adds to our understanding of the aerosol light absorption characteristics of coastal cities.

Author Contributions

J.C.: Methodology, Formal analysis, Validation, Writing. W.Z.: Conceptualization, Resources, Supervision, Formal analysis, Funding acquisition. Q.L.: Conceptualization, Resources, Supervision, Formal analysis, Funding acquisition. X.Q.: Formal analysis, Writing—review & editing. X.L.: Funding acquisition, resources. J.Z.: Validation, Writing—review & editing. T.Y.: Validation, Software. Q.X.: Validation, Software. All authors have read and agreed to the published version of the manuscript.

Funding

Project supported by the National Natural Science Foundation of China (Grant Nos. 41805014), Foundation of Advanced Laser Technology Laboratory of Anhui Province (Grant No. 20191002), Key Program in the Youth Talent Support Plan in Universities of Anhui Province (Grant No. gxyqZD2020032), Strategic Priority Research Program of Chinese Academy of Sciences (Grant No. XDA17010104), Key Laboratory of Science and Technology Innovation of Chinese Academy of Sciences (Grant No. CXJJ-21S028) and Open Research Fund of Key Laboratory of Atmospheric Optics, Chinese Academy of Sciences (Grant No. JJ-19-01).

Institutional Review Board Statement

Not applicable.

Informed Consent Statement

Not applicable.

Data Availability Statement

The data presented in this study are available on request from the corresponding author.

Conflicts of Interest

The authors declare that they have no known competing financial interests or personal relationships that could have appeared to influence the work reported in this paper.

References

  1. Hegg, D.A.; Covert, D.S.; Rood, M.J.; Hobbs, P.V. Measurements of aerosol optical properties in marine air. J. Geophys. Res. Space Phys. 1996, 101, 12893–12903. [Google Scholar] [CrossRef]
  2. Meira, G.R.; Pinto, W.T.A.; Lima, E.E.P.; Andrade, C. Vertical distribution of marine aerosol salinity in a Brazilian coastal area—The influence of wind speed and the impact on chloride accumulation into concrete. Constr. Build. Mater. 2017, 135, 287–296. [Google Scholar] [CrossRef]
  3. Rodríguez, S.; Cuevas, E.; González, Y.; Ramos, R.; Romero, P.M.; Pérez, N.; Querol, X.; Alastuey, A. Influence of sea breeze circulation and road traffic emissions on the relationship between particle number, black carbon, PM1, PM2.5 and PM2.5–10 concentrations in a coastal city. Atmos. Environ. 2008, 42, 6523–6534. [Google Scholar] [CrossRef]
  4. Wang, Y.; Guo, H.; Lyu, X.; Zhang, L.; Zeren, Y.; Zou, S.; Ling, Z. Photochemical evolution of continental air masses and their influence on ozone formation over the South China Sea. Sci. Total Environ. 2019, 673, 424–434. [Google Scholar] [CrossRef]
  5. Kumar, S.; Srivastava, A.K.; Pathak, V.; Bisht, D.S.; Tiwari, S. Surface solar radiation and its association with aerosol characteristics at an urban station in the Indo-Gangetic Basin: Implication to radiative effect. J. Atmos. Sol. Terr. Phys. 2019, 193, 105061. [Google Scholar] [CrossRef]
  6. Rosenfeld, D.; Andreae, M.O.; Asmi, A.; Chin, M.; de Leeuw, G.; Donovan, D.P.; Kahn, R.; Kinne, S.; Kivekäs, N.; Kulmala, M.; et al. Global observations of aerosol-cloud-precipitation-climate interactions. Rev. Geophys. 2014, 52, 750–808. [Google Scholar] [CrossRef] [Green Version]
  7. Brem, B.T.; Mena Gonzalez, F.C.; Meyers, S.R.; Bond, T.C.; Rood, M.J. Laboratory-Measured Optical Properties of Inor-ganic and Organic Aerosols at Relative Humidities up to 95%. Aerosol Sci. Technol. 2012, 46, 178–190. [Google Scholar] [CrossRef]
  8. Shen, L.; Wang, H.; Cheng, M.; Ji, D.; Liu, Z.; Wang, L.; Gao, W.; Yang, Y.; Huang, W.; Zhang, R.; et al. Chemical composition, water content and size distribution of aerosols during different development stages of regional haze episodes over the North China Plain. Atmos. Environ. 2021, 245, 118020. [Google Scholar] [CrossRef]
  9. Wu, Y.; Xia, Y.; Zhou, C.; Tian, P.; Tao, J.; Huang, R.-J.; Liu, D.; Wang, X.; Xia, X.; Han, Z.; et al. Effect of source variation on the size and mixing state of black carbon aerosol in urban Beijing from 2013 to 2019: Implication on light absorption. Environ. Pollut. 2021, 270, 116089. [Google Scholar] [CrossRef]
  10. Soleimanian, E.; Mousavi, A.; Taghvaee, S.; Shafer, M.M.; Sioutas, C. Impact of secondary and primary particulate matter (PM) sources on the enhanced light absorption by brown carbon (BrC) particles in central Los Angeles. Sci. Total Environ. 2020, 705, 135902. [Google Scholar] [CrossRef]
  11. Srivastava, R.; Asutosh, A.; Sabu, P.; Anilkumar, N. Investigation of Black Carbon characteristics over southern ocean: Contribution of fossil fuel and biomass burning. Environ. Pollut. 2021, 276, 116645. [Google Scholar] [CrossRef] [PubMed]
  12. Tie, X.; Brasseur, G.P.; Zhao, C.; Granier, C.; Massie, S.; Qin, Y.; Wang, P.; Wang, G.; Yang, P.; Richter, A. Chemical characterization of air pollution in Eastern China and the Eastern United States. Atmos. Environ. 2006, 40, 2607–2625. [Google Scholar] [CrossRef]
  13. Bellouin, N.; Boucher, O.; Haywood, J.; Reddy, M.S. Global estimate of aerosol direct radiative forcing from satellite measurements. Nat. Cell Biol. 2005, 438, 1138–1141. [Google Scholar] [CrossRef] [PubMed]
  14. Chin, M.; Chu, A.; Levy, R.; Remer, L.; Kaufman, Y.; Holben, B.; Eck, T.; Ginoux, P.; Gao, Q. Aerosol distribution in the Northern Hemisphere during ACE-Asia: Results from global model, satellite observations, and Sun photometer measurements. J. Geophys. Res. Space Phys. 2004, 109, 1–15. [Google Scholar] [CrossRef]
  15. Kaufman, Y.J.; Koren, L.A.; Remer, D.; Tanre, D.; Ginoux, P.; Fan, S. Dust transport and deposition observed from the Terra-Moderate Resolution Imaging Spectroradiometer (MODIS) spacecraft over the Atlantic Ocean. J. Geophys. Res. 2005, 110, D10S12. [Google Scholar] [CrossRef] [Green Version]
  16. Jones, T.A.; Christopher, S.A. MODIS derived fine mode fraction characteristics of marine, dust, and anthropogenic aerosols over the ocean, constrained by GOCART, MOPITT, and TOMS. J. Geophys. Res. Space Phys. 2007, 112, D22204. [Google Scholar] [CrossRef] [Green Version]
  17. Seinfeld, J.H.; Pandis, S.N. From air pollution to climate change. Atmos. Chem. Phys. 1998, 1326. [Google Scholar]
  18. Favez, O.; Cachier, H.; Sciare, J.; Sarda-Estève, R.; Martinon, L. Evidence for a significant contribution of wood burning aerosols to PM2.5 during the winter season in Paris, France. Atmos. Environ. 2009, 43, 3640–3644. [Google Scholar] [CrossRef]
  19. Lan, Z.-J.; Huang, X.-F.; Yu, K.-Y.; Sun, T.-L.; Zeng, L.-W.; Hu, M. Light absorption of black carbon aerosol and its en-hancement by mixing state in an urban atmosphere in South China. Atmos. Environ. 2013, 69, 118–123. [Google Scholar] [CrossRef]
  20. Sandradewi, J.; Prevot, A.S.H.; Szidat, S.; Perron, N.; Alfarra, M.R.; Lanz, V.A.; Weingartner, E.; Baltensperger, U. Using Aerosol Light Absorption Measurements for the Quantitative Determination of Wood Burning and Traffic Emission Contributions to Particulate Matter. Environ. Sci. Technol. 2008, 42, 3316–3323. [Google Scholar] [CrossRef] [PubMed]
  21. Sun, T.; Wu, C.; Wu, D.; Liu, B.; Sun, J.Y.; Mao, X.; Yang, H.; Deng, T.; Song, L.; Li, M.; et al. Time-resolved black carbon aerosol vertical distribution measurements using a 356-m meteorological tower in Shenzhen. Theor. Appl. Clim. 2020, 140, 1263–1276. [Google Scholar] [CrossRef] [Green Version]
  22. Utry, N.; Ajtai, T.; Filep, Á.; Pintér, M.; Török, Z.; Bozóki, Z.; Szabó, G. Correlations between absorption Angström ex-ponent (AAE) of wintertime ambient urban aerosol and its physical and chemical properties. Atmos. Environ. 2014, 91, 52–59. [Google Scholar] [CrossRef]
  23. Xu, X.; Zhao, W.; Zhang, Q.; Wang, S.; Fang, B.; Chen, W.; Venables, D.S.; Wang, X.; Pu, W.; Wang, X.; et al. Optical properties of atmospheric fine particles near Beijing during the HOPE-J3A campaign. Atmos. Chem. Phys. 2016, 16, 6421–6439. [Google Scholar] [CrossRef] [Green Version]
  24. Xin, J.; Wang, S.; Wang, Y.; Yuan, J.; Zhang, W.; Yang, S. Optical properties and size distribution of dust aerosols over the Tengger Desert in Northern China. Atmos. Environ. 2005, 39, 5971–5978. [Google Scholar] [CrossRef]
  25. Xu, J.; Bergin, M.H.; Greenwald, R.; Schauer, J.J.; Shafer, M.M.; Jaffrezo, J.L.; Aymoz, G. Aerosol chemical, physical, and radiative characteristics near a desert source region of northwest China during ACE-Asia. J. Geophys. Res. Space Phys. 2004, 109, D19S03. [Google Scholar] [CrossRef] [Green Version]
  26. Bellouin, N.; Quaas, J.; Morcrette, J.-J.; Boucher, O. Estimates of aerosol radiative forcing from the MACC re-analysis. Atmos. Chem. Phys. Discuss. 2013, 13, 2045–2062. [Google Scholar] [CrossRef] [Green Version]
  27. AzadiAghdam, M.; Braun, R.A.; Edwards, E.-L.; Bañaga, P.A.; Cruz, M.T.; Betito, G.; Cambaliza, M.O.; Dadashazar, H.; Lorenzo, G.R.; Ma, L.; et al. On the nature of sea salt aerosol at a coastal megacity: Insights from Manila, Philippines in Southeast Asia. Atmos. Environ. 2019, 216, 1138–1141. [Google Scholar] [CrossRef]
  28. The Seventh Population Census of the People’s Republic of China. 2021. Available online: https://www.jinan.gov.cn (accessed on 13 September 2021).
  29. Chen, J.; Qian, X.M.; Liu, Q.; Zheng, J.J.; Zhu, W.Y.; Li, X.B. Research on Optical Absorption Characteristics of Atmospheric Aerosols at 1064 nm Wavelength. Spectrosc. Spectr. Anal. 2020, 40, 2989–2995. [Google Scholar]
  30. Liu, Q.; Huang, H.-H.; Wang, Y.; Wang, G.-S.; Cao, Z.-S.; Liu, K.; Chen, W.-D.; Gao, X.-M. Multi-wavelength meas-urements of aerosol optical absorption coefficients using a photoacoustic spectrometer. Chin. Phys. B 2014, 23, 064205. [Google Scholar] [CrossRef]
  31. Zhu, W.; Liu, Q.; Wu, Y. Aerosol absorption measurement at SWIR with water vapor interference using a differential photoacoustic spectrometer. Opt. Express 2015, 23, 23108–23116. [Google Scholar] [CrossRef]
  32. Hu, H.; Li, X.; Zhang, Y.; Li, T. Determination of the refractive index and size distribution of aerosol from du-al-scattering-angle optical particle counter measurements. Appl. Opt. 2006, 45, 3864–3870. [Google Scholar] [CrossRef]
  33. Li, X.; Xu, Q.; Hu, H. New Method to Deduce Imaginary Part of Refractive Index of Aerosol with Double-Scattering Angles Laser Optical Particle Counter. Acta Opt. Sin. 2007, 27, 391–394. [Google Scholar]
  34. Cui, F.; Chen, M.; Ma, Y.; Zheng, J.; Zhou, Y.; Li, S.; Qi, L.; Wang, L. An intensive study on aerosol optical properties and affecting factors in Nanjing, China. J. Environ. Sci. 2016, 40, 35–43. [Google Scholar] [CrossRef]
  35. Zhao, X.J.; Zhao, P.S.; Xu, J.; Meng, W.; Pu, W.W.; Dong, F.; He, D.; Shi, Q.F. Analysis of a winter regional haze event and its formation mechanism in the North China Plain. Atmos. Chem. Phys. Discuss. 2013, 13, 5685–5696. [Google Scholar] [CrossRef] [Green Version]
  36. Wang, J.; Virkkula, A.; Gao, Y.; Lee, S.; Shen, Y.; Chi, X.; Nie, W.; Liu, Q.; Xu, Z.; Huang, X.; et al. Observations of aerosol optical properties at a coastal site in Hong Kong, South China. Atmos. Chem. Phys. Discuss. 2017, 17, 2653–2671. [Google Scholar] [CrossRef] [Green Version]
  37. Yan, P.; Tang, J.; Huang, J.; Mao, J.T.; Zhou, X.J.; Liu, Q.; Wang, Z.F.; Zhou, H.G. The measurement of aerosol optical properties at a rural site in Northern China. Atmos. Chem. Phys. Discuss. 2007, 7, 13001–13033. [Google Scholar] [CrossRef] [Green Version]
  38. Garland, R.M.; Yang, H.; Schmid, O.; Rose, D.; Nowak, A.; Achtert, P.; Wiedensohler, A.; Takegawa, N.; Kita, K.; Miyazaki, Y.; et al. Aerosol optical properties in a rural environment near the mega-city Guangzhou, China: Implications for regional air pollution, radiative forcing and remote sensing. Atmos. Chem. Phys. Discuss. 2008, 8, 5161–5186. [Google Scholar] [CrossRef] [Green Version]
  39. Wu, D.; Wu, C.; Liao, B.; Chen, H.; Wu, M.; Li, F.; Tan, H.; Deng, T.; Li, H.; Jiang, D.; et al. Black carbon over the South China Sea and in various continental locations in South China. Atmos. Chem. Phys. Discuss. 2013, 13, 12257–12270. [Google Scholar] [CrossRef] [Green Version]
  40. Chai, T.; Draxler, R.; Stein, A. Source term estimation using air concentration measurements and a Lagrangian dispersion model—Experiments with pseudo and real cesium-137 observations from the Fukushima nuclear accident. Atmos. Environ. 2015, 106, 241–251. [Google Scholar] [CrossRef]
  41. Bo, Z.; Dan, T.; Meng, L.; Fei, L.; Chaopeng, H.; Guannan, G.; Haiyan, L.; Xin, L.; Liqun, P.; Ji, Q. Trends in China’s anthropogenic emissions since 2010 as the consequence of clean air actions. Atmos. Chem. Phys. Discuss. 2018, 18, 14095–14111. [Google Scholar]
  42. Lin, W.; Xu, X.; Ge, B.; Liu, X. Gaseous pollutants in Beijing urban area during the heating period 2007–2008: Variability, sources, meteorological, and chemical impacts. Atmos. Chem. Phys. Discuss. 2011, 11, 8157–8170. [Google Scholar] [CrossRef]
  43. Deng, X.; Wu, D.; Yu, J.; Lau, A.K.; Li, F.; Tan, H.; Yuan, Z.; Ng, W.M.; Deng, T.; Wu, C.; et al. Characterization of secondary aerosol and its extinction effects on visibility over the Pearl River Delta Region, China. J. Air Waste Manag. Assoc. 2013, 63, 1012–1021. [Google Scholar] [CrossRef]
  44. Yu, X.; Ma, J.; An, J.; Yuan, L.; Zhu, B.; Liu, D.; Wang, J.; Yang, Y.; Cui, H. Impacts of meteorological condition and aerosol chemical compositions on visibility impairment in Nanjing, China. J. Clean. Prod. 2016, 131, 112–120. [Google Scholar] [CrossRef]
  45. Chen, W.; Wang, X.; Zhou, S.; Cohen, J.B.; Zhang, J.; Wang, Y.; Chang, M.; Zeng, Y.; Liu, Y.; Ling, Z.; et al. Chemical Composition of PM2.5 and its Impact on Visibility in Guangzhou, Southern China. Aerosol Air Qual. Res. 2016, 16, 2349–2361. [Google Scholar] [CrossRef]
  46. Moosmüller, H.; Chakrabarty, R.; Arnott, W. Aerosol light absorption and its measurement: A review. J. Quant. Spectrosc. Radiat. Transf. 2009, 110, 844–878. [Google Scholar] [CrossRef]
  47. Huang, K.; Zhuang, G.; Lin, Y.; Fu, J.S.; Wang, Q.; Liu, T.; Zhang, R.; Jiang, Y.; Deng, C.; Fu, Q.; et al. Typical types and formation mechanisms of haze in an Eastern Asia megacity, Shanghai. Atmos. Chem. Phys. Discuss. 2012, 12, 105–124. [Google Scholar] [CrossRef] [Green Version]
  48. DeCarlo, P.F.; Slowik, J.G.; Worsnop, D.R.; Davidovits, P.; Jimenez, J.L. Particle Morphology and Density Characteriza-tion by Combined Mobility and Aerodynamic Diameter Measurements. Part 1: Theory. Aerosol Sci. Technol. 2004, 38, 1185–1205. [Google Scholar] [CrossRef] [Green Version]
  49. Petzold, A.; Ogren, J.A.; Fiebig, M.; Laj, P.; Li, S.M.; Baltensperger, U.; Holzer-Popp, T.; Kinne, S.; Pappalardo, G.; Sugimoto, N.; et al. Recommendations for reporting “black carbon” measurements. Atmos. Chem. Phys. 2013, 13, 8365–8379. [Google Scholar] [CrossRef] [Green Version]
  50. Gaur, A.; Tripathi, S.N.; Kanawade, V.P.; Tare, V.; Shukla, S.P. Four-year measurements of trace gases (SO2, NOx, CO, and O3) at an urban location, Kanpur, in Northern India. J. Atmos. Chem. 2014, 71, 283–301. [Google Scholar] [CrossRef]
  51. Paton-Walsh, C.; Jones, N.; Wilson, S.; Meier, A.; Deutscher, N.; Griffith, D.; Mitchell, R.; Campbell, S. Trace gas emissions from biomass burning inferred from aerosol optical depth. Geophys. Res. Lett. 2004, 31, L05116. [Google Scholar] [CrossRef] [Green Version]
  52. Eichler, H.; Cheng, Y.F.; Birmili, W.; Nowak, A.; Wiedensohler, A.; Brüggemann, E.; Gnauk, T.; Herrmann, H.; Althausen, D.; Ansmann, A. Hygroscopic properties and extinction of aerosol particles at ambient relative humidity in South-Eastern China. Atmos. Environ. 2008, 42, 6321–6334. [Google Scholar] [CrossRef]
  53. Ji, D.; Gao, W.; Zhang, J.; Morino, Y.; Zhou, L.; Yu, P.; Li, Y.; Sun, J.; Ge, B.; Tang, G.; et al. Investigating the evolution of summertime secondary atmospheric pollutants in urban Beijing. Sci. Total Environ. 2016, 572, 289–300. [Google Scholar] [CrossRef] [PubMed]
  54. Jacob, D.J.; Logan, J.A.; Yevich, R.M.; Gardner, G.M.; Spivakovsky, C.M.; Wofsy, S.C.; Munger, J.W.; Sillman, S.; Prather, M.J.; Rodgers, M.O.; et al. Simulation of summertime ozone over North America. J. Geophys. Res. Space Phys. 1993, 98, 14797–14816. [Google Scholar] [CrossRef]
Figure 1. Map of the sampling site.
Atmosphere 12 01553 g001
Figure 2. Time series of optical properties, air pollutant concentrations, and meteorological data.
Atmosphere 12 01553 g002
Figure 3. (a) Backward trajectory and size spectrum distribution of six kinds of air masses; (b,c) pollutant concentration and OACs of each source.
Atmosphere 12 01553 g003
Figure 4. Dependence map of gas concentration and RH on wind speed and direction (af); diurnal variation of SO2, NO2, CO, and O3 (hourly average) in Jiaonan (JN), Jiaozhou (JZ), Laoshan (LS), Licang (LC), Shinan (SN), and Yangkou (YK) during the measuring process (gj).
Atmosphere 12 01553 g004
Figure 5. Visibility (a) and OAC (b) as a function of PM10 mass concentration under different relative humidities (RHs). The blue, yellow, green, orange, and red lines present the fits of the dots for the different RH conditions.
Atmosphere 12 01553 g005
Figure 6. Highly time-resolved evolution of two selected RH-change episodes (red dotted box). (a) RH; (b) T; (c) PM10; (d) particle number size distribution; (e) OAC. A process of increasing and decreasing relative humidity was selected to clearly show the evaluation of particle size and aerosol optical absorption coefficient.
Atmosphere 12 01553 g006
Figure 7. RH increase and decrease process: (a,e) change in particle number concentration with RH; (b,f) change in particle mean diameter (MD) with RH; (c,g) change in absorption cross section (α) with MD; (d,h) change in OAC with RH.
Atmosphere 12 01553 g007
Figure 8. (ac) Linear correlation between gaseous pollutants (SO2, NO2 and CO) and PM2.5/OAC. (d) Diurnal variation of Ox concentration. (e1,e2) Linear correlation between temperature and OX.
Atmosphere 12 01553 g008
Table 1. Aerosol absorbing coefficients of this and other studies.
LocationObservation TimeΛ
(nm)
InstrumentationOAC
(Mm−1)
Source
Qingdao
(urban, coastal)
November to December 2019 1064PAS18.52 ± 13.31This study
Shenzhen
(urban)
26 August to 20 September 2011450
532
781
PASS-337.1 ± 28.1
25.4 ± 19.0
17.6± 12.9
[19]
Beijing,
Tianjin and Hebei
(urban)
14 to 23 November 2010532AE3137 ± 43[35]
Hok Tsui
(rural, coastal)
February 2012 to February 2015550AE318.3 ± 6.1[36]
Nanjing
(urban)
14 to 28 November 2012405
532
781
PASS-368.4 ± 53.5
41.6 ± 18.7
28.0 ± 18.7
[34]
Shangdianzi
(Beijing, rural
background station)
September 2003 to January 2005525AE3117.54 ± 13.44[37]
Guangzhou,
(rural)
July 2006532PAS34.3 ± 26.5[38]
Yulin
(Gobi Desert)
April 2001565PASP6 ± 11[25]
Yongxing Island
(oceanic, rural)
May to June 2008
December 2008 to January 2009
532AE317.21 ± 5.23[39]
Publisher’s Note: MDPI stays neutral with regard to jurisdictional claims in published maps and institutional affiliations.

