Abstract
The COVID-19 outbreak has significantly affected global industrial and transportation markets. Airlines, rails, and cars’ industries and their supporting energy sectors have been substantially disrupted by the pandemic. This has resulted in undermined energy demand around the world during 2019 and 2020. The organization of the Petroleum Exporting Countries (OPEC) led by Saudi Arabia failed to persuade Russia to cutback oil supplies to deal with the loss of demand from the COVID-19 pandemic. On 8 March 2020, Saudi Arabia announced a raise in its oil production and offered a large discount on its crude oil sales. By April 2020, Saudi Arabia increased its oil production to about 12 million-oil barrels/day. This rise in oil production has not only resulted in the biggest fall in oil prices since the 1991 Gulf War but also increased methane emissions over the Gulf Cooperation Council (GCC) regions. Here, we report 2019 and 2020 data set of average seasonal methane-mixing ratio retrieved from TROPOspheric Monitoring Instrument (TROPOMI) on board of S5P spacecraft over 19 refineries and oil fields in Saudi Arabia, Kuwait, Oman, United Arab Emirates, Qatar, and Bahrain. Low methane emissions were recorded over western and central Saudi Arabia compared to the eastern side of the country. In general, high methane emissions were observed in 2020 compared to 2019 around oil refineries and fields in western, central, and eastern regions of Saudi Arabia as well as over other GCC countries. This could be attributed to the oil high production associated with the oil prices fluctuation during 2020.
1. Introduction
Carbon dioxide (CO2) and methane (CH4) emissions are the largest cause of climate change today [1]. Methane has a shorter lifetime (~12 Y) in the atmosphere compared with CO2, which could remain for hundreds of years. Methane, however, absorbs much more energy compared to CO2 while in the atmosphere [2]. Since the Industrial Revolution, methane emissions in the atmosphere increased by almost 2.5 times [3]. Natural sources contribute to about 40% of the methane emissions, while manmade activities comprise the remaining 60% of the emissions. Livestock and agriculture activities are responsible for about one-quarter of methane global emissions [4], while the energy sector represented by oil, natural gas, coal, and bioenergy is the second largest source. Despite strict governmental policies and regulations on industrial emissions, controlling methane emissions remains a critical environmental challenge. Even under ambitious global efforts to use renewable energy to reduce greenhouse gas (GHGs) effects, oil and natural gas are a major part of the world’s energy system for a few decades. It is important to monitor all sources of methane generated by manmade activities; however, it is very important to focus on petrochemical sectors. This is because oil and gas industries release substantial amounts of methane in the atmosphere, and it is vital to control its emission in order to reduce its environmental impacts. In 2019, oil and natural gas industries emitted about 82 Mt (mega ton) of methane [5]. Emerging approaches for methane detection and measurement are set to provide timely and actionable information on leaks and generally enlarge the amount of data available on oil and gas methane emissions.
Several technologies are designed to detect and mitigate methane release including satellites, planes, helicopters, drones, and ground-based sensors [6]. Remote sensing measurements have significantly helped in monitoring methane emissions, which guarantees allowing better transparency of the emissions from the petrochemical sectors. Satellites provide real time tools to conduct global scans to estimate and detect methane emissions levels from large point sources. Nevertheless, more efforts are needed before satellites can generate a robust global data of methane emissions from all petrochemical activities. Challenges such as difficulty in precisely detecting emissions at the source and to detect methane emission in snowy and offshore areas persist with satellites measurements. Ref. [7] shows that petrochemical industries including oil production and use are among the largest contributors to methane emissions.
Data indicate [8,9] that oil, coal, and natural gas production and usage can contribute 15–22% of methane emissions and to the global atmospheric methane budget. Their finds imply that the fossil fuel industry could have a greater potential to mitigate global radiative forcing impact of methane and carbon dioxide. Ref. [10] estimated that in 2015 methane emissions was about 13 ± 2 × 10¹² g per year from United States oil and natural gas supplies, which is equivalent to ~2.3% of gross United States gas production. They indicated that this rate of methane emissions could have similar radiative forcing impacts as CO2 in 20-year periods. It was found that [11] shifting vehicle and power plants from using gasoline to compressed natural gas comes with an environmental price due to methane leakage. Minimizing such leakage is crucial for reducing methane cumulative radiative forcing effects.
Methane heat-trapping effects and methane leaks in upstream oil and gas infrastructure in the GCC region were investigated in [12]. They found that Saudi Arabia is the lowest Green House Gases (GHG) emitter compared to Qatar, Kuwait, and United Arab Emirates.
Since oil discovery in Saudi Arabia back in 1930, the GCC countries including Saudi Arabia (KSA), United Arab Emirates (UAE), Kuwait, Qatar, Bahrain, and Oman (Figure 1) have become some of the world’s most enriched areas in terms of oil and natural gas reserves. From 1980 to 2000, oil production has increased from 11 M (million) barrels to 18 M per day. That makes the oil and gas sector one of the major sources of national income for GCC countries, with about $835 billion of contracts awarded in 2018 and 2019 [13]. Due to this high economical value of the oil and gas sector, many of its environmental impacts have often been neglected for decades [14].
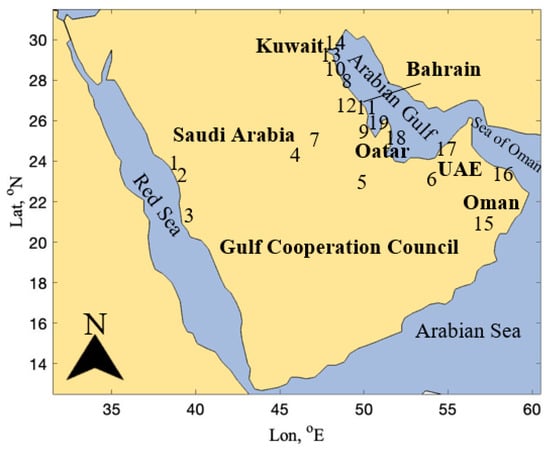
Figure 1.
Map of the Gulf Cooperation Council (GCC) countries. Numbers 1–19 indicate refineries and oil fields considered for this study, as shown in Table 1.
The Organization of the Petroleum Exporting Countries (OPEC) [15] was founded in 1960 to coordinate petroleum exporting policies of its member countries and to stabilize oil markets by ensuring a regular supply of oil to consumers and a fair return to its producer countries. Currently, the OPEC organization has a total of 13 member countries, including the following: Algeria, Angola, Congo, Equatorial Guinea, Gabon, Iran, Iraq, Kuwait, Libya, Nigeria, Saudi Arabia, United Arab Emirates, and Venezuela. Early March 2020, an oil production war erupted between Saudi Arabia and Russia, a non-OPEC Member and one of the top oil-producing countries in the world. As the negotiations between the two countries failed to persuade Russia that large oil supply cutbacks were needed to compensate with the loss of demand from the COVID-19 pandemic [16], Saudi Arabia propelled output to unprecedented 12 million oil barrels a day in early April 2020 (Figure 2 and Figure 3a). Moreover, other oil producers in the GCC region (Kuwait, UAE, and Oman) largely increased oil production during March and April 2020 (Figure 3b–d). Kuwait propelled ~3 million, UAE propelled ~4 million, and Oman propelled ~1.1 million barrels a day in April 2020. Qatar and Bahrain, however, did not increase their oil production from January to December 2020 (Figure 3e,f). As a result, oil prices dropped to their lowest price since 2002, falling below USD 20 a barrel in London and even below zero in the United States [17]. Under immense involvement of international allies, Saudi Arabia and Russia reached an agreement to cut vast amounts of oil supplies. Towards the end of April 2020, Saudi Arabia reduced its oil output average to about 11.4 million barrels. This record raise in oil production did not only have an economic impact but also an environmental one.
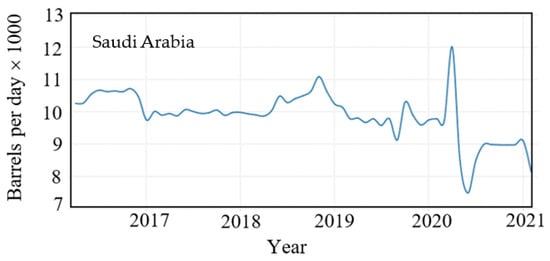
Figure 2.
Daily oil production in Saudi Arabia from 2016 to 2021, Source [18].
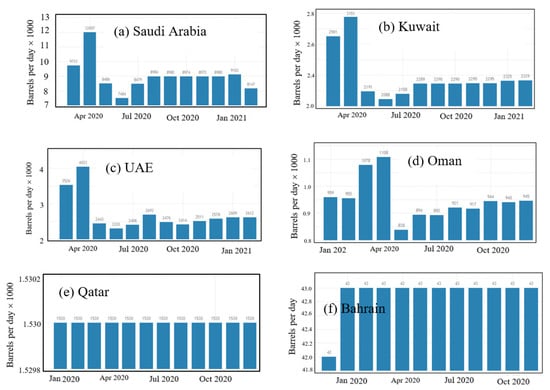
Figure 3.
Histograms of daily oil production during 2020 from (a) Saudi Arabia, (b) Kuwait, (c) United Arab Emirates, (d) Oman, (e) Qatar, and (f) Bahrain. Source [18].
In this study, we use data from the TROPOMI instrument on board of Sentinel-5 Precursor (S5P) spacecraft to investigate how the 2020 disagreement on oil production affected methane emissions from 19 oil fields and refineries and major oil transport pipelines in Saudi Arabia and other GCC countries (Table 1). The study region has been divided into three parts: western and central Saudi Arabia, eastern Saudi Arabia, and other GCC countries (Kuwait, Oman, United Arab Emirates, Qatar, and Bahrain). Additionally, methane emissions across the East-West, Iraq-Saudi Arabia (IPSA), and Trans-Arabian (TapLine) oil transport pipelines have been investigated. The effect of the operation of Al Wafra oil field in 2020 shared between Saudi Arabia and Kuwait on methane emissions in the region is also discussed.

Table 1.
List of major oil fields and refineries in Saudi Arabia, Kuwait, United Arab Emirates, Oman, Qatar, and Bahrain.
2. TROPOMI Instrument
In this study, we analyze methane data from the Level 2 CH4 TROPOspheric Mointoring Instrument (TROPOMI), a single sensor on board of the Copernicus Sentinel-5 Precursor (S5P) spacecraft [19]. The S5P spacecraft was launched in 2017 for an expected 7 years mission to investigate Earth’s atmospheric composition. The TROPOMI instrument was designed and built by the Netherlands Space Office (NSO) and financed by the European Space Agency (ESA). TROPOMI data products were developed through a scientific partnership among institutes in Netherlands, United Kingdom, Finland, and Germany. TROPOMI instrument is a continuation of Ozone Monitoring Instrument (OMI) [20] and the SCanning Imaging Absorption spectroMeter for Atmospheric CartograpHY (SCIAMACHY) [21,22] satellite missions to explore atmospheric products and air quality.
The main TROPOMI mission objectives include a better understanding of the trends and variability of aerosols and trace gases affecting climate and air quality. TROPOMI compares radiation reflected by the atmosphere with direct sunlight. Since each atmospheric gas absorbs radiation at a specific wavelength, TROPOMI can measure the abundance of each gas present in the troposphere (lower layer of Earth’s atmosphere). The mission is also designed to better constrain the evolution, spatio-temporal variability, and distribution of methane (CH4) and tropospheric ozone (O3). Data available from the TROPOMI instrument also provide an important tool to develop and examine existing air quality models and support air quality forecasting in regional and global scales.
The absorption of solar light as detected in the reflected radiances allowed for the retrieval of the methane’s atmospheric abundance given that the light path through the atmosphere is precisely known. Scattering by aerosol and other atmospheric particles can change the light path and significantly result in retrieval errors if not accounted for. The TROPOMI instrument is a nadir viewing spectrometer that uses passive remote sensing techniques to measure the solar radiation at the top of the Atmosphere reflected by the Earth’s surface and atmosphere in the visible (270–500 nm), near infrared (NIR) (675–775 nm), and short-wave infrared (SWIR) (2305–2385) spectral bands [23]. The main objective of the NIR band is to improve the accuracy of cloud correction of the trace gases (CO2, CO, NO2, N2O, SO2, O3, and CH4) retrievals. The primary objective of adding the SWIR back is the observation of CO and CH4. The TROPOMI swath width is about 2600 km on Earth’s surface, and it has 5.5 × 5.5 km spatial resolution near nadir. One of the main challenges of methane remote sensing observation is that high quality data are needed for flux inversion applications and data interpretation. One limitation of the TROPOMI methane mixing ratio (column averaged dry air mixing ratio of methane) data is that a heavy latitudinal background superimposes local emissions, and it is challenging to observe the emissions at ground surface for a given spot (example: oil refinery). Meanwhile, latitude, agriculture, and other land uses may affect methane-mixing ratios. Scattering by cirrus particles and atmospheric aerosols can also modify the light path and significantly result in retrieval errors if not accounted for.
TROPOMI, however, retrieves methane columns based on a physics algorithm [24] that applies strict filtering to scattering artifacts; thereby, its retrieval success rate is only 3% [25]. Moreover, TROPOMI data have been validated with both ground-based measurements from Total Carbon Column Observing Network (TCCON) [25] and satellites’ observations from the Greenhouse Gases Observing Satellite (GOSAT) [26]. Furthermore, [27] presented an improvement for retrieving methane from TROPOMI observations using the full physics approach, and they have compared their product and proved good data quality with ground-based and space-borne measurements. The high resolution along with high signal-to-noise ratio provides TROPOMI the potential to measure CH4 emissions over individual large and mega cities. The study depends on Sentinel-5P TROPOMI level 2 (L2) data for methane mixing ratio with a spatial resolution of 5.5 × 7 km. CH4 data are downloaded from (https://disc.gsfc.nasa.gov/datasets/S5P_L2__CH4____HiR_1/summary?keywords=CH4, accessed on 31 December 2020) in NetCDF for specific period and spatial coordinates. Google Earth Engine script and Panoply software were used to generate methane mixing ratio maps. Network Common Data Form (NetCDF) data were then transformed into Microsoft .csv format, where statistical analyses were performed to examine variability of methane emissions in 2020 and 2019. The significance of the variability of methane mixing ratio is also tested using a statistical p-value test (Figure 4).
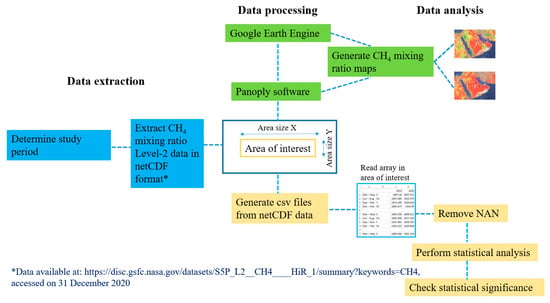
Figure 4.
Schematic diagram shows Sentinel-5P data processing steps.
3. Results and Discussion
Figure 5a–f show the average seasonal trend of methane mixing ratio during 2019–2020 as observed from the TROPOMI instrument over the Arabian Peninsula with major oil fields (Table 1) and oil pipelines highlighted. Seasons are defined as spring (March–May), summer (June–August), fall (September–November), winter (December–February). A significant increase in the methane emission is observed during spring 2020 compared to spring 2019 (Figure 5a,b). Despite high oil production during spring 2020, no significant increase in methane emissions was observed around the East–West or the Iraq-Saudi Arabia (IPSA) oil pipeline except around the oil fields in the Northeast regions of Saudi Arabia and Kuwait. High methane concentrations were also observed in Kuwait, United Arab Emirates, and Oman.
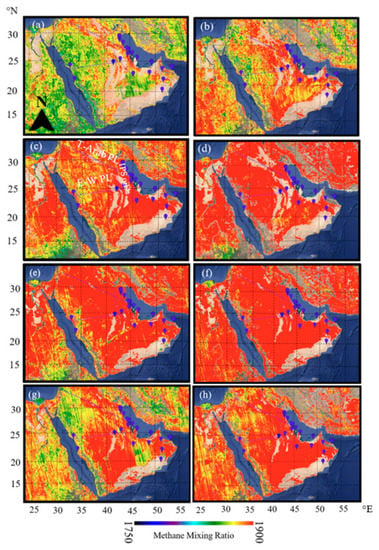
Figure 5.
Seasonal trend of methane mixing ration over the GCC countries during 2019–2020 (a) spring (March–May) 2019, (b) spring (March–May) 2020, (c) summer (June–August) 2019, (d) summer (June–August) 2020, (e) fall (September–November) 2019, (f) fall (September–November) 2020, (g) winter (Dec 2019–February 2020), and (h) winter (December 2020–February 2021). T-Arab PL: Trans-Arabian Line (Tapline), E-W PL: East–West pipeline (Petroline).
The high energy demands in GCC countries during summer seasons could be a major cause of high methane mixing ratio over the region (Figure 5c,d). Most of the GCC countries use fossil fuel to generate electricity and to operate mega water desalination planets. GCC countries usually observe high temperature (35–50 °C) and relative humidity (40–80%) [28] during the summer time, which results in overusing air conditioners and water. In summer 2020, higher methane emissions were observed compared to summer 2019. Although most GCC countries significantly reduced their oil production during June–August 2020 (Figure 2 and Figure 3), high methane emissions were still observed during summer 2020 (Figure 5d). This could be attributed to the long life spans of methane in the atmosphere.
During fall 2019, low methane emissions were observed at West Saudi Arabia, while higher methane emissions were observed at central Saudi Arabia and other GCC countries (Figure 5e). While methane emissions in fall 2020 were higher than 2019 (Figure 5f), no significant increase in methane emissions was observed between fall and summer of 2020.
High methane emissions were observed in winter 2020 compared to winter 2019 (Figure 5g,h), while a large reduction in methane emissions was observed during winter compared to fall and summer of 2020.
This reduction is mainly observed in the north and west of Saudi Arabia. This methane emissions reduction in 2020 could be attributed to low oil production in Saudi Arabia during December 2020–January 2021.
In general, low methane emissions were observed in west side Saudi Arabia compared to its east side (Figure 5a–h), which is attributed to the relative low number of oil fields in the west side. A noticeable amount of methane emissions were observed around the Trans-Arabian pipeline (Tapline) in northern Saudi Arabia (Figure 5c) indicating a possible leak in this oil pipeline. This high methane emission around Tapline is mostly observed in spring 2019 and 2020 (Figure 5a,b). This possible leak is, however, not observed in the East–West oil pipeline that moves through central Saudi Arabia or the IPSA oil pipeline that connects Saudi Arabia and Kuwait oil fields.
3.1. Emission from Oil Fields
3.1.1. West and Central Saudi Arabia
Figure 6 displays methane emissions from oil refinery located in west (Yanbu, Jeddah, and Yasref) and central (Riyadh) Saudi Arabia during March 2019–February 2020 and March 2020–February 2021. It can be observed that during spring 2019, the highest methane emissions were observed during April by Yanbu, Jeddah, Yasref, and Riyadh refineries. Due to high oil production during spring 2020, an increase in methane emissions was observed at the west and central refineries; however, due to many missing observations, we could not determine the exact methane emission increase (Figure 6(a1–a4)).
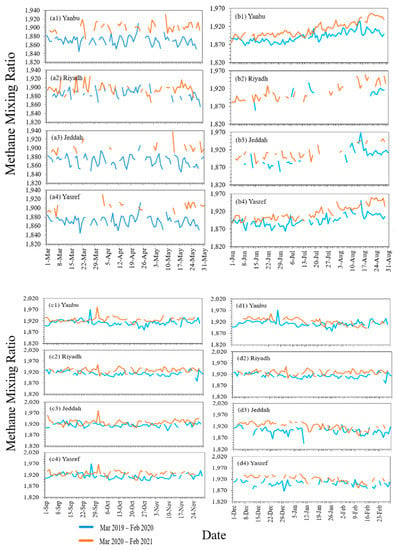
Figure 6.
Methane mixing ratio in west and central Saudi Arabia during March 2019–February 2020 and March 2020–February 2021 (a1–a4) spring (1 March–31 May), (b1–b4) summer (1 June–31 August), (c1–c4) fall (1 September–30 November), and (d1–d4) winter (1 December–28 February).
Towards the end of summer 2019, methane emissions had peaked to about 1930, 1970, and 1950 at Yanbu, Jeddah, and Yasref refineries, respectively (Figure 6(b1,b3,b4)). No high methane emissions values were recorded around the Riyadh refinery (Figure 6(b2)). A similar methane emission trend was observed during summer 2020 with peaks occuring around mid-August (Figure 6(b1–b4)).
Figure 6(c1–c4) show methane emissions during fall 2019 and 2020, respectively. High methane emissions were observed from 27 to 29 September 2019 at Yasrif oil refinery but it lasts only for few days. Interestingly, similar peaks were observed from 29 September to 6 October 2020 in Yanbu, Jeddah, Yasref, and Riyadh refineries. In general, higher methane emissions were observed is all west and central oil refineries in 2020 compared to 2019; however, no major increases in methane emissions were observed in winter 2020 compared to winter 2019 (Figure 6(d1–d4)).
3.1.2. East Saudi Arabia
Figure 7 displays methane emissions from Shaybah, Khurais, Safaniyah, Abqaiq, Al Wafra, Abu Safah, Jubail, and Ghawar oil refinery located in East Saudi Arabia during March 2019–February 2020 and March 2020–February 2021. Abqaiq is one of the largest oil production facilities in the GCC region that produces about 1.5 million barrels of oil per day [29]. Jubail hosts one of the largest oil refineries in the world and hosts one of the world’s longest coke handling conveyer system with a production of about 400,000 barrels of oil per day [30]. Al Wafra oil field is one of the oldest oil fields in the region shared between Saudi Arabia and Kuwait and has been halted for about five years from 2015 to 2020, and it resumed its production on July 2020. During spring 2019, high methane emissions were observed around Abqaiq and Jubail refinery around 19–26 April (Figure 7(a4,a7)). Figure 7(a5) shows low methane emissions from Al Wafra field while not in operation during 2019. Although many of the methane emissions data are missing over East Saudi Arabia during spring 2020, the high emission from Abqaiq and low emission from Al Wafra oil fields are still clearly observed (Figure 7(a4, a5)).
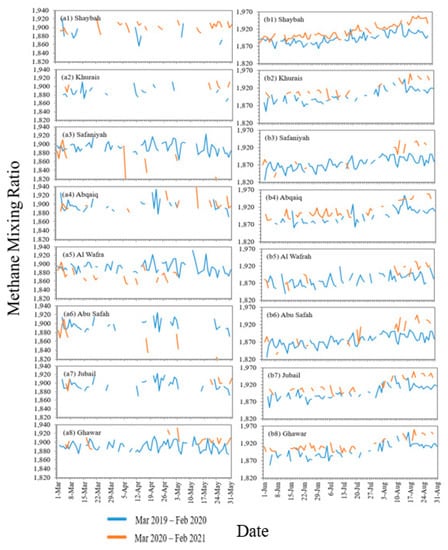
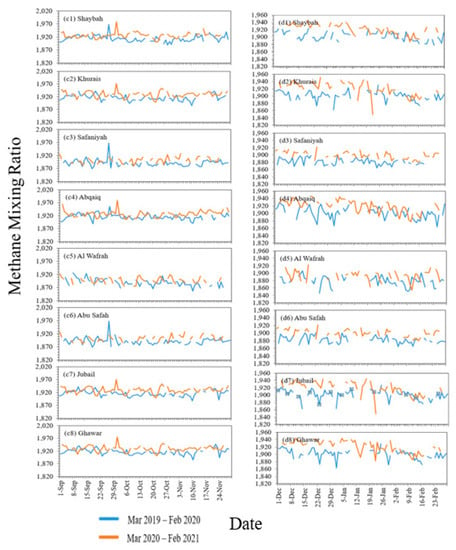
Figure 7.
Methane mixing ratio in East Saudi Arabia during March 2019–February 2020 and March 2020–February 2021 (a1–a8) spring (March 1–May 31), (b1–b8) summer (1 June–31 August), (c1–c8) fall (1 September–30 November), and (d1–d8) winter (1 December–28 February).
Figure 7(b1–b8) show the increase in methane emissions over all oil fields and refineries in East Saudi Arabia during June–August 2019. Highest emissions were generated from Abqaiq, Jubail, and Ghawar fields. The operation of Al Wafra field in July 2020 has increased methane emissions from the field during August 2020, as shown in the Figure 7(b5).
General stability in methane emissions is observed during fall 2019 (Figure 7(c1–c8)), except the emissions observed during 27–29 September 2019 in Abqaiq and Abu Safah fields (Figure 7(c4,c6)). A similar methane trend was observed in fall 2020 but with higher methane emissions. Highest emissions were observed from 29 September to 6 October in 2020 in Abqaiq and Ghawar fields (Figure 7(c4,c8)).
While methane emissions during winter 2020 are found larger than 2019, most of the high emissions came from Abqaiq and Ghawar fields in both years (Figure 7(d1–d8)).
3.1.3. Kuwait, Oman, UAE, Qatar, and Bahrain
Figure 8 displays methane emissions from Burgan (Kuwait), Saih Rawl (Oman), Falcon (Oman), Qatar Petroleum (Qatar), Al Ain (UAE), and Ras oilfields (Bahrain) oil refineries during March 2019–February 2020 and March 2020–February 2021. Most of the emissions were generated by Qatar Petroleum (Qatar), Burgan (Kuwait), and Falcon (Oman). Higher emissions were observed in all fields during September 2020–February 2021 compared to September 2019–February 2020.
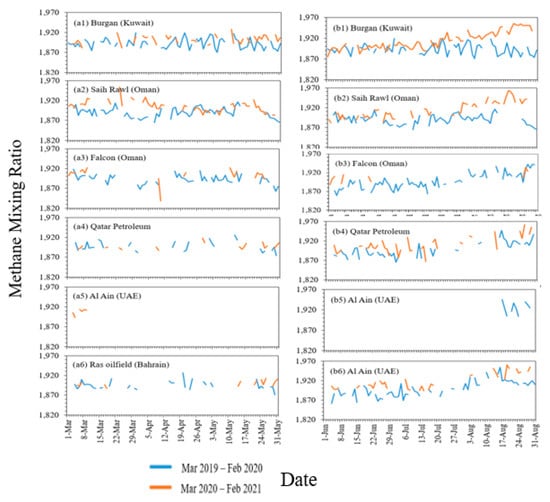
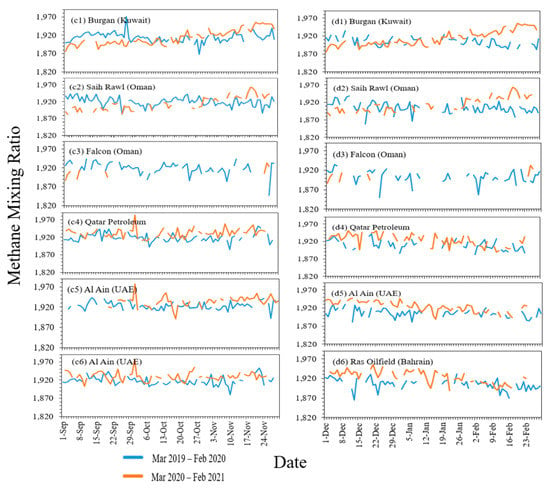
Figure 8.
Methane mixing ratio in Kuwait, Oman, UAE, Qatar, and Bahrain during March 2019–February 2020 and March 2020–February 2021 (a1–a6) spring (1 March–31 May), (b1–b6) summer (1 June–31 August), (c1–c6) fall (1 September–30 November), and (d1–d6) winter (1 December–28 February).
Based on continous data availability, methane emissions and location, we chose four oil refineries in Saudi Arabia and Kuwait to examine percent variation of menthane emissions during March 2019–February 2020 and March 2020–February 2021. Figure 9a–c show box plots of percent variation of methane emissions from Riyadh, Abqaiq, and Kuwait (Burgan) oil refineries/fields. In Riyadh, the average seasonal emission in the spring is ~0.57% higher in 2020 compared to 2019, while it is ~0.98, 0.81, and 1.02% higher in summer, fall, and winter, respectively, in 2020 compared to 2019. The maximum increase recorded is ~2.79% in winter 2020 compared to winter 2019 (Figure 9a). In Abqaiq, the average emission percentage significantly increased to ~1.3% in summer 2020 compared to summer 2019. While the increase in the spring and fall was relatively low (~0.14 and 0.54%, respectively), the increase in winter emission was ~0.96% in 2020 compared to 2019. Meanwhile, the maximum percentage increases recorded are 1.54, 3.69, 3.02, and 3.31% during the spring, summer, fall, and winter, respectively (Figure 9b). In Kuwait, the increase in emission percentage was ~0.56, 1.1, 0.61, and 0.90 during spring, summer, winter, and fall of 2020 compared to 2019 (Figure 9c). The increase in methane emissions from Al Wafra field after it returned to operation in April 2020 is clearly observed in Figure 9d. In 2020, methane emission increased by ~0.94, 0.65, and 0.71% compared to 2019 during summer, fall, and winter.
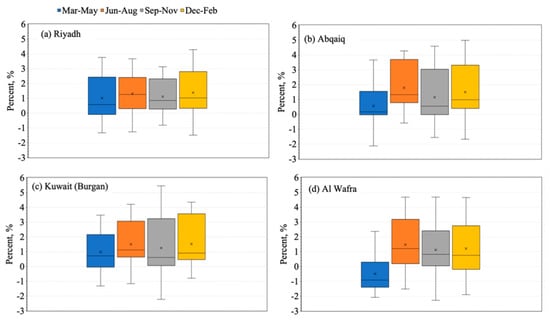
Figure 9.
Comparison of 2019/2020 percent change of methane emission from (a) Riyadh, (b) Abqaiq, (c) Kuwait (Burgan), and (d) Al Wafra oil fields and refineries. X represents data statistical mean.
In order to check the sensitivity of data to observational frequency, we have performed statistical p-value test to examine the significance of the difference in seasonal methane mixing ratio during spring, summer, fall, and winter in Riyadh, Abqaiq, Kuwait (Burgan), and Al Wafra oil refineries (Figure 10). The probability value (p-value) indicates how likely it is that the difference between the parameter’s values occurred by chance. A small p-value indicates that the result was unlikely to have occurred by chance alone. These results are called statistically significant. We tested the null hypotheses that the difference in methane mixing ratio between March 2019–February 2020 and March 2020–February 2021 is insignificant. In order to minimize the randomness in our results, we imposed a 95% confidence level with p-value < 0.05. This means that if p < 0.05, we will reject the null hypothesis. Statistical tests were performed only on matching days with valid measurements during both March 2019–February 2020 and March 2020–February 2021. The number of those matching days is indicated by the number above the bars in Figure 10. It can be observed from Figure 10 that the difference in seasonal mean methane mixing ration is significant (p < 0.05) expect during summer 2019 and 2020. This confirms that high methane emissions observed in 2020 compared to 2019 could be attributed to oil high production during 2020.
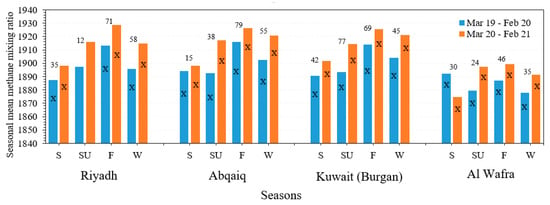
Figure 10.
Statistical p-value test to examine the significance of the difference in seasonal methane mixing ratio during March 2019–February 2020 and March 2020–February 2021 for spring, summer, fall, and winter seasons in Riyadh, Abqaiq, Kuwait (Burgan), and Al Wafra oil refineries. X indicates p < 0.05.
It is important to mention that the objective of the above the results is to show that 2020 has stronger methane emissions than 2019 and not to retreive methane emissions over the study region.
4. Conclusions
In this study, we have investigated the impact of oil industry on methane emissions over Gulf Cooperation Council (GCC) countries. The 2020 disagreement on oil production between some members of the Petroleum Exporting Countries (OPEC) led by Saudi Arabia and Russia has instigated a record increase in oil production and transport in the GCC region. Data from 19 oil fields and refineries located in Saudi Arabia, Kuwait, Oman, United Arab Emirates, Qatar, and Bahrain show that high oil production resulted in high methane emissions over the GCC region. Although the increase in methane emissions ranged between 0.5 and 3.7% only, it is directly linked to high oil production in 2020.
In the Riyadh refinery located in central Saudi Arabia, the average maximum annual percent increase in methane emission in 2020 compared to 2019 is around 2.5%, while the emission was mostly higher from June 2019–February 2020. The lowest percent increase in methane emission between 2019 and 2020 was recorded during March–May with 0.57% increase only.
In an Abqaiq oil field, one of the largest fields located in eastern Saudi Arabia, the maximum annual percent increase in methane emission in 2020 compared to 2019 is around 2.9%. The maximum methane emissions are about 3.69, 3.03, and 3.31% June–August, September–November, and December–February, respectively, compared to 1.54% only from March to May.
In a Burgan oil field in Kuwait, the average maximum annual percent increase in methane emissions is around 3.0% with a stable trend of the increase observed among all seasons. The average percent increase in methane emission from June to August and December to February is 1.1 and 0.9%, respectively, compared to 0.56 and 0.61% from March to May and September to November, respectively.
A large increase in percent methane emission was observed at the Al Wafra field shared between Saudi Arabia and Kuwait. After a five-year halt, crude oil production resumed from that field around the beginning of July 2020. Methane emissions from Al Wafra field almost doubled in June–August 2020 compared to March–May 2020.
In order to examine methane emissions while transporting oil products through a pipeline, we have investigated the emission from three major pipelines in the GCC region: the East–West pipeline connecting east to west fields of Saudi Arabia, the Iraq–Saudi Arabia (IPSA) pipeline connecting Saudi Arabia to Kuwait and to Iraq fields, and the Trans-Arabian (Tapline) oil pipeline between Saudi Arabia and Jordon. We found high emissions from the Tapline compared to other fields, which could be attributed to possible leaks in the Tapline. The emissions from Tapline have even increased in 2020, where more oil was pumped out in association with the conflicts on oil production.
Methane emission was also examined around major oil pipelines in the GCC region. Results indicate high methane emissions around the Trans-Arabian pipeline in northern Saudi Arabia, indicating a possible leak at this oil pipeline; however, other major pipelines such as East–West and IPSA oil pipelines do not generate such high emissions. High methane emissions from Al Wafra field shared between Saudi Arabia and Kuwait have been recorded after the field resumed its production in 2020, indicating the direct relation between high oil production and methane emissions over the GCC region.
Although the devastating oil production disagreement between GCC countries and Russia lasted for only about one month, it provided a good indicator on how the oil industry could have a large effect on methane emissions over the region.
Funding
The author (A.F.) would like to acknowledge the support provided by the Deanship of Scientific Research (DSR) at the King Fahd University of Petroleum and Minerals (KFUPM) for funding this work through project No. ISSP2103.
Institutional Review Board Statement
Not applicable.
Informed Consent Statement
Not applicable.
Data Availability Statement
Data available in a publicly accessible repository that does not issue DOIs. Publicly available datasets were analyzed in this study. This data can be found here: https://disc.gsfc.nasa.gov/datasets/S5P_L2__CH4____HiR_1/summary?keywords=CH4 (accessed on 31 December 2020).
Acknowledgments
Author would like to thank Peng Jing at the Institute of Earthquake Forecasting, Beijing, China, and Ramesh Singh at the Chapman University, CA, USA for useful discussion, and Ahmed Al Fifi for technical support.
Conflicts of Interest
The author declares no conflict of interest.
References
- NASA. Global Climate Change: Vital Signs of the Planet. 2021. Available online: www.climate.nasa.gove/evidence (accessed on 8 March 2021).
- EPA. United States Environmental Protection Agency, Green Gas Emissions. 2021. Available online: https://www.epa.gov/ghgemissions/overview-greenhouse-gases (accessed on 10 March 2021).
- Le Fevre, C. Methane Emissions: From Blind Spot to Spotlight, The Oxford Institute for Energy Studies. Available online: https://www.oxfordenergy.org/wpcms/wp-content/uploads/2017/07/Methane-Emissions-from-blind-spot-to-spotlight-NG-122.pdf (accessed on 2 November 2021).
- Saunois, M.; Stavert, A.R.; Poulter, B.; Bousquet, P.; Canadell, J.G.; Jackson, R.B.; Raymond, P.A.; Dlugokencky, E.J.; Houweling, S.; Patra, P.K.; et al. The Global Methane Budget 2000–2017. Earth Syst. Sci. Data 2020, 12, 1561–1623. [Google Scholar] [CrossRef]
- IEA. 2019. Available online: www.iea.org (accessed on 12 March 2021).
- JPT. ExxonMobil Field Tests New Methane Leak Detection Systems. 2020. Available online: https://jpt.spe.org/exxonmobil-field-tests-new-methane-leak-detection-systems (accessed on 12 March 2021).
- Hmiel, B.; Petrenko, V.V.; Dyonisius, M.N.; Buizert, C.; Smith, A.M.; Place, P.F.; Harth, C.; Beaudette, R.; Hua, Q.; Yang, B.; et al. Preindustrial 14CH4 indicates greater anthropogenic fossil CH4 emissions. Nature 2020, 578, 409–412. [Google Scholar] [CrossRef] [PubMed]
- Schwietzke, S.; Sherwood, O.; Bruhwiler, L.; Miller, J.B.; Etiope, G.; Dlugokencky, E.J.; Michel, S.E.; Arling, V.A.; Vaughn, B.H.; White, J.W.; et al. Upward revision of global fossil fuel methane emissions based on isotope database. Nature 2016, 538, 88–91. [Google Scholar] [CrossRef] [PubMed]
- Bilal, M.; Mhawish, A.; Nichol, J.; Qiu, Z.; Nazeer, M.; Ali, A.; Leeuw, G.; Levy, R.; Wang, Y.; Chen, Y.; et al. Air pollution scenario over Pakistan: Characterization and ranking of extremely polluted cities using long-term concentrations of aerosols and trace gases. Remote Sens. Environ. 2021, 264, 112617. [Google Scholar] [CrossRef]
- Alvarez, R.A.; Zavala-Araiza, D.; Lyon, D.R.; Allen, D.T.; Barkley, Z.R.; Brandt, A.R.; Davis, K.J.; Herndon, S.C.; Jacob, D.J.; Karion, A.; et al. Assessment of methane emissions from the U.S. oil and gas supply chain. Science 2018, 361, 186–188. [Google Scholar] [CrossRef] [PubMed]
- Alvarez, R.A.; Pacala, S.W.; Winebrake, J.J.; Chameides, W.L.; Hamburg, S.P. Methane leakage from natural gas infrastructure. Proc. Natl. Acad. Sci. USA 2012, 109, 6435–6440. [Google Scholar] [CrossRef] [PubMed] [Green Version]
- Krane, J. Climate Strategy for Producer Countries: The Case of Saudi Arabia. In When Can Oil Economies Be Deemed Sustainable? The Political Economy of the Middle East; Luciani, G., Moerenhout, T., Eds.; Palgrave Macmillan: Singapore, 2021. [Google Scholar]
- Sertin, C. $835bn in Active Oil and Gas Projects across GCC. Available online: https://www.oilandgasmiddleeast.com/33286-835bn-in-active-oil-and-gas-projects-across-gcc-protenders (accessed on 4 March 2020).
- Johnston, J.E.; Lim, E.; Roh, H. Impact of upstream oil extraction and environmental public health. Sci. Total Environ. 2019, 657, 187–199. [Google Scholar] [CrossRef] [PubMed]
- Organization of the Petroleum Exporting Countries. 2021. Available online: https://www.opec.org (accessed on 9 April 2021).
- Organization for Economic Co-operation and Development (OECD). The Impact of Coronavirus (COVID-19) and the Global Oil Price Shock on the Fiscal Position of Oil-Exporting Developing Countries. 2020. Available online: https://www.oecd.org/coronavirus/policy-responses/the-impact-of-coronavirus-covid-19-and-the-global-oil-price-shock-on-the-fiscal-position-of-oil-exporting-developing-countries-8bafbd95/ (accessed on 16 April 2021).
- World Oil. 2020. Available online: https://www.worldoil.com/ (accessed on 18 April 2021).
- Trading Economics. 2021. Available online: https://tradingeconomics.com/saudi-arabia/crude-oil-production (accessed on 5 April 2021).
- Veefkind, J.P.; Aben, I.; McMullan, K.; Forster, H.; de Vries, J.; Otter, G.; Visser, H. TROPOMI on the ESA Sentinel-5 Precursor: A GMES mission for global observations of the atmospheric composition for climate, air quality and ozone layer applications. Remote Sens. Environ. 2012, 120, 70–83. [Google Scholar] [CrossRef]
- Levelt, P.F.; Van Den Oord, G.H.; Dobber, M.R.; Malkki, A.; Visser, H.; De Vries, J.; Stammes, P.; Lundell, J.O.; Saari, H. The Ozone Monitoring Instrument. IEEE Trans. Geosci. Remote Sens. 2006, 44, 1093–1101. [Google Scholar] [CrossRef]
- Bergamaschi, P.; Frankenberg, C.; Meirink, J.F.; Krol, M.; Villani, M.G.; Houweling, S.; Dentener, F.; Dlugokencky, E.J.; Miller, J.B.; Gatti, L.V.; et al. Inverse modeling of global and regional CH4 emissions using SCIAMACHY satellite retrievals. J. Geophys. Res. Atmos. 2009, 114, D22301. [Google Scholar] [CrossRef] [Green Version]
- Bovensmann, H.; Burrows, J.P.; Buchwitz, M.; Frerick, J.; Noël, S.; Rozanov, V.V.; Chance, K.V.; Goede, A.P.H. Sciamachy: Mission objectives and measurement modes. J. Atmos. 1999, 56, 127–150. [Google Scholar] [CrossRef] [Green Version]
- Ingmann, P.; Veihelmann, B.; Langen, J.; Lamarre, D.; Stark, H.; Courrèges-Lacoste, G.B. Requirements for the GMES Atmosphere Service and ESA’s implementation concept: Sentinels-4/-5 and -5p. Remote Sens. Environ. 2012, 120, 58–69. [Google Scholar] [CrossRef]
- Butz, A.; Galli, A.; Hasekamp, O.; Landgraf, J.; Tol, P.; Aben, I. TROPOMI aboard Sentinel-5 Precursor: Prospective performance of CH4 retrievals for aerosol and cirrus loaded atmospheres. Remote Sens. Environ. 2012, 120, 267–276. [Google Scholar] [CrossRef]
- Hasekamp, O.; Lorente, A.; Hu, H.; Butz, A.; aan de Brugh, J.; Landgraf, J. Algorithm Theoretical Baseline Document for Sentinel-5 Precursor Methane Retrieval. Available online: https://sentinel.esa.int/documents/247904/2476257/Sentinel-5P-TROPOMI-ATBD-Methane-retrieval (accessed on 6 November 2021).
- Maasakkers, J.D.; Jacob, D.J.; Sulprizio, M.P.; Scarpelli, T.R.; Nesser, H.; Sheng, J.-X.; Zhang, Y.; Hersher, M.; Bloom, A.A.; Bowman, K.W.; et al. Global distribution of methane emissions, emission trends, and OH concentrations and trends inferred from an inversion of GOSAT satellite data for 2010–2015. Atmos. Chem. Phys. 2019, 19, 7859–7881. [Google Scholar] [CrossRef] [Green Version]
- Lorente, A.; Borsdorff, T.; Butz, A.; Hasekamp, O.; aan de Brugh, J.; Schneider, A.; Wu, L.; Hase, F.; Kivi, R.; Wunch, D.; et al. Methane retrieved from TROPOMI: Improvement of the data product and validation of the first 2 years of measurements. Atmos. Meas. Tech. 2021, 14, 665–684. [Google Scholar] [CrossRef]
- Farahat, A. Air pollution in the Arabian Peninsula (Saudi Arabia, the United Arab Emirates, Kuwait, Qatar, Bahrain, and Oman): Causes, effects, and aerosol categorization. Arab. J. Geosci. 2016, 9, 196. [Google Scholar] [CrossRef]
- NS Energy. Available online: https://www.nsenergybusiness.com/projects/abqaiq-oil-processing-facility/ (accessed on 22 April 2021).
- Saptrop. 2021. Available online: http://www.satorp.com/ (accessed on 28 April 2021).
Publisher’s Note: MDPI stays neutral with regard to jurisdictional claims in published maps and institutional affiliations. |
© 2021 by the author. Licensee MDPI, Basel, Switzerland. This article is an open access article distributed under the terms and conditions of the Creative Commons Attribution (CC BY) license (https://creativecommons.org/licenses/by/4.0/).