
Meteorological Variables That Affect the Beginning of Flowering of the Winter Oilseed Rape in the Czech Republic

 , and
, and
Abstract
:1. Introduction
2. Material and Methods
3. Results
4. Discussion
5. Conclusions
Author Contributions
Funding
Data Availability Statement
Conflicts of Interest
References
- Hájková, L.; Voženílek, V.; Tolasz, R.; Kohut, M.; Možný, M.; Nekovář, J.; Novák, M.; Reitschläger, J.D.; Richterová, D.; Stříž, M.; et al. Atlas of the Phenological Conditions in Czechia; CHMI Prague-UP Olomouc: Prague, Czech Republic, 2012; p. 312. [Google Scholar]
- Kirkegaard, J.A.; Lilley, J.M.; Morrison, M.J. Drivers of trends in Australian canola productivity and future prospects. Crops Pasture Sci. 2016, 67, i–ix. [Google Scholar] [CrossRef] [Green Version]
- D’Amato, G.; Cecchi, L.; Bonini, S.; Nunes, C.; Annesi-Maesano, I.; Behrendt, H.; Liccardi, G.; Popov, T.; van Cauwenberge, P. Allergenic pollen and pollen allergy in Europe. Allergy 2007, 62, 976–990. [Google Scholar] [CrossRef] [PubMed]
- Marjanovič-Jeromela, A.; Terzič, S.; Jankulovska, M.; Zorič, M.; Kondič-Špika, A.; Jockovič, M.; Hristov, N.; Crnobarac, J.; Nagl, N. Dissection of Year Related Climatic Variables and Their Effect on Winter Rapeseed (Brassica Napus L.) Development and Yield. Agronomy 2019, 9, 517. [Google Scholar] [CrossRef] [Green Version]
- Balodis, O.; Gaile, Z. Sowing date and rate effect on winter oilseed rape (Brassica napus L.) yield components formation. Proc. Latv. Acad. Sci. Sect. B 2016, 70, 384–392. [Google Scholar] [CrossRef] [Green Version]
- Weymann, W.; Bőttcher, U.; Sieling, K.; Kage, H. Effects of weather conditions during different growth phases on yield formation of winter oilseed rape. Field Crops Res. 2015, 173, 41–48. [Google Scholar] [CrossRef]
- About the Pan European Phenology Project PEP725. Available online: www.pep725.eu (accessed on 1 November 2021).
- Chuine, I.; de Cortazar-Atauri, I.G.; Kramer, K.; Hanninen, H. Plant development models. In Phenology: An Integrative Environmental Science; Schwartz, M.D., Ed.; Springer: Dordrecht, The Netherlands, 2013; pp. 275–293. [Google Scholar]
- Vitasse, Y.; Francois, C.; Delpierre, N.; Dufrene, E.; Kremer, A.; Chuine, I.; Delzon, S. Assesing the effects of climate change on the phenology of European temperate trees. Agric. For. Meteorol. 2011, 151, 969–980. [Google Scholar] [CrossRef]
- Roltsch, W.J.; Zalom, F.G.; Strawn, A.J.; Strand, J.F.; Pitcairn, M.J. Evaluation of several degree-day estimation methods in California climates. Int. J. Biometeorol. 1999, 42, 169–176. [Google Scholar] [CrossRef]
- Botta, A.; Viovy, N.; Ciais, P.; Friedlingstein, P.; Monfray, P. A global prognostic scheme of leaf onset using satellite data. Glob. Chang. Biol. 2000, 6, 709–725. [Google Scholar] [CrossRef]
- Jolly, W.M.; Nemani, R.; Running, S.W. A generalized, bioclimatic index to predict foliar phenology in response to climate. Glob. Chang. Biol. 2005, 11, 619–632. [Google Scholar] [CrossRef]
- Templ, B.; Fleck, S.; Templ, M. Change of plant phenophases explained by survival modeling. Int. J. Biometeorol. 2017, 61, 881–889. [Google Scholar] [CrossRef]
- Bennie, J.; Kubin, E.; Wiltshire, A.; Huntley, B.; Baxter, R. Predicting spatial and temporal patterns of bud-burst and spring frost risk in north-west Europe: The implications of local adaptation to climate. Glob. Chang. Biol. 2010, 16, 1503–1514. [Google Scholar] [CrossRef]
- Meier, U. BBCH-Monograph: Growth Stages of Mono- and Dicotyledonous Plants, 2nd ed.; Technical Report; Federal Biological Research Centre for Agriculture and Forestry: Bonn, Germany, 2001. [Google Scholar]
- Tolasz, R.; Míková, T.; Valeriánová, A.; Voženílek, V. Climate Atlas of Czechia, 1st ed.; CHMI: Prague, Czech Republic, 2007; p. 255. ISBN 978-80-86690-26-1. [Google Scholar]
- Květoň, V.; Voženílek, V. Climatic Regions of Czechia–Quitt’s Classification during Years 1961–2000; Palackého University: Olomouc, Czech Republic, 2011; p. 20. ISBN 978-80-244-2813-0. [Google Scholar]
- Černá, H.; Bartošová, L.; Trnka, M.; Bauer, Z.; Štěpánek, P.; Možný, M.; Dubrovský, M.; Žalud, Z. The analysis of long-term phenological data of apricot tree (Prunus armeniaca L.) in southern Moravia during 1927–2009. Acta Univ. Agric. Et Silvic. Mendel. Brun. 2012, 60, 9–18. [Google Scholar] [CrossRef]
- Solantie, R. Daytime temperature sum—A new thermal variable describing growing season characteristics and explaining evapotranspiration. Boreal Environ. Res. 2004, 9, 319–333. [Google Scholar]
- Zahradníček, P.; Rasol, D.; Cindric, K.; Štěpánek, P. Homogenization of monthly precipitation time series in Croatia. Int. J. Climatol. 2014, 34, 3671–3682. [Google Scholar] [CrossRef]
- Ahas, R.; Aasa, A.; Menzel, A.; Fedotova, V.G.; Scheifinger, H. Changes in European spring phenology. Int. J. Climatol. 2002, 22, 1727–1738. [Google Scholar] [CrossRef]
- Chmielewski, F.M.; Műller, A.; Bruns, E. Climate changes and trends in phenology of fruit trees and field crops in Germany, 1961–2000. Agric. For. Meteorol. 2004, 121, 69–78. [Google Scholar] [CrossRef]
- Menzel, A.; Sparks, T.H.; Estrella, N.; Koch, E.; Aasa, A.; Ahas, R.; Alm-Kübler, K.; Bissolli, P.; Braslavská, O.G.; Briede, A.; et al. European phenological response to climate change matches the warming patterns. Glob. Chang. Biol. 2006, 12, 1969–1976. [Google Scholar] [CrossRef]
- Poikolainen, J.; Tolvanen, A.; Karhu, J.; Kubin, E. Seventeen-year trends in spring and autumn phenophases of Betula pubescens in a boreal environment. Int. J. Biometeorol. 2016, 60, 1227–1236. [Google Scholar] [CrossRef]
- Hájková, L.; Kožnarová, V.; Možný, M.; Bartošová, L. Influence of climate change on flowering season of birch in the Czech Republic. Int. J. Biometeorol. 2020, 64, 791–801. [Google Scholar] [CrossRef]
- Franks, S.J.; Sim, S.; Weis, A.E. Rapid evolution of flowering time by an annual plant in response to a climate fluctuation. Proc. Natl. Acad. Sci. USA 2007, 104, 1278–1282. [Google Scholar] [CrossRef] [Green Version]
- Branzi, G.P.; Zanotti, A.L. Estimate and mapping of the activity of airborne pollen sources. Aerobiologia 1992, 8, 69–74. [Google Scholar] [CrossRef]
- Andrimont, R.; Taymans, M.; Lemoine, G.; Ceglar, A.; Yordanov, M.; Velde, M. Detecting flowering phenology in oil seed rape parcels with Sentinel-1 and -2 time series. Remote Sens. Environ. 2020, 239, 111660. [Google Scholar] [CrossRef]
- Kirkegaard, J.A.; Lilley, J.M.; Brill, R.D.; Ware, A.H.; Walela, C.K. The critical period for yield and quality determination in canola (Brassica napus L.). Field Crop. Res. 2018, 222, 180–188. [Google Scholar] [CrossRef]
- Schiessl, S.; Iniguez-Luy, F.; Qian, W.; Snowdon, R.J. Diverse regulatory factors associate with flowering time and yield responses in winter-type Brassica napus. BMC Genom. 2015, 16, 737. [Google Scholar] [CrossRef] [Green Version]
- Habekotte, B. A model of the phenological development of winter oilseed rape (Brassica napus L.). Field Crops Res. 1997, 54, 127–136. [Google Scholar] [CrossRef]
- Klabzuba, J.; Kožnarová, V. Usage possibilities of standard climatic characteristics for agrometeorological purposes. Folia Oecologica 2008, 35, 60–65. [Google Scholar]
- Brown, J.K.M.; Beeby, R.; Penfield, S. Yield instability of winter oilseed rape modulated by early winter temperature. Sci. Rep. 2019, 9, 6953. [Google Scholar] [CrossRef] [Green Version]
- Soltani, E.; Adeli, R.; Akbari, G.A.; Ramshini, H. Application of hydrotime model to predict early vigour of rapeseed (Brassica napus L.) under abiotic stresses. Acta Physiol. Plant. 2017, 39, 252. [Google Scholar] [CrossRef]
- Farzaneh, S.; Soltani, E.; Zeinali, E.; Ghaderi-Far, F. Screening oil seed rape germination for thermotolerance using a laboratory-based mathod. Seed Tech. 2014, 36, 15–27. [Google Scholar]
- Derakhshan, A.; Bakhshandeh, A.; Siadat, S.A.; Moradi-Telavat, M.R.; Andarzian, S.B. Quantifying the germination response of spring canola (Brassica napus L.) to temperature. Ind. Crop. Prod. 2018, 122, 195–201. [Google Scholar] [CrossRef]
- Luo, T.; Xian, M.; Khan, M.N.; Hu, L.; Xu, Z. Estimation of base temperatur efor germination of rapeseed (Brassica napus) using different models. Int. J. Agric. Biol. 2018, 20, 524–530. [Google Scholar] [CrossRef]
- Szparaga, A.; Kocira, S. Generalized logistic functions in modelling emergence of Brassica napus L. PLoS ONE 2018, 13, e0201980. [Google Scholar] [CrossRef] [PubMed]
- Nowosad, K.; Liersch, A.; Poplawska, W.; Bocianowski, J. Genotype by environment interaction for oil content in winter oilseed rape (Brassica napus L.) using additive main effects and multiplicative interaction model. Indian J. Genet. 2017, 77, 293–297. [Google Scholar] [CrossRef] [Green Version]
- Jackson, S.T.; Lyford, M.E. Pollen dispersal models in Quaternary plant ecology: Assumptions, parameters, and prescriptions. Bot. Rev. 1999, 65, 39–75. [Google Scholar] [CrossRef]
- Clot, B. Airborne birch pollen in Neuchâtel (Switzerland): Onset, peak and daily patterns. Aerobiologia 2001, 17, 25–29. [Google Scholar] [CrossRef]
- Zhang, Y.; Bielory, L.; Georgopoulos, P.G. Climate change effect on Betula (birch) and Quercus (oak) pollen seasons in the United States. Int. J. Biometeorol. 2014, 58, 909. [Google Scholar] [CrossRef] [Green Version]
- Beggs, P.J. (Ed.) Impacts of Climate Change on Allergens and Allergic Diseases; Cambridge University Press: Cambridge, UK, 2016. [Google Scholar]
- Ziska, L.H.; Makra, L.; Harry, S.K.; Bruffaerts, N.; Hendrickx, M.; Coates, F.; Saarto, A.; Thibaudon, M.; Oliver, G.; Damialis, A.; et al. Temperature-related changes in airborne allergic pollen abundance and seasonality across the northern hemisphere: A retrospective data analysis. Lancet Planet. Health 2019, 3, e124–e131. [Google Scholar] [CrossRef] [Green Version]


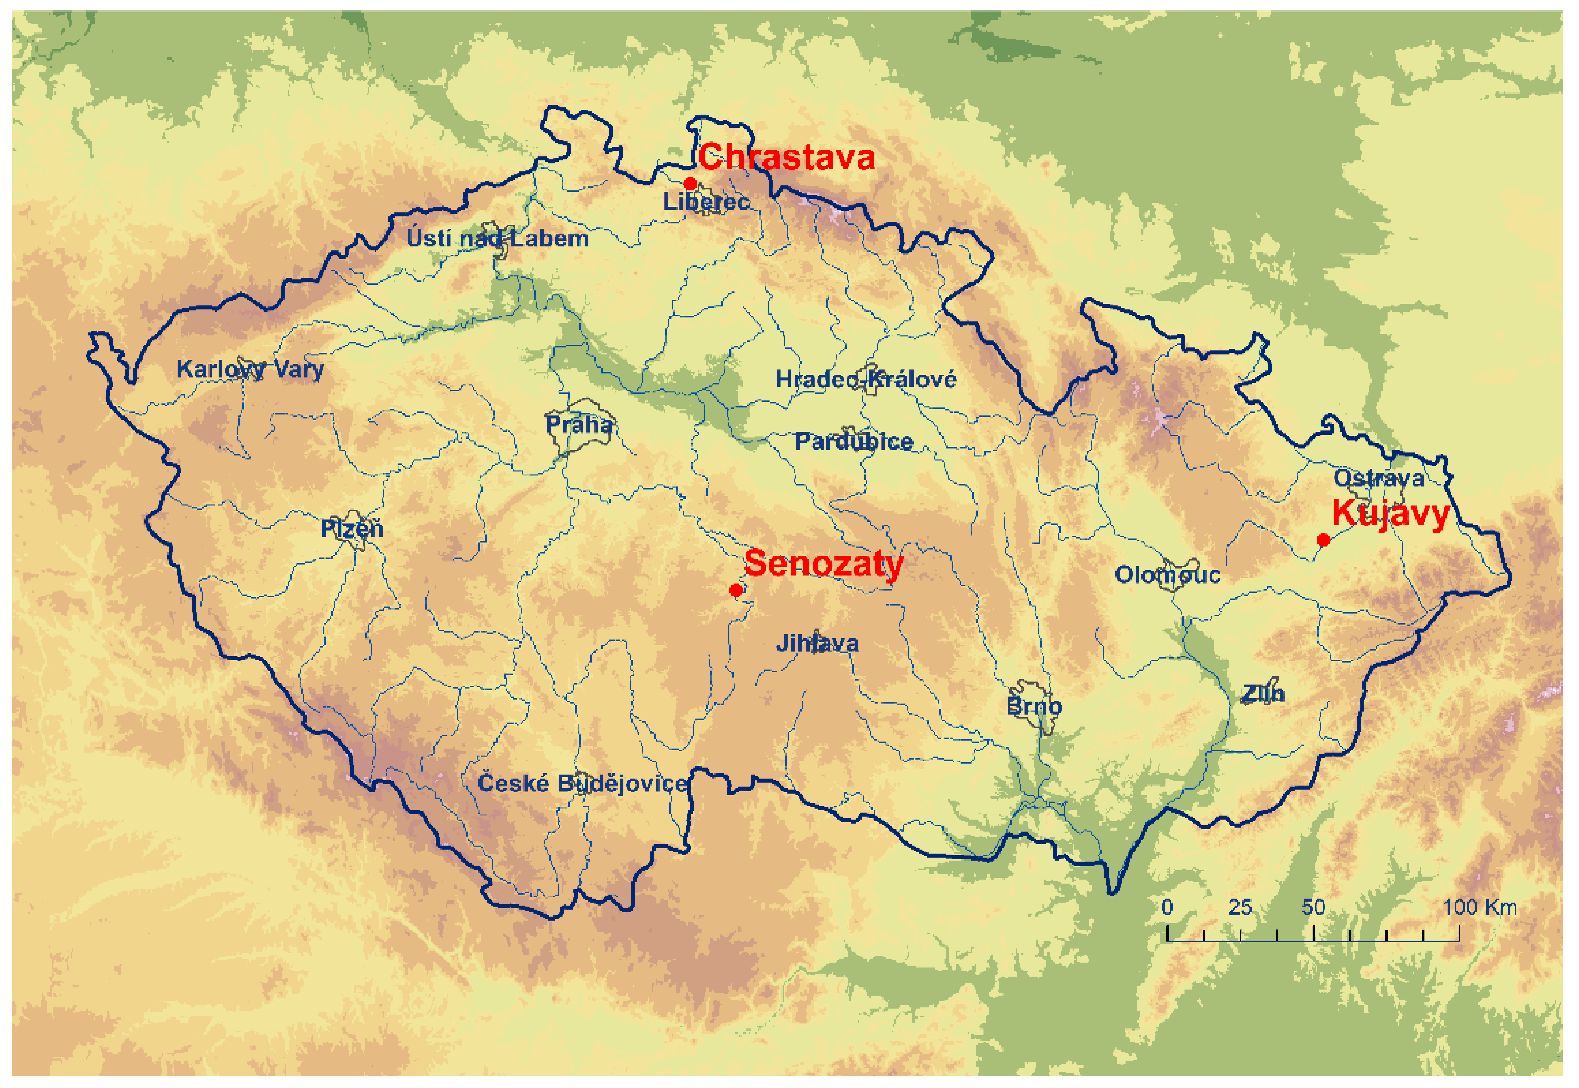
| Station | Longitude | Latitude | Altitude (m a.s.l.) | Station | Longitude | Latitude | Altitude (m a.s.l.) | Quitt’s Classification |
|---|---|---|---|---|---|---|---|---|
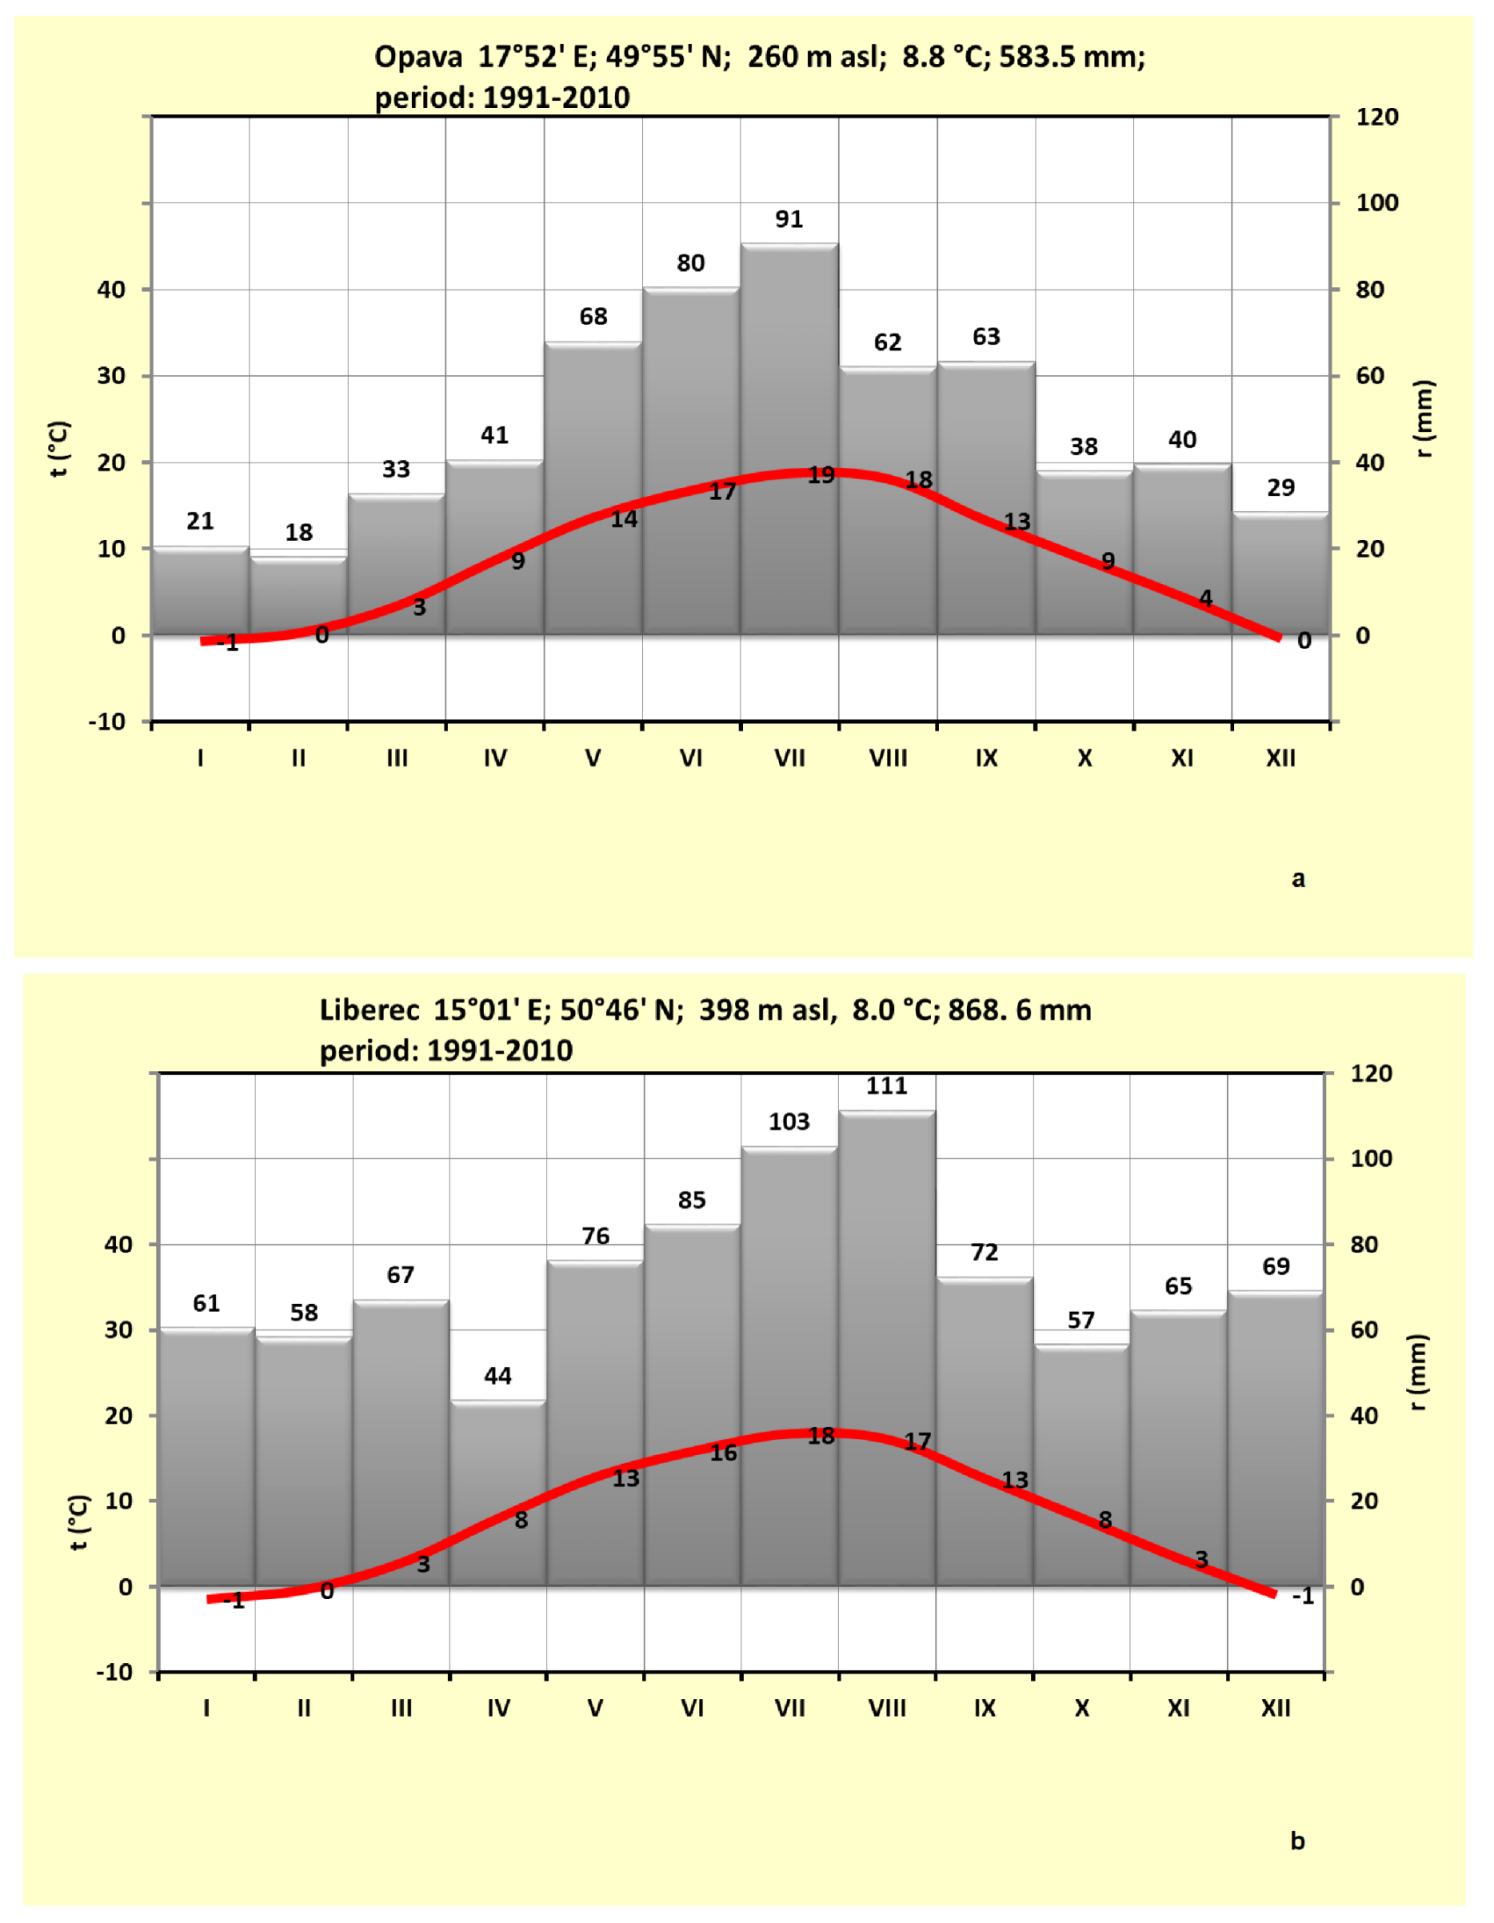
| Kujavy (P) | 17°51′ | 49°52‘ | 260 | Opava (C) | 17°52′ | 49°55‘ | 270 | W2 |
| Chrastava (P) | 15°00′ | 50°48‘ | 310 | Liberec (C) | 15°01′ | 50°46‘ | 398 | C7 |
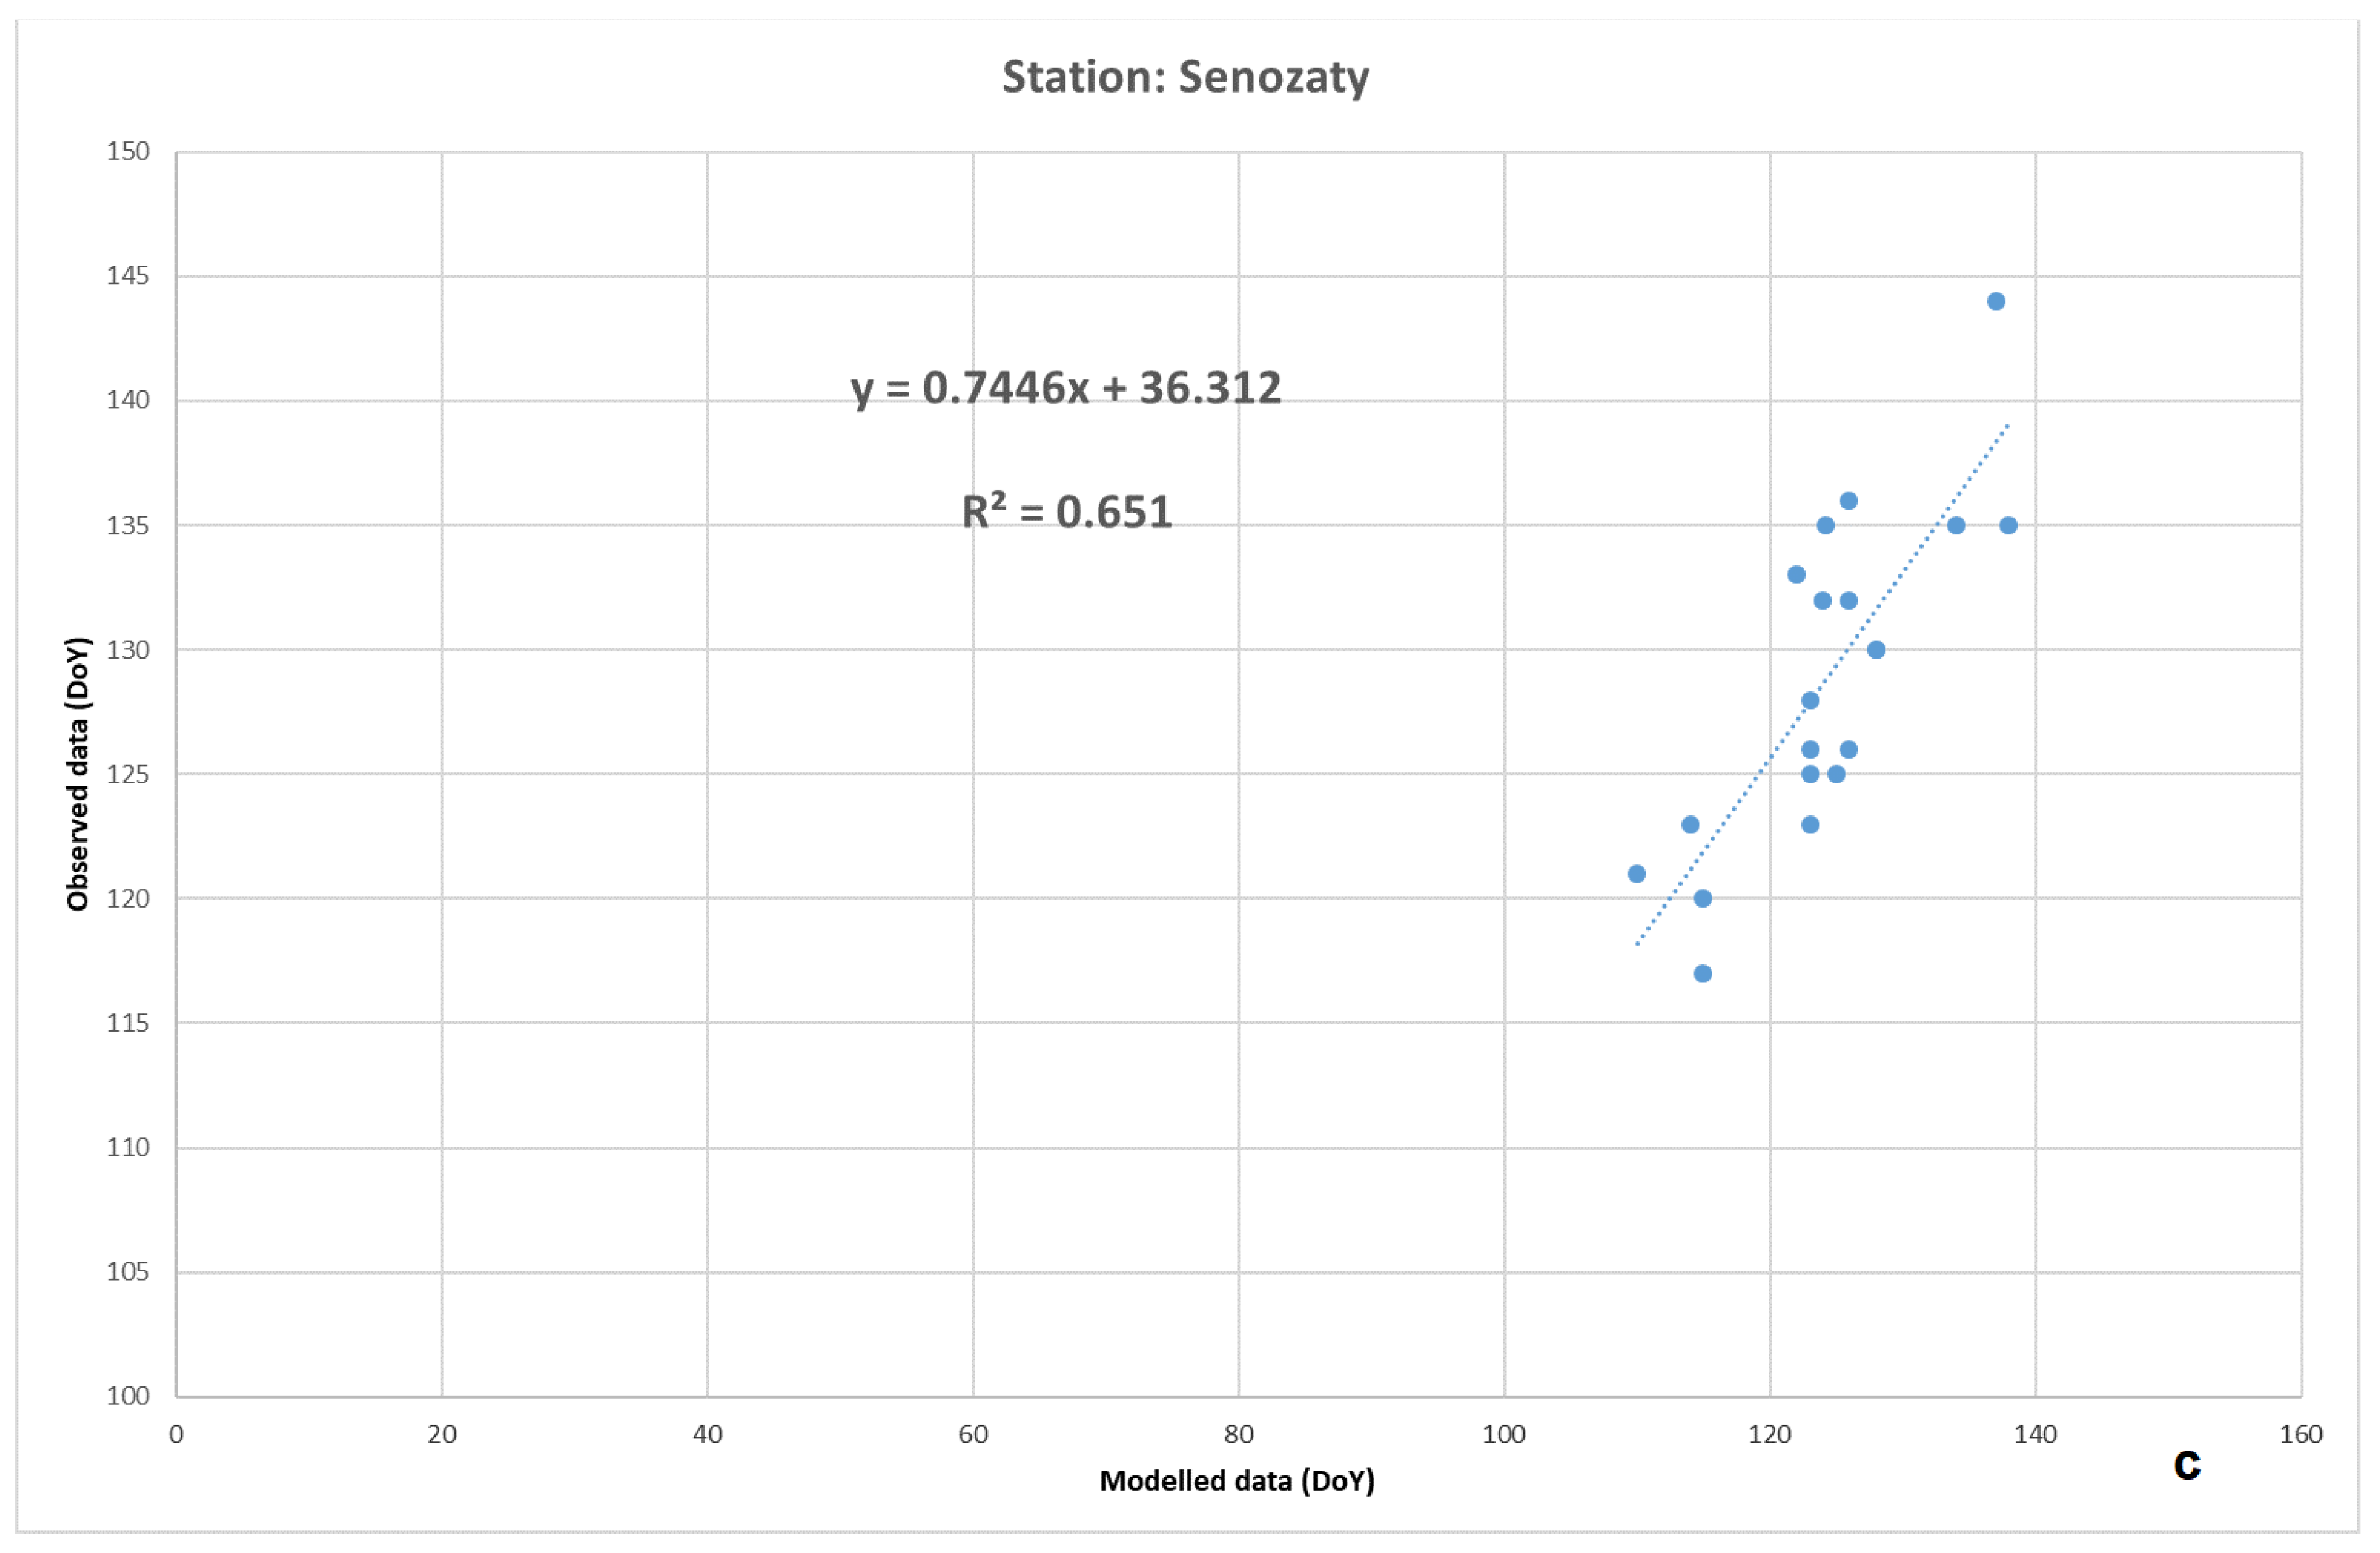
| Senožaty (P) | 15°04′ | 49°33‘ | 470 | Košetice (C) | 15°04′ | 49°34‘ | 533 | MW7 |
| Station | Per | R2 |
|---|---|---|
| Kujavy | −15.6 | 0.45 |
| Chrastava | −10.7 | 0.16 |
| Senožaty | −14.9 | 0.38 |
| RMSE | MBE | R2 | Threshold (Tbase) | Sums (Ts) | Start Day | Meteorological Element | |
|---|---|---|---|---|---|---|---|
| Brassica napus BBCH 60 | 4.78 | −3.00 | 0.55 | 6.0 | 157.0 | 30 | Tmean |
| 5.68 | −4.25 | 0.52 | 6.0 | 165.0 | 30 | Tmean | |
| 6.17 | −4.88 | 0.52 | 6.0 | 169.0 | 30 | Tmean | |
| 6.28 | −4.92 | 0.52 | 6.0 | 170.0 | 30 | Tmean | |
| 5.85 | −4.42 | 0.51 | 6.0 | 167.0 | 30 | Tmean |
Publisher’s Note: MDPI stays neutral with regard to jurisdictional claims in published maps and institutional affiliations. |
© 2021 by the authors. Licensee MDPI, Basel, Switzerland. This article is an open access article distributed under the terms and conditions of the Creative Commons Attribution (CC BY) license (https://creativecommons.org/licenses/by/4.0/).
Share and Cite
Hájková, L.; Možný, M.; Oušková, V.; Bartošová, L.; Dížková, P.; Žalud, Z. Meteorological Variables That Affect the Beginning of Flowering of the Winter Oilseed Rape in the Czech Republic. Atmosphere 2021, 12, 1444. https://doi.org/10.3390/atmos12111444
Hájková L, Možný M, Oušková V, Bartošová L, Dížková P, Žalud Z. Meteorological Variables That Affect the Beginning of Flowering of the Winter Oilseed Rape in the Czech Republic. Atmosphere. 2021; 12(11):1444. https://doi.org/10.3390/atmos12111444
Chicago/Turabian StyleHájková, Lenka, Martin Možný, Veronika Oušková, Lenka Bartošová, Petra Dížková, and Zdeněk Žalud. 2021. "Meteorological Variables That Affect the Beginning of Flowering of the Winter Oilseed Rape in the Czech Republic" Atmosphere 12, no. 11: 1444. https://doi.org/10.3390/atmos12111444
APA StyleHájková, L., Možný, M., Oušková, V., Bartošová, L., Dížková, P., & Žalud, Z. (2021). Meteorological Variables That Affect the Beginning of Flowering of the Winter Oilseed Rape in the Czech Republic. Atmosphere, 12(11), 1444. https://doi.org/10.3390/atmos12111444