Abstract
The adverse health impact of particles and ultrafine particles (UFP) is proven, highlighting the need of measuring the particle number concentration (PNC) dominated by UFP. So far, PNC had never been measured in the Strasbourg urban area (France). The present study on particle size distribution and PNC measurements by an UFP-3031 analyzer was conducted during winter 2019 on a background and a roadside multi-instrumented sites (Black Carbon, chemical speciation, particulate matter 10 μm or less in diameter—PM10 mass). This paper shows significantly higher particle number concentrations of particles below 100 nm at the traffic site compared to the background site. The presence of a road axis thus mainly influences UFP, contrary to larger particles whose levels are more homogeneous over the agglomeration. During the measurement period, the nature of the particles (particle size contribution and chemical composition) was different between periods of high PM10 mass concentrations and periods of high PNC. High PM10 mass concentrations were associated with a high contribution of particles larger than 100 nm but they did not show specific chemical signature. On the other hand, during the periods with high PNC, the chemical composition was modified with an increase of the primary carbonaceous fraction compared to the periods with low PNC, but there was then no clear change in size distribution. Overall, this study illustrates that PM10 mass concentrations were barely representative of UFP and PNC variations, confirming that the monitoring of the latter metrics is necessary to better evaluate the particles toxicity, knowing that this toxicity also depends on the particle’s chemical composition.
1. Introduction
Adverse health effects induced by air pollutants are nowadays considered as a major sanitary issue. The World Health Organization (WHO) has classified outdoor air pollution as carcinogenic to humans (Group 1) in 2013 [1]. Among atmospheric pollutants, particulate matter (PM) is known as one of the main contributors to health effects. Since 2009, the French National Agency for Food, Environmental and Occupational Health Safety (ANSES) has declared that “there is no concentration threshold below which particles have no effect on health” [2].
These health impacts depend on the size and chemical composition of the particles. In recent years, an increase in the toxicity of the particles of identical composition has been related with the decrease of their diameter [3]. Ultrafine Particles (UFP) are commonly defined as the fraction of particles with an aerodynamic diameter lower than 0.1 µm (they can therefore also be called PM0.1). UFP are associated with health effects on the cardiovascular and respiratory systems [4]. They are the particles with the highest probability of reaching the deepest part of the respiratory tract to the pulmonary alveoli, although deposition in the upper respiratory tract (naso-pharynx) of the particles smaller than 20 nm occurs by diffusion process [5,6,7]. UFP seem to induce a local inflammatory response and are associated with a higher production of Reactive Oxygen Species (ROS) than larger particles [5,8]. Yacobi et al. [9] have shown that UFP have the ability to cross the alveolar-capillary barrier and thus pass into the bloodstream. In the blood system, they can be transported throughout the body to other organs by translocation and, then, potentially affect them. Other biological barriers, such as the gastrointestinal barrier [10] and the placental barrier [11], also appear to be permeable to UFP. Moreover, UFP can also adsorb toxic compounds, such as polycyclic aromatic compounds (PAHs), because of their large reactive surface [5,12]. These specific properties have been highlighted, but further studies are needed to better understand the underlying mechanisms.
Ultrafine particles can be primary (i.e., emitted directly in particulate form) or secondary (i.e., formed in-situ in the atmosphere from anthropogenic and biogenic precursors) [13]. Primary UFP are mainly emitted by combustion processes. Kumar et al. [14] have shown that UFP are mainly anthropogenic-born with more than 60% of emissions in urban areas being associated with road traffic. Biomass combustion, industry, and aviation are also sources of significant emissions of primary UFP [15]. Secondary UFP are formed by condensation of precursors gases with low saturation vapor pressure emitted after combustion processes (exhaust, industry). Another formation of secondary UFP appears directly in atmosphere involving photochemistry and leads to new particle formation events (NPF), called regional nucleation. The binary and ternary sulfuric acid nucleation is a major source of NPF events, but other oxidized compounds may be involved, such as volatile organic compounds (VOCs). This process can also become a major source of UFP in the summer when photochemical activity is important, especially in rural areas where the regional nucleation can be higher than other primary sources, such as emissions from traffic and urban heating [16,17].
Up until now, the European regulations for air quality (directive n°2008/50/EC of 21 May 2008) only focus on mass concentrations, and there are no further requirements regarding ultrafine particles or number concentrations. However, UFP represent only a small part of the total mass of particles in the atmosphere while in urban areas, UFP contribute to more than 80% of the concentration number (particle/cm3 or #/cm3), which is therefore a more representative metric than mass concentration [13]. In addition to the number concentration, the study of particle size distribution can be helpful to identify sources and to better understand the processes of formation and growth of UFP. The identification of industrial source of formation of secondary UFP was highlighted by the strong correlation between the number concentration of the 20–30 nm size range and the sulfur dioxide concentration, not observed on larger particles [18,19]. This relation is the consequence of the nucleation process of sulfuric acid formed by oxidation of a part of sulfur dioxide emitted by industry. Other sources of larger particles were observed thanks to particle size distribution. A strong correlation was shown between the 100–200 nm size range and the wood burning tracers. This correlation was confirmed by the seasonal and diurnal variations [20,21,22] and by specific events, such as forest fires [19].
This work presents the first results of particle size distribution and particle number concentration (PNC) measurements in the agglomeration of Strasbourg (northeast of France). The study sites were also instrumented with a chemical composition analyzer and PM and gases analyzers. These “super-sites” are recommended to better understand the particles behavior [23]. The two sites are in the same agglomeration, but one is located in the background area while the other is close to a road axis. One aim of this experimental setting was to identify the influence of traffic. The PNC variations were also studied during pollution episodes defined as exceedance of a limit value for PM10 mass concentrations as defined by the current regulation (Directive 2008/50/CE). A comparison between the particle number and the particle mass concentration hourly peaks was also achieved, in terms of both particle size contribution and chemical composition. These last two points are aimed at better understanding the number concentration in relation to the PM10 mass concentration.
2. Experiments
2.1. Measurement Sites and Period
The data used in this study were collected at two sites in Strasbourg: Strasbourg-Danube (an urban background site) and Strasbourg-Clemenceau (an urban roadside site). The two sites are part of the regional monitoring network of Atmo Grand-Est (www.atmo-grandest.eu). Strasbourg is located in the upper Rhine valley in the northeast of France. It is the first agglomeration on a regional scale and the thirteenth French agglomeration in terms of population. The city of Strasbourg is subject to a national Atmosphere Protection Plan (PPA) due to high NO2 concentrations recorded at some of its measuring sites. Locally, this territory is highly urbanized (26% of the urban community surface area) but has, nevertheless, significant industrial and agricultural fabrics around the city center. The city is crossed by some major interregional road axis such as the A35-A4 motorway (north–south axis) and the Rhine Avenue (east–west axis). The traffic on these axes has a high proportion of heavy goods vehicles. The climate in this part of France is semi-continental with two main wind directions: south–southwest and north–northeast. The upper Rhine valley is indeed sheltered from the main westerly winds by the Vosges Mountains and its climate is influenced by air masses from Central Europe.
The Strasbourg-Danube monitoring site was located on Emmanuel Levinas road in the new Danube eco-district in Strasbourg (GPS coordinates: 48°34′21.927″ N–7°46′03.917″ E). This site was established in October 2019 to provide a representation of the background levels in the east of the Strasbourg agglomeration. It is located in an urbanized area where the share of biomass combustion represents less than 1% of the energy consumption of the residential sector of the surrounding neighborhoods [24]. Previous study of ATMO Grand-Est on the PM10, PM2.5 and NO2 measurements had revealed higher levels for these three pollutants compared to their concentrations at other background stations in the agglomeration because of the influence of the Rhine avenue, which crosses the neighboring district. However, the levels were still 20% to 40% lower than those measured on roadside sites.
Strasbourg-Clemenceau was located at the corner of a major intersection between Clemenceau boulevard and Faubourg-de-Pierre road in the city center of Strasbourg (GPS coordinates: 48°35′26.05″ N–7°44′40.99″ E). The daily average traffic volumes are around 2.8 × 10⁴ vehicles per day. In operation since 1998, this station is representative of urban levels under the influence of traffic. The share of biomass combustion represents less than 1% of the consumption of the residential sector in the surrounding neighborhoods in accordance with its urban environment [24]. A biomass boiler plant is located less than 1 km northeast of the site. ATMO Grand-Est’s previous results have indicated that as an annual average, NO2 concentrations were about twice as high as those measured at Strasbourg’s urban background and PM10 mass concentrations were 10–20% higher.
This study is based on data measured from the 22 November 2019 to the 16 March 2020, by automatic analyzers.
Meteorological data came from a background station located less than two kilometers from the two study sites (Relative Humidity and temperature: Model HMP, Vaisala Inc., Vantaa, Finland, and winds: model TAVID, Chauvin Arnoux Inc., Foxborough, MA, USA). The campaign period was characterized by an average temperature of 6.2 °C and an average relative humidity of 84.8%. Light winds were observed over the period with a maximum hourly wind speed of 8 m/s and 98% of wind speeds below 4 m/s (Figure 1). The month of February was associated with less favorable conditions for particles accumulation in air compared to the other months of the study (highest precipitations, lowest relative humidity, and highest winds,) as shown in Figure 2.
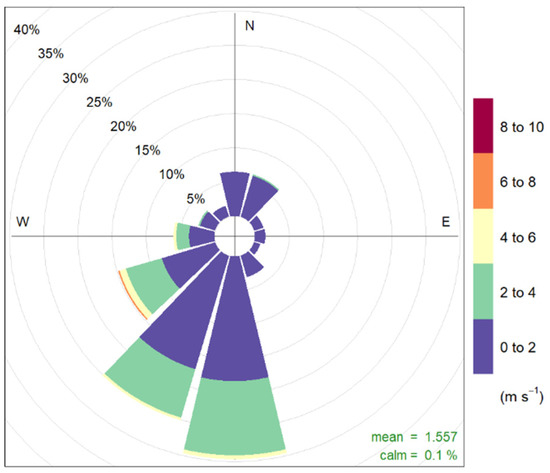
Figure 1.
Wind rose from Strasbourg data over the measurement period.
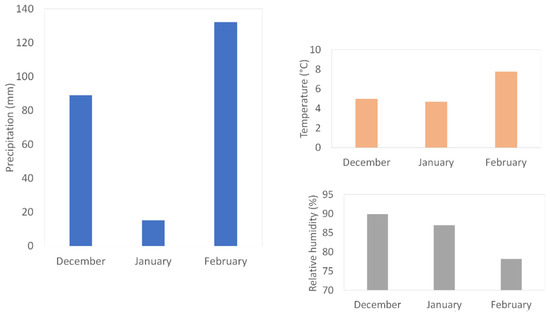
Figure 2.
Monthly meteorological data over the measurement period.
2.2. Instrumental
Both study sites were multi-instrumental. Each site was equipped with a UFP 3031 monitor (TOPAS), an Aerosol Chemical Speciation Monitor (ACSM, Aerodyne Res. Inc., Billerica, MA, USA) and a multi-wavelength Aethalometer (AE33 model, Magee Scientific). The instruments were placed in a temperature-controlled measurement station at around 20 °C. Sampling was carried out at a height of 4–5 m at both sites.
The UFP 3031 Monitor was developed as part of the European UFIPOLNET project [25]. It was designed to avoid the use of butanol or radioactive/X-ray sources, as is the case for mobility particle size spectrometers (MPSS). It has been commercially available since 2009 in France (where it is marketed by TSI Inc., Shoreview, MN, USA). The analyzer principle is based on the measurement of particles number concentrations in the range 20–800 nm via six size ranges: 20–30 nm, 30–50 nm, 50–70 nm, 70–100 nm, 100–200 nm, and 200–800 nm. The particles are separated in size classes according to their electric mobility with a differential mobility analyzer (DMA) and then counted by an electrometer. The TSI Sampling System (3031200 model) was used with a PM10 inlet, sharp-cut PM1 cyclone and Nafion dryer. Good correlations with mobility particle size spectrometer (MPSS) have been found in the UFP 3031-measurement range (20–200 nm) [26]. Particle losses due to diffusion in the sampling system were automatically corrected by the internal software. The time resolution used for the present study was 15 min. UFP 3031 were used following the technical recommendations of the French reference laboratory for air quality monitoring (LCSQA) [27].
The chemical composition of non-refractory submicron aerosols (NR-PM1: organic matter, nitrate, sulfate, ammonium and chloride) was measured using two ACSMs, both equipped with a quadrupole detector (Q-ACSM) and operating to scan 150 mass-to-charge (m/z) of fragmented ions. Calibration of the ionization efficiencies was made following the procedure developed by Ng et al. [28] and further optimized using the full-scan mode as recommended by Freney et al. [29], allowing to determine instrument-specific values of the response factor (RF) and the ammonium and sulfate relative ionization efficiencies (RIEs). In order to limit a possible underestimation of the finest organic particles emitted by vehicles exhaust, a RIE value of 1.3 was applied for the organic aerosol fraction at the roadside site. This relatively low value was chosen to compensate for lens transmission and collection efficiency-related errors of small hydrogen-like organic aerosols (HOA), although such particles displayed higher RIE values than 1.3 in laboratory experiments [30]. The default value of 1.4 was used to retrieve organic aerosols (OA) concentrations at the background site, as well as for chloride (RIE = 1.3) at both sites. A collection efficiency (CE) of 0.5 was initially used to calculate mass concentration in real-time, before being corrected for relative humidity by the Middlebrook method [31]. Particle-laden and particle-free air were sampled interchangeably and averaged over ~ 30 min intervals for each measurement data point.
Concentrations of carbon soot, resulting from combustion and known as Black Carbon (BC), were measured using the AE33 multi-wavelength aethalometer in the PM2.5 fraction and at a time resolution of 1 min. For ease of reading, the term Black Carbon (BC) is still used in this paper, whereas authors acknowledge that, when using optical method, such as AE33, it would be more appropriate to refer to “equivalent Black Carbon” (eBC) concentrations. Using this instrument, and by convention, BC concentrations were determined from measurement of the optical attenuation at 880 nm. The measuring principle and corrections introduced by Drinovec et al. [32] were applied to the data. The source apportionment model proposed by Sandradewi et al. [33] was also applied to identify the part of particles emitted from biomass (or wood) burning (BCwb) and the part associated with particles from fossil fuel combustion (BCff).
On the background site (Strasbourg-Danube), NOx were measured by chemiluminescence (Model APNA-370, Horiba) according to the reference method NF EN 14211 and PM10 were measured continuously by an optical analyzer (Model FIDAS 200, Palas). This approach was demonstrated to be equivalent to the reference method NF EN 12341 for background sites.
For every instrument used in the present study, quality assurance included monthly, quarterly, and annual preventive maintenance and calibration, as indicated by the manufacturer and by the relevant national guidance discussed above. Data quality control was then completed through daily technical validation and weekly environmental validation processes.
2.3. Assumptions and Statistical Tools
The entire dataset used here is a compilation of synchronized averaged hourly data, where only hours containing at least 75% of valid data were kept. The same threshold of 75% was used for the monthly average calculations.
A few assumptions were made for the purpose of the present study: (i) the sum of the size ranges below 100 nm (20–30 nm, 30–50 nm, 50–70 nm, and 70–100 nm) were assumed to be similar to the number concentration of ultrafine particles between 20 and 100 nm in diameter and identified by the term “UFP” in this paper, and (ii) Black Carbon measured in PM2.5 was assumed to be primarily included in PM1, so that the submicron aerosol chemical composition can be estimated as the sum of the major constituents measured by the ACSM and the aethalometer. These constituents are organic matter, nitrate, sulfate, ammonium, chloride, BCwb and BCff.
It must be noted that non-accounting for particles below 20 nm was leading to substantial underestimation of the number concentration of particles above 7 nm in diameter, as defined by the European Committee for Standardization (CEN) Technical Specification for PNC measurement (CEN/TS 16976). As illustrated by Figure A1 (Appendix A), a comparison of the total number concentrations measured by a condensation particle counter (CPC, model 3750, TSI Inc.) with UFP 3031 outputs indicated that the latter one underestimated CPC measurements by a factor of approximately 2 during the campaign at our roadside site. For ease of reading, the term “PNC” is used in this paper to identify the sum of the six size ranges measured by the UFP 3031 (between 20 and 800 nm) and each size range number concentration measured by the UFP 3031 is identified hereafter as “N (size range)” (e.g., N (20–30) for particles comprised between 20 and 30 nm).
The planet boundary layer (PBL) height was modeled and extracted using the Weather Research and Forecasting model (WRF) outputs (forecast) over the period. This forecast model is linked to uncertainties of the input global meteorological data (Global Forecast System, GFS) and to uncertainties of the model itself.
3. Results
3.1. Size Distributions
Figure 3 presents monthly mean concentrations obtained for each of the six size ranges measured by the UFP 3031 at both sites during the study period. Similar monthly variations were observed for all size ranges, with lower mean number concentrations in February than in other months. A summary of the number concentration statistics over the campaign at both sites is given in Table A1 and Table A2 (Appendix B). Mean and median concentrations were higher at the roadside site than at the background site for each size fraction except for the largest one (N (200–800)) (See also Appendix C for quantitative estimations).
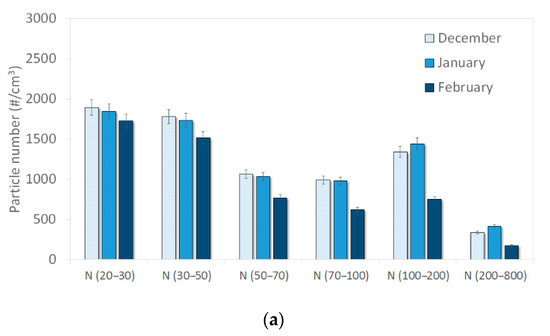
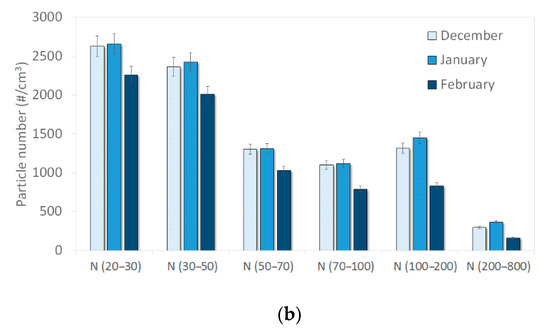
Figure 3.
Monthly variation of particle number concentrations at (a) the background site (Strasbourg-Danube) and (b) the roadside site (Strasbourg-Clemenceau).
Figure 4 illustrates the relative particle size contribution for the six size ranges at both sites. Despite a significant difference in absolute particle numbers, the average relative contribution of each range was similar between both sites over the measurement period. Indeed, the number concentration was dominated by the two smallest fractions (20–30 nm and 30–50 nm) with 52% and 57% for the background and the roadside site respectively. UFP represented close to 80% of PNC on both sites, with a slightly higher contribution for the site under traffic influence. This slight difference (79% and 83% for the background and the roadside sites, respectively) was mainly due to the two smallest fractions, which account for 80% of the difference in number concentration of particles between the sites.
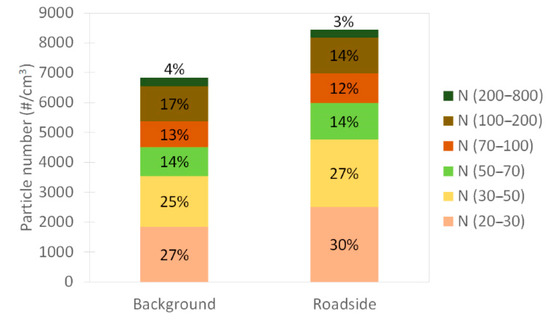
Figure 4.
Relative particle-size contribution at both sites over the measurement period.
Size-resolved and normalized particle-size distribution on the two study sites are shown in Figure 5. Both sites presented the same profile with a bimodal size-resolved particle distribution. Nevertheless, the normalized distribution showed an “unimodal” distribution with the start of one mode. The two figures highlighted a similar distribution between the two sites, but showed again the higher levels of particles smaller than 100 nm at the roadside site compared to the background site.
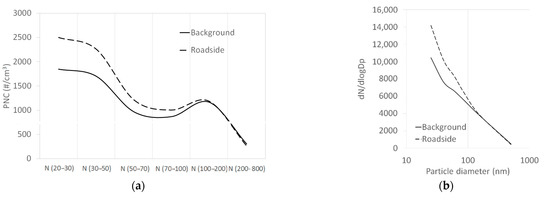
Figure 5.
Size-resolved (a) and normalized (dN/dlogDp as a function of the median diameter), (b) particle-size distribution at both sites over the measurement period.
3.2. PNC Daily and Weekly Variations
For each size range (and as well as PNC), the mean concentration value was well above the median one, indicating high variation in the measurements towards the occurrence of high number concentration peaks (Appendix B). Hourly maxima up to 60 times higher than the average values might notably be indicative of the influence of intense primary emissions. This is particularly true at the roadside site where hourly maxima were higher than at the background site for N (20–70). Unexpectedly, it was the opposite for particles above 70 nm (Table A1 and Table A2). The latter observation for “medium-size” particles can be explained by a much stronger impact of the firework emissions during the night of New Year’s Eve on the mean value calculations at background site, compared to roadside. When discarding this exceptional event, hourly maxima values were higher at the roadside site for every size range, as well as for PNC.
In general, hourly peaks were associated with road traffic rush hours as shown by the average daily profile for both sites over the measurement period (Figure 6) and the weekly profile confirmed this source because it showed a clear decrease during weekend especially on Sunday (Figure 7). The average daily profiles of BCff presented in Figure A3 (Appendix D) were like PNC daily profiles for both sites, also highlighting the traffic influence on PNC. The daily maxima were higher at the roadside site than at the background site for ultrafine particles (Table A1 and Table A2).
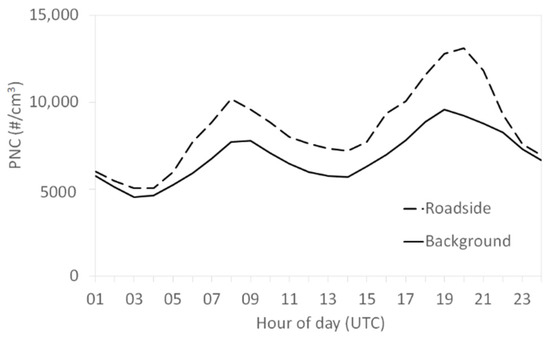
Figure 6.
Particle number concentration (PNC) average daily profile from hourly data at both sites over the measurement period.
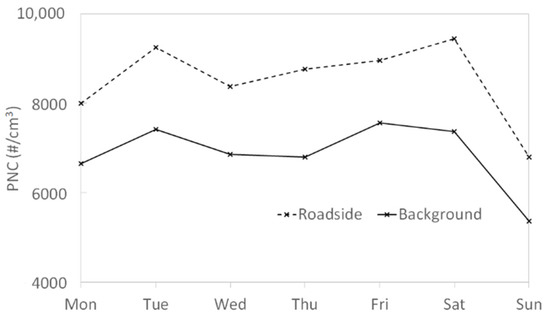
Figure 7.
PNC average weekly profile at both sites over the measurement period.
3.3. Mass Concentration and Number Concentration Influences on the Distribution and Chemical Composition of Submicron Particles
Particle size distributions are discussed here, considering the measured chemical composition according to various aerosol loadings: for high vs. low mass concentrations (PM10), and for high vs. low number concentrations (PNC). High PM10 mass concentrations are defined, for the purpose of the present discussion, as hourly averages greater than 50 µg/m3 (based on the daily limit value defined in the 2008/50/CE directive), which represent about 5% of the measurements over the period. In the absence of limit values for the PNC, a threshold value for high concentrations corresponding to approximately 5% of the data over the period was defined for each site. This value is equal to 16,000 particles/cm3 for the background site; the results are presented below. Average particle size distribution and composition during the periods with high PM10 mass concentrations were compared to those of low PM10 mass concentrations. A similar approach was followed for PNC. Hourly data were used to increase statistical representativeness and to assess the temporal variability of UFP, at time scales shorter than the day.
The comparison between high and low PM10 mass concentrations at the background site (Figure 8) showed that high PM10 mass concentrations were associated with a change in particle size contribution although no change in chemical composition was observed over the study period compared to low PM10 mass concentrations. The proportion of UFP, and especially of particles below 50 nm, was decreasing from 54% to 40% in favor of particles larger than 100 nm, which increased from 20% to 31% between low and high PM10 mass concentrations. The chemical composition was similar with 44–45% organic matter, 34–37% inorganics and 19–21% Black Carbon. The comparison between low and high PNC at the background site (Figure 9) showed that high PNC were not associated with a strong change in particle size, but with a change in chemical composition compared to low PNC over the period. This change in size contribution was like that observed for high PM10 mass concentrations, but of lesser intensity. Black Carbon was increasing from 19% to 28% and particularly the share associated with fossil fuels combustion mainly attributed to road traffic between low and high PNC.
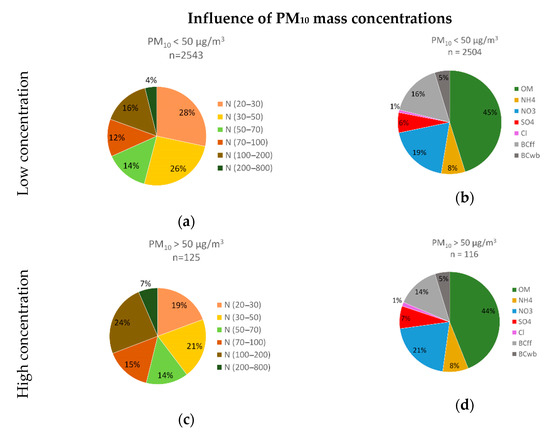
Figure 8.
Particle size contribution (a) and chemical composition (b) for low PM10 mass concentrations and particle size contribution (c) and chemical composition (d) for high PM10 mass concentrations at the background site.
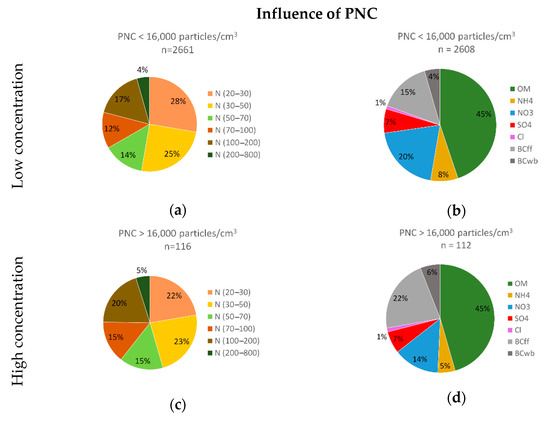
Figure 9.
Particle size contribution (a) and chemical composition (b) for low PNC and particle size contribution (c) and chemical composition (d) for high PNC at the background site.
Similar comparisons were carried out at the roadside site. Detailed results are presented in Appendix E. High PM10 mass concentrations were associated with a change in particle size, without any change in chemical composition, compared to low PM10 mass concentrations. High PNC were associated with a change in chemical composition with not clear change in particle size contribution compared to low PNC. The chemical composition at the roadside site was indeed 44% organic matter, 32–35% inorganics and 20–24% Black Carbon.
Thus, the results indicated a similar behavior between the two sites regardless of the proximity of traffic. Just a slight difference in the average chemical composition appeared with a lower proportion of inorganics in favor of Black Carbon at the roadside site.
4. Discussion
4.1. PNC Variations
On average over the campaign, UFP represented about 79% and 82% of the number concentration in the 20–800 nm range at the background site and at the roadside site respectively. This confirms the domination of particle number by ultrafine particles in urban area—observed here at both sites. Both sites display a distribution dominated by the 20–30 nm and 100–200 nm size ranges. This bimodal size-resolved distribution has already been observed on others French stations whatever the influence of the site typology [34].
The average PNC concentration over the campaign is 6.8 × 10³ particles/cm3 for the urban background site and 8.4 × 10³ particles/cm3 for the roadside site. The levels at both sites are similar to the average levels measured on urban background sites—around 103–104 particles/cm3 (from four studies using MPSS [17]) and the roadside site presents levels almost 10 times lower than the roadside sites order of magnitude—around 105 particles/cm3 (from 18 studies using CPC and MPSS [17]). The lack of a harmonized methodology makes it difficult to compare levels between studies, but the underestimation of PNC in this study is consistent given the approximation made (sum of channels instead of total count) and the minimum diameter of 20 nm. Studies also highlight levels two to ten times higher in roadside sites compared to urban background sites [15,20,35,36]. This difference is not as marked in this campaign, which may be linked to an influence of the road axis in the vicinity of the background station (about 60 m), but also to the underestimation of lowest particles by the analyzer as discussed above.
The normalized size distribution showed only the start of a mode, which could be attributed to an Aitken mode or nucleation mode. However, the lowest measured size range was greater than this mode (known to be lower than 20 nm). An unimodal distribution is frequently noticed in other studies, such as the size distribution characterized by a mode at 10–20 nm at the Antwerp and Amsterdam sites based on Mobility Particle Size Spectrometer (MPSS) measurements [37].
Monthly variations remained small in the present experimental set-up, as the studied period was short. The decrease in particle number levels in February may be associated with better atmospheric dispersion conditions less favorable to particles than other months. Wind and precipitation conditions are favorable to particle dispersion and washout phenomena, leading to lower particulate levels. In winter, the formation of UFP and in particular of the nucleation mode at pipe engine exhausts is favored by low temperatures [17,38]. The most marked decrease at both sites was observed for the 100–200 nm size range, which can be explained by: (i) a greater dependence on meteorological conditions and in particular on the washout effect which is less important on particles smaller than 150 nm according to Morawska et al. study [17], and (ii) a decrease in biomass combustion emissions in connection with the reduction of urban residential heating under warmer meteorological conditions than the 2 other months (Figure 2) [34].
4.2. Insights into the Aerosol Origins
Results confirm the clear influence of road traffic emissions on size-segregated number concentrations, as well as on PNC. In fact, the roadside site presented particles number concentrations between 20% and 30% higher than the background site over the measurement period. Moreover, a link between the hourly peaks and road traffic was clearly shown on the daily profiles (Figure 6), which reflected home-to-work commuting journeys (on morning and late afternoon) at both sites. The weekly profiles show that Saturday presented the highest levels in relation to the concomitant emissions on this day: road traffic remains dense due to the activities of the population in these urban areas (shopping area of the city center near the roadside site and major shopping center near the background site) in parallel with a greater use of residential heating on weekends (Figure 7). However, the drop in road traffic on Sunday significantly influences the levels of PNC on this day, which presented the lowest levels compared to the weekdays, confirming the major influence of the road traffic on PNC. Moreover, the periods of high PNC were associated with a modification of particles chemical composition compared to periods of low PNC. This modification was linked to the increase of the share associated with the combustion of fossil fuels (BCff) which is mainly attributed to road traffic in urban areas. This observation is confirmed by the fact that the change in chemical composition in favor of BCff was more marked at the roadside site.
Traffic influence was even more marked for ultrafine particles (size ranges below 100 nm), which is consistent with previous study [39] and explained the high spatial and temporal variability of the UFP. The distance to a road has been shown to be associated with an exponential decrease in the levels of ultrafine particles: Kumar et al. [14] have calculated a decreased in PNC of 40% at only 10 m from a road for an unobstructed topography. Moreover, the investigation indicates that the size range concentrations at the roadside site became higher than those at the background site, with the decrease in particle diameter. This has already been observed in Grenoble (France) with an increase in the finest particles as the traffic influence increases [20].
Even if the traffic influence is more important on finer particles, the relative contribution of the six size ranges was not clearly different between the two sites over the period. This could be explained by: (i) the road traffic influences both sites because of the proximity of a road axis to the background station as discussed above, and (ii) the distribution of particles emitted by traffic. Indeed, previous studies [14,17,40] have shown a bimodal particle size distribution of the particles emitted at engine exhaust with a nucleation mode (10–20 nm) and an accumulation mode (100–200 nm). Road traffic may therefore be responsible for the emission of particles over different size ranges, which can mitigate the direct impact of road traffic on the relative size contribution. Moreover, the measurement range of the UFP 3031 starts only from 20 nm diameter, which allows measurement of the nucleation mode only after aging of the finest UFP (Aitken mode). This equipment characteristic can also reduce the differences between the two sites. The observed particle size distribution might appear more affected by road traffic if particles with smaller diameters (less than 20 nm) were measured. Future studies should also consider a wider particle size range in order to identify the impact of ultrafine particles below 20 nm.
Particles greater than 100 nm showed two features: their contribution to the PNC slightly increased between low and high PNC and their concentrations remained high during night (from 10 p.m. to 5 a.m.) at both sites (Appendix F Figure A6). These observations may be linked to: (i) the impact of the growth of the finest particles by coagulation and (ii) emissions from other sources than traffic. Particle coagulation and/or aging processes could explain these observations because the smaller the UFP are, the higher their coagulation rate is, thus producing larger particles [36,41,42] and the coagulation is favored by the presence of pre-existing particles as observed at the end of the day. The presence of other sources at the scale of the agglomeration, such as urban heating in this winter period, can also be pointed out. The great agreement between the 100–200 nm size range and biomass combustion tracers has already been discussed [19,20,21,22]. New Year’s Eve fireworks were another punctual striking example observed during the measurement period. On 31 December 2019, at midnight, the number concentration of N (100–200) was multiplied by 35 compared to the average levels measured at midnight over the period at the urban background. This has already been observed in Antwerp and Amsterdam [37]. As is the case for biomass burning emissions, firework-related aerosols mainly influence the number concentrations of particles larger than 100 nm.
On the other hand, high PM10 mass concentrations were associated with a clear change in particle size contribution in favor of particles larger than 100 nm compared to low PM10 mass concentrations, confirming that particle sources differ according to the particle size and that there is a source difference between coarse/fine particles and ultrafine particles. The absence of changes in chemical composition between low and high PM10 mass concentrations may indicate that high PM10 mass concentrations are associated with an increase in all the usual emitting sources. However, as the chemical composition is measured in PM1, the specific chemical composition of particles between 1 and 10 µm diameter is not evident. Moreover, some compounds found in the coarse fraction (PM2.5-PM10) such as metals or terrigenous compounds [43] are not measured in this study although they could be important contributors. The chemical composition of PM1 nevertheless remains unchanged during the high PM10 mass concentrations over this measurement period.
4.3. Pollution Episodes
According to current national air quality policy, pollution episodes occur when the regulated pollutants—NO2, PM10 and O3—exceed an hourly or daily threshold value in accordance with the European directive n°2008/50/EC of 21 May, 2008. This regulation concerns the mass concentration of PM10 with a daily limit value of 50 µg/m3 not to be exceeded more than 35 days per year. This section shows the evolution of number concentration during two PM10 pollution episodes (exceedance of the daily limit value). Results are presented for the urban background station more representative of population exposure and usually used for pollution episodes by air quality networks. The variations of pollutant concentrations and meteorological parameters are shown in Figure 10a,b for the first episode (24 to 25 January) and the second episode (8 February), respectively. Although the daily limit value was not exceeded in Strasbourg on 8 February, particle levels increased in the city and it was exceeded in two departments of the region.
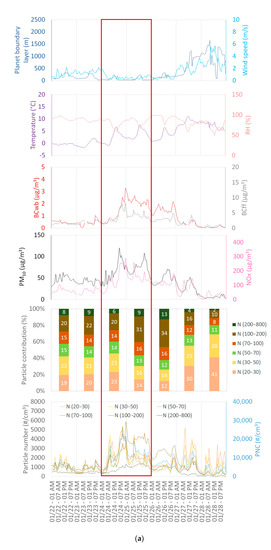
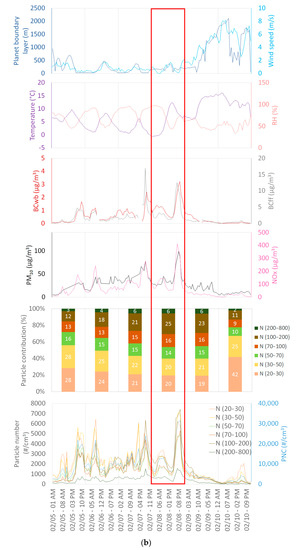
Figure 10.
Variations of pollutants and meteorological parameters during (a) 24 and 25 January, 2020 episode, and (b) 8 February, 2020 episode, framed in red.
Both episodes were characterized by low temperatures and high relative humidity as expected in winter period. Light winds were observed during the first days of the two episodes. PBL followed the same variation for both episodes. Temperatures and wind speeds were slightly higher and relative humidity slightly lower during the second episode, but, overall, the meteorological conditions can be considered as rather similar for these two episodes.
The two BC fractions (BCff and BCwb) and NOx varied like PM10 mass concentration for both episodes. Furthermore, the episodes were characterized by an increase in particle number concentration with PM10 mass concentration. Concentrations of primary pollutants typically increase under these stable atmospheric conditions with low dispersion (wind speeds less than 4 m/s) and low dilution (low planet boundary layer height). These phenomena often occur in French cities during winter and are currently associated with an increase in the levels of locally emitted pollutants. The decrease of PM10 mass concentrations for each of the two episodes—from 27 January and 9 February for the first and the second episode respectively—is associated with a net increase in winds from the southwest, allowing the dispersion of pollutants.
During the first episode, the increase in particle number was observed for all size ranges, as well as PNC, from 24 January, 8:00 p.m. to 25 January, 4:00 p.m., and then mostly for the N (100–200 nm), which became dominant on 25 and 26 January. This behavior was associated with a strong modification of the relative particle-size contribution and could be attributed to the weekend. Indeed, the N (100–200) did not decrease as the other size ranges and therefore became the dominant one. The increase in emissions and a potential coagulation aging of the finest particles in polluted atmosphere may explain this change in contribution. The biomass combustion rises because of the increase of emissions from urban heating during the weekend. The influence and correlation between the 100–200 nm range and biomass combustion tracer (BCwb) seems to be still confirmed during this specific episode. Given the stable atmospheric conditions during the weekend, the phenomenon of coagulation of the finest particles (below 50 nm) may also contribute to increase the number concentration of accumulation mode particles (particles larger than 100 nm). Coagulation is favored when the atmosphere is polluted, and nucleation is disadvantaged by the presence of particles that act as condensation sink [14,15].
In contrast, the second episode was characterized by a short but strong peak the 8 February during the evening (5:00–12:00 a.m.). This peak appeared for all size ranges, which were increasing during the whole duration of this episode with a slight modification in particle size contribution. This increase occurred at the end of the day and seems to be linked to the increase in emissions from local primary sources, particularly road traffic and urban heating, given the temperatures and the daytime (Saturday evening) in a stable atmosphere. The drop-in levels the following day can be explained by the arrival of the wind at the same time as the fall of the primary emissions on Sunday.
Both episodes presented the same increase for the 20–30 nm and 30–50 nm size channels from 27 January and 10 February, respectively. On the contrary, a clear drop in PM10, NOx and larger particles was caused by the arrival of the wind. The average particle size contribution, with a stronger dominance of the 20–30 nm and 30–50 nm size ranges, appeared at these dates. This situation highlighted a specific relative size contribution with a predominant influence of N (20–50) onto PNC (more than 65% of PNC). The UFP below 50 nm seems therefore to be less influenced by dispersion phenomena than the larger particles. The impact of road traffic on these finer particles was also highlighted, as the reappearance of the levels in the 20–30 nm and 30–50 nm size ranges starts with the beginning of the week and the resumption of normal road traffic, especially the presence of heavy goods vehicles [44].
The study of these two PM10 pollution episodes highlights an impact of meteorological conditions on the levels of primary pollutants, but also the importance of emissions. The weekend/weekdays influences were mainly observed on UFP, particularly on particles below 50 nm with similar behavior to NOx. The importance of road traffic on particulate levels is again confirmed. Dispersion conditions (winds and heights of the boundary layer) seem to have a lesser effect on particles below 50 nm than other pollutants. Indeed, the beginning of the week show an increase of these ranges despite levels indicating that particles emissions drive the concentrations more than meteorological conditions. This is consistent with Morawska et al. [17], which indicates the absence of a relationship between wind and particles below 30 nm.
Figure 11 shows the daily averages of PM10 mass concentration and PNC for both episodes. The daily averages of PM10 mass concentration were higher during the first episode compared to the second one, while the daily averages of the particle number concentration were similar between the two episodes. Between the first and the second episodes, PM10 levels were 42% lower while PNC were 8% higher. The variations in PM10 mass concentration were not like those of the PNC or even reversed depending on the situation. It confirms that the sources and atmospheric variations of fine/coarse particles are different from those of ultrafine particles. The PM10 mass concentration is therefore clearly not representative of the number concentration. Differences between measurements in number concentration or mass contraction confirm the need of monitoring the number concentration and the need for air quality standard using this metric. These results are consistent with the differences observed between high PM10 mass concentrations and high PNC.
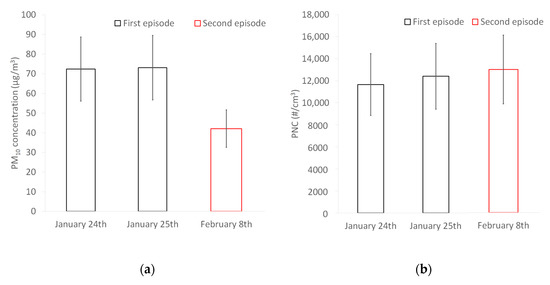
Figure 11.
Daily averages during both episodes for (a) PM10 mass concentration and (b) PNC.
5. Conclusions
This study aimed at measuring for the first time the submicron aerosol number size distribution and concentrations (in the range 20–800 nm) in the urban area of Strasbourg. It included a focus on influence of road traffic emissions, thanks to the comparison of measurements carried out at a background site and a roadside site of this agglomeration. The studied period ranged from 22 November 2019, to 16 March 2020, and the investigated datasets were based on the hourly averaged data. Both sites were multi-instrumented. That allowed a simultaneous study of the chemical composition of submicron particles and of the gaseous and particulate pollutants usually measured (NOx, PM10).
Results showed significantly higher concentrations for particles below 100 nm and for PNC at the roadside site than at the background site over the measurement period. This paper confirms the strong influence of traffic on the particle number concentrations and especially on UFP concentrations. This influence of traffic emissions was clearly observed at both sites on the daily and weekly profiles and was confirmed by the increase of the share of BCff between periods of low PNC and periods of high PNC. However, other local sources were also identified during the measurement period, such as the biomass combustion strongly associated with the 100–200 nm size range or occasional fireworks.
The high PM10 mass concentrations were associated with change in particle size contribution with an increase in the larger size ranges while the chemical composition was unchanged compared to low PM10 mass concentrations. Therefore, the increase in PM10 mass concentrations appears to be due to aging process and increased emissions from all current sources. However, changes in composition in the coarse fractions could be observed because only major constituents of PM1 were measured in this study. The high PNC were associated with a slight change in size contribution, but a clear modification of the chemical composition compared to low PNC. PM1 were more carbonaceous during the periods with high PNC, especially more constituted by Black Carbon attributed to road traffic. As the toxicity of the particles is dependent on the chemical composition, these results indicate the importance of following the PNC as a metric.
Study of pollution episodes, based on PM10 mass concentrations following the current regulation strategy, showed that particle number concentrations, and PUF smaller than 50 nm specifically, were more dependent on emissions than on meteorological conditions. Therefore, seasonal variations should probably be related to the influence of meteorological conditions on emissions. The different variations between PM10 mass concentrations and PNC indicated that monitoring of PM10 is not enough to monitor PNC and UFP variations. The measurement of PM10 mass concentration is clearly not representative of the number concentration nor UFP concentrations. This is confirmed by the study of the difference between high PNC and high PM10 mass concentrations indicating different sources depending on the size.
The present study did not consider the finer particles in the particle size contribution (below 20 nm) nor the chemical composition of the coarse particles (above 1 µm). The widening of the investigated size range will be of great interest, especially considering that the smallest particles are extremely numerous. For the monitoring of particle number size distribution, this can be done using more sophisticated MPSS systems than the UFP 3031. Considering the aerosol composition, such online measurements are still extremely complicated as mass spectrometry techniques do not currently allow for scrutinizing the chemical composition of ultrafine particles, possibly also resulting from nucleation processes. Nevertheless, as Black Carbon is now considered as a good indicator for potential PM adverse health effects [4], additional studies combining size and chemical composition must be conducted to better understand the associated risks of the particles. As population exposure is represented by background sites, the studies may favor this typology, given the influence of traffic, which can also be measured on these sites.
Author Contributions
Conceptualization, M.C., R.A., E.R., O.F. and C.P.; methodology, M.C. and A.U.; software, M.C.; validation, M.C.; investigation, M.C., R.A. and A.U.; writing—original draft preparation, M.C.; writing—review and editing, A.U., R.A., E.R, O.F. and C.P. All authors have read and agreed to the published version of the manuscript.
Funding
This research received no external funding.
Data Availability Statement
The data presented in this study are available on request from the corresponding author.
Acknowledgments
The authors warmly acknowledge David Cailler, Gilbert Fiegel, Bruno Elsass, and Damien Durant (Atmo Grand-Est) for their precious technical support. A.U. and O.F. acknowledge the French Ministry of Environment for financial support to the reference laboratory for air quality monitoring at national level (LCSQA) and the so-called CARA program.
Conflicts of Interest
The authors declare no conflict of interest.
Appendix A
Figure A1 shows the correlation between CPC and UFP 3031 at roadside site over the campaign.
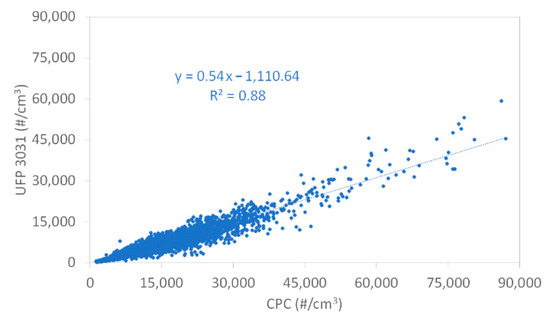
Figure A1.
Correlation between condensation particle counter (CPC) and UFP-3031 monitor at roadside site over the campaign.
Appendix B

Table A1.
Descriptive statistics of ultrafine particle number concentrations (particle/cm3) over the measurement period on background site (Strasbourg-Danube).
Table A1.
Descriptive statistics of ultrafine particle number concentrations (particle/cm3) over the measurement period on background site (Strasbourg-Danube).
| Size Range | Mean | Median | Hourly Minimum | Hourly Maximum | Daily Minimum | Daily Maximum |
|---|---|---|---|---|---|---|
| N (20–30) | 1845 | 1553 | 113 | 9529 | 465 | 3359 |
| N (30–50) | 1700 | 1449 | 89 | 8309 | 404 | 3368 |
| N (50–70) | 967 | 812 | 24 | 7725 | 167 | 2024 |
| N (70–100) | 866 | 692 | 24 | 15,834 | 148 | 2696 |
| N (100–200) | 1165 | 850 | 10 | 40,930 | 178 | 5582 |
| N (200–800) | 302 | 210 | 4 | 17,905 | 32 | 1847 |
| PNC | 6844 | 5857 | 390 | 87,094 | 1598 | 16,233 |

Table A2.
Descriptive statistics of ultrafine particle number concentrations (particle/cm3) over the measurement period on roadside site (Strasbourg-Clemenceau).
Table A2.
Descriptive statistics of ultrafine particle number concentrations (particle/cm3) over the measurement period on roadside site (Strasbourg-Clemenceau).
| Size Range | Mean | Median | Hourly Minimum | Hourly Maximum | Daily Minimum | Daily Maximum |
|---|---|---|---|---|---|---|
| N (20–30) | 2503 | 2038 | 79 | 15,009 | 702 | 5377 |
| N (30–50) | 2263 | 1837 | 74 | 16,391 | 614 | 5130 |
| N (50–70) | 1217 | 991 | 29 | 9677 | 281 | 3190 |
| N (70–100) | 1006 | 800 | 28 | 8229 | 224 | 3026 |
| N (100–200) | 1189 | 877 | 18 | 16,440 | 217 | 4141 |
| N (200–800) | 265 | 197 | 5 | 8622 | 34 | 1294 |
| PNC | 8444 | 7062 | 326 | 59,342 | 2173 | 21,417 |
Appendix C
This appendix summarizes the results obtained from statistical analyses of the comparison between these two sites: urban background and roadside. Statistical analyses were performed using the R software (3.6.3 version). Only the five finest fractions were investigated here, as previous studies showed the limited performances of the 200–800 nm fraction and advised to use for information purpose only [26,27,45,46,47]. Statistical graphs of averages particle number concentration are presented in Figure A2 for the five finest fractions and PNC.
Particles below 100 nm (20–30 nm, 30–50 nm, 50–70 nm, and 70–100 nm size ranges) and the PNC were significantly different between these two urban sites: the roadside site was significantly higher than the background one with a 95% confident interval, while the 100–200 nm fraction not.
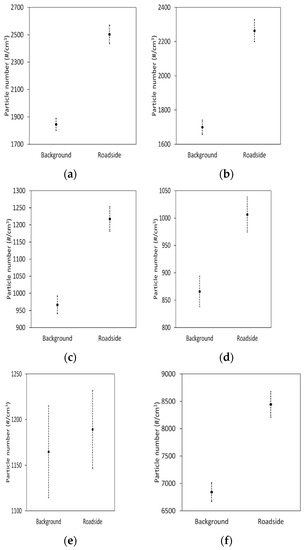
Figure A2.
Statistical comparison of ultrafine particle number concentration averages (with a 95% confidence interval) for (a) N (20–30 nm); (b) N (30–50 nm); (c) N (50–70 nm); (d) N (70–100 nm); (e) N (100–200 nm) and (f) PNC.
Appendix D
This appendix presents the average daily profiles of fossil-fuel combustion contribution to black carbon (BCff) for background site (Figure A3a) and for roadside site (Figure A3b). These profiles showed a similar trend with the average daily profiles of PNC for background and roadside site.
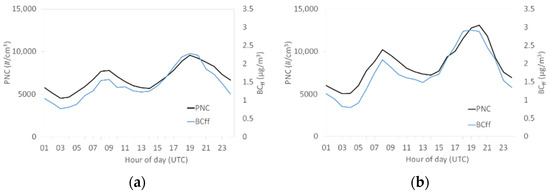
Figure A3.
Average daily profiles of fossil-fuel combustion contribution to black carbon (BCff) (a) for background site and (b) for roadside site over the measurement period
Appendix E
The influence of PM10 mass concentrations on particle size contribution and chemical composition of fine particles is presented in Figure A4 for the roadside site. The same comparison for the PNC is showed in Figure A5. As explained above, high PM10 mass concentrations were defined as hourly averages greater than 50 µg/m3 (limit value) which represent about 5% of the measurements over the period. In the absence of limit values for the number concentration, a threshold value for high concentrations corresponding to approximately 5% of the data over the period was defined for each site. This value was equal to 20,000 particles/cm3 for the roadside site.
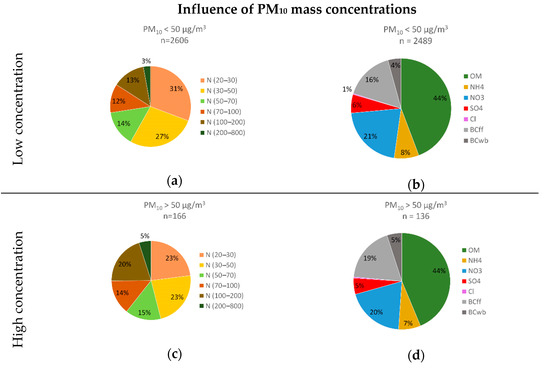
Figure A4.
Particle size contribution (a) and chemical composition (b) for low PM10 mass concentrations and particle size contribution (c) and chemical composition (d) for high PM10 mass concentrations at the roadside site.
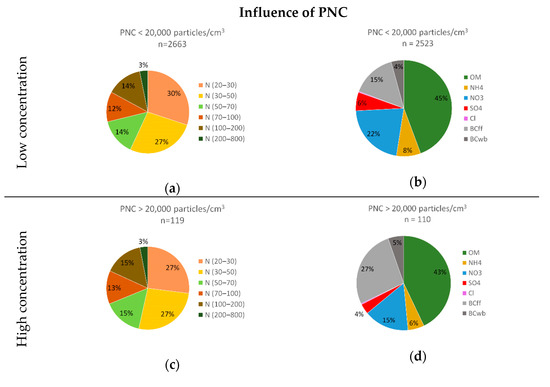
Figure A5.
Particle size contribution (a) and chemical composition (b) for low PNC and particle size contribution (c) and chemical composition (d) for high PNC at the roadside site.
Appendix F
This appendix presents the average particle number daily profiles of each size range for background site (Figure A6a,c) and for roadside site (Figure A6b,d).
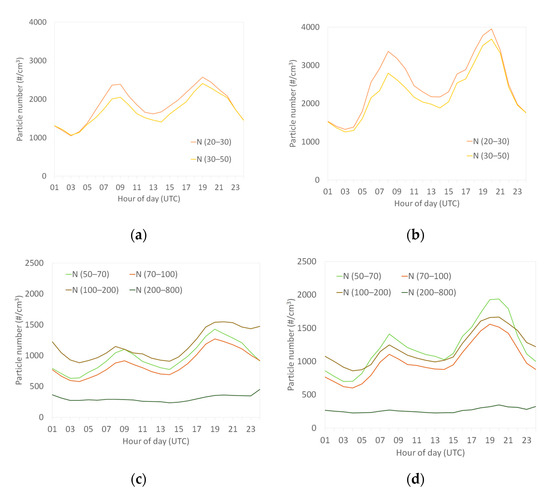
Figure A6.
Average daily profiles of each size range (a,c) for background site and (b,d) for the roadside site over the measurement period.
References
- World Health Organization. IARC: Outdoor Air Pollution a Leading Environmental Cause of Cancer Deaths; WHO: Geneva, Switzerland, 2013. [Google Scholar]
- ANSES. Pollution par les Particules dans l’Air Ambiant: Synthèse des Eléments Sanitaires en Vue d’un Appui à l’Elaboration de Seuils d’Information et d’Alerte du Public pour les Particules dans l’Air Ambiant; ANSES: Paris, France, 2009.
- Monteiller, C.; Tran, L.; MacNee, W.; Faux, S.; Jones, A.; Miller, B.; Donaldson, K. The pro-inflammatory effects of low-toxicity low-solubility particles, nanoparticles and fine particles, on epithelial cells in vitro: The role of surface area. Occup. Environ. Med. 2007, 64, 609–615. [Google Scholar] [CrossRef]
- ANSES. Particules de l’Air Ambiant Extérieur—Effets Sanitaires des Particules de l’Air Ambiant Extérieur Selon les Composés, les Sources et la Granulométrie; ANSES: Paris, France, 2019.
- Schraufnagel, D.E. The health effects of ultrafine particles. Exp. Mol. Med. 2020, 52, 311–317. [Google Scholar] [CrossRef]
- Schraufnagel, D.E.; Balmes, J.R.; Cowl, C.T.; De Matteis, S.; Jung, S.-H.; Mortimer, K.; Perez-Padilla, R.; Rice, M.B.; Riojas-Rodriguez, H.; Sood, A.; et al. Air Pollution and Noncommunicable Diseases. Chest 2019, 155, 409–416. [Google Scholar] [CrossRef] [PubMed]
- Alföldy, B.; Giechaskiel, B.; Hofmann, W.; Drossinos, Y. Size-distribution dependent lung deposition of diesel exhaust particles. J. Aerosol Sci. 2009, 40, 652–663. [Google Scholar] [CrossRef]
- Donaldson, K.; Brown, D.M.; Clouter, A.; Duffin, R.; MacNee, W.; Renwick, L.; Tran, L.; Stone, V. The Pulmonary Toxicology of Ultrafine Particles. J. Aerosol Med. 2002, 15, 213–220. [Google Scholar] [CrossRef] [PubMed]
- Yacobi, N.R.; Malmstadt, N.; Fazlollahi, F.; DeMaio, L.; Marchelletta, R.; Hamm-Alvarez, S.F.; Borok, Z.; Kim, K.-J.; Crandall, E.D. Mechanisms of Alveolar Epithelial Translocation of a Defined Population of Nanoparticles. Am. J. Respir. Cell Mol. Biol. 2010, 42, 604–614. [Google Scholar] [CrossRef] [PubMed]
- Powell, J.; Harvey, R.; Ashwood, P.; Wolstencroft, R.; Gershwin, M.; Thompson, R. Immune Potentiation of Ultrafine Dietary Particles in Normal Subjects and Patients with Inflammatory Bowel Disease. J. Autoimmun. 2000, 14, 99–105. [Google Scholar] [CrossRef]
- Morales-Rubio, R.A.; Alvarado-Cruz, I.; Manzano-León, N.; Andrade-Oliva, M.-D.-L.-A.; Uribe-Ramirez, M.; Quintanilla-Vega, B.; Osornio-Vargas, A.R.; De Vizcaya-Ruiz, A. In utero exposure to ultrafine particles promotes placental stress-induced programming of renin-angiotensin system-related elements in the offspring results in altered blood pressure in adult mice. Part. Fibre Toxicol. 2019, 16, 1–16. [Google Scholar] [CrossRef]
- Limbach, L.K.; Wick, P.; Manser, P.; Grass, R.N.; Bruinink, A.; Stark, W.J. Exposure of Engineered Nanoparticles to Human Lung Epithelial Cells: Influence of Chemical Composition and Catalytic Activity on Oxidative Stress. Environ. Sci. Technol. 2007, 41, 4158–4163. [Google Scholar] [CrossRef]
- Zhang, S.; Thomasson, A.; Mesbah, B.; Guernnion, P.-Y.; Pin, F.; Aleixo, T.; Roze, F.; Dalle, M.; Le Bihan, O. La surveillance des particules ultrafines en France. In Proceedings of the Congrès Français sur les Aérosols (CFA 2018), Paris, France, 30–31 January 2018. [Google Scholar]
- Kumar, P.; Morawska, L.; Birmili, W.; Paasonen, P.; Hu, M.; Kulmala, M.; Harrison, R.M.; Norford, L.K.; Britter, R. Ultrafine particles in cities. Environ. Int. 2014, 66, 1–10. [Google Scholar] [CrossRef]
- Air Quality Expert Group. Ultrafine Particles (UFP) in the UK; Defra: London, UK, 2018.
- Weber, R.; Marti, J.J.; McMurry, P.H.; Eisele, F.L.; Tanner, D.J.; Jefferson, A. Measurements of new particle formation and ultrafine particle growth rates at a clean continental site. J. Geophys. Res. Space Phys. 1997, 102, 4375–4385. [Google Scholar] [CrossRef]
- Morawska, L.; Ristovski, Z.; Jayaratne, R.; Keogh, D.U.; Ling, X. Ambient nano and ultrafine particles from motor vehicle emissions: Characteristics, ambient processing and implications on human exposure. Atmos. Environ. 2008, 42, 8113–8138. [Google Scholar] [CrossRef]
- Atmo Nouvelle-Aquitaine. Mesures Exploratoires de Particules Ultrafines en Aquitaine; Atmo Nouvelle-Aquitaine: Merignac, France, 2015. [Google Scholar]
- AtmoSud. Plan de Surveillance des Particules dans la Région PACA, PUF Bilan des Mesures 2016; Atmosud: Marseille, France, 2017. [Google Scholar]
- Atmo AURA. Observatoire des Particules Ultrafines Atmosphériques en Rhône-Alpes; Atmo AURA: Bron, France, 2016. [Google Scholar]
- Atmo Nouvelle-Aquitaine. Particules Ultrafines—Bilan Annuel 2017; Atmo Nouvelle-Aquitaine: Merignac, France, 2018. [Google Scholar]
- Atmo Hauts-de-France. Surveillance des Particules Ultrafines dans la Région Hauts-de-France; Atmo Hauts-de France: Lille, France, 2019. [Google Scholar]
- Cassee, F.R.; Morawska, L.; Peters, A. White Paper—Ambient Ultrafine Particles: Evidence for Policy Makers; European Federation of Clean Air and Environmental Protection Associations (EFCA): Pfintal, Germany, 2019. [Google Scholar]
- ATMO Grand Est. Invent’Air 2020—Données de l’année 2018. Observatoire climat-air-énergie Grand Est. Available online: https://observatoire.atmo-grandest.eu/ (accessed on 14 December 2020).
- UFIPOLNET. Technical Final Report. 2008. Available online: https://ec.europa.eu/environment/life/project/Projects/index.cfm?fuseaction=search.dspPage&n_proj_id=2709 (accessed on 2 November 2020).
- JOAQUIN. UFP Instrument Comparison at an Urban Background Location in Antwerp; VITO: Mol, Belgium, 2013. [Google Scholar]
- LCSQA. Recommandations Techniques pour l’Utilisation du Granulomètre UFP 3031; Laboratoire Central de Surveillance de la Qualité de l’Air: Paris, France, 2016. [Google Scholar]
- Ng, N.L.; Herndon, S.C.; Trimborn, A.; Canagaratna, M.R.; Croteau, P.L.; Onasch, T.B.; Sueper, D.; Worsnop, D.R.; Zhang, Q.; Sun, Y.L.; et al. An Aerosol Chemical Speciation Monitor (ACSM) for Routine Monitoring of the Composition and Mass Concentrations of Ambient Aerosol. Aerosol Sci. Technol. 2011, 45, 780–794. [Google Scholar] [CrossRef]
- Freney, E.; Zhang, Y.; Croteau, P.; Amodeo, T.; Williams, L.R.; Truong, F.; Petit, J.-E.; Sciare, J.; Sarda-Esteve, R.; Bonnaire, N.; et al. The second ACTRIS inter-comparison (2016) for Aerosol Chemical Speciation Monitors (ACSM): Calibration protocols and instrument performance evaluations. Aerosol Sci. Technol. 2019, 53, 830–842. [Google Scholar] [CrossRef]
- Xu, W.; Lambe, A.T.; Silva, P.; Hu, W.; Onasch, T.B.; Williams, L.; Croteau, P.; Zhang, X.; Renbaum-Wolff, L.; Fortner, E.; et al. Laboratory evaluation of species-dependent relative ionization efficiencies in the Aerodyne Aerosol Mass Spectrometer. Aerosol Sci. Technol. 2018, 52, 626–641. [Google Scholar] [CrossRef]
- Middlebrook, A.M.; Bahreini, R.; Jimenez, J.L.; Canagaratna, M.R. Evaluation of Composition-Dependent Collection Efficiencies for the Aerodyne Aerosol Mass Spectrometer using Field Data. Aerosol Sci. Technol. 2012, 46, 258–271. [Google Scholar] [CrossRef]
- Drinovec, L.; Močnik, G.; Zotter, P.; Prévôt, A.S.H.; Ruckstuhl, C.; Coz, E.; Rupakheti, M.; Sciare, J.; Müller, T.; Wiedensohler, A.; et al. The “dual-spot” Aethalometer: An improved measurement of aerosol black carbon with real-time loading compensation. Atmos. Meas. Tech. 2015, 8, 1965–1979. [Google Scholar] [CrossRef]
- Sandradewi, J.; Prévôt, A.S.H.; Szidat, S.; Perron, N.; Alfarra, M.R.; Lanz, V.A.; Weingartner, E.; Baltensperger, U.R.S. Using Aerosol Light Absorption Measurements for the Quantitative Determination of Wood Burning and Traffic Emission Contributions to Particulate Matter. Environ. Sci. Technol. 2008, 42, 3316–3323. [Google Scholar] [CrossRef]
- AtmoSud. Plan de Surveillance des Particules dans la Région PACA, PUF Bilan des Mesures 2017; AtmoSud: Marseille, France, 2018. [Google Scholar]
- Birmili, W.; Sun, J.; Weinhold, K.; Merkel, M.; Rasch, F.; Spindler, G. Atmospheric aerosol measurements in the German Ultrafine Aerosol Network (GUAN)—Part 3: Black Carbon mass and particle number concentrations 2009 to 2014. Gefahrstoffe Reinhalt. 2015, 75, 479–488. [Google Scholar]
- Sun, J.; Birmili, W.; Hermann, M.; Tuch, T.; Weinhold, K.; Spindler, G.; Schladitz, A.; Bastian, S.; Löschau, G.; Cyrys, J.; et al. Variability of black carbon mass concentrations, sub-micrometer particle number concentrations and size distributions: Results of the German Ultrafine Aerosol Network ranging from city street to High Alpine locations. Atmos. Environ. 2019, 202, 256–268. [Google Scholar] [CrossRef]
- JOAQUIN. Monitoring of Ultrafine Particles and Black Carbon; Flanders Environment Agency: Aalst, Belgium, 2015. [Google Scholar]
- Rönkkö, T.; Virtanen, A.; Vaaraslahti, K.; Keskinen, J.; Pirjola, L.; Lappi, M. Effect of dilution conditions and driving parameters on nucleation mode particles in diesel exhaust: Laboratory and on-road study. Atmos. Environ. 2006, 40, 2893–2901. [Google Scholar] [CrossRef]
- JOAQUIN. Short-Term Intra-Urban Variability of UFP Number Concentration and Size Distribution; VITO: Mol, Belgium, 2013. [Google Scholar]
- Regniers, O. Les Particules Diesel Ultrafines: Techniques de Mesure à l’Emission et à l’Immission; Universite Libre de Bruxelles: Buxelles, Belgium, 2006. [Google Scholar]
- Harrison, R.M.; Shi, J.P.; Jianxin, Y.; Khan, A.; Mark, D.; Kinnersley, R.; Yin, J. Measurement of number, mass and size distribution of particles in the atmosphere. Philos. Trans. R. Soc. A Math. Phys. Eng. Sci. 2000, 358, 2567–2580. [Google Scholar] [CrossRef]
- LCSQA. Surveillance des Particules Submicroniques; Laboratoire Central de Surveillance de la Qualité de l’Air: Paris, France, 2004. [Google Scholar]
- Putaud, J.-P.; Van Dingenen, R.; Dell’Acqua, A.; Raes, F.; Matta, E.; Decesari, S.; Facchini, M.C.; Fuzzi, S. Size-segregated aerosol mass closure and chemical composition in Monte Cimone (I) during MINATROC. Atmos. Chem. Phys. Discuss. 2004, 4, 889–902. [Google Scholar] [CrossRef]
- Southern Ontario Centre for Atmospheric Aerosol Research. Near-Road Air Pollution Pilot Study; University of Toronto: Toronto, ON, Canada, 2019. [Google Scholar]
- LCSQA. Inter-Comparaison 2014 sur les Granulomètres UFP 3031; Laboratoire Central de Surveillance de la Qualité de l’Air: Paris, France, 2014. [Google Scholar]
- LCSQA. Inter-Comparaison 2015 sur les Granulomètres UFP 3031; Laboratoire Central de Surveillance de la Qualité de l’Air: Paris, France, 2015. [Google Scholar]
- LCSQA. Inter-Comparaison 2016 sur les Granulomètres UFP 3031; Laboratoire Central de Surveillance de la Qualité de l’Air: Paris, France, 2016. [Google Scholar]
Publisher’s Note: MDPI stays neutral with regard to jurisdictional claims in published maps and institutional affiliations. |
© 2021 by the authors. Licensee MDPI, Basel, Switzerland. This article is an open access article distributed under the terms and conditions of the Creative Commons Attribution (CC BY) license (http://creativecommons.org/licenses/by/4.0/).