Article

Predicting Suitable Habitats of the African Cherry (Prunus africana) under Climate Change in Tanzania

by
Richard A. Giliba
1,* and
Genesis Tambang Yengoh
2
1
School of Life Sciences and Bio-Engineering, The Nelson Mandela African Institution of Science and Technology, P.O. Box 447, Arusha, Tanzania
2
Lund University Centre for Sustainability Studies–LUCSUS, Lund University, Biskopsgatan 5, SE 223 62 Lund, Sweden
*
Author to whom correspondence should be addressed.
Atmosphere 2020, 11(9), 988; https://doi.org/10.3390/atmos11090988
Submission received: 5 August 2020 / Revised: 24 August 2020 / Accepted: 25 August 2020 / Published: 15 September 2020
(This article belongs to the Special Issue Plant Adaptation to Global Climate Change)

Abstract

:
Prunus africana is a fast-growing, evergreen canopy tree with several medicinal, household, and agroforestry uses, as well as ecological value for over 22 countries in sub-Saharan Africa. This species is under immense pressure from human activity, compounding its vulnerability to the effects of climate change. Predicting suitable habitats for P. africana under changing climate is essential for conservation monitoring and planning. This study intends to predict the impact of climate change on the suitable habitats for the vulnerable P. africana in Tanzania. We used maximum entropy modeling to predict future habitat distribution based on the representative concentration pathways scenario 4.5 and 8.5 for the mid-century 2050 and late-century 2070. Species occurrence records and environmental variables were used as a dependent variable and predictor variables respectively. The model performance was excellent with the area under curve (AUC) and true skill statistics (TSS) values of 0.96 and 0.85 respectively. The mean annual temperature (51.7%) and terrain ruggedness. index (31.6%) are the most important variables in predicting the current and future habitat distribution for P. africana. Our results show a decrease in suitable habitats for P. africana under all future representative concentration pathways scenario when compared with current distributions. These results have policy implications for over 22 countries of sub-Saharan Africa that are facing problems associated with the sustainability of this species. Institutional, policy, and conservation management approaches are proposed to support sustainable practices in favor of P. africana.

1. Introduction

Climate change is a serious threat to floral biodiversity conservation [1,2,3]. Over the next century, the global temperature is projected to rise by 0.3–4.8 °C [4]. The projected increase in temperature is anticipated to influence both species and habitat distribution in several different ways. Some of the climate change impacts on flora include changes in species distribution, the increased extinction rate of species, changes in the length of growing season, and reproduction timings for plants [5]. With a rise in temperature, plant species are likely to shift their distribution patterns depending on resource availability [6]. This may lead to species range expansion or range contraction, or range shift when respond to changing climate [7]. Predicting suitable habitat of species under climate change using species distribution models (SDM) is one of the key important steps to undertake conservation planning and management [6,8]. Greenhouse gases (GHGs) from various human activities are the primary agents answerable for climate change and the current emission rates are at the highest level in the recorded history [9].
SDM have been widely used to monitor the impacts of climate change on the floral distribution [10] and identification of suitable habitats of species [11]. SDM uses species occurrence and environmental variables [12] to predict the distribution of a species in a geographical or an environmental space [13]. SDM engage a variety of methods for predicting species distribution and mapping habitat suitability [14]. These include: MAXENT, BIOCLIM, DOMAIN artificial neural networks, generalized linear models, and generalized additive models. Maxent, Bioclim, and Domain use presence-only data [15] while others require both presence absent data [14]. Presence-only methods include bioclimatic envelope algorithm BIOCLIM, DOMAIN.
Maxent has been widely used and gives better results when compared to other different modeling methods that use presence-only data are used [14,16,17]. Several studies have demonstrated Maxent’s ability to accurately predict species distribution in a wide range of ecological and geographical regions [10,18,19]. Subsequently, conservation practitioners have been increasingly using habitat suitability models from Maxent to make conservation management decisions [20,21]. We used Maxent: first to identify the most important variables that govern the current distribution of P. africana; second to predict current suitable habitats; third to predict future suitable habitats based on two representative concentration pathways (RCP 4.5 and RCP 8.5) for the mid-century 2050 and late-century 2070 in Tanzania. We selected P. africana due to local and international economic importance for medicinal purposes, contributing to its overexploitation. Due to the changing climate and overexploitation and, there is a need to use species occurrence data for identification of key conservation sites so as to develop a countrywide conservation strategy.

1.1. P. africana–Its Value, Demand and Conservation Pressures

P. africana is a fast-growing, evergreen canopy tree about 30–40 m in height. It has a wide range, spanning several countries in central, western, southern, and eastern Africa (including Madagascar). It occupies habitats in upland rain-forest, montane and riverine forests, moist evergreen forest, and the edges of dry gallery forests [22]. The uses of P. africana are many, and explain the huge demand for this tree and its products throughout the world:
Medicinal uses: The tree is widely used in both traditional and modern medicine to treat a variety of ailments [23,24,25]. P. africana contains several medically active compounds including the cyanogenic glycoside amygdalin, which is found in the bark, leaf, and fruit; phytosterols such as. β-sitosterol 15–18%, and its 3-O-glycoside, β-sitostenone, campesterol, and aucosterol; pentacyclic triterpenoids [26,27]. The bark is highly valued for its medicinal properties, particularly as a treatment for benign prostatic hyperplasia and prostate gland hypertrophy, diseases that commonly affect older men in Europe and North America [28]. In traditional medicinal practices throughout sub-Saharan Africa, the bark is used in traditional medicine as a purgative and as a remedy for stomachache, while the leaves are used as an inhalant for fever or are drunk as an infusion to improve appetite. Demand for P. africana bark for medicinal uses has been high and growing, putting immense pressure on the species throughout sub-Saharan Africa. In Tanzania, this has raised issues of sustainability for the species [29]. While data on current demand and supply of P. africana barks in the international and local markets is scarce, it was expected in 2000 that this demand would triple or quadruple to 7000 to 11,000 tons/year in export and about 500 tons/year for use in Africa the years after the report [30].
Household uses: Domesticated trees serve as shade in compounds, as windbreaks, and as ornamental trees. The tree yields a high-quality fuel, and so is a favorite for the production of charcoal or for use as fuel wood in many communities. Regarding household socioeconomics, P. africana supports revenue streams of communities in a wide variety of ways. As an input to furniture production, the seasoned wood saws easily and cleanly; works well with hand and machine tools; and polishes and finishes well. It also serves as highly desirable timber for flooring and heavy construction where durability is not required.
Agroforestry uses: Where the tree has been domesticated for integration into agricultural systems, the tree is used for erosion control, while the leaves are incorporated into the system of organic manure complex of crop production. There have been efforts to more tightly incorporate P. africana into the agroforestry mix of agricultural systems in some parts of the continent. For example, in Cameroon where the harvesting and commercialization have come under more targeted scrutiny given the large volumes involved, the government established a “National Management Plan for P. africana” that supported greater efforts towards reducing the pressures on wild tree species with locally cultivated trees [31].
Ecological value: One of the most cited ecological value of P. africana is its preference by the black and white colobus monkeys (Colobus guereza) as their top food species [32]. In forests, agricultural fields, as in homes, P. africana also serves as shelter for a variety of bird species. It is a valuable species for beekeeping, and therefore an important contributor in supporting pollination services that are relied on by forest species, and for the success of agriculture.
The heavy pressures to which P. africana has recently come under in most African countries because of wild harvesting for the medicinal plant trade have not gone unnoticed in the international and biodiversity community. In 1995, P. africana was added to Appendix A of the Convention on International Trade in the Endangered Species of Wild Fauna and Flora’s (CITES) list of endangered species, for the regulation of its trade from wild harvesting [33]. Currently, all exports of P. africana should therefore subject to a CITES export permit to protect the tree from depletion in Africa. In response, a European Union (EU) ban on imports of P. africana bark came into force in 2007 to help stocks to recover [34]. The International Union for Conservation of Nature (IUCN) recognize P. africana as a vulnerable species on its red list (https://www.iucnredlist.org) and it was categorized as a species “of urgent concerns” by CITES [22].

1.2. Forests and the Circular Economy

The circular economy is defined as “the concept can, in principle, be applied to all kinds of natural resources, including biotic and abiotic materials, water and land. Eco-design, repair, reuse, refurbishment, remanufacture, product sharing, waste prevention and waste recycling are all important in a circular economy” [35]. The concept of the circular economy seeks to achieve a shift from the linear economy, which is characterized by less than optimal recycling and reuse of materials and resources in human societies. The overall goal of the circular economic model is to reduce the undesirable impacts of the linear economy by achieving a systemic transition into a more sustainable approach to natural resource exploitation and use built on long-term sustainability. One of the main objectives of the circular economy is to reduce the impact of human activities on the planet’s ecosystems by reducing the excessive exploitation of natural resources and minimizing the pressure of human actions on the functioning of these ecosystems.
The role of forests in human societies and development, as well as the nature of forestry and forestry-based industries makes them a prime candidate for contributing to the global drive towards achieving the goals of a circular economy [36,37]. By striving towards achieving the objectives of the circular economy, positive contributions can be made towards achieving several sustainable development goals [38], many of which are relevant for Tanzania’s development.

2. Material and Methods
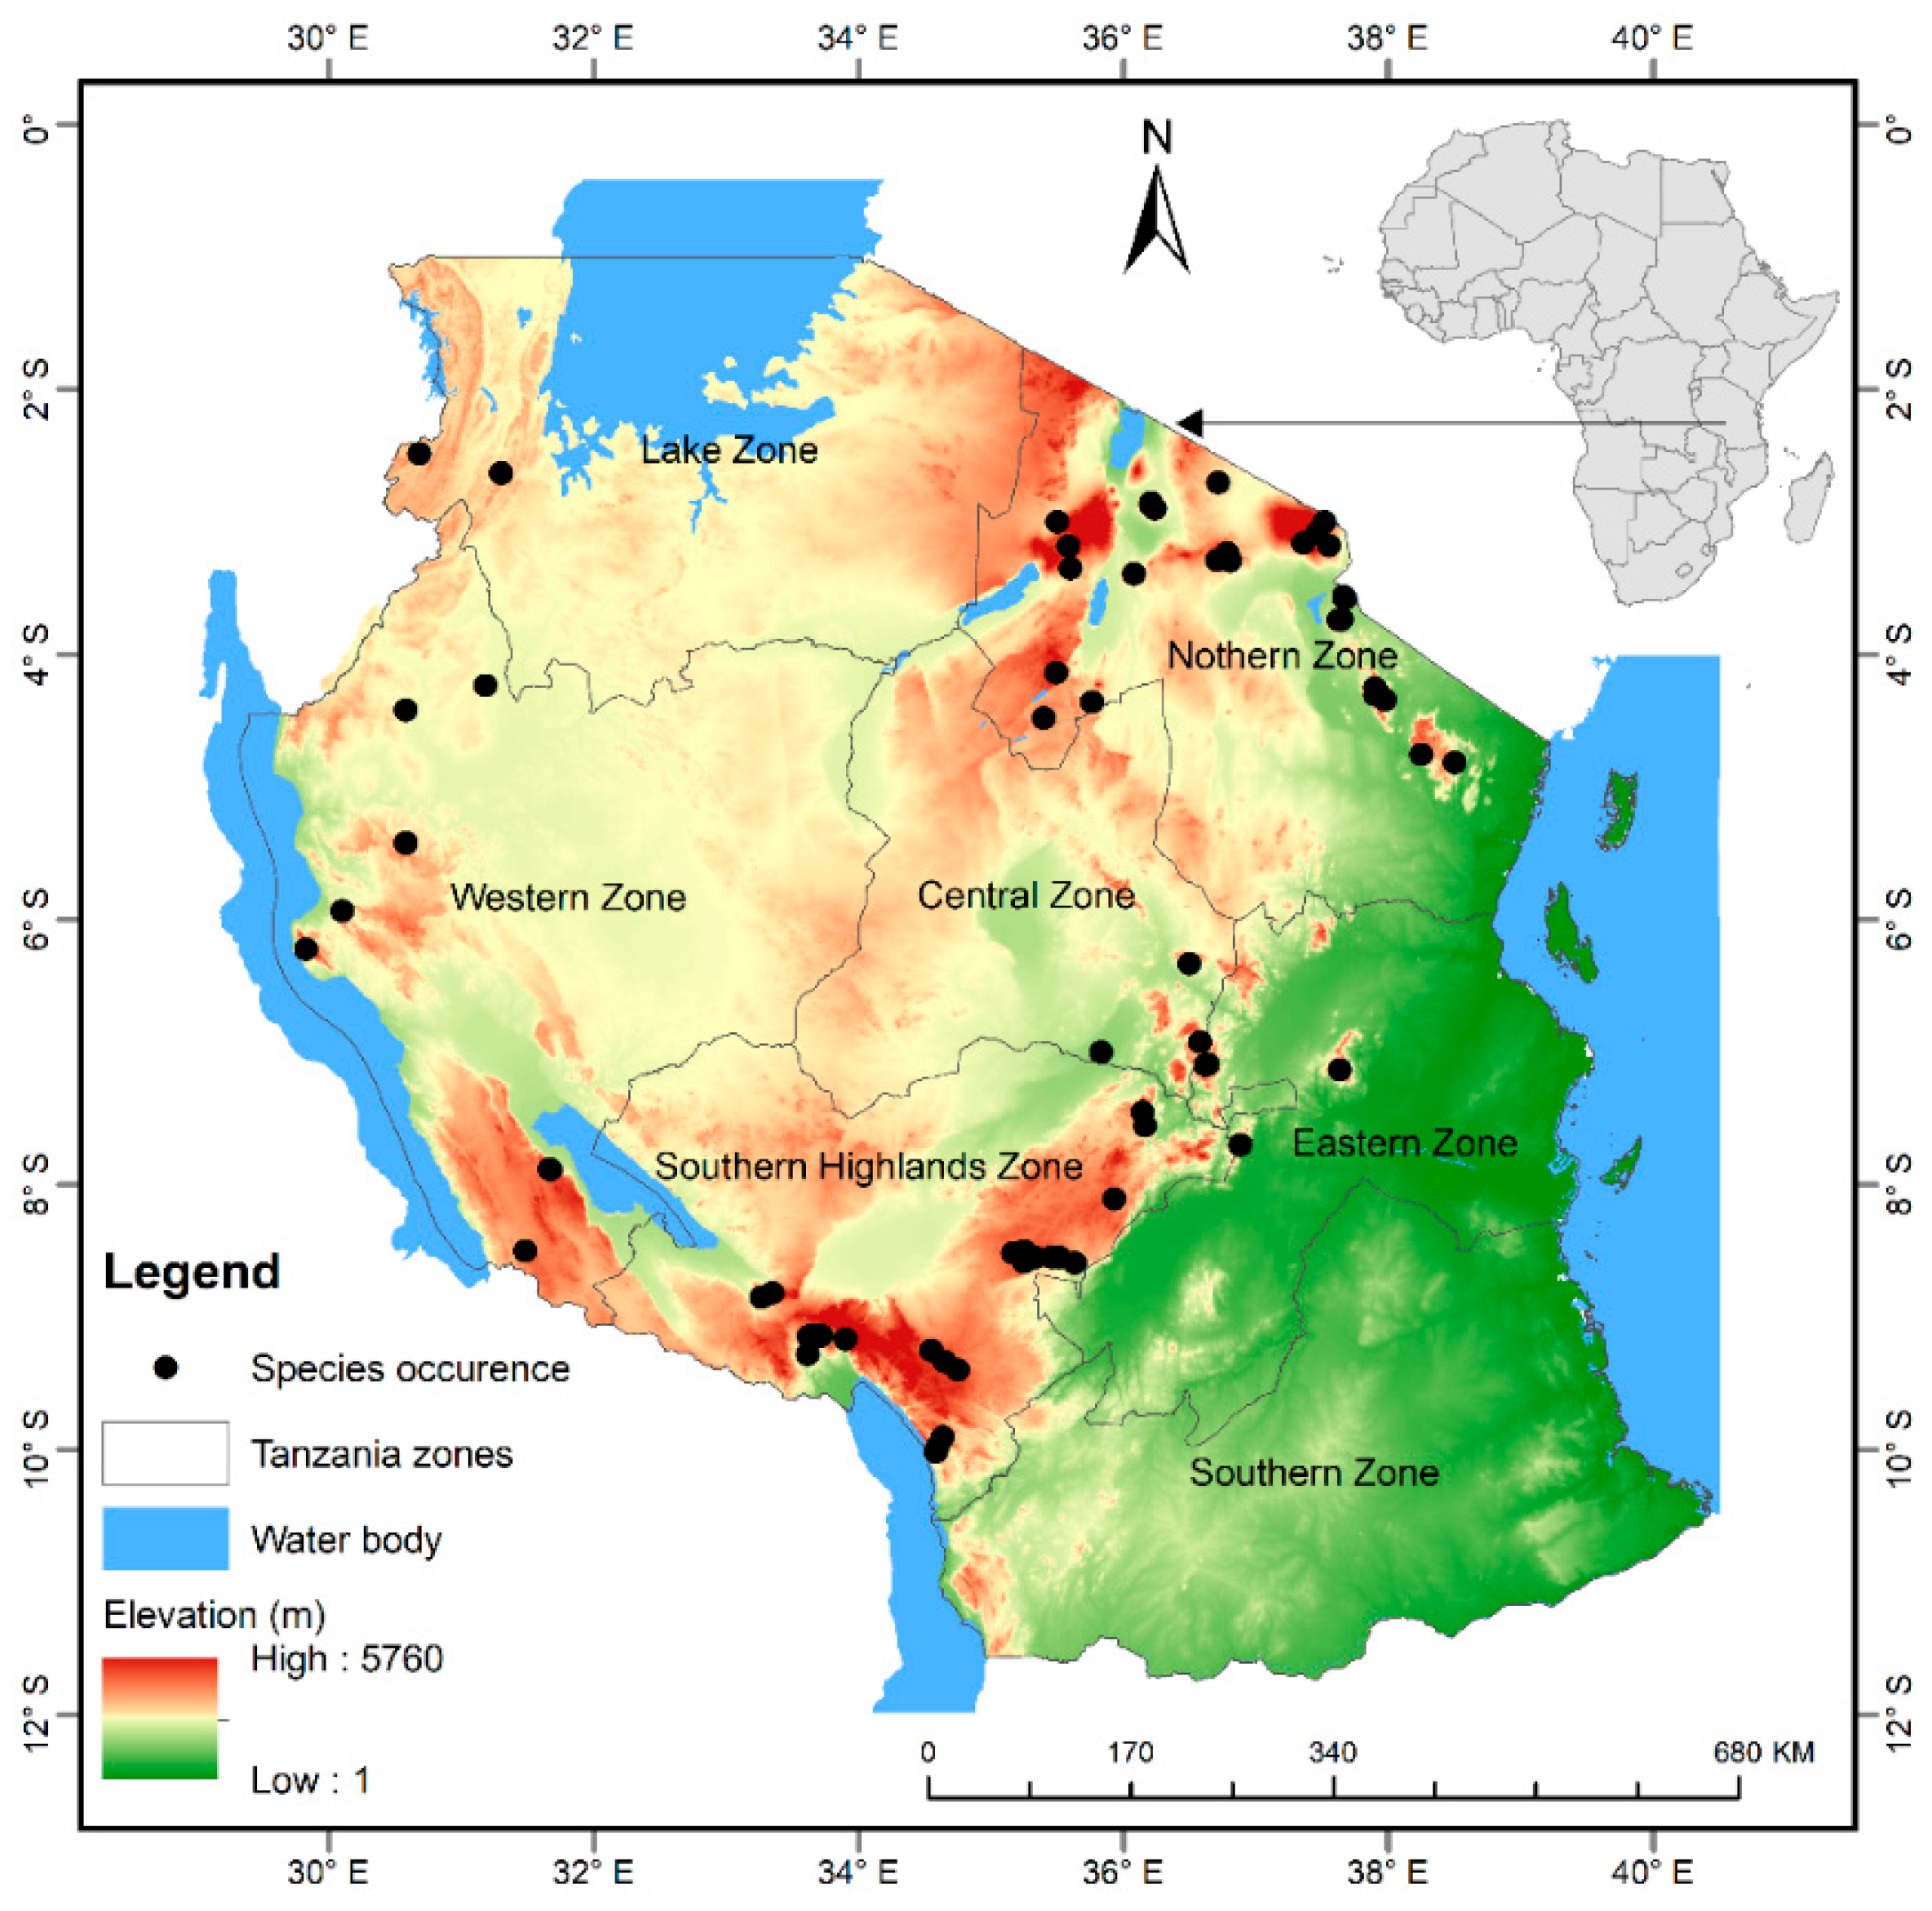
2.1. Study Area

The United Republic of Tanzania is located in East Africa between longitude 29° and 41° East and latitude 1° and 12° South (Figure 1). Tanzania is endowed with a wide range of natural resources as well as ecological and cultural diversity including extensive areas of arable land, wildlife reserves and parks, mountains, forest reserves, rivers, and lakes. The mean annual rainfall varies from below 500 mm to over 2000 mm per annum while the mean temperature ranges from −4.9 °C to 27.9 °C per annum. The central and western plateau is relatively dry while, the northern and southern highland are cool. Rainfall for large parts of the country is bimodal with short rains from October-December and long rains from March to May [39]. The country has 7 hotspots including forest reserves, nature reserves game reserves, and national parks that are recognized by The United Nations Educational, Scientific and Cultural Organization as World Heritage sites (https://whc.unesco.org). A significant number of world endemic and threatened species are reported from Tanzania (https://www.cbd.int). However, the country has lost its forest cover from land use change and it is threatened by changing climate [40].

2.2. Species Presence Records

We obtained the present locations of P. africana from a 5-year field survey done across the country by National Forest Resources Monitoring and Assessment Project, and different online sources, TROPICOS an online botanical database containing taxonomic information on plants (http://www.tropicos.org) and Global Biodiversity Information Facility database (http://www.gbif.org). A total of 187 records were collected, and after screening, 57 duplicate records were removed, and finally 120 records were used to run the model (Figure 1). To model potential attribution of P. africana across the country.

2.3. Environmental Variables

We collected 19 bioclimatic variables from WorldClim dataset (https://www.worldclim.org). To derive elevation and terrain ruggedness index, we downloaded a digital elevation model from Shuttle Radar Topography Mission dataset (http://srtm.csi.cgiar.org). Soil type (Table 1) were obtained from the International Soil Reference and Information Centre database (https://www.isric.org). We resampled both soils and topographic layers to the resolution of bioclimatic variables (~1 km) using ArcGIS 10.6. To reduce multi-collinearity of climate variables, the two variables that found to have a high correlation coefficient (|r| > 0.7), as suggested by [41], we selected “one variable for modeling due to its ecological importance for the survival of P. africana” [42]. This resulted in the inclusion of eight variables for modeling. Table 2 lists the general statistics of the major environmental variables used in this study. We used Climate Community Climate System version four (CCSM4) bioclimatic variables to predict the future distribution of P. africana under future climate scenarios, namely representative concetration pathway (RCP) 4.5 a moderate greenhouse gas emission scenario and RCP 8.5 a extreme greenhouse gas emission scenario for mid-century and late-century. The CCSM4 is among the most commonly used bioclimatic variables to predict the impact of climate change on plant distribution [1,3].

2.4. Species Distribution Modeling

We used Maxent version 3.3.3; [17] to model the distribution of P. africana in this study due to the unavailability of absence records. Maxent uses presence records in combination with environmental conditions the species is present to model the spatial distribution based on the theory of maximum entropy [14]. During modeling, we selected 75% of presence records to training the model and 25% for testing the model [1,3,15], while changing Maxent setting. We tried to set various values for the regularization multiplier and the number of iterations and changed feature types. We obtained the good results with the following settings; cross-validate with iterations set to 5000, regularization multiplier set to 1, and feature type set to quadratic, hinge, and linear. Further, the maximum number of background points was set to 10,000, and replicates were set to 30. Afterward, we imported current and future predicted maps for P. africana from Maxent models into ArcGIS 10.6 and reclassified into five classes of potential habitats according to [43]: unsuitable habitat (0–0.2); barely suitable habitat (0.2–0.4); suitable habitat (0.4–0.6); highly suitable habitat (0.6–0.8); very highly suitable habitat (0.8–1). Finally, current distribution maps were subtracted from future maps to compute the relative changes in species range (decreasing or increasing) [2].

2.5. Model Evaluation and Validation

We used the area under receiver operating characteristic (AUC) and true skill statistic (TSS) to assess the performance of model. The AUC values range between 0–1; higher AUC values suggest the better and higher performance of a model [14,17]. “TSS values range between +1 to −1; a values > 0.8 suggest excellent, 0.4–0.8 useful, and <0.4 poor model performance” [2]. Finally, we selected the model with highest AUC and TSS. Besides, we used jackknife test to identify important variable governing the distribution of P. africana. Further, we use response curves to show how the predicted probability of presence changes as each environmental variable is varied.

3. Results

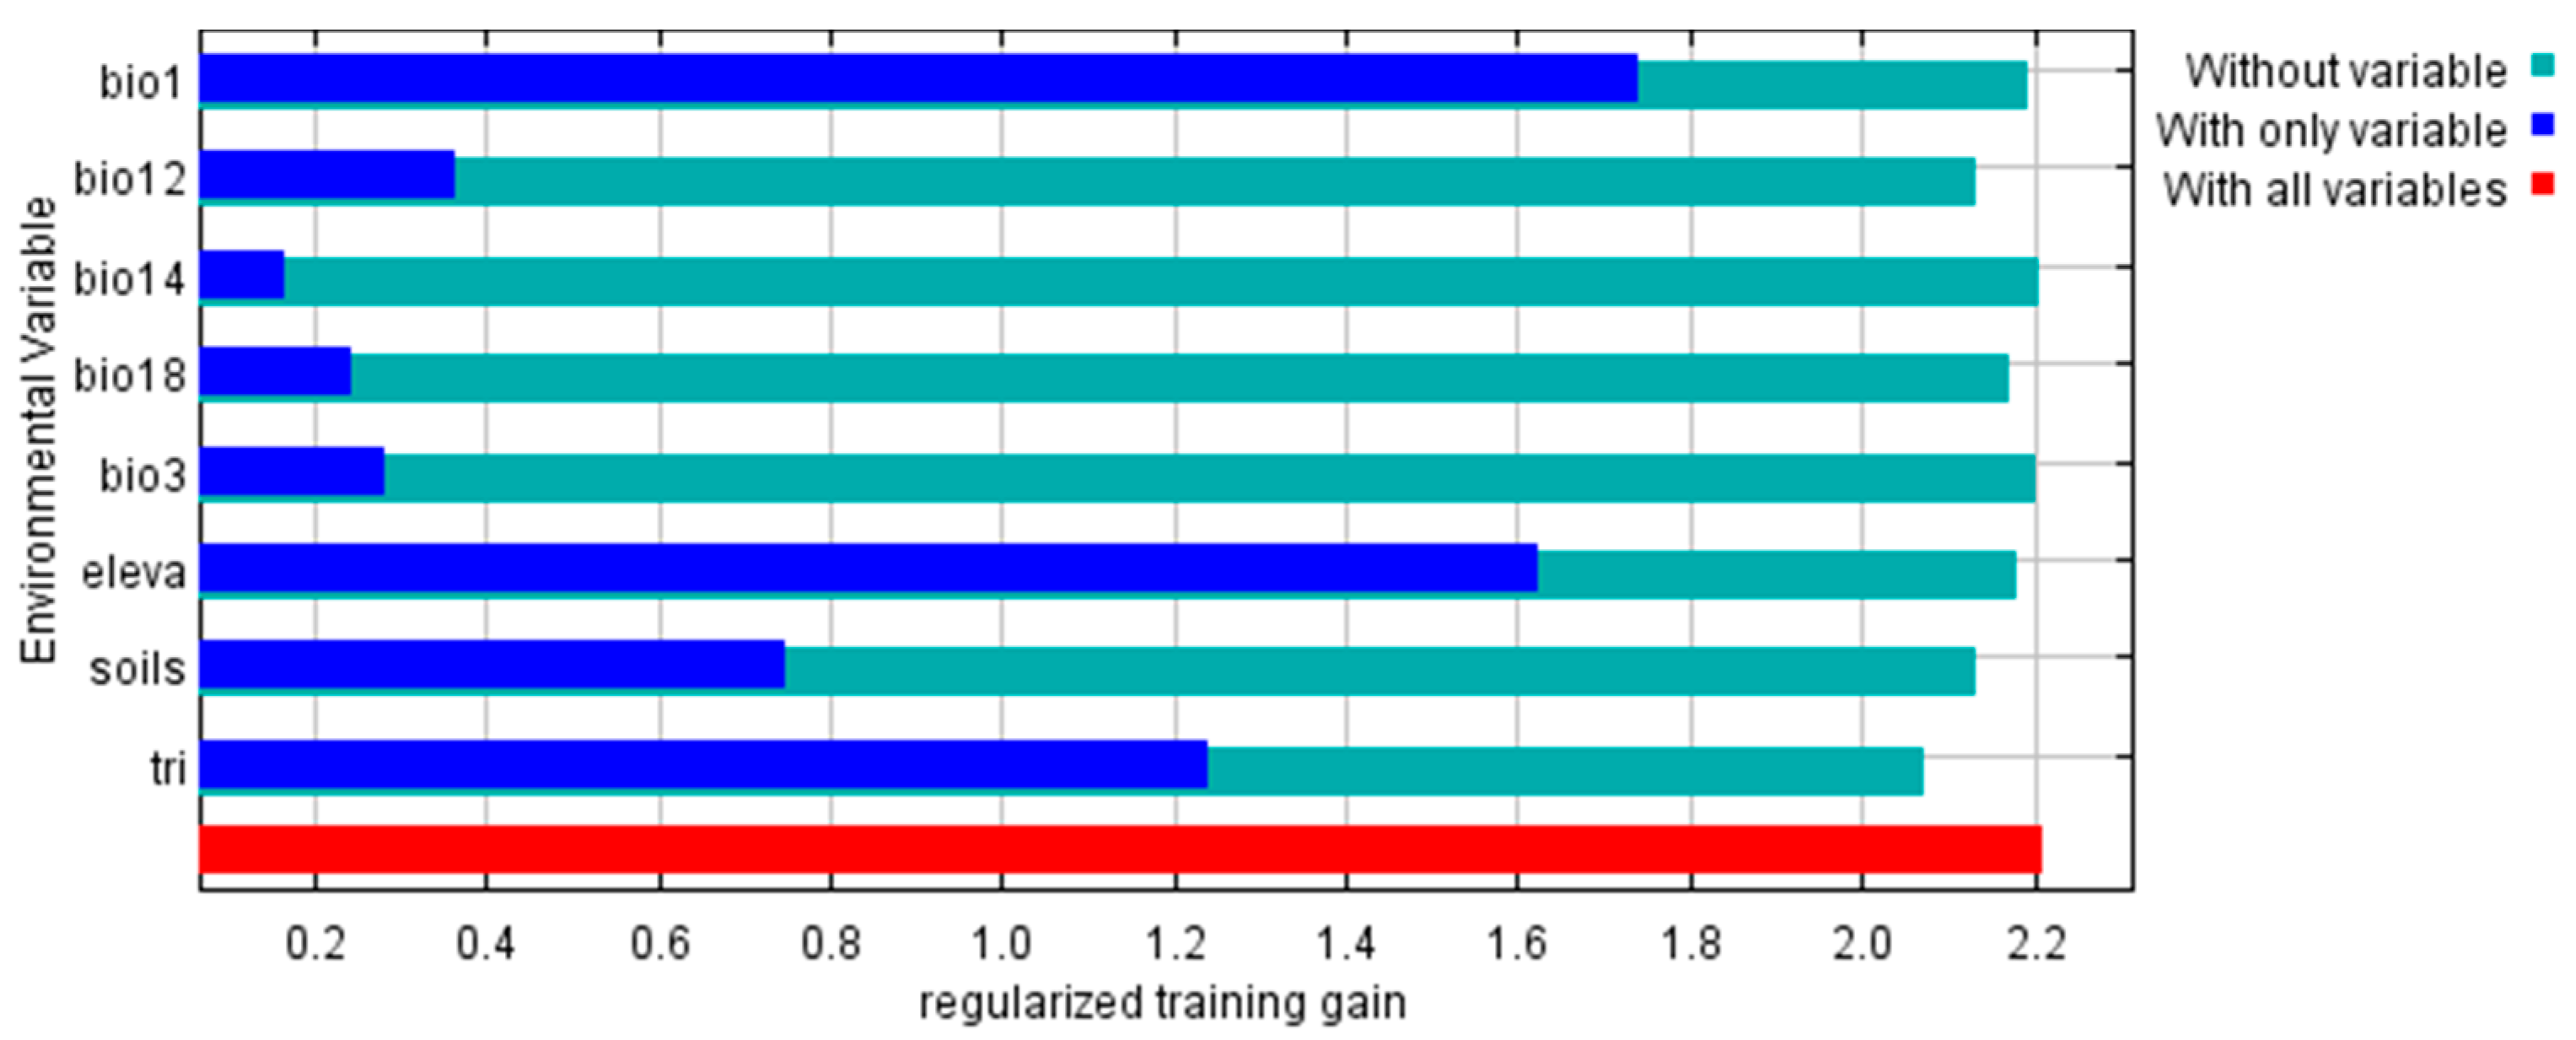
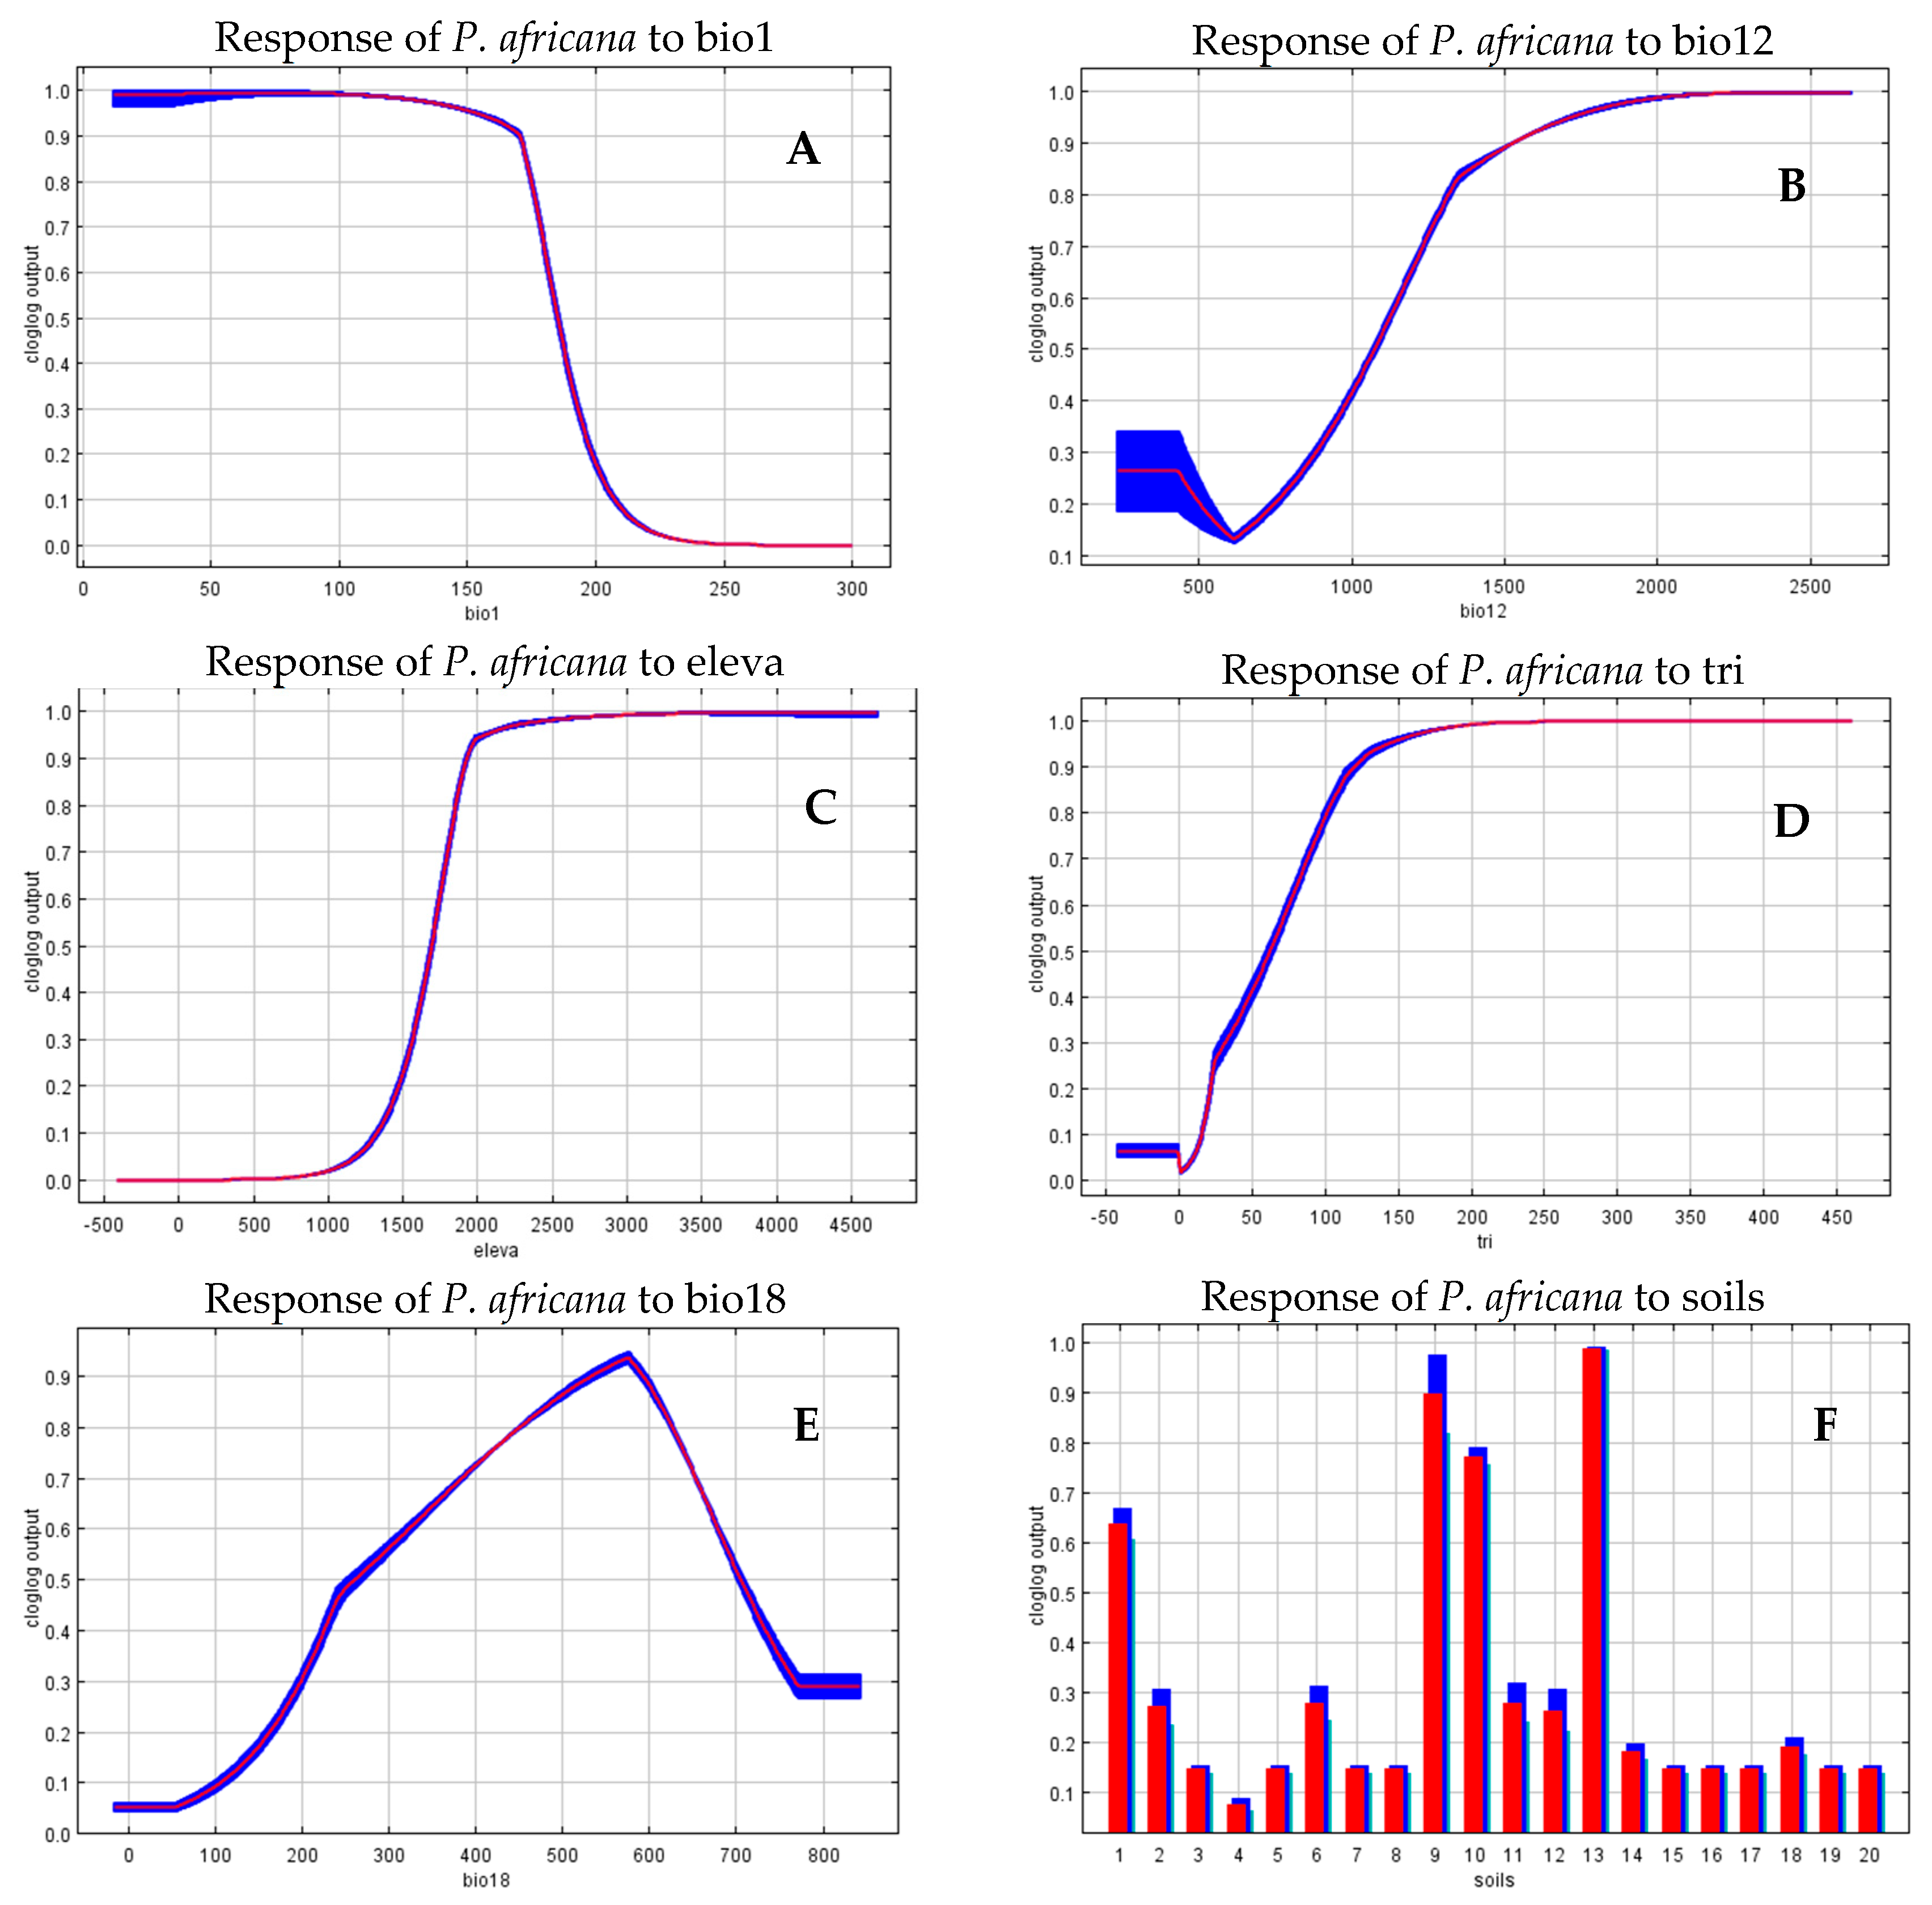
3.1. Model Validation and Influencing Bioclimatic Variables

Model for P. africana provided satisfactory results, with AUC and TSS values of 0.957 and 0.845 respectively. These suggest that the model for P. africana produced good results. Annual mean temperature (bio1) contributed most to the model, followed by terrain ruggedness index (tri) (Table 3). The cumulative contribution of these two variables is 83.30%. On the other hand, the variable with the highest gain when used in isolation is bio1, this implies this variable has the most useful information by itself. The variable that decreases the gain most when it is omitted is tri, this implies that the tri has the most information that is not present in the other variables (Figure 2). These results signify that bio1 and tri a proxy measure of topographic heterogeneity are the master variables governing the current and future distribution of P. africana in Tanzania.
Figure 3, below, shows how the predictions depend on the variables, as mean annual temperature (bio1), increases habitat suitability for P. africana decreases while its habitat suitability increases with annual precipitation (bio12). On the other hand, as elevation (eleva) and terrain ruggedness index (tri), increases habitat suitability for P. africana increases indicating that it prefers undulating upland areas. Further, P. africana prefers to reside on nitisols, histosols, leptosols, and acrisols soils, which is widely distributed in undulating upland areas.

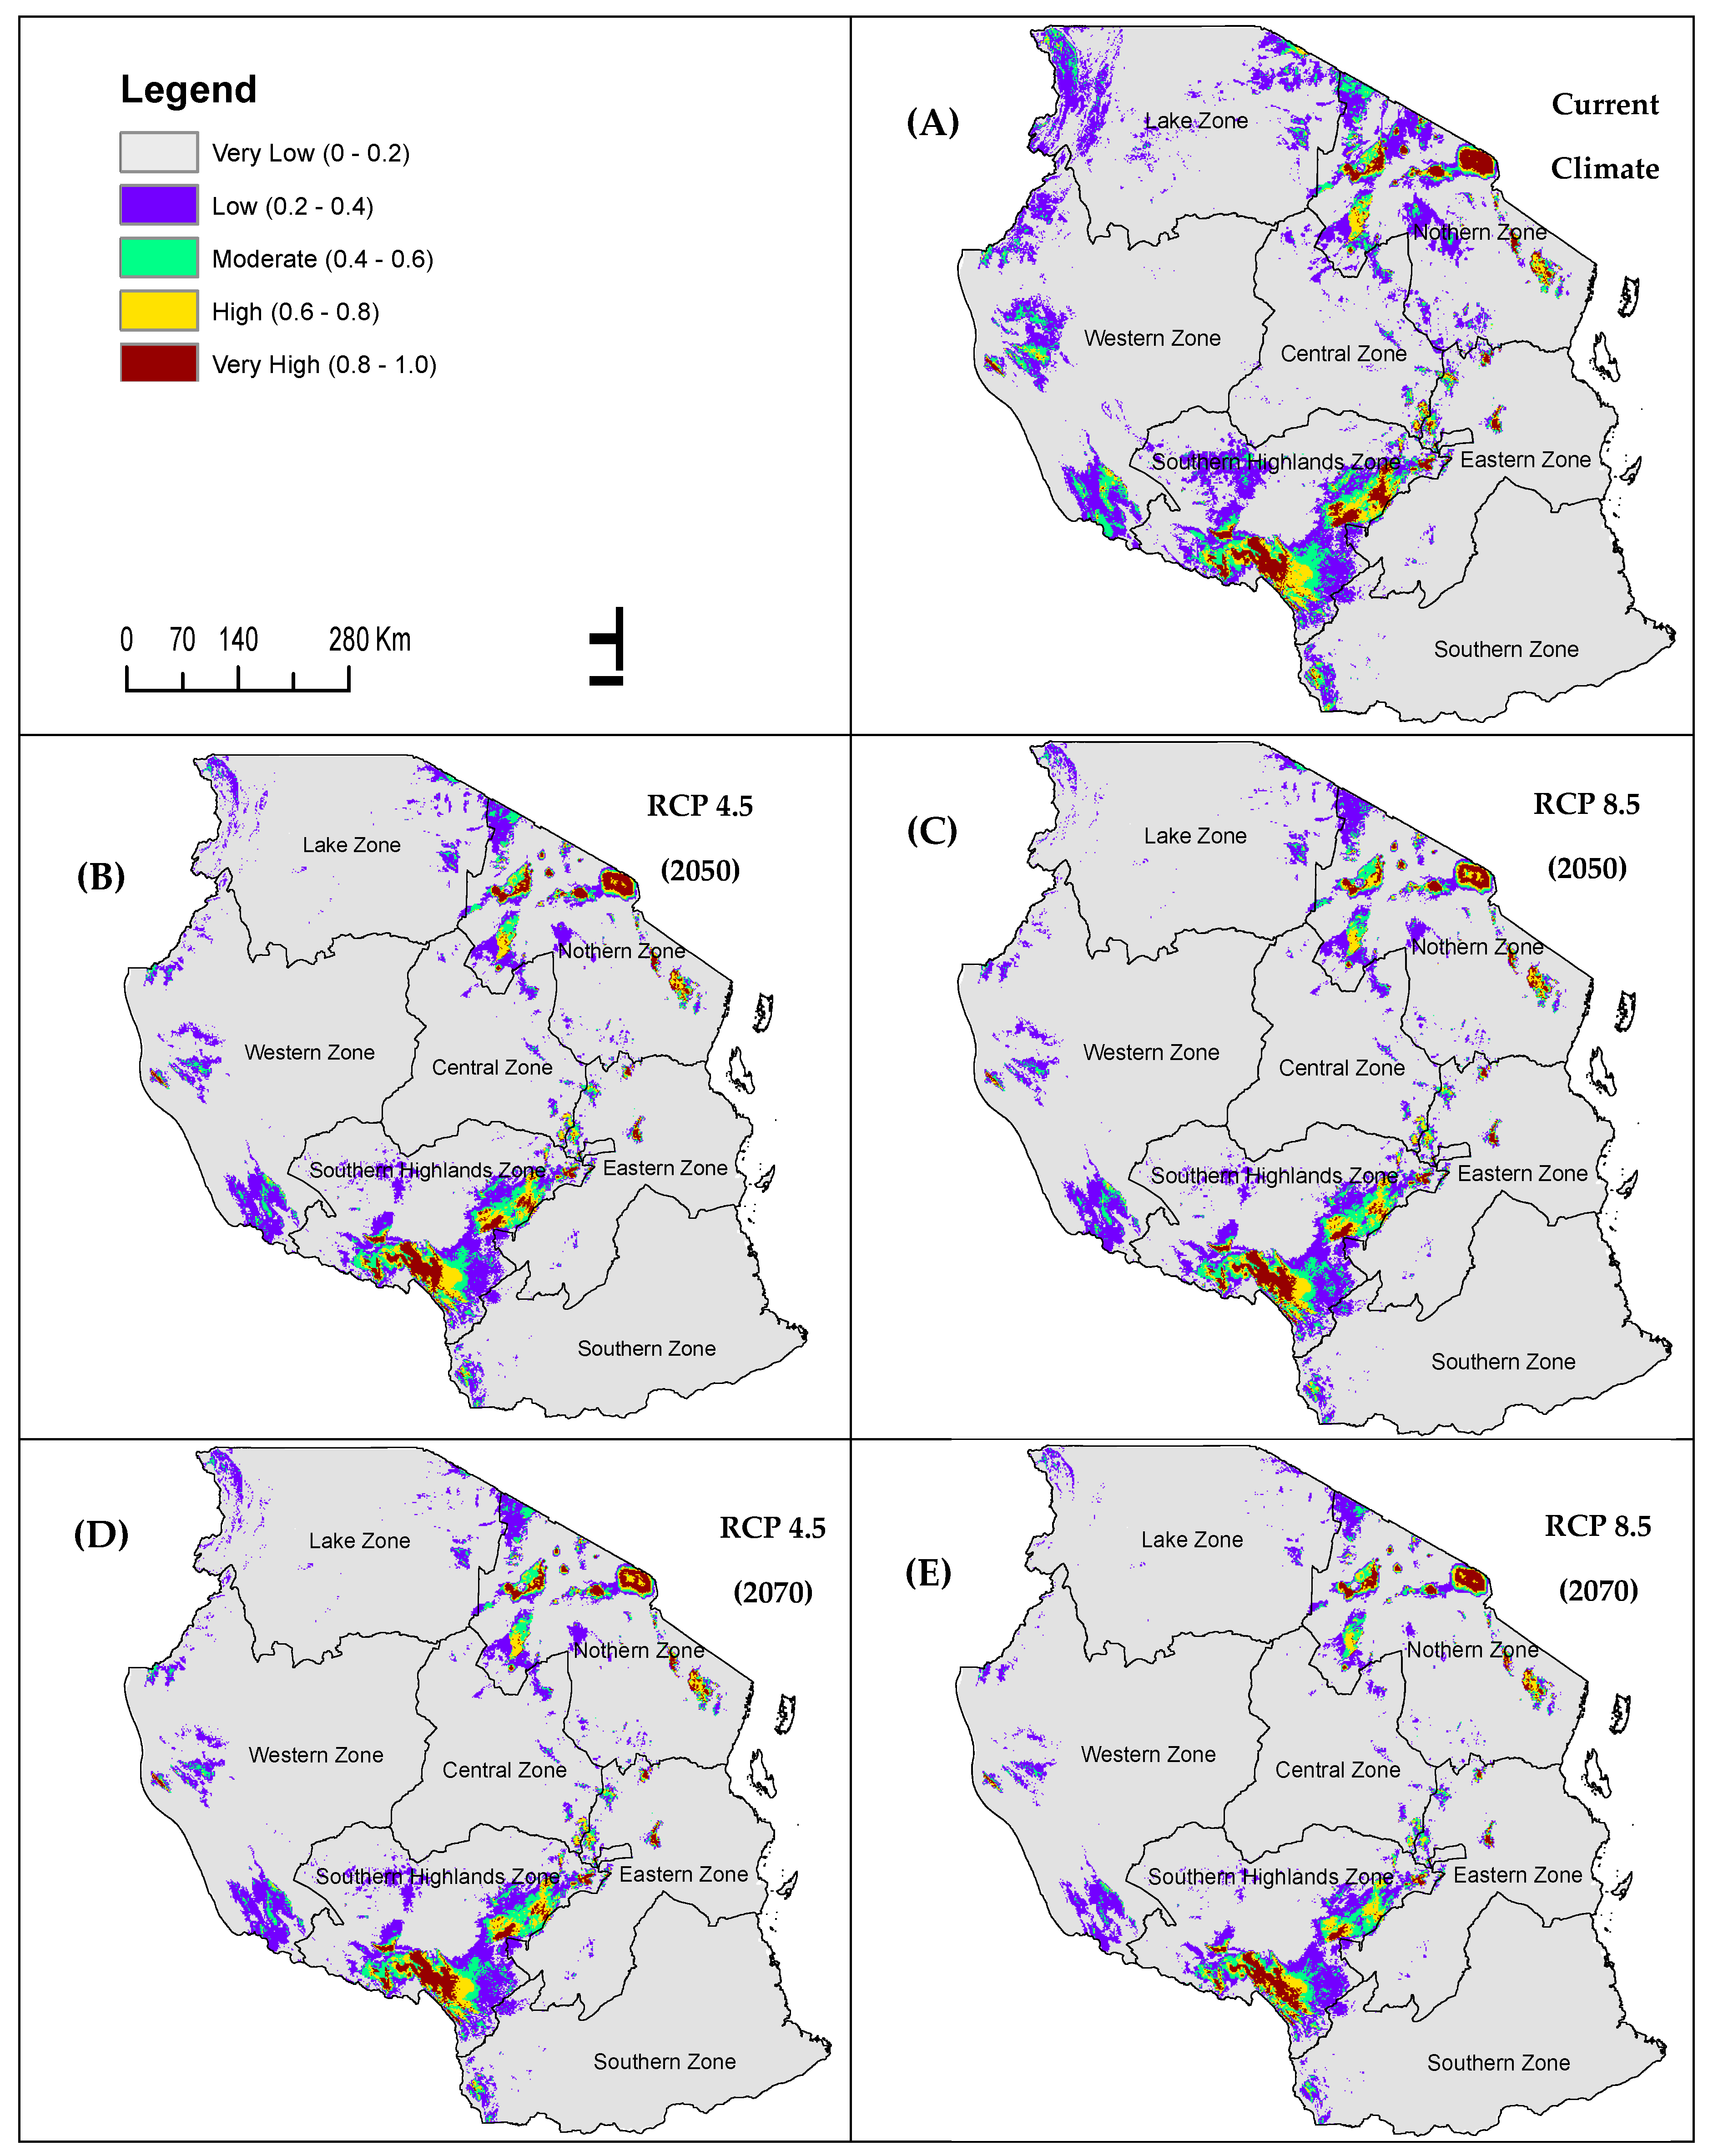
3.2. Current and Future Distribution of P. africana

Predicted distributions under current conditions revealed that highly and moderately suitable areas for P. africana covers only 6.69% (62,388.75 sq. km), while low and very low suitable areas cover the large portion, 93.31% (869,937.04 sq. km), of the study area (Table 4; Figure 4). The highly suitable areas to a large extent are identified in the southern highlands, western, and northern zones of the study area (Tanzania, Figure 4). Predicted distributions under future conditions indicates decline in suitable areas and increase in suitable areas under RCP 4.5 and RCP 8.5 scenarios for mid-century 2050 and late-century 2070 (Table 4; Figure 4). Climatically highly and moderately suitable areas will decline by 2.29% and 3.07% under RCP 8.5 for 2050 and 2070, respectively while under RCP 4.5 for 2050 and 2070 highly and moderately suitable areas will decline by 2.10% and 2.20% respectively. Climatically very low areas will increase by 6.85% and 8.59% under RCP 8.5 for 2050 and 2070, respectively while under RCP 4.5 for 2050 and 2070 suitable conditions will decline by 6.25% and 6.59% respectively (Table 4; Figure 4). Southern highlands, western, and northern zones are anticipated to lose large portion of suitable areas in the future for all climate scenarios under mid-century and late-century (Table 5; Figure 4).

4. Discussion

The findings of the study show that the suitability distribution of the P. africana is largely controlled by annual temperature, terrain ruggedness index, elevation, and soil type (contributed more than 90%). P. africana showed sharp decline in response to an increase in annual temperature beyond signifying that the probability of occurrence of the species may be affected with higher temperature. This is in line with the results from a study in eastern arc mountains Tanzania, where the studied tree species showed a declining trend in response to an increase in temperature [44]. With warming trends, plant species are expected to track the changing climate and shift their distributions to the extent that resource availability allows [6]. P. africana showed an increasing trend in response to an increase of the terrain ruggedness index suggesting that the species prefers rugged or undulating areas [45]. “Terrain ruggedness index as a measure of terrain heterogeneity is an important variable for predicting which habitats are used by a species and the density at which species occur in a variety of environments” [46]. P. africana showed an increasing trend in response to the increase of elevation indicating that the species prefers high elevation areas. Higher temperature is stated to cause shifts in plant distribution along the elevation gradients [47]. P. africana distribution appears to associate with Nitisols, Histosols, and Leptosols soils that are found in undulating upland areas. Soil type plays a major role in the heterogeneity of habitats, thus determining the distribution of plant species [48].

4.1. Management Implications

Our results indicate that climate change will pose a severe impact on the future distribution of P. africana in Tanzania. Research institutions and public universities can take an interest in both in situ and ex situ long-term monitoring trends of P. africana distribution in a country. In-situ interventions should focus on the “recruitment and regeneration of the species while ex-situ interventions should target to promote tree retention on farms, or advocate further planting, collect specimens, and to establish gene banks and botanical gardens to ensure the survival of the species” [42].

4.2. Institutional and Policy Context for Addressing Challenges Associated with P. africana

Addressing challenges associated with the vulnerability of P. africana in Tanzania can benefit from the institutional context already in place in the country. The government has put in place institutional frameworks to manage natural resources and environment-related initiatives and challenges countrywide. The President’s Office-Regional Administration and Local Government (PORALG) works closely with Local Government Authorities through their various departments in collaboration with the respective sector ministries to implement the strategic interventions at the local level (municipalities, districts, wards, villages, and sub-villages). This is important for addressing the immediate management decisions that directly affect the health and survival of P. africana, as the trees are directly impacted by community demand for livelihoods at the local level. Successful implementation of policies, laws, and plans also requires enhanced engagement with Civil Society Organizations, development partners, the private sector, and academic and research institutions.
Addressing the more systemic and long-term environmental challenges facing P. africana would be best addressed within the institutional arrangements for environmental management functions in Tanzania. These are two basic types of such functions: (i) Sectoral Environmental Management Functions (also known as Type A functions) that are concerned with the management of specific natural resources or environmental services, such as forestry, agriculture, fisheries, wildlife, mining, and waste management. These functions are to a large extent operational and guided by sector-specific policies and acts such as the Forest Act (2002), which should be directly relevant for addressing challenges of P. africana. (ii) Coordinating and Supporting Environmental Management Functions (commonly referred to as Type B functions) involve the task of providing central support functions by coordinating and supporting the different and sometimes conflicting Type A activities and integrating them into an overall sustainable system. Specific tools within this Type B functions relevant for addressing challenges of P. africana are the National Environmental Policy (1997) and the Environmental Management Act (2004), which provide policy and legislative framework for the coordination of the implementation of policies and laws on environmental and natural resources management.

4.3. Conservation and Management Approaches to Support Sustainable Practices in Favor of P. africana

Three main conservation and management approaches can offer possibilities to address the vulnerability of P. africana in Tanzania. These draw from experiences in other parts of the developing world facing conservation challenges of their own and the lessons learned from their conservation and management approaches.

4.3.1. Supporting Inclusive Conservation Approaches

While climate changing is increasingly representing a challenge to the distribution and health of P. africana, this challenge comes to compound existing pressures imposed by anthropogenic pressures of the species. Given the high degree of anthropic intervention contributing to the vulnerability of the species, conservation and management strategies need to be closely linked to the needs of indigenous peoples and local communities. There is therefore a serious need to consider the genuine and effective participation of indigenous peoples and local communities in the definition and application of resource management options when addressing challenges to the sustainable management of P. africana. Given the importance of this specie to the health of local populations, socio-economic and environmental welfare, emphasis on supporting its sustainable and adaptive use, supported by initiatives that reduce local reliance on the harvesting of wild resources (such as agroforestry) may prove to be more locally acceptable. This principle of “conservation through use” is an example of the application of community-based natural resources management models to address issues of resource degradation. These types of co-management models have been applied to the successful management of protected resources in other parts of the world [41]. Such an approach will be in alignment with current governmental efforts towards a more inclusive management of forests and natural resources. A program of Participatory Forest Management has been introduced and operationalized through the Joint Forest Management (JFM) as well as a Community Based Forest Management (CBFM) processes across the country. Under JFM, agreements between community groups and the Government have been developed with a view to promoting the participation of communities in the management and utilization of forest resources. The Community Based Forest Management program encourages communities to set up forest reserves from the general lands for economic and conservation activities.

4.3.2. Collaboration to Streamline and Align Regional and International Efforts

Given the regional and international character of challenges of P. africana vulnerability, there is a need for collaboration to improving forest management, share best practices, and support effective conservation as well as the production and trade of forest products. The Collaborative Partnership on Forests (CPF) is an informal, voluntary arrangement among 14 international organizations to share experiences and build on them to produce new benefits for their respective national stakeholders in the forest resources sector [41]. Addressing the challenges of P. africana has the potential of benefiting from the CPF whose mission is to promote sustainable management of all types of forests and to strengthen long-term political commitment to this end.

4.3.3. Leveraging the Potential of Payments for Ecosystem Services (PES)

Payments for ecosystem services (PES) refer to voluntary transactions between users and suppliers of environmental services, such that suppliers are subject to natural resource management and handling rules within and outside of service provision areas [49]. Under a PES scheme, users of land upstream may agree to voluntary limitation or diversification of their activities in return for an economic benefit. In many parts of the world, the positive impact on forest cover and species diversity of the implementation of PES) schemes have been documented [50,51]. Developing PES schemes that specifically target compounding factors contributing to the vulnerability of P. africana can contribute to reducing these vulnerabilities. Such schemes would also concomitantly contribute to combatting the degradation or loss of essential ecosystems and ecosystem services without sacrificing the well-being of people—an essential element in the portfolio of Tanzania’s sustainable development goals. It must be noted however that the design and implementation of PES programs must be carefully done, adopting best practices as well as the best and most recent scientific guidance on the subject matter. This is because PES per se is not a panacea for addressing underlying deficiencies in natural resources governance policies and practices where they exist. For example, Tuanmu Viña [50] observed that the effectiveness of a PES program depends on who receives the payment and on whether the payment provides sufficient incentives.

4.3.4. Incorporating Forest Management into the Circular Economy

In striving to incorporate forests and forestry into the circular economy, it is important to understand some of the strategies required to achieve the transition from a linear to a circular economy. In a study aimed at understanding strategies for an effective transition into sustainable forest-based bioeconomy in Italy, Falcon, Tani [52] identified that four strategies are most effective. These include defining viable methods of circular management to improve environmental and forest planning; investing in forest infrastructure; supporting entrepreneurship programs for professionals in the forestry sector; and enhancing the development and application of innovative forest-based value chains.
One of the key challenges to transitioning the exploitation and use of P. africana in Tanzania from a linear to a circular economic model is that of adding value to the main product, as well as to bio-residuals. Much of the chain for its value-addition for its many uses (medicinal, furniture, fuelwood, etc.) is minimal to non-existent. This is in line with the recognition of that weak market pull, needs for big investments, and the adoption of risk-averse approaches among the few incumbent firms in the sector are reducing the potential for the forestry industry to invest in technological and market capabilities for valorizing residuals [53].

5. Conclusions

Bioclimatic predictors mainly mean annual temperature presented high contribution and important information in predicting distribution and mapping habitat suitability for P. africana in Tanzania. Suitable habitats for P. africana will decline in mid- and late-century for both RCP 4.5 and RCP 8.5 scenarios when compared with baseline conditions. For instance, southern highlands and northern zones will constantly lose much more suitable habitats for P. africana in the future. The areas mapped in this study as suitable habitats for the tree species could be advantageous for conservation planning and afforestation interventions.

Author Contributions

R.A.G. and G.T.Y. contributed equally in the following tasks: conceptualization of the study; methodology development; investigation, data analysis; writing—original draft preparation; as well as the review and editing of the final draft. All authors have read and agreed to the published version of the manuscript.

Funding

This research was not funded by any external party.

Acknowledgments

The authors acknowledge the occurrence data providers Tanzania Forest Service Agency, Global Biodiversity Information Facility and TROPICOS. Further, the authors are grateful to Mathew Mpanda for his valuable suggestions and comments on the manuscripts. Finally, the authors are grateful to Elikana John for his guidance to access the soils data.

Conflicts of Interest

The authors declare no conflict of interest.

Appendix A

Figure A1. Distribution of the selected environmental variable in the study area.
Atmosphere 11 00988 g0a1

References

  1. Heshmati, I.; Khorasani, N.; Shams-Esfandabad, B.; Riazi, B. Forthcoming risk of Prosopis juliflora global invasion triggered by climate change: Implications for environmental monitoring and risk assessment. Environ. Monit. Assess. 2019, 191, 72. [Google Scholar] [CrossRef] [PubMed]
  2. Pramanik, M.; Paudel, U.; Mondal, B.; Chakraborti, S.; Deb, P. Predicting climate change impacts on the distribution of the threatened Garcinia indica in the Western Ghats, India. Clim. Risk Manag. 2018, 19, 94–105. [Google Scholar] [CrossRef]
  3. Abrha, H.; Birhane, E.; Hagos, H.; Manaye, A. Predicting suitable habitats of endangered Juniperus procera tree under climate change in Northern Ethiopia. J. Sustain. For. 2018, 37, 842–853. [Google Scholar] [CrossRef]
  4. Priti, H.; Aravind, N.A.; Uma Shaanker, R.; Ravikanth, G. Modeling impacts of future climate on the distribution of Myristicaceae species in the Western Ghats, India. Ecol. Eng. 2016, 89, 14–23. [Google Scholar] [CrossRef]
  5. Thompson, I.; Mackey, B.; McNulty, S.; Mosseler, A. Forest Resilience, Biodiversity, and Climate Change. Secr. Conv. Biol. Divers. Montr. Tech. Ser. 2009, 43, 1–67. [Google Scholar]
  6. Berry, P.M.; Dawson, T.P.; Harrison, P.A.; Pearson, R.G. Modelling potential impacts of climate change on the bioclimatic envelope of species in Britain and Ireland. Glob. Ecol. Biogeogr. 2002, 11, 453–462. [Google Scholar] [CrossRef]
  7. Sommer, J.H.; Kreft, H.; Kier, G.; Jetz, W.; Mutke, J.; Barthlott, W. Projected impacts of climate change on regional capacities for global plant species richness. Proc. R. Soc. B Biol. Sci. 2010, 277, 2271–2280. [Google Scholar] [CrossRef] [Green Version]
  8. Lawler, J.J.; White, D.; Neilson, R.P.; Blaustein, A.R. Predicting climate-induced range shifts: Model differences and model reliability. Glob. Chang. Biol. 2006, 12, 1568–1584. [Google Scholar] [CrossRef] [Green Version]
  9. Lindner, M.; Maroschek, M.; Netherer, S.; Kremer, A.; Barbati, A.; Garcia-Gonzalo, J.; Seidl, R.; Delzon, S.; Corona, P.; Kolström, M.; et al. Climate change impacts, adaptive capacity, and vulnerability of European forest ecosystems. For. Ecol. Manag. 2010, 259, 698–709. [Google Scholar] [CrossRef]
  10. Thuiller, W.; Lavorel, S.; Araújo, M.B.; Sykes, M.T.; Prentice, I.C. Climate change threats to plant diversity in Europe. Proc. Natl. Acad. Sci. USA 2005, 102, 8245–8250. [Google Scholar] [CrossRef] [Green Version]
  11. Porfirio, L.L.; Harris, R.M.B.; Lefroy, E.C.; Hugh, S.; Gould, S.F.; Lee, G.; Bindoff, N.L.; Mackey, B. Improving the Use of Species Distribution Models in Conservation Planning and Management under Climate Change. PLoS ONE 2014, 9, e113749. [Google Scholar] [CrossRef] [PubMed] [Green Version]
  12. Kumar, S.; Stohlgren, T.J. Maxent modeling for predicting suitable habitat for threatened and endangered tree Canacomyrica monticola in New Caledonia. J. Ecol. Nat. Environ. 2009, 1, 94–98. [Google Scholar]
  13. Botkin, D.B.; Saxe, H.; Araujo, M.B.; Betts, R.; Bradshaw, R.H.; Cedhagen, T.; Chesson, P.; Dawson, T.P.; Etterson, J.R.; Faith, D.P.; et al. Forecasting the effects of global warming on biodiversity. Bioscience 2007, 57, 227–236. [Google Scholar] [CrossRef]
  14. Elith, J.H.; Graham, C.P.; Anderson, R.; Dudík, M.; Ferrier, S.; Guisan, A.J.; Hijmans, R.; Huettmann, F.R.; Leathwick, J.; Lehmann, A.; et al. Novel methods improve prediction of species’ distributions from occurrence data. Ecography 2006, 29, 129–151. [Google Scholar] [CrossRef] [Green Version]
  15. Phillips, S.J.; Dudík, M. Modeling of species distributions with Maxent: New extensions and a comprehensive evaluation. Ecography 2008, 31, 161–175. [Google Scholar] [CrossRef]
  16. Ortega-Huerta, M.A.; Peterson, A.T. Modeling ecological niches and predicting geographic distributions: A test of six presence-only methods. Rev. Mex. Biodivers. 2008, 79, 205–216. [Google Scholar]
  17. Phillips, S.J.; Anderson, R.P.; Schapire, R.E. Maximum entropy modeling of species geographic distributions. Ecol. Model. 2006, 190, 231–259. [Google Scholar] [CrossRef] [Green Version]
  18. Mwakapeje, E.R.; Ndimuligo, S.A.; Mosomtai, G.; Ayebare, S.; Nyakarahuka, L.; Nonga, H.E.; Mdegela, R.H.; Skjerve, E. Ecological niche modeling as a tool for prediction of the potential geographic distribution of Bacillus anthracis spores in Tanzania. Int. J. Infect. Dis. 2019, 79, 142–151. [Google Scholar] [CrossRef] [Green Version]
  19. Yi, Y.J.; Zhou, Y.; Cai, Y.P.; Yang, W.; Li, Z.W.; Zhao, X. The influence of climate change on an endangered riparian plant species: The root of riparian Homonoia. Ecol. Indic. 2018, 92, 40–50. [Google Scholar] [CrossRef]
  20. Loiselle, B.A.; Howell, C.A.; Graham, C.H.; Goerck, J.M.; Brooks, T.; Smith, K.G.; Williams, P.H. Avoiding Pitfalls of Using Species Distribution Models in Conservation Planning. Conserv. Biol. 2003, 17, 1591–1600. [Google Scholar] [CrossRef]
  21. Saatchi, S.; Buermann, W.; Ter Steege, H.; Mori, S.; Smith, T.B. Modeling distribution of Amazonian tree species and diversity using remote sensing measurements. Remote Sens. Environ. 2008, 112, 2000–2017. [Google Scholar] [CrossRef]
  22. Cheboiwo, J.K.; Mugabe, R.; Langat, D. Review of conservation of Prunus africana and international trade opportunities for its bark in Kenya. J. Emerg. Trends Eng. Appl. Sci. 2014, 5, 372–377. [Google Scholar]
  23. Bii, C.; Korir, K.R.; Rugutt, J.; Mutai, C. The potential use of Prunus africana for the control, treatment and management of common fungal and bacterial infections. J. Med. Plants Res. 2010, 4, 995–998. [Google Scholar] [CrossRef]
  24. Jena, A.K.; Vasisht, K.; Sharma, N.; Kaur, R.; Dhingra, M.S.; Karan, M. Amelioration of testosterone induced benign prostatic hyperplasia by Prunus species. J. Ethnopharmacol. 2016, 190, 33–45. [Google Scholar] [CrossRef] [PubMed]
  25. Mwitari, P.G.; Ayeka, P.A.; Ondicho, J.; Matu, E.N.; Bii, C.C. Antimicrobial Activity and Probable Mechanisms of Action of Medicinal Plants of Kenya: Withania somnifera, Warbugia ugandensis, Prunus africana and Plectrunthus barbatus. PLoS ONE 2013, 8, e65619. [Google Scholar] [CrossRef] [PubMed]
  26. Kadu, C.A.C.; Parich, A.; Schueler, S.; Konrad, H.; Muluvi, G.M.; Eyog-Matig, O.; Muchugi, A.; Williams, V.L.; Ramamonjisoa, L.; Kapinga, C.; et al. Bioactive constituents in Prunus africana: Geographical variation throughout Africa and associations with environmental and genetic parameters. Phytochemistry 2012, 83, 70–78. [Google Scholar] [CrossRef]
  27. Nyamai, D.; Mawia, A.; Wambua, F.; Njoroge, A.; Matheri, F.; Lagat, R.; Kiambi, J.; Ogola, P.; Arika, W.; Cheseto, X.; et al. Pharmacognosy & Natural Products Phytochemical Profile of Prunus africana Stem Bark from Kenya. J. Pharmacogn. Nat. Prod. 2015, 1, 1–8. [Google Scholar] [CrossRef]
  28. Catalano, S.; Ferretti, M.; Marsili, A.; Morelli, I. New constituents of Prunus africana bark extract. J. Nat. Prod. 1984, 47, 910. [Google Scholar] [CrossRef]
  29. Maximillian, J.R.; O’Laughlin, J. Toward sustainable harvesting of Africa’s largest medicinal plant export (Prunus africana): A case study in Tanzania. South. For. 2009, 71, 303–309. [Google Scholar] [CrossRef]
  30. Hall, J.B.; O’Brien, E.M.; Sinclair, F.L. Prunus africana: A monograph. Sch. Agric. For. Sci. Publ. Number Univ. Wales Bangor 2000, 18, 104. [Google Scholar]
  31. Anderson, P.K.; Cunningham, A.A.; Patel, N.G.; Morales, F.J.; Epstein, P.R.; Daszak, P. Emerging infectious diseases of plants: Pathogen pollution, climate change and agrotechnology drivers. Trends Ecol. Evol. 2004, 19, 535–544. [Google Scholar] [CrossRef] [PubMed]
  32. Fashing, P.J. Mortality trends in the African cherry (Prunus africana) and the implications for colobus monkeys (Colobus guereza) in Kakamega Forest, Kenya. Biol. Conserv. 2004, 120, 449–459. [Google Scholar] [CrossRef]
  33. Cunningham, A.; Anoncho, V.F.; Sunderland, T. Power, policy and the Prunus africana bark trade, 1972–2015. J. Ethnopharmacol. 2016, 178, 323–333. [Google Scholar] [CrossRef] [Green Version]
  34. Chupezi, T.J. Critical Study of Guidance for A National Prunus africana Management Plan-Cameroon. Under the Supervision of Dr Jean Lagarde BETTI, Regional Coordinator of the ITTO–CITES Program in Africa. Ph.D. Thesis, University of KwaZulu-Natal, Durban, South Africa, 2010; pp. 1–33. [Google Scholar]
  35. Reichel, A.; De Schoenmakere, M.; Gillabel, J. Circular Economy in Europe-Developing the Knowledge Base (European Environment Agency Report No 2/2016); European Environmental Agency: Luxembourg, 2016; ISBN 9789292137199. [Google Scholar]
  36. Ia, W. Forestry and Forestry Based Industry Implications Digitalisation and Circular Economy: Forestry and Forestry Based Industry Implications; Union of Scientists of Bulgaria: Sofia, Republic of Bulgaria, 2019; ISBN 9789543970421. [Google Scholar]
  37. Pirc Barčić, A.; Kitek Kuzman, M.; Haviarova, E.; Oblak, L. Circular economy & Sharing collaborative economy principles: A case study conducted in wood-based sector. In Digitalisation and Circular Economy: Forestry and Forestry Based Industry Implications; Union of Scientists of Bulgaria: Sofia, Republic of Bulgaria, 2019; pp. 23–28. [Google Scholar]
  38. Schroeder, P.; Anggraeni, K.; Weber, U. The Relevance of Circular Economy Practices to the Sustainable Development Goals. J. Ind. Ecol. 2019, 23, 77–95. [Google Scholar] [CrossRef] [Green Version]
  39. Magehema, A.; Chang, L.; Mkoma, S. Implication of rainfall variability on maize production in Morogoro, Tanzania. Int. J. Environ. Sci. 2014, 4, 1077–1086. [Google Scholar] [CrossRef]
  40. Capitani, C.; Van Soesbergen, A.; Mukama, K.; Malugu, I.; Mbilinyi, B.; Chamuya, N.; Kempen, B.; Malimbwi, R.; Mant, R.; Munishi, P.; et al. Scenarios of Land Use and Land Cover Change and Their Multiple Impacts on Natural Capital in Tanzania. Environ. Conserv. 2019, 46, 17–24. [Google Scholar] [CrossRef] [Green Version]
  41. Dormann, C.F.; Elith, J.; Bacher, S.; Buchmann, C.; Carl, G.; Carré, G.; Marquéz, J.R.G.; Gruber, B.; Lafourcade, B.; Leitão, P.J.; et al. Collinearity: A review of methods to deal with it and a simulation study evaluating their performance. Ecography 2013, 36, 27–46. [Google Scholar] [CrossRef]
  42. Giliba, R.A. Effects of Climate Change on Potential Geographical Distribuition of Prunus africana (African cherry) in the Eastern Arc Mountain Forests of Tanzania. Master’s Thesis, Lund University, Lund, Sweden, 2018. [Google Scholar]
  43. Zhang, Q.; Wen, J.; Chang, Z.; Xie, C.; Song, J. Evaluation and prediction of ecological suitability of medicinal plant American ginseng (Panax quinquefolius). Chin. Herb. Med. 2018, 10, 80–85. [Google Scholar] [CrossRef]
  44. Platts, P.J. Spatial Modelling, Phytogeography and Conservation the Eastern Arc Mountains of Tanzania and Kenya. Ph.D. Thesis, University of York, York, UK, 2012. [Google Scholar]
  45. Riley, S.J.; DeGloria, S.D.; Elliot, R. Terrain_Ruggedness_Index.pdf. Intermt. J. Sci. 1999, 5, 23–27. [Google Scholar]
  46. Fabricius, C.; Coetzee, K. Geographic information systems and artificial intelligence for predicting the presence or absence of mountain reedbuck. S. Afr. J. Wildl. Res. 1992, 22, 80–86. [Google Scholar]
  47. Telwala, Y.; Brook, B.W.; Manish, K.; Pandit, M.K. Climate-Induced Elevational Range Shifts and Increase in Plant Species Richness in a Himalayan Biodiversity Epicentre. PLoS ONE 2013, 8, e57103. [Google Scholar] [CrossRef] [PubMed] [Green Version]
  48. Baldeck, C.A.; Harms, K.E.; Yavitt, J.B.; John, R.; Turner, B.L.; Valencia, R.; Navarrete, H.; Davies, S.J.; Chuyong, G.B.; Kenfack, D.; et al. Soil resources and topography shape local tree community structure in tropical forests. Proc. R. Soc. B Biol. Sci. 2013, 280, 20122532. [Google Scholar] [CrossRef] [PubMed]
  49. Wunder, S. Revisiting the concept of payments for environmental services. Ecol. Econ. 2015, 117, 234–243. [Google Scholar] [CrossRef]
  50. Tuanmu, M.N.; Viña, A.; Yang, W.; Chen, X.; Shortridge, A.M.; Liu, J. Effects of payments for ecosystem services on wildlife habitat recovery. Conserv. Biol. 2016, 30, 827–835. [Google Scholar] [CrossRef]
  51. Chen, H.L.; Lewison, R.L.; An, L.; Tsai, Y.H.; Stow, D.; Shi, L.; Yang, S. Assessing the effects of payments for ecosystem services programs on forest structure and species biodiversity. Biodivers. Conserv. 2020, 29, 2123–2140. [Google Scholar] [CrossRef] [Green Version]
  52. Falcone, P.M.; Tani, A.; Tartiu, V.E.; Imbriani, C. Towards a sustainable forest-based bioeconomy in Italy: Findings from a SWOT analysis. For. Policy Econ. 2020, 110, 101910. [Google Scholar] [CrossRef]
  53. Gregg, J.S.; Jürgens, J.; Happel, M.K.; Strøm-Andersen, N.; Tanner, A.N.; Bolwig, S.; Klitkou, A. Valorization of bio-residuals in the food and forestry sectors in support of a circular bioeconomy: A review. J. Clean. Prod. 2020, 267, 122093. [Google Scholar] [CrossRef]
Figure 1. Location map of the study area Tanzania. Black points show species occurrence. Note that the data for P. africana is superimposed on top of elevation layer.
Atmosphere 11 00988 g001
Figure 2. Jackknife test results indicating variable with highest gain when used in isolation and variable that decreases the gain the most when it is omitted. The test results indicate annual mean temperature (bio1) has the most useful information by itself while terrain ruggedness index (tri) has the most information that is not present in the other variables. Jackknife of regularized training gain for P. africana.
Atmosphere 11 00988 g002
Figure 3. Relationships between selected environmental variables and probability of species suitability of P. africana (A) mean annual temperature (bio1) (B) annual precipitation (bio12), (C) elevation (eleva), (D) terrain ruggedness index (tri), (E) precipitation of warmest quarter (bio18), (F) soil types (soils). The y-axis represents the probability of presence (cloglog output). Red curves show the average response and blue margins are ± SD calculated by 30 replicate runs. For the interpretation of soil type legend, refer Table 1.
Atmosphere 11 00988 g003
Figure 4. Climate Community Climate System version four (CCSM4) climate model based predicted future suitability of P. africana species: (A) current potential distribution; (B,C) RCP 4.5, and 8.5 emission scenario for 2050; (E,D) RCP 4.5, and 8.5 scenario for 2070.
Atmosphere 11 00988 g004
Table 1. Summary of dominant tropical soil groups for Southern Africa (Batjes, 2004).
CodeMajor Soil GroupDescriptions
1AcrisolsStrongly weathered acid soils, with low base saturation
2AndosolsBlack soils of volcanic landscapes, rich in organic matters
3ArenosolsSandy soils with limited soil development, under scattered (mostly grassy) vegetation to very old plateaus of light forest
4CambisolsWeakly to moderately developed soil soils occurring from sea level to the highlands and under all kind of vegetation (savanna woodland and forests)
5ChernozemsBlack soil rich in organic matter, occurring in flat to undulating plains with forest and tall grass vegetation
6FerralsolsDeep, strongly weathered, physically stable but chemically depleted
7FluvisolsAssociated with important river plains, periodically flooded areas
8GleysolsTemporary or permanent wetness near soil surface, support swamp forests or permanent grass cover
9HistosolsPeat and muck soils with incompletely decomposed plant remains
10LeptosolsShallow soils over hard rock/gravel, at medium to high altitude landscapes, suitable for forestry and nature conservation
11LixisolsStrongly weathered and leached, finely textured materials support natural savanna or open woodland vegetation
12LuvisolsCommon in flat or gently sloping land with unconsolidated alluvial, colluvial, aeolian deposits in cooler environments and young surface
13NitisolsDeep, red, well-drained tropical soils with a clayey, well defined nut-shaped peds with shiny surface. Found in level to highland under tropical rain forest or savanna vegetation
14PhaeozemsDark soils, rich in organic matter. Occur on flat to undulating land in a warm to cool (tropical highland). Support natural vegetation with tall grass steppe and or/forest
15PlanosolsClayey alluvial and colluvial deposits and support light forest or grass vegetation
16RegosolsContain gravelly lateritic materials (murrum) with low suitability for plant growth
17SolonchanksOccur in seasonally or permanently water logged areas with grasses and/or halophytic herbs
18SolonetzAssociated with flat lands in a hot climate, dry summers, coastal deposit. Contain a high proportional of sodium ions
19VertisolsContain sediments with a high proportion of smectite clay, high swelling and shrinking of results in deep cracks during dry season. Climax vegetation is savanna, natural grass and/or woodland
20WaterAreas covered by water bodies
Table 2. Environmental variables used to model distribution of P. africana.
VariableCodeMeanStandard ErrorMinimumMaximum
Annual mean temperature (°C)bio117.103.463.7024.00
Isothermality (dimensionless)bio36.640.486.108.40
Annual precipitation (mm)bio121237385032287
Precipitation of warmest quarter (mm)bio1836412140576
Precipitation of driest month (mm)bio1470.9057
Terrain ruggedness index (m)tri104.439.470.13418.75
Elevation (m)eleva1903566984249
Table 3. Environmental variables used in the study and their percentage contributions, and the maps that show the spatial distribution of the important variables are presented in Figure A1.
VariableCodePercent Contribution (%)
Annual mean temperature bio151.7
Terrain ruggedness indextri31.6
Elevationeleva5.7
Soil typesoils5.5
Annual precipitationbio123.4
Precipitation of warmest quarterbio180.9
Precipitation of driest monthbio140.8
Isothermalitybio30.5
Table 4. Change in suitable areas of P. africana country-wide for mid-century and late-century under representative concertation pathway (RCP) 4.5 and RCP 8.5 scenarios.
Suitability ClassSpecies Distribution Area (km2)
CurrentRCP 4.5Area ChangeRCP 8.5Area Change
2050Very low767,755.74826,010.158,254.37831,659.8063,904.06
Low102,181.3064,349.85−37,831.4659,628.51−42,552.80
Moderate32,044.0119,254.13−12,789.8819,514.24−12,529.77
High15,758.0511,585.16−4172.8811,224.09−4533.96
Very high14,586.7011,126.55−3460.1510,299.16−4287.54
2070Very low767,755.74829,251.2261,495.48847,873.0480,117.30
Low102,181.3061,217.40−40,963.9050,670.11−51,511.19
Moderate32,044.0119,591.25−12,452.7715,309.70−16,734.31
High15,758.0511,456.82−4301.239021.71−6736.34
Very high14,586.7010,809.11−3777.589451.23−5135.46
Table 5. Change in suitable areas of P. africana zone wide for mid-century and late-century under RCP 4.5 and RCP 8.5 scenarios.
Species Distribution Area (km2)
ScenarioSuitability ClassEastern ZoneSouthern ZoneNorthern ZoneCentral ZoneSouthern Highlands ZoneWestern ZoneLake Zone
RCP 4.5 (2050)Very low1089.211216.6912,694.852972.4311,410.5612,119.0216,740.23
Low−416.69−556.15−8740.17−2262.26−5417.79−6645.61−13,783.20
Moderate−219.89−412.41−2170.71−404.71−2750.82−4373.08−2457.34
High−176.26−175.40−885.57−145.46−1374.98-941.18−473.16
Very high−276.37−72.73−898.40−160.00−1866.97−159.15−26.52
RCP 4.5 (2070)Very low1156.801082.3614,000.532985.2610,945.1112,734.2118,578.96
Low−479.15−416.69−9586.38−2332.42−5392.98−7310.43−15,435.41
Moderate−229.31−403.85−2176.70−396.15−2286.22−4326.88−2632.75
High−169.41−183.10−860.75−114.65−1546.96−942.04−483.43
Very high−278.93−78.72−1376.69−142.03−1718.94−154.87−27.38
RCP 8.5 (2050)Very low1333.061315.0913,487.163082.8012,644.3713,412.7218,614.89
Low−582.68−624.60−8825.73−2387.18−6618.23−7879.42−15,622.79
Moderate−250.70−390.16−2244.29−399.58−2331.57−4409.02−2503.55
High−175.40−213.91−765.78−133.48−1827.61−954.02−462.89
Very high−324.28−86.42−1651.35−162.57−1866.97−170.27−25.67
RCP 8.5 (2070)Very low1911.461935.4217,698.524095.8616,881.4116,414.2421,166.36
Low−748.67−975.41−11,529.49−3080.24−7644.12−9855.04−17,666.87
Moderate−421.82−577.54−3021.20−521.07−3902.49−5315.97−2973.28
High−274.65−280.64−1523.86−278.93−2831.25−1048.14−497.12
Very high−466.31−101.82−1623.97−215.62−2503.55−195.08−29.09

