Article

Linking Hydraulic Modeling with a Machine Learning Approach for Extreme Flood Prediction and Response

1
Korea Institute of Civil Engineering and Building Technology, 283 Goyangdae-ro, Ilsanseo-gu, Goyang 10223, Korea
2
Department of Civil Engineering, Kyungpook National University, 80 Daehak-ro, Buk-gu Daegu 41566, Korea
*
Author to whom correspondence should be addressed.
Atmosphere 2020, 11(9), 987; https://doi.org/10.3390/atmos11090987
Submission received: 14 July 2020 / Revised: 6 September 2020 / Accepted: 7 September 2020 / Published: 15 September 2020
(This article belongs to the Special Issue Meteorological Extremes in Korea: Prediction, Assessment, and Impact)

Abstract

:
An emergency action plan (EAP) for reservoirs and urban areas downstream of dams can alleviate damage caused by extreme flooding. An EAP is a disaster action plan that can designate evacuation paths for vulnerable districts. Generally, calculation of dam-break discharge in accordance with dam inflow conditions, calculation of maximum water surface elevation as per hydraulic channel routing, and flood map generation using topographical data are prepared for the purposes of creating an EAP. However, rainfall and flood patterns exhibited in the context of climate change can be extremely diverse. In order to prepare an efficient flood response, techniques should be considered that are capable of generating flood maps promptly while taking dam inflow conditions into account. Therefore, this study aims to propose methodology that is capable of generating flood maps rapidly for any dam inflow conditions. The proposed methodology was performed by linking a dynamic numerical analysis model (DAMBRK) with a random forest regression technique. The previous standard method of drawing flood maps often requires a significant amount of time depending on accuracy and personnel availability; however, the technique proposed here is capable of generating a flood map within one minute. Through use of this methodology, the time taken to prepare flood maps in large-scale water-disaster situations can be reduced. Moreover, methodology for estimating flood risk via use of flood mapping has been proposed. This study would provide assistance in establishing disaster countermeasures that take various flood scenarios into account by promptly providing flood inundation information to disaster-related agencies.

1. Introduction

Dam failure-related flooding with large-scale flood inflow, infiltration, dam piping, and insufficient flood control capacity can cause unpredictable damage to people and property. Property damage and human casualties due to flooding occur worldwide. It is important to be able to provide accurate flood maps to reduce potential flood damage [1]. On 12 February 2017, 200,000 people were evacuated from the village under Oroville dam in California due to unforeseen flooding. On 9 May 2018, the collapse of the Patel dam in Kenya caused the loss of at least 48 lives and 2000 flood victims [2]. On 25 January 2019, the collapse of the Brumadinho tailings dam in Brazil caused 270 casualties and massive pollution due to mine waste. Experts say that the collapse of the Edenville and Sanford dams in Michigan on 21 May 2020 caused 3500 homes to be destroyed and 10,000 people to be evacuated—something which might happen once every 500 years. Therefore, it is very important to be able to prepare an expected flood map to provide basic data for an EAP (Emergency Action Plan) by analyzing the downstream consequences in case of an emergency situation at a dam. The Federal Emergency Management Agency (FEMA) actually provides 100 years of flood maps from all across the United States to be used as the basis for establishing flood insurance costs. Japan, meanwhile, operates a system for utilizing flood analysis and grid unit information, and provides disaster-related maps including flood control zones. In the case of Europe, the EU Flood Defense Directive has been established to produce flood risk maps which can be divided into pre-flood risk assessment, flood risk guidance, and flood risk management plans.
A one- or two-dimensional flood numerical model may be applied to prepare flood flooding diagrams in advance. Kim et al. [1] linked the results of DAMBRK, which performs one-dimensional dynamic analysis, to the GIS program for flood map generation. Dang et al. [3] simulated the natural dam break, and this research showed that important parameter for verifying the simulated and observed discharge is the time of collapse. Lodhi et al. [4] conducted dam collapse analysis for various scenarios using DAMBRK and was able to indicate flooding patterns downstream of dams with probable maximum flood (PMF) conditions. The study indicated that the absence of a dam in a high rainfall intensity situation could lead to more serious flood damage downstream. These studies indicate that the limitations of one-dimensional flood analysis could be addressed by generation of flood maps using the GIS program. Mao et al. [5] emphasized that the risk of flooding increases with economic growth. They carried out dam collapse analysis using the MIKE-21 program. Flood analysis was conducted using hydrological and geographical data, and the flood maps automatically drawn by the GIS program. Alvarez et al. [6] conducted virtual dam collapse analysis with the Iber program, which enables two-dimensional flood wave analysis based on dam collapse analysis and finite volume methodology. This research also identified that topographic conditions affect the results of the model to a greater extent than other factors and suggested a method for performing dam collapse analysis in basins with insufficient data.
Predicted flood maps can be prepared using various models, and the resulting data can be used for diverse purposes. In Korea, flood maps are also produced through one-dimensional dynamic models to determine flood risk levels for urban areas that are downstream of dams. Dam collapse-related flood maps are prepared using probable maximum flood (PMF) conditions. Seoul, Korea has a high population density, so flood maps should be prepared and distributed not only for the above conditions but also for the event of dam inflow exceeding a return period of 200 years. However, creating flood maps by linking the GIS program with a dynamic model can require a lot of time for preparing input data, generating topographic data, and calculating a numerical map with the GIS program. Moreover, flood maps generated by the GIS program may indicate non-continuous flooding patterns for some low-lying areas, requiring post-processing of data. Such intensive work is time-consuming and makes it difficult to create a flood map that reflects various dam inflow scenarios.
The random forest model, which could be used for regression or classification, has been increasingly applied to flood analysis and water resource engineering. The random forest model is an ensemble model, which is advantageous for handling large amounts of data. Feng et al. [7] conducted the urban flood mapping by using unmanned aerial vehicle remote sensing and random forest classifier model. The random forest model in this research applied to extract the flooded areas by recognizing the monitoring results of UAV. Sachdeva et al. [8] performed the flood susceptibility mapping by using random forest model, and compared it GIS-based support vector machine. This research showed that the random forest model could be used for flood susceptibility assessment with other conventional machine learning methods. Munoz et al. [9] used the random forest algorithm for flash-flood forecasting. The methodology in this research was applied to develop short-term prediction model for various time duration. This performance of presented model was improved by including precipitation data.
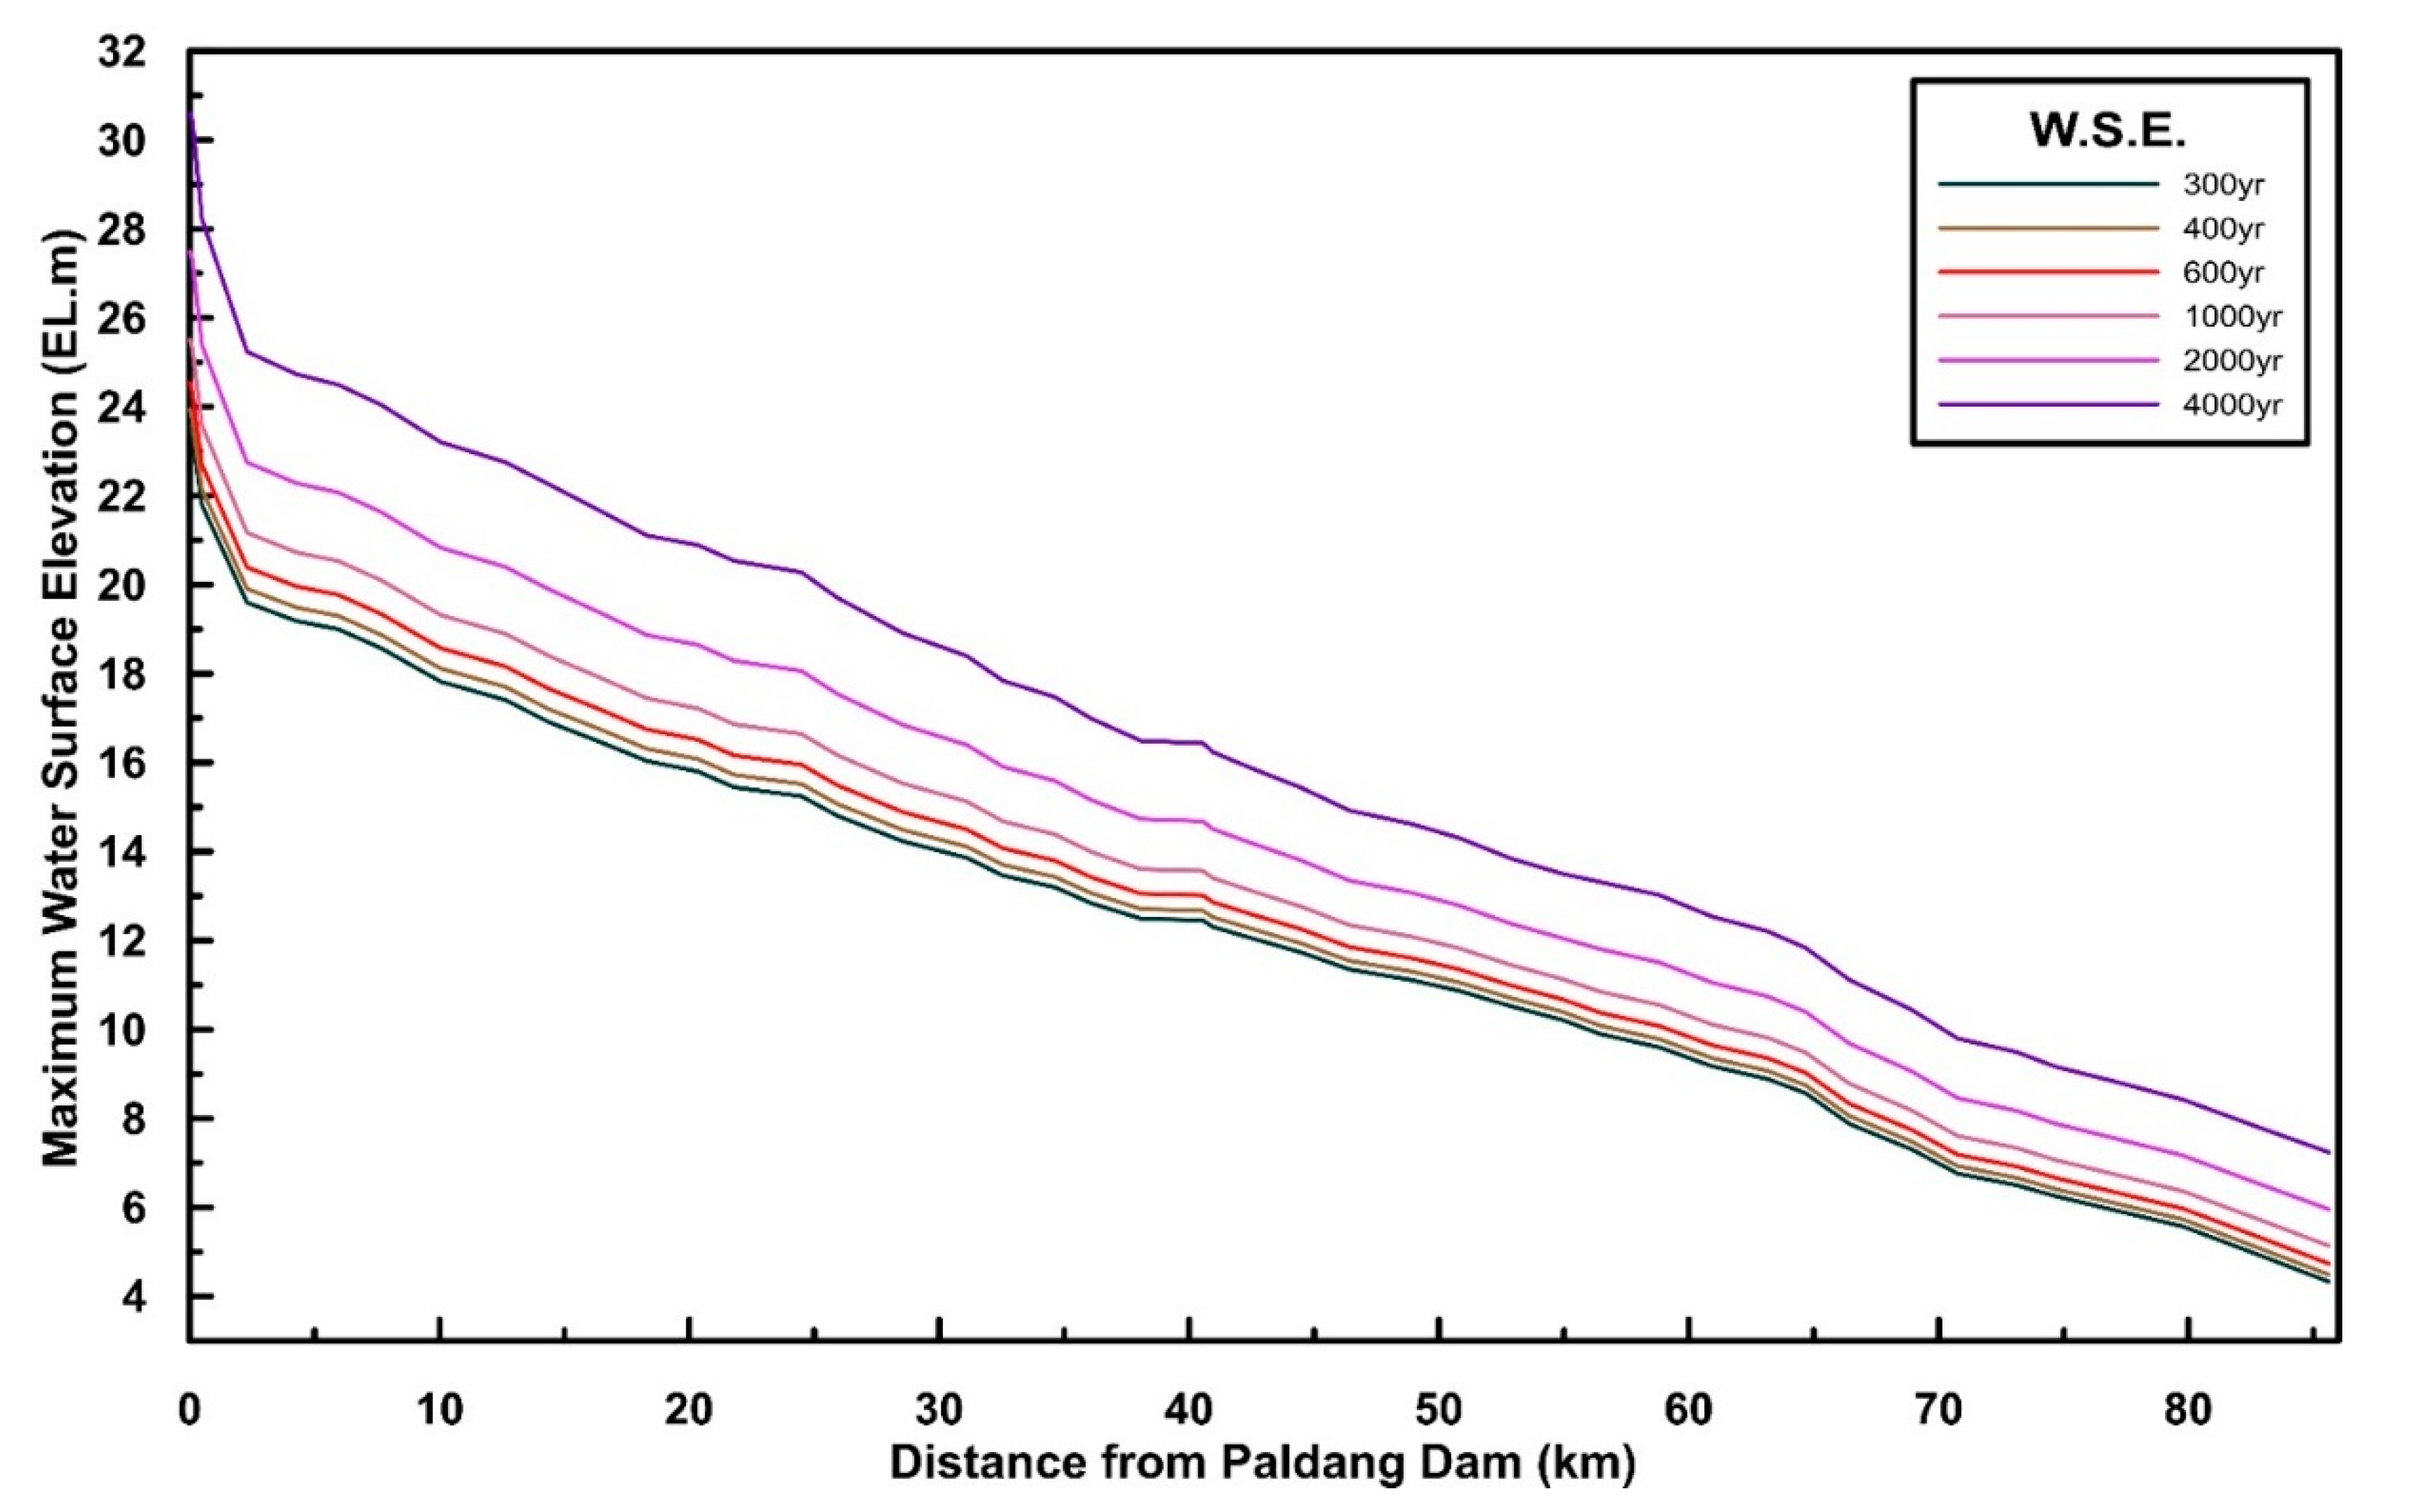
Accordingly, this study presented a technique to generate predicted flood maps rapidly when dam peak inflow (or dam inflow return period) is given along with the random forest regression technique. Flood maps for extreme condition were analyzed, and in this study, it means extensive inundation in metropolitan watersheds with the excessive discharge or collapse of dam. Since PMF (probable maximum flood) conditions were also considered, the extreme flood patterns due to climate change were analyzed with machine learning and numerical program. For random forest regression, the maximum water surface elevation for cross-sections was entered. For the rapid estimation of maximum water surface elevation for each cross-section, the log function and the spline curves were applied. The independent variable of the log function was the dam inflow return period and the dependent variable was the amount of dam inflow in cubic meter per seconds. The spline curves were generated with using maximum water surface elevation information calculated by the DAMBRK model. When any dam inflow return period was entered, the log function was used to estimate the peak inflow of the dam, and the maximum water surface elevation for each cross-section was estimated in a short time with a spline curve. Based on the maximum water surface elevation calculated by the DAMBRK model and the flood map data generated by the GIS program, the basic data for random forest regression was established. The proposed methodology aids production of large-scale flood map data, and flood risk was calculated to indicate the utilization of flood map data using the population of Seoul City and information regarding hospital and fire station accessibility. This study will enable sufficient flood data to be established in advance, as various extreme climate change-associated flood events may occur in future. The flowchart for this study is shown in Figure 1 and Figure 2. The random forest data for the study section shown in Figure 1 was used for flood map prediction, and the random forest data in Figure 2 was applied to select weights for each flood risk factor.

2. Research Methods

2.1. DAMBRK

The DAMBRK model is used to analyze hydrological runoff from reservoir collapse and for hydraulic routing of the flood flow downstream. A U.S. National Weather Service (NWS) dynamic flood analysis model, DAMBRK was developed by Fread [10] in 1980s. This model was developed to allow mathematical interpretation of flood routing downstream and induction of dam discharge curves. The governing equation used in this model is a one-dimensional Saint-Venant equation designed to accommodate internal boundary conditions such as the effects of rapid varied flows, cross section changes, bridges, etc. at the downstream section. Objective values are obtained from the nonlinear weighted four-point implicit scheme equation. The downstream flow can be calculated for both subcritical and supercritical flow. Flood hydrological curves are calculated from variables such as time, size, and shape of the point of collapse. The dynamic flood routing of the DAMBRK model results in interpretation of the Saint-Venant equation, consisting of a continuous equation and a momentum equation, as the Preissmann finite differential method [10].
Q x +   ( A + A 0 ) t q = 0
Q t +   ( Q 2 / A ) x + q A   ( h x + S f + S e ) + L = 0
In Equations (1) and (2), x is the flow direction distance of the stream, t is the time, Q is the flow rate, h is the water level elevation, A is the flow area, A 0 is the storage area, S f is the friction slope, S e is the loss slope due to the cross-sectional change, q is lateral discharge quantity, and L is the change in the amount of movement due to the rate of lateral discharge quantity. In this study, dam discharge or collapse flow rates were calculated for the various dam inflows, and the highest flood level by cross-section was calculated by performing channel routing.

2.2. Random Forest

The random forest model is a technique that uses ensemble learning to generate a number of decision trees to perform classification and regression for specific event occurrences. Although it is possible to predict desired hydrologic data using ensemble learning between different kinds of artificial neural networks, as attempted by Zhou et al. [11], the random forest applied in this study is a model that uses a number of decision trees and aggregates each result. The random forest model is simple but offers high predictive power for conducting interpretations of natural phenomena [12]. Important random forest parameters are max_features, bootstrap usage, and n_estimator. The max_features parameter determines the maximum number of attributes to be used in each node. Bootstrap is an option for allowing data overlap when sampling data for each classification model. The n_estimator is determined by the number of decision trees created in a random forest. The default value is set to 10 in this study. When the number of variables m is typically the random forest number, each split and randomly select m /3 variables to create a decision tree [13]. The algorithm of random forest can be summarized in four stages:
(1) Extract any bootstrap sample n .
(2) To determine the decision tree from the bootstrap sample, each node does not allow duplication and randomly selects the number of d characteristics. Divide the nodes using characteristics that create the optimal segmentation for an objective function, such as information gain.
(3) Repeat k times step (1), (2).
(4) Each decision tree’s predictions are collected, and class labels (objective values) are assigned by a majority vote.
A particular function is defined to optimize division of nodes by the most informative characteristics. A particular function that can be used in the random forest maximizes information gains in each partition. Information gain ( I G ) can be defined as Equation (3).
I G   ( D p ,   f ) = I   ( D p ) j = 1 m N j N p I   ( D j )
where f is the property to be used for segmentation, D p and D j are the data set of the parent and the j th child node, I is an impurity indicator, and N p is the total number of samples on the parent node and N j represents the number of samples on the j th child node. The information gain is simply the difference between the impurity of the parent node and the impurity of the child node. The lower the impurity of the child node, the greater the information gain is. In this study, the parameters of random forest model, which in the scikit-learn package for python, were adjusted in automatically based on the calculation of impurity in each node.

3. Verification of the Study Area

For the purpose of flood map analysis, the Paldang dam and the Han river basin were selected as the study area. The study area for this research, including the Seoul Metropolitan, is shown in Figure 3, and the area of the study boundary is 3140 km 2 . The city of Seoul, which has an area of 605 km 2 , is comprised of 25 administrative districts. This area has been damaged by sudden discharge from the Paldang dam during flood season and rising water surface elevation in the mainstream of the Han River.
In order to perform accurate hydraulic channel routing according to the operating conditions of the Paldang dam, it was necessary to accurately input the dam specifications into the DAMBRK program. The basin area is 23,517 km 2 and the reservoir area of the Paldang dam is 36.5 km 2 . Flood water, high water, and minimum water levels are 27.0, 25.5 and 25.0 EL. m , respectively. In terms of the main specifications of Paldang Dam, the dam type is C.G.D. and its height is 29.0 m . The dam elevation is 32.0 EL. m , the length is 575.0 m , and the volume is 250,000 m 3 [14]. The DAMBRK cross-section was constructed using HEC-RAS terrain information data and 1:5000 numerical map data to enable appropriate analysis of dam collapse and flood routing. A total of 44 cross-sections directly downstream of the Paldang dam were used. The roughness coefficient was entered into the DAMBRK by referring to the HEC-RAS input data and the Han River basic plan [15].
In order to check the appropriateness of the input data and the DAMBRK cross-section, the model was verified using the actual observed inflow and observed water surface elevation. Validation was conducted on Paldang bridge and Hangang bridge, and water level data observed from 15 July to 16 July 2006 and 27 July to 28 July 2011 was used. In 2006 and 2011, flood damage was caused by rising flood water levels in the Han river. For model calibration, the river distortion factor and roughness coefficient were adjusted with trial and error method. A comparison of the water surface elevation calculated by the DAMBRK and the observed water surface elevation is shown in Figure 4. In 2006, the mean square error (MSE) for Paldang Bridge and Hangang bridge was 0.15 m and 0.11 m . In 2011, the MSE for Paldang bridge and Hangang bridge was 0.15 m and 0.09 m . The DAMBRK model adequately reproduced the observed water surface elevation, and the cross-section and input data used in DAMBRK was considered appropriate.

4. Simulated Results

4.1. Calculation of the Max. Water Surface Elevation

In this study, one-dimensional rainfall-runoff analysis of HEC-1 was performed for the inflow of Paldang dam, and inflows of 2, 10, 30, 50, 80, 100, 200, and 500-year return periods were considered. In order to determine the additional maximum possible extent of flooding, the inflow was used in consideration of the probable maximum flood (PMF). The peak inflows of the 2 to 500-year return periods and PMF conditions were 10,372, 22,361, 30,479, 34,380, 380,633, 39,837, 45,455, 53,043 and 72,771 m 3 / s , respectively. The dam inflow is shown in Figure 5a, and the lateral inflow of the tributary rivers in the DAMBRK simulation applied the 100-year return period inflow. The peak inflows from the eight tributaries are shown in Table 1. For the discharge conditions through the dam spillway, the maximum discharge conditions were considered, including the reservoir water level-discharge relationship (Table 2). The maximum water surface elevation by distance as calculated by DAMBRK is as shown in Figure 5b.

4.2. Flood Map Generation

In this study, the one-dimensional flood analysis maximum water surface elevation results were linked with ArcGIS in order to generate flood maps. A 1:5000 continuous numerical map was used to construct topographic data for the study area and a square 50 m grid DEM (Digital Elevation Model) was created [16]. The results of topographic DEM construction using the ArcGIS tool are shown in Figure 6a. The maximum water surface elevation DEM, as shown in Figure 6b, could be created by entering DAMBRK simulation results into the cross-sectional geospatial data (shapefile) and converting it to TIN and DEM data. Flood maps, which include the inundation depth of each grid, could be produced by subtracting the terrain DEM from the maximum water surface elevation DEM. The result was shown by flood depth DEM, as depicted in Figure 6c. Completed floodplains for the dam inflows with a 500-year return period and PMF condition are shown in Figure 7. There was a total of four directly calculated flood maps, taking into account 200- and 500-year return period frequencies, PMF, and PMF in dam-break situations. Each flood map consisted of 427,897 flood depth grids (50 m square grids).
In Figure 7, more flooding appeared in the lower section of the Han river. This is a relatively low-lying area compared to the upstream area, is located near the main tributary, and appears to feature a relatively large number of rice fields. Information for the flood map calculation was entered into the random forest regression and it was trained to predict flooding patterns rapidly according to any return period of dam inflow.

5. Application of Random Forests

5.1. Flood Map Prediction

The relationship between the dam inflow return period, the peak dam inflow, and the maximum water surface elevation of the cross-section was defined through the log function and the second and third spline curves. These curves were used to quickly estimate the input data for a random forest given the dam inflow conditions. All of flood condition that containing the flood of 2, 10, 30, 50, 80, 100, 200, and 500-year return periods and PMF was applied to create a more realistic relationship curve. The peak inflow of the dam according to the 2 to 500-year return periods and PMF conditions was defined by the log function and can be expressed as shown in Figure 8. The relationship between dam peak inflow and the maximum water surface elevation of the first cross-section was defined as the third spline curve (Figure 9a), and the maximum water surface elevation between the first and the rest of the cross-sections was defined in the second spline curves (Figure 9b). The maximum water surface elevation for 44 cross-sections was calculated using the logarithmic function and the spline curve in a short time. This process served as an important medium between the hydrologic data in order to predict the flood map according to the peak inflow of the dam. The 44 maximum water surface elevations were summed to be changed as total maximum water surface elevation, and this data entered as input data of random forest model.
The sum of maximum water surface elevations, frequency of flooding, topographic elevation, maximum and average grid flood depth, and the (X, Y) coordinates were applied as input data for random forest model training. The random forest target data was flood depth in grid units. The maximum flood depth shown in each grid is the same as the inundation depth under the conditions of PMF (dam-break), and the average flood depth was calculated with four inflow conditions (200, 500-year return periods, PMF condition, and dam-break PMF condition). The number of flooding occurrences represented the inundation occurring under the four inflow conditions, and the total water surface elevation represented the sum of maximum water surface elevations for the 44 cross-sections calculated by DAMBRK. The data was constructed by grid, so the total number of data items was 427,879.
To confirm the practicality of the proposed methodology, the water surface elevation and flood maps for 300, 400, 600, 1000, 2000- and 4000-year return period were predicted. The return period of 2000 and 4000 could be seen as too long to be shown in real environment, but this study tried to indicate the possibility of real-time flood map prediction with diverse return period condition. The peak inflow of Paldang dam for the return periods presented earlier was estimated at 48,502, 50,715, 53,835, 57,765, 63,097, 68,430 m 3 / s and was entered into the second and third spline curves to predict the maximum water surface elevation (Figure 10). The maximum flood depth of the predicted flood maps for the 300, 400, 600, 1000, 2000- and 4000-year return periods was 13.13, 13.60, 14.31, 15.40, 17.66 and 21.65 m , respectively. Flood maps for the 400, 600, 1000, and 2000-year return periods are shown in Figure 11.

5.2. Flood Hazard Calculation

In this study, a simple and intuitive method was suggested to calculate the relative flood risk in district units in consideration of human casualties. Grid unit (square type 500 m ) population, hospital accessibility, and fire station accessibility data was used, as shown in Figure 12a–c. The unit of accessibility data for fire stations and hospitals was km , the accessibility is the distance to the fire stations and hospitals that closest to the center point of the grid. When a flooding depth of more than 25 cm , which is a normal road curb height, occurred in a two-dimensional grid, it was considered to constitute flooding [17]. Population and hospital/fire station accessibility in the grid in which flooding occurred were considered in the flood risk calculation. Both flood maps calculated using DAMBRK-ArcGIS and predicted via random forest were applied. Flood analysis considering emergency rescue facilities, including hospitals and fire stations, was performed by Coles et al. [18] and Bruijn et al. [19]. In particular, Coles et al. [18] used flood guidance results for numerical analysis and determined that decrease in accessibility to hospitals and emergency rescue facilities due to flooding would increase the flood-prone population value.
The sum of each flood risk factor was calculated for districts of Seoul as shown in Figure 12d. In order to select weights for the three risk factors, the human casualty record during 2010~2017 and the random forest importance estimation technique were applied. Over eight years, 26 people were injured or killed due to flooding. The feature importance was calculated by entering the data of casualties, the number of people in the area where the damage occurred, and hospital and fire station accessibility data into the random forest model. In other words, the weight was calculated using the relationship between the factors that could affect human casualties and the damage history. The random forest weight (feature importance) selection results were calculated as 0.41 for population, 0.36 for access to hospitals, and 0.23 for access to fire stations.
Flood risk in district units was calculated for the 200, 300, 400, 500, 600, 1000, 2000 and 4000-year return period and PMF (dam-break). Because the design of levee in Seoul city was conducted based on flood of 200-year return period, flood risk analysis was performed based on the flood of 200~4000-year return periods and PMF (dam-break) condition. The total number of people in the grid that shows flooding, and the total access distance for hospitals and fire stations were calculated by district, and each factor was normalized. By multiplying the weight calculated via random forest, the relative flood risk was calculated by adding them all together, and the results are shown as Table 3 and Figure 13. In the Gangseo district, a high flood risk was calculated. The risk of flooding was not calculated in the Gangbuk district because no flooding of any depth was observed due to Gangbuk district being higher than other area and far from the Han River. The proposed technique is believed to be useful for comparing the relative flood risk for adjacent areas, such as the Gangnam and Seocho districts, and can calculate relative flood risk rapidly and generate various flood maps.

6. Discussion

Existing method could consume a lot of time for showing flood map with consideration of dam operation or collapse [1,2,3,4]. The technique proposed in this paper has the advantage of displaying a flood map faster than the previous method that using GIS program [5]. However, there is a disadvantage that it is necessary to build a database for various flood scenarios for this purpose. This shortcoming can be solved through data processing automation that can quickly build a flood database.
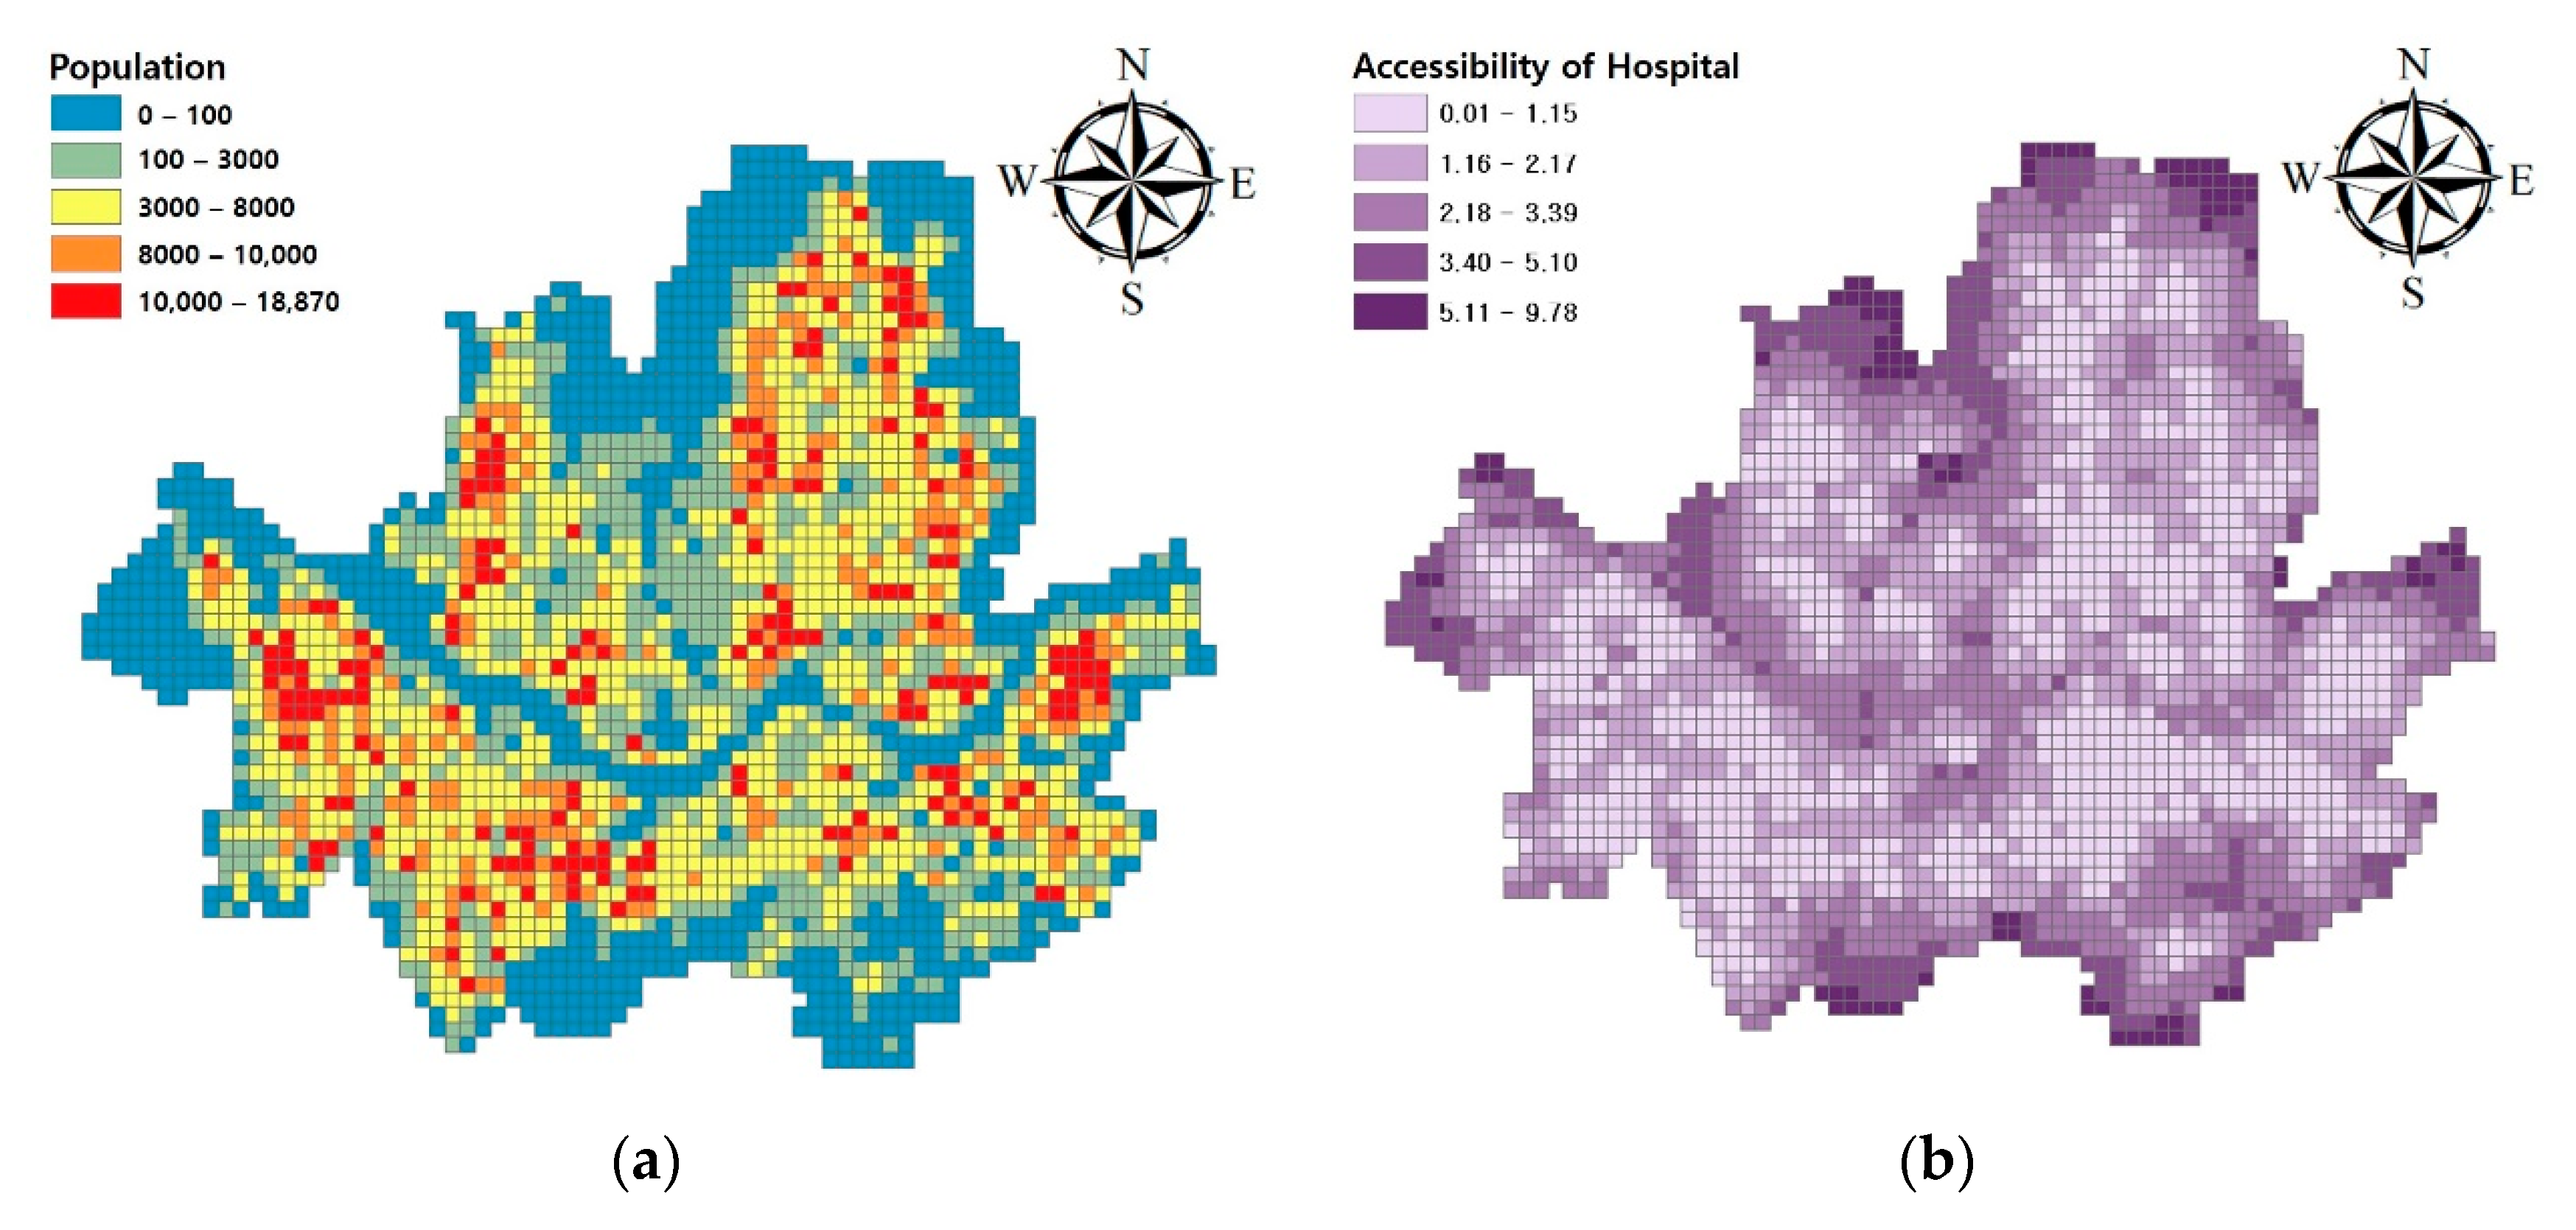
In addition, unlike previous studies, this study not only displays a flood map, but also presents a flood risk level by using flood maps that rapidly generated, population, and accessibility to hospitals and fire stations data. Previous studies appear to have performed the flood risk analysis by using various economic and topographic factors [18,19]. However, in this study, the flood risk that could indicate the prioritization of flood response was analyzed by simply overlapping flood map, population and accessibility data. The result of flood risk analysis in district units will be used in extreme flood situation in Seoul city.
In order to apply this technique to other watersheds, accurate stream cross-section data are required to perform the DAMBRK simulation. The enough topographic data is also needed for drawing flood map with GIS program. Since it is necessary to accurately represent the pattern of flooding in urban areas, detailed building size and height information is also required. For flood risk analysis, the population data, other data that can affect flood response are also required. Depending on the new watershed, the applied flood information and topographic data may appear differently, and meaningful prediction results should be calculated by appropriately using the data according to the characteristics of each research area.

7. Conclusions

In this study, flood analysis was conducted using a one-dimensional flood analysis simulation and random forest modeling. To generate reliable flood data, the flood analysis model DAMBRK was validated by comparison with observed water surface elevation. The maximum water surface elevation in the Han River, flood map by dam inflow, and flood risk per district were predicted and analyzed according to the Paldang Dam inflow return period. The main findings of this study can be summarized as follows:
(1) Using the DAMBRK model, the maximum water surface elevation of each cross-section was calculated for the four inflow conditions. Under the 200, 500-year return periods and PMF conditions, flood maps were generated in conjunction with the results of DAMBRK and the ArcGIS program. Under PMF conditions, two flood maps were generated depending on whether the dam collapsed or not, indicating a wide extent of flooding and a high-water surface level under the conditions of the collapse of the Paldang Dam.
(2) Information for four flood maps was entered into the random forest model for training. The random forest regression model was trained to predict flooding patterns rapidly with consideration of any amount of dam inflow or return period. According to the conditions of peak inflow for Paldang dam, the water surface elevation was analyzed via the second and third spline curves. While it may require at least three to six hours to generate a flood map based on DAMBRK and ArcGIS analysis, prediction of a flood map through the given random forest regression model was carried out within one minute. This ability to identify flood conditions in a short period of time will help secure evacuation time and reduce damage to people and assets.
(3) Rapid estimation of maximum water surface elevation for 44 cross-sections was performed using cubic and quadratic spline curves. This process serves as an important medium for connecting input and prediction results in order to predict flood maps according to the amount of dam inflow. There are, however, some limitations to these estimated results of mapped maximum flooding in proportion to peak dam inflow due to the suggested methodology considering only the maximum discharge according to the reservoir level. Nevertheless, it is deemed appropriate for expressing the extent of extreme flooding instances.
(4) In order to indicate flood map utilization, data for human casualties, population, and accessibility to hospitals and fire stations was investigated. A method was proposed to prioritize disaster response in the event of a massive flooding based on human casualties. The analysis was performed using the calculated flood maps and predicted results. Considering casualties, the flood response priority was shown to take the order of Gangseo, Songpa, and Yeongdeungpo district. The proposed methodology is a simple one that works in conjunction with the random forest importance calculation technique but is judged to be a practical intuitive method. Suggested method has advantage of quickly determining the risk of flooding in emergency situations. If this methodology is linked to various flood maps, it is believed that flexible flood response can be achieved.

Author Contributions

Conceptualization, K.Y.H.; Methodology, H.I.K.; Supervision, K.Y.H.; Writing original draft, H.I.K.; Writing—review & editing, H.I.K. All authors have read and agreed to the published version of the manuscript.

Funding

This work was supported by Korea Environment Industry & Technology Institute (KEITI) though the Water Management Research Program, funded by Korea Ministry of Environment (MOE) (79609).

Acknowledgments

This research was funded by Korea Environment Industry & Technology Institute (KEITI) grant number 79609.

Conflicts of Interest

The authors declare no conflict of interest.

References

  1. Kim, B.H.; Choi, S.Y.; Han, K.Y. A 1D Hydrodynamic Model Analysis Method Based on GIS for Flood Inundation Mapping. J. Korean Soc. Hazard Mitig. 2011, 11, 227–235. [Google Scholar] [CrossRef] [Green Version]
  2. Korea National Committee on Large Dams (KNCOLD), Kenya Patel Dam Collapse, Daejeon, Korea, KNCOLD International Cooperation Committee, 2018, 05. Available online: http://kncold.or.kr/ (accessed on 6 January 2020).
  3. Dang, C.; Chu, N.N.; Ding, Y. Natural Dam Break Forecasting by Use of DamBrk Model. Adv. Mater. Res. 2012, 594, 2262–2266. [Google Scholar] [CrossRef]
  4. Lodhi, M.S.; Agrawal, D.K. Dam-break Flood Simulation under Various Likely Scenarios and Mapping Using GIS: Case of a Proposed Dam on River Yamuna, India. J. Mt. Sci. 2012, 9, 214–220. [Google Scholar] [CrossRef]
  5. Mao, J.; Wang, S.D.; Ni, J.H.; Xi, C.B.; Wang, J.C. Management System for Dam-Break Hazard Mapping in a Complex Basin Environment. Int. J. Geo-Inf. 2017, 6, 162. [Google Scholar] [CrossRef] [Green Version]
  6. Alvarez, M.; Puertas, J.; Pena, E.; Bermudez, M. Two-Dimensional Dam-Break Flood Analysis in Data-Scare Regions: The Case Study of Chipembe Dam, Mozambique. Water 2017, 9, 432. [Google Scholar] [CrossRef] [Green Version]
  7. Feng, Q.; Liu, J.; Gong, J. Urban Flood Mapping Based on Unmanned Aerial Vehicle Remote Sensing and Random Forest Classifier—A Case of Yuyao, China. Water 2015, 7, 1437–1455. [Google Scholar] [CrossRef]
  8. Sachdeva, S.; Bhatia, T.; Verma, A.K. Flood susceptibility mapping using GIS-based support vector machine and particle swarm optimization: A case study in Uttarakhand (India). In Proceedings of the 2017 8th International Conference on Computing, Communication and Networking Technologies (ICCCNT), Delhi, India, 3–5 July 2017; pp. 1–7. [Google Scholar] [CrossRef]
  9. Munoz, P.; Alvear, J.O.; Willems, P.; Celleri, R. Flash-flood forecasting in an Andean mountain catchment-development of a step-wise methodology based on the random forest algorithm. Water 2018, 10, 1519. [Google Scholar] [CrossRef] [Green Version]
  10. Fread, D.L. The NWS DAMBRK Model: Theoretical Back-Ground/User Documentation; Hydrologic Research Laboratory, National Weather Service: Silver Spring, MD, USA, 1988. [Google Scholar]
  11. Tyralis, H.; Papacharalmpous, G.; Langousis, A. A brief review of random forests for water scientists and practitioners and their recent history in water resources. Water 2019, 11, 910. [Google Scholar] [CrossRef] [Green Version]
  12. Zhou, J.Z.; Peng, T.; Zhang, C.; Sun, N. Data pre-analysis and ensemble of various artificial neural networks for monthly streamflow forecasting. Water 2018, 10, 628. [Google Scholar] [CrossRef] [Green Version]
  13. Choi, C.H.; Park, K.H.; Park, H.K.; Lee, M.J.; Kim, J.S.; Kim, H.S. Development of Heavy Rain Damage Prediction Function for Public Facility Using Machine Learning. J. Korean Soc. Hazard Mitig. 2017, 17, 443–450. [Google Scholar] [CrossRef]
  14. Korea Hydro & Nuclear Power Co., Ltd. (KHNP). Report of Paldang Dam Emergency Action Plan; Korea Hydro & Nuclear Power Co., Ltd.: Gyeongju-si, Korea, 2016. [Google Scholar]
  15. Ministry of Land, Infrastructure, and Transport (MOLIT). Han River Basic Plan; Ministry of Land, Infrastructure, and Transport: Tokyo, Japan, 2020.
  16. National Territory Information Platform (NTIP). Geographical Database. 2020. Available online: https:/http://map.ngii.go.kr/ (accessed on 28 February 2020).
  17. Cho, J.W.; Bae, C.Y.; Kang, H.S. Development and Application of Urban Flood Alert Criteria Considering Damage Records and Runoff Characteristics. J. Korea Water Resour. Assoc. 2018, 51, 1–10. [Google Scholar]
  18. Coles, D.; Yu, D.; Wilby, R.L.; Green, D.; Herring, Z. Beyond ‘flood hotspots’: Modelling emergency service accessibility during flooding in York, UK. J. Hydrol. 2017, 546, 419–436. [Google Scholar] [CrossRef] [Green Version]
  19. Bruijn, K.M.; Maran, C.; Zygnerski, M.; Juraqdo, J.; Burzel, A.; Jeuken, C.; Obeysekera, J. Flood resilience of critical infrastructure: Approach and method applied to Fort Lauderdale, Florida. Water 2019, 11, 517. [Google Scholar] [CrossRef] [Green Version]
Figure 1. Flow chart for flood map prediction.
Atmosphere 11 00987 g001
Figure 2. Flow Chart for flood hazard analysis.
Atmosphere 11 00987 g002
Figure 3. Study boundary, tributaries, and Paldang Dam.
Atmosphere 11 00987 g003
Figure 4. Validation of DAMBRK with observed W.S.E. (a) W.S.E. in Paldang Bridge (2006); (b) W.S.E. in Hangang Bridge (2006); (c) W.S.E. in Paldang Bridge (2011); (d) W.S.E. in Hangang Bridge (2011).
Atmosphere 11 00987 g004
Figure 5. DAMBRK simulation results. (a) dam inflow scenario; (b) maximum water surface elevation.
Atmosphere 11 00987 g005
Figure 6. Digital elevation models for flood mapping. (a) Elevation DEM; (b) max W.S.E. DEM; (c) flood depth DEM.
Atmosphere 11 00987 g006
Figure 7. Flood map calculation using DAMBRK and the GIS program. (a) 500 y; (b) PMF (dam-break).
Atmosphere 11 00987 g007
Figure 8. Logarithmic fitting with frequency and peak dam inflow data.
Atmosphere 11 00987 g008
Figure 9. Spline curve for dam peak inflow and max water surface elevation. (a) Cubic spline curve; (b) quadratic spline curves.
Atmosphere 11 00987 g009aAtmosphere 11 00987 g009b
Figure 10. Estimated max water surface elevation.
Atmosphere 11 00987 g010
Figure 11. Flood Mmaps predicted by random forest regression. (a) 400 y; (b) 600 y; (c) 1000 y; (d) 2000 y.
Atmosphere 11 00987 g011
Figure 12. Factors in estimating flood risk. (a) Population; (b) hospital accessibility; (c) fire station accessibility; (d) flood map overlapping.
Atmosphere 11 00987 g012aAtmosphere 11 00987 g012b
Figure 13. Flood hazard score considering casualties (bar graph).
Atmosphere 11 00987 g013
Table 1. Peak Flow Rate of Main Tributaries.
TributaryWangsukTanJungnangHongje
Peak Flow Rate (m3/h)2285.862754.792802.68715.40
TributaryAnyangChangneungGongneungImjin
Peak Flow Rate (m3/h)3257.39943.692021.7418378.78
Table 2. Spillway Water Level-Discharge Data.
Reservoir Water Level (EL.m)Discharge
(m3/h)
Reservoir Water Level (EL m)Discharge
(m3/s)
9.00033.0041,994
14.00273135.2444,947
19.0010,39436.0047,900
24.0021,09141.0054,863
25.3823,37246.0056,596
25.8230,50847.7879,172
31.0939,19053.3599,514
32.9143,545--
Table 3. Flood Hazard Score Considering Casualties.
DistrictFlood Map for Dam Inflow Condition
200
y
300
y
400
y
500
y
600
y
1000
y
2000
y
4000
y
PMF
Gangnam0.200.240.230.220.220.300.290.430.44
Gangdong0.040.050.070.080.080.220.250.410.41
Gangbuk0.000.000.000.000.000.000.000.000.00
Gangseo0.930.940.940.930.930.910.920.980.98
Gwanak0.000.000.000.000.000.000.000.010.02
Gwangjin0.040.120.110.110.110.150.180.360.36
Guro0.250.250.240.250.250.270.280.350.35
Geumcheon0.050.050.050.050.050.060.060.090.09
Nowon0.000.000.000.000.020.020.030.140.14
Dobong0.000.000.000.000.000.030.030.020.02
Dongdaemun0.020.020.280.280.280.290.290.330.33
Dongjak0.010.010.020.020.020.060.070.080.08
Mapo0.230.230.220.230.230.260.330.470.48
Seodaemun0.020.020.020.020.020.020.030.030.04
Seocho0.010.040.030.030.030.280.280.340.34
Seongdong0.090.140.350.340.340.350.340.330.33
Seongbuk0.000.000.000.000.000.010.020.090.10
Songpa0.590.590.610.610.610.630.630.680.68
Yangcheongu0.450.440.430.420.420.420.430.430.43
Yeongdeungpo0.380.390.380.370.370.430.510.540.54
Yongsan0.040.040.040.040.040.200.250.230.23
Eunpyeong0.000.000.000.000.000.010.010.030.03
Jongno0.000.000.000.000.000.010.010.020.02
Junggu0.000.000.000.000.000.000.000.010.02
Jungnang0.030.110.130.130.130.140.160.220.22

