Article

Effects of Elevated Air Temperature and CO2 on Maize Production and Water Use Efficiency under Future Climate Change Scenarios in Shaanxi Province, China

1
College of Water Resources and Architectural Engineering, Northwest A&F University, Yangling 712100, China
2
Key Laboratory of Agricultural Soil and Water Engineering in Arid and Semiarid Areas, Ministry of Education, Northwest A&F University, Yangling 712100, China
3
National Research Center of Fluid Machinery Engineering and Technology, Jiangsu University, Zhenjiang 212000, China
4
Institute of Crop Science and Resource Conservation (INRES), University Bonn, 53115 Bonn, Germany
5
Department of Agronomy, MNS- University of Agriculture Multan, Multan 60650, Pakistan
6
Faculty of Agriculture and Environmental Sciences, University of Rostock, 18059 Rostock, Germany
7
Water Management and Agricultural Mechanization Research Center, Centre for Climate Change and Hydrological Modeling Studies, Department of Agricultural Engineering, Khwaja Fareed University of Engineering and Information Technology, Rahim Yar Khan 64200, Pakistan
8
Center of Excellence in Water Resources Engineering, University of Engineering and Technology Lahore, Lahore 54000, Pakistan
*
Authors to whom correspondence should be addressed.
Atmosphere 2020, 11(8), 843; https://doi.org/10.3390/atmos11080843
Submission received: 1 July 2020 / Revised: 3 August 2020 / Accepted: 3 August 2020 / Published: 9 August 2020

Abstract

:
The ongoing global warming and changing patterns of precipitation have significant implications for crop yields. Process-based models are the most commonly used method to assess the impacts of projected climate changes on crop yields. In this study, the crop-environment resource synthesis (CERES)-Maize 4.6.7 model was used to project the maize crop yield in the Shaanxi Province of China over future periods. In this context, the downscaled ensemble projections of 17 general circulation models (GCMs) under four representative concentration pathways (RCP 2.6, RCP 4.5, RCP 6.0, and RCP 8.5) were used as input for the calibrated CERES-Maize model. Results showed a negative correlation between temperature and maize yield in the study area. It is expected that each 1.0 °C rise in seasonal temperature will cause up to a 9% decrease in the yield. However, the influence of CO2 fertilization showed a positive response, as witnessed by the increase in the crop yield. With CO2 fertilization, the average increase in the maize crop yield compared to without CO2 fertilization per three decades was 10.5%, 11.6%, TA7.8%, and 6.5% under the RCP2.6, RCP4.5, RCP6.0, and RCP8.5 scenarios, respectively. An elevated CO2 concentration showed a pronounced positive impact on the rain-fed maize yield compared to the irrigated maize yield. The average water use efficiency (WUE) was better at elevated CO2 concentrations and improved by 7–21% relative to the without CO2 fertilization of the WUE. Therefore, future climate changes with elevated CO2 are expected to be favorable for maize yields in the Shaanxi Province of China, and farmers can expect further benefits in the future from growing maize.

1. Introduction

In recent years, global warming has gained considerable attention by experts throughout the world to see how the rapidly changing climate is affecting crop growths and what are the possible solutions to minimize its influence. Such future global warming also reflects the changes in predicted climate variables [1]. Crop yields directly correlate with climate variables, and they can bring positive or negative impacts on the agriculture yield. The increase in temperature may have a severe negative effect on crop yields, which may lead to decreased crop yields around the world [2,3,4]. The global average maize yield is expected to decrease by 3.7% per 1 °C increase in the temperature [3,5]. In recent studies, it was shown that a rise in temperature negatively affects the maize yield; however, an increase in the CO2 concentration positively influenced the maize yield [6,7]. The fertilization of CO2 increased the maize yield due to an increase in the photosynthesis process and improvement in the water use efficiency (WUE) [8].
Maize yield demands in the world could increase by 66% in 2050 compared to current maize yields [9]. Maize is an important food to fulfill the food requirements of humans around the world [10]. Among the maize yield countries, China is the second-largest producer of maize and exporter to the world [9], and Shaanxi Province is considered the main producing region of China [11]. Like other parts of the world, the maize yield in China will also be greatly affected by changes in the climatic conditions [12,13], which could make it difficult to fulfill future maize demands in China. Therefore, it is necessary to estimate the impact of changing climatic conditions on maize yields by using advanced tools such as cropping system models.
A crop model is the best tool to measure the impact of climate change on the crop yield by using historical and future climate data [14,15,16]. There are many available process-based models to measure the response of climate changes on crop yields [17,18,19,20]. Crops models have been used to find answers to future practical crop yield demands. For example, Dixt et al. [21] found that CO2 fertilization reduced the negative effect of temperature on the crop yield and increased the crop yield compared to without the fertilization of CO2. Different crop modeling studies have been conducted to analyze the impact of future climate changes on different crops by using the climate change scenario data [19,22,23,24]. Climate change scenario data in previous studies were used from the Fourth Assessment Report (AR4) of the IPCC [25]. To date, these have been replaced by the representative concentration pathway (RCP) scenarios [1]. Climate data from general circulation models (GCMs) used in Coupled Model Intercomparison Project Phase 5 (CMIP5) were explained by Collins et al. [26].
Currently, not enough studies have been evaluated based on the annual period, particularly the impact of changing climate conditions on Chinese maize yield areas, where the temperature trend is increasing [27] with an increase of 1.2 °C since 1960 [28]. In many studies, the Chinese maize yield regions have been studied in a large scale, but the maize yield from the Shaanxi region has not been specifically discussed. For example, Ray et al. [29] calculated the relationship between climate and yield variability between 1979 and 2008 and showed that maize yields vary by 32% in China due to climate variability at a large scale. A recent study of projected maize yields as influenced by climate change was executed in China [30]. This assessment was mainly focused on future temperature impacts on maize yields and predicted a decrease in yields by varying temperatures. However, such agricultural impact assessments have not considered the effect of elevated CO2 concentrations on maize yields under future climate changes. Furthermore, the water use efficiency and evapotranspiration will change under future climate scenarios with increasing atmospheric CO2 concentrations [31,32]. Thus, there is a need to assess the responses of evapotranspiration and water use efficiency under future climate changes in China.
This study emphasized exploring the effects of elevated CO2 under future climate changes on the maize yields, evapotranspiration, and water use efficiency. We used the CERES (crop-environment resource synthesis)-Maize crop model to simulate the growth and development of maize crops in future climate change scenarios, considering seventeen general circulation models (GCM) and four representative concentration pathways (RCPs)—2.6, 4.5, 6.0, and 8.5—with different CO2 concentrations [1].

2. Data and Methods

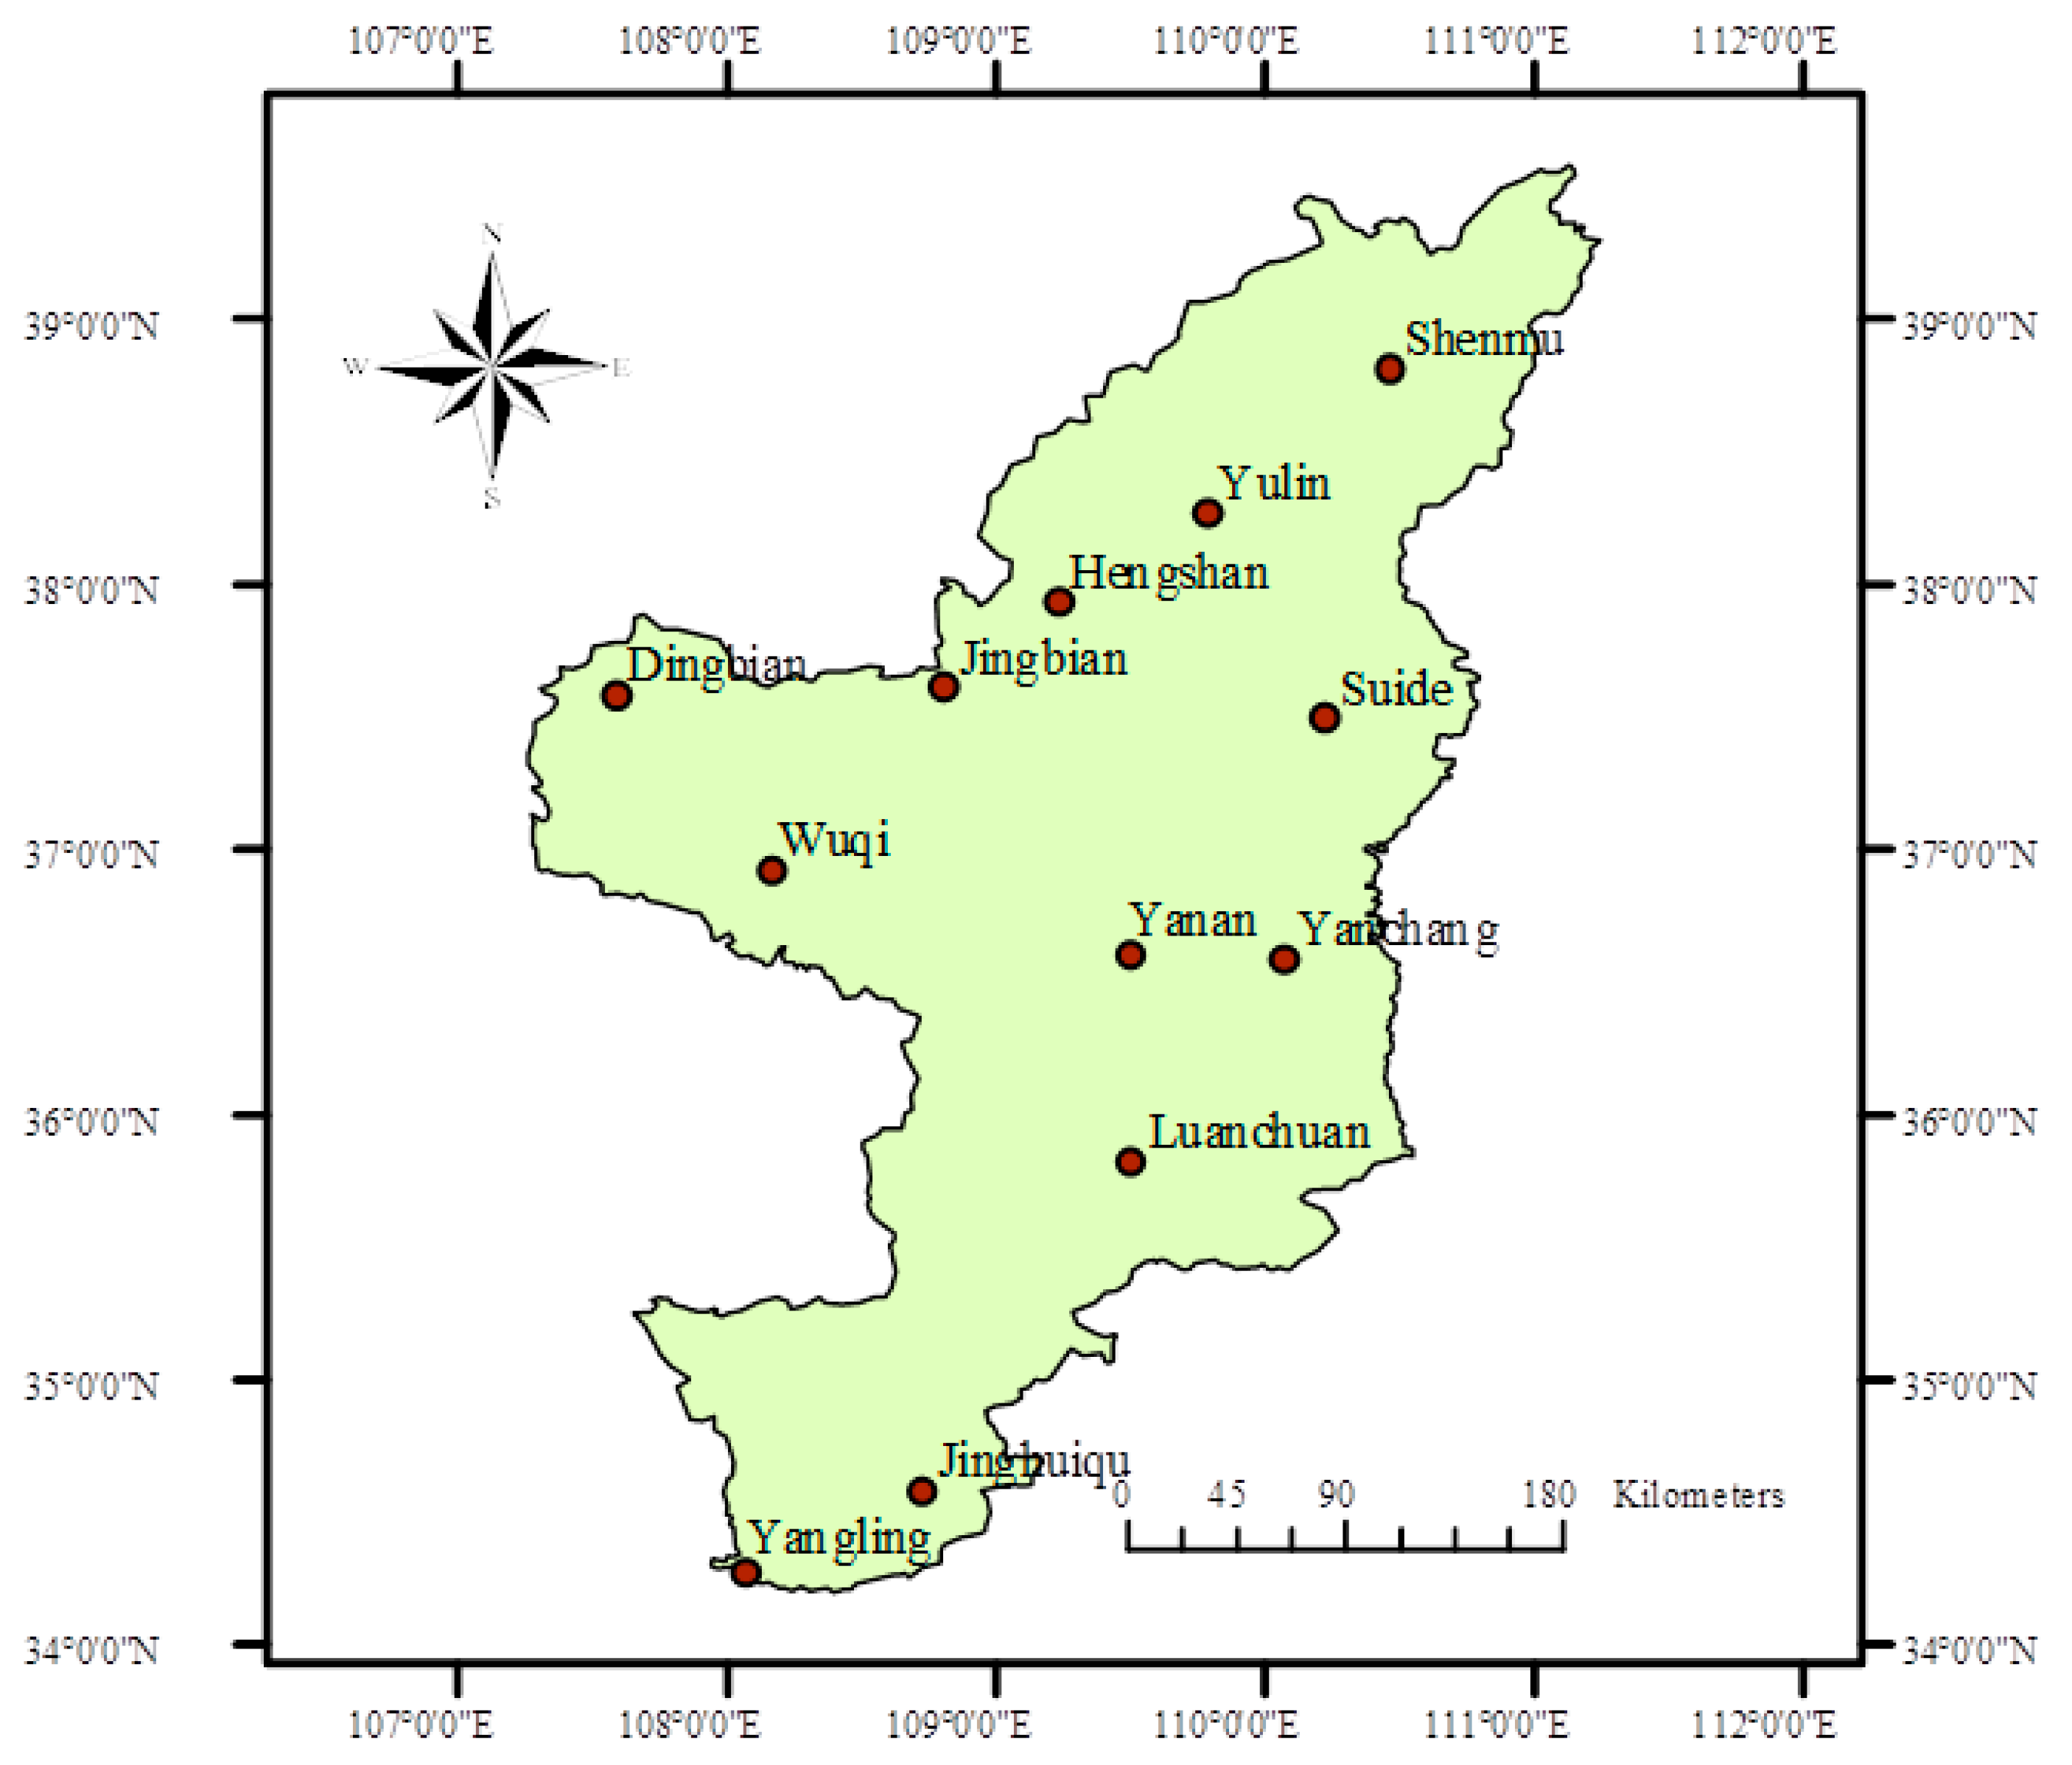
2.1. Study Area Description

Shaanxi Province is located in Northwest China (34°18′ N to 39°34′ N and 107°24′ E to 110°31′ E). The study area is in a sub-humid to semiarid climate zone, with mean annual temperatures of 6.0 to 13.4 °C, with minimum and maximum air temperatures ranging between −8.4 °C and 42 °C, respectively. The total annual sunshine duration was 2196–2914 h, with precipitations of 400–600 mm. Summer and spring maize are extensively cultivated in this region, and the average maize crop yields are 4 to 9 t ha−1. Maize is grown in this region between April and September, with a growing season interval between 100–150 days. The soil type in the South region is a loess loam; Heliu and dark loessial are the soil types in the Northeast and Northwest regions of Shaanxi [33,34,35].
Maize plants were sown using normal practices: 6 plants per m−2, with row-row spacing of 50 cm and fertilizer of 100–280 kg ha−1 N and 120 kg ha−1 P2O5 applied at the time of sowing. The crop received no irrigation in the rainfed regions and three flood irrigations in the irrigated region prior to crop maturity. The most common maize varieties cultivated are Zhong dan-02 and Wuke-02. Five rainfed sites (Luochuan, Yanan, Suide, Wuqi, and Yanchang,) and seven irrigated sites (Yulin, Dingbian, Jingbian, Hengshan, Shenmu, Yangling, and Jinghui qu) were selected to evaluate the effect of climatic change on maize crop yields in the Shaanxi Province (Figure 1).

2.2. Data

2.2.1. Crop Management Data

For this study, the crop data was collected from 4 experimental fields in Yangling district and 11 farmer fields in Shaanxi Province for four consecutive years (2010–2014). Crop data included: planting date, fertilizer, grain yield, phenology, soil texture, and irrigation data of the maize crop from the experimental and farmer sites.

2.2.2. Climate Data

Baseline (1961–1990) and future climate data were collected against the sites of experimental and farmer fields in Shaanxi Province from the MarkSim model [36]. Projected data, against the four RCP scenarios of 2.6, 4.5, 6.0, and 8.5, were obtained from the output of the MarkSim model. The MarkSim model is a weather generator that is extensively used to predict the daily weather data, including solar radiation, maximum temperature, minimum temperature, and rainfall for crop yield simulations [37,38,39]. MarkSim is a coarse-scale GCM (general circulation model) that outputs to a 0.5° × 0.5° latitude/longitude grid resolution using stochastic downscaling and climate-typing techniques [36]. MarkSim produces the daily solar radiation, as well as the maximum and minimum temperatures using Richardson (1981) methodology and precipitation data based on the Third-Markov stochastic model. The model has been applied to downscale the GCM outputs in different climate zones around the world [21,38,39]. Nouri et al. [39] indicated that it successfully produces the essential climate data for crop simulation modeling. An updated standalone version of MarkSim (V.2) that includes data from 17 individual GCMs from the fifth phase of the Coupled Model Inter-Comparison Project (CMIP5) was used in this study. MarkSim has new characteristics that allow the operator to make any arrangement among the 17 GCMs. GCM modifications can also be made for high, medium, and low RCP emissions [16]. Daily weather data for each RCP (2.6, 4.5, 6.0, and 8.5) during the study years (2021–2080) was done by choosing all the GCMs with their mean ensemble in 99 replicates for the experimental and farmer fields. The GCMs are detailed in Table 1. Daily maximum and minimum temperatures (°C), precipitation (mm d−1), and solar radiations against different CO2 concentrations of RCPs: 2.6, 4.5, 6.0, and 8.5 were downloaded from http://gisweb.ciat.cgiar.org/MarkSimGCM/. The CO2 concentration selected for the baseline (1961–1990) was 380 ppm and, in RCPs 2.6, 4.5, 6.0, and 8.5, ranged from 380–420 ppm, 380–560 ppm, 380–650 ppm, and 380–950 ppm, respectively, during 2021–2080.

2.3. Methods

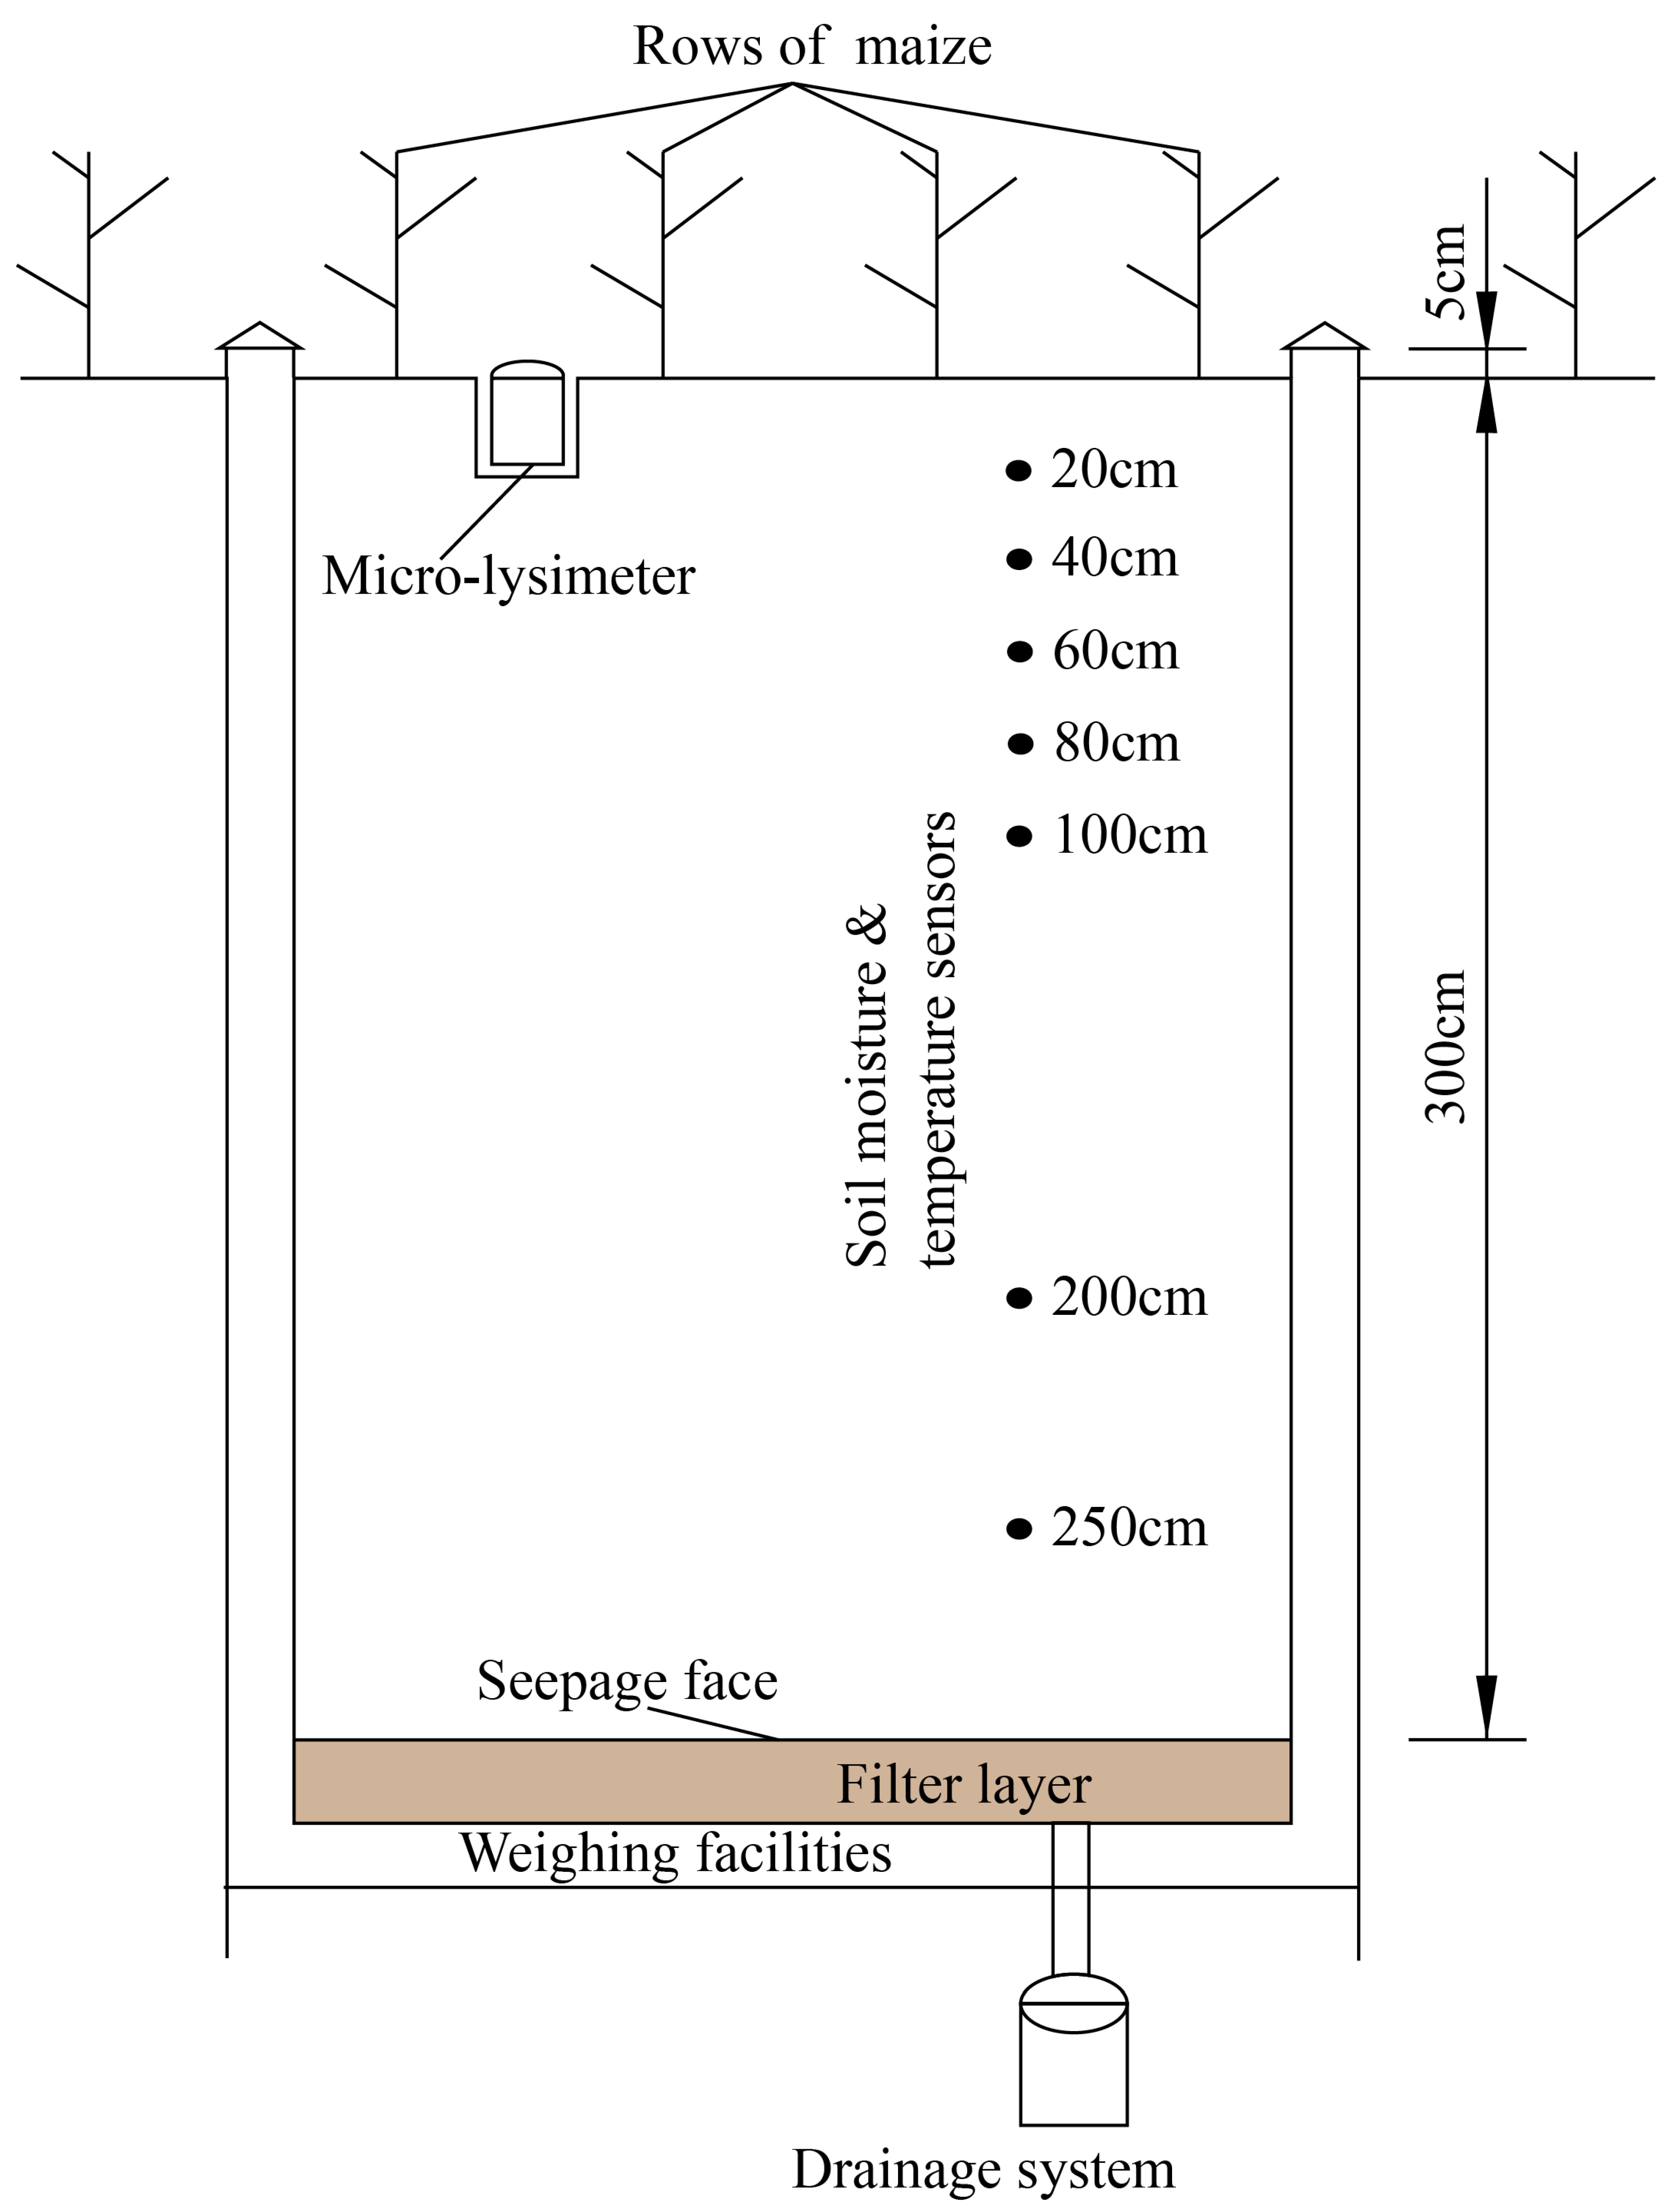
2.3.1. Descriptions of the Experimental and Farmer Fields

At Yangling, the experimental field consisted of four growing seasons (2010–2014), where irrigation scheduling was done by selecting the four successive phenology phases in the summer maize-growing period (three leaves-jointing stage, jointing-anthesis stage, anthesis-filling stage, and filling-mature stage). This experiment was conducted under a rainfall shelter. In each stage, three different irrigation amount ratios (IAR), 1.0 (100%), 0.8 (80%), 0.6 (60%), defined as a ratio of irrigation amount in stressed treatments to irrigation amount in the control treatment (CK), were applied. In the control irrigation treatment (CK), the irrigation amount was enough to substitute for crop water consumption due to evapotranspiration (ET). ET was measured with large weighing lysimeters with continuous electronic data-reading devices installed in the experimental plots (Figure 2). The design scheme and irrigation amount of the experimental site is specified in the Supplementary Materials (Tables S1 and S2). In the farmer field, irrigation schedules were carried out at different levels of irrigation and fertilizer amounts during the 2010–2014 growing seasons. Irrigation was applied at the joining, tasseling, and grain-filling stages. The cropping sequence of this area was summer maize (mid-June–late-October) and spring maize (late-April–late-September) during growing seasons 2010–2014.

2.3.2. CERES-Maize Model

The CERES-maize crop simulation model (CSM), which is part of the Decision Support System for Agro Technology Transfer (DSSAT) Version 4.6.7 [16], was used. A CERES-maize tool that incorporates GCM-projected climatic data was used to assess the impact of climate changes on crop yields [15]. The CERES-maize model uses inputs, including cultivar type, weather data on a daily basis, soil properties, initial soil conditions, cultivar coefficients, planting density, and planting dates, to simulate the growths of 30 different crops [40].

2.3.3. Model Calibration

In order to calibrate the model for separate sites, we used basic crop data (anthesis, physiological maturity dates, and final grain yield) from the full-irrigation treatment (CK) in the experimental and in the farmer fields during three growing seasons (2010–2012). Cultivar coefficients of the maize crop were also estimated using these data. In a first step, the DSSAT-GLUE (generalized likelihood uncertainty estimation) [41] package was used to determine the genetic coefficient for the summer maize cultivar Wuke-02 and spring maize Zhong dan-02. GLUE was run 3000 times to obtain the best cultivar coefficients. However, as these coefficients did not produce satisfying fits between the simulated and observed values, a trial and error method [42] was used to identify cultivar coefficients that led to the best simulation performance. The genetic coefficients identified during the calibration process can be found in the Supplementary Materials (Tables S3 and S4 and Figure S1).

2.3.4. Model Evaluation Data

The model was evaluated using two years of experimental data (2012–2013) from Yangling and the farmer field data (2013–2014). In Yangling in 2012 and 2013, the experiment was designed with nine deficit irrigation treatments (CK-T9) with three replicates using the partial orthogonal experimental design method. In the farmer fields, nonlimiting irrigation and fertilizer amounts were selected during the growing seasons in 2013 and 2014. Data on the grain yields were used from the experimental and farmer sites to evaluate the model. The model evaluation output of the experimental field and farmer fields can be found in the Supplementary Materials (Figures S2 and S3).

2.3.5. Model Setting for Baseline and Future Projections

The calibrated CERES-maize model DSSAT version 4.6 was run to simulate the average maize yield with a CO2 concentration of 380 ppm and baseline weather data (1961–1990). The parameter settings for the baseline yield in the DSSAT seasonal analysis tool simulation option were selected by taking information from previous and current experiments, interviews with farmers, and agronomist knowledge from different field sites. According to the currently available data, the sowing dates of late-April (28) for the spring maize and June (14) for the summer maize, irrigation water amount of 200 mm, and fertilizer of 180 kg ha−1 were selected in the study area sites for the average baseline yield simulation. In addition, these assumptions were also used for the simulations under future climate scenarios from 2021 to 2080.

2.3.6. Statistical Analysis

In this study, the model was evaluated using the coefficient of determination (R2), d-index value, and normalized root mean square error (nRMSE) between the simulated and observed data. In addition, a regression analysis was also used for the relationship between yield and temperature. The d-index value was calculated using the following equation:
d = 1 [ i = 1 n ( P i O i ) 2 i = 1 n ( | P i | + | O i | ) 2 ] ,   0 d 1 ,  
where n = number of observations,   P i   = predicted value for the ith measurement, O i = observed value for the ith measurement, O ¯   = the overall mean of observed values, P i = P i O ¯ , and O i = O i   O ¯ .
The normalized root mean square error (nRMSE) was calculated using the following equation:
nRMSE = RMSE   × 100   O ¯
where RMSE is the root mean square error, which was calculated using the following equation:
RMSE = i = 1 n ( P i O i ) 2 n
A higher d-index value and lower nRMSE value indicated a good fit between the simulated and observed data. R2 and D-index values ranges from 0 to 1, and perfect agreement between the observed and simulated data is represented by being closer to 1.
Generally, there are four categories of criteria for nRMSE to understand the relationship between simulated and observed data: nRMSE < 10% was considered excellent, 10% < nRMSE < 20% was considered good, 20% < nRMSE < 30% was considered fair, and nRMSE > 30% was considered poor.
Mann Kendall test
There are many statistical tests available for a trend analysis of climate data. The Mann Kendall test was considered as a good tool to identify the values of the trends in the climatic time series [43,44,45]. The increasing warming and decreasing cooling trends were identified by positive (+ve) and negative (−ve) values at the 0.05 significant level [43]. Further details of the Mann Kendall test can be found in the literature [46]. In this study, the Mann-Kendall test was used to identify the trend values in precipitation and temperature during the period 2020–2080 and calculated as:
S = i 1 n 1 j i + 1 n s g n ( x j x i )
where x j   x i are values of i and j(j > i) in the data series, and sgn ( x j     x i ) is the sign function, whereas n denotes the data points:
s g n ( x j x i ) { + 1 ,   if   x j x i > 0 0 ,   if   x j x i = 0 1 , if   x j x i = 0 }  
If the sample size is greater than 10, the variance is μ ( s ) = 0 .
σ ( s ) = n ( n 1 ) ( 2 n + 5 ) i 1 m t i ( t i 1 )   ( 2 t i + 5 ) 18  
Zs is calculated as:
Z s = { S 1 σ 2 ( S )   if   s > 0 0 ,   if   s = 0 S + 1 σ 2 ( S )   if   s < 0 }

3. Results

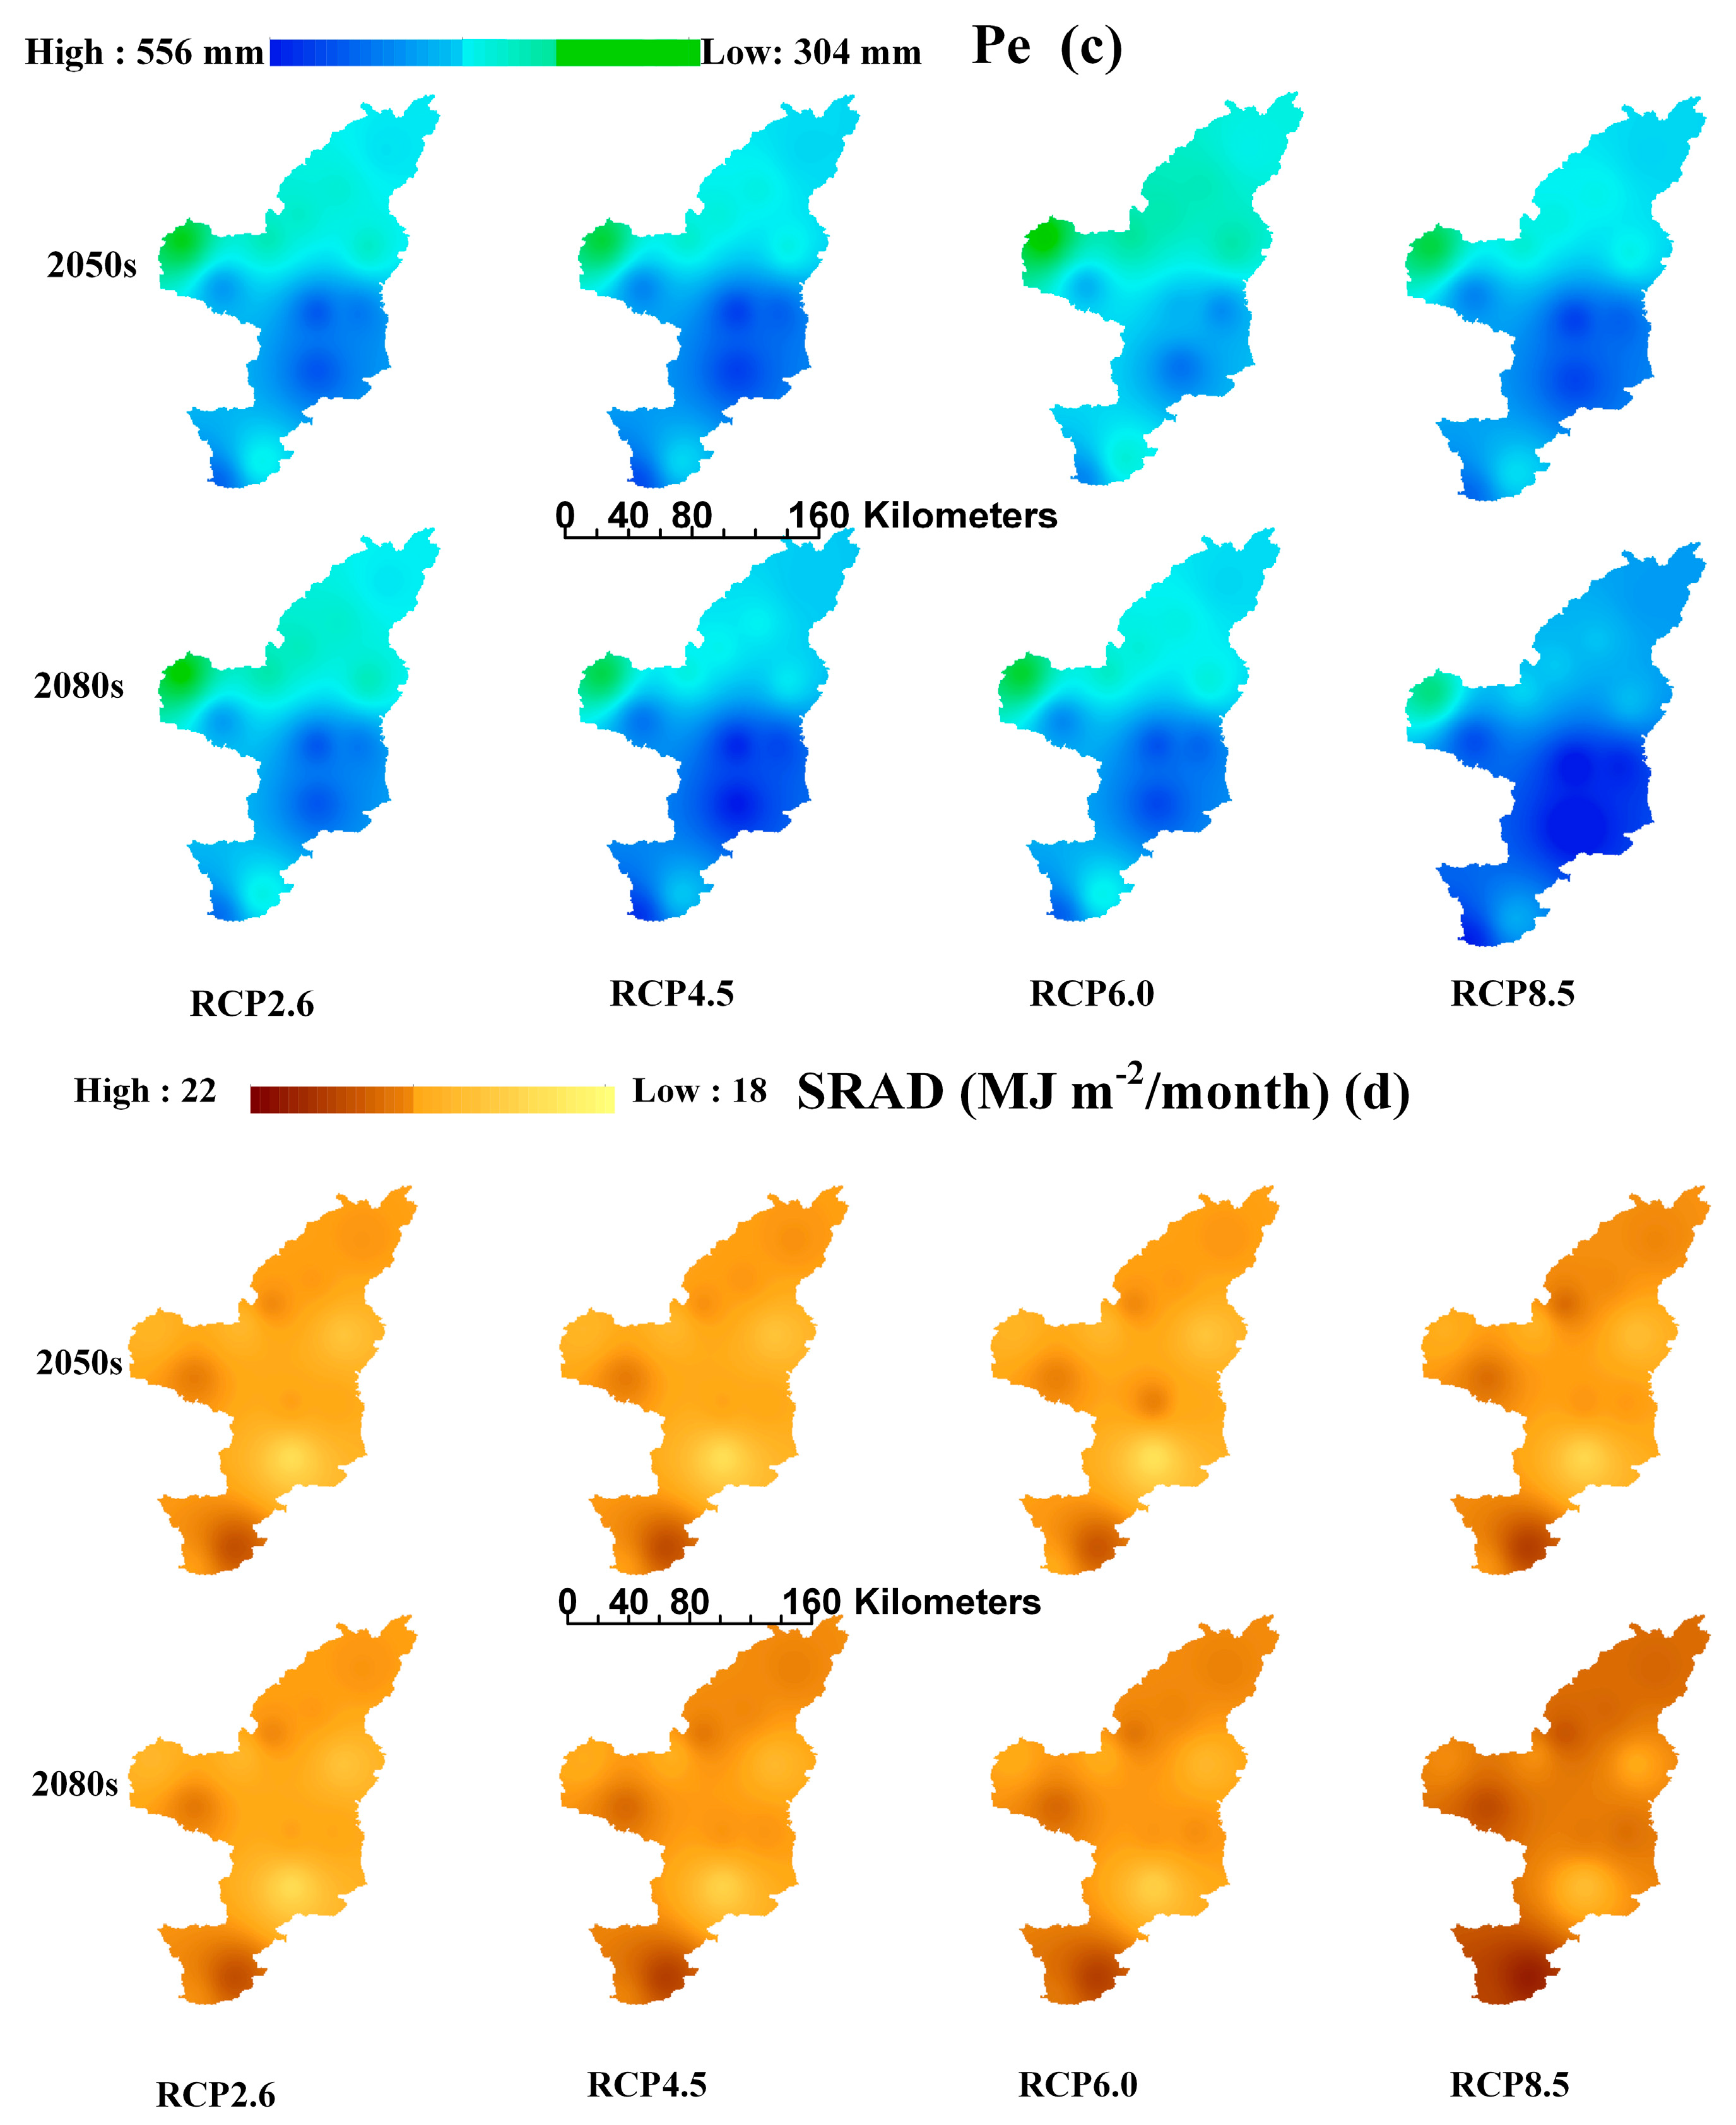
3.1. Projected Climatic Conditions under Future Changing Climate Scenarios

This paper evaluated the spatial and temporal evolution processes of future climatic factors relative to a baseline (1961–1990) on the 12 sites in the study area (Figure 1): precipitation (Pe), temperature (Tmax. and Tmin.), and solar radiation (SRD) under prospected climate change scenarios. As noted by the spatial distribution of these climate variables, the results showed that T and Pe were higher in the Southern region than the Northern region relative to the baseline. Furthermore, the responses of the climate variables in each of the scenarios was different (Figure 3a–d). As studied from the temporal evolution of the variables in all the scenarios at separate stations, temperature (Tmax. and Tmin.) had an ascending trend and indicated a high significant ascending trend (p < 0.05) in all regions in the RCP8.5 scenario. The highest temperature increase was found at Jinghui qu, and the trend test of the Mann-Kendall (MK) value was 3.94 (p < 0.05). In the same period of time, the precipitation trend also increased in most of the regions in all scenarios with a significant ascending trend (p < 0.05). The highest precipitation was found at Yanan Station in the RCP8.5 scenario, and the trend test of the Mann-Kendall (MK) value was 3.90 (p < 0.05). The solar radiation was not significant in all scenarios at all stations. Further details about changes in the climate variables of different scenarios relative to the baseline have been provided in the Supplementary Materials (Figure S4).

3.2. Spatial Evolution of Maize Yield, ET, and WUE under Future Climate Change Scenarios

3.2.1. Maize Yield

This study analyzed the evolution of the average maize yield under different future climate scenarios. Figure 4a,b indicates the spatial distribution of the maize yield. The results showed that the average simulated baselines of the rainfed and irrigated maize crop yields in the study area were in the range of 4.8–6.0 t ha−1 and 5.9–8.0 t ha−1, respectively. With CO2 fertilization, the seasonal total average maize yields simulated under the rainfed and irrigation conditions were in the range of 4.0–7.4 t ha−1, 3.7–6.8 t ha−1, 3.9–7.5 t ha−1, and 3.4–6.8 t ha−1 under the RCP2.6, RCP4.5, RCP6.0, and RCP8.5 scenarios, respectively, in the 2050s. In the 2080s, the simulated maize yields ranged 3.7–6.8 t ha−1, 3.4–6.4 t ha−1, 3.2–6.0 t ha−1, and 2.8–4.9 t ha−1 under the RCP2.6, RCP4.5, RCP6.0, and RCP8.5 scenarios, respectively. Without increased CO2, the seasonal total average maize yields were 3.4–6.9 t ha−1, 3.0–6.3 t ha−1, 3.0–7.0 t ha−1, and 2.8–6.6 t ha−1 under the RCP2.6, RCP4.5, RCP6.0, and RCP8.5 scenarios, respectively, in 2050. In 2080, the simulated maize yields ranged from 3.0–6.6 t ha−1, 2.9–6.2 t ha−1, 2.75–5.9 t ha−1, and 2.65–4.8 t ha−1 under the RCP2.6, RCP4.5, RCP6.0, and RCP8.5 scenarios, respectively. In most of the regions, the average modeled maize crop yield indicated a decreasing trend under the RCP2.6, RCP4.5, RCP6.0, and RCP8.5 scenarios; the highest yield decrease was in the RCP8.5 scenario. The average maize yield without the fertilization of CO2 at the Suide site indicated the lowest yields of 3.0 and 2.5 t ha−1 and other stations for the 2050s and 2080s, respectively. While the increases in the yields with the fertilization of CO2 at Dingbian and Jingbian were the highest relative to the baseline yield and other stations in all scenarios for the 2050s but decreased in the 2080s. In this region, the irrigated and rainfed total average yields increased compared to without the fertilization of CO2 10.5%, 11.6%, 7.8%, and 6.5% under the RCP2.6, RCP4.5, RCP6.0, and RCP8.5 scenarios, respectively, during the years 2021–2080.

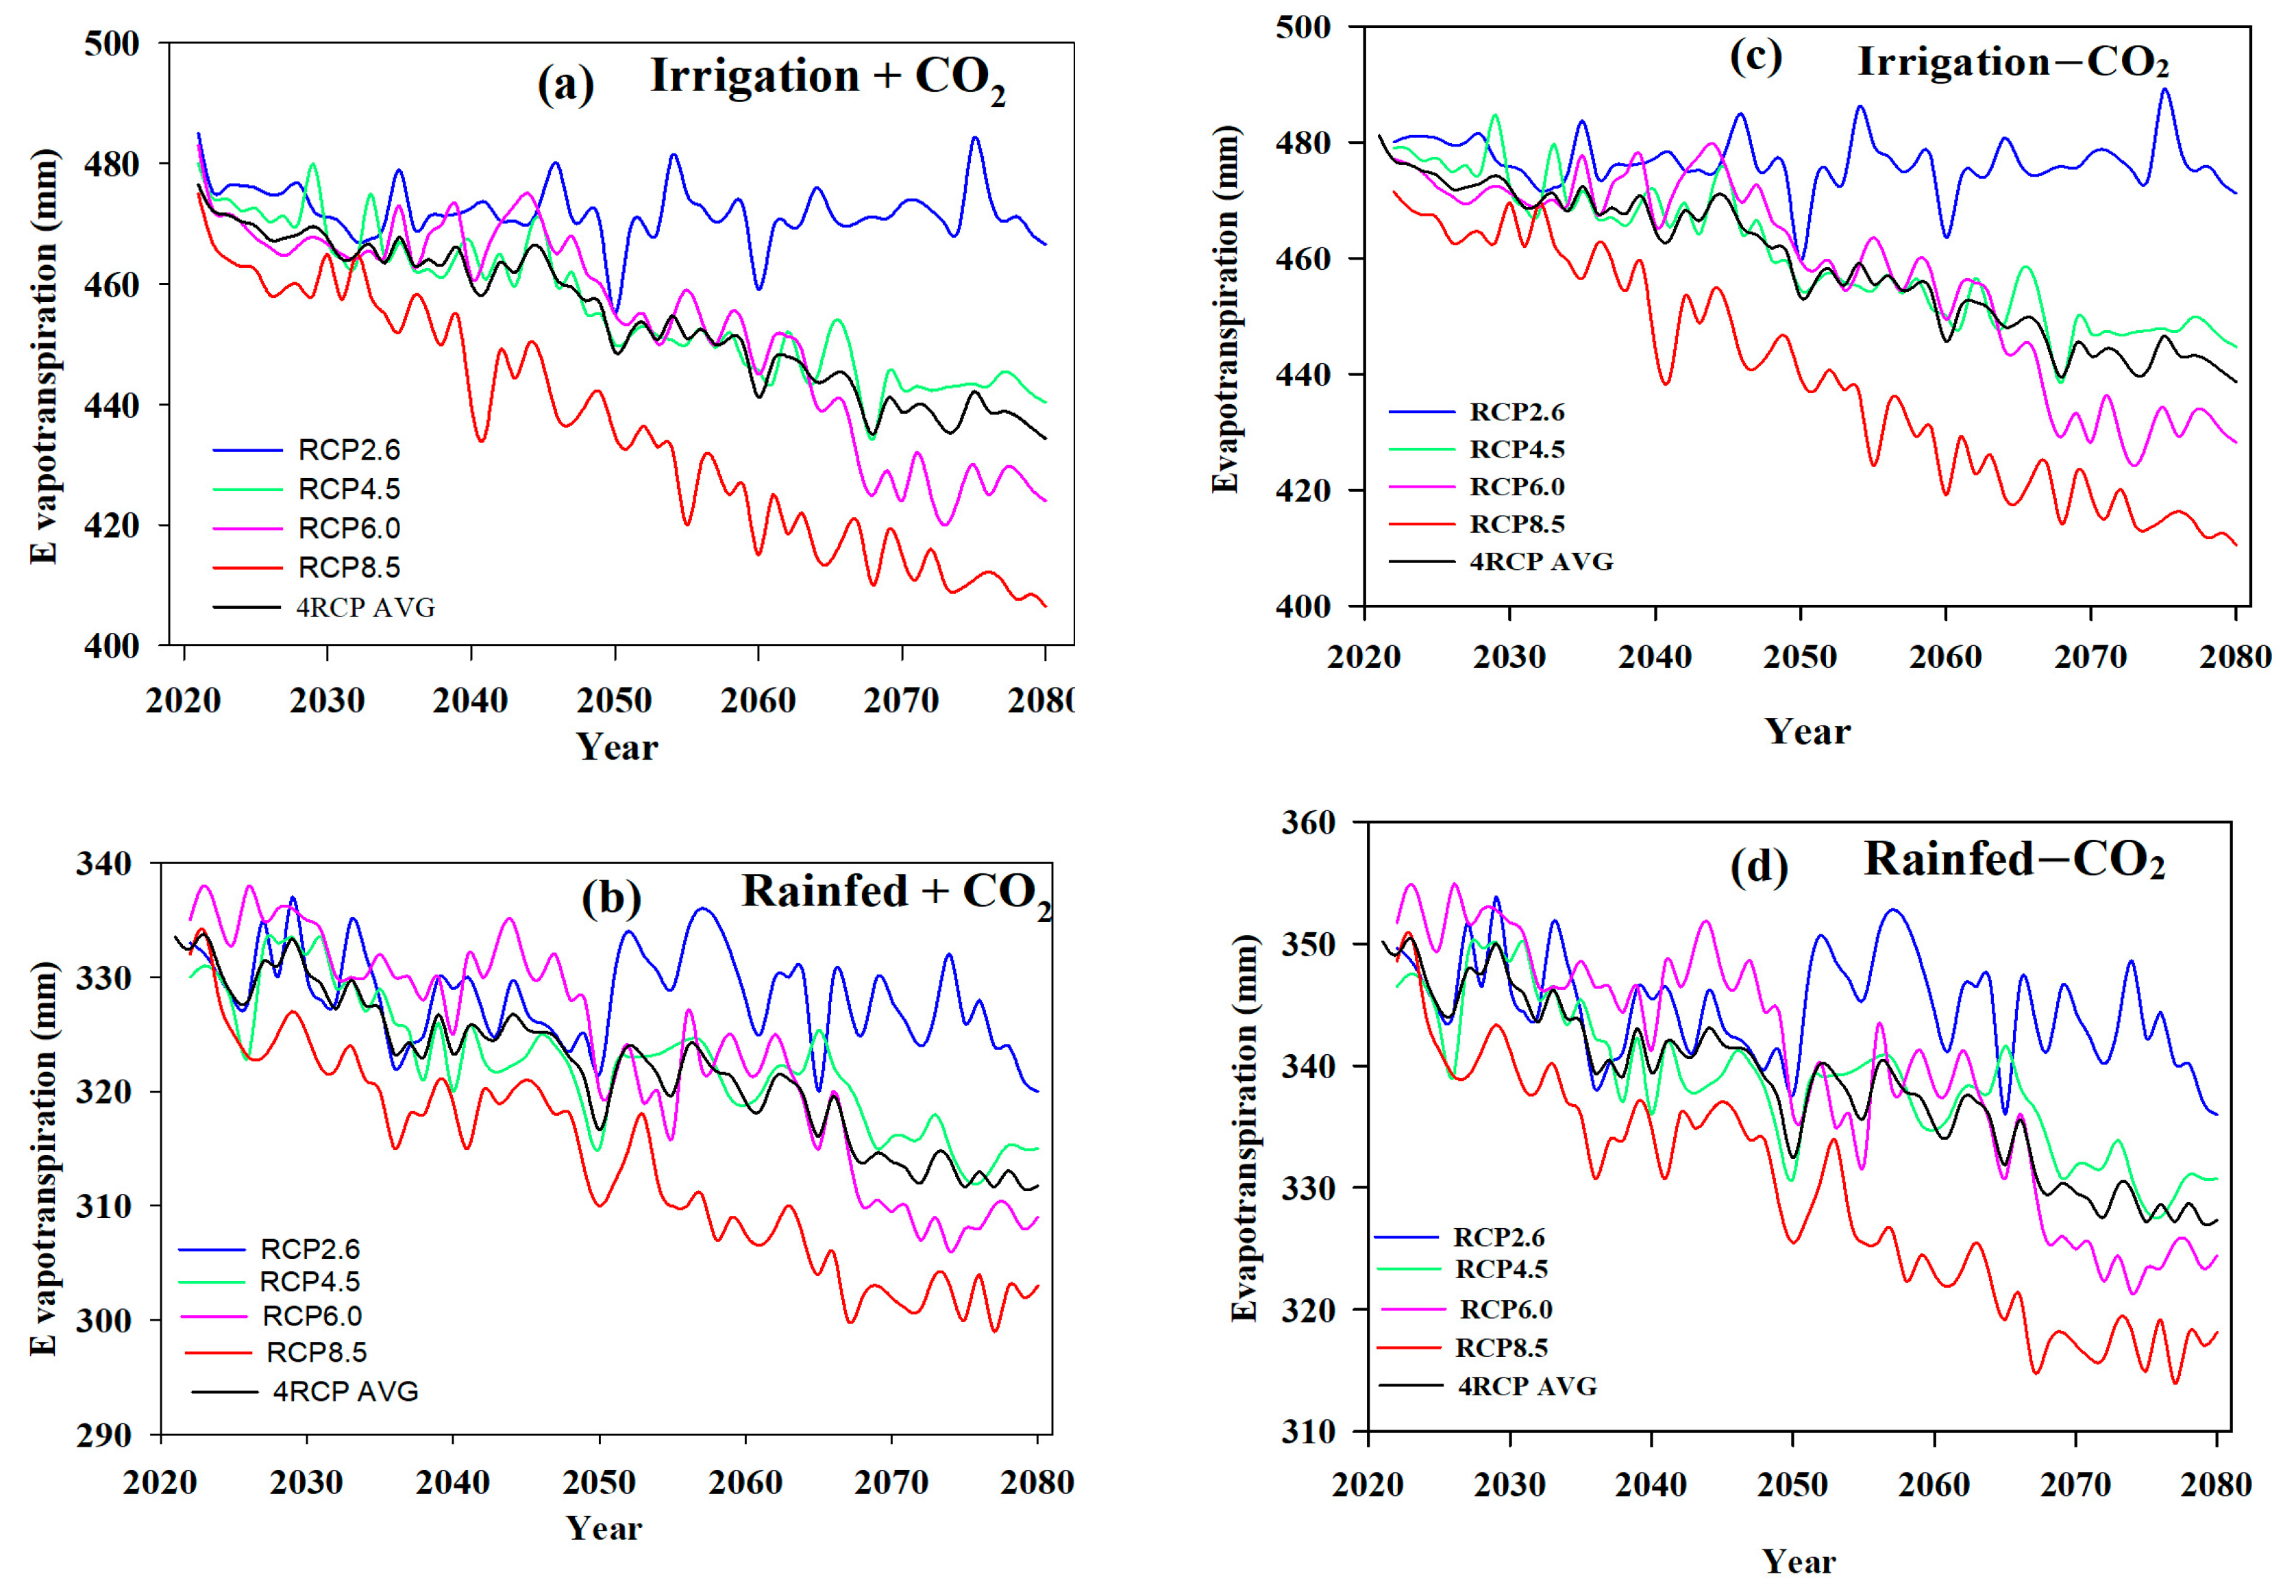
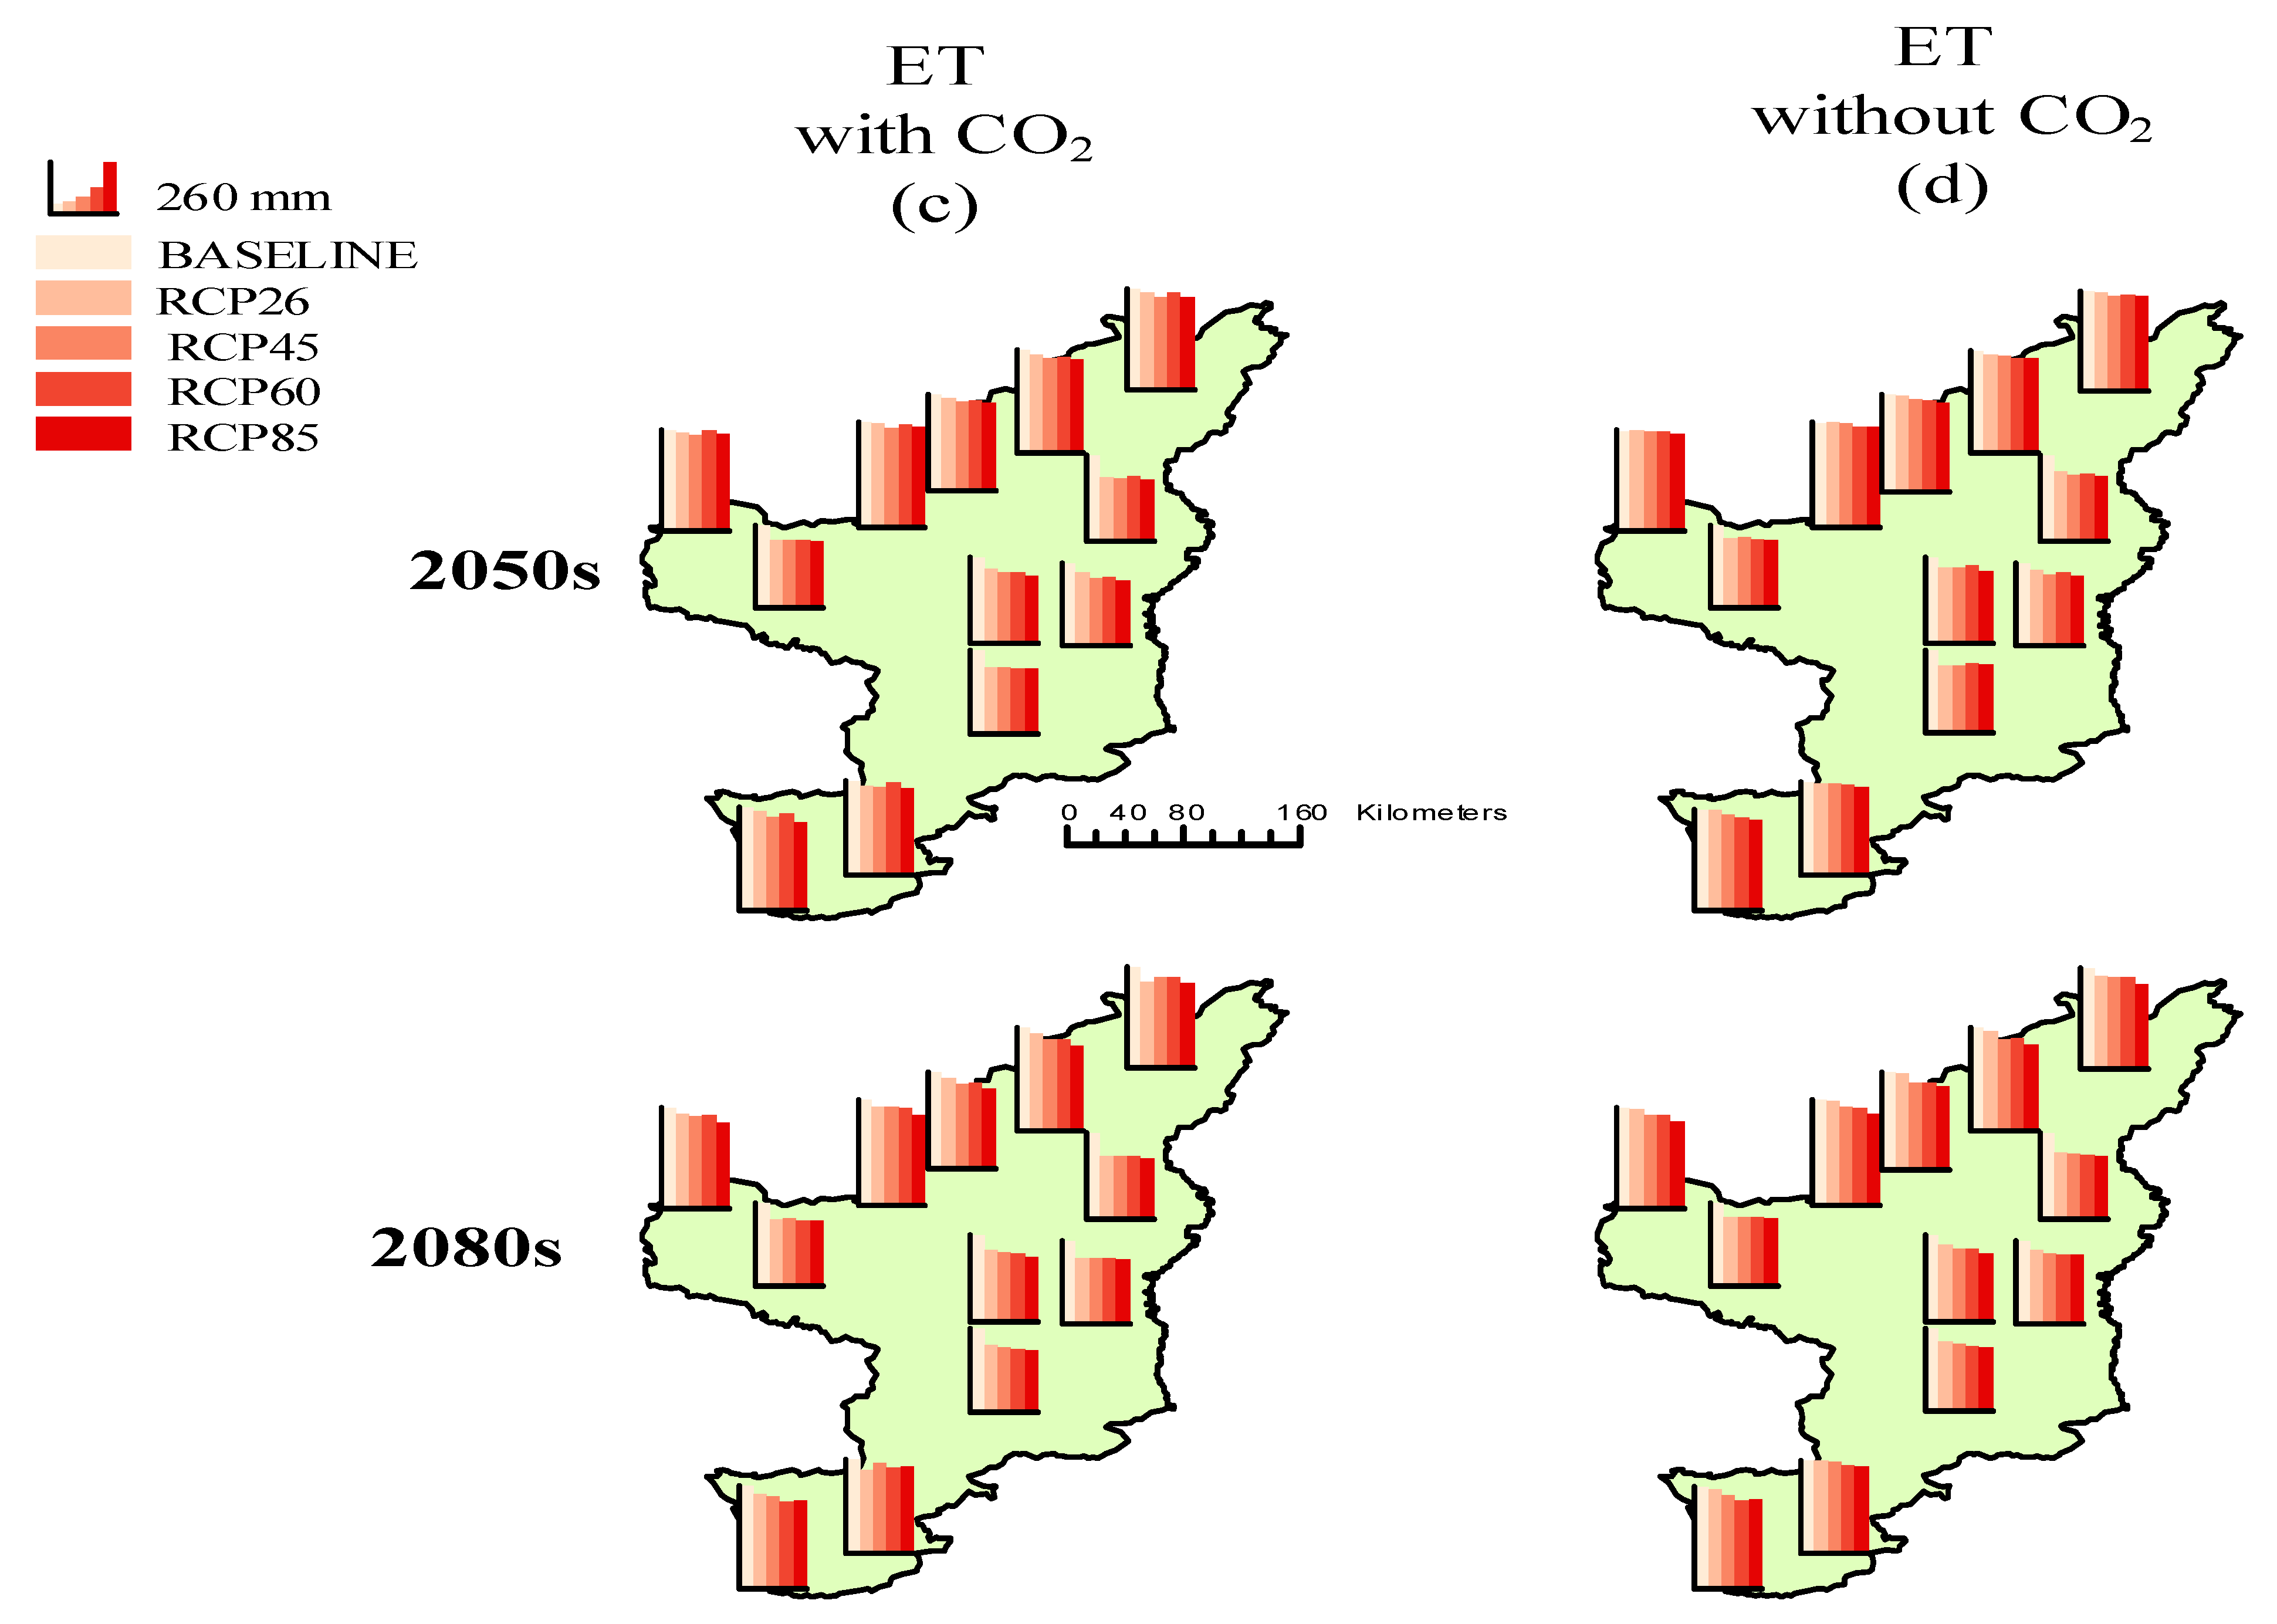
3.2.2. Evapotranspiration

The distribution of the ET with and without increased carbon dioxide at each station had different behaviors in all the scenarios (Figure 4c,d). The results showed that the simulated baseline ET of the irrigated and rainfed maize in the study area ranged from 460–510 mm and 400–420 mm, respectively. The simulated ET of the maize crops in all scenarios decreased with the fertilization of CO2 and increased without the fertilization of CO2. With CO2 fertilization, the simulated ET ranged from 310–505 mm, 305–485 mm, 313–500 mm, and 300–487 mm and 303–465 mm, 305–476 mm, 301–470 mm, and 294–440 mm under the RCP2.6, RCP4.5, RCP6.0, and RCP8.5 scenarios for the 2050s and 2080s, respectively. Without CO2 fertilization, the simulated ET ranged from 332–512 mm, 345–507 mm, 326–486 mm, and 318–493 mm and 323–505 mm, 315–480 mm, 312–475 mm, and 306–426 mm under the RCP2.6, RCP4.5, RCP6.0, and RCP8.5 scenarios for the 2050s and 2080s, respectively. The highest decrease in ET with the fertilization of CO2 was found in the RCP8.5 scenario compared to the RCP2.6, RCP4.5, and RCP6.0 scenarios and the highest increase in ET without the fertilization of CO2 in the RCP2.6 scenario compared to the RCP4.5, RCP6.0, and RCP8.5. The spatial variability of the ET was higher in the Northern region and lower in the Southern region and Western region. The maximum ET of the maize crop in the RCP2.6 scenario in the 2050s was 505 mm with increased CO2 and 512 mm without fertilized CO2, respectively, at Jingbian Station.

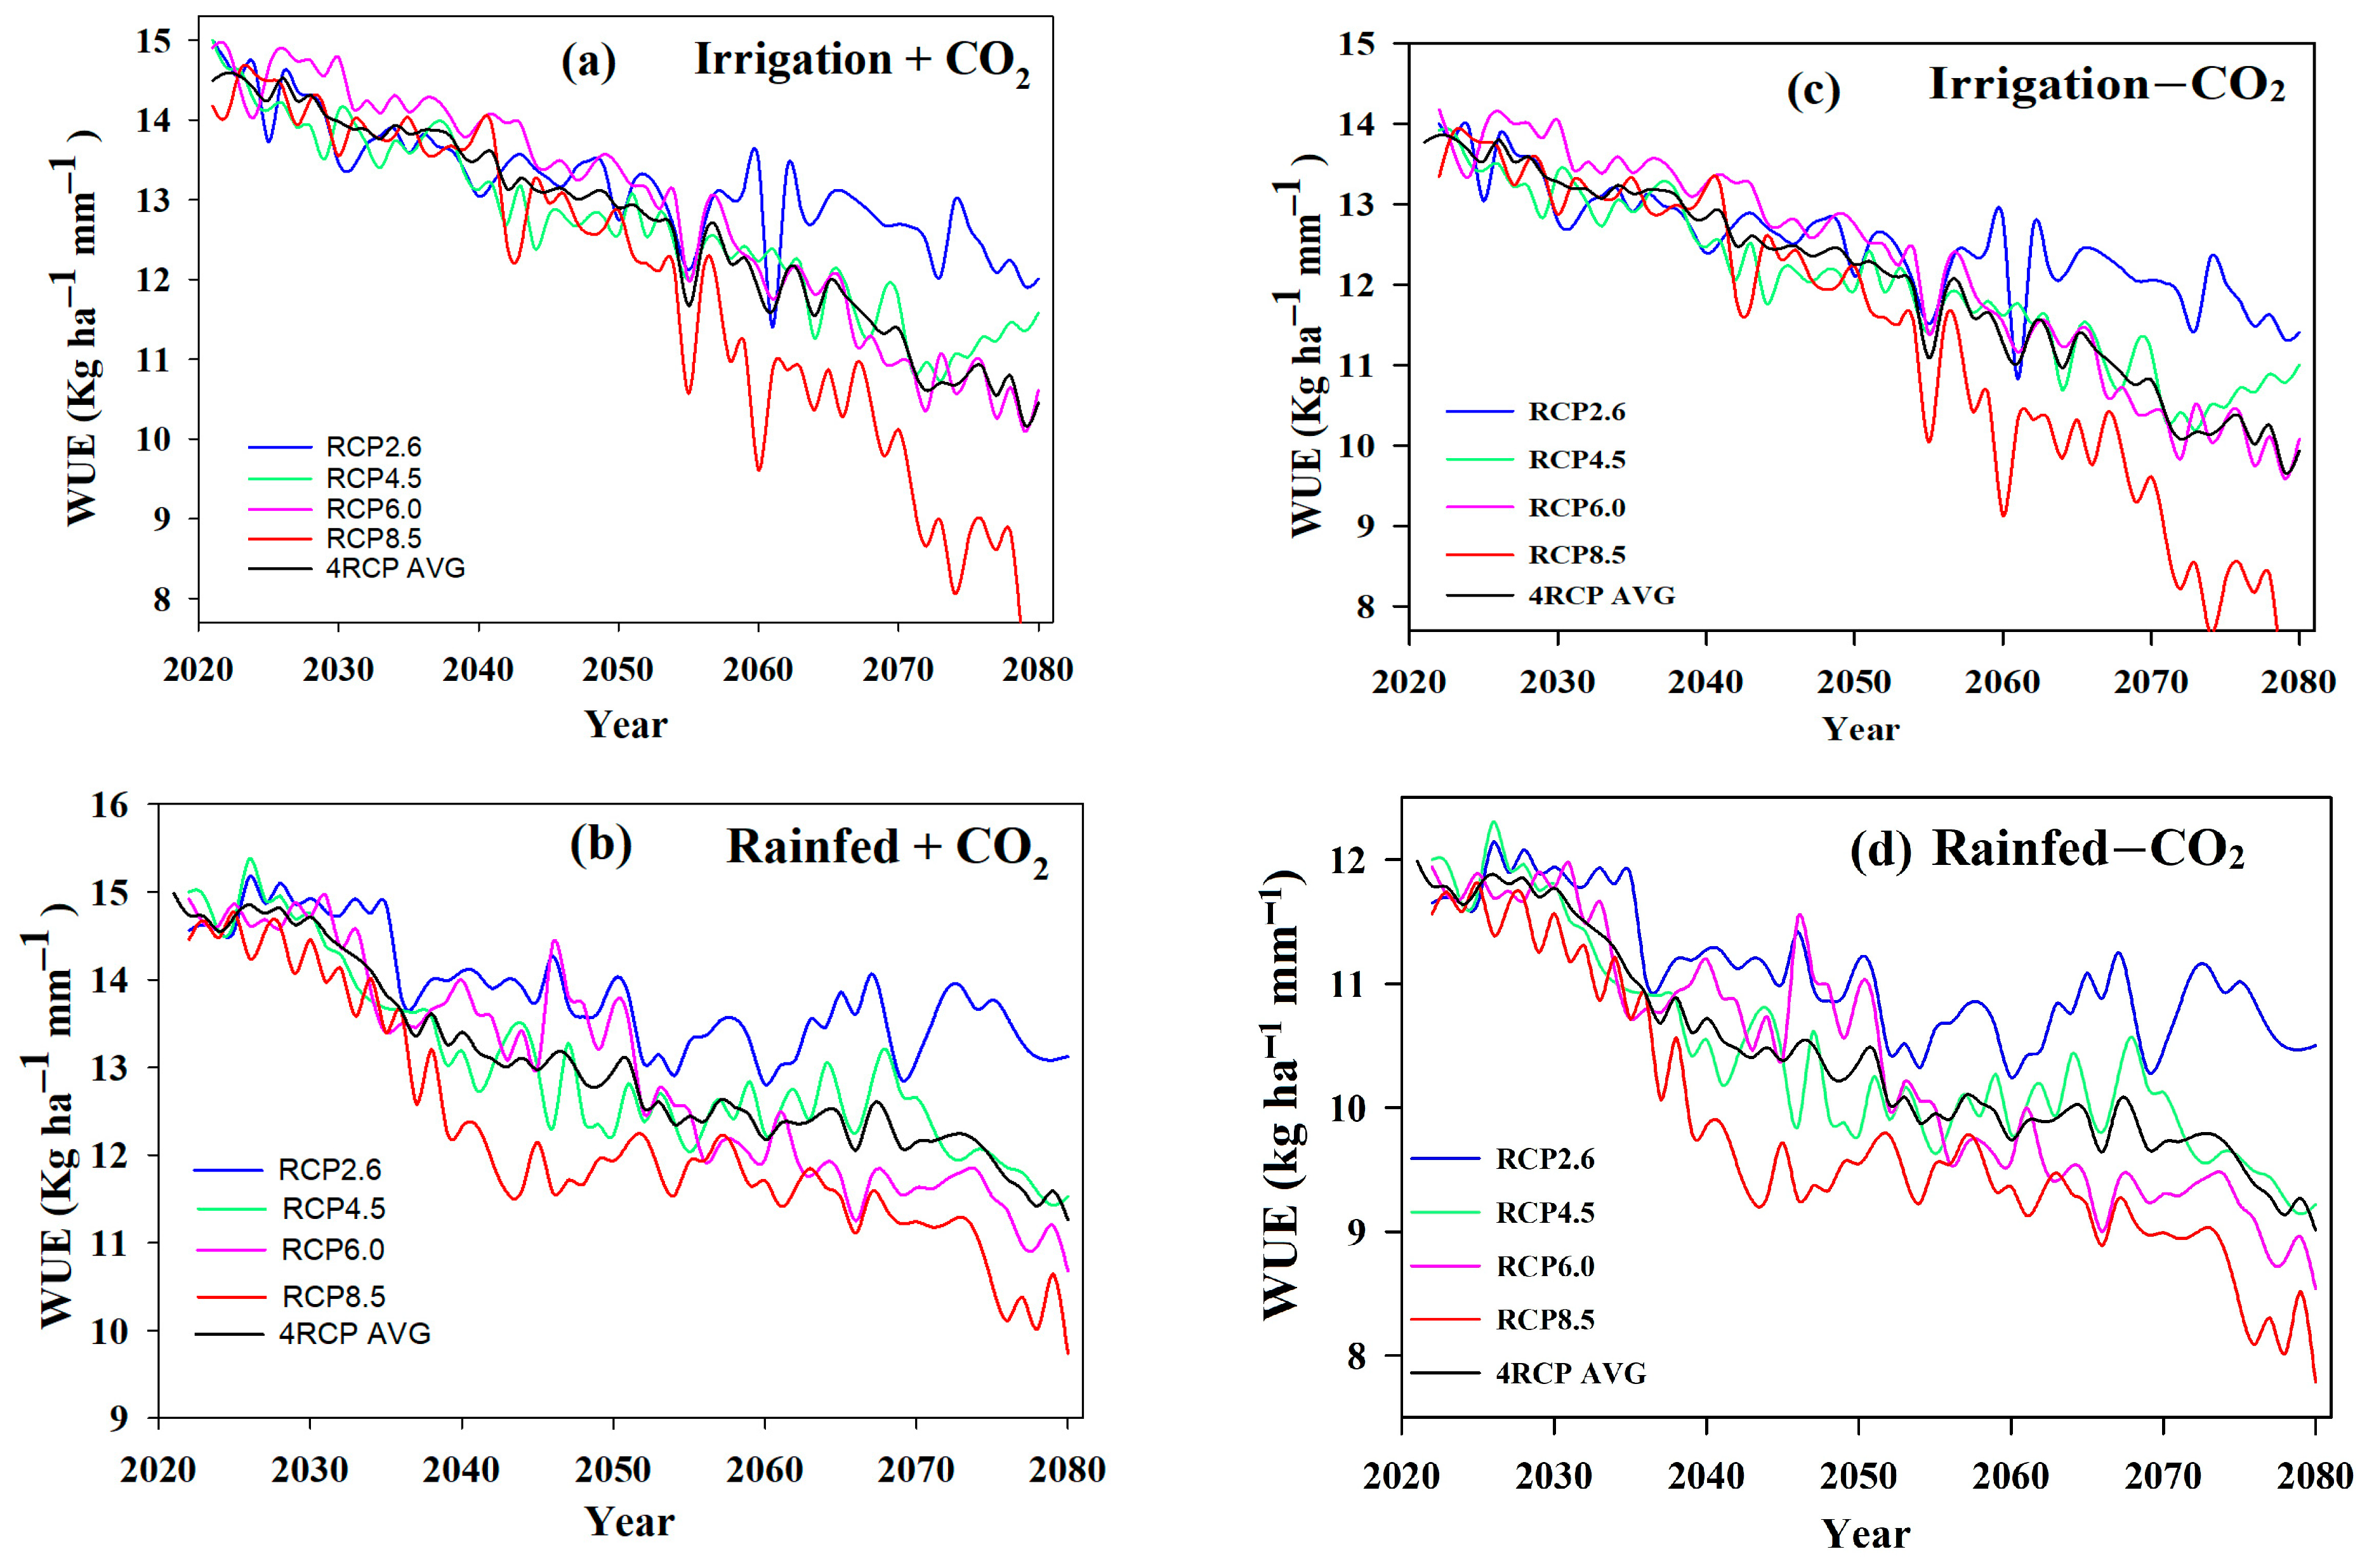
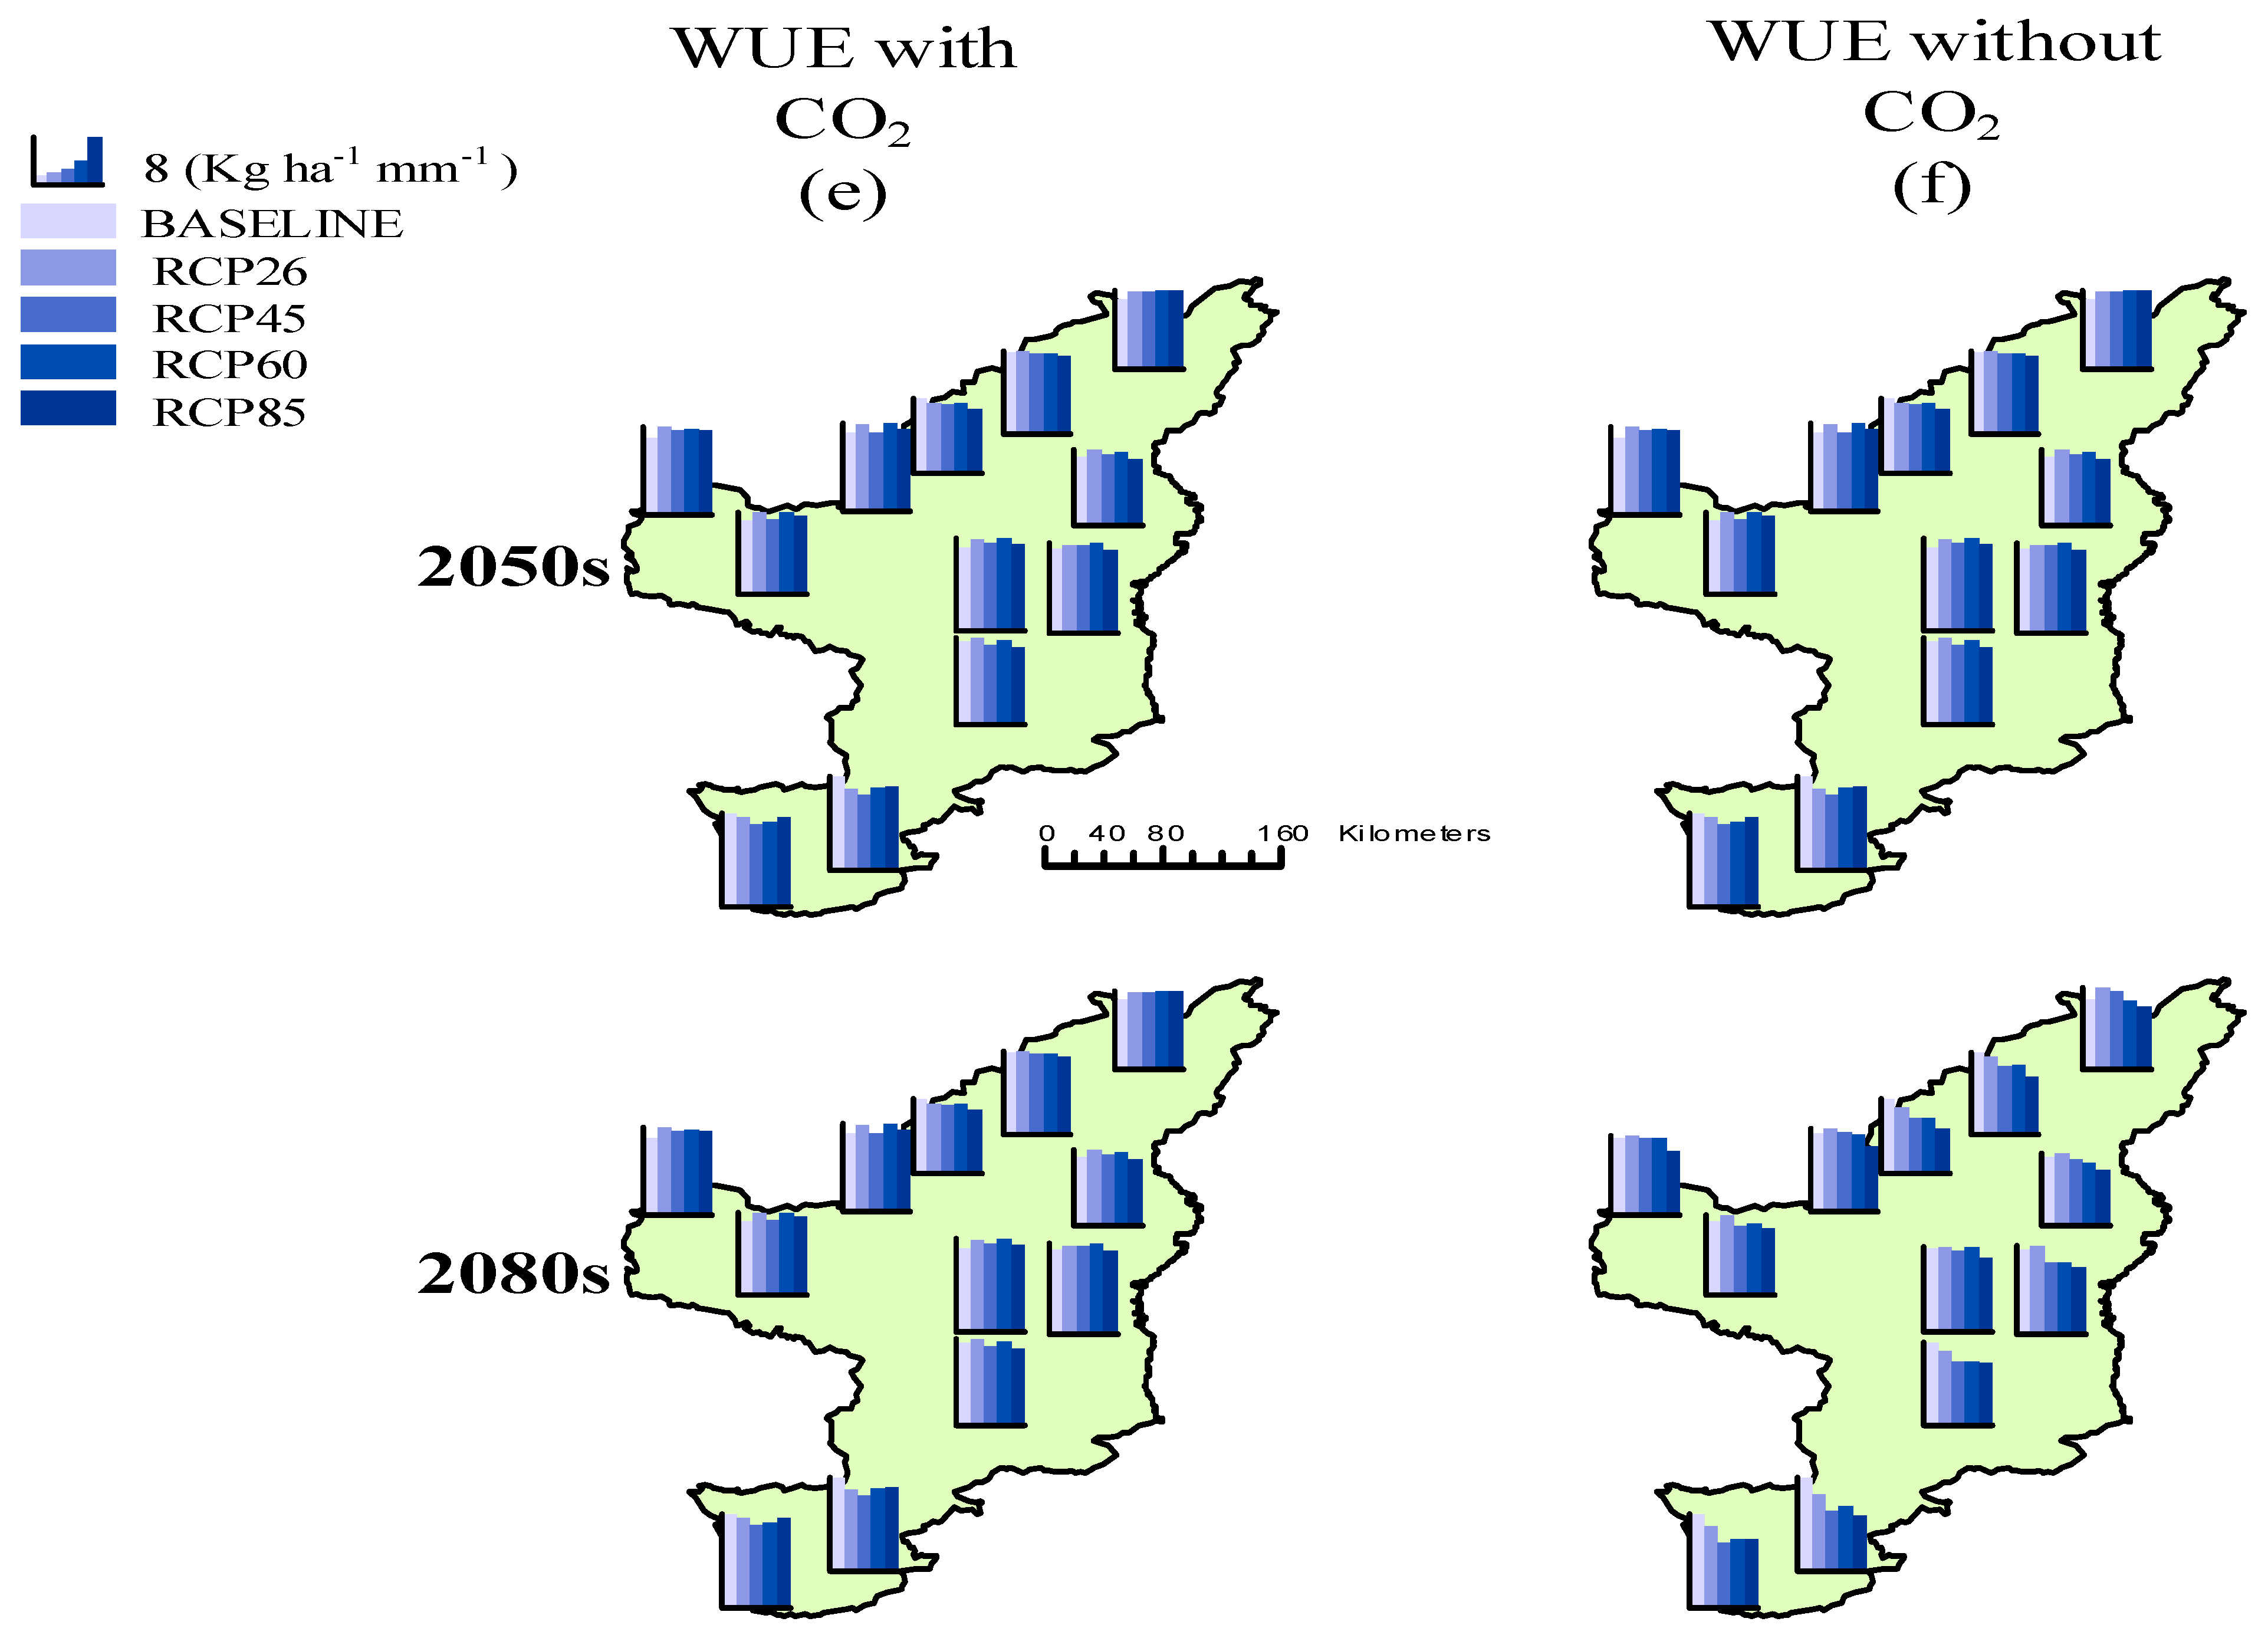
3.2.3. Water Use Efficiency

The simulated water use efficiency under rainfed and irrigated conditions in the baseline in the study area was 11.6–14.4 kg ha−1 mm−1 and 12.0–16.0 kg ha−1 mm−1, respectively. As exhibited in Figure 4e,f, the results showed that the water use efficiency of the maize crops were not increased in the scenarios with the fertilization of CO2 and without the fertilization of CO2. The range of the simulated WUE with the fertilization of CO2 was 13.1–15.0 kg ha−1 mm−1, 12.0–12.7 kg ha−1 mm−1, 12.4–15 kg ha−1 mm−1, and 11.3–14.3 kg ha−1 mm−1 under the RCP2.6, RCP4.5, RCP6.0, and RCP8.5 scenarios, respectively, for the 2050s (Figure 4e). In the 2080s, the simulated WUE ranged from 12.2–14.1 kg ha−1 mm−1, 10.4–13.7 kg ha−1 mm−1, 10.6–13.1 kg ha−1 mm−1, and 7.69–12.6 kg ha−1 mm−1 under the RCP2.6, RCP4.5, RCP6.0, and RCP8.5 scenarios, respectively (Figure 4e). Without the fertilization of CO2, the simulated WUE ranged from 9.7–13.9 kg ha−1 mm−1, 9.3–12.9 kg ha−1 mm−1, 9.2–14.7 kg ha−1 mm−1, and 8.8–14.3 kg ha−1 mm−1 under the RCP2.6, RCP4.5, RCP6.0, and RCP8.5 scenarios, respectively, for the 2050s. In the 2080s, the simulated WUE range was 9.2–13.0 kg ha−1 mm−1, 8.7–12.74 kg ha−1 mm−1, 8.6–12.8 kg ha−1 mm−1, and 7.4–10.9 kg ha−1 mm−1 under the RCP2.6, RCP4.5, RCP6.0, and RCP8.5 scenarios, respectively (Figure 4f). The increase in the WUE of the maize crops was highest in RCP2.6 and lowest in RCP8.5. Compared to the baseline WUE, the increase in the total average WUE of the maize crop was 13% at Dingbian Station under the RCP2.6 scenario in the 2050s; however, it was not increased under RCP8.5 in the 2080s. In this region, on average, the irrigated and rainfed WUE of CO2 fertilization was increased 7% and 21%, respectively, compared to without CO2 fertilization.

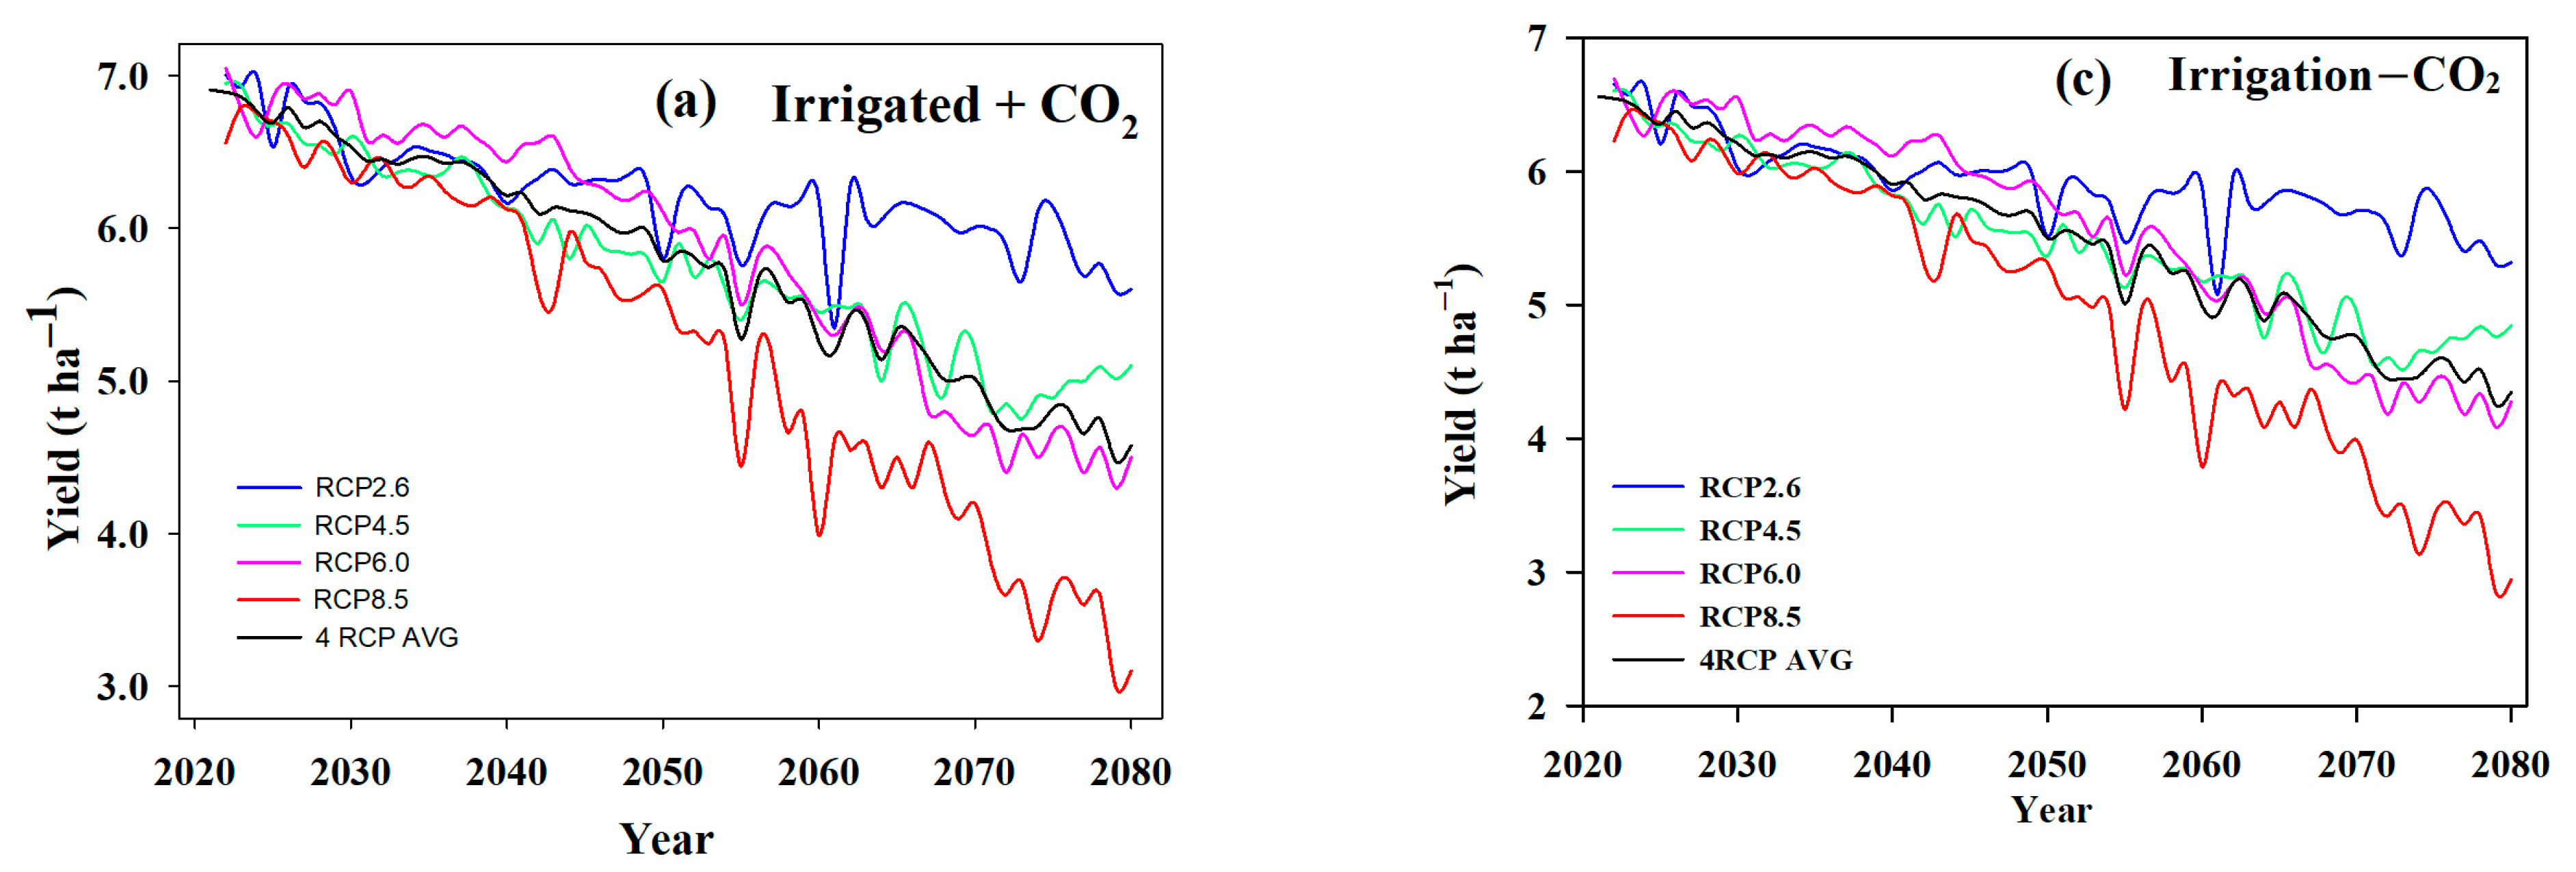
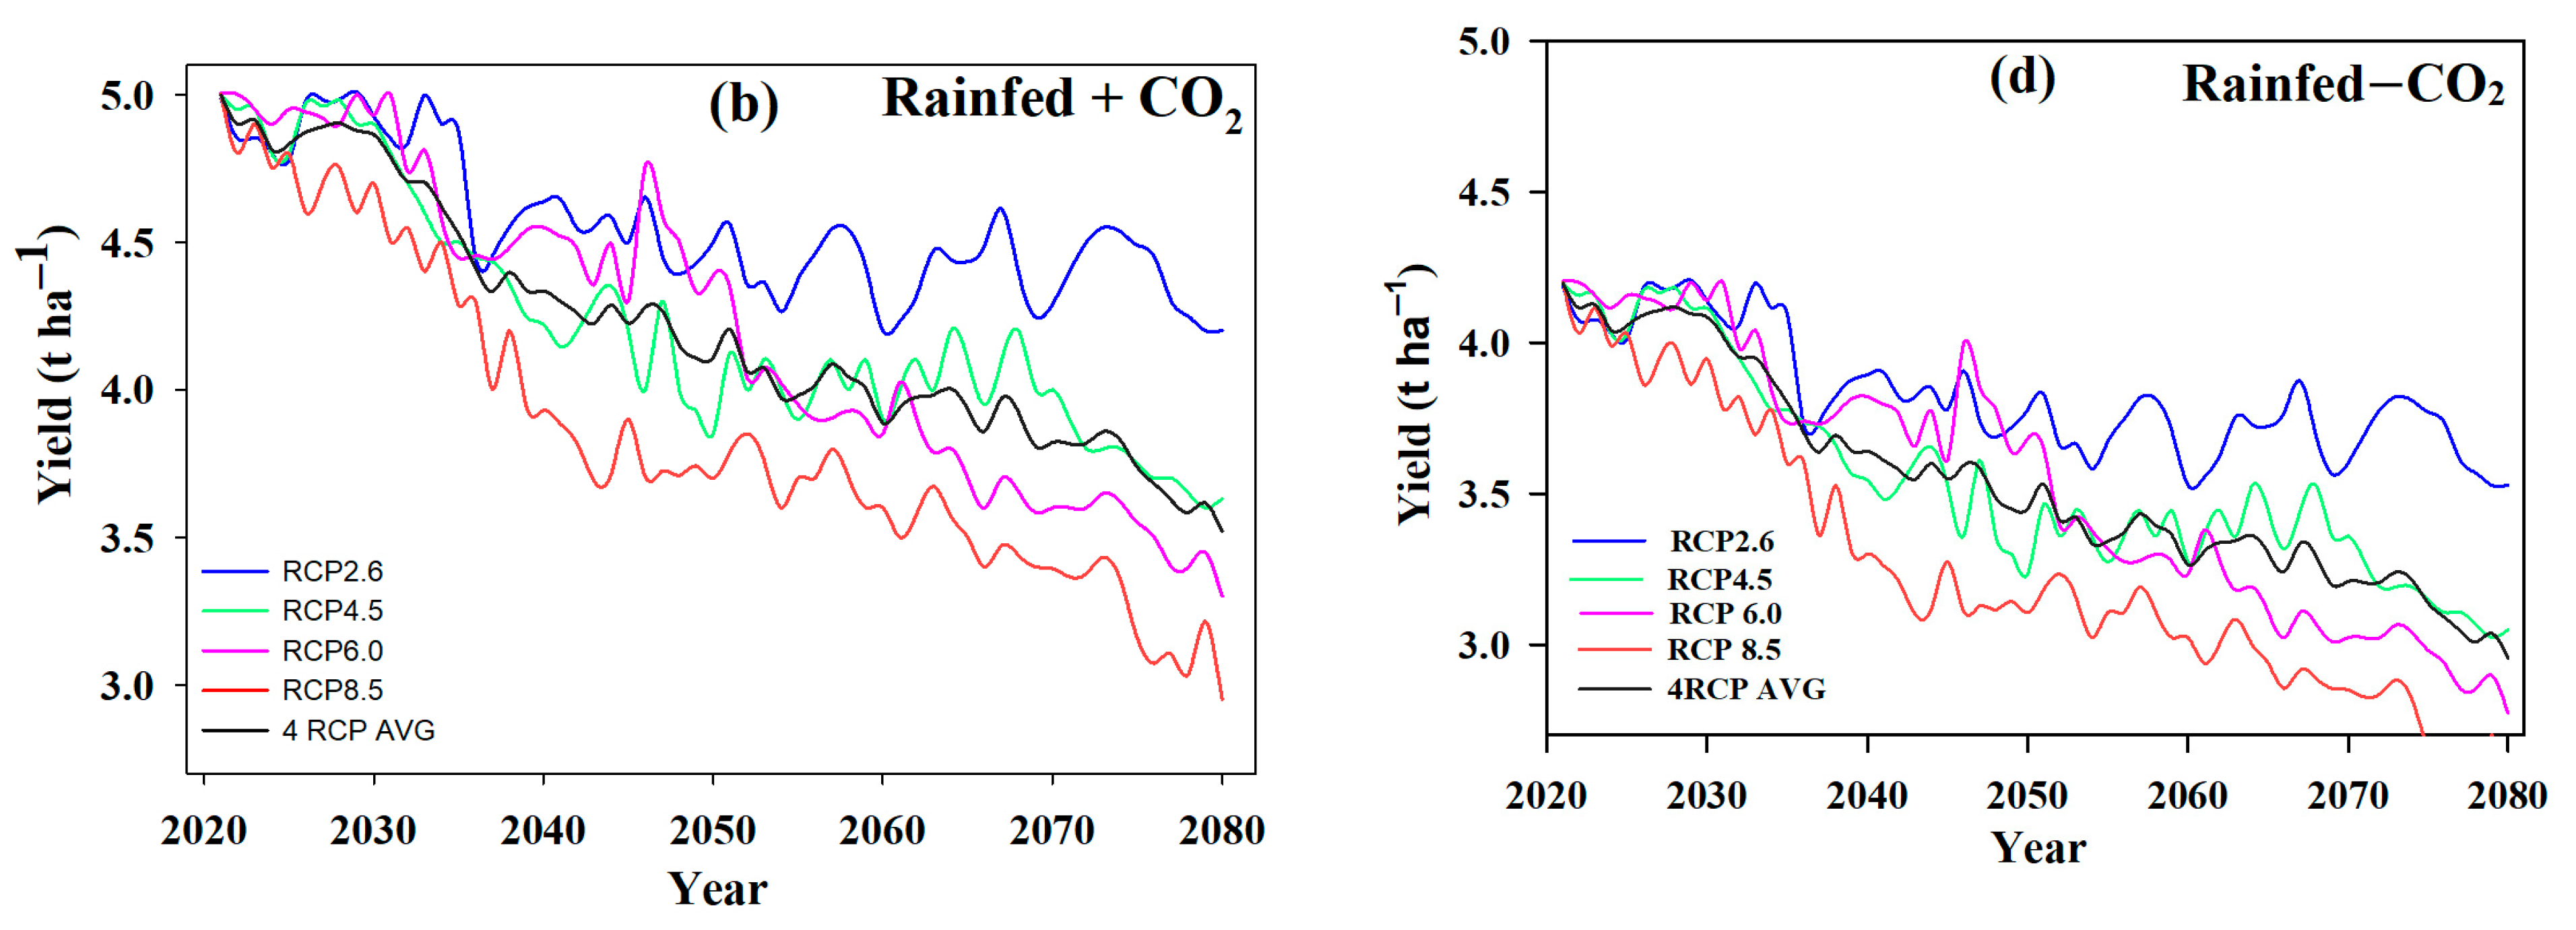
3.3. Temporal Evolution of Maize Yield, ET, and WUE under Future Climate Change Scenarios

During 2021–2080, the simulated irrigated and rainfed maize yields with CO2 fertilization fluctuate and are steadily decreasing, with an average coefficient of variation of 5.93%, 10.87%, 14.86%, 21.46%, and 12.56% in the respective RCP2.6, RCP4.5, RCP6.0, RCP8.5, and 4RCP average scenarios (Figure 5a,b) and, similarly, without CO2 fertilization, the yields are steadily decreasing, with an average coefficient of variation of 5.84%, 10.71%, 14.65%, 21.19%, and 12.37% in the respective RCP2.6, RCP4.5, RCP6.0, RCP8.5, and 4RCP average scenarios (Figure 5c,d).
The simulated irrigated and rainfed evapotranspiration with CO2 fertilization in all scenarios varies, ranging from 485 to 320 mm, 480 to 312 mm, 483 to 306 mm, 475 to 299 mm, and 476 to 311 mm, with the CV from 1.23% to 1.96%, 1.77% to 2.55%, 3.81% to 3.05%, 4.51% to 2.95%, and 2.63% to 1.75% for RCP2.6, RCP4.5, RCP6.0, RCP8.5, and the average of the four RCPs, respectively, during the years 2021–2080 (Figure 6a,b). Without the fertilization of CO2, the simulated irrigated ET varies, ranging from 487 to 336 mm, 480 to 330 mm, 482 to 324 mm, 475 to 318 mm, and 481 to 327 mm, with CV 1.20% to 0.98%, 2.54% to 1.75%, 3.78% to 3.02%, 4.51% to 2.95%, and 2.64% to 1.98% for the RCP2.6, RCP4.5, RCP6.0, RCP8.5, and 4RCP average scenarios, respectively, during the years 2021–2080 (Figure 6c,d).
The simulated irrigated and rainfed WUE with CO2 fertilization in all scenarios varies, ranging from 15.0 to 12.0 kg ha−1 mm−1, 15.0 to 11.5 kg ha−1 mm−1, 14.9 to 10.6 kg ha−1 mm−1, 14.1 to 7.6 kg ha−1 mm−1, and 14.5 to 10.4 kg ha−1 mm−1, with CV 5.49% to 4.6%, 9.9% to 8.47%, 11.42% to 10.9%, 17.51% to 7.8%, and 10.18% for RCP2.6, RCP4.5, RCP6.0, RCP8.5, and the average of the four RCPs, respectively, during the years 2021–2080 (Figure 7a,b). Fertilization without CO2-simulated irrigated and rainfed WUE varies, ranging from 13.9 to 10.5 kg ha−1 mm−1, 13.5 to 9.2 kg ha−1 mm−1, 14.1 to 8.5 kg ha−1 mm−1, 13.4 to 7.2 kg ha−1 mm−1, and 13.7 to 9.9 kg ha−1 mm−1, with CV 5.14% to 4.70%, 8.0% to 7.8%, 11.3% to 9.9%, 17.4% to 11.1%, and 9.9% to 7.9% for the RCP2.6, RCP4.5, RCP6.0, RCP8.5, and 4RCP average scenarios, respectively, during the years 2021–2080 (Figure 7c,d).

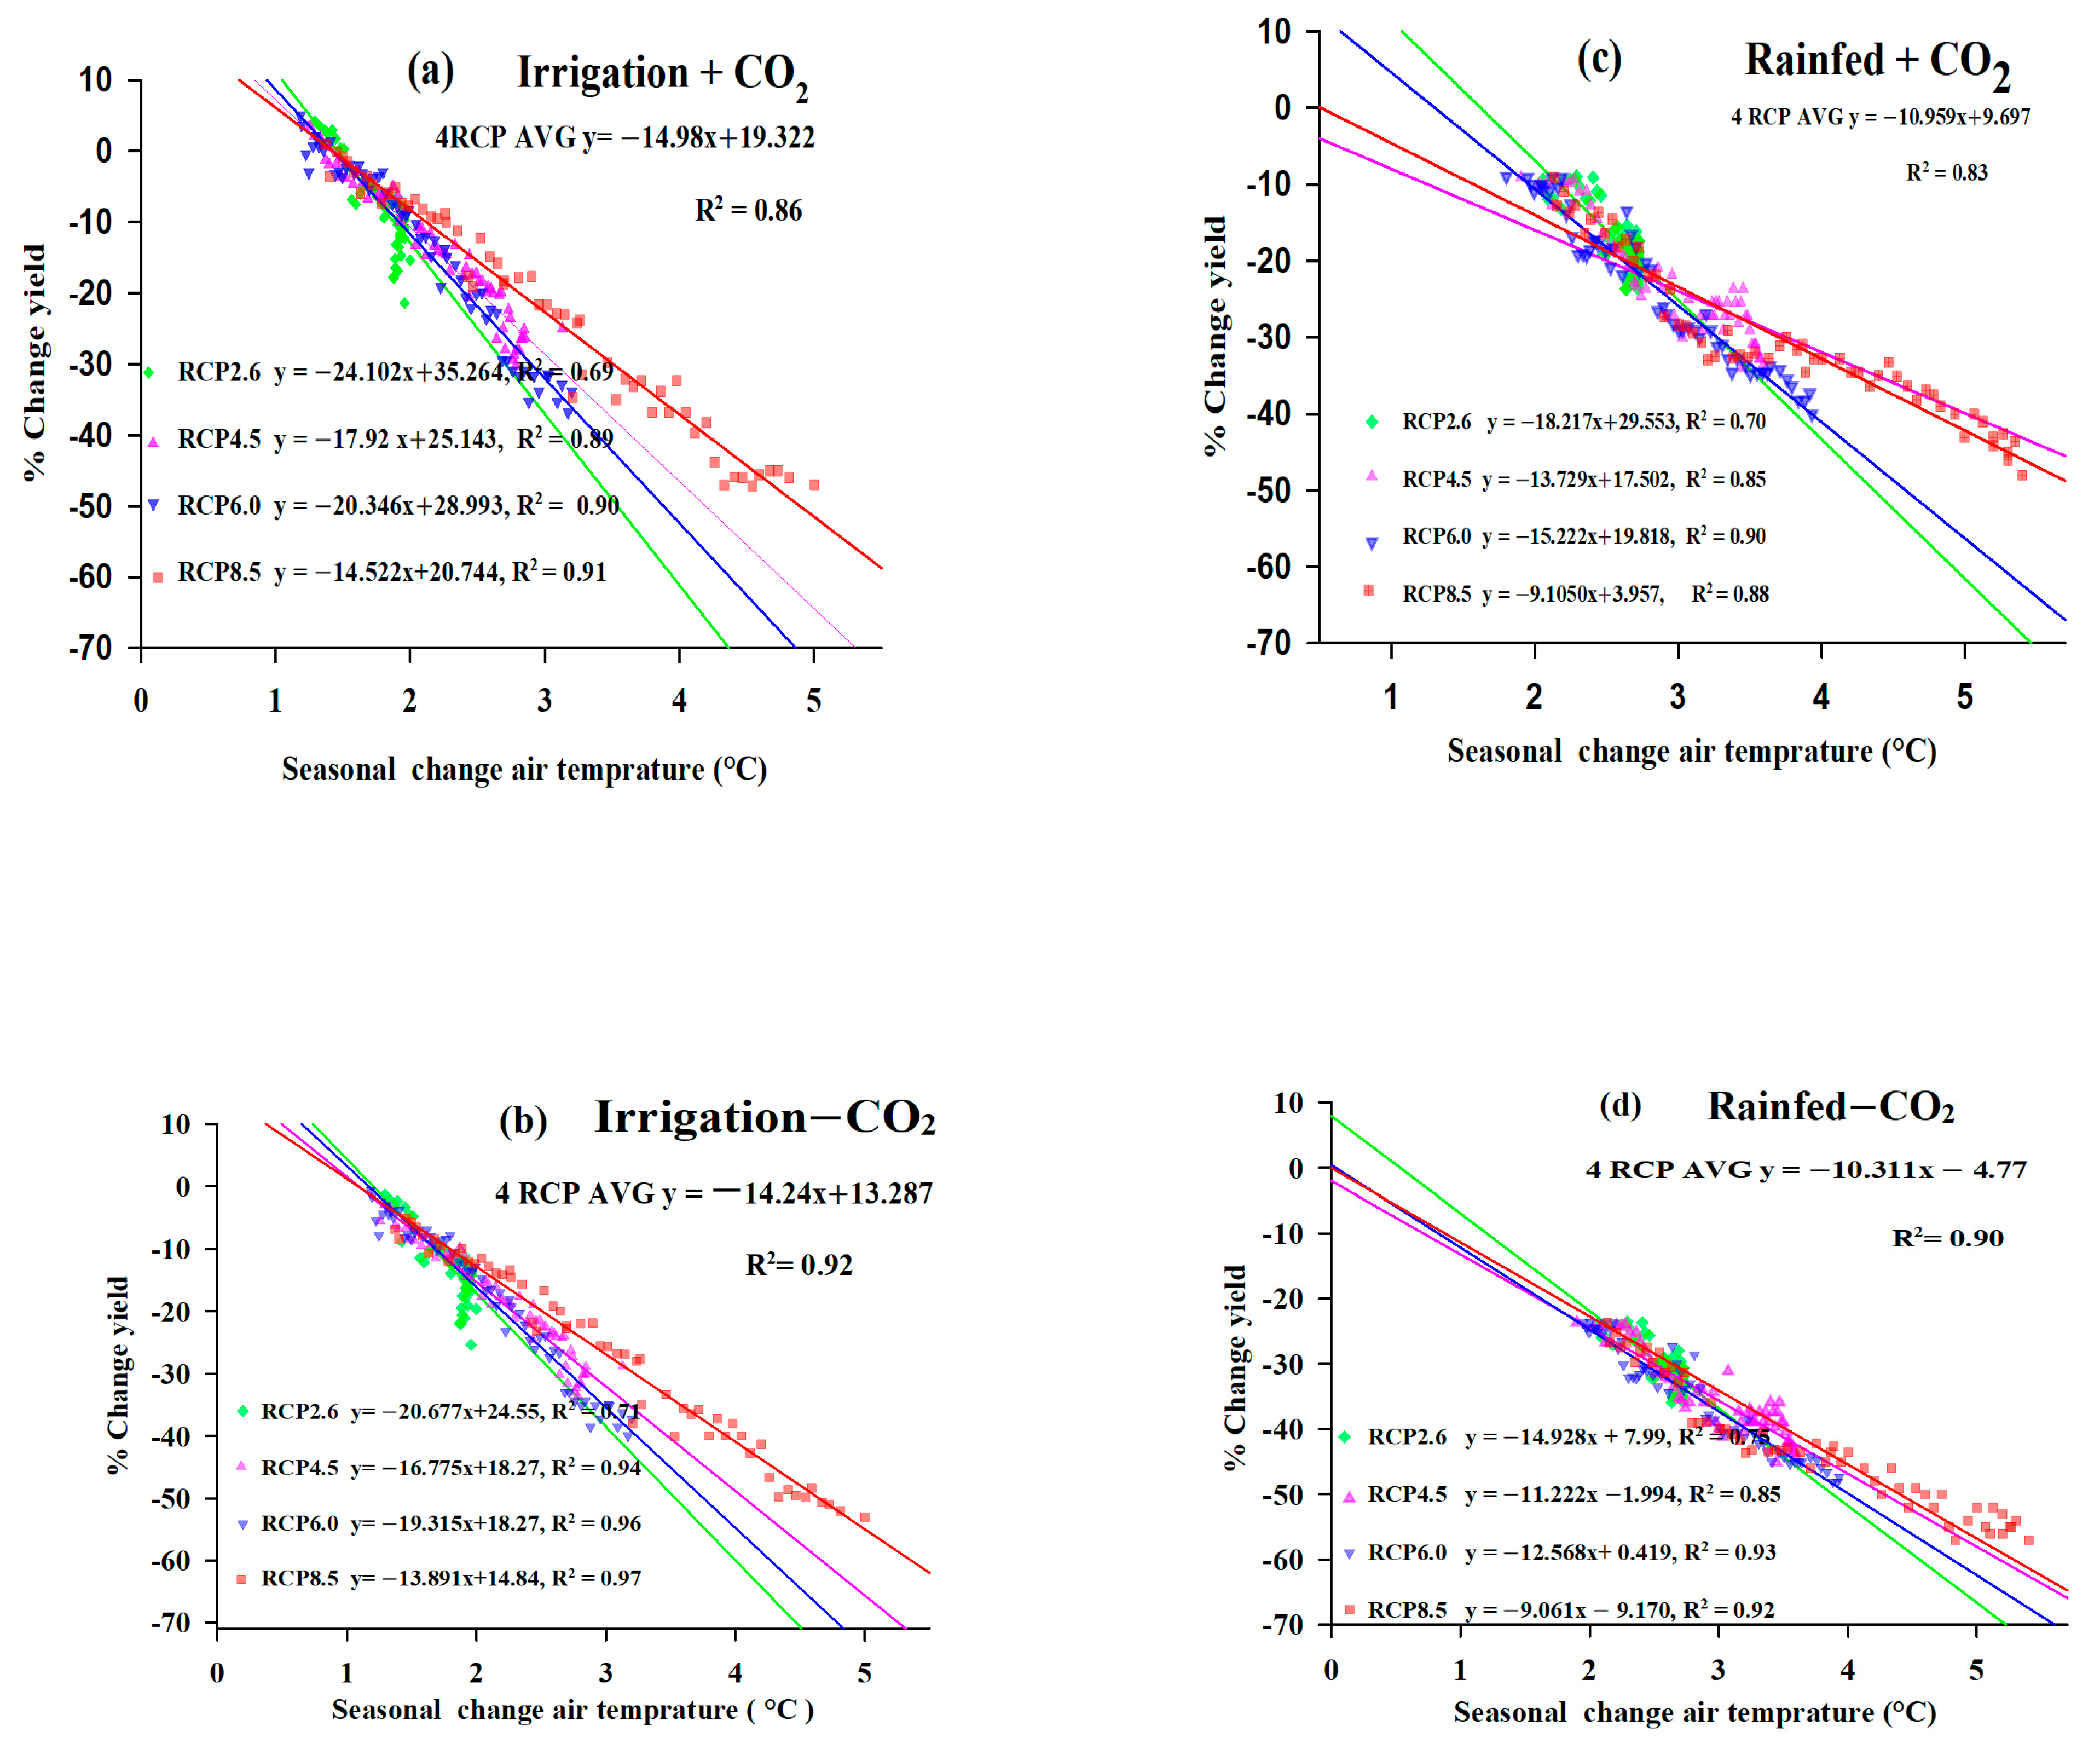
3.4. Relationship between Crop Yield and Temperature

We developed the regression relationship between the crop yields and seasonal changes in temperatures, as well as the projected increased CO2 concentrations during the years 2021–2080. With small temperature increases, as shown in Figure 8a–d, it is observed that, under the projected increased CO2 relative to the baseline CO2, the irrigated maize yields slightly increase from the baseline yield. When CO2 does not increase from the baseline CO2, then there is a reduction in the crop yields relative to the baseline yield under small increases in the temperature. For example, when the minimum changes in the seasonal temperature were 1.28 °C, 1.25 °C, 1.17 °C, and 1.37 °C with increased CO2 from 350 to 450 ppm, the changes in the irrigated maize crop yields were 4.2%, 3.5%, 5%, and 1%, respectively, under RCP2.6, RCP4.5, RCP6.0, and RCP8.5 during the years 2021–2080 (Figure 8a). However, with the same changes in temperature, but without increased CO2, the change in the crop yields showed small reductions of −1.3%, −4.9%, −0.56%, and −5.8% compared to the baseline (Figure 8b). At the maximum changes in the seasonal temperature of 1.88 °C, 3.12 °C, 3.2 °C, and 5.0 °C, the percent changes in the irrigated crop yields with increased CO2 were −17.0%, −25.0%, −33.8%, and −47%, respectively, under the RCP2.6, RCP4.5, RCP6.0, and RCP8.5 scenarios during the years 2021–2080. Similarly, in rainfed maize yields, with increased CO2 at the minimum changes in the seasonal temperature of 2.0 °C, 1.9 °C, 1.8 °C, and 2.1 °C, the percentage changes in the yields relative to the baseline yield were −9.3%, −9.0%, −8.9%, and −9.0%, respectively, under the RCP2.6, RCP4.5, RCP6.0, and RCP8.5 scenarios during the years 2021–2080 (Figure 8c). While, without an increased CO2 from the baseline CO2 and with the same changes in the seasonal temperature, the percentage changes in the yields were −22.8%, −22.4%, −22.3, and −23.63% in RCP2.6, RCP4.5, RCP6.0, and RCP8.5 during the years 2021–2080, respectively (Figure 8d). At the maximum changes in the seasonal temperature of 2.6 °C, 3.4 °C, 3.9 °C, and 5.4 °C, the percent changes in the rainfed yields with increased CO2 were −23.6%, −34%, −40%, and −48% under the RCP2.6, RCP4.5, RCP6.0, and RCP8.5 scenarios, respectively.

4. Discussion

4.1. Prospective Climate Anomalies in Shaanxi

Agricultural systems directly respond to climatic variables (precipitation, temperature, and solar radiation). Research based on the prospective spatial and temporal evolutions of climate variables and evapotranspiration can allow for directing basic information for the management of agriculture yields and assist in the adaptation actions of changing climate conditions. In recent years, the climate conditions in most parts of Shaanxi Province are changing, and studies on the aspects of the climate changes in Shaanxi Province have become a major issue of focus for many researchers.
The climate change results were in agreement with the findings of Zhao et al. [47,48], who stated that the temperature of this study area was on the increase under prospective changing climate scenarios. In the South region, the precipitation was higher than the North region, and this is in-line with the findings of Zhao et al. [47]. The ascending trend in precipitation was observed in all scenarios, which was in-line with the findings reported by Cao et al. [49].

4.2. Impact of Climate Change on Maize Yield

In this study, we evaluated the crop yields with projected climate variables (precipitation, temperature, and solar radiation). With projected changes in the climatic conditions, it is necessary to quantify the impact of the climate changes on the crop yields for the sustainability of agricultural systems and adaptations to changing climate conditions. Therefore, it is essential to identify the changing climate conditions that are favorable or not for agriculture yields. The crop yields strongly correlated with temperature, precipitation, and increases in the CO2 concentration. The climate conditions in this study area were projected to vary with the passage of time under the RCP2.6, RCP4.5, RCP6.0, and RCP8.5 scenarios.

4.2.1. Effects of RCP on Yields under Irrigated and Rainfed Conditions

In RCP8.5, the increase in temperature was higher than that of other RCP scenarios during the years 2021–2080. Irrigated and rainfed Maize yields in RCP8.5 dramatically decreased during the years 2065–2080 due to strong increases in the seasonal temperatures relative to the baseline temperature. In RCP2.6, the decrease in the maize yields was lower during the years 2065–2080 due to changes in the seasonal temperatures being lower compared to the other RCP scenarios. From the results, it is clear that future climate changes have negative effects on maize yields, as previously described by Zhao et al. [30]. Our findings showed that the average maize yield declined by 9% in response to a 1 °C increase in temperature, which is greater than previously reported for the 21st century [50]. In contrast, our yield reduction results are lower than those obtained by Schlenker and Roberts [51], who predicted maize yields to decrease 20–30% by 2020–2049 and 45–80% by 2070–2099.

4.2.2. Comparison of CO2 Effect on Yields under Irrigated and Rainfed Conditions

Elevated CO2 are slightly favorable for maize crops to increase the maize yields by offsetting the negative effects of temperature on the maize yields, which was consistent with earlier studies [52]. In our study, the investigation of CO2 fertilization was carried out on irrigated and rainfed maize crops, and we found that yield improvements by CO2 fertilization were lower under irrigated than rainfed conditions, and they were lower as previously discussed in another research work (Twine et al., 2013). Increases in the CO2 concentration increased the yields significantly only when water was a yield-limiting factor. In other words, an increase of CO2 did not significantly contribute to yield promotions under optimum water supplies, which is consistent with previous studies [8,53]. The results of this study clearly indicated that greater rainfed yields increased due to increased CO2 concentrations when a rainfall deficit condition was projected under the future climate conditions. Our comprehensive analysis showed that elevated CO2 compensates the negative effects of future temperatures on the maize yields and minimizes the yield losses, while the projected maize yields remained below the baseline yield with and without CO2 fertilization. However, the extent to which it is possible that the maize-growing period will be reduced and the crops will face early maturity due to future climate changes, which are consistent with the previous studies [52], it can be inferred that the temperature-driven reductions in crop-growing seasons may decrease the grain weight in the absence of CO2 fertilization, ultimately leading to reduced yields. In addition, it seems that future temperatures are a sever risk for maize yields, which is already highlighted in some parts of the world [54]. However, agriculture yields effects, in response to variations in temperatures around the world, need some mitigation to offset the negative effects of temperature on the crops. These temperature affects are also different for regions and crops and may need urgent employing of adaptation strategies (planting, irrigation, and cultivar) at the regional scale to cope with the negative effects of temperature on maize yields.

4.3. Effects of RCP on ET and WUE under Irrigated and Rainfed Conditions

In RCP2.6, the increase in temperature was lower than that of other RCP scenarios during the years 2021–2080. The irrigated and rainfed WUE in RCP2.6 dramatically increased during the years 2021–2080 due to higher yields obtained and being lower in seasonal temperatures relative to the baseline temperature. In RCP8.5, the decrease in maize yields was higher during the years 2021–2080 due to changes in the seasonal temperatures, and the ET was higher compared to the other RCP scenarios. From these results, it is clear that future climate changes have negative effects on maize yields and the ET.

4.4. Comparison of CO2 Effects on ET and WUE under Irrigated and Rainfed Conditions

This study examined that the evapotranspiration decreased with the CO2 fertilization and vice versa, as discussed in a previous study [55]. The irrigated and rainfed evapotranspiration in this region decreased by 6% and 10%, respectively, in response to elevated CO2, which is consistent with the range value for maize crops [56]. In our study, the rainfed evapotranspiration was decreased larger than the irrigated evapotranspiration; this reduction occurred due to less opening of the stomata during the crop-growing season under limited amounts of water or soil moisture deficits [32,56,57]. Globally, increased level of CO2 lead to reduced ET and increased soil moisture storage beneficial for crop yields and the WUE [58,59]. The WUE will increase with considering the fertilization of CO2 and vice versa under without the fertilization of CO2. This is important, because there is raise in photosynthesis, and CO2 fertilization has an effect on the water use efficiency [60,61,62]. This study’s findings showed that the increase in the WUE is greater than as previous discussed for maize crops [52]. Overall, these findings are in accordance with findings reported by [63], who stated that the water use efficiency increased with the elevated CO2.

5. Conclusion and Future Implications

The evaluation of maize crop yields and water use efficiencies were studied by combining the predicted climate change variables and CERES-Maize model. The CERES-Maize crop model seemed to perform well for the crop yields, water use efficiency, and evapotranspiration of the maize at the annual and decadal levels based on four climate change scenarios, i.e., RCP2.6, RCP4.5, RCP6.0, and RCP8.5. This study showed that future maize yields negatively correlated with increased temperatures in Shaanxi Province. With an average 1 °C increase in the temperature, the maize yields decreased by 9%. However, elevated CO2 concentrations reduced the severe effects of temperatures on the maize yields. In response to CO2 fertilization, the average increases in the maize yield per decade were 6%, 5.5%, 5%, and 4.5%, respectively, under all scenarios compared to without CO2 fertilization. While the elevated CO2 concentration effects on the rainfed maize had larger positive impacts on the maize yields than the irrigated maize.
The fertilization with CO2 can bring about a positive effect on the evapotranspiration and water use efficiency. The average evapotranspiration and water use efficiency are expected to improve by 6–9% and 5–13%, respectively, with the increased temperatures and elevated CO2 compared to without CO2 fertilization. With the fertilization without CO2 and the increased temperature being considered, the water use efficiency will drop about −5.1% to −10.5% relative to the baseline WUE.
This study reported that future climate changes will affect maize yields. It is necessary to suggest suitable adaptations in order to offset the negative effects of climate changes on maize yields. For example, shifting the sowing date, changing the planting geometry and planting density, heat and drought-resilient genotypes, and changes in irrigation scheduling have the potential to reduce the negative impacts of future climates and may be adopted at farmer fields for sustainable maize yields. Hence, an adaptation study should be conducted to determine the scope of specific adaptations and their combinations to offset the negative effects of temperature on crop yields.

Supplementary Materials

The following are available online at https://www.mdpi.com/2073-4433/11/8/843/s1, Figure S1: Model performance during calibration for maize grain yield, Figure S2: Evaluation results of yield between observed and simulated at experimental fields, Figure S3: Evaluation results of yield between observed and simulated at farmer fields, Figure S4: Spatial and temporal evolution of the climate parameters during 2021–2080; Seasonal Change in: (a) Precipitation (%) (b)Temperature (°C), (c) Solar radiation (MJ m−2/ month), Table S1: Irrigation scheduling based on ET (mm) during 2012, 2013, 2014, and 2015 growing seasons at the experimental fields in Yangling, Table S2: Total irrigation amount (mm) applied during 2012, 2013, 2014, and 2015 growing seasons at the experimental field in Yangling, Table S3: CERES-Maize model calibrated coefficients of maize crop Wuke-02 (a) for experiments, and Zhong dan-02 (b) for farmer field in 2010, 2011, 2012, 2013 and 2014, Table S4: CERES-Maize model results between simulated and observed data of full irrigation Table 2010. 2011 and 2012.

Author Contributions

Q.S., M.I.K., M.H.u.R., M.W., and H.C. contributed to the manuscript in terms of model development, calibration, simulation, and integration with the GCM and manuscript writing and are responsible for the model simulation results. X.J., T.G., M.M.W., I.A., L.C., and H.C. contributed to proofreading and manuscript modification. Q.S., T.G., M.H.u.R., M.W., and H.C. did the manuscript final review. All authors have read and agreed to the published version of the manuscript.

Funding

The APC was funded by the Open Access Department, University of Rostock. This research was jointly supported by the National Key Research and Development Program of China (2016YFC0400201), the National Science Foundation of China (no. 51179162), and the Program of Introducing Talents of Discipline to Universities, China (B12007) and Chinese Government Postdoctoral Funding.

Conflicts of Interest

The authors declare no conflict of interest.

References

  1. Intergovernmental Panel on Climate Change (IPCC). Climate Change 2014: Synthesis Report. In Contribution of Working Groups I, II and III to the Fifth Assessment Report of the Intergovernmental Panel on Climate Change; Pachauri, R.K., Meyer, L.A., Eds.; IPCC: Geneva, Switzerland, 2014. [Google Scholar]
  2. Awais, M.; Wajid, A.; Saleem, M.F. Potential impacts of climate change and adaptation strategies for sunflower in Pakistan. Environ. Sci. Pollut. Res. 2018, 25, 13719–13730. [Google Scholar] [CrossRef] [PubMed]
  3. Lobell, D.B.; Schlenker, W.; Costa-Roberts, J. Climate trends and global crop production since 1980. Science 2011, 333, 616–620. [Google Scholar] [CrossRef] [PubMed] [Green Version]
  4. Rahimi-Moghaddam, S.; Kambouzia, J.; Deihimfard, R. Adaptation strategies to lessen negative impact of climate change on grain maize under hot climatic conditions: A model-based assessment. Agric. Forest Meteor. 2018, 253–254, 1–14. [Google Scholar] [CrossRef]
  5. Hatfield, J.L.; Boote, K.J.; Kimball, B.A.; Ziska, L.H.; Izaurralde, R.C.; Ort, D.; Thomson, A.M.; Wolfe, D. Climate impacts on agriculture: Implications for crop production. Agron. J. 2011, 103, 351–370. [Google Scholar] [CrossRef] [Green Version]
  6. Pongratz, J.; Lobell, D.B.; Cao, L.; Caldeira, K. Crop yields in a geo engineered climate. Nat. Clim. Change 2012, 2, 101–105. [Google Scholar] [CrossRef]
  7. Singh, P.; Nedumaran, S.; Ntare, B.R.; Boote, K.J.; Singh, N.P.; Srinivas, K.; Bantilan, M.C.S. Potential benefits of drought and heat tolerance in groundnut for adaptation to climate change in India and West Africa. Mitig. Adapt. Strateg. Glob. Chang. 2014, 19, 509–529. [Google Scholar] [CrossRef]
  8. Allen , L.H., Jr.; Kakani, V.G.; Vu, J.C.V.; Boote, K.J. Elevated CO2 increases water use efficiency by sustaining photosynthesis of water-limited maize and sorghum. J. Plant Physiol. 2011, 168, 1909–1918. [Google Scholar]
  9. World Agriculture towards 2030/2050 the 2012 Revision. Available online: https://ageconsearch.umn.edu/record/288998/ (accessed on 15 April 2018).
  10. Food and Nutrition in Numbers 2014. Available online: http://www.fao.org/publications/card/en/c/9f31999d-be2d-4f20-a645-a849dd84a03e/ (accessed on 15 April 2018).
  11. Meng, E.C.H.; Hu, R.; Shi, X.; Zhang, S. Maize in China: Production Systems, Constraints, and Research Priorities; CIMMYT: Mexico City, Mexico, 2006. [Google Scholar]
  12. Tao, F.; Yokozawa, M.; Liu, J.; Zhang, Z. Climate crop yield relationships at provincial scales in China and the impacts of recent climate trends. Clim. Res. 2008, 38, 83–94. [Google Scholar] [CrossRef]
  13. Wang, J.X.; Huang, J.K.; Yang, J. Overview of impacts of climate change and adaptation in china agriculture. J. Integr. Agric. 2014, 13, 1–17. [Google Scholar] [CrossRef]
  14. Saddique, Q.; Liu, D.L.; Wang, B.; Feng, P.; He, J.; Ajaz, A.; Ji, J.; Xu, J.; Zhang, C.; Cai, H. Modelling future climate change impacts on winter wheat yield and water use: A case study in Guanzhong Plain, northwestern China. Eur. J. Agron. 2020, 119, 126113. [Google Scholar] [CrossRef]
  15. Cortes, A.J.; Monserrate, F.A.; Ramírez, V.J. Drought tolerance in wild plant populations: The case of common beans (Phaseolus vulgaris L.). PLoS ONE 2013, 8, e62898. [Google Scholar] [CrossRef]
  16. Jones, P.; Thornton, P. The potential impacts of climate change on maize production in Africa and Latin America in 2055. Glob. Environ. Chang. 2003, 13, 51–59. [Google Scholar] [CrossRef]
  17. Hoogenboom, G.; Jones, J.W.; Wilkens, P.W.; Porter, C.H.; Boote, K.J.; Hunt, L.A.; Singh, U.; Lizaso, J.L.; White, J.W.; Uryasev, O. Decision Support System for Agrotechnology Transfer (DSSAT); DSSAT Foundation: Prosser, WA, USA, 2015. [Google Scholar]
  18. Hoogenboom, G.; Porter, C.H.; Shelia, V.; Boote, K.J.; Singh, U.; White, J.W.; Hunt, L.A.; Ogoshi, R.; Lizaso, J.I.; Koo, J.; et al. Decision Support System for Agrotechnology Transfer (DSSAT); DSSAT Foundation: Gainesville, FL, USA, 2019. [Google Scholar]
  19. Pirttioja, N.; Carter, T.R.; Fronzek, S. A crop model ensemble analysis of temperature and precipitation effects on wheat yield across a European transect using impact response surfaces. Clim. Res. 2015, 65, 87–105. [Google Scholar] [CrossRef] [Green Version]
  20. Challinor, A.J.; Watson, J.; Lobell, D.B.; Howden, S.M.; Smith, D.R.; Chhetri, N. A meta-analysis of crop yield under climate change and adaptation. Nat. Clim. Chang. 2014, 4, 287–291. [Google Scholar] [CrossRef]
  21. Dixit, P.N.; Telleria, R.; Khatibb, A.N.; Allouzi, S.F. Decadal analysis of impact of future climate on wheat production in dry Mediterranean environment: A case of Jordan. Sci. Total Environ. 2018, 610–611, 219–233. [Google Scholar] [CrossRef] [PubMed]
  22. Bregaglio, S.; Hossard, L.; Cappelli, G.; Resmondb, R.; Bocchic, S.; Barbierb, J.; Rugetd, F.; Delmotteb, S. Identifying trends and associated uncertainties in potential rice production under climate change in Mediterranean areas. Agric. Forest Meterol. 2017, 237, 219–232. [Google Scholar] [CrossRef]
  23. Rahman, M.H.U.; Ahmad, A.; Wajid, A.; Hussain, M.; Rasul, F.; Ishaque, W.; Islam, M.A.; Shelia, V.; Awais, M.; Ullah, A.; et al. Application of CSM-CROPGRO-cotton model for cultivars and optimum planting dates: Evaluation in changing semi-arid climate. Field Crop. Res. 2019, 238, 139–152. [Google Scholar] [CrossRef]
  24. Rahman, M.H.U.; Ahmad, A.; Wang, X.; Wajid, A.; Nasim, W.; Hussain, M.; Ahmad, B.; Ahmad, I.; Ali, Z.; Ishaque, W.; et al. Multi-model projections of future climate and climate change impacts uncertainty assessment for cotton production in Pakistan. Agric. Forest Meterol. 2018, 253–254, 94–113. [Google Scholar] [CrossRef]
  25. IPCC. A report of working group one of the intergovernmental panel on climate change-summary for policy makers. In Intergovernmental Panel on Climate Change; IPCC: Geneva, Switzerland, 2007. [Google Scholar]
  26. Collins, M.; Knutti, R.; Arblaster, J.; Dufresne, J.-L.; Fichefet, T.; Friedlingstein, P.; Gao, X.; Gutowski, W.J.; Johns, T.; Krinner, G.; et al. Long-term Climate Change: Projections, Commitments and Irreversibility. In Climate Change 2013: The Physical Science Basis. Contribution of Working Group I to the Fifth Assessment Report of the Intergovernmental Panel on Climate Change; Stocker, T.F., Qin, D., Plattner, G.-K., Tignor, M., Allen, S.K., Boschung, J., Nauels, A., Xia, Y., Bex, V., Midgley, P.M., Eds.; Cambridge University Press: Cambridge, UK; New York, NY, USA, 2013. [Google Scholar]
  27. Khan, M.I.; Liu, D.; Fu, Q.; Dong, S.; Liaqat, U.W.; Faiz, M.A.; Hu, Y.; Saddique, Q. Recent climate trends and drought behavioral assessment based on precipitation and temperature data series in the Songhua River basin of China. Water Resour. Manag. 2016, 30, 4839–4859. [Google Scholar] [CrossRef]
  28. Piao, S.; Ciais, P.; Huang, Y.; Shen, Z.; Peng, S.; Li, J.; Zhou, L.; Liu, H.; Ma, Y.; Ding, Y.; et al. The impacts of climate change on water resources and agriculture in China. Nature 2010, 467, 43–51. [Google Scholar] [CrossRef]
  29. Ray, D.K.; Gerber, J.S.; MacDonald, G.K.; West, P.C. Climate variation explains a third of global crop yield variability. Nat. Commun. 2015, 6, 5989. [Google Scholar] [CrossRef] [PubMed] [Green Version]
  30. Zhao, C.; Liu, B.; Piao, S.; Wang, X.; Lobell, D.B.; Huang, Y.; Huang, M.; Yao, Y.; Bassu, S.; Cias, P. Temperature increase reduces global yields of major crops in four independent estimates. Proc. Natl. Acad. Sci. USA 2017, 14, 9326–9331. [Google Scholar] [CrossRef] [PubMed] [Green Version]
  31. Awal, R.; Fare, A.; Bayabil, H. Assessing Potential Climate Change Impacts on Irrigation Requirements of Major Crops in the Brazos Headwaters Basin, Texas. Water 2018, 10, 1610. [Google Scholar] [CrossRef] [Green Version]
  32. Twine, T.E.; Bryant, J.J.; Richter, K.T.; Bernacchi, C.J.; McConnaughay, K.D.; Morris, S.J.; Leakey, A.D.B. Impacts of elevated CO2 concentration on the productivity and surfaceenergy budget of the soybean and maize agroecosystem in the Midwest USA. Global Change Biol. 2013, 19, 2838–2852. [Google Scholar] [CrossRef] [Green Version]
  33. Shaanxi Agriculture Institute of Engineering Investigations and Design (SAIEID). Agricultural Soil in Shaanxi; Shaanxi Science and Technology Press: Beijing, China, 1982; pp. 74–83. (In Chinese) [Google Scholar]
  34. Zhu, X.M. Lou Soil; Agricultural Press: Beijing, China, 1964; pp. 34–54. (In Chinese) [Google Scholar]
  35. Zheng, Z.; Cai, H.; Yu, L.; Hoogenboom, G. Application of the CSM–CERES–Wheat Model for Yield Prediction and Planting Date Evaluation at Guanzhong Plain in Northwest China. Agron. J. 2017, 109, 204–217. [Google Scholar] [CrossRef]
  36. Weather Simulation with MarkSim. Available online: http://www.ccafs-climate.org/pattern_scaling/. (accessed on 13 January 2018).
  37. Claessens, L.; Antle, J.M.; Stoorvogel, J.J.; Valdivia, R.O.; Thornton, P.K.; Herrero, M. A method for evaluating climate change adaptation strategies for small-scale farmers using survey, experimental and modeled data. Agric. Syst. 2012, 111, 85–95. [Google Scholar] [CrossRef] [Green Version]
  38. Anache, J.A.A.; Flanagan, D.C.; Srivastava, A.; Wendland, E.C. Land use and climate change impacts on runoff and soil erosion at the hillslope scale in the Brazilian Cerrado. Sci. Total Environ. 2018, 622–623, 140–151. [Google Scholar] [CrossRef]
  39. Nouri, M.; Homaee, M.; Bannayan, M.; Hoogenboom, G. Towards shifting planting date as an adaptation practice for rainfedwheat response to climate change. Agric. Water Manag. 2017, 186, 108–119. [Google Scholar] [CrossRef]
  40. Jones, J.W.; Hoogenboom, G.; Porter, C.H.; Boote, K.J.; Batchelor, W.D.; Hunt, L.A.; Wilkens, P.W.; Singh, U.; Gijsman, A.J.; Ritchie, J.L. The DSSAT cropping system model. Eur. J. Agron. 2003, 18, 235–265. [Google Scholar] [CrossRef]
  41. He, J.; Dukes, M.; Jones, J.; Graham, W.; Judge, J. Applying GLUE for estimating CERES-Maize genetic and soil parameters for sweet corn production. Trans. ASABE 2009, 52, 1907–1921. [Google Scholar] [CrossRef]
  42. Mavromatis, T.; Boote, K.; Jones, J.; Irmak, A.; Shinde, D.; Hoogenboom, G. Developing genetic coefficients for crop simulation models with data from crop performance trials. Crop. Sci. 2001, 41, 40–51. [Google Scholar] [CrossRef]
  43. Nalley, D.J.; Adamowski, B.; Khalil, B. Ozga-Zielinski, Trend detection in surface air temperature in Ontario and Quebec, Canada during 1967–2006 using the discrete wavelet transform. Atmos. Res. 2013, 132, 375–398. [Google Scholar] [CrossRef]
  44. Safeeq, M.A.; Mair, A. Fares, Temporal and spatial trends in air temperature on the Island of Oahu, Hawaii. Int. J. Climatol. 2013, 33, 2816–2835. [Google Scholar] [CrossRef]
  45. Tabari, H.B.S.; Somee, M.R. Zadeh, Testing for long-term trends in climatic variables in Iran. Atmos. Res. 2011, 100, 132–140. [Google Scholar] [CrossRef]
  46. Salmi, T.A.; Määttä, P.; Anttila, T.; Ruoho-Airola, T. Amnell. In Air Quality No. 31, Report code FMI-AQ-31; Finnish Meteorological Institute: Helsinki, Finland, 2002; p. 35. [Google Scholar]
  47. Zhao, C.Y.; Nan, Z.R.; Cheng, G.D.; Zhou, S.B.; Zhang, Y.Z. Prediction of the trend of the future climate change in northwestern China by statistical downscaling. J. Lanzhou Univ. (Nat. Sci.) 2008, 44, 12–18. [Google Scholar]
  48. Zhao, C.; Li, Z.; Liu, W.Z. Projecting the potential changes of temperature in the Jinghe watershed using downscaling. J. Northwest. A&F Univ. (Nat. Sci. Ed.) 2013, 41, 227–234. [Google Scholar]
  49. Cao, Y.; Zhang, G.H.; Luo, R.T. Response of runoff and sediment discharge to global climate change in Jinghe River Basin. Sci. Soil Water Conserv. 2010, 8, 30–35. [Google Scholar]
  50. Xu, H.; Twine, T.E.; Girvetz, E. Climate Change and Maize Yield in Iowa. PLoS ONE 2016, 11, e0156083. [Google Scholar] [CrossRef]
  51. Schlenker, W.; Roberts, M.J. Nonlinear temperature effects indicate severe damages to U.S. crop yields under climate change. Proc. Natl. Acad. Sci. USA 2009, 106, 15594–15598. [Google Scholar] [CrossRef] [Green Version]
  52. Guo, R.; Lin, Z.; Mo, X.; Yang, C. Responses of crop yield and water use efficiency to climate change in the North China Plain. Agr. Water Manag. 2010, 97, 1185–1194. [Google Scholar] [CrossRef]
  53. Adaptation Measures for Maize and Soybean in Southeastern South America. AIACC Working Paper no. 28. Available online: www.aiaccproject.org/. (accessed on 14 June 2010).
  54. Ray, D.K.; Ramankutty, N.; Mueller, N.D.; West, P.C.; Foley, J.A. Recent patterns of crop yield growth and stagnation. Nat. Commun. 2012, 3, 1293. [Google Scholar] [CrossRef] [PubMed] [Green Version]
  55. Deryng, D.J.; Elliott, A.C.; Ruane, C.; Folberth, C.; Müller, T.A.M.; Pugh, E.; Schmid, K.J.; Boote, D.; Conway, D.; Gerten, J.W.; et al. Rosenzweig, Regional disparities in the beneficial effects of rising CO2 concentrations on crop water productivity. Nat. Clim. Change 2016, 6, 786–790. [Google Scholar] [CrossRef] [Green Version]
  56. Hussain, M.Z.; Vanloocke, A.; Siebers, M.H. Future carbon dioxide concentration decreases canopy evapotranspiration and soil water depletion by field-grown maize. Global Change Biol. 2013, 19, 1572–1584. [Google Scholar] [CrossRef] [PubMed]
  57. Durand, J.L.; Delusca, K.; Boote, K.; Lizaso, J.; Manderscheid, R.; Weigel, H.J.; Zhao, Z. How accurately do maize crop models simulate the interactions of atmospheric CO2 concentration levels with limited water supply on water use and yield? Eur. J. Agron. 2018, 100, 67–75. [Google Scholar] [CrossRef]
  58. Bunce, J.A. Limitations to soybean photosynthesis at elevated carbon dioxide in free-air enrichment and open top chamber systems. Plant Sci. 2014, 226, 131–135. [Google Scholar] [CrossRef] [PubMed]
  59. Markelz, R.J.C.; Strellner, R.S.; Leakey, A.D.B. Impairment of C4 photosynthesis by drought is exacerbated by limiting nitrogen and ameliorated by elevated CO2 in maize. J. Exp. Bot. 2011, 62, 3235–3246. [Google Scholar] [CrossRef] [Green Version]
  60. Leakey, A.D.B. Rising atmospheric carbon dioxide concentration and the future of C4 crops for food and fuel. Entomol. Soc. B 2009, 276, 2333–2343. [Google Scholar]
  61. Vanuytrecht, E.; Raes, D.; Willems, P. Quantifying field-scale effects of elevated carbon dioxide concentration on crops. Clim. Res. 2012, 54, 35–47. [Google Scholar] [CrossRef] [Green Version]
  62. Pugh, T.; Müller, C.; Arneth, A. Key knowledge and data gaps in modelling the influence of CO2 concentration on the terrestrial carbon sink. J. Plant Physiol. 2016, 203, 3–15. [Google Scholar] [CrossRef] [Green Version]
  63. Chen, Y.; Zhang, Z.; Tao, F. Impacts of climate change and climate extremes on major crops productivity in China at a global warming of 1.5 and 2.0. Earth Syst. Dynam. 2018, 9, 543–562. [Google Scholar] [CrossRef] [Green Version]
Figure 1. The geographical location of the maize crop sites of Shaanxi.
Atmosphere 11 00843 g001
Figure 2. Drawing of the large lysimeter structure installed in the experimental fields.
Atmosphere 11 00843 g002
Figure 3. Spatial and temporal evolutions of the climate parameters in the 2050s and 2080s. Seasonal (a) maximum temperature (°C), (b) minimum temperature (°C), (c) precipitation (mm), and (d) solar radiation (MJ m−2/ month). RCPs: representative concentration pathways.
Atmosphere 11 00843 g003aAtmosphere 11 00843 g003b
Figure 4. Spatial and temporal evolutions of (a,b) the yields with and without CO2 (t ha−1), (c,d) evapotranspiration (mm) with and without CO2, and the water use efficiency (Kg ha−1 mm−1) (e,f) with and without CO2 during the 2050s and 2080s.
Atmosphere 11 00843 g004aAtmosphere 11 00843 g004bAtmosphere 11 00843 g004c
Figure 5. Temporal evolutions of the maize crop yields, with and without increased CO2. (a) Irrigated + CO2 (b) Rainfed + CO2 (c) Irrigation − CO2 (d) Rainfed − CO2.
Atmosphere 11 00843 g005aAtmosphere 11 00843 g005b
Figure 6. Temporal evolutions of the maize crop evapotranspiration with and without increased CO2. (a) Irrigation + CO2 (b) Rainfed + CO2 (c) Irrigation − CO2 (d) Rainfed − CO2.
Atmosphere 11 00843 g006
Figure 7. Temporal evolutions of the maize crop water use efficiencies with and without increased CO2. (a) Irrigation + CO2 (b) Rainfed + CO2 (c) Irrigation − CO2 (d) Rainfed − CO2.
Atmosphere 11 00843 g007
Figure 8. Regression relationships between the temperature and changes in the average yields relative to the baseline yield during the years 2021–2080. (a) Irrigation + CO2 (b) Irrigation − CO2 (c) Irrigation + CO2 (d) Rainfed − CO2.
Atmosphere 11 00843 g008
Table 1. Detailed description of the general circulation models (GCMs) used in the study. Institutions from Jones (2013).
Sr No.ModelInstitutionsResolution, Lat.° × Long °
1BCC-CSM 1.1Beijing Climate Center, China Meteorological Administration, China2.8125 × 2.8125
2BCC-CSM 1.1(m)Beijing Climate Center, China Meteorological Administration, China2.8125 × 2.8125
3CSIRO-Mk3.6.0CSIRO and the Queensland Climate Change Center of Excellence, Australia1.8750 × 1.8750
4FIO-ESMThe First Institute of Oceanography, China2.8120 × 2.8120
5GFDL-CM3Geophysical Fluid Dynamics Laboratory, USA2.0 × 2.5
6GFDL-ESM2GGeophysical Fluid Dynamics Laboratory, USA2.0 × 2.5
7GFDL-ESM2MGeophysical Fluid Dynamics Laboratory, USA2.0 × 2.5
8GISS-E2-HNASA Goddard Institute for Space Studies, USA2.0 × 2.5
9GISS-E2-RNASA Goddard Institute for Space Studies, USA2.0 × 2.5
10HadGEM2-ESMet Office Hadley Centre, UK1.2414 × 1.8750
11IPSL-CM5A-LRInstitute Pierre-Simon Laplace, France1.8750 × 3.7500
12IPSL-CM5A-MRInstitute Pierre-Simon Laplace, France1.2587 × 2.5000
13MIROC-ESMAtmosphere and Ocean Research Institute, National Institute for Environmental Studies and Japan Agency for Marine Earth Science and Technology, Japan2.8125 × 2.8125
14MIROC-ESM-CHEMAtmosphere and Ocean Research Institute, National Institute for Environmental Studies and Japan Agency for Marine Earth Science and Technology, Japan2.8125 × 2.8125
15MIROC5Atmosphere and Ocean Research Institute, National Institute for Environmental Studies and Japan Agency for Marine Earth Science and Technology, Japan1.4063 × 1.4063
16MRI-CGCM3Meteorological Research Institute, Japan1.1250 × 1.1250
17NorESM1-MNorwegian Climate Centre, Norway1.8750 × 2.5000

