Article

Assessment of Soybean Evapotranspiration and Controlled Water Stress Using Traditional and Converted Evapotranspirometers

1
Georgikon Faculty, University of Pannonia, P.O. Box 71, H-8361 Keszthely, Hungary
2
Miki-Cho Post Office, P.O. Box 7, Kagawa-ken 761-0799, Japan
3
Agricultural Institute, Centre for Agricultural Research, 2462 Martonvásár, Hungary
4
Festetics Doctoral School, Georgikon Faculty, University of Pannonia, 8360 Keszthely, Hungary
*
Author to whom correspondence should be addressed.
Atmosphere 2020, 11(8), 830; https://doi.org/10.3390/atmos11080830
Submission received: 1 July 2020 / Revised: 29 July 2020 / Accepted: 31 July 2020 / Published: 6 August 2020

Abstract

:
Evapotranspiration (ETR), reference evapotranspiration (ET0), and seasonal ETR totals were determined for soybean over two growing seasons, at Keszthely, Hungary, using traditionally operated and converted evapotranspirometers. The study aimed to document the plant–water response of two soybean varieties (Sinara: Sin; Sigalia: Sig) which have different water demands. Three water supply treatments were tested: unlimited (WW) watering, 50% of crop water requirement (RO), and rainfed (P). Reconstructed evapotranspirometers allowed crop water deprivation to be simulated under field conditions. ETR sums were higher during the cooler 2017 than in the warmer 2018, calling attention to the importance of being informed about more detailed meteorological variables other than monthly (seasonal) means. In addition to variation in daily mean air temperatures (Ta), maximum Ta played a key role in determining ETR under naturally occurring extreme weather conditions in 2018. Irrespective of the variety, daily mean ETR was on average 65–75% greater than in the water-stress treatment. Unexpectedly, water stress-tolerant Sin used slightly more water than Sig, which was bred for standard weather conditions. Measured mean ETR was as much as 10% higher than derived ET0 rates, causing crop coefficient to exceed 1.0 during flowering. Careful selection of the soybean variety when practicing water-saving management may lead to more efficient variety improvement in a breeding program. It may also be important for soybean producers and farmers to adopt the best variety, aiming to decrease the use of irrigation water to increase seed yield.

Graphical Abstract

1. Introduction

In most soybean (Glycine max (L.) Merr.)-growing areas in temperate climatic zones, including Hungary, there is a need to meet nutritional and food demands locally. The import of soybean seed is very expensive, and due to the tropical origin of the crop, soybean growth requires irrigation in some years. Soybean is the world’s most important protein and oil source, and its use and consumption in food is recommended due to its high content of Ω6 and Ω3 fatty acids [1]. Soybean yield is strongly dependent on the genotype × environment interaction [2], but it is a crop that is resilient to saline environments, allowing for grain production under drought stress [3].
Soybean is not a dominant crop in Hungary, with a harvest area of 63,013 ha and accounting for less than 1% of the total crop-growing area in 2018, but it is of paramount importance as a fodder plant [4]. In Hungary, soybean is often grown under dry land conditions. Thuzar et al. (2010) [5] reported that 90% of the world’s soybean production occurs under rainfed conditions. Assuming that the increasing trend in the growth area in Hungary will continue, and due to a decline in amount and the uneven distribution of precipitation (PR) [6], the need for soybean irrigation will increase.
Water use efficiency (WUE) is a crucial indicator of a crop’s adaptation to drought. This parameter, at the seed level, refers to how much water is consumed throughout the process of yield accumulation [7]. Karam et al. (2005) [8] noted that the response of soybean (leaf area index (LAI) and dry matter accumulation) grown in Lebanon to water shortage depended on the timing of drought application, with crops compensating for missing water at the vegetative growth stage, but this ability was considerably reduced in the reproductive phase. SPAD (index of assessment of chlorophyll content) can also serve as a predictive selection marker for screening soybean varieties to water stress in field conditions [9]. Borhan et al. (2017) [10] identified a close relationship between chlorophyll content and SPAD readings by converting SPAD values from radiometric to solvent extracted chlorophyll units.
Solar radiation, air temperature (Ta), PR, air humidity and wind speed (u) are the most important meteorological variables impacting evapotranspiration rate (ETR) in soybean [11]. Vapor pressure deficit (VPD), the “driving force” behind evapotranspiration, is a critical weather element that controls transpiration via stomatal regulation. Pongrácz et al. (2014) [12] projected a significant decline in Hungary of about 10% in seasonal PR sums and more than a 1.5–2 °C increase in the mean temperature (Ta) of a growing season by 2100 that may adversely affect dominant dry land agricultural areas. The ratio of seasonal PR to corresponding reference evapotranspiration (ET0) was found to be about 0.5, allowing semi-arid climatic conditions to be identified. Furthermore, variation in monthly mean PR between 13.4 mm in 2017 and 101.2 mm in 2018 also represents high temporal variability in local PR. A decline in PR due to the possible local impact of global climate change in Hungary may threaten future water availability, even for irrigation. More attention should be paid to synchronize crop water demands with natural water resources.
To cope with the negative impacts of climate modification, two basic pieces of information are required, the crop’s water needs (relative to ETR), and the amount and distribution of PR. Within these two variables, only PR can be measured easily. Several methods of differing complexity exist to obtain ETR [13]. The most common methods employ the use of water and residual energy balance [14,15,16,17], Bowen ratio modelling [18,19], the use of a lysimeter [20], eddy covariance [7,21,22,23], or sap flow measurements [24]. There are several methods to obtain crop ETR, but theoretical and direct measurements are the two dominant basic procedures. Singer et al. (2010) [20] briefly summarized the most frequent methods used to determine ETR in soybean from the leaf scale to the canopy scale. ETR for soybean communicated in the literature vary greatly due to variable weather conditions (geographical location), varieties/cultivars, agronomic practices and methods used, with a wide range of daily mean ETR spanning from 2.54 ([20]; eddy-covariance; m (ECS) (Campbell Scientific, Inc., Logan, Utah, Ames, USA) to 5.3 mm day−1 ([17]; lysimeter; Troyer Enterprises, Inc., North Platte, Nebraska, USA). For this reason, local measurements are absolutely necessary. As one example, Kamkar et al. (2013) [25], using a high-yielding soybean cultivar DPX in Iran, evaluated the optimal WUE under eight irrigation conditions to provide the least loss in grain yield.
ETR plays a crucial role in energy and mass exchange. One of the aims of the current study was to obtain information about the determinants of field-grown soybean ETR. Comprehensive studies that integrate environmental impacts (weather) and crop traits on soybean ETR under field conditions are still uncommon in Hungary. To the best of our knowledge, only one previous report [26] exists in the literature that estimated ETR of water-stressed soybean by converting the mode of water supply in a compensation evapotranspirometer.
Several efforts were made to understand the crop–water relationship, but less attention was paid to local soybean varieties exposed to variable water supplies. Two selected varieties in the current study differed only in their water demands, thus allowing for a better identification of their behavior in response to different levels of watering. The current study permits a better understanding of the crop–water relationship that is required to generate more effective water use strategies in everyday irrigation, although additional breeding efforts are needed to generate new water stress-tolerant soybean varieties.
The main objectives of the current study were to: (1) compare the response of two soybean varieties with different water demands; (2) simulate water stress in the field using a specially converted compensation evapotranspirometer; (3) develop response factors (meteorological variables) for ETR. In addition to commonly used daily mean air temperature (Ta), the effect of maximum Ta on ETR was also emphasized.

2. Materials and Methods

2.1. Study Site and Agronomic Procedures

A field experiment was conducted at the Keszthely Agrometeorological Research Station (ARS) (latitude: 46°44′ N, longitude: 17°14′ E, elevation: 124 m above sea level), in Hungary, from April to September in 2017 and 2018, to investigate soybean ETR (Figure 1). Keszthely, which is located on the western edge of Lake Balaton, is a particularly vulnerable to climate change, and is expected to possess highly variable inter- and intra-annual Ta and PR. The ARS belongs to the University of Pannonia while the operation of the climate station is supervised by the National Meteorological Service.
Soybean growth was controlled following the best management practice prescribed by local specialists of the University of Pannonia (Georgikon Faculty, Keszthely). Two indeterminate soybean varieties, Sinara (Sin) and Sigalia (Sig), which differ exclusively in their water demands, were used. Sin is a water stress-tolerant variety while Sig was bred for “normal” weather conditions, as reported by the crop breeding institute of Karintia Ltd. (Sárvár, Hungary). These varieties were selected because they are widely used by Hungarian soybean farmers and have a similar length of growing cycle (115–120 days from sowing to maturity). Following recommended guidelines, before seeding, the experimental field of about 0.5 ha and growing pots of evapotranspirometers were tilled and fertilized with 300 kg of N, P, and K ha−1 (1:1:1, w/w) using commercial granular fertilizer (Kite Zrt, Nádudvar, Hungary). Weeds were controlled with pre-emergence herbicides (Dual Gold 960 EC; Syngenta) and hand weeding was performed when necessary. Due to a cool spring in 2017, seeds were sown on May 10. In 2018, sowing was earlier, on April 24. Plant density was 40 plant m−2 and inter-row spacing was 0.24 m. In the field, the density of the harvest population was estimated at 25,000–30,000 plants ha−1. Due to the fixed nature of the evapotranspirometer and requirements of the measuring towers, both varieties were sown in the field adjacent to the evapotranspirometers. The experimental field was divided into two sections with the two soybean varieties sown separately, at 50 m (width) × 60 m (length) for each variety (Figure 1).

2.2. Weather, Crop and Soil Characteristics

A QLC-50 climate station (Vaisala, Helsinki, Finland) equipped with a CM-3 pyranometer (Kipp & Zonen Corp., Delft, the Netherlands) was operated at ARS. The combined sensor was placed at a standard height of 2 m above the ground level. Signals from Ta, relative humidity (RH), wind speed (u), and global radiation (Rs) were collected every 2 sec, and 10 min averages were logged. The height of the anemometer was at 10.5 m above the ground level. These data were converted to 2 m when computing ET0.
Phenological developmental stages were continuously followed by using the Fehr and Caviness (1977) [27] scale in both growing seasons.
In weekly determination of leaf area, each green trifoliate leaf was placed on flat pieces of evenly colored red cardboard of known area, directly under a vertically mounted digital camera (Canon EOS 7D, Tokyo, Japan). Leaf area was determined photographically for five sample plants in each treatment. A histogram, based on the segmentation method, was applied in an image processing program (SGDIP 0.1, on-site designed) to count the area of region of interest [28]. The threshold point was set between the two peaks representing the background and the leaf area. Leaf-area index (LAI) was calculated as the ratio of leaf area divided by total ground area occupied by each plant. To study the distribution of leaflet size inside trifoliate leaves, LAImax was selected and evaluated when leaflet area was relatively invariable. This time period coincided with the peak of the growing season, from the end of July to the first 10 days of August. A high resolution photo of every leaflet from 10 plants was taken for each treatment. About 3000 leaflets per season were measured. At the same time, a SPAD-502 chlorophyll meter (Spectrum Technologies Inc., Plainfield, IL, USA) was applied to detect the “greenness” of individual leaflets. This device transmits light through a leaf at wavelengths of 650 and 940 nm. Any characteristic that alters the color of a crop (e.g., water shortage) may influence the value of SPAD readings. Ten replications were used for each treatment.
The soil type was a Ramann-type brown forest soil (clay loam; Haplic cambisol World Reference Base for Soil Resources 2015—WRB, 2006 [29]) with a mean bulk density of 1.15 Mg m−3 in the top 1 m of the profile and 273 mm m−1 of available water. The pots of the evapotranspirometer were also filled with the upper 0.9 m soil layer from the surroundings of the installed evapotranspirometers. Soil water was gravimetrically measured at 0.1 m depth intervals, down to 1 m, twice in each growing season, at the seeding stage in May and at full maturity at the beginning of September. Samples were weighed immediately after sampling, and oven-dried at 105 °C for 72 h until constant weight. Soil water was converted into available soil water (ASW), which is the amount of water in mm above the wilting point [30].

2.3. ETR and Derived Variables for The Field

In the field, to estimate total ETR, water balance was used. The only time when the crop was irrigated was after sowing on May 10th 2017. The amount of irrigation water was equal to 10 mm to obtain uniform emergence in the field. ETR totals in rainfed plots was derived as follows:
ETR = PR + I + CDR ± ΔS
where PR is precipitation during the growing season (mm), I is the amount of irrigation water (mm), C is the capillary rise of water from below the root zone (mm), R is the surface runoff (mm), D is deep percolation (mm), and ΔS is the cumulative change in soil water storage between planting and harvest (mm).
ETR sum in the field estimation was based on the soil water balance method (ΔS based on gravimetrically measured soil water at the beginning and end of the season, and PR). C was assumed to be zero, due to the 1.5 m aquitard sand layer that hinder the capillarity. The water table depth was at 8 m. D was also ignored because there was only one occasion when extreme PR occurred. Due to a flat field and previous monthly PR sums, the only exceptional PR value was in July 2018 after a dry period, which completed the missing soil water without deep percolation. Following the work of Gajić et al., any PR value below 100 mm were assumed to be zero run-off and run-on [14].
Thornthwaite–Mather type compensation evapotranspirometers were used to detect the daily water use of crops. The fixed pots are metal containers with a volume of 4 m3 (surface area: 4 m2; 1 m in depth). Three replications provided unlimited water supply to each variety. In water-stressed treatments, the number of replicates was the same. The pots were filled with a 0.1 m layer of gravel at the bottom and the remaining volume of pots was filled with soil from the upper layer of an adjacent field. The water level in the compensational vessel was controlled by a swimming ring magnet and a Reed-switch. The Reed-switch was connected to the water supply tap directly by a magnetic switch. A data logger (HYGACQ V1.3 type) was connected to log the amount of water use. The WHYGACQ computer program (HYGACQ, EWS Limited Partnership, Eger, Hungary) was used to upload data. Measured daily ETR values were expressed as a residual term from the water balance equation. By closing the water supplier tap every second day, 50% water withdrawal was ensured. More details are available in Anda et al. (2019a) [31]. In the RO treatment, the contribution of PR was also excluded by means of mobile rainout shelters (2.5 m long, 4.5 m wide, 2–2.5 m in height) covered with 200 µm thick UV transparent polyethylene film (MOL Petrolkémia Ltd., Budapest, Hungary). This mobile equipment was only installed during PR events to avoid increases in Ta (extra heat stress of RO crops) under rain-free time periods.
Three water levels were applied in the current study: WW: use of Thornthwaite–Mather type compensation evapotranspirometer; RO: 50% water deprivation from the reproductive stage; P: rainfed plots.
Daily crop ET0 rate (mm day−1) was computed by the widely-applied FAO-56 Penman–Monteith equation [32,33]:
E T 0 = 0.408 Δ ( R n G ) + γ 900 T a + 273 u ( e s e a ) Δ + γ ( 1 + 0.34 u 2 )
where G is soil heat flux density (MJ m−2 day−1), Ta is mean daily air temperature at 2 m height (°C), u is wind speed at 10.5 m height (m s−1), es is saturation vapor pressure (kPa), ea is actual vapor pressure [kPa], Δ is the slope of the vapor pressure curve (kPa °C−1) and 0.408 is a conversion factor from MJ m−2 day−1 to equivalent evaporation in mm day−1. Rn was estimated from Rs, daily mean Ta, mean daily ea, the site latitude and elevation based on Allen et al. (2005) [34]. A fixed value of 0.23 was applied for albedo. The on-site Rn derivation was reported in more detail by Soós and Anda (2014) [35]. Soil heat flux density was assumed to be G = 0 on a daily basis. The value of 900 combines several variables from the original FAO-56 equation [32], while 0.34 is an empirical factor.
The ratio of daily measured ETR (ETm) and derived ET0 rate resulted in the crop coefficient (Kc) for both soybean varieties:
K c = E T m E T 0
WUE for seed yield (ys) was computed as the ratio of ys and seasonal total ETR [36] expressed as kg m−3:
W U E = y s E T R
At maturity, 2 × 2 m subplots were harvested in the highlighted areas of the field to determine the ys of crops. Five replicates per variety were included (Figure 1). The harvested pods were oven dried at 65 °C for at least 48 h (until constant weight) to obtain pod dry weight. After threshing pods by hand, seed weight was obtained and adjusted to 13% moisture. The process was the same in each evapotranspirometer pot.

2.4. Statistical Analyses

The experimental design was a complete block with three replications due to the fixed nature of the evapotranspirometer.
The effect of the treatment, variety and season on LAI as well as SPAD was analyzed by three-way analysis of variance (ANOVA). The starting model was a full-factorial model with all main effects and all two- and three-way interactions. The non-significant interaction with the highest p-value was removed from the model iteratively. Decisions are detailed in the Results and Discussion section.
Differences between experimental groups were assessed using a Student’s t-test or one-way ANOVA followed by Tukey’s (honestly significant difference) HSD post hoc test (p < 0.05).
A two-tailed one-sample t-test was applied to compare the proportion of LAI, SPAD, Kc and WUE. To facilitate the presentation of results, a 95% confidence interval was calculated.
Boxplots were applied to show differences between the LAIs of soybean varieties, water treatments and seasons.
To illustrate the impact of meteorological elements (Ta; RH; solar radiation (Rs); u; VPD) on ETR, Pearson’s correlation analysis was applied. Multiple stepwise regression analysis was carried out to obtain the combined effect of different meteorological variables on ETR.
All statistical computations were implemented using SPSS software, version 17.0 [37] and R-statistics software [38].

3. Results and Discussion

3.1. Weather Conditions of the Studied Growing Seasons

The location of the study, Keszthely, which is positioned in the Carpathian Basin, is expected to have strongly variable inter- and intra-annual climate conditions (mild, continental climate with long warm and dry summers). The long-term (1971–2000) growing season’s average Ta is 16.9 °C (Table 1). The climate of Keszthely is typified by highly variable and irregular PR events with long-term seasonal total of 384.3 mm.
The growing season’s monthly mean Ta followed a similar pattern in both 2017 and 2018: they were unusually warm, with a seasonal average Ta of 1.3 (p = 0.075) and 2.4 °C (p = 0.006) that exceeded the long-term mean. The only exception in 2017 was the cool (and dry) April that caused a slight delay in soybean sowing.
The 2017 growing season was slightly drier than the long-term mean, receiving 10.1% less (p = 0.947) PR. The amount of PR was more frequent and of larger magnitude in 2018 than during the 2017 growing season. The sum of PR in the 2018 growing season was 21.6% higher (p = 0.093) than the long-term average. The end of each seasons was typified by considerable monthly PR, in September, which had no effect on soybean development. However, after disregarding the extremely high monthly sum of PR in September, and considering the soybean’s remaining growing season, 2017 received 44.9% less (p = 0.006) while 2018 received 6.4% (p = 0.046) more PR than the climate norm.

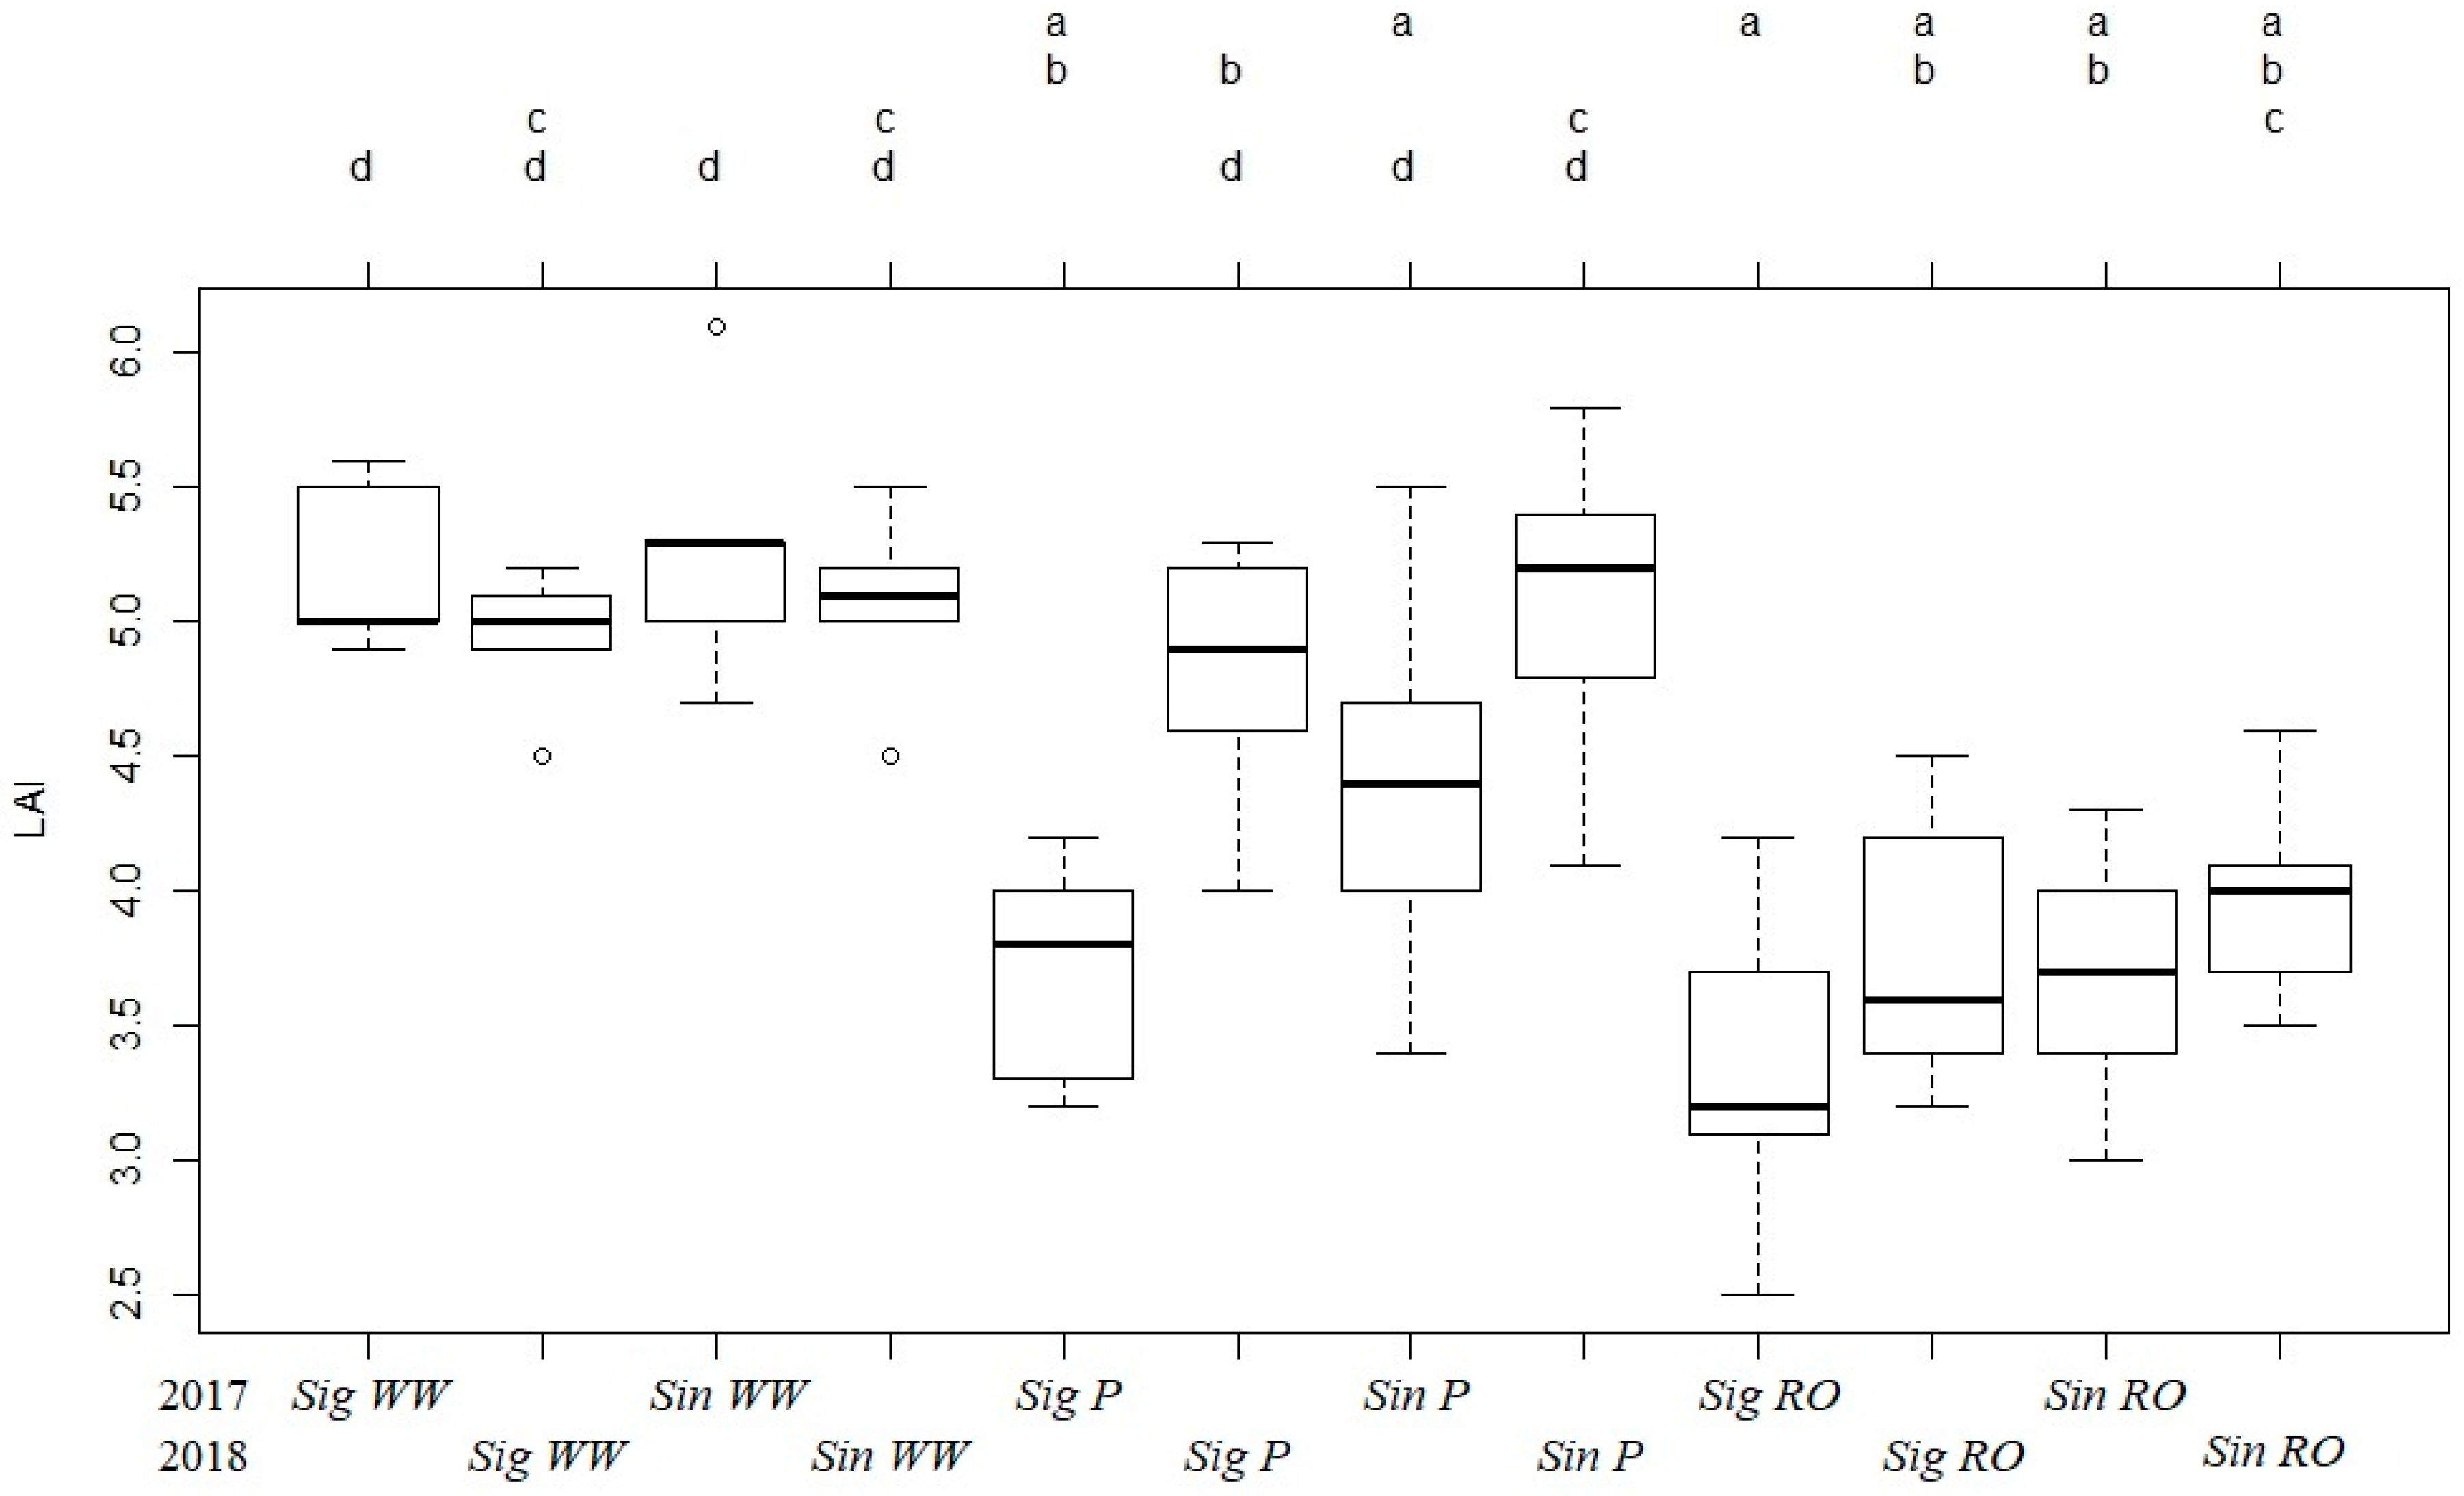
3.2. Soybean Development (Phenological Stages, LAI and SPAD)

3.2.1. Phenological Stages

Independent of the fact that seeding in 2018 was earlier than in 2017 by two weeks, soybean plant growth, development, and phenological stages were similar in both seasons under different irrigation water treatments (p = 0.211–0.441). The length of soybean development ranged from 114 to 120 days across treatments in 2017 (115–121 days in 2018). The only difference between the length of phenological stages was the one and a half times longer flowering (R1–R2) in 2018, probably due to the wetter weather conditions during June (18.6% lower monthly mean VPD and 40 mm higher monthly PR sum), in comparison to the previous season’s weather during June (Figure 2).
Water deprivation at the reproductive stage slightly shortened the length of the vegetative cycle in both varieties. In both Sin RO and Sig RO, seed maturity occurred in 4 (p < 0.03) and 6 days (p < 0.026) earlier in 2017 and 2018, respectively, compared to their WW treatments. Irrespective of the season studied, the length of the vegetative cycle of rainfed (118 days) crops was intermediate between the WW (121 days) and RO (116 days) values over the two-season study. The vegetative cycle of a rainfed soybean cultivar, Don Mario, was completed seven days earlier than its irrigated treatment in Uruguay [39].

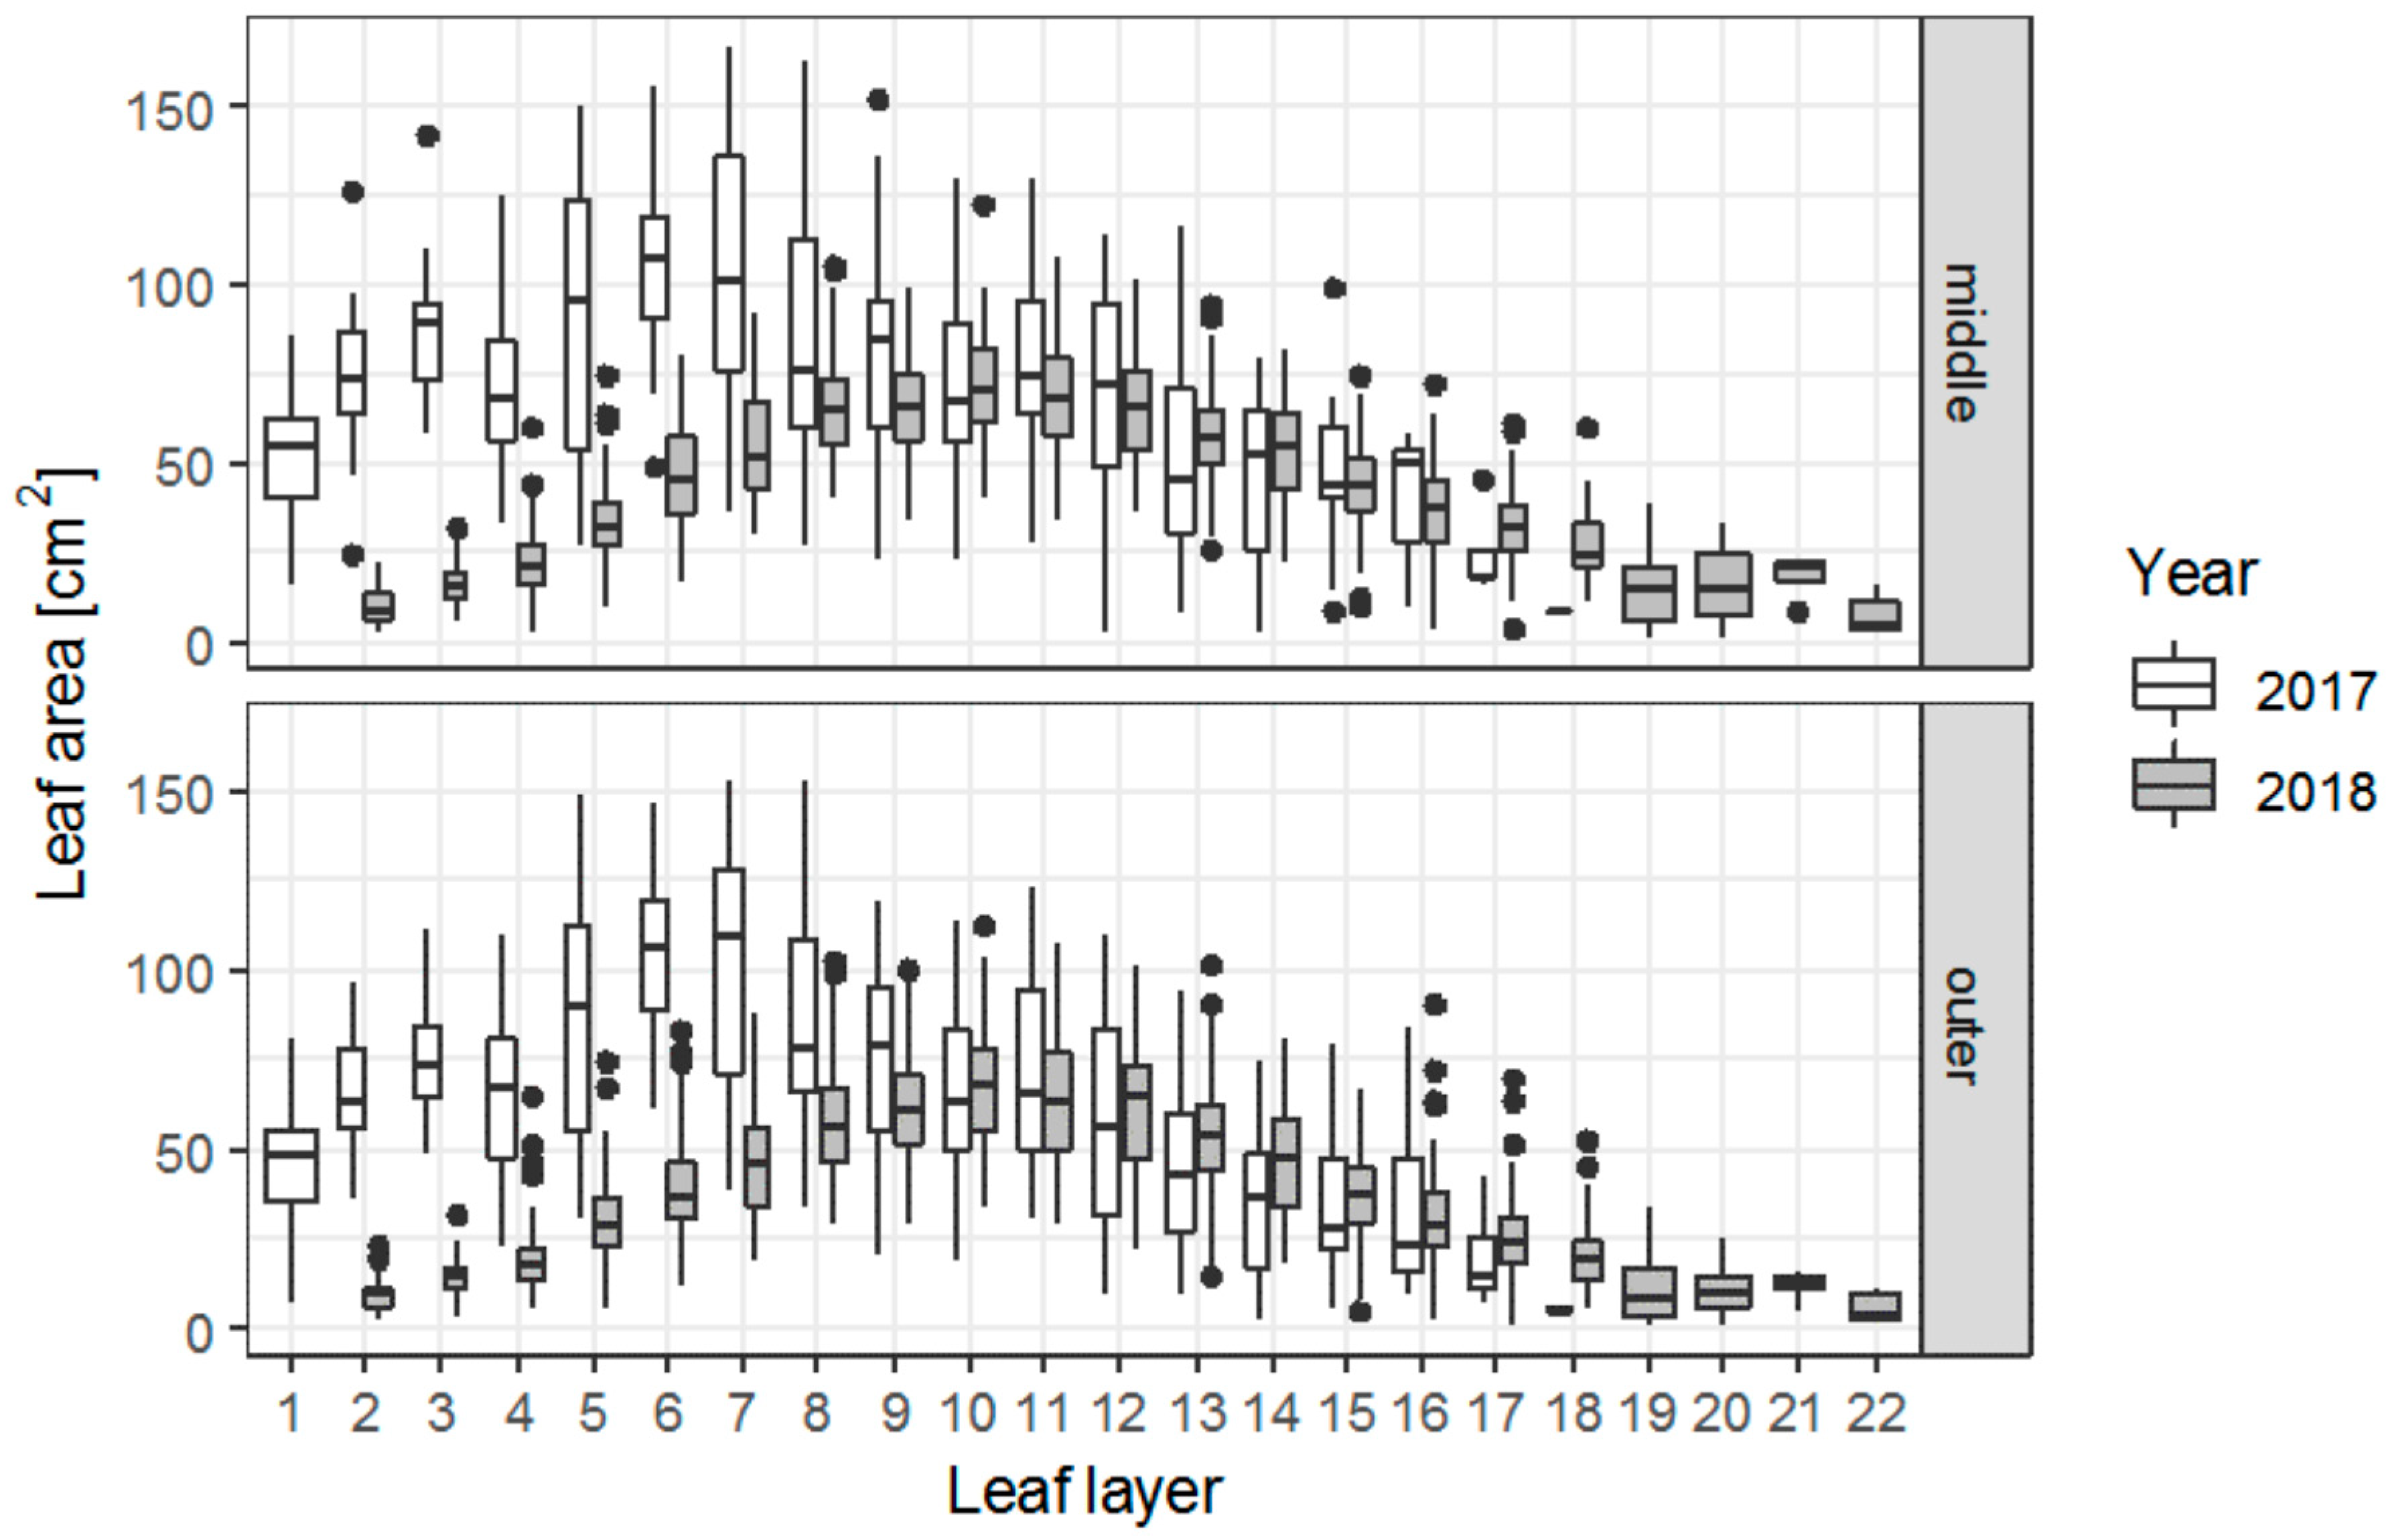
3.2.2. Leaf (Leaflet) Area of Soybean

Seasonal LAI means ranged from 3.3 ± 0.64 (Sig RO in 2017) to 5.3 ± 0.51 (Sin WW in 2017) in the two-season study. There was no significant impact of season on mean LAI in WW. Decreases in the seasonal LAI means were 44.4% (p < 0.001) and 44.7% (p < 0.001) in Sin RO and Sig RO, respectively, during 2017, in comparison to average LAI of crops grown in WW. In the next growing season, water deprivation reduced LAI by 24.2% (p = 0.002) and 25.3% (p = 0.003) in Sin RO and Sig RO, respectively, compared to WW. Irrespective of the season, mean LAI of P was intermediate to the WW and RO values (Figure 3).
Independent of the variety and season, the LAI of P was always lower than that of WW. Furthermore, the LAI of RO was even lower than that of P for each season-variety combination. The difference between the RO treatment and the associated WW as well as P treatment was different for each season-variety combination. As a rule, LAI values of P were intermediate between WW and RO values. In 2018, due to higher PR, the LAI of P treatment was closer to that of WW treatment, while in drier 2017 it was closer to that of RO treatment. The lower LAI in P caused by drier weather conditions in 2017 may have occurred due to greater investment in root structure to make more effective use of soil moisture at deeper soil layers [40].
Higher seasonal variation in different LAI characteristics including median and quartiles occurred in water deprived RO and P crops. The lower LAI of RO confirmed that reduced compensation of water shortage in soybean growth might be expected under water stress during the reproductive stage [8]. The two-season mean LAI of Sin RO ranging from 3.3 (2017) to 4.0 (2018) in the present study overlapped with the range reported by Akhtar et al. (2019) [41], who found long-term seasonal mean LAI between 2.5–3.5 in a rainfed summer soybean variety Dongdou 339 in Yangling, China between 2015 and 2017. The three-season mean LAI of 4.2 reported by Matsuo et al. (2017) [42] in rainfed soybean (variety Fukuyutaka) in Fukuoka, Japan was in an intermediate range of rainfed LAI in our study, from 3.7 (2017: Sig P) to 5.1 (2018: Sin P). Values of LAImax tended to follow the sizes in seasonal mean LAI, irrespective of treatment. The two-season mean LAImax values of 9.3 measured in WW were similar to LAImax of 9.0 in soybean (variety Pioneer P93M11) reported by Setiyono et al. (2008) [43] in Nebraska, USA, but higher than the LAImax of 5.8 and 7.7 in 2012 and 2013, respectively, reported by Kross et al. (2015) [40] for two soybean varieties in Ontario, Canada.
The statistical analysis of LAI was carried out by three-way ANOVA. The three factors were season (S), variety (V) and water supply (W). In the full-factorial model, the three-way interaction was not significant (p = 0.75) so it was excluded from the model. In the model containing all two-way interactions, the V × W interaction had the largest p-value (p = 0.51), so it was removed from the model. Similarly, the V × S interaction had the largest p-value (p = 0.49) so it was also removed from the model. The main effect of V was slightly significant (p = 0.04), so it was also excluded. The final model included the main effect of W and S and their interaction (Table 2).
The interaction is illustrated in Figure 4.
Analysis on the distribution of the middle and two outer leaflets in different trifoliate heights was carried out during the two experimental seasons (Figure 5). A previous one-season result showed a significant difference in the size of the middle and two outer leaflets [44], irrespective of variety. The leaflet areas of the two varieties were pooled.
Probably due to the earlier seeding in 2018, the number of trifoliate layers increased with five more levels than in 2017. In addition, the size and level of trifoliates with the highest leaflet area also varied. Trifoliate level with maximum leaf area in the middle (outer) leaflet was observed in the 6th and 10th levels in 2017 and in the 7th and 10th levels in 2018. In 2017, increases in leaflet size were 35.0% (p < 0.001) and 41.4% (p < 0.001) in the middle and outer leaflets, respectively, relative to the 2018 values. Summarizing the results for leaflets, we conclude that different weather conditions in the two seasons caused variation to both the number and leaf areas of trifoliates. In 2017, fewer leaf layers with higher leaf areas, relative to 2018, were observed.

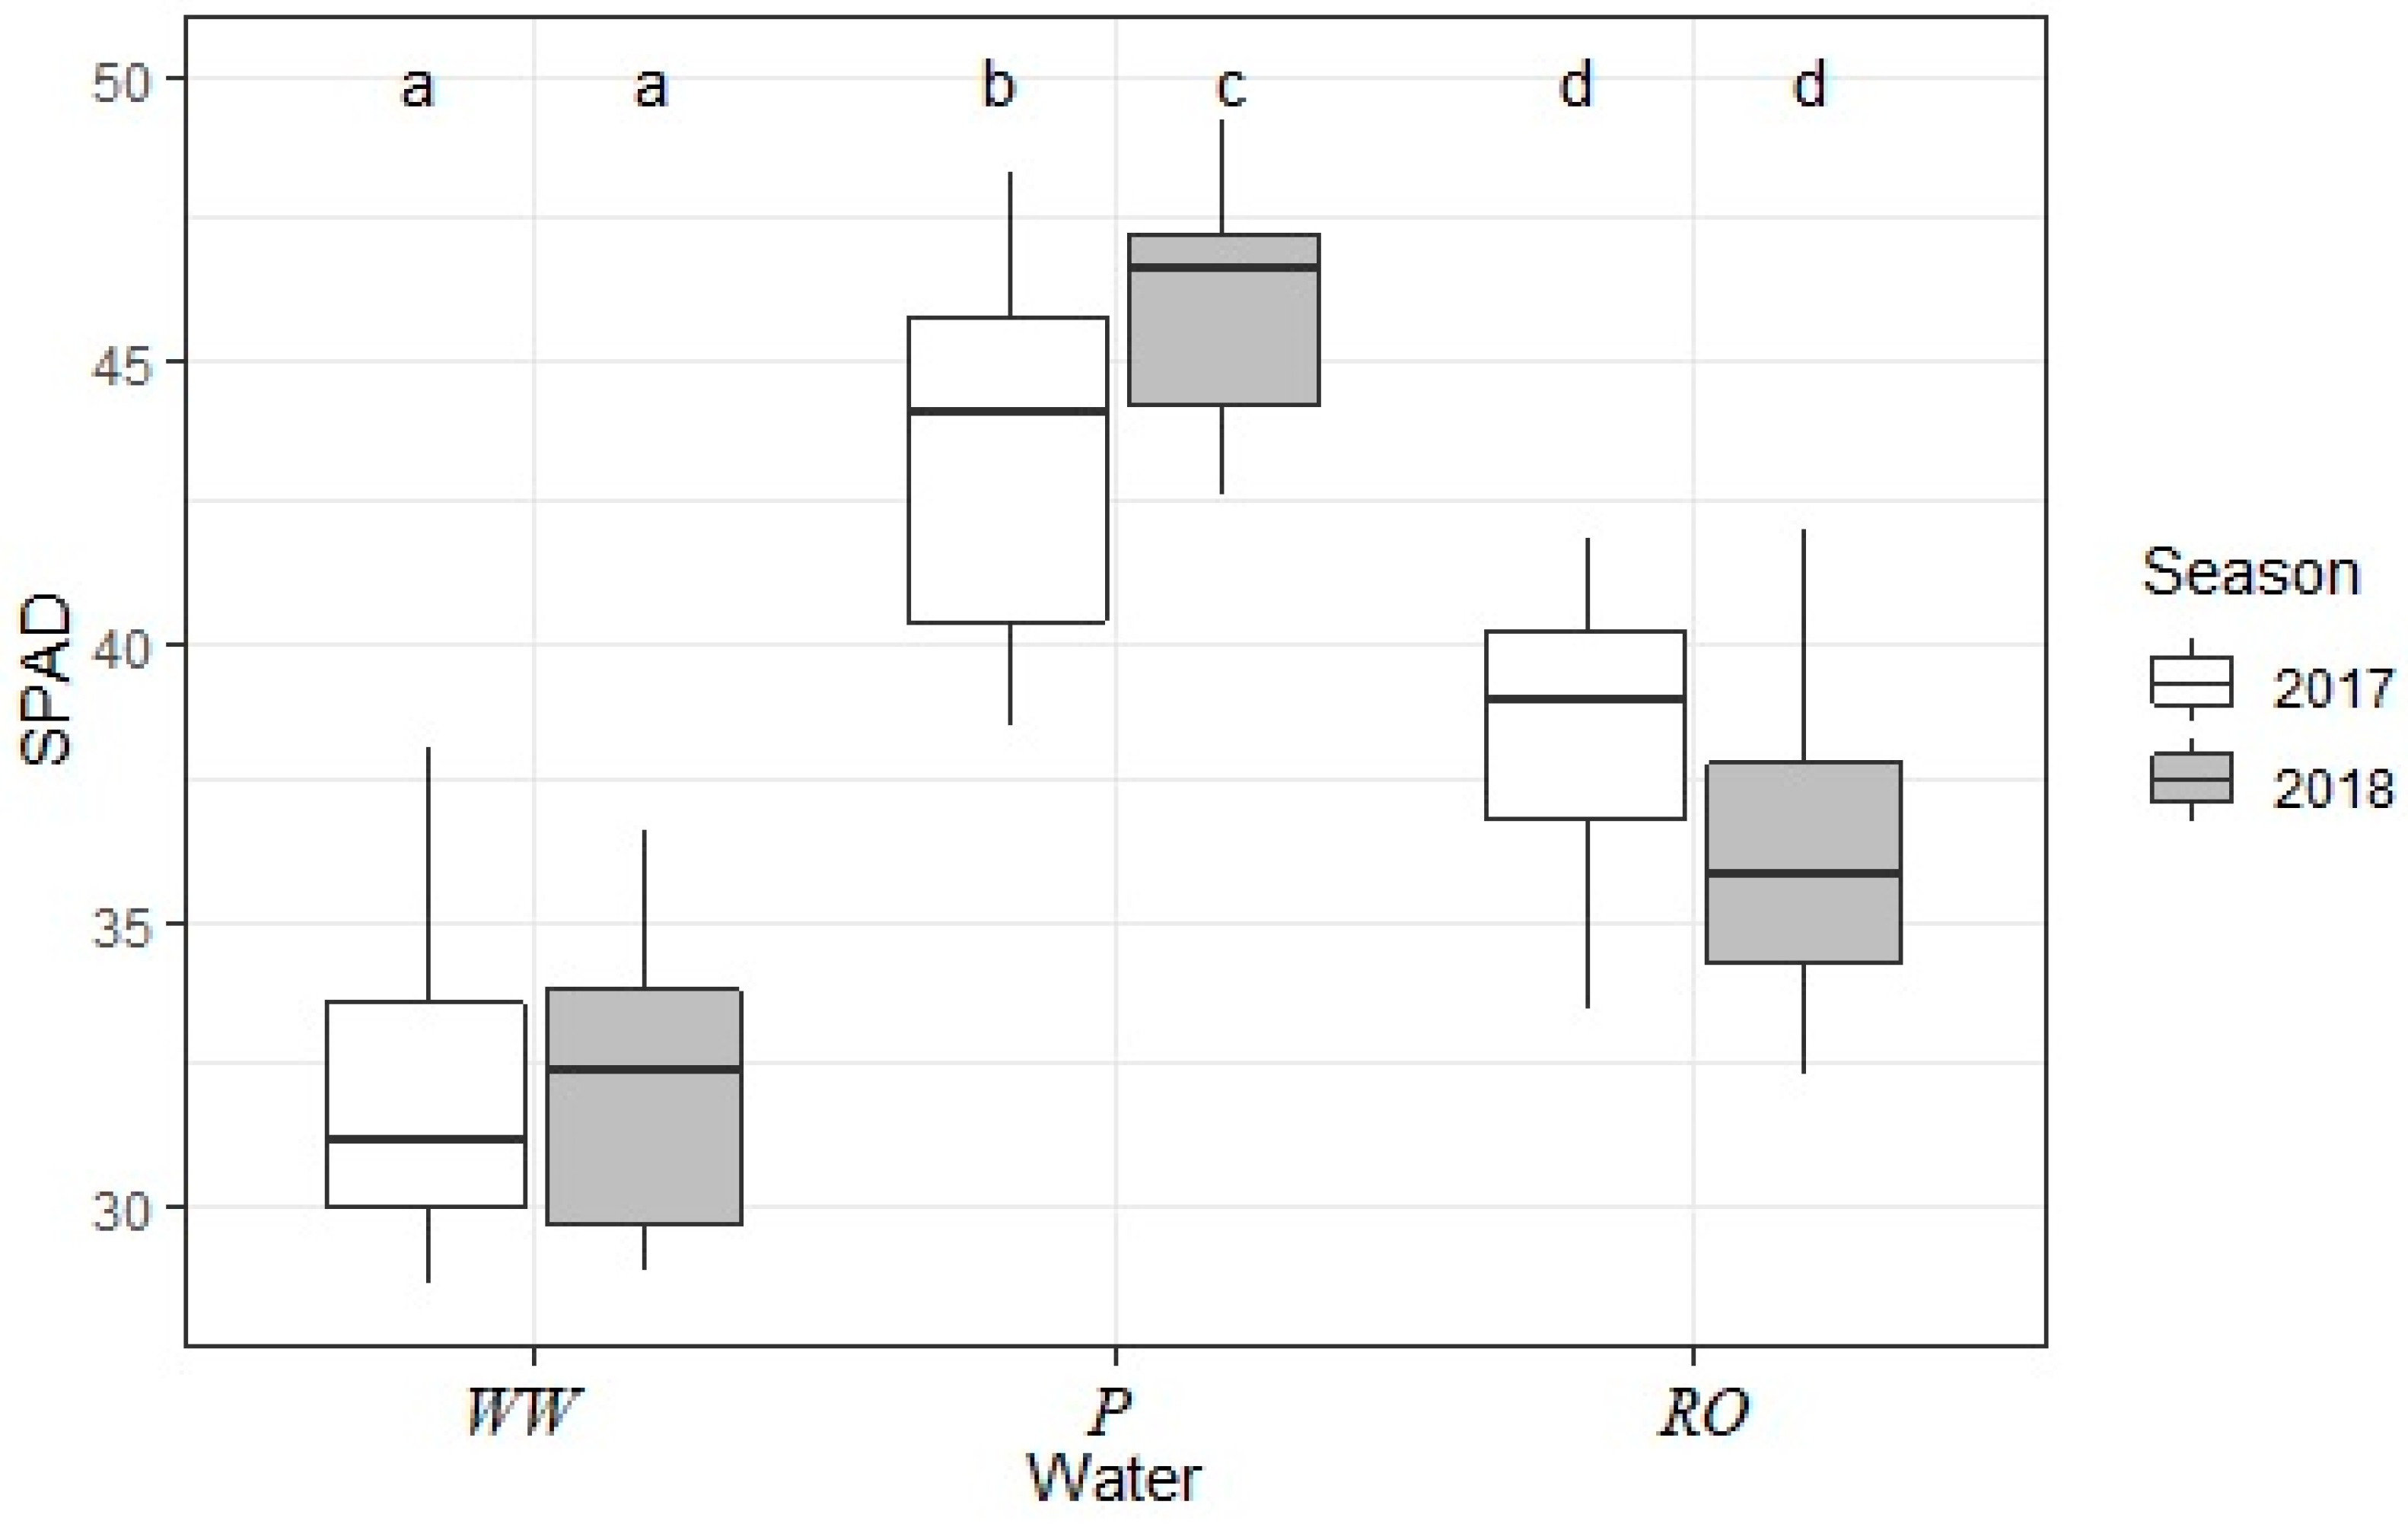
3.2.3. Chlorophyll Content of the Leaves (SPAD)
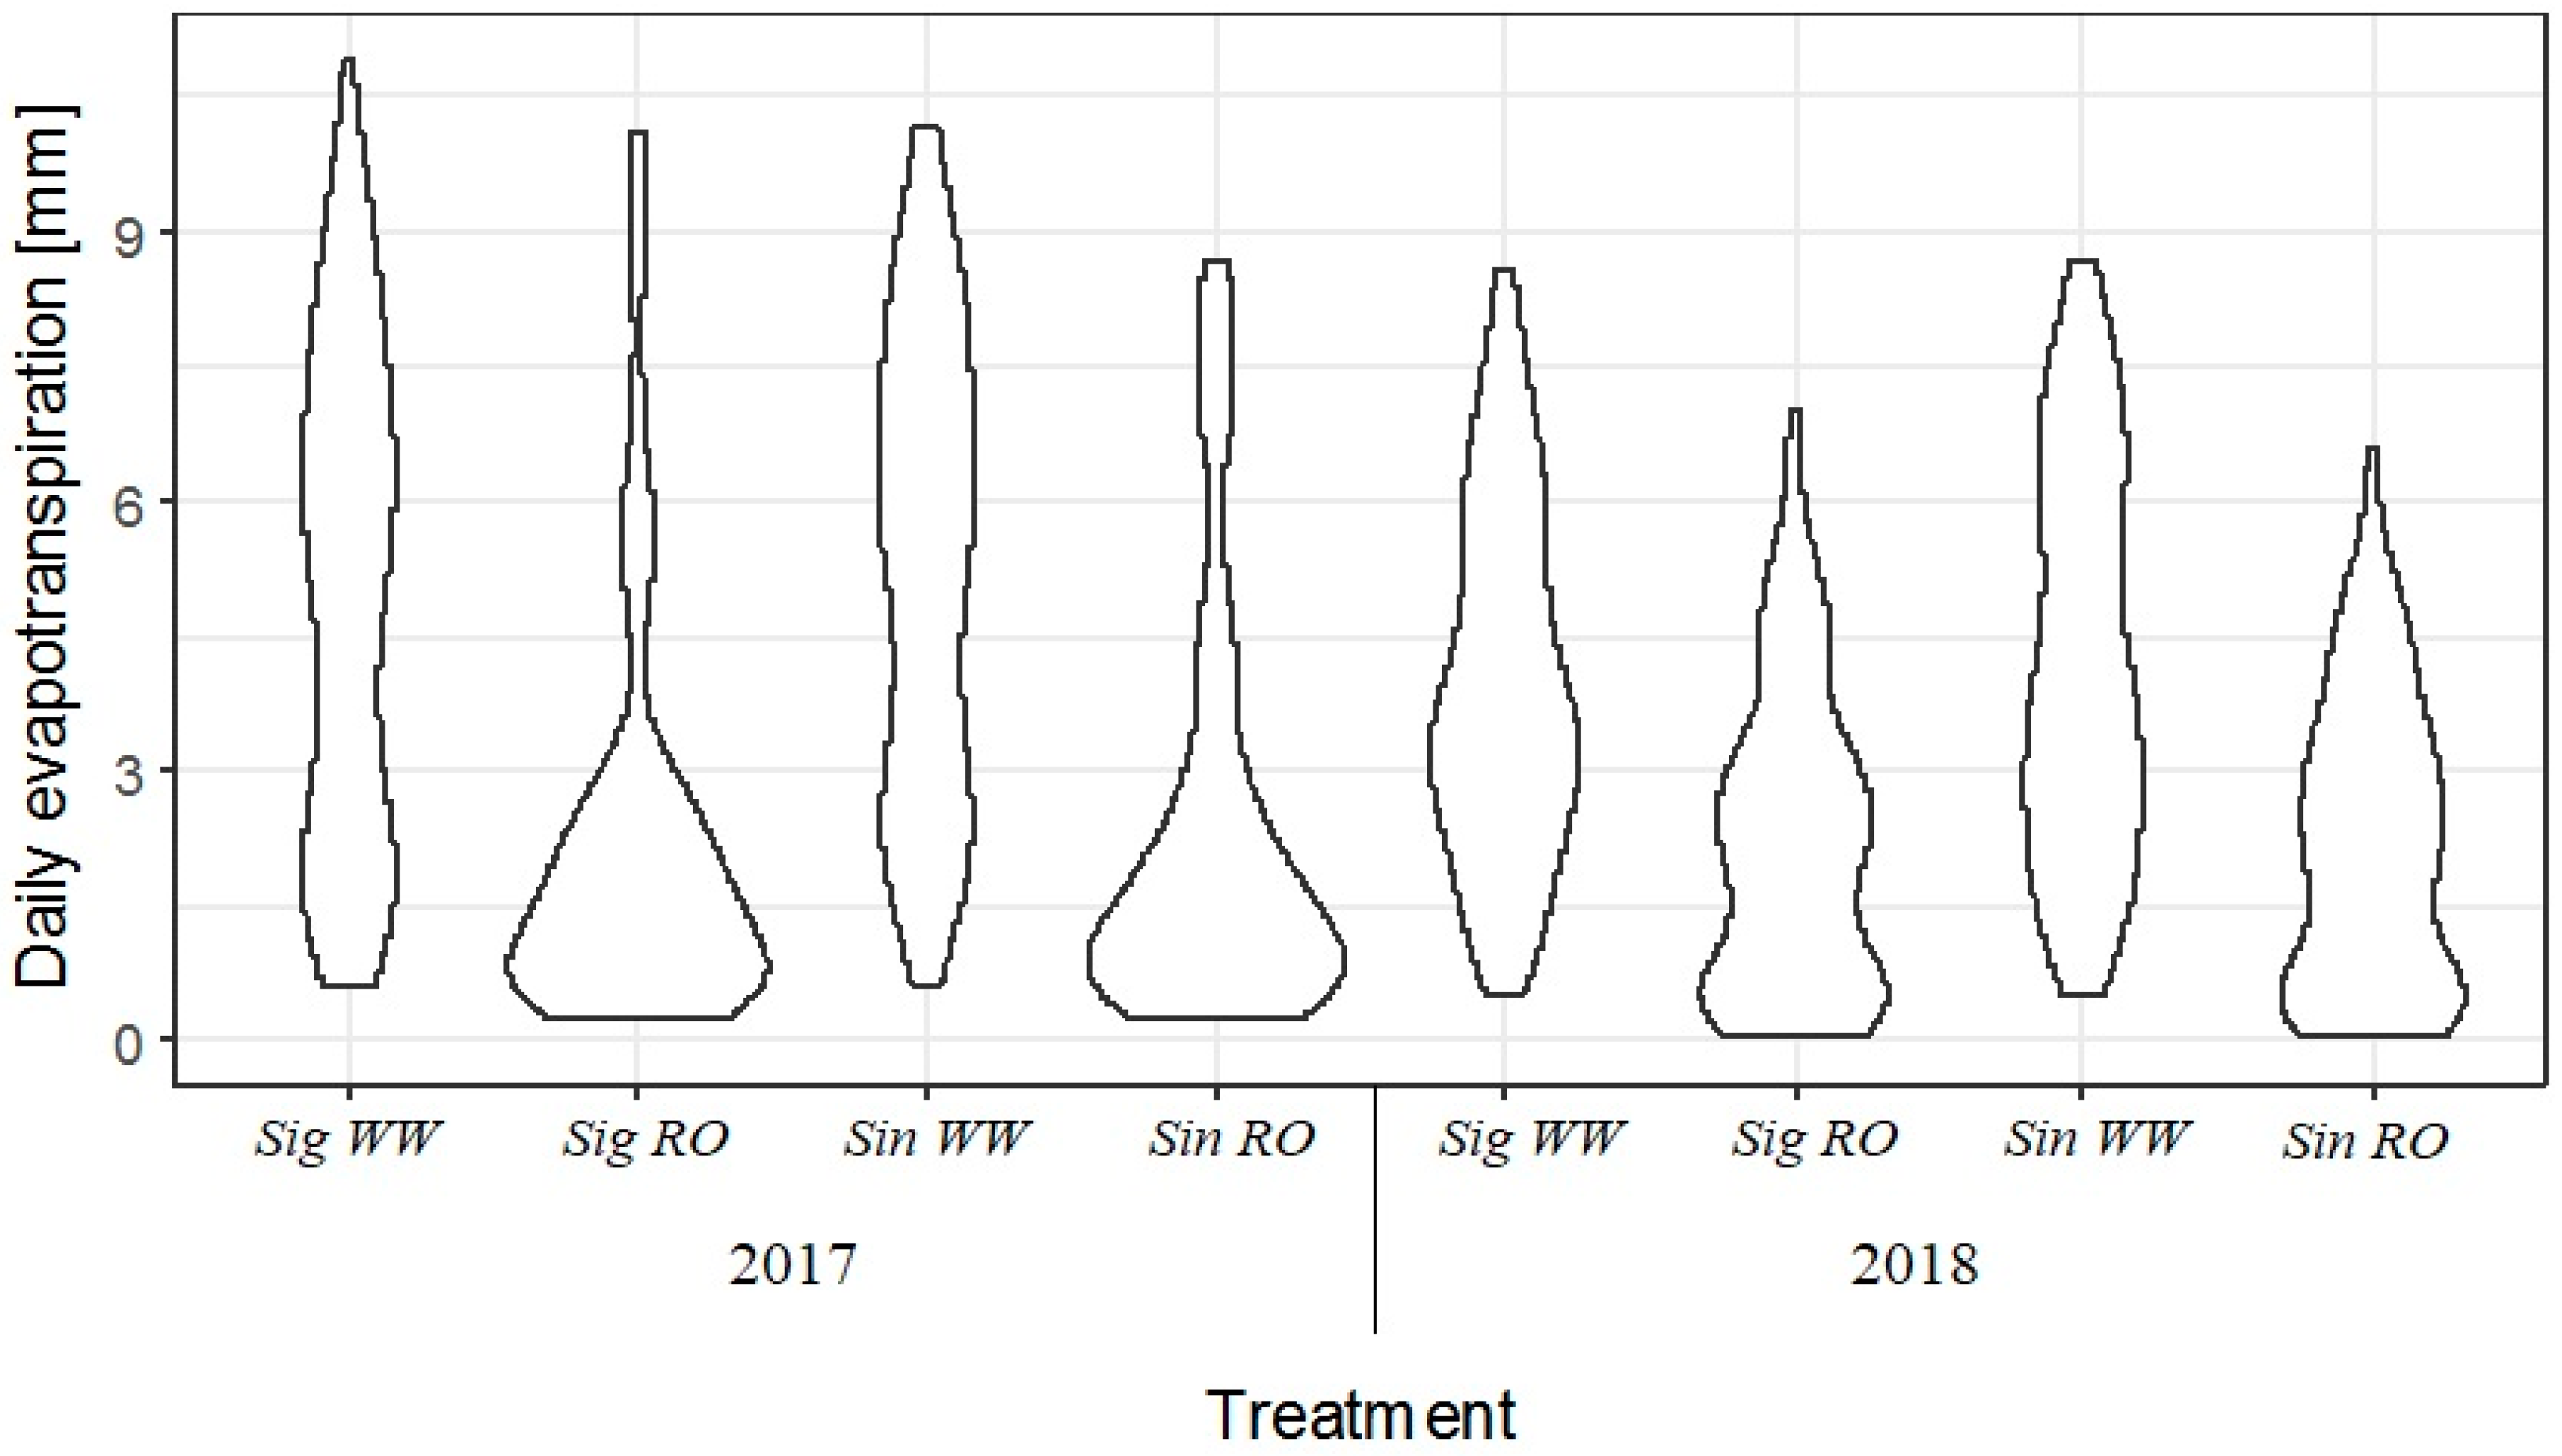
SPAD values mirror the “greenness” of leaves and provide an index of the actual chlorophyll content. Increased SPAD may contribute to impaired photosynthetic activity leading to better crop performance and crop yield. The index was documented by Bajgain et al. (2015) [45] to be a determinant factor of soybean photosynthesis as well. Smaller chlorophyll content per unit leaf surface likely contributes to less absorbed radiation that may potentially be converted to crop dry matter. Photophosphorylation controlled by photosystems is triggered by the density of chlorophyll units in the leaf, and is related to SPAD values [46]. SPAD and water supplies were inversely related in both growing seasons. The highest SPAD values ranging from 42.7 ± 3.43 (Sig P; 2017) to 46.3 ± 2.14 (Sin P; 2018) were obtained in rainfed crops. Decreases by 33.4% (p < 0.000), 33.5% (p < 0.001), 34.0% (p < 0.001) and 37.1% (p < 0.001) were observed in Sin WW (2017), Sig WW (2017), Sin WW (2018) and Sig WW (2018), respectively, in relation to the SPAD of P. Accordingly, Ergo et al. (2018) [9] documented a 37% (irrigated: 22.38, control: 35.48) reduction in SPAD for a water-stressed soybean genotype, SPS4 × 4 RR, at Manfredi in Argentina, between 2012 and 2013.
The effect of treatment, variety and season on SPAD was analysed by three-way ANOVA. The starting model was the full-factorial model with all main effects and all two- and three-way interactions. The non-significant three-way interaction was removed from the model, then the new model was recalculated. This process was iterated until all parts of the model were significant. In each step, the interaction with the highest p-value was removed. The final model included the main effects of water and season as well as their interaction. The pairwise comparison of the six water-season combinations were compared with Tukey’s HSD test (Figure 6).
There were no significant differences in SPAD values between the two seasons in P (Sin: 4.8% (p = 0.0502); Sig: 6.7% (p = 0.067)). Higher SPAD values in rainfed soybean in the present study agreed well with the results of Ergo et al. (2018) [9] for rainfed soybean, variety SPS4 × RR, at Manfredi in Argentina, between 2012 and 2013.

3.3. ETR in Soybean

The seasonal patterns of daily mean ETR were similar to each treatment of the studied seasons, however, the size of water losses varied among different (water/season/variety) treatments. Temporal patterns in ETR were the same as in LAI development. An increase in water demand from emergence to the R5 phenological stage occurred. This was followed by a sharp decrease in crop senescence until the R7-R8 stages. For all treatments, lower ETR occurred in the vegetative stage, ranging from 0.1 to about 2.5 mm day−1. Statistical characteristics in variation of daily mean ETR are summarized in Figure 7. The top daily water demands between 6.6 (Sin RO) and 10.9 (Sig WW) mm during July (day of year (DOY): 190–200) coincided well with both the highest Ta as reported by Dinpashoh et al. (2011) [47] in Iran (25°00′–38°39′ N latitudes, data of 16 observation points) between 1951 and 2005, and with flowering accordingly to a soybean investigation of Anapalli et al. (2018) [13] in Stoneville, USA (33°42′ N). Daily ETR gradually decreased in below 1.5 mm toward the end of August (R8). Ranges from 1.0 to 8.9 mm day−1 in seasonal average ETR of Montoya et al. (2017) [29] coincided with 2018 ranges from 0.5 to 8.7 mm day−1 in WW treatments (Sin and Sig). Seasonal average ETR of 5.3 mm day−1 in Sin WW (2017) was the same as the three-season daily mean ETR rate of Payero and Irmak (2013) [17] in North Platte, USA (41° N) with Roundup Ready soybean hybrids. Daily mean ETR of 4.2 mm day−1 in Sig WW (2018) was somewhat higher than that of daily ETR of 3.4 mm day−1 reported by Zhang et al. (2018) [16] for Noxubee County, Mississippi, between 2014 and 2015. Results in our study coincide with the two-season mean ETR of 4.5 mm day−1 observed by Karam et al. (2005) [8] with soybean variety Asgrow at Bekaa Valley, Lebanon (33° N) in a lysimeter experiment.
At the same time, in the P treatment, ASW ranged from about 140 to 180 mm in 2017 and from 90 to 110 mm in 2018.
In 2017, unlimited watering significantly increased daily mean ETR by 77.3% (p < 0.001) and 76.7% (p < 0.001) in Sin and Sig, respectively, in comparison to daily ETR of the RO crop (Figure 7). In the next experimental season, 69.4% (Sin: p < 0.001) and 59.4% (Sig: p < 0.001) increments were recorded in WW treatments relative to water-deprived (RO) treatments. Daily mean ETR of RO were similar to each other: 2.3 ± 2.28, 2.2 ± 2.24, 2.2 ± 1.63 and 2.2 ± 1.68 mm day−1 for Sin RO (2017), Sig RO (2017), Sin RO (2018) and Sig RO (2018), respectively (p = 0.524–0.750). Many outliers in RO rooted after stressed crops were watered every second day, and ETR of RO diverged considerably from R1 when water was withheld.
Outliers in Figure 7 were restricted to RO treatments during 2017 because daily ETR means in 2017 were more concentrated around small values while they were evenly distributed in the observed range in 2018. The lower the box height (interquartile range in 2017), the more easily the outliers evolved. The maximum ETR of RO crops ranged from 8.7 (Sin) to 10.1 mm day−1 (Sig) in 2017, while the more moderate maximum ETR ranged from 6.6 (Sin) to 7.0 mm day−1 (Sig) in 2018. The limited emergence of outliers in 2018 could be explained by analyzing the distribution of daily ETR in the two investigated seasons. The violin plots, which contain the density curves, provide additional information about the data distributions (Figure 8).
With the exception of Sig WW in 2018, the shape of WW curves with highest LAI values were quite balanced, showing an evenly distributed daily ETR. This aspect was highlighted in the conclusion of Suyker and Verma (2008) [23], who explained that beyond threshold LAI (LAI > 3–4), after full-canopy closure, greater leaf areas would not significantly affect ETR. The long-necked thin “violins” of RO crops showed that the majority of ETR values were relatively low (“paunchy” violins). Surprisingly, the warmer season of 2018 produced shorter violins than 2017 curves, which could be entirely attributed to the variability in weather conditions of the two investigated seasons. The seasons in the current study were considered to be warm relative to the climatic norm. However, changing patterns of weather perturbations, such as variations in Tamax and its distribution, might also impact the development of soybean. Despite 1 °C cooler weather in the 2017 season, daily mean ETR were 18.7% (p < 0.001) and 20.2% (p < 0.001) higher in Sin WW and Sig WW, respectively, when compared to their daily mean ETR over 2018. Despite this, there was no significant growth in the seasonal mean LAI of WW crops during 2018. Ta is a known driving factor of a crop’s water loss. The growing seasons—mainly summers—of 2017 and 2018 were characterized by either considerable variation in Ta (in relation to 30-year averages), or ranges of Ta including distributions in Tamax (Figure 9) that varied substantially between the two summers (June–August).
Daily Tamax ranged from 13.7 to 38.5 °C in 2017. In 2018, more evenly distributed Tamax values ranged from 16.6 to 34.2 °C. Tamax during the vegetation period was recorded on DOY 216 (4 August 2017) and on DOY 220 (8 August 2018). McMaster and Wilhelm (1997) [48] considered 30 °C as the upper air temperature threshold in soybean development, i.e., daily Tamax that exceeds 30 °C harms crop development. Bagg et al. (2009) [49] found soybean to be very susceptible to extreme heat around the reproductive stage, when hot weather reduced crop growth and flowering. The number of days with daily Tamax over 30 °C was higher in 2017 (38 days) than in 2018 (28 days) even though the mode of Tamax distribution was below the threshold of 30 °C in both growing seasons.
Extreme Tamax values in 2017 simultaneously impacted heat and drought stresses during soybean development. Dornbos and Mullen (1991) [50] documented that the simultaneous occurrence of heat and water stresses additively reduced yield in soybean that equaled the sum of individual stresses. However, this phenomenon was not confirmed by Ergo et al. (2018) [9], who identified water stress to be the dominant factor beside heat stress, motivating the greatest specific response to soybean variety SPS4 × RR. The experimental design used in our study would not enable us to separate the influences of the two stressors, but it is assumed that both might have occurred, mainly during 2017.
Previous investigations on soybean reported, that PR and flowering mainly are very sensitive to air moisture [31]. Two moisture characteristics were included in the analysis, RH and VPD. Both of them varied considerably in the growing seasons. In addition to an increased amount of seasonal PR in 2018, the number of days (101 days) in which daily mean RH exceeded 70% was about twice the number of similarly “humid” days between May and September in 2017 (55 days). This weather perturbation might also affect ETR due to the tropical origin of soybean, therefore higher RH is likely to induce more favorable growing conditions, mainly during flowering [9]. Daily mean RH under 70% was often associated with low temporary RH values of under 30% measured at around solar noon that could damage soybean development, even with proper soil water (i.e., plants grown in evapotranspirometers). Wei et al. (2015) [51] applied average minimum RH > 45% as the limit in a soybean (variety Zhonghuang No. 13) transpiration model experiment, and this required weather adjustment to model inputs in Daxing, China (39°37′ N), between 2008 and 2010. VPD, the “driving force” of ETR, is also a critical weather variable that controls crop transpiration via stomatal regulation. The second likely reason for the decline in daily average water loss in 2018 might be the 20.3% (p = 0.023) decline in the VPD of the 2018 summer (June–August), which was a wet growing season. One trend was salient: lower VPD was accompanied by a loss in ETR intensity (also see Figure 7).
Seasonal average daily ET0 of 5.3 ± 1.51 mm day−1 and 5.0 ± 1.45 mm day−1 were recorded in 2017 and 2018, respectively. A seasonal mean ET0 of 5.2 (41° N) and 4.9 mm day−1 (33°42′ N) reported by Payero and Irmak (2013) [17] and Anapalli et al. (2018) [13], respectively were very similar to the ET0 results in our study. The insignificant increment (7.7%; p = 0.067) in daily mean ET0 in 2017 was probably due to the increase in mean VPD (from 1.28 to 2.03 kPa) in summer compared to the summer of 2018. Seasonal variation in measured daily mean ETR and daily average ET0 rates followed the same trend observed by others, including Payero et al. (2005) [52], for soybean.
In 2017, increases in cumulative ETR by 79.3, 81.3 and 23.8 mm were obtained in Sin WW, Sig WW and Sig RO, respectively, relative to 2018; moreover, Sin RO had 9.7 mm lower crop water than the 2018 season. The average evapotranspiration totals of 655.2 mm in Sin WW and 616.7 mm in Sig WW in our two-season study were close to 633 mm reported by Payero et al. (2005) [52] for North Platte, Nebraska (41° N) in an irrigated soybean, variety Renze 2600 RR, in 2003. It was also similar to the observation of Doorenbos and Kassam (1979) [53], whose cumulative ETR estimations in soybean ranged from 450 to 700 mm, which were controlled by the weather and cultivation conditions, the varieties used, the length of the vegetation cycle, and the observation time period.
Soybean water demand of 431–585 mm reported by Zhang et al. (2018) [16] for full irrigation conditions in Noxubee, Mississippi (31° N) agreed well with the WW results in the current study. Luo et al. (2018) [15] reported an ETR total of 325 mm in rainfed soybean, at Iowa (41°55′ N), between 2013 and 2014, which was consistent with the cumulative ETR of the RO crop ranging from 291 to 317 mm observed in the present study. Using soybean variety Zhonghuang, Wei et al. (2015) [51] reported seasonal ETR total ranging from 283 to 347 mm in Daxing, China (39°37′ N) between 2008 and 2011, approximating and overlapping with our results of RO. ETR totals of 821 mm by Sincik et al. (2008) [54] and 841 mm by Candogan et al. (2013) [55] exceeded ETR sums in those studies. Both results were derived from Bursa, Turkey (40°15′ N), for fully irrigated soybean, variety Nova, for the same time period (2005–2006). In-season PR supplied up to 50% and 70% of both varieties’ crop water requirements in 2017 and 2018, respectively, based on the relationship between ETR sums and natural seasonal PR totals.
There were deviations in measured and derived daily ET0 rates in both growing seasons. Figure 10a,b show that the computed ET0 rates were slightly higher than the measured rates. Due to late sowing in 2017 (9th May), due to a cool April, measured ETR was considerably lower than ET0 during the early growth cycle (highlighted by an ellipse in Figure 10a). A similar reduction in ETR as a result of delayed sowing was reported by Suyker and Verma (2008) [23] in soybean variety Asgrow at Mead, Nebraska (41° N). Small, recently emerged crops with a LAI below 1 could not satisfy the increased atmospheric water demand in May, causing a wider variation in the relationship between seasonal measured ETR and derived ET0 (Figure 10). This deviation between measured ETR and ET0 in the early stage of soybean development reduced RMSE for 2017 in both varieties. The slopes of the linear regression between measured ETR and ET0 ranged from 0.93 to 0.98 (RMSE: 2.04–2.26 mm day−1) and from 0.86 to 0.89 (RMSE: 1.46–1.73 mm day−1) in 2017 and 2018, respectively, close to the 1:1 slope.

3.4. Crop Coefficients, Kc

The Kc values showed day-to-day variations in both experimental periods. The variability in seasonal Kc also showed apparent seasonal dynamics, and peaked together with seasonal ETR and LAI in the most active period of soybean development (R5). Daily Kc averages ranged from 0.19 (20 May 2017) to 1.56 (18 August 2017) in Sig WW and Sin WW, respectively, over the 2017 and 2018 seasons. The seasonal averages ± SD in 2017 (2018) were 0.97 ± 0.36 (0.84 ± 0.36) and 0.91 ± 0.39 (0.79 ± 0.30) in Sig WW and Sin WW, respectively. The 13.7 (p < 0.030) and 14.1% (p < 0.021) declines in Kc over 2018 were due to the lower ETR over that time period. Similar daily Kc values for soybean (Roundup Ready hybrid) between 0.27 and 1.47 during the 2002 and 2005 seasons were reported by Payero and Irmak (2013) [17] for Nebraska, USA (41° N), under similar weather conditions as the site of our study, although their Kc values were published on a weekly basis. Anapalli et al. (2018) [13] recorded daily Kc values ranging from 0.5 to 1.3 for soybean (cv. Dyna Grow 31RY45) in Stoneville, USA (33° N) in 2016, values that were intermediate to the daily Kc values measured in different treatments in our study. Kc values of 0.4, 1.14 and 0.48 in the initial, mid-season and late season, respectively, reported by Candogan et al. (2013) [55] at Bursa, Turkey (40° N) in a two-season study (2005–2006) were somewhat lower than the Kc results of our experiment. A brief summary of previously observed Kc values is presented in Table 3.
Seasonal variation in Kc curves was developed for both seasons and varieties as a function of DOY. The scatterplot shows a parabolic pattern in 2017 (Figure 11a) and a third-order polynomial pattern in 2018 (Figure 11b).
The warm spring in 2018 (end of April to the beginning of May) increased initial Kc values slightly. Irrespective of the season, the measured daily Kc values were characterized by rapid increases from early June to about mid-August, followed by a steady decrease due to reduced LAI, solar radiation and ETR towards September. This pattern is evident for variation in daily Kc, although the coefficients varied in each season (Table 4).
One example was found between 195 and 215 DOY in 2018, when a moderate decline in daily Kc values was due to cloudy (rainy) weather conditions with lower Ta and VPD, which lasted about 20 days. This variation was smoothened by taking a third-order polynomial function of the daily time series of the Kc values. Similar peak values of 1.59 (Sin WW) and 1.56 (Sin WW) occurred on 18th August 2017 and 2nd August 2018, respectively. A similar daily peak Kc of 1.47 was reported by Irmak et al. (2013) [61] for semi-arid Nebraska, USA (41° N) in 2008. A Kc maximum of 1.4 noted by Anapalli et al. (2018) [13] for soybean variety Dyna Grow 31RY45 in Stonewill, USA (33° N) during 2016 was also close to the Kc values in our study.
Slightly greater Kc values obtained in 2017 were probably due to increased maximum Ta that was also reflected in the higher ETR obtained in that season. Small Kc values in the vegetative stage and throughout maturity were lower than 1, with one exception (Sin WW) in 2018. In Sig WW, Kc values below 1 were characteristic of most of the growing season. There were no significant differences in Kc between the two varieties, irrespective of the season.
Assuming that there may be large difference in geographic/weather conditions and agronomic management practices between observation sites, Kc values cited in the literature might differ significantly. Kc developed with an evapotranspirometer (unlimited watering) for two soybean varieties were higher than the value of 0.7 found by Karam et al. (2005) [8] in a lysimeter study, in Lebanon (33° N), although their seasonal mean ETR of 5.5 mm day−1 was close to our average ETR of 5.3 and 5.0 mm day−1 in Sin WW and Sig WW, respectively, during 2018. However, soybean daily Kc values between 0.27 and 1.47 during the 2007 and 2008 growing seasons noted by Irmak et al. (2013) [61] in south-central Nebraska (41°1′ N) were consistent with the Kc results of our study.
Given that Kc values might be significantly affected by local environmental conditions and agronomic practices, our study is primarily appropriate for on-site use in the Carpathian Basin. One of the reasonable factors that might induce deviations in actual Kc is the size of LAI, due to the modified fraction of soil cover (canopy opening), by impacting ETR [63]. The Kc values were slightly influenced by LAI sizes in different treatments in the present study: higher LAI had higher Kc caused by a higher ETR.

3.5. The Impact of Weather Variables on Daily Mean ETR

ETR is a multivariate process affected by various meteorological factors [64]. In the current study, the influence of weather characteristics (Ta, RH, u, Rs, VPD and ET0) on measured daily mean ETR of two soybean varieties (Sin and Sig) were investigated under unlimited (WW) watering at Keszthely ARS, during the 2017 and 2018 growing seasons (Table 5). Due to limiting water supply every second day, ETR of RO treatments and PR were excluded from the analysis. Irrespective of the season, the correlation coefficients (r) hardly fluctuated between the two varieties studied. This may be due to the low number of varieties studied. Moreover, differences in the relationship between ETR and weather variables, including VPD, were not confirmed.
Similar to the results of Payero and Irmak (2013) [17], with one exception of Sig WW in 2017, the most dominant variable with the highest r of 0.92 was VPD. There was one exception, Sig (2017), which possessed only a slightly higher r (0.01) for Ta (0.74) than for VPD (0.73). In this case, the variation in r between Ta and VPD was so small that it was not worth considering separately. VPD integrated the impact of both Ta and RH, explaining 76, 73 and 74% of variability in ETR for Sin WW 2017, 2018 and Sig WW (2018), respectively. The only exception was Sig WW, in which Ta was the dominant meteorological variable (74% variability) during 2017. Lower r values ranging from 0.58 to 0.74 were observed with Ta and measured ETR. This meteorological variable, which is related to available energy, was the second most relevant factor in determining daily ETR. The sizes of r for Ta were followed by RH (scattering throughout −0.50), which was the third meteorological variable that most influenced measured ETR. The only inefficient meteorological variable related to measured ETR was u. However, it is important to point out that the factors controlling ETR interact within the soil-crop-atmosphere continuum, including soybean ETR. Results in our analysis, in accordance with the findings of Liu and Feng (2012) [64], revealed that the most important factors in ETR were VPD (atmospheric water demand) and two energy sources (Ta and Rn).
It is worth noting that Sadok and Sinclair (2009) [65] found genetic variability in the ETR to VPD relationship when studying 22 genotypes from a recombined inbred line (RIL) population and their parents in Gainesville, FL, USA (29° N). They reported that VPD at which plants limit ETR might vary in different genotypes. Depending on the genotype, VPD reached a maximum ETR at a VPD ranging from 1.3 to 2 kPa. The above conclusion was strengthened by Gilbert et al. (2011) [66], who investigated 11 soybean genotypes at Harvard University, Cambridge, MA, USA (42° N) in 2009.
Every meteorological variable was included in the multiple stepwise regression analysis (Table 6). On the basis of the current analysis, VPD impacted measured ETR the most with only one exception, Sig WW during 2017, where Ta became the dominant variable (first equations in Table 6). The second equation in every treatment—except for Sig WW in 2018—were completed with the meteorological variable Ta. In the case of Sig WW in 2018, VPD was completed with RH.

3.6. Relationship between Seed Yield and Seasonal Water Use

Due to the higher and more evenly distributed PR in 2018, 14.2% (p < 0.001) and 6.7% (p < 0.001) higher seed yields were produced in the rainfed crop than in the previous (2017) season (Figure 11). Unlimited watering and partial water withdrawal equalized seed production between the two studied seasons. Irrespective of the season, seed yield was significantly lower with declining water supply. Compared to the RO treatments, the WW crops with unlimited watering produced highest seed yield. The two-season increments in yield for WW ranged from 50.3 (Sig 2017 p < 0.001) to 68.7% (Sin 2018) (p < 0.001) relative to values for RO. The seed yield of rainfed crops were intermediate between the WW and RO production results. Lower, but highly significant decreases in seed yield of P varied between 30 and 40% (p < 0.001), when compared to the results of WW. However, with one exception of Sin (in 2018; p < 0.001), variation in seed yield between rainfed and RO crops was not statistically significant (p = 0.085–0.315).
Regression analysis between seed yield and cumulative ETR of soybean showed a quadratic relationship for all water/variety treatments for the two growing seasons (Figure 12). The second-order polynomial function, which had a determination coefficient of 0.85 (p < 0.001; RMSE: 0.05), implied that irrigation seemed to be an effective tool to increase soybean yield on the current study site. However, it should be noted that continuously high soil water content in an evapotranspirometer may also expose the soybean to harm. Among others, Bajgain et al. (2015) [45] observed in soybean variety Enrei, in Kyoto, Japan (34° N) between 2010 and 2011, that leaf gas exchange was negatively affected by excessive water, demonstrating a decline in physiological activity, LAI and seed yield by about 25–30%. The temporary increase (seed-filling stage) in water tables negatively affected the growth and seed yield of soybean, variety Fukuyutaka in Fukuoka, Japan (33° N) between 2011 and 2013 [42]. In contrast, Rhine et al. (2010) [67] identified significant variation in excessive water tolerance of five different soybean cultivars placed into the Missouri Soybean Variety Testing Program at Hayward, Missouri (36° N), in a three-year cultivar screening trial.
Candogan et al. (2013) [55] published the same quadratic relationship (seed yield = −5 × 10−6x2 + 0.0094x − 0.683, R2 = 0.905) obtained through a comparison between seed yield and ETR of soybean cultivar Nova in Bursa, Turkey (40° N) for the 2005 and 2006 seasons.
In the case of rainfed crops, to estimate the amount of total ETR, a simplified soil water balance method [62] is applied to the top 1 m of soil, which is 0.4 m deeper than the bulk root zone of soybean. AWS (available water storage) data before seeding and just after harvesting were used to assess the total amount of lost water (ETR). The difference between these two AWS data sets supplemented with seasonal PR sums accounted for seasonal ETR in rainfed crops. It is worth noting that the AWS of rainfed crops in the present study (data not shown) were almost greater than the threshold level fixed to 50% depletion of total AWS as reported by Gajic et al. (2018) [14] for soybean variety Zena in Vojvodina, Serbia (44° N) over 2006–2008.
The WUE values ranged between 0.7 ± 0.02 (Sig 2017) and 0.89 ± 0.04 (Sin 2018), 0.92 ± 0.12 (Sig 2018) and 1.0 ± 0.04 (Sin 2017), and 0.69 ± 0.03 (Sig 2018) and 1.16 ± 0.06 (Sin 2016) for WW, RO and P, respectively (Figure 13).
WUE of 0.52–0.72 and 0.65–0.66 in well-watered and water-stressed soybean (variety: Talon), respectively, in Bari, Italy (41° N), were slightly lower than the values of 0.77 published by Katerji et al. (2008) [68]. Surprisingly, the WUE values in that study were only moderately lower than those (1.0–1.7 and 0.8–1.1 kg m−3) for rainfed (var. TMG1180 RR) and irrigated (var. M8210 Ipro) soybean, respectively, as noted by Lathuilliére et al. (2018) [69] at Capuaba farm, Lucas do Rio Verde, Mato Grosso (13° S). Probably due to less PR in 2017, the WUE of rainfed Sin and Sig were 34.5% (p < 0.001) and 36.5% (p < 0.001) higher than that in Sin WW and Sig WW, respectively. As a consequence of even and abundant PR events during 2018, the variation in WUE between WW and P ceased completely (Sig), or was reduced by only a few percent in Sin. We assume that the seasonal PR sum during 2018 might be high enough to allow almost maximum seed yield, even in rainfed crops. The lowest WUE values were obtained in WW irrespective of the variety. Rainfed conditions increased soybean WUE by as much as 35–40%, consistent with the results of Montoya et al. (2017) [39] and Candogan et al. (2013) [55]. WUE above 0.75 under semiarid conditions (Nebraska, USA; 41° N), for three consecutive growing seasons resulted in maximum seed yield in soybean (Payero et al. 2005) [52]. Regarding the WUE results in our study, before drawing conclusions based on earlier investigations, a critical overview of data derived from other locations with different climatic conditions is necessary.
WUE was influenced by V (p < 0.001), S (p = 0.001) and W (p < 0.001) and some of their interactions (p < 0.001), with two exceptions, non-significant V × S (p = 0.325) and V × S × W (p = 0.713) effects on WUE. The non-significant V × S interaction revealed that the response of seasons on WUE did not differ between both varieties.

4. Conclusions

The aim of the present study was to investigate ETR and a few related determinants of ETR in two soybean varieties differing in water demands for three different water supply levels over the two growing seasons (2017 and 2018). Among two of the controlled water treatments used, WW crops were grown in an evapotranspirometer that was traditionally operated. The RO crop received 50% of its water requirement through specially converted evapotranspirometers from the R1 developmental stage. The third treatment was rainfed soybean.
There were three differences in soybean’s features related to water demands.
1. Irrespective of the variety and season, declines in seasonal mean LAI of RO were two-fold higher than the mean LAI of P. A higher SPAD of RO and P, but not of all treatments, suggested that the seasonal amount/distribution of PR is one of the main weather variables limiting the dry land SPAD value, whose size might enhance photosynthesis and related determinants of crop yield at the study site. Daily mean ETR reported in the current study for WW was, on average, about 65–75% greater than in RO for both varieties. Regarding the two soybean varieties, Sin WW used only 6.1% more water than Sig WW, averaged across the two seasons. Unexpectedly, water stress-tolerant Sin used slightly more water than Sig, the variety that was bred for “normal” weather conditions, and which should be more vulnerable to water-deprived environments. It is important to note that these ETR values were determined under an unlimited water supply in an evapotranspirometer. The cumulative ETR curves were far from the PR totals in the studied area over the two-season period. In both growing seasons, the impact of season on mean Kc in both soybean varieties was insignificant.
2. ETR and the impact of meteorological variables on ETR: The most consistent meteorological variable related to soybean ETR was VPD, irrespective of season. The higher ETR totals in 2017 than in 2018 call attention to the importance of being informed about more detailed meteorological variables than monthly (seasonal) means. Despite an approximately 1.5 °C higher seasonal mean Ta in 2018, the ranges of daily mean ETR were narrower than during the cooler 2017 growing season. A detailed analysis based on recognized daily variation and extreme Ta certified that daily Tamax values could also sometimes play a significant role in soybean ETR. The lower VPD in summer also contributed to the lower ETR during 2018. Interestingly, even when Tamax and ETR/evapotranspiration total increased, the WUE in different water supplies hardly varied in 2018.
3. The adaptability of a previously applied technical conversion of evapotranspirometers was confirmed, affirming thus that the reconstructed devices allow water deprivation under field conditions.
In Hungary, seasonal PR sums were insufficient to cover soybean’s water demand and irrigation was required in both seasons. From this standpoint, PR sums might greatly constrain water availability for soybean growth at Keszthely. Irrigation is one possible option that soybean growers might have to adapt to account for PR variability which is relevant to areas that are vulnerable to the negative impacts of global climate, change as the Carpathian Basin.

Author Contributions

Conceptualization, A.A.; methodology and formal analysis, G.S. and L.M.; software, G.S.; investigation, G.S. and B.S.; data curation, A.A., B.S., G.S. and L.M.; visualization, B.S. and L.M.; writing—original draft preparation, A.A. and J.A.T.d.S.; writing—review and editing, A.A. and J.A.T.d.S.; project administration, Z.F. All authors have read and agreed to the published version of the manuscript.

Funding

A special thanks to Karintia Ltd. for their kindness by supporting us by donating good-quality, disease-free soybean seed.

Acknowledgments

The research leading to these results received funding from the Hungarian Government and the European Regional Development Fund of the European Union in the frames of the Széchenyi 2020 Programme, under project number GINOP-2.3.2-15-2016-00029.

Conflicts of Interest

The authors declare no conflicts of interest.

References

  1. Proházka, P.; Stranc, P.; Pazderu, K.; Stranc, J.; Vostrel, J. Effects of biologically active substances used in soybean seed treatment on oil, protein and fibre content of harvested seeds. Plant Soil Environ. 2017, 63, 564–568. [Google Scholar]
  2. Tyagi, S.D.; Khan, M.H.; Teixeira da Silva, J.A. Yield stability of some soybean genotypes across diverse environments. Int. J. Plant Breed. 2011, 5, 37–41. [Google Scholar]
  3. El Sabagh, A.; Hossain, A.; Islam, M.S.; Barutçular, C.; Ratnasekera, D.; Kumar, N.; Meena, R.S.; Gharib, H.S.; Saneoka, H.; Teixeira da Silva, J.A. Sustainable soybean production and abiotic stress management in saline environments: A critical review. Aust. J. Crop Sci. 2019, 13, 228–236. [Google Scholar] [CrossRef]
  4. KSH. Statisztikai Tükör (Statistical Mirror); Központi Statisztikai Hivatal: Budapest, Hungary; Available online: http://www.ksh.hu/docs/hun/xftp/gyor/vet/vet1806.pdf (accessed on 3 August 2018). (In Hungarian)
  5. Thuzar, M.; Puteh, A.; Abdullah, N.; Lassim, M.M.; Jusoff, K. The effects of temperature stress on the quality and yield of soya bean [(Glycine max L.) Merrill.]. J. Agric. Sci. 2010, 2, 172–179. [Google Scholar]
  6. Anda, A.; Soós, G. Some physiological responses of agricultural crops to global warming. Időjárás 2016, 120, 85–101. [Google Scholar]
  7. Wang, T.; Tang, X.; Zheng, C.; Gu, Q.; Wei, J.; Ma, M. Differences in ecosystem water-use efficiency among the typical croplands. Agric. Water Manag. 2018, 209, 142–150. [Google Scholar] [CrossRef]
  8. Karam, F.; Maasad, R.; Sfeir, T.; Mounzer, O.; Rouphael, Y. Evapotranspiration and seed yield of field grown soybean under deficit irrigation conditions. Agric. Water Manag. 2005, 75, 226–244. [Google Scholar] [CrossRef]
  9. Ergo, V.V.; Lascano, R.; Vega, C.R.C.; Parola, R. Heat and water stressed field-grown soybean: A multivariate study on the relationship between physiological-biochemical traits and yield. Environ. Exp. Bot. 2018, 148, 1–11. [Google Scholar] [CrossRef]
  10. Borhan, M.S.; Panigrahi, S.; Satter, M.A.; Gu, H. Evaluation of computer imaging technique for predicting the SPAD readings in potato leaves. Inform. Proc. Agric. 2017, 4, 275–282. [Google Scholar] [CrossRef]
  11. Campbell, G.S.; Norman, J.M. An Introduction to Environmental Biophysics; Springer: New York, NY, USA, 1998. [Google Scholar]
  12. Pongrácz, R.; Bartholy, J.; Kis, A. Estimation of future precipitation conditions for Hungary with special focus on dry periods. Időjárás 2014, 118, 305–321. [Google Scholar]
  13. Anapalli, S.S.; Fisher, D.K.; Reddy, K.N.; Wagle, P. Quantifying soybean evapotranspiration using eddy covariance approach. Agric. Water Manag. 2018, 209, 228–239. [Google Scholar] [CrossRef]
  14. Gajić, B.; Kresović, B.; Tapanarova, A.; Životić, L.; Todorović, M. Effect of irrigation regime on yield, harvest index and water productivity of soybean grown under different precipitation conditions in a temperate environment. Agric. Water Manag. 2018, 210, 224–231. [Google Scholar] [CrossRef]
  15. Luo, C.; Wang, Z.; Sauer, T.J.; Helmers, M.J.; Horton, R. Portable canopy chamber measurements of evapotranspiration in corn, soybean, and reconstructed prairie. Agric. Water Manag. 2018, 198, 1–9. [Google Scholar] [CrossRef] [Green Version]
  16. Zhang, B.; Feng, G.; Ahuja, L.R.; Kong, X.; Ouyang, Y.; Adeli, A.; Jenkins, J.N. Soybean crop-water production function in a humid region across years and soils determined with APEX model. Agric. Water Manag. 2018, 204, 180–191. [Google Scholar] [CrossRef]
  17. Payero, J.O.; Irmak, S. Daily energy fluxes, evapotranspiration and crop coefficient of soybean. Agric. Water Manag. 2013, 129, 31–43. [Google Scholar] [CrossRef]
  18. Bowen, I.S. The ratio of heat losses by conduction and by evaporation from any water surface. Phys. Rev. 1926, 27, 779–787. [Google Scholar] [CrossRef] [Green Version]
  19. Irmak, S.; Mutiibwa, D.; Irmak, A.; Arkebauer, T.J.; Weiss, A.; Martin, D.L.; Eisenhauer, D.E. On the scaling up leaf stomatal resistance to canopy resistance using photosynthetic photon flux density. Agric. For. Meteorol. 2008, 148, 1034–1044. [Google Scholar] [CrossRef]
  20. Singer, J.W.; Heitman, J.L.; Hernandez-Ramirez, G.; Sauer, T.J.; Prueger, J.F.; Hatfield, J.L. Contrasting methods for estimating evapotranspiration in soybean. Agric. Water Manag. 2010, 98, 157–163. [Google Scholar] [CrossRef]
  21. Mbangiwa, N.C.; Savage, M.J.; Mabhaudhi, T. Modelling and measurement of water productivity and total evaporation in a dryland soybean crop. Agric. For. Meteorol. 2019, 266–267, 65–72. [Google Scholar] [CrossRef]
  22. Wallace, J.S.; Lloyd, C.R.; Sivakumar, M.V.K. Measurements of soil, plant, and total evaporation from millet in Niger. Agric. For. Meteorol. 1993, 63, 149–169. [Google Scholar] [CrossRef]
  23. Suyker, A.E.; Verma, S.B. Interannual water vapor and energy exchange in an irrigated maize-based agroecosystem. Agric. For. Meteorol. 2008, 148, 417–427. [Google Scholar] [CrossRef]
  24. Baker, J.M.; van Bavel, C.H.M. Measurement of mass flow of water in the stems of herbaceous plants. Plant Cell Environ. 1987, 10, 777–782. [Google Scholar]
  25. Kamkar, B.; Langeroodi, A.R.S.; Teixeira da Silva, J.A.; Nodehi, D.A.; Lack, S.; Ghooshchi, F. Study on crop-water production functions for soybean in Mediterranean climatic conditions. Sci. J. Agron. Plant Breed. 2013, 1, 6–21. [Google Scholar]
  26. Anda, A.; Soós, G.; Menyhárt, L.; Kucserka, T.; Simon, B. Yield features of two soybean varieties under different water supplies and field conditions. Field Crop. Res. 2020, 245, 107673. [Google Scholar] [CrossRef]
  27. Fehr, W.R.; Caviness, C.E. Stages of Soybean Development; Special Report 80; Iowa State University: Ames, IA, USA, 1977. [Google Scholar]
  28. Vollmann, M.; Antoniw, K.; Hartung, F.-M.; Renner, B. Social support as mediator of the stress buffering effect of optimism: The importance of differentiating the recipients’ and providers’ perspective. Personal. Soc. Relat. 2011, 25, 146–154. [Google Scholar] [CrossRef]
  29. WRB. World Reference Base for Soil Resources 2015. International Soil Classification System for Naming Soils and Creating Legends for Soil Maps; Food and Agriculture Organization of the United Nations, Viale delle Terme di Caracalla, 00100 Rome, Italy. 2006. Available online: http://www.fao.org/3/i3794en/I3794en.pdf (accessed on 6 May 2020).
  30. Ritchie, J. Water dynamics in the soil-plant-atmosphere system. Plant Soil 1981, 58, 81–96. [Google Scholar] [CrossRef]
  31. Anda, A.; Simon, B.; Soós, G.; Teixeira da Silva, J.A.; Kucserka, T. Crop-water relation and production of two soybean varieties under different water supplies. Theor. Appl. Climatol. 2019, 137, 1515–1528. [Google Scholar] [CrossRef]
  32. Monteith, J.L. Evaporation and environment. In The State and Movement of Water in Living Organism, Proceedings of the XIX. Symp. Soc. Exp. Biol.; Fogg, G.E., Ed.; Cambridge University Press: Cambridge, UK, 1965; Volume 19, pp. 205–234. [Google Scholar]
  33. Penman, H.L. Natural evaporation from open water, bare soil and grass. Proc. Royal Soc. Lond. Ser. A Math. Phys. Sci. 1948, 193, 120–145. [Google Scholar]
  34. Allen, R.G.; Clemmens, A.J.; Burt, C.M.; Solomon, K.; O’Halloran, T. Prediction accuracy for project wide evapotranspiration using crop coefficients and reference evapotranspiration. J. Irrig. Drain. Eng. ASCE 2005, 131, 24–36. [Google Scholar] [CrossRef] [Green Version]
  35. Soós, G.; Anda, A. A methodological study on local application of the FAO-56 Penman-Monteith reference evapotranspiration equation. Georgikon For. Agric. 2014, 18, 71–85. [Google Scholar]
  36. Howell, T.A.; Evett, S.R.; Tolk, J.A.; Copeland, K.S.; Dusek, D.A.; Colaizzi, P.D. Crop coefficients developed at Bushland, Texas for corn, wheat, sorghum, soybean, cotton, and alfalfa. In Proceedings of the World Water and Environmental Resources Congress. Examining the Confluence of Environmental and Water Concerns, Omaha, NH, USA, 21–25 May 2006; CDROM: Omaha, NH, USA, 2006. [Google Scholar]
  37. SPSS Inc. SPSS for Windows User’s Guide Series, Release 7.0; SPSS Inc.: Chicago, IL, USA, 1996. [Google Scholar]
  38. R Core Team. A Language and Environment for Statistical Computing; R Foundation for Statistical Computing: Vienna, Austria, 2018; Available online: https://www.R-project.org/ (accessed on 20 December 2018).
  39. Montoya, F.; García, C.; Pintos, F.; Otero, A. Effects of irrigation regime on the growth and yield of irrigated soybean in temperate humid climatic conditions. Agric. Water Manag. 2017, 193, 30–45. [Google Scholar] [CrossRef]
  40. Kross, A.; Lapen, D.R.; McNairn, H.; Sunohara, M.; Champagne, C.; Wilkes, G. Satellite and in situ derived corn and soybean biomass and leaf area index: Response to controlled tile drainage under varying weather conditions. Agric. Water Manag. 2015, 160, 118–131. [Google Scholar] [CrossRef]
  41. Akhtar, K.; Wang, W.; Khan, A.; Ren, G.; Afridi, M.Z.; Feng, Y.; Yang, G. Wheat straw mulch offset soil moisture deficient for improving physiological and growth performance of summer sown soybean. Agric. Water Manag. 2019, 211, 16–25. [Google Scholar] [CrossRef]
  42. Matsuo, N.; Takahashi, M.; Yamada, T.; Takahashi, M.; Hajka, M.; Fukami, K.; Tsuchiya, S. Effects of water table management and row width on the growth and yield of three soybean cultivars in southwestern Japan. Agric. Water Manag. 2017, 192, 85–97. [Google Scholar] [CrossRef]
  43. Setiyono, T.D.; Weiss, A.; Specht, J.E.; Cassman, K.G.; Dobermann, A. Leaf area index simulation in soybean grown under near-optimal conditions. Field Crops Res. 2008, 108, 82–92. [Google Scholar] [CrossRef] [Green Version]
  44. Anda, A.; Simon, B.; Menyhárt, L.; Soós, G.; Kucserka, T. Investigation on soybean leaf area influenced by water supply. Időjárás 2019, 123, 73–87. [Google Scholar] [CrossRef] [Green Version]
  45. Bajgain, R.; Kawasaki, Y.; Akamatsu, Y.; Tanaka, Y.; Kawamura, H.; Katsura, K.; Shiraiwa, T. Biomass production and yield of soybean grown under converted paddy fields with excess water during the early growth stage. Field Crops Res. 2015, 180, 321–327. [Google Scholar] [CrossRef]
  46. Charles-Edwards, D.A.; Stutzel, H.; Ferraris, R.; Beech, D.F. An analysis of spatial variation in the nitrogen content of leaves from different horizons within a canopy. Ann. Bot. 1987, 60, 421–426. [Google Scholar] [CrossRef]
  47. Dinpashoh, Y.; Jhajharia, D.; Fakheri-Fard, A.; Singh, V.P.; Kahya, E. Trends in reference crop evapotranspiration over Iran. J. Hydrol. 2011, 399, 422–433. [Google Scholar] [CrossRef]
  48. McMaster, G.S.; Wilhelm, W.W. Growing degree-days: One equation, two interpretations. Agric. For. Meteorol. 1997, 87, 291–300. [Google Scholar] [CrossRef] [Green Version]
  49. Bagg, J.; Banks, S.; Baute, T.; Bohner, H.; Brown, C.; Cowbrough, M.; Hall, B.; Hayes, A.; Johnson, P.; Martin, H.; et al. Agronomy Guide for Field Crops: Publication 811; Brown, C., Ed.; Ministry of Agriculture, Food and Rural Affairs: Toronto, ON, Canada, 2009.
  50. Dornbos, D.L., Jr.; Mullen, R.E. Influence of stress during soybean seed fill on seed weight, germination, and seedling growth rate. Can. J. Plant Sci. 1991, 71, 373–383. [Google Scholar] [CrossRef] [Green Version]
  51. Wei, Z.; Paredes, P.; Liu, Y.; Chi, W.W.; Pereira, L.S. Modelling transpiration, soil evaporation and yield prediction of soybean in North China Plain. Agric. Water Manag. 2015, 147, 43–53. [Google Scholar] [CrossRef]
  52. Payero, J.O.; Melvin, S.; Irmak, S. Response of soybean to deficit irrigation in the semi-arid environment of west-central Nebraska. Trans. ASAE 2005, 48, 2189–2203. [Google Scholar] [CrossRef] [Green Version]
  53. Doorenbos, J.; Kassam, J.H. FAO Irrigation and Drainage Paper; No. 33; FAO: Rome, Italy, 1979; p. 193. [Google Scholar]
  54. Sincik, M.; Candogan, B.N.; Demirtas, C.; Büyükcangaz, H.; Yazgan, S.; Göksoy, A.T. Deficit irrigation of soybean [Glycine max (L.) Merr.] in a sub-humid climate. J. Agron. Crop Sci. 2008, 194, 200–205. [Google Scholar] [CrossRef]
  55. Candogan, B.N.; Sincik, M.; Buyukcangaz, H.; Demirtas, C.; Goksoy, A.T.; Yazgan, S. Yield, Quality and crop water stress index relationships for deficit-irrigated soybean [Glycine max (L.) Merr.] in sub-humid climatic conditions. Agric. Water Manag. 2018, 118, 113–121. [Google Scholar] [CrossRef]
  56. Patil, C.S.; Manickam, R. Crop evapotranspiration and crop coefficient of soybean (Glycine max L. Merrill) in Bengaluru, Karnataka. J. Agrometeorol. 2017, 19, 292–293. [Google Scholar]
  57. Kuo, S.F.; Ho, S.S.; Liu, C.W. Estimation irrigation water requirements with derived crop coefficients for upland and paddy crops in ChiaNan Irrigation Association, Taiwan. Agric. Water Manag. 2006, 82, 433–451. [Google Scholar] [CrossRef]
  58. Jagtap, S.S.; Jones, J.W. Stability of crop coefficients under different climate and irrigation management practices. Irrig. Sci. 1989, 10, 231–244. [Google Scholar] [CrossRef]
  59. Tabrizi, M.S.; Masoud, P.; Babazadeh, H. Efficacy of partial root drying technique for optimizing soybean crop production in semi-arid regions. Irrig. Drain. 2012, 61, 80–88. [Google Scholar] [CrossRef]
  60. Paredes, P.; Wie, Z.; Liu, Y.; Xu, D.; Xin, Y.; Zhang, B.; Pereira, L.S. Performance assessment of the FAO AquaCrop model for soil water, soil evaporation, biomass and yield of soybeans in North China Plain. Agric. Water Manag. 2015, 152, 57–71. [Google Scholar] [CrossRef] [Green Version]
  61. Irmak, S.; Odhiambo, L.O.; Specht, J.E.; Djaman, K. Hourly and daily single and basal evapotranspiration crop coefficients as a function of growing degree days, days after emergence, leaf area index, fractional green canopy cover, and plant phenology for soybean. Trans. ASABE 2013, 56, 1785–1803. [Google Scholar]
  62. Allen, R.G.; Pereira, L.S.; Raes, D.; Smith, M. Crop Evapotranspiration-Guidelines for Computing Crop Water Requirements-FAO Irrigation and Drainage Paper 56; FAO: Rome, Italy, 1998. [Google Scholar]
  63. Allen, R.G.; Pereira, L.S. Estimating crop coefficients from fraction of ground cover and height. Irrig. Sci. 2009, 28, 17–34. [Google Scholar] [CrossRef] [Green Version]
  64. Liu, H.-Z.; Feng, J.-W. Seasonal and interannual variation of evapotranspiration and energy exchange over different land surfaces in a semi-arid area of China. J. Appl. Meteorol. Climatol. 2012, 51, 1875–1888. [Google Scholar]
  65. Sadok, W.; Sinclair, T.R. Genetic variability of transpiration response to vapor pressure deficit among soybean (Glycine max [L.] Merr.) genotypes selected from a recombinant inbred line population. Field Crops Res. 2009, 113, 156–160. [Google Scholar] [CrossRef]
  66. Gilbert, M.E.; Zwieniecki, M.A.; Holbrook, N.M. Independent variation in photosynthetic capacity and stomatal conductance leads to differences in intrinsic water use efficiency in 11 soybean genotypes before and during mild drought. J. Exp. Bot. 2011, 62, 2875–2887. [Google Scholar] [CrossRef]
  67. Rhine, M.D.; Stevens, G.; Shannon, G.; Wrather, A.; Sleper, D. Yield and nutritional responses of waterlogging of soybean cultivars. Irrig. Sci. 2010, 28, 135–142. [Google Scholar] [CrossRef]
  68. Katerji, N.; Mastrorilli, M.; Rana, G. Water use efficiency of crops cultivated in the Mediterranean region: Review and analysis. Eur. J. Agron. 2008, 28, 493–507. [Google Scholar] [CrossRef]
  69. Lathuillière, M.J.; Dalmagro, H.J.; Black, T.A.; de Arruda, P.H.Z.; Hawthorne, I.; Couto, E.G.; Johnson, M.S. Rain-fed and irrigated cropland-atmosphere water fluxes and their implications for agricultural production in Southern Amazonia. Agric. For. Meteorol. 2018, 256–257, 407–419. [Google Scholar] [CrossRef]
Figure 1. A sketch of the study site at Keszthely Agrometeorological Research Station, where (a) and (b) denote the experimental field and observation garden, respectively. Three water treatments and measuring towers (●) were placed, as shown in a, as follows: X, rainfed plots; 1, 1–12 evapotranspirometer pots in the field. The evapotranspirometers’ pots with different water and variety treatments are highlighted as follows: ■, pots of a traditional evapotranspirometer with Sinara (Sin WW); ◘, pots of water-stressed treatment with Sinara (Sin RO); ■, pots of a traditional evapotranspirometer with unlimited water in Sigalia (Sig WW); Atmosphere 11 00830 i001
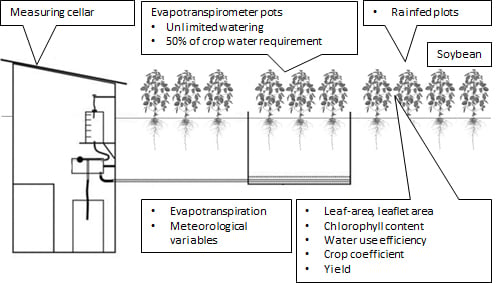
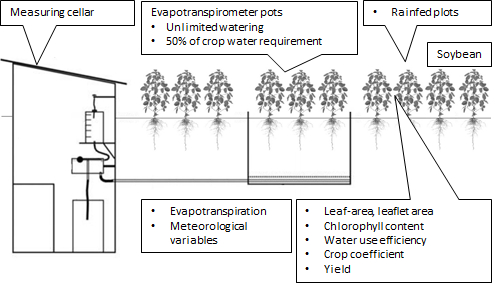
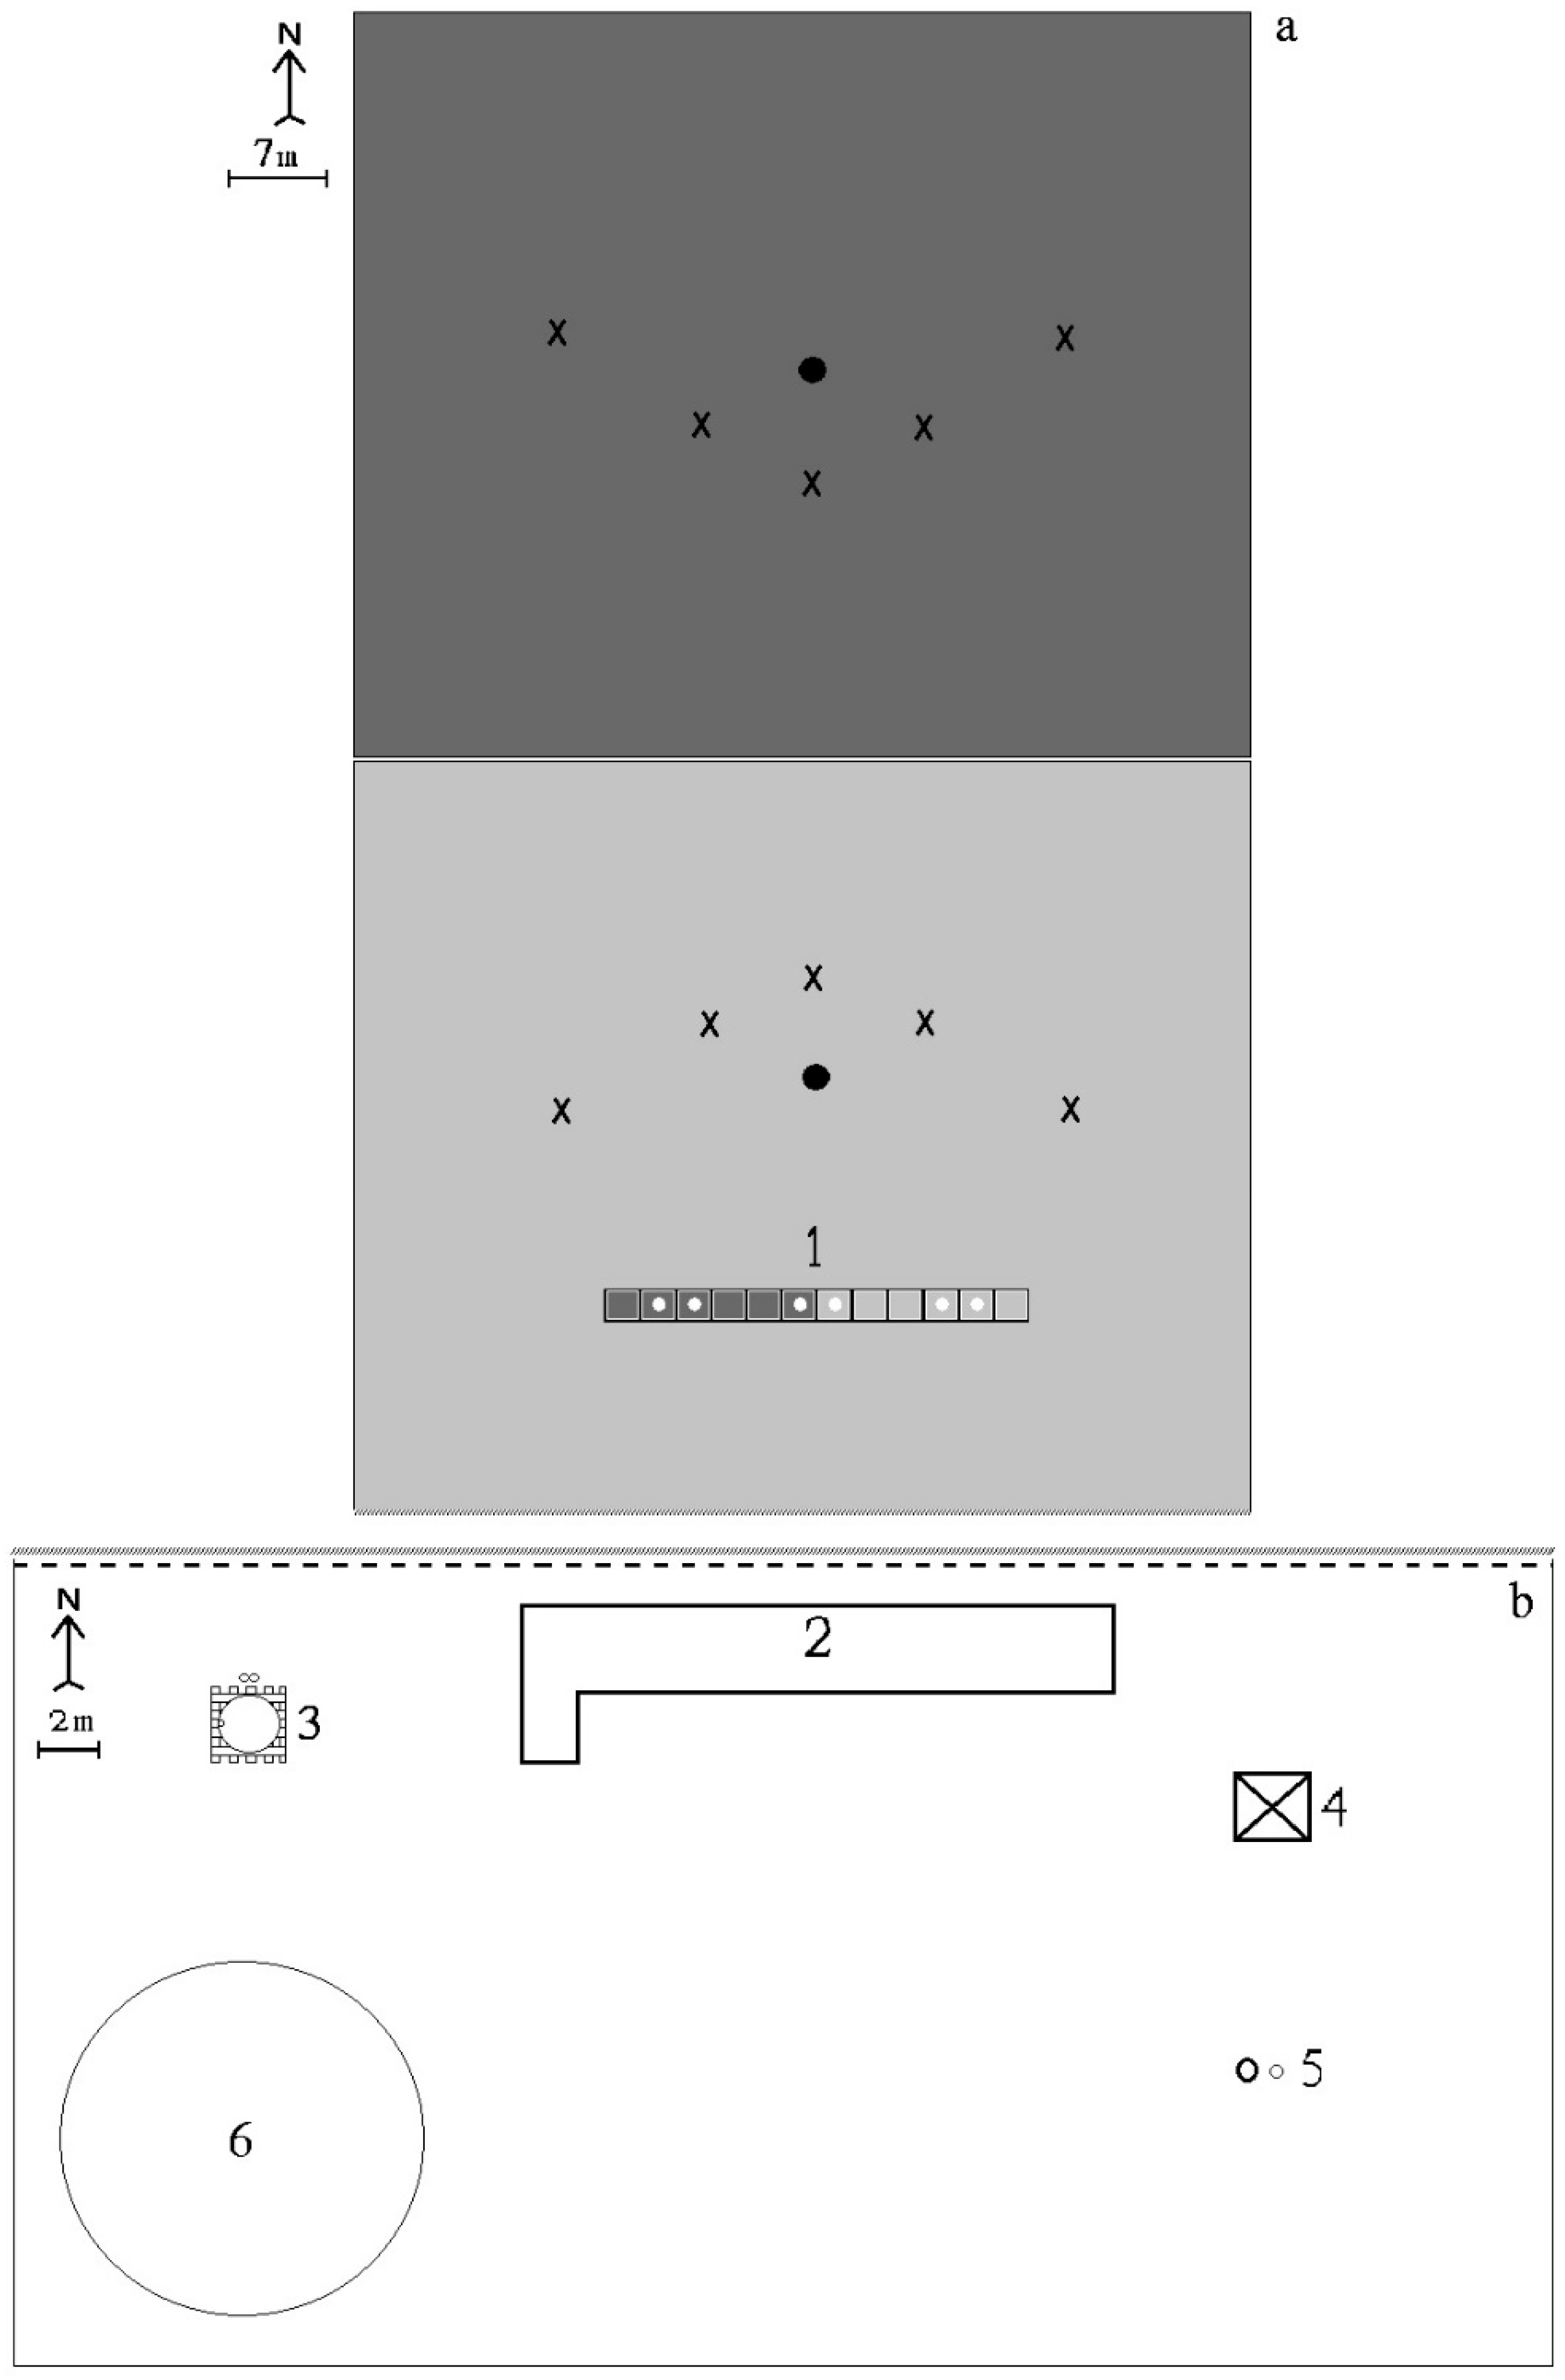
, pots of water-stressed treatment with Sigalia (Sig RO). In (b) the following abbreviations were used: 2, measuring cellar; 3, US class “A” pan; 4, wind tower with a pyranometer; 5, QLC-50 automatic climate station; 6, evaporation pan with a surface area of 20 m2. The same experimental setup was used in both observation seasons (2017 and 2018). Several plant indicators (phenology, leaf and leaflet areas, chlorophyll index, yield, water use efficiency) were measured in all water and variety treatments (upper part (a): 1 and X). Daily evapotranspiration was measured in (a) 1, 1–12 evapotranspirometer pots. The crop coefficient was derived from these equipment pots. Evapotranspiration totals were also estimated from the field (a). All meteorological variables were derived from observational garden (b).
Atmosphere 11 00830 g001
Figure 2. Length of soybean phenological phases in 2017 and 2018 based on days after sowing (DAS) according to Fehr and Caviness (1977) [27]. Top figure = 2017; bottom figure = 2018. Abbreviations: VE—emergence; V3—third node; V5—fifth node; R1—start of bloom; R2—full bloom; R3—start of pod; R4—full pod; R5—start of seed; R6—full seed; R7—start of maturity; R8—full maturity. X-axis: day of year (DAS). WW—evapotranspirometer with unlimited water supply; RO—50% water deprivation in evapotranspirometer; P—rainfed. V—vegetative; R—reproductive. DAS—days after sowing.
Atmosphere 11 00830 g002
Figure 3. Seasonal mean leaf area index (LAI) of soybean varieties Sinara (Sin) and Sigalia (Sig) in rainfed (P), unlimited (WW) and water-stressed (RO) conditions over two consecutive growing seasons (2017 and 2018) at Keszthely, in Hungary. Lower-case letters at the top of the graph indicate the LAI subsets by Tukey’s test.
Atmosphere 11 00830 g003
Figure 4. Seasonal mean leaf area index (LAI) boxplots that highlight the water-season interaction during the 2017 and 2018 growing seasons.
Atmosphere 11 00830 g004
Figure 5. Middle and outer leaflet areas in different leaf levels of soybean during flowering through two growing seasons of 2016 and 2017.
Atmosphere 11 00830 g005
Figure 6. SPAD values in water-season combinations. Letters at the top indicate homogeneous groups by Tukey’s honestly significant difference (HSD) test. The three water supply levels were: unlimited water, WW; water withdrawn, RO and rainfed, P crops.
Atmosphere 11 00830 g006
Figure 7. Daily mean evapotranspiration rates (ETR) of treated soybean varieties (Sinara: Sin; Sigalia: Sig) under unlimited (WW) and limited (RO) watering levels through two consecutive growing seasons (2017 and 2018) at Keszthely.
Atmosphere 11 00830 g007
Figure 8. Distribution of the daily evapotranspiration rates (ETR) in two soybean varieties (Sinara: Sin and Sigalia: Sig) under two watering levels (WW: unlimited water; RO: water withdrawn) of crops between 2017 and 2018.
Atmosphere 11 00830 g008
Figure 9. Distribution of daily maximum air temperatures observed at the Keszthely Agrometeorological Research Station, between the summers of 2017 and 2018 (from June to August). Vertical line is the upper bound of the optimum temperature range of soybean.
Atmosphere 11 00830 g009
Figure 10. (a,b) Relationship between daily measured evapotranspiration rate (ETR) in Sinara (Sin WW) and Sigalia (Sig WW) and daily reference evapotranspiration (ET0) over the 2017 (a) and 2018 (b) growing seasons. ET0 was derived from the FAO-56 equation (Penman–Monteith).
Atmosphere 11 00830 g010
Figure 11. (a,b) Seasonal variation in reference evapotranspiration (ET0) based on crop coefficients (Kc) for two soybean varieties, Sinara (Sin) and Sigalia (Sig), during 2017 (a) and 2018 (b) at Keszthely, Hungary.
Atmosphere 11 00830 g011
Figure 12. Relationship between seed yield (kg m−2) and total seasonal evapotranspiration (ETR; mm) of two soybean varieties over the 2017 and 2018 growing seasons.
Atmosphere 11 00830 g012
Figure 13. Water use efficiency (WUE) of two varieties (Sinara: Sin; Sigalia: Sig) in unlimited (WW), water-stressed (RO) and rainfed (P) soybean, during 2017 and 2018. Values are the mean ± standard deviation of the mean (n = 5).
Atmosphere 11 00830 g013
Table 1. Meteorological variables, monthly mean air temperatures (Ta), rainfall sums (PR) and vapor pressure deficits (VPD), measured at Keszthely Agrometeorological Research Station during the 2017 and 2018 growing seasons. The climate norms represent the time period between 1971 and 2000.
AprilMayJuneJulyAugustSeptember
Mean air temperature, Ta [°C] Mean
Climate norm10.515.718.720.520.115.716.9
201710.816.621.222.322.815.118.1
201815.318.820.521.722.616.919.3
Precipitation sum, PR [mm] Sum
Climate norm50.559.678.573.565.157.1384.4
201720.938.861.153.832.7140.1347.4
201813.468.4101.278.987.1128.7477.7
Vapor pressure deficit, VPD [kPa] Mean
Climate norm3.95.36.17.16.43.75.4
20174.35.57.68.69.23.16.4
20185.45.66.37.37.13.95.9
Table 2. ANOVA table of the final LAI model (non-significant parts were iteratively excluded from three-way full-factorial model including season, water and variety).
SourceSum of SquaresdfMean SquareFp-Value
Season1.8511.856.790.012
Water20.41210.2137.490.000
Season × water3.0821.545.660.006
Error14.70540.27
Table 3. Previously observed (estimated/simulated) daily Kc values for soybean grown at different geographical locations.
Kc for SoybeanStudied SeasonsLatitudeStudy SiteReference
Latitude below 15°
0.51–1.28312° NBangalore, IndiaPatil and Manickam (2017) [56]
Latitude between 16° and 30°
0.35–1.10123° NTaiwanKuo et al. (2006) [57]
0.73–1.30129° NGainesville, FL, USAJagtap and Jones (1989) [58]
0.19–1.12130° SKwaZulu-Natal, South AfricaMbangiwa et al. (2019) [21]
0.45–1.03 1130° SKwaZulu-Natal, South AfricaMbangiwa et al. (2019) [21]
Latitude between 31° and 40°
0.40–1.00231° SSalto, UruguayMontoya et al. (2017) [38]
0.48–1.02133° NStoneville, MS, USAAnapalli et al. (2018) [13]
0.62–1.00233° NBekaa Valley, LebanonKaram et al. (2005) [8]
1.00 1135° NKaraj, IranTabrizi et al. (2012) [59]
0.18–1.18 2335° NBushland, TX, USAHowell et al. (2006) [35]
0.18–1.00 2439° NDaxing, ChinaParedes et al. (2015) [60]
0.15–1.08439° NDaxin, ChinaWei et al. (2015) [51]
0.40–1.14240° NBursa, TurkeyCandogan et al. (2013) [55]
Latitude above 41°
0.27–1.03541° NMead, NE, USASuyker and Verma (2008) [23]
0.27–1.47341° NNebraska, USAIrmak et al. (2013) [61]
0.40–1.33441° NNorth Platte, Nebraska, USAPayero and Irmak (2013) [17]
0.15–1.15 3 40–45° N 4Central USAAllen et al. (1998) [62]
0.19–1.56246° NKeszthely, HungaryIn the current study
1 simulated; 2 estimated from a figure; 3 mid-season value only; 4 estimated position.
Table 4. The monthly mean crop coefficient (Kc) for three developmental stages (V: vegetative growth; R1–R6: from the start of bloom to full seed; R7–R8: from the start of maturity to full maturity) based on Fehr and Caviness (1977) [27]. Abbreviations: Sinara: Sin; Sigalia: Sig; WW: no limited water supply.
20172018
VR1–R6R7–R8Mean ± SDVR1–R6R7–R8Mean ± SD
Sin WW0.54 ± 0.221.21 ± 0.161.08 ± 0.280.97 ± 0.360.53 ± 0.121.00 ± 0.320.98 ± 0.410.85 ± 0.36
Sig WW0.45 ± 0.241.23 ± 0.190.92 ± 0.260.91 ± 0.390.54 ± 0.110.91 ± 0.270.90 ± 0.350.79 ± 0.30
Table 5. Correlation coefficient (r) between daily measured evapotranspiration rate (ETR) and weather variables including mean air temperature (Ta), relative humidity (RH), wind speed (u), net radiation (Rs), and vapor pressure deficit (VPD) for the two soybean varieties, Sinara (Sin) and Sigalia (Sig). Crops with unlimited watering (WW) were included in the study. ET0 represents the Penman-Monteith reference evapotranspiration.
Seasons ET0 (mm)Ta
(°C)
RH
(%)
VPD (kPa)u
(m s−1)
Rs
(MJ m−2 h−1)
2017Sin WW0.60 **0.73 **−0.51 **0.76 **−0.210.40 **
Sig WW0.56 **0.74 **−0.45 **0.73 **−0.480.38 **
2018Sin WW0.63 **0.58 **−0.52 **0.67 **0.090.45 **
Sig WW0.69 **0.61 **−0.58 **0.74 **0.100.49 **
Correlation is significant at the 0.05 level (2-tailed). ** Correlation is significant at the 0.01 level (2-tailed).
Table 6. Multiple stepwise regression analysis between meteorological elements (air temperature, Ta; relative humidity, RH; net radiation, Rs; wind speed, u; vapor pressure deficit, VPD) and measured soybean evapotranspiration rate (ETR) in varieties Sinara (Sin) and Sigalia (Sig). WW denotes unlimited watering.
Adjusted r2FF sig.SE of CoefficientRegression Equation
2017
Sin WW
Estimation 1
0.574177.6770.000Const. = 0.422
VPD = 0.523
ETR = 6.968VPD-0.015
Sin WW
Estimation 2
0.615105.7120.000Const. = 0.889
VPD = 0.832
Ta = 0.063
ETR = 4.396VPD + 0.243Ta-3.070
Sig WW
Estimation 1
0.541155.6830.000Const. = 0.922
Ta = 0.044
ETR = 0.550Ta-6.348
Sig WW
Estimation 2
0.59195.7230.000Const. = 0.982
Ta = 0.070
VPD = 0.920
ETR = 0.321Ta + 3.772VPD-4.483
2018
Sin WW
Estimation 1
0.442113.1410.000Const. = 0.362
VPD = 0.523
ETR = 5.563VPD + 0.687
Sin WW
Estimation 2
0.46864.4290.000Const. = 1.026
VPD = 0.678
Ta = 0.061
ETR = 4.2VPD + 0.184Ta-2.239
Sig WW
Estimation 1
0.543172.0020.000Const. = 0.292
VPD = 0.423
ETR = 5.545VPD + 0.426
Sig WW
Estimation 2
0.57497.9700.000Const. = 2.614
VPD = 0.915
RH = 0.028
ETR = 8.312VPD + 0.094RH-8.354

