Case Report

Cold and Dense Plasma Sheet Caused by Solar Wind Entry: Direct Evidence

1
School of Space and Environment, Beihang University, Beijing 100089, China
2
Key Laboratory of Space Environment Monitoring and Information Processing, Ministry of Industry and Information Technology, Beijing 100089, China
*
Author to whom correspondence should be addressed.
Atmosphere 2020, 11(8), 831; https://doi.org/10.3390/atmos11080831
Submission received: 12 June 2020 / Revised: 30 July 2020 / Accepted: 2 August 2020 / Published: 7 August 2020
(This article belongs to the Special Issue Nonlinearities, Turbulence and Chaos in Space and Earth Systems)

Abstract

:
We present a coordinated observation with the Magnetospheric Multiscale (MMS) mission, located in the Earth’s magnetotail plasma sheet, and the Acceleration, Reconnection, Turbulence, and Electrodynamics of the Moon’s Interaction with the Sun (ARTEMIS) mission, located in the solar wind, in order to understand the formation mechanism of the cold and dense plasma sheet (CDPS). MMS detected two CDPSs composed of two ion populations with different energies, where the energy of the cold ion population is the same as that of the solar wind measured by ARTEMIS. This feature directly indicates that the CDPSs are caused by the solar wind entry. In addition, He+ was observed in the CDPSs. The plasma density in these two CDPSs are ~1.8 cm−3 and ~10 cm−3, respectively, roughly 4–30 times the average value of a plasma sheet. We performed a cross-correlation analysis on the ion density of the CDPS and the solar wind, and we found that it takes 3.7–5.9 h for the solar wind to enter the plasma sheet. Such a coordinated observation confirms the previous speculation based on single-spacecraft measurements.

1. Introduction

The Earth’s magnetotail plasma sheet, which plays a crucial role in the solar wind-magnetosphere coupling, is usually characterized by hot (Ti ≈ 4 keV) and tenuous (Ni ≈ 0.3 cm−3) ions [1]. However, prolonged northward interplanetary magnetic field (IMF) conditions can lead to the formation of rare cold and dense plasma sheets (CDPSs) [2,3,4,5,6,7,8,9,10,11,12]. In the CDPS, the ion number density (>1 cm−3) is several times the typical value of a plasma sheet, while the ion temperature (~1 keV) is lower than the typical value of a plasma sheet.
The CDPS plays crucial roles in the magnetospheric dynamic processes by causing the following consequences. The CDPS probably makes great contributions to the production of storm-time energetic particles [13] and can lead to stronger ring currents during the main phase of storms [9,14]. The CDPS can also lead to the mass loading of the magnetotail. Therefore, it may have effects on substorms [13,15,16,17] and reduce the reconnection rate [18,19]. In addition, by altering the plasma density gradients near the dipolarization fronts (DFs), the CDPS can affect the DF dynamics [20], such as the density-driven instabilities [21,22] and electric field structure [23] near the DFs. Meanwhile, since cold electrons behind the DFs cannot be efficiently accelerated by the Fermi and Betatron acceleration mechanism [24,25,26,27,28,29,30,31], the electron distribution behind the DFs [32,33,34] may be influenced.
The formation mechanism of the CDPS has been widely studied. The ionosphere and the solar wind were believed to be possible sources of plasma in the CDPS [13,35]. Large plasma temperature anisotropy, caused by the decrease in parallel temperature in a CDPS, indicates the presence of cold and field-aligned ionospheric origin ion populations [36]. However, it has been found that the ionospheric outflow is strong during the southward IMF period [37,38], which is inconsistent with the observation that the CDPS is caused by prolonged northward IMF periods. In addition, there is a lack of cold O+ component in the CDPS [39,40]. Therefore, the ionosphere may not be the primary source of plasma in the CDPS. Terasawa et al. [10] presented that the plasma density and temperature in the CDPS correlate with those in the solar wind during the northward IMF period, indicating that the solar wind is the source of plasma in the CDPS. In addition, cold ions (e.g., H+ and He2+) with a lower solar-wind-like energy were widely observed in the CDPS [4,5,41]. Fujimoto et al. [2] found that two ion populations with distinctly different energies coexist in a CDPS, with these lower energy ions being similar to those in the magnetosheath. However, there has been no simultaneous observation of the plasma energy spectrum in both the solar wind and the CDPS. Therefore, there is no direct comparison between the energy of cold ion populations in the CDPS and the energy of ions in the solar wind.
To verify the ion energy of these two populations, two satellites located, respectively, in the plasma sheet and the solar wind should be used. With the launch of the Magnetospheric Multiscale (MMS) mission [42,43,44], which frequently travelled to the Earth’s magnetotail plasma sheet during the summer (May–September) of 2017, and the Acceleration, Reconnection, Turbulence, and Electrodynamics of the Moon’s Interaction with the Sun (ARTEMIS) mission [45], which travelled around the Moon and was certainly frequently located in the solar wind, we are able to investigate this issue.
In this study, based on coordinated MMS/ARTEMIS observations, we present two CDPS events in order to provide direct evidence that the CDPS is a consequence of solar wind entry.

2. Observations

For the plasma sheet measurements, we use the MMS mission [42]. Specifically, the magnetic field data with a 0.0625 s resolution are from Fluxgate Magnetometer (FGM) [43], and the plasma data with a 4.4 s resolution are from Fast Plasma Investigation Instrument (FPI) [44]. For the solar wind measurements, we use the ARTEMIS mission [45]. Specifically, magnetic field data with a 4.3 s resolution and plasma data with a 4.3 s resolution are from Fluxgate Magnetometer (FGM) [46] and Electrostatic analyzers (ESA) [47], respectively. All the data are shown in Geocentric Solar Magnetospheric (GSM) coordinates unless noted otherwise.
We present two cold and dense plasma sheet (CDPS) events detected by MMS, when ARTEMIS was in the solar wind. Therefore, a direct comparison of the ion energy spectrum between the plasma sheet and the solar wind can be obtained.
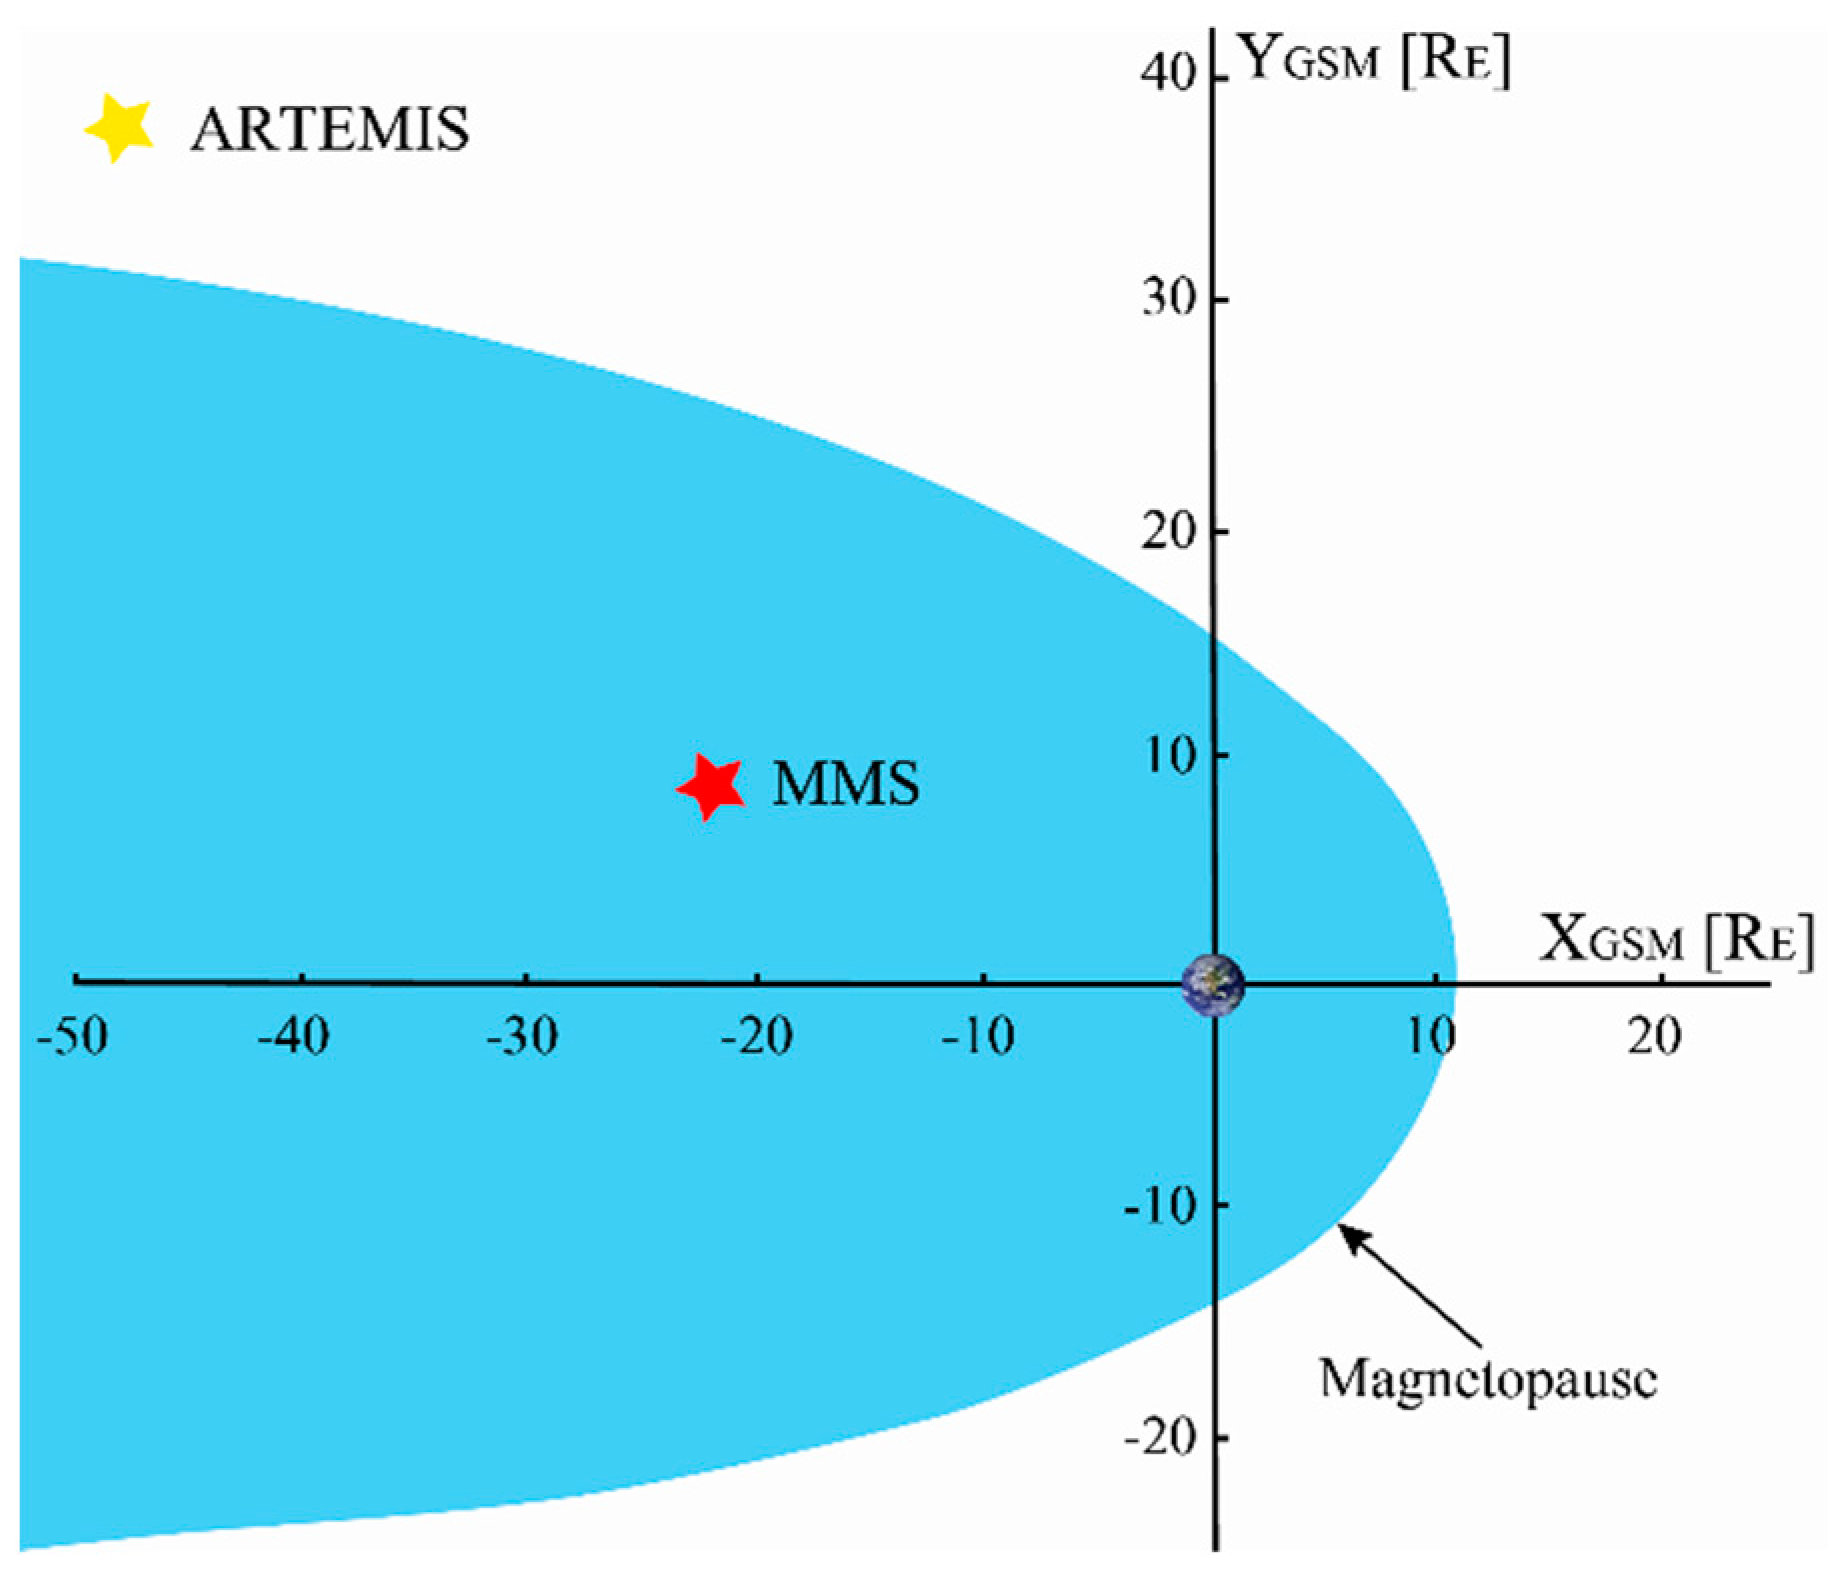
Specifically, the first event was observed by MMS from 10:10:00UT to 11:50:00 UT on 20 July 2017, when MMS spacecrafts were moving from (−21.655, 6.838, 4.078) RE to (−22.151, 6.636, 4.273) RE (Earth radii) in Geocentric Solar Magnetospheric (GSM) coordinates (see red pentagram in Figure 1), indicating that MMS spacecrafts were located on the dusk-side of the magnetotail. At the same time, ARTEMIS was moving from (42.503, −40.308, −5.009) RE to (42.813, −39.733, −5.006) RE in GSM coordinates (see yellow pentagram in Figure 1), indicating that ARTEMIS was located in the solar wind.
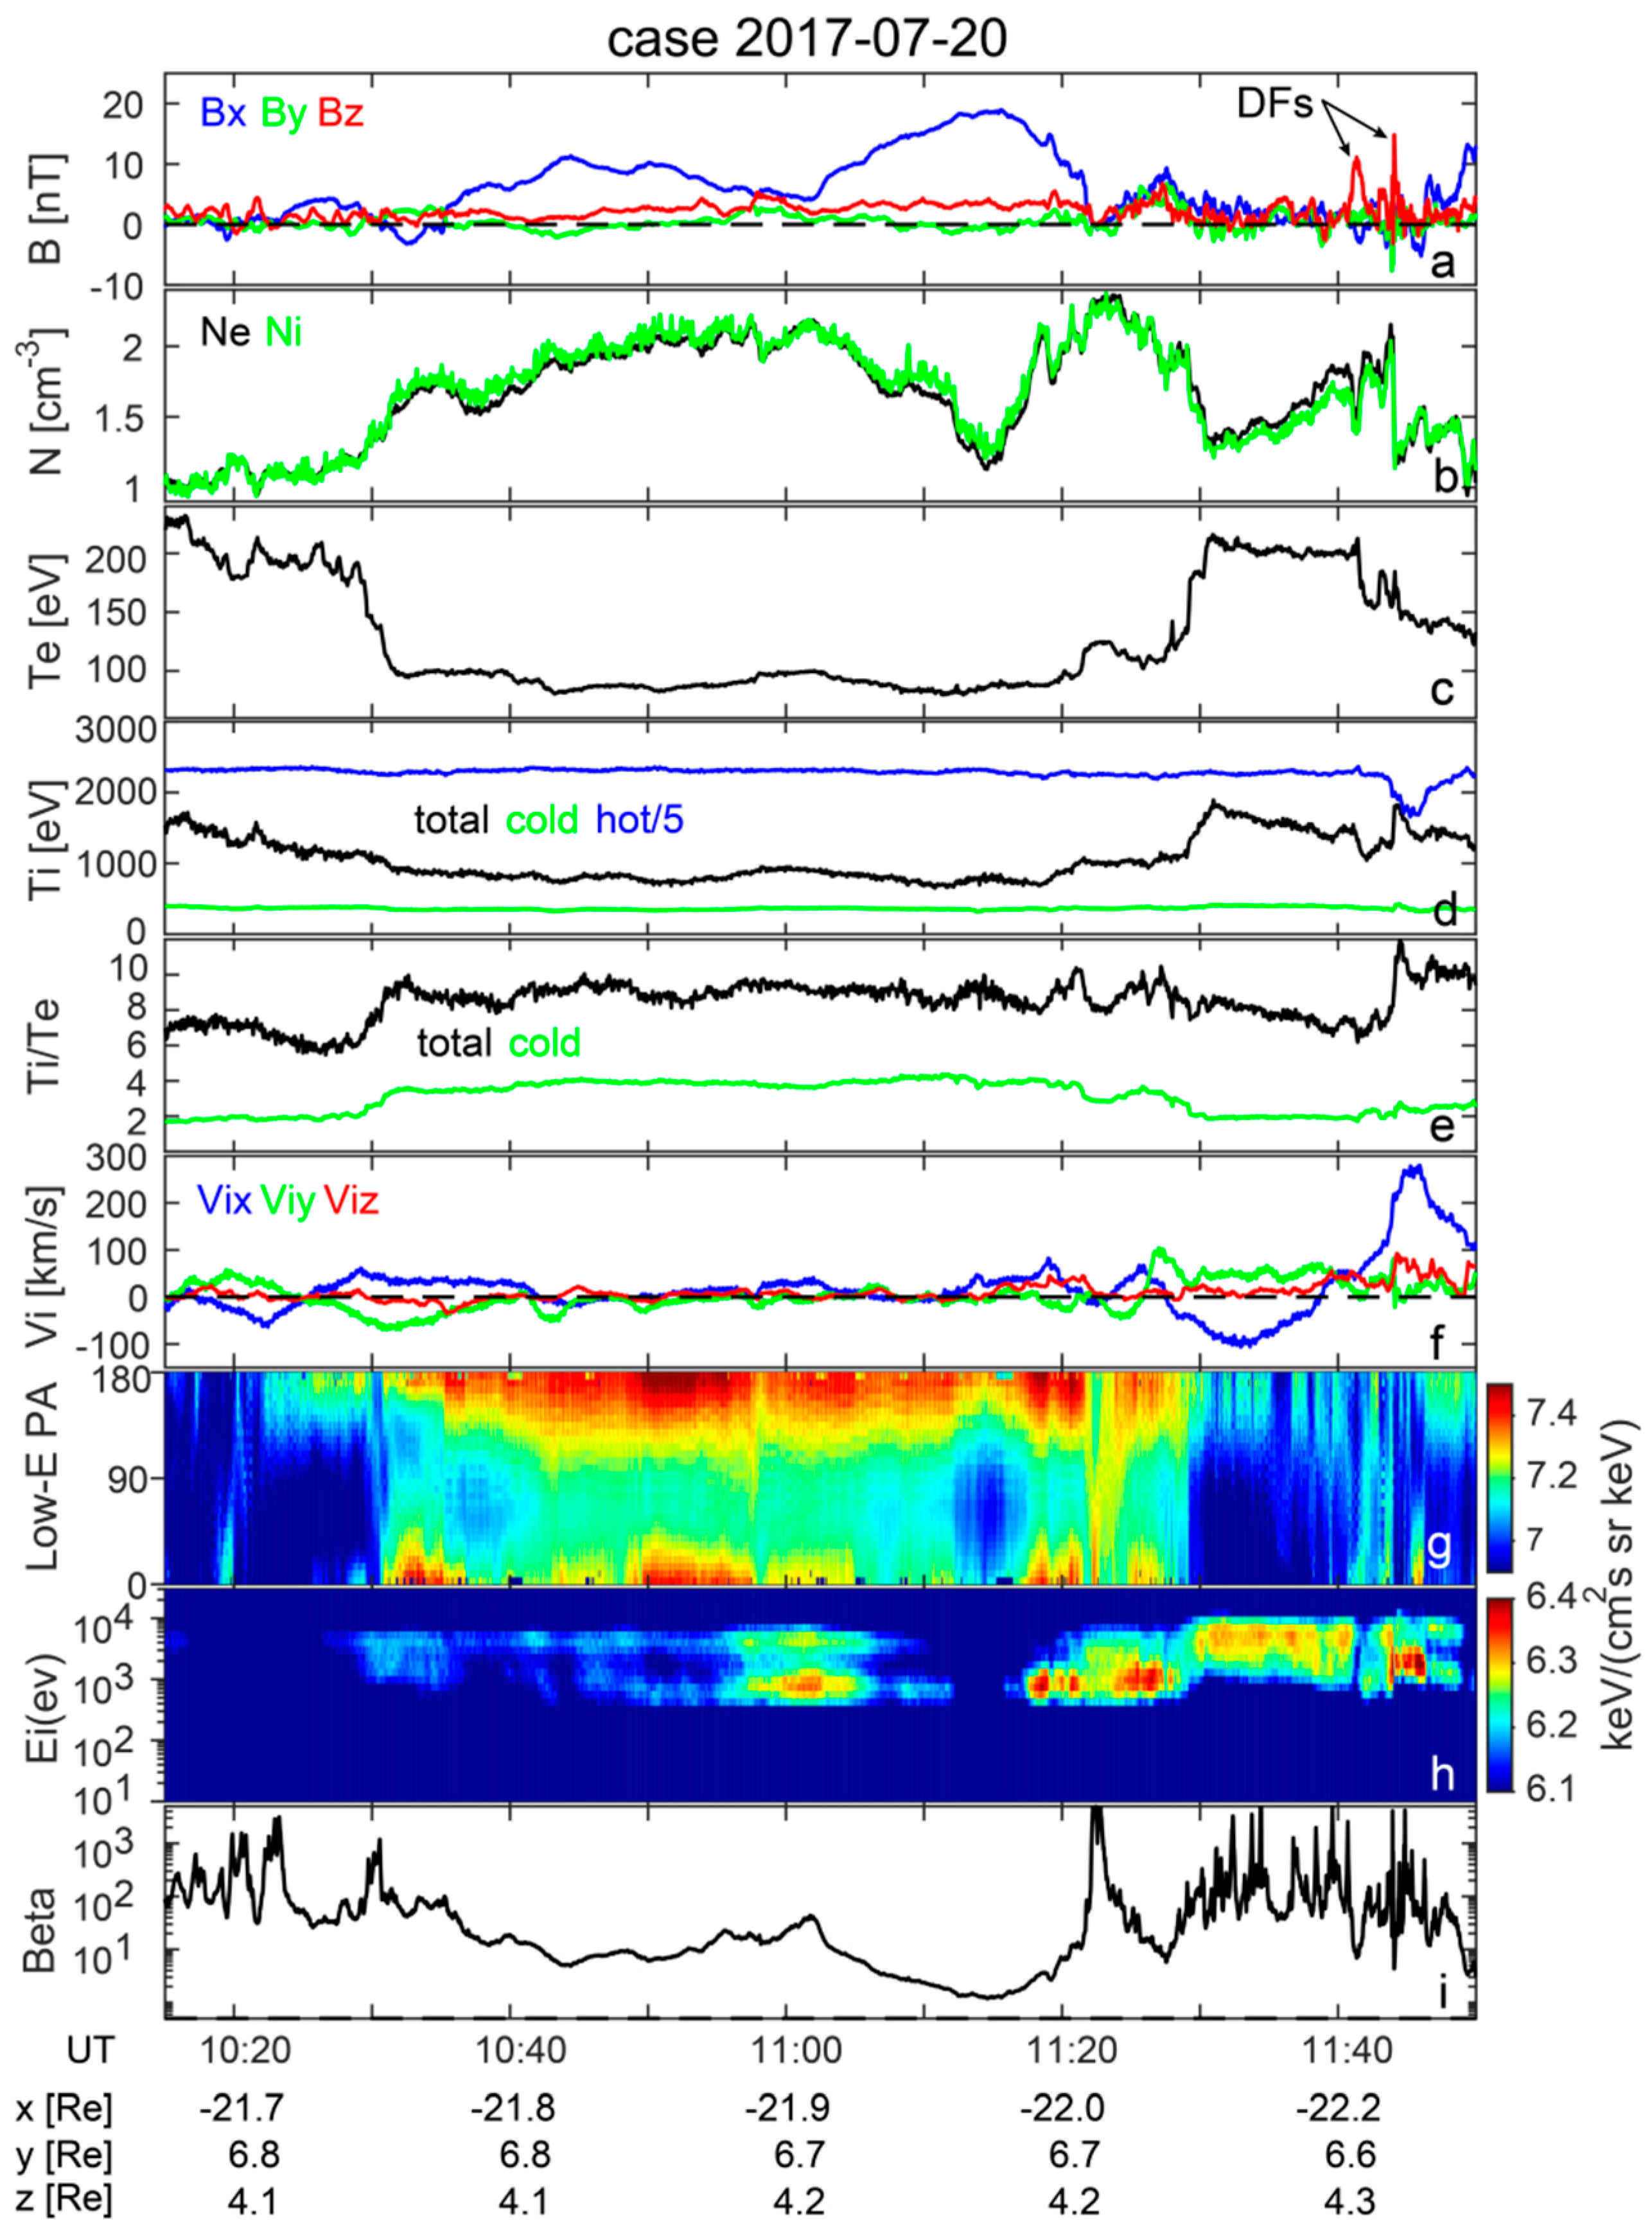
Figure 2 presents an overview of the event, with the magnetic field shown in panel a, the ion and electron number density in panel b, electron temperature in panel c, ion temperature in panel d, Ti/Te in panel e, ion velocity in panel f, pitch angle distribution of 2–200 eV electrons in panel g, ion differential energy flux (0.01–30 keV) in panel h, and plasma β in panel i. These data were collected by MMS1 in the fast mode [42]. During this period, MMS measured a small magnetic field Bx (|Bx| < 20 nT; see blue line in Figure 2a), high plasma densities (N ≳1 cm−3; Figure 2b), and large plasma β (β > 0.5; Figure 2i), indicating that it was in the plasma sheet [49]. After 11:40:00 UT, two DFs (Figure 2a), characterized by a sharp increase in the Z-component of the magnetic field [24,50], were detected in a flow burst (Figure 2f) [49]. At the beginning (before 10:30:00 UT) and the end (after 11:30:00) of this interval, the plasma number density (1–2.2 cm−3; Figure 2b) is higher than the average in the plasma sheet (~0.3 cm−3 [1]), while both the ion (1–1.8 keV; Figure 2d) and electron temperature (130–230 eV; Figure 2c) are lower than the average in the plasma sheet (Ti ~3 keV, Te ~ 500 eV [1]). Between 10:30:00 UT and 11:30:00, the plasma density rapidly increases from 1.4 cm−3 to 1.8 cm−3 (Figure 2b), i.e., 4.5–6 times the average of the plasma sheet. In addition, the ion and electron temperatures decrease to ~800 eV (Figure 2d) and ~100 eV (Figure 2c), respectively. The ion spectrum features two ion populations with distinctly different energies (Figure 2h), whose cold and hot ion population energies are ~1 keV and ~3 keV, respectively. These features are consistent with those in the CDPS [10,35,51,52,53,54], which is widely believed to be the consequence of the solar wind entry [12,51,52]. During the crossing of the CDPS (10:10:00–11:50:00 UT), the temperature of the cold ion populations was ~400 eV (green curve in Figure 2d), while that of the hot ion populations was ~11,500 eV (blue curve in Figure 2d). As can be seen, the ratios of the ion to electron temperature and cold ion to electron temperature were ~9 and ~4, respectively. In addition, these electrons with a low energy (Figure 2g) appeared mainly in the parallel and anti-parallel directions, showing the signature of a cigar distribution [24,32,33,34,55]. Such a cigar distribution of electrons with low energy was also observed in previous CDPSs caused by the solar wind entry via a low-latitude boundary layer (LLBL) [56].
The global MHD model with kinetic test particles [8] showed that the cold ion population originates from the solar wind through LLBL. Previous observations found that the energy of the cold ion population in the CDPS is similar to that of ions in the solar wind [4,5,41]. However, there is no direct comparison of these ion populations between the CDPS and the solar wind.
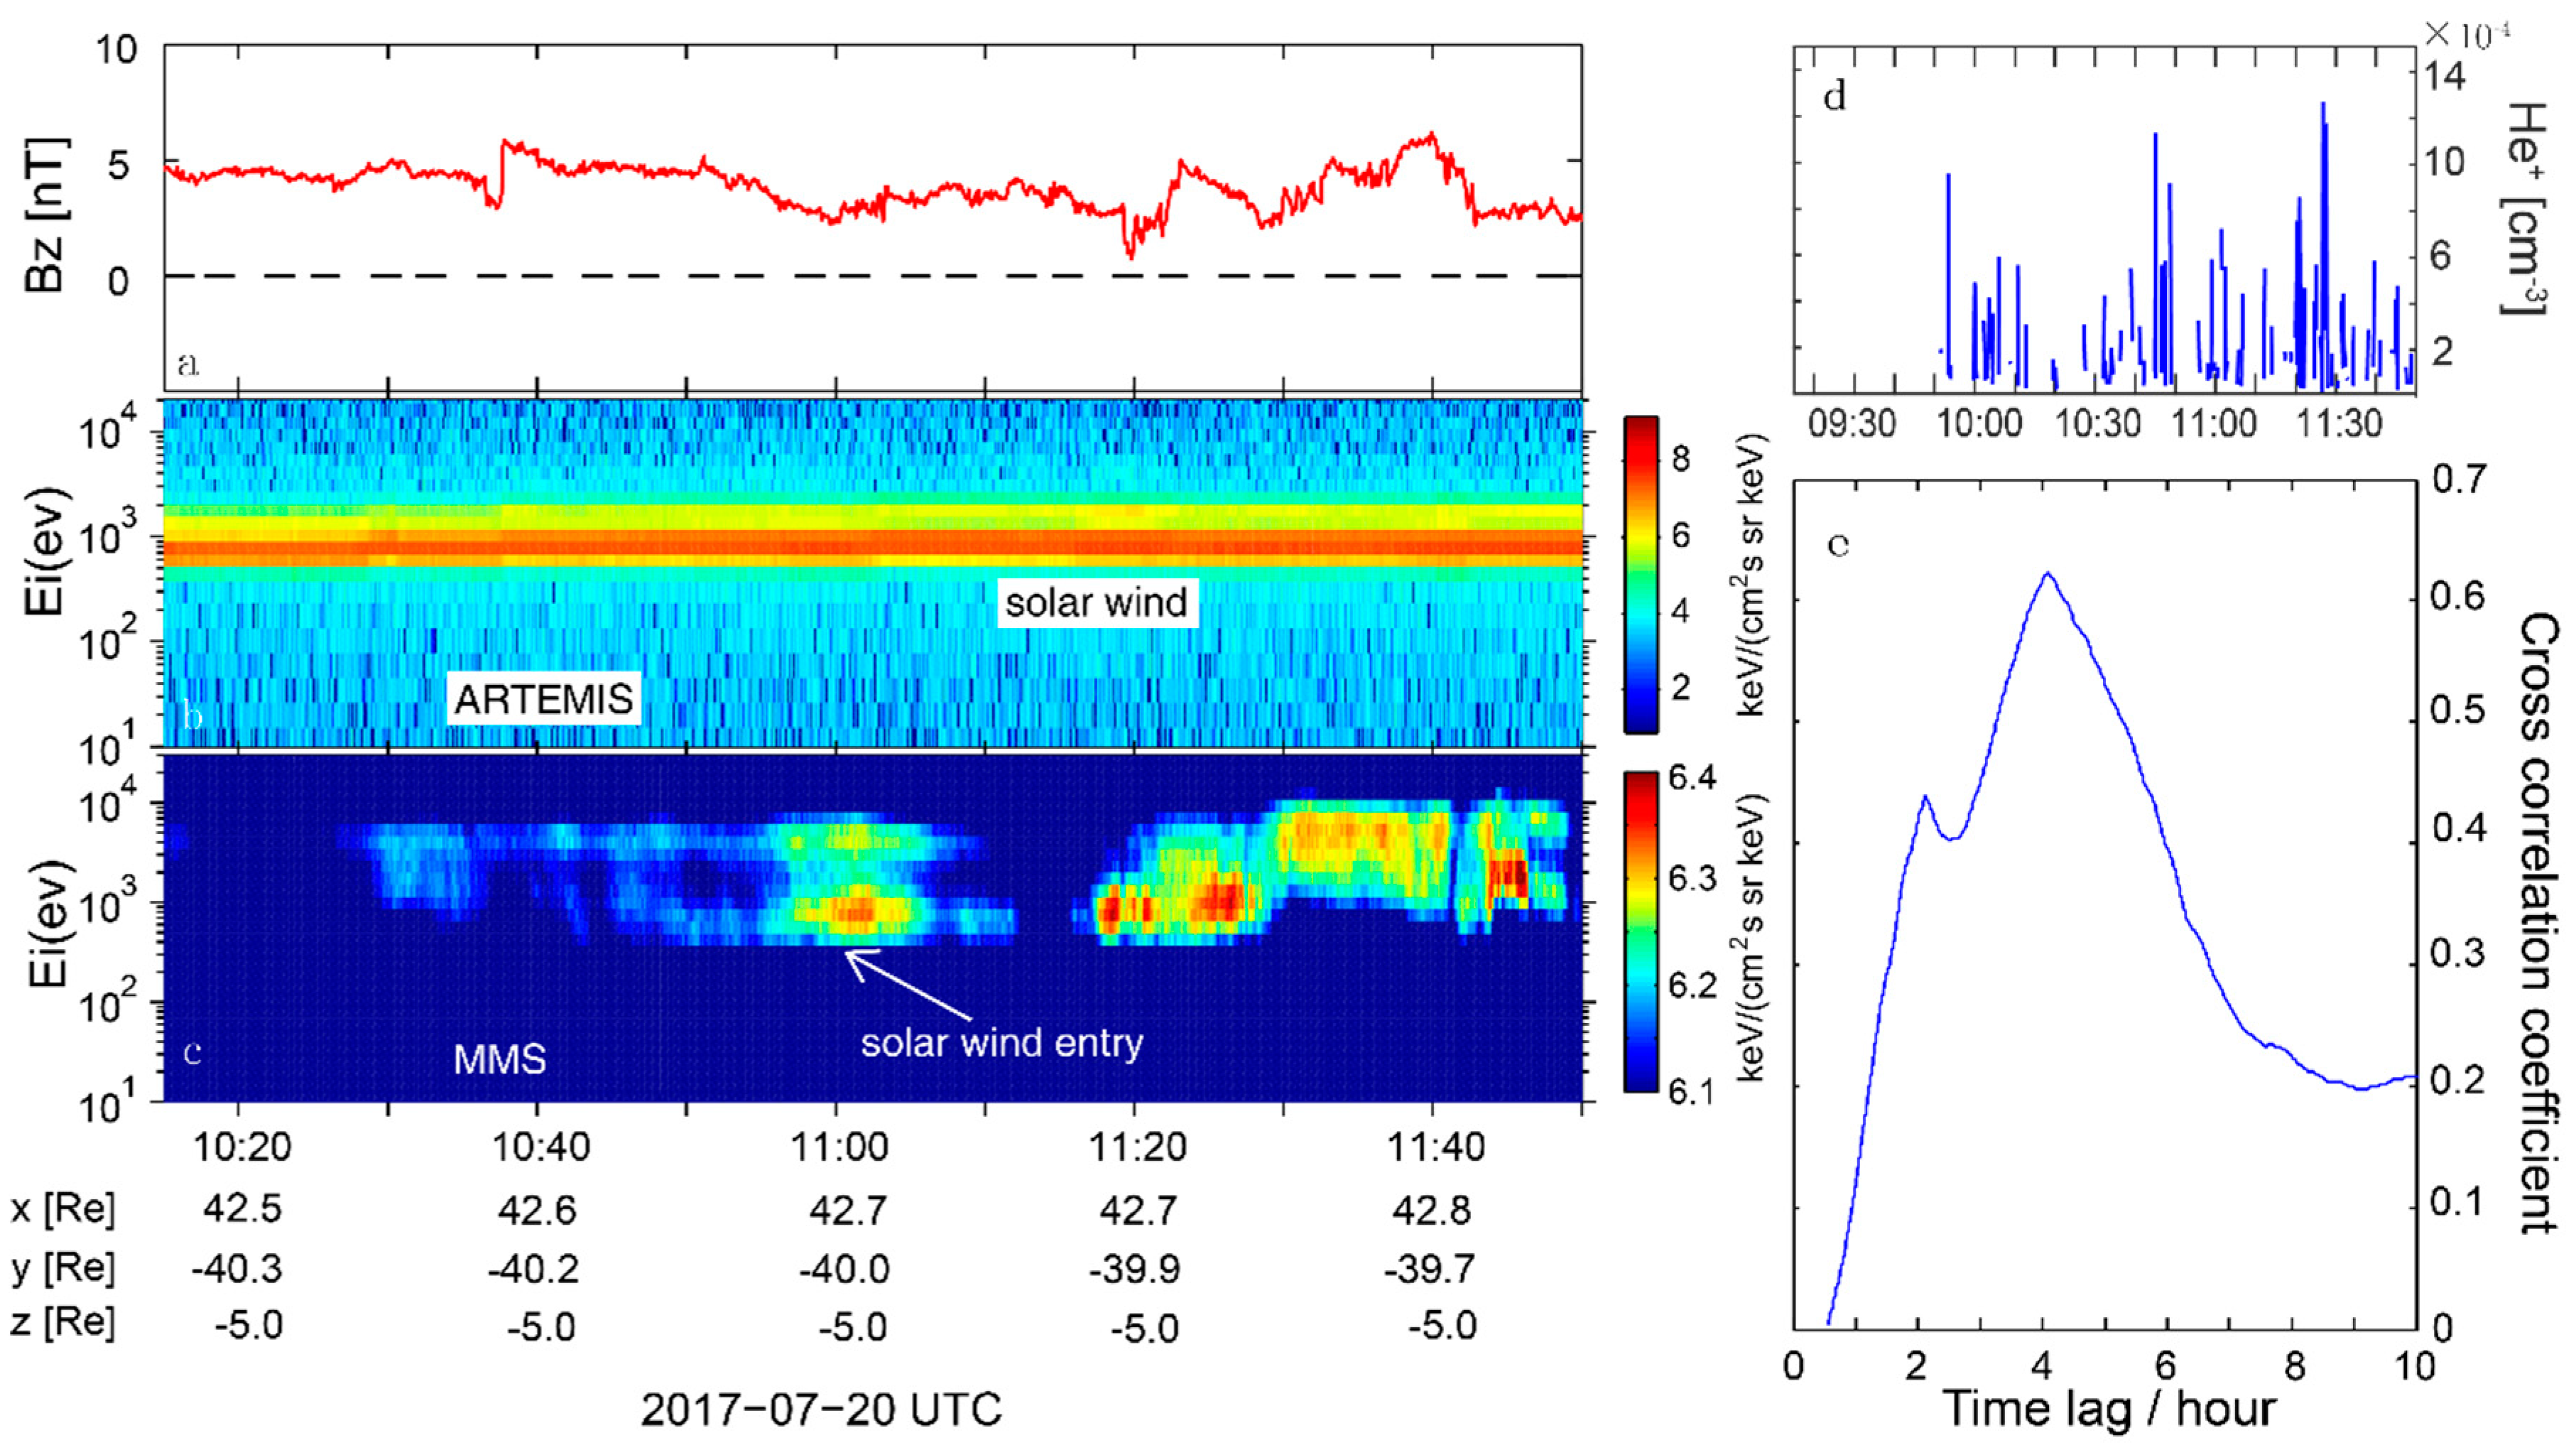
Figure 3 shows a direct comparison of these ion populations between the CDPS and the solar wind, using the plasma sheet data collected by MMS1 in the fast mode [42] and the solar wind data collected by ARTEMIS P1 in the reduced mode [45]. As can be seen, the CDPS was detected during northward IMF periods (Bz > 0; Figure 3a), consistent with previous studies (Wing et al. [12] and therein). The energy of ions in the solar wind (Figure 3b) is indeed consistent with that of cold ions in the CDPS (Figure 3c), directly demonstrating that these cold ions in the CDPS may originate from the solar wind. To verify our inference, we checked He+ in this CDPS, which comes from the solar wind. He+ was observed when the CDPS was detected (Figure 3d), which further proves that these cold ions in the CDPS originate from the solar wind. The distribution of cold ions is intermittent (Figure 3c,d), which may attributable to the spatial discontinuity of cold ions. The solar wind may cross the flank of the bow shock and then enter the plasma sheet.
It has been suggested that the solar wind plasma can enter the plasma sheet via the low-latitude boundary layer (LLBL) during northward IMF periods [3,57]. Thus, the ion number density in the CDPS should be correlated with that in the solar wind. Based on the correlation, we can estimate the duration for the solar wind ion to propagate from the LLBL to the plasma sheet, which is to say we can search for which period the ion number density in the solar wind has the best correlation with ion number density in the CDPS. We perform a cross-correlation analysis between the ion number density in the CDPS and ion number density in the solar wind. The cross-correlation coefficient is defined as follows:
R s p , c o e f f ( t ) = { i = 1 t N s w ( M t + i ) N p s ( i ) [ i = 1 t N s w ( M t + i ) N s w ( M t + i ) ] [ i = 1 t N p s ( i ) N p s ( i ) ] ,   t N i = 1 N N s w ( M t + i ) N p s ( i ) [ i = 1 N N s w ( M t + i ) N s w ( M t + i ) ] [ i = 1 N N p s ( i ) N p s ( i ) ] ,   N < t M
N s w , N p s , M, N, and t represent the ion number density in solar wind, ion number density in CDPS, time scale of N s w , time scale of N p s , and time lag.
Since the ion data resolution of ARTEMIS (4.3 s resolution) is higher than that of MMS (4.4 s resolution), we perform the linear interpolation to reduce the ARTEMIS resolution. The time-series of the ion number density in the CDPS (10:10:00–11:50:00 UT) slides back along that of the ion number density in the solar wind from the time that the CDPS was detected. During this process, the cross-correlation coefficient first increases and then decreases. The largest cross correlation coefficient (~0.62) occurs at lags ≈ 4.1 h (Figure 3e), indicating that it takes 4.1 h for ions to propagate from the ARTEMIS location to the plasma sheet. Considering the fact that the solar wind velocity is stable, (–350 60 −25] km/s, we can estimate that the duration for ions to propagate from the ARTEMIS location to the LLBL is ~24 min. Therefore, it takes 3.7 h for ions to propagate from the LLBL to the plasma sheet. The energy of ions in the solar wind 4.1 h ago (Figure 7e) is still consistent with that of cold ions in the CDPS, suggesting that the results of this cross-correlation analysis are reasonable.
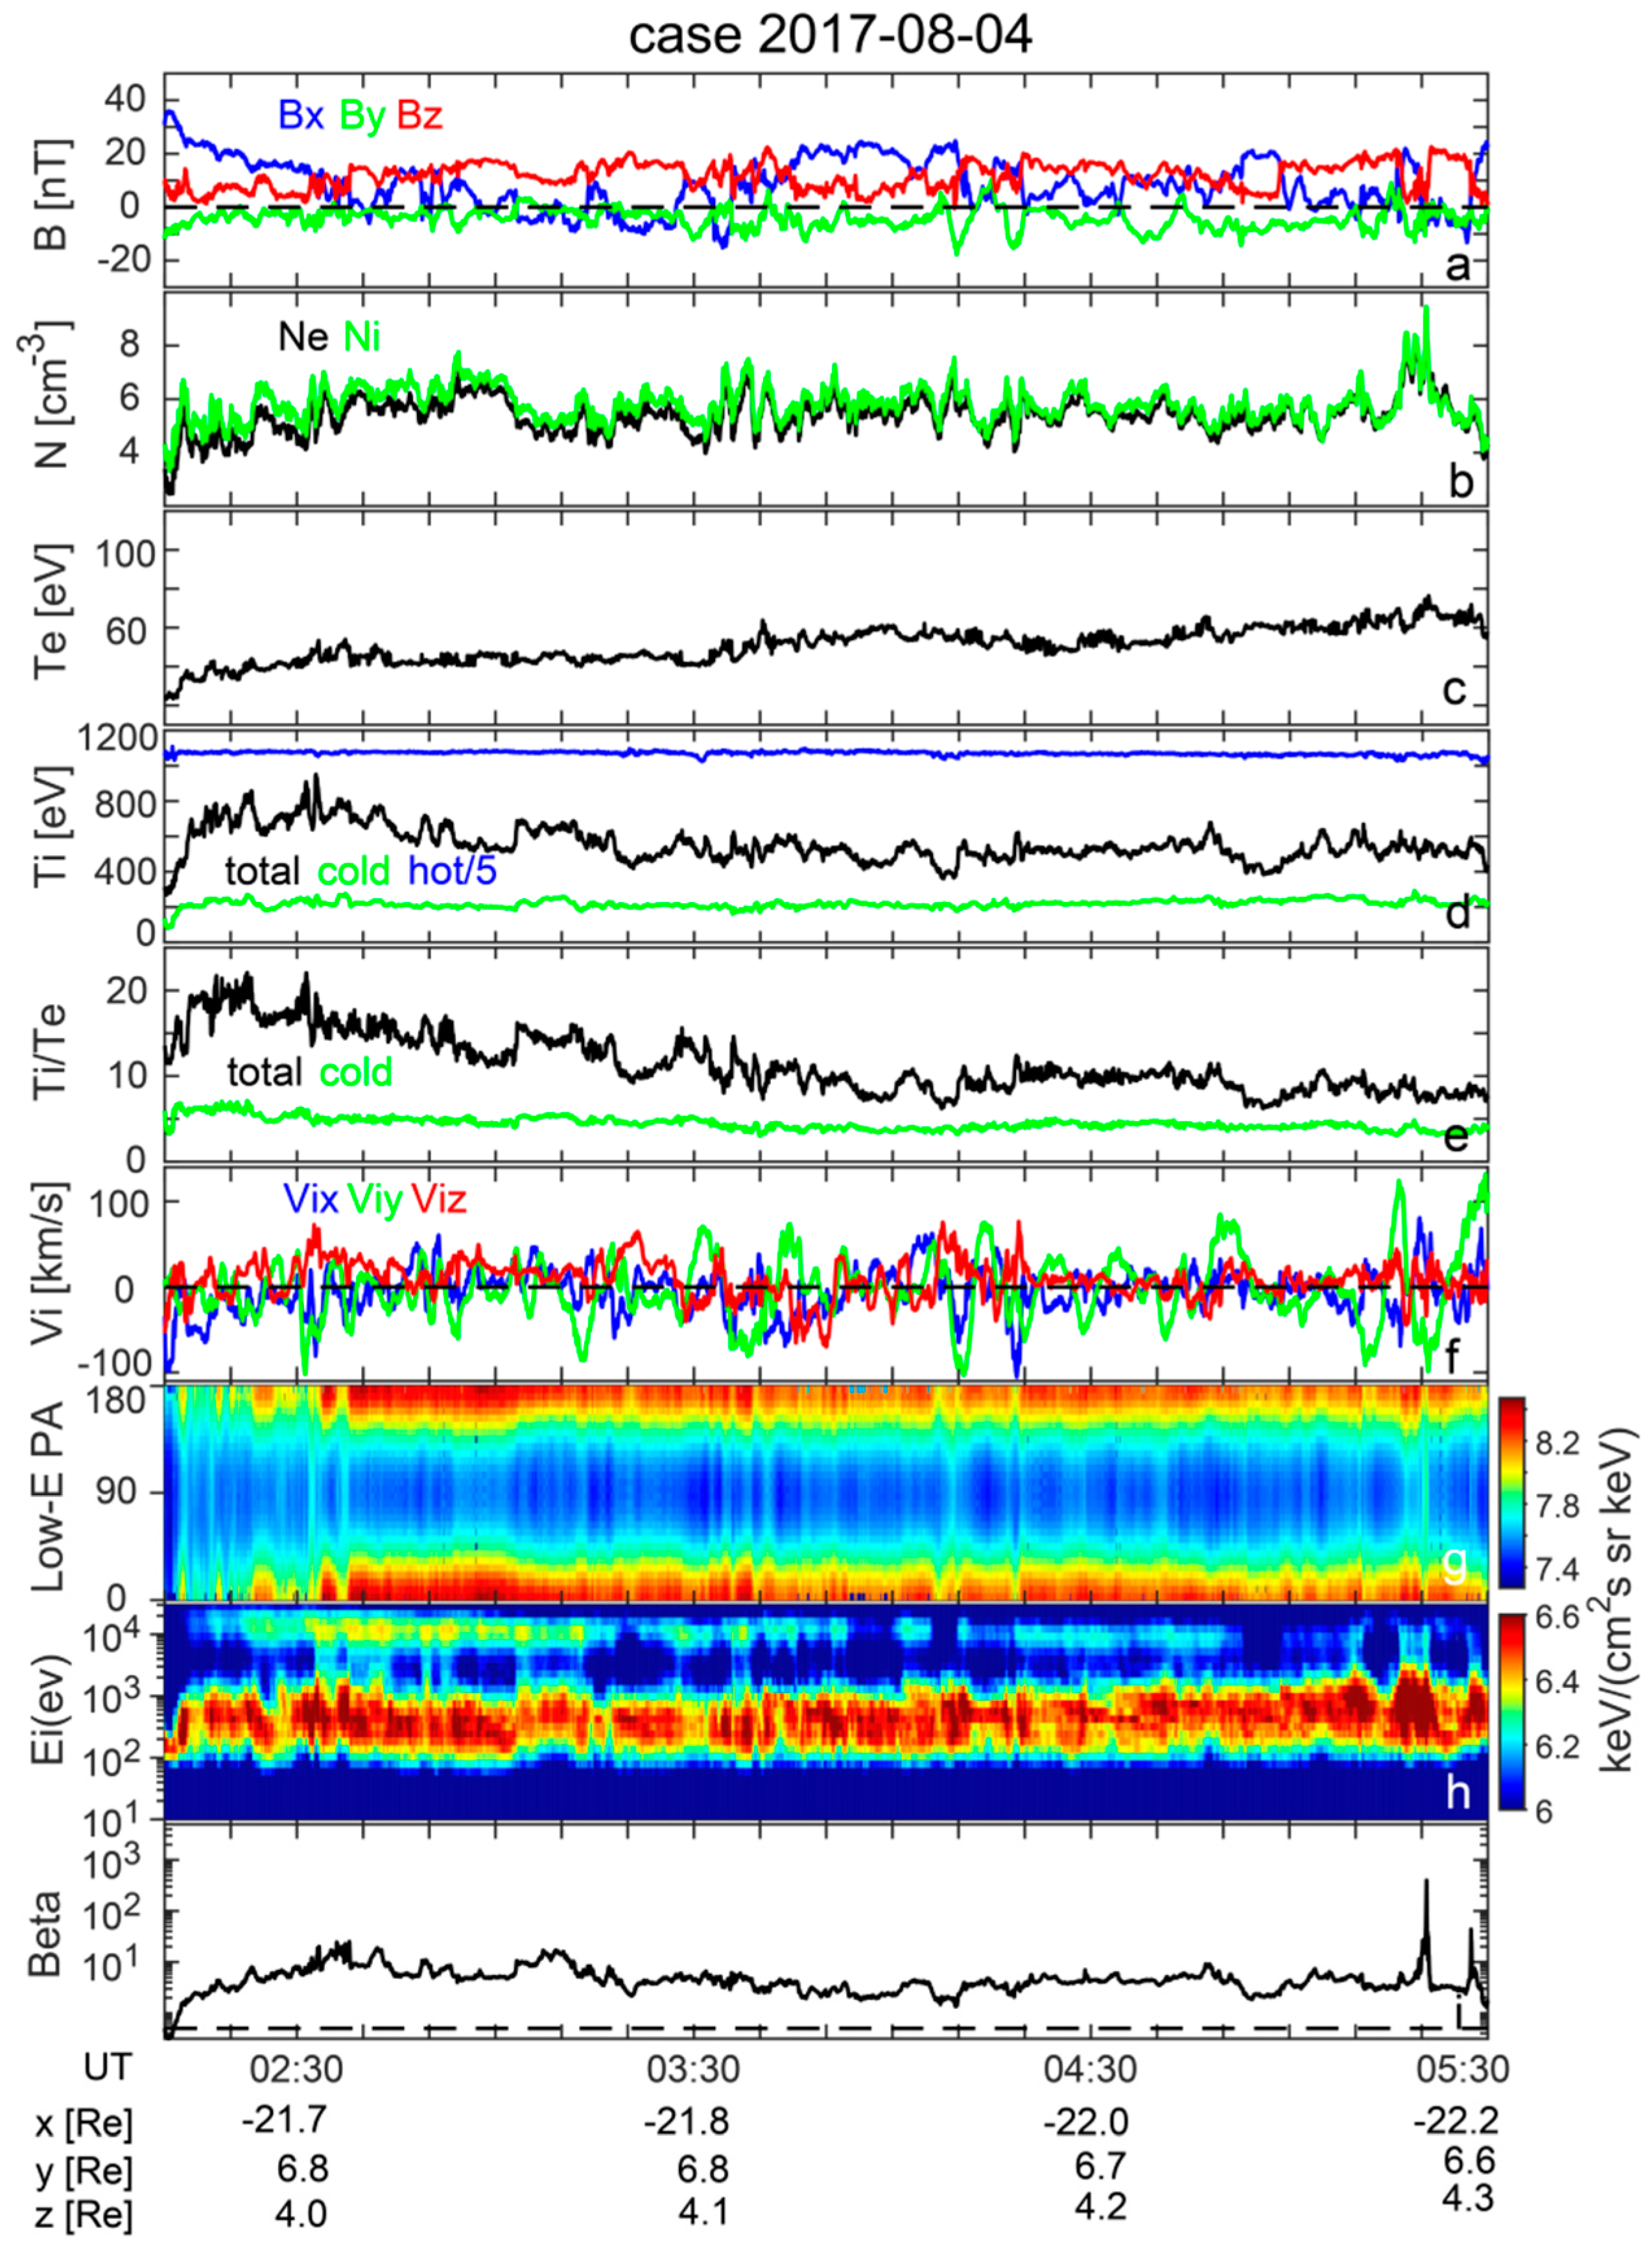
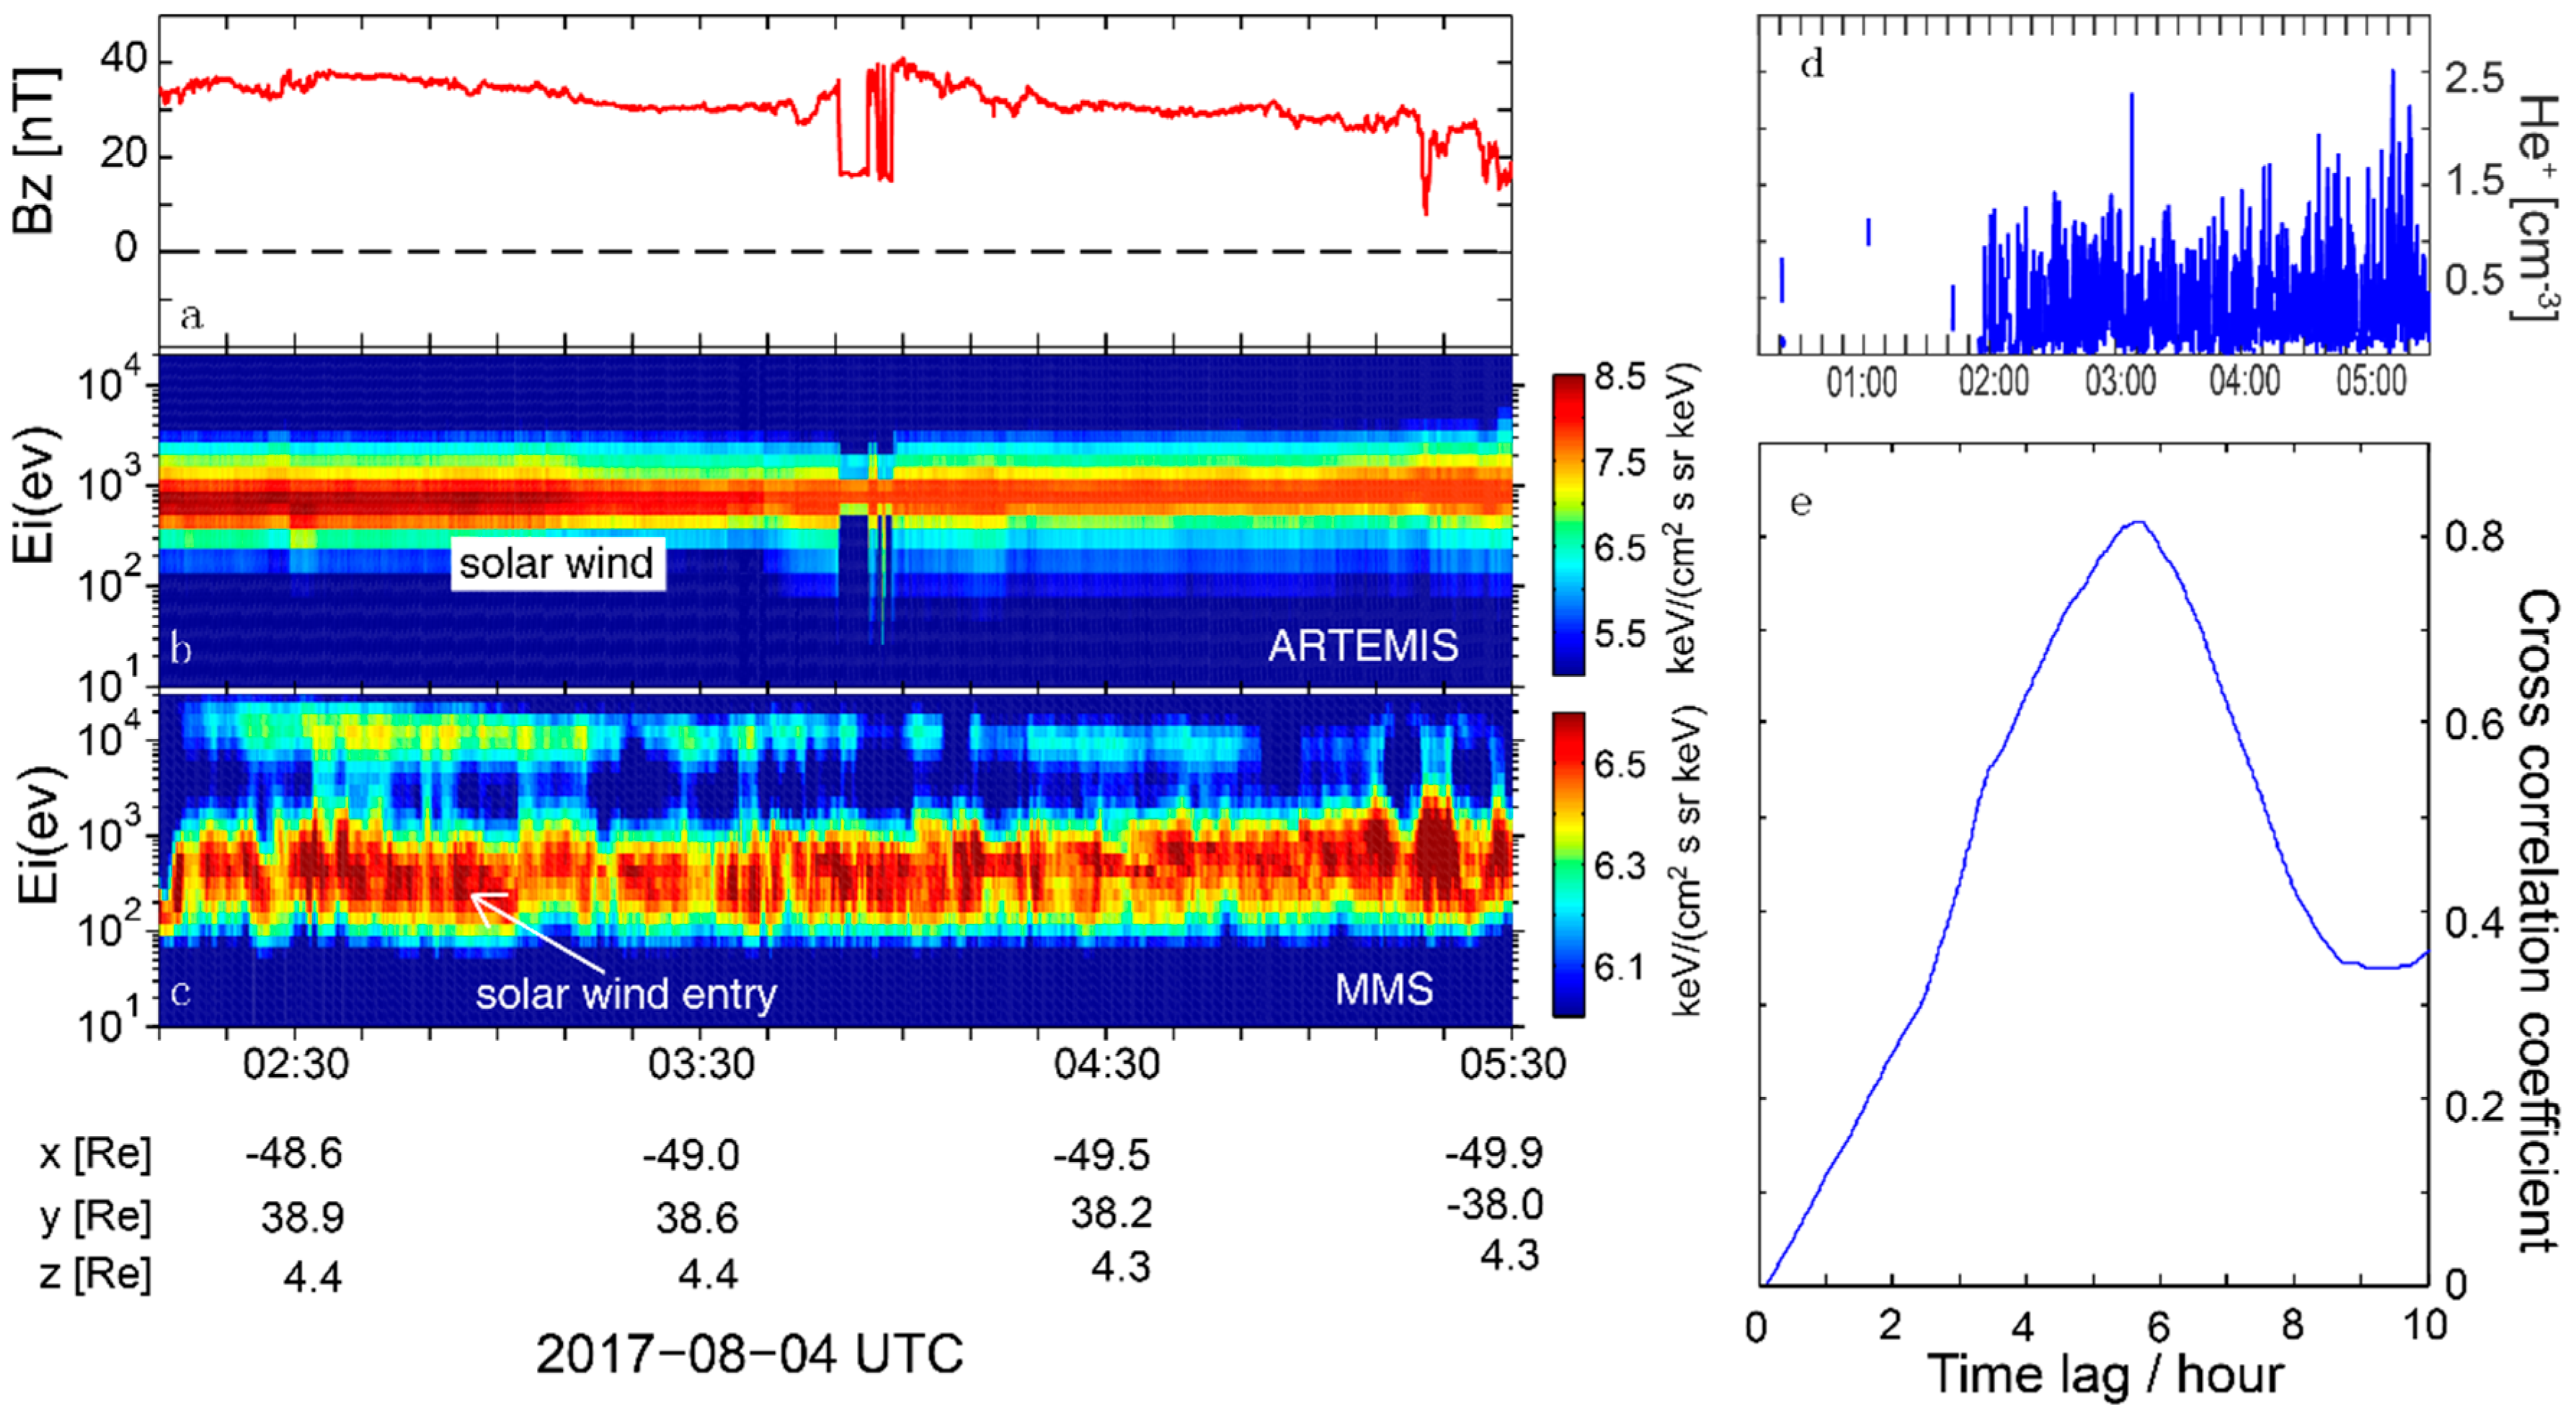
The second event was observed by MMS from 02:10:00 to 05:30:00 UT on 4 August 2017, when MMS spacecrafts were moving from (−22.589, 8.767, 5.821) RE to (−22.328, 7.805, 5.923) RE in Geocentric Solar Magnetospheric (GSM) coordinates (see red pentagram in Figure 4), indicating that MMS spacecrafts were located on the duskside of the magnetotail. At the same time, ARTEMIS was moving from (−48.567, 38.941, 4.390) RE to (−49.941, 38.043, 4.257) RE in GSM coordinates (see yellow pentagram in Figure 4), indicating that ARTEMIS was located in the solar wind. Figure 5, in the same format as Figure 2, presents an overview of the event. These data were collected by MMS1 in the fast mode [42]. During this period, MMS measured a small magnetic field Bx (|Bx| < 20 nT; see blue line in Figure 5a), high plasma densities (N ≳ 1 cm−3; Figure 5b), and a large plasma β (β > 0.5; Figure 5i), indicating that it was in the plasma sheet [49]. The plasma density is 3~10 cm−3 (Figure 5b), i.e., 10–30 times the average value of the plasma sheet. In addition, the ion and electron temperatures are 400–800 eV (Figure 5d) and 20–70 eV (Figure 5c), respectively. The ion spectrum features two ion populations with distinctly different energies (Figure 5h), whose cold and hot ion population energies are 0.1–1.2 keV and 6–20 keV, respectively. These features are consistent with those in the CDPS [10,51,52,53]. During the crossing of the CDPS, the temperature of the cold ion populations was ~200 eV (green curve in Figure 2d), while that of the hot ion populations was ~5 keV (blue curve in Figure 2d). As can be seen, the ratios of the ion to electron temperature and cold ion to electron temperature were ~15 and ~5, respectively. In addition, these low-energy electrons (Figure 2g) showed the signature of a cigar distribution, which was also observed in previous CDPSs caused by solar wind entry via the low-latitude boundary layer. Figure 6, in the same format as Figure 4, shows a direct comparison of these ion populations between the CDPS sheet and the solar wind, using the plasma sheet data collected by MMS1 in the fast mode [42] and the solar wind data collected by ARTEMIS P1 in the reduced mode [45]. As can be seen, the CDPS was detected during northward IMF periods (Bz > 0; Figure 6a), consistent with previous studies (Wing et al. [12] and therein). The energy of ions in the solar wind (Figure 6b) is indeed consistent with that of cold ions in the CDPS (Figure 6c), directly demonstrating that cold ions in the CDPS originate from solar wind. In addition, He+, mainly from the solar wind, was observed when the CDPS was detected (Figure 6d), which also demonstrates that these cold ions in the CDPS originate from the solar wind. We also performed a cross-correlation analysis on the ion number density between the CDPS and the solar wind. We selected the time-series of the CDPS from 02:10:00 to 05:30:00 UT, sliding it back along that of the ion number density in the solar wind from the time that the CDPS was detected. As can be seen, ARTEMIS is located downstream of MMS, indicating that the ions observed by ARTEMIS cannot propagate toward MMS. However, these upstream cold ions near the LLBL can propagate to the downstream ARTEMIS and can simultaneously leak into the plasma sheet. The time needed for these upstream cold ions near the LLBL to propagate to ARTEMIS is defined as Ta, while the time needed for these upstream cold ions near the LLBL to propagate to the MMS is defined as Tm. Thus, the time lag obtained by the cross-correlation analysis is Tm-Ta. Then, we can obtain the time needed for the upstream cold ions near the LLBL to propagate to MMS by adding Ta to Tm-Ta. The largest cross correlation coefficient (~0.8) occurs at lags ≈ 5.7 h (Figure 6e), namely Tm-Ta = 5.7 h. Considering the fact that the solar wind velocity is stable, (−360 60 0) km/s, we can estimate that the duration needed for ions to propagate from the LLBL to the ARTEMIS location is ~14 min (Ta). Therefore, it takes 5.9 h for ions to propagate from the LLBL to the plasma sheet. The energy of ions in the solar wind 5.7 h ago (Figure 7j) is still consistent with that of cold ions in the CDPS, suggesting that the results of this cross-correlation analysis are reasonable.

3. Summary and Discussion

In this study, we analyze two cold and dense plasma sheets (CDPSs) via an MMS mission during northward IMF periods, and we find that the energy of cold ion populations in these CDPSs is consistent with that of ion populations observed by the ARTEMIS mission in the solar wind, directly demonstrating that the CDPS is the consequence of the solar wind entry. In addition, He+, mainly from the solar wind, was observed in these CDPSs. In these CDPSs, the plasma density was ~4–30 times the average plasma sheet value. We performed a cross-correlation analysis of the ion density between the CDPS and the solar wind, and found that it takes 3.7–5.9 h for solar wind ions to enter the plasma sheet. Such coordinated observations confirm the previous speculation based on single-spacecraft measurements.
The path of solar wind ions entering the plasma sheet depends on the IMF conditions. On the one hand, during southward IMF periods, solar wind ions enter the magnetosphere via magnetopause magnetic reconnection [58] and are then convected to the magnetotail. Subsequently, these ions are propagated towards the tail center and then energized and thermalized in the plasma sheet [59,60]. On the other hand, during northward IMF periods, there are two major entry mechanisms: (1) the double cusp reconnection, which captures magnetosheath plasma, and (2) the Kelvin–Helmholtz instability, which makes solar wind ions “leak” into the plasma sheet via the low-latitude boundary layer (LLBL) along the flanks of the magnetosphere [42,57].
The global MHD model with kinetic test particles [8] showed that Cusp-entering ions are predominantly deflected toward the dawn-side and are heated, while Flank-entering ions via LLBL are dawn-dusk symmetric and relatively cold. These mechanisms lead to ion populations in the plasma sheet exhibiting a dawn-dusk asymmetry [8,61,62]: these ion populations at the dusk-side exhibit a two-component structure of energy distribution due to the cold Flank-entering ions and the higher-energy subset of Cusp-entering ions that drift from the dawn-side, while the ion populations at the dawn-side exhibit a hotter and broadly peaked energy distribution due to the cold Flank-entering ions and the lower-energy subset of Cusp-entering ions. In these two events, the cold dense plasma sheets were detected at the dusk-side of the plasma sheet during northward IMF periods (Figure 3a and Figure 6a). Thus, the cold component more likely constitutes the flank-entering ions via KHI, while the hot component may constitute the Cusp-entering ions that drift from the dawn-side.
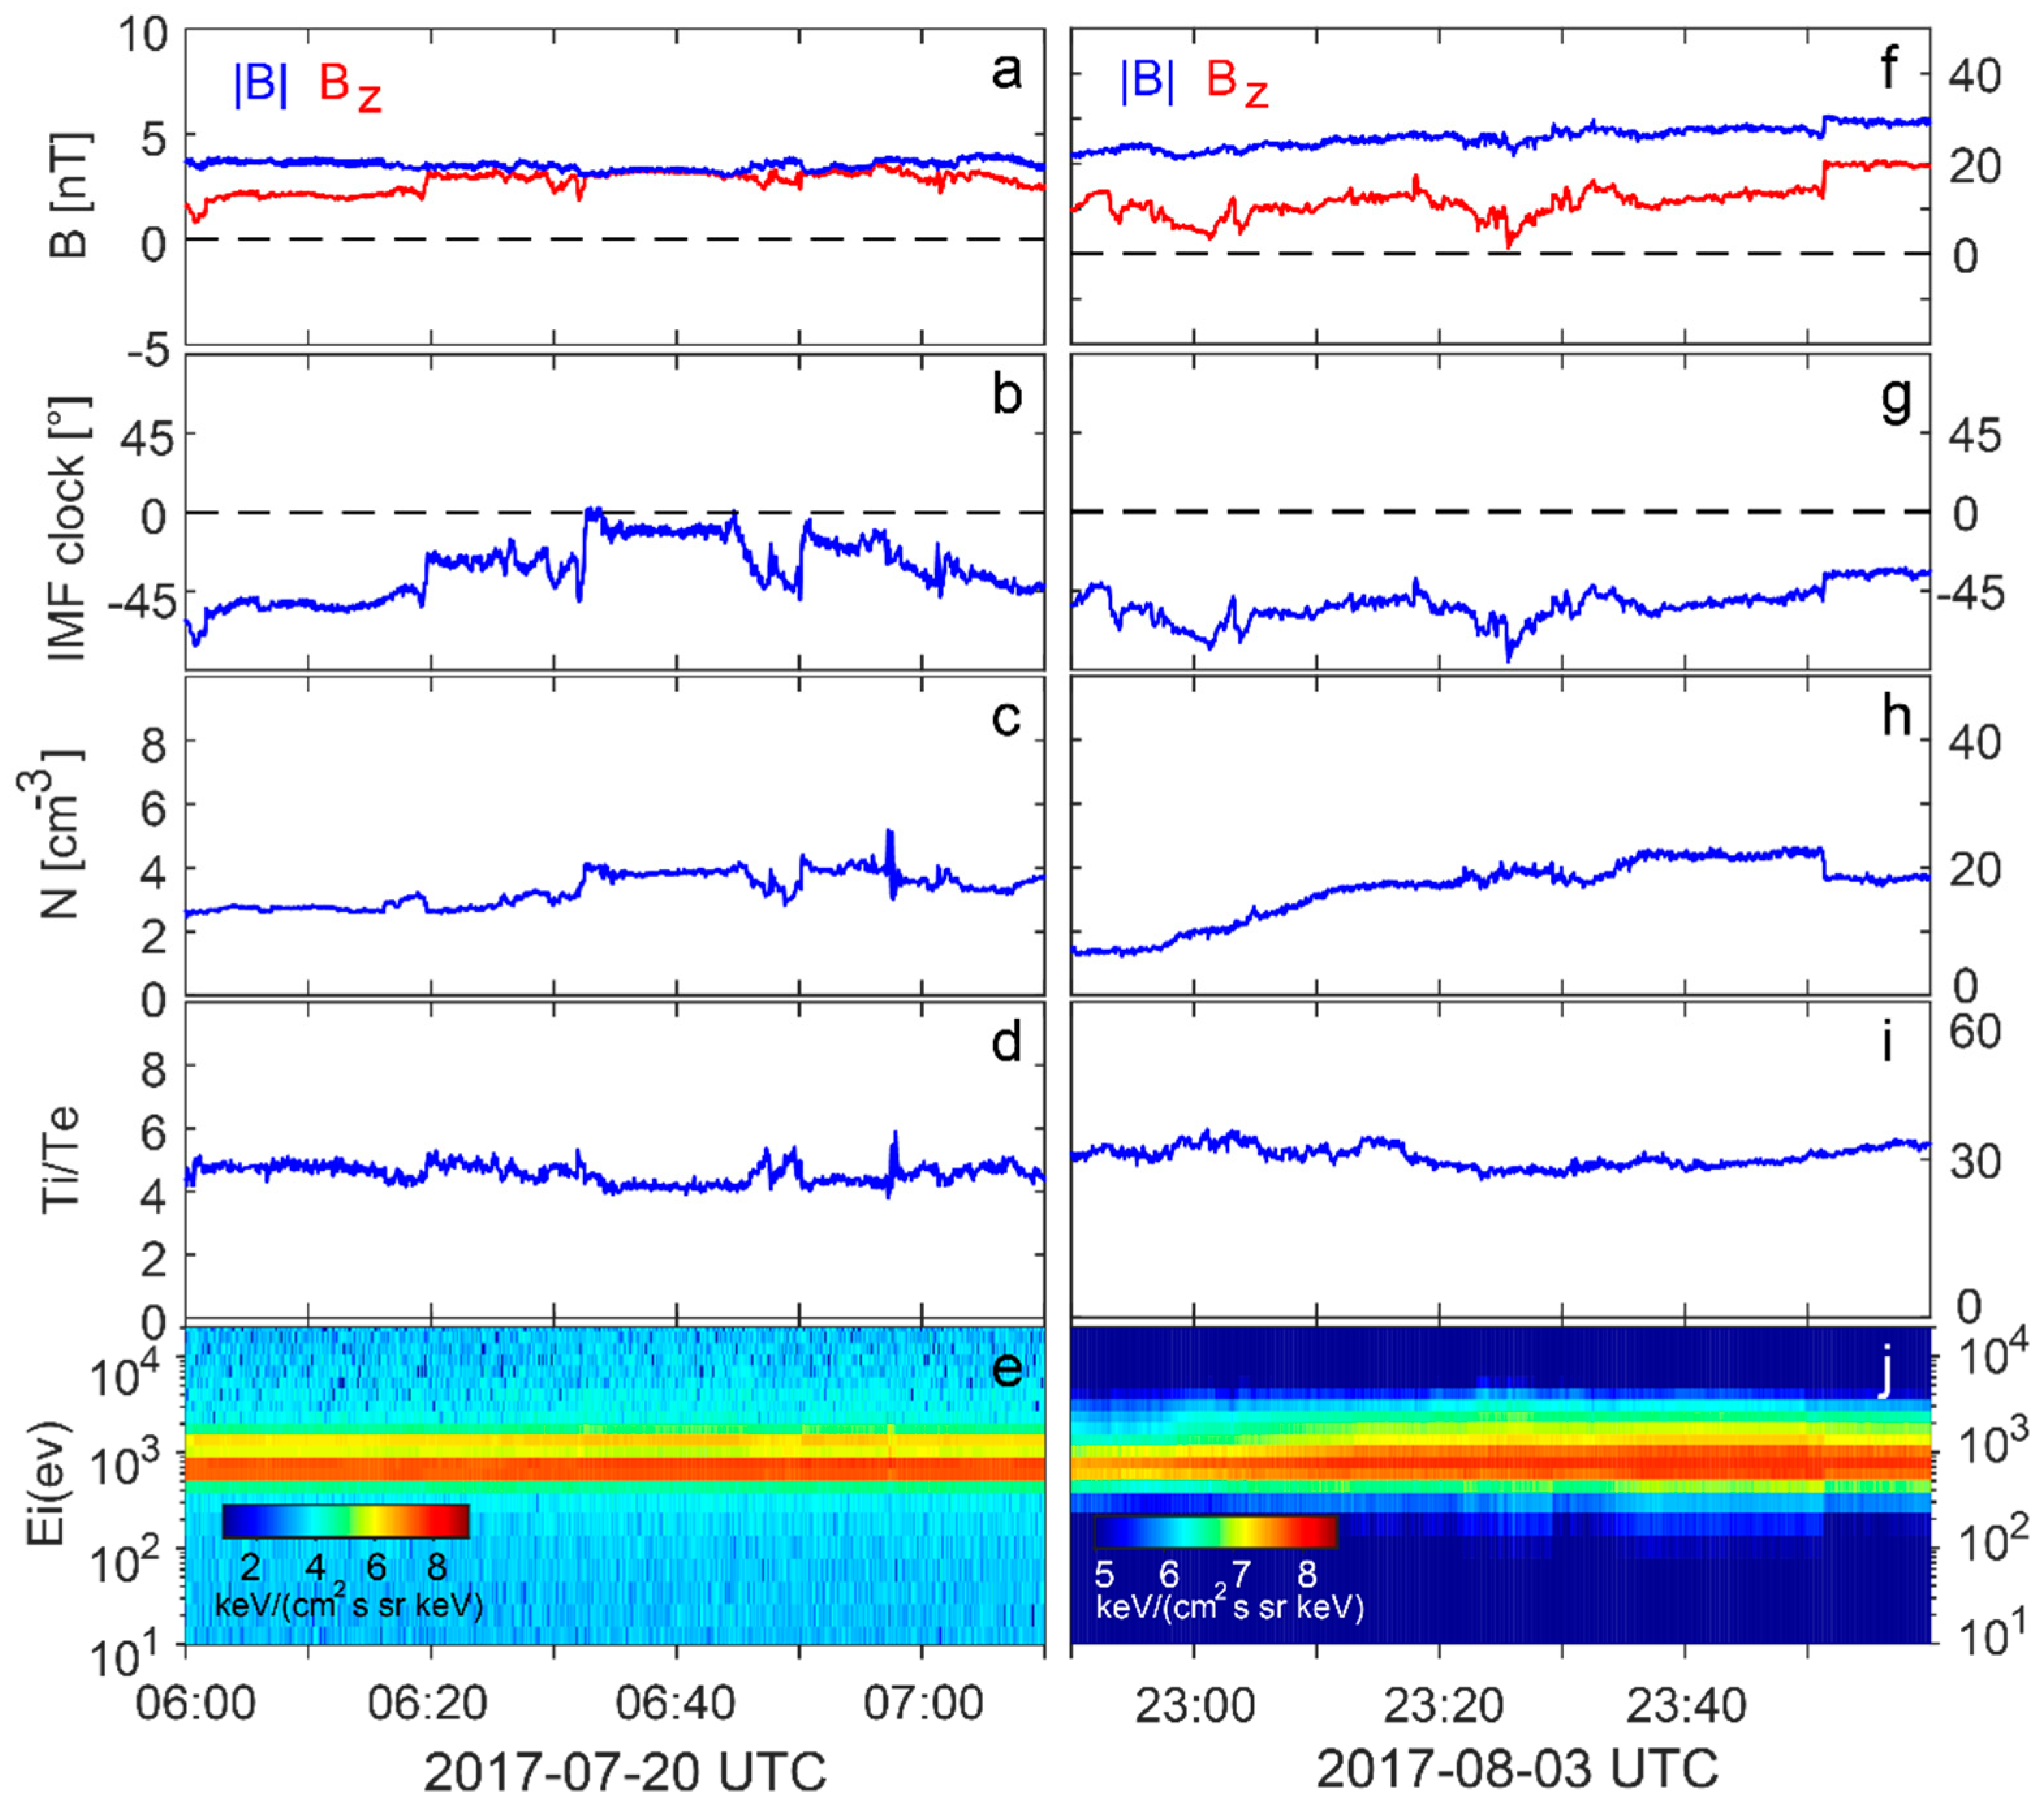
Li et al. [35] performed MHD simulations on the entry rate of the double cusp reconnection under different solar wind conditions, showing that the entry rate peaked under the following conditions: (1) the IMF magnitude was 10 nT, (2) the IMF clock angle was 0°, (3) the ion number density was 6.6 cm−3, (4) the solar wind speed was 500 km/s, and (5) the dipole tilt angle was 15°. For the first event, we checked the solar wind condition when the IMF was northward ~4 h ago: (1) the IMF magnitude was ~4 nT (Figure 7a), (2) the IMF clock angle varied from ~80° to ~0° (Figure 7b), (3) the ion number density was ~3 cm−3, (4) the solar wind speed was ~358 km/s (not shown), and (5) the dipole tilt angle was ~20.36° (not shown). Such conditions deviate largely from the best conditions presented in Li et al. [35], indicating that the entry rate of the double cusp reconnection was low. For the second event, we checked the solar wind conditions when the IMF was northward ~5.7 h ago: (1) the IMF magnitude was ~30 nT (Figure 7f), (2) the IMF clock angle was ~55° (Figure 7g), (3) the ion number density was ~15 cm−3, (4) the solar wind speed was ~365 km/s (not shown), and (5) the dipole tilt angle was ~10.02° (not shown). Such conditions also deviate largely from the best conditions presented in Li et al. [35], indicating that the entry rate of the double cusp reconnection was low. Thus, the cusp reconnection may contribute little to CDPSs. However, the simulation of Li et al. [35] is based on the long-lasting northward IMF. Such a condition is different from that in our events, which were observed shortly after IMF turned from southward to northward. Therefore, we can only obtain a rough estimation of the entry rate.
Therefore, these two CDPSs are mainly caused by KHI that occurs at LLBL. The cross-correlation analysis suggests that it takes 3.7–5.9 h for solar wind ions to enter the plasma sheet through the pathway, which is in agreement with previous studies [10].
Fujimoto et al. [56] presented a CDPS event where cold ion populations originate from the magnetosheath via LLBL. In the CDPS, these low-energy electrons mainly appear in the parallel and anti-parallel directions, showing the signature of a cigar distribution. In our events, one can observe a similar phenomenon as well (see Figure 2g and Figure 5g). Wang et al. [41] presented a magnetopause crossing at LLBL and found that the Ti/Te was conserved. In our study, however, the Ti/Te in the deeper plasma sheet was not the same as that in the solar wind. For the first event, Ti/Te in the plasma sheet (~9) was larger than that in the solar wind (~4) due to the existence of hotter ions in the plasma sheet, while the ratio of the cold ion to electron temperature in the plasma sheet (~4) was similar to Ti/Te in the solar wind (~4) due to the fact that these cold ions came from the solar wind. For the second event, both Ti/Te (~15) and the cold ion to electron temperature (~5) in the plasma sheet were smaller than Ti/Te in the solar wind (~30), possibly owing to the turbulent plasma environment in the magnetosheath when the solar wind near the LLBL propagated to the downstream ARTEMIS. Thus, we guess that Ti/Te near the LLBL may be ~5.
The CDPSs have effects on the dipolarization fronts (DFs) dynamics. The cold and dense plasma can alter the plasma density gradients near the dipolarization fronts [20,63] and thus affect the density-driven instabilities [21,22,64], electric field structure [23], and wave-particle interactions [62] near the DFs. It also possibly affects the growth and decay of the DF. In the first event, MMS detected two DFs (Figure 2a) embedded in an earthward ions flow burst (Figure 2f). Around these two DFs, the plasma number density varied dramatically, suggesting that the plasma density gradients near the DFs may be inconsistent with that near the normal DF. Further analyses of plasma density gradients near these two DFs remain to be conducted in future studies.

Author Contributions

Y.Y. gave the basic idea of the paper. Y.Y. and Z.C. designed the experiments and analysis tools, Y.Y., Z.C., and F.C. performed the experiments, and analyzed the data; Y.Y. and Z.C. participated in discussion and interpretation of the data. Y.Y. wrote the paper. All authors have read and agreed to the published version of the manuscript.

Funding

This research was funded by the National Natural Science Foundation of China (grant no. 41821003 and 41874188).

Acknowledgments

We thank the MMS team and ARTEMIS team for providing the data for this study. MMS data and ARTEMIS data are available at https://lasp.colorado.edu/mms/sdc/public/ and https://cdaweb.sci.gsfc.nasa.gov/index.html/, respectively.

Conflicts of Interest

The authors declare no conflict of interest.

References

  1. Baumjohann, W.; Paschmann, G.; Cattell, C.A. Average plasma properties in the center plasma sheet. J. Geophys. Res. Space Phys. 1989, 94, 6597–6606. [Google Scholar] [CrossRef]
  2. Fairfield, D.H.; Lepping, R.P.; Hones, E.W.; Bame, S.J.; Asbridge, J.R. Simultaneous measurements of magnetotail dynamics by IMP spacecraft. J. Geophys. Res. 1981, 86, 1396–1414. [Google Scholar] [CrossRef] [Green Version]
  3. Fujimoto, M.; Terasawa, T.; Mukai, T.; Saito, Y.; Yamamoto, T.; Kokubun, S. Plasma entry from the flanks of the near-Earth magnetotail: Geotail observations. J. Geophys. Res. 1998, 103, 4391–4408. [Google Scholar] [CrossRef]
  4. Lennartsson, O.W.; Shelley, E.G. Survey of 0.1- to 16-keV/e plasma sheet ion composition. J. Geophys. Res. 1986, 91, 3061–3076. [Google Scholar] [CrossRef]
  5. Lennartsson, W. A scenario for solar wind penetration of earth’s magnetotail based on ion composition data from the ISEE 1 spacecraft. J. Geophys. Res. 1992, 97, 19221–19238. [Google Scholar] [CrossRef]
  6. Øieroset, M.; Raeder, J.; Phan, T.D.; Wing, S.; McFadden, J.P.; Li, W.; Fujimoto, M.; Rѐme, H.; Balogh, A. Global cooling and densification of the plasma sheet during an extended period of purely northward IMF on October 22–24, 2003. Geophys. Res. Lett. 2005, 32, L12S07. [Google Scholar] [CrossRef]
  7. Stenuit, H.; Fujimoto, M.; Fuselier, S.A.; Sauvaud, J.-A.; Wing, S.; Fedorov, A.; Budnik, E.; Savin, S.P.; Trattner, K.J.; Angelopoulos, V.; et al. Multi-spacecraft study ion the dynamics of the dusk-flank magnetosphere under northward IMF: January 10–11, 1997. J. Geophys. Res. 2002, 107, 1333. [Google Scholar] [CrossRef]
  8. Sorathia, K.; Merkin, V.G.; Ukhorskiy, A.Y.; Allen, R.C.; Nykyri, K.; Wing, S. Solar wind ion entry into the magnetosphere during northward IMF. J. Geophys. Res. Space Phys. 2019, 124, 5461–5481. [Google Scholar] [CrossRef] [Green Version]
  9. Thomsen, M.F.; Borovsky, J.E.; Skoug, R.M.; Smith, C.W. Delivery of cold, dense plasma sheet material into the near-Earth region. J. Geophys. Res. 2003, 108, 1151. [Google Scholar] [CrossRef] [Green Version]
  10. Terasawa, T.; Fujimoto, M.; Mukai, T.; Shinohara, I.; Lepping, R.P. Solar wind control of density and temperature in the near-Earth plasma sheet: WIND/GEOTAIL collaboration. Geophys. Res. Lett. 1997, 24, 935–938. [Google Scholar] [CrossRef]
  11. Wing, S.; Newell, P.T. 2D plasma sheet ion density and temperature profiles for northward and southward IMF. Geophys. Res. Lett. 2002, 29, 21-1–21-4. [Google Scholar] [CrossRef] [Green Version]
  12. Wing, S.; Johnson, J.R.; Chaston, C.C.; Echim, M.; Escoubet, C.P.; Lavraud, B.; Lemon, C.; Nykyri, K.; Otto, A.; Raeder, J.; et al. Review of Solar Wind Entry into and Transport within the Plasma Sheet. Space Sci. Rev. 2014, 184, 33–86. [Google Scholar] [CrossRef]
  13. Borovsky, J.E.; Thomsen, M.F.; McComas, D.J. The superdense plasma sheet: Plasmaspheric origin, solar wind origin, or ionospheric origin? J. Geophys. Res. 1997, 102, 22089–22097. [Google Scholar] [CrossRef]
  14. Lavraud, B.; Thomsen, M.F.; Borovsky, J.E.; Denton, M.H.; Pulkkinen, T.I. Magnetosphere preconditioning under northward IMF: Evidence from the study of coronal mass ejection and corotating interaction region geoeffectiveness. J. Geophys. Res. 2006, 111, A09208. [Google Scholar] [CrossRef] [Green Version]
  15. Fu, H.S.; Khotyaintsev, Y.V.; Vaivads, A.; André, M.; Huang, S.Y. Occurrence rate of earthward-propagating dipolarization fronts. Geophys. Res. Lett. 2012, 39, L10101. [Google Scholar] [CrossRef]
  16. Xu, Y.; Fu, H.S.; Norgren, C.; Hwang, K.J.; Liu, C.M. Formation of dipolarization fronts after current sheet thinning. Phys. Plasmas 2018, 25, 072123. [Google Scholar] [CrossRef]
  17. Yao, Z.; Sun, W.J.; Fu, S.Y.; Pu, Z.Y.; Liu, J.; Angelopoulos, V.; Zhang, X.J.; Chu, X.N.; Shi, Q.Q.; Guo, R.L.; et al. Current structures associated with depolarization fronts. J. Geophys. Res. Space Phys. 2013, 118, 6980–6985. [Google Scholar] [CrossRef]
  18. Toledo-Redondo, S.; André, M.; Khotyaintsev, Y.V.; Vaivads, A.; Walsh, A.; Li, W.; Graham, D.B.; Lavraud, B.; Masson, A.; Aunai, N.; et al. Cold ion demagnetization near the X-line of magnetic reconnection. Geophys. Res. Lett. 2016, 43, 6759–6767. [Google Scholar] [CrossRef]
  19. Wang, J.; Cao, J.B.; Fu, H.S.; Liu, W.L.; Lu, S. Enhancement of oxygen in the magnetic island associated with dipolarization fronts. J. Geophys. Res. Space Phys. 2017, 122, 185–193. [Google Scholar] [CrossRef]
  20. Xu, Y.; Fu, H.S.; Norgren, C.; Toledo-Redondo, S.; Liu, C.M.; Dong, X.C. Ionospheric cold ions detected by MMS behind dipolarization fronts. Geophys. Res. Lett. 2019, 46, 7883–7892. [Google Scholar] [CrossRef]
  21. Chen, Z.Z.; Fu, H.S.; Liu, C.M.; Wang, T.Y.; Ergun, R.E.; Cozzani, G.; Huang, S.Y.; Khotyaintsev, Y.V.; Le Contel, O.; Giles, B.L.; et al. Electron–driven dissipation in a tailward flow burst. Geophys. Res. Lett. 2019, 46, 5698–5706. [Google Scholar] [CrossRef]
  22. Liu, C.M.; Fu, H.S.; Vaivads, A.; Khotyaintsev, Y.V.; Gershman, D.J.; Hwang, K.J.; Chen, Z.Z.; Cao, D.; Xu, Y.; Yang, J.; et al. Electron jet detected by MMS at dipolarization front. Geophys. Res. Lett. 2018, 45, 556–564. [Google Scholar] [CrossRef]
  23. Fu, H.S.; Khotyaintsev, Y.V.; Vaivads, A.; André, M.; Huang, S.Y. Electric structure of depolarization front at sub-proton scale. Geophys. Res. Lett. 2012, 39, L06105. [Google Scholar] [CrossRef]
  24. Fu, H.S.; Khotyaintsev, Y.V.; André, M.; Vaivads, A. Fermi and betatron acceleration of suprathermal electrons behind depolarization fronts. Geophys. Res. Lett. 2011, 38, L16104. [Google Scholar] [CrossRef]
  25. Fu, H.S.; Khotyaintsev, Y.V.; Vaivads, A.; Retinò, A.; André, M. Energetic electron acceleration by unsteady magnetic reconnection. Nat. Phys. 2013, 9, 426–430. [Google Scholar] [CrossRef] [Green Version]
  26. Fu, H.S.; Cao, J.B.; Khotyaintsev, Y.V.; Sitnov, M.I.; Runov, A.; Fu, S.Y.; Hamrin, M.; André, M.; Retinò, A.; Ma, Y.D.; et al. Dipolarization fronts as a consequence of transient reconnection: In situ evidence. Geophys. Res. Lett. 2013, 40, 6023–6027. [Google Scholar] [CrossRef] [Green Version]
  27. Fu, H.S.; Xu, Y.; Vaivads, A.; Khotyaintsev, Y.V. Super-efficient Electron Acceleration by an Isolated Magnetic Reconnection. Astrophys. J. Lett. 2019, 870, L22. [Google Scholar] [CrossRef]
  28. Liu, C.M.; Fu, H.S.; Xu, Y.; Wang, T.Y.; Cao, J.B.; Sun, X.G.; Yao, Z.H. Suprathermal electron acceleration inthe near-Earth flow rebounce region. J. Geophys. Res. Space Phys. 2017, 122, 594–604. [Google Scholar] [CrossRef]
  29. Liu, C.M.; Liu, Y.Y.; Xu, Y.; Zhao, M.J. Betatron Cooling of Suprathermal Electrons in the Terrestrial Magnetotail. Astrophys. J. 2018, 866, 93. [Google Scholar] [CrossRef]
  30. Wu, M.; Lu, Q.; Volwerk, M.; Nakamura, R.; Zhang, T. Electron acceleration behind a wavy dipolarization front. Astrophys. Space Sci. 2018, 363, 22. [Google Scholar] [CrossRef]
  31. Xu, Y.; Fu, H.S.; Liu, C.M.; Wang, T.Y. Electron acceleration by dipolarization fronts and magnetic reconnection: A quantitative comparison. Astrophys. J. 2018, 853, 11. [Google Scholar] [CrossRef]
  32. Fu, H.S.; Khotyaintsev, Y.V.; Vaivads, A.; André, M.; Sergeev, V.A.; Huang, S.Y.; Kronberg, E.A.; Daly, P.W. Pitch angle distribution of suprathermal electrons behind dipolarization fronts: A statistical overview. J. Geophys. Res. 2012, 117, A12221. [Google Scholar] [CrossRef]
  33. Liu, C.M.; Fu, H.S.; Cao, J.B.; Xu, Y.; Yu, Y.Q.; Kronberg, E.A.; Daly, P.W. Rapid pitch angle evolution of suprathermal electrons behind dipolarization fronts. Geophys. Res. Lett. 2017, 44, 10116–10124. [Google Scholar] [CrossRef]
  34. Liu, C.M.; Fu, H.S.; Xu, Y.; Cao, J.B.; Liu, W.L. Explaining the rolling-pin distribution of suprathermal electrons behind depolarization fronts. Geophys. Res. Lett. 2017, 44, 6492–6499. [Google Scholar] [CrossRef]
  35. Li, W.; Raeder, J.; Thomsen, M.F.; Lavraud, B. Solar wind plasma entry into the magnetosphere under northward IMF conditions. J. Geophys. Res. 2008, 113, A04204. [Google Scholar] [CrossRef] [Green Version]
  36. Lavraud, B.; Denton, M.H.; Thomsen, M.F.; Borovsky, J.E.; Friedel, R.H.W. Superposed epoch analysis of dense plasma access to geosynchronous orbit. Ann. Geophys. 2005, 23, 2519–2529. [Google Scholar] [CrossRef] [Green Version]
  37. Øieroset, M.; Yamauchi, M.; Liszka, L.; Hultqvist, B. Energetic ion outflow from the dayside ionosphere: Categorization, classification, and statistical study. J. Geophys. Res. 1999, 104, 24915–24928. [Google Scholar] [CrossRef]
  38. Yau, A.W.; Shelley, E.G.; Peterson, W.K.; Lenchyshyn, L. Energetic auroral and polar ion outflow at DE 1 altitudes: Magnitude, composition, magnetic activity dependence, and long-term variations. J. Geophys. Res. 1985, 90, 8417. [Google Scholar] [CrossRef]
  39. Fuselier, S.A.; Elphic, R.C.; Gosling, J.T. Composition measurements in the dusk flank magnetopause. J. Geophys. Res. 1999, 104, 4515–4522. [Google Scholar] [CrossRef]
  40. Reme, H.; Aoustin, C.; Bosqued, J.M.; Dandouras, I.; Lavraud, B.; Sauvaud, J.A.; Barthe, A.; Bouyssou, J.; Camus, T.; Coeur-Joly, O.; et al. First multispacer craft ion measurements in and near the Earth’s magnetosphere with identical Cluster ion spectrometry (CIS) experiments. Ann. Geophys. 2001, 19, 1303–1354. [Google Scholar] [CrossRef] [Green Version]
  41. Wang, C.-P.; Gkioulidou, M.; Lyons, L.R.; Angelopoulos, V. Spatial distributions of the ion to electron temperature ratio in the magnetosheath and plasma sheet. J. Geophys. Res. 2012, 117, A08215. [Google Scholar] [CrossRef] [Green Version]
  42. Burch, J.L.; Moore, T.E.; Torbert, R.B.; Giles, B.L. Magnetospheric Multiscale overview and science objectives. Space Sci. Rev. 2016, 199, 5–21. [Google Scholar] [CrossRef] [Green Version]
  43. Russell, C.T.; Anderson, B.J.; Baumjohann, W.; Bromund, K.R.; Dearborn, D.; Fischer, D.; Le, G.; Leinweber, H.K.; Leneman, D.; Magnes, W.; et al. The magnetospheric multiscale magnetometers. Space Sci. Rev. 2014, 199, 189–256. [Google Scholar] [CrossRef] [Green Version]
  44. Pollock, C.; Moore, T.; Jacques, A.; Burch, J.; Gliese, U.; Saito, Y.; Omoto, T.; Avanov, L.; Barrie, A.; Coffey, V.; et al. Fast plasma investigation for magnetospheric multiscale. Space Sci. Rev. 2016, 199, 331–406. [Google Scholar] [CrossRef] [Green Version]
  45. Angelopoulos, V. The ARTEMIS mission. Space Sci. Rev. 2011, 165, 3–25. [Google Scholar] [CrossRef]
  46. Auster, H.U.; Glassmeier, K.H.; Magnes, W.; Aydogar, O.; Baumjohann, W.; Constantinescu, D.; Fischer, D.; Fornacon, K.H.; Georgescu, E.; Harvey, P.; et al. The THEMIS fluxgate magnetometer. Space Sci. Rev. 2008, 141, 235–264. [Google Scholar] [CrossRef]
  47. McFadden, J.P.; Carlson, C.W.; Larson, D.; Ludlam, M.; Abiad, R.; Elliott, B.; Turin, P.; Marckwordt, M.; Angelopoulos, V. The THEMIS ESA plasma instrument and in-flight calibration. Space Sci. Rev. 2008, 141, 277. [Google Scholar] [CrossRef]
  48. Sibeck, D.G. A model for the transient magnetospheric response to sudden solar wind dynamic pressure variations. J. Geophys. Res. 1990, 95, 3755–3771. [Google Scholar] [CrossRef]
  49. Cao, J.B.; Ma, Y.D.; Parks, G.; Reme, H.; Dandouras, I.; Nakamura, R.; Zhang, T.L.; Zong, Q.; Lucek, E.; Carr, C.M.; et al. Joint observations by Cluster satellites of bursty bulk flows in the magnetotail. J. Geophys. Res. 2006, 111, A04206. [Google Scholar] [CrossRef]
  50. Huang, S.Y.; Fu, H.S.; Vaivads, A.; Yuan, Z.G.; Pang, Y.; Zhou, M.; Khotyaintsev, Y.V.; Deng, X.H.; André, M.; Zhang, L.; et al. Dawn-dusk scale of dipolarization front in the Earth’s magnetotail: Multi-Cases study. Astrophys. Space Sci. 2015, 357, 22. [Google Scholar] [CrossRef]
  51. Fujimoto, M.; Mukai, T.; Matsuoka, A.; Saito, Y.; Hayakawa, H.; Kokubun, S.; Lepping, R.P. Multipoint observations of cold-dense plasma sheet and its relation with tail-LLBL. Adv. Space Res. 2000, 25, 1607–1616. [Google Scholar] [CrossRef]
  52. Fujimoto, M.; Mukai, T.; Kokubun, S. Cold-dense plasma sheet and hot-dense ions in the inner-magnetosphere. Adv. Space Res. 2002, 30, 2279–2288. [Google Scholar] [CrossRef]
  53. Hasegawa, H.; Fujimoto, M.; Maezawa, K.; Saito, Y.; Mukai, T. Geotail observations of the dayside outer boundary region interplanetary magnetic field control and dawn-dusk asymmetry. J. Geophys. Res. 2003, 108, 1065. [Google Scholar] [CrossRef] [Green Version]
  54. Li, W.; Raeder, J.; Thomsen, M.F.; Lavraud, B.; Lü, L.-Z.; Liang, E.-W. The formation of superdense plasma sheet in association with the IMF turning from northward to southward. J. Geophys. Res. Space Phys. 2018, 122, 2936–2955. [Google Scholar] [CrossRef]
  55. Zhao, M.J.; Fu, H.S.; Liu, C.M.; Chen, Z.Z.; Xu, Y.; Giles, B.L.; Burch, J.L. Energy range of electron rolling pin distribution behind dipolarization front. Geophys. Res. Lett. 2019, 46, 2390–2398. [Google Scholar] [CrossRef]
  56. Fujimoto, M.; Terasawa, T.; Mukai, T. The Cold-dense plasma sheet: A Geotail Perspective. Space Sci. Rev. 1997, 80, 325–339. [Google Scholar] [CrossRef]
  57. Hasegawa, H.; Fujimoto, M.; Phan, T.D.; Re`me, H.; Balogh, A.; Dunlop, M.W.; Hashimoto, C.; TanDokoro, R. Transport of solar wind into Earth’s magnetosphere through rolled-up Kelvin-Helmholtz vortices. Nature 2004, 430, 755. [Google Scholar] [CrossRef]
  58. Burch, J.L.; Torbert, R.B.; Phan, T.D.; Chen, L.J.; Moore, T.E.; Ergun, R.E.; Eastwood, J.P.; Gershman, D.J.; Cassak, P.A.; Argall, M.R.; et al. Electron-scale measurements of magnetic reconnection in space. Science 2016, 352, aaf2939. [Google Scholar] [CrossRef] [Green Version]
  59. Speiser, T.W. Particle trajectories in model current sheets: 1. Analytical solutions. J. Geophys. Res. 1965, 70, 4219–4226. [Google Scholar] [CrossRef]
  60. Torbert, R.B.; Burch, J.L.; Phan, T.D.; Hesse, M.; Argall, M.R.; Shuster, J.; Ergun, R.E.; Alm, L.; Nakamura, R.; Genestreti, K.J.; et al. Electron-scale dynamics of the diffusion region during symmetric magnetic reconnection in space. Science 2018, 362, 1391–1395. [Google Scholar] [CrossRef] [Green Version]
  61. Haaland, S.; Lybekk, B.; Maes, L.; Laundal, K.; Pedersen, A.; Tenfjord, P.; Ohma, A.; Østgaard, N.; Reistad, J.; Snekvik, K. North south asymmetries in cold plasma density in the magnetotail lobes: Cluster observations. J. Geophys. Res. Space Phys. 2017, 122, 136–149. [Google Scholar] [CrossRef] [Green Version]
  62. Breuillard, H.; Le Contel, O.; Retino, A.; Chasapis, A.; Chust, T.; Mirioni, L.; Graham, D.B.; Wilder, F.D.; Cohen, I.; Vaivads, A.; et al. Multispacecraft analysis of dipolarization fronts and associated whistler wave emissions using MMS data. Geophys. Res. Lett. 2016, 43, 7279–7286. [Google Scholar] [CrossRef]
  63. Liu, C.M.; Fu, H.S.; Xu, Y.; Khotyaintsev, Y.V.; Burch, J.L.; Ergun, R.E.; Gershman, D.G.; Torbert, R.B. Electron-scale measurements of dipolarization front. Geophys. Res. Lett. 2018, 45, 4628–4638. [Google Scholar] [CrossRef]
  64. Chen, Z.Z.; Wang, T.Y.; Yu, Y.; Chen, F. Relationship between Current Filaments and Turbulence during a Turbulent Reconnection. Astrophys. J. Lett. 2020, 888, L16. [Google Scholar] [CrossRef]
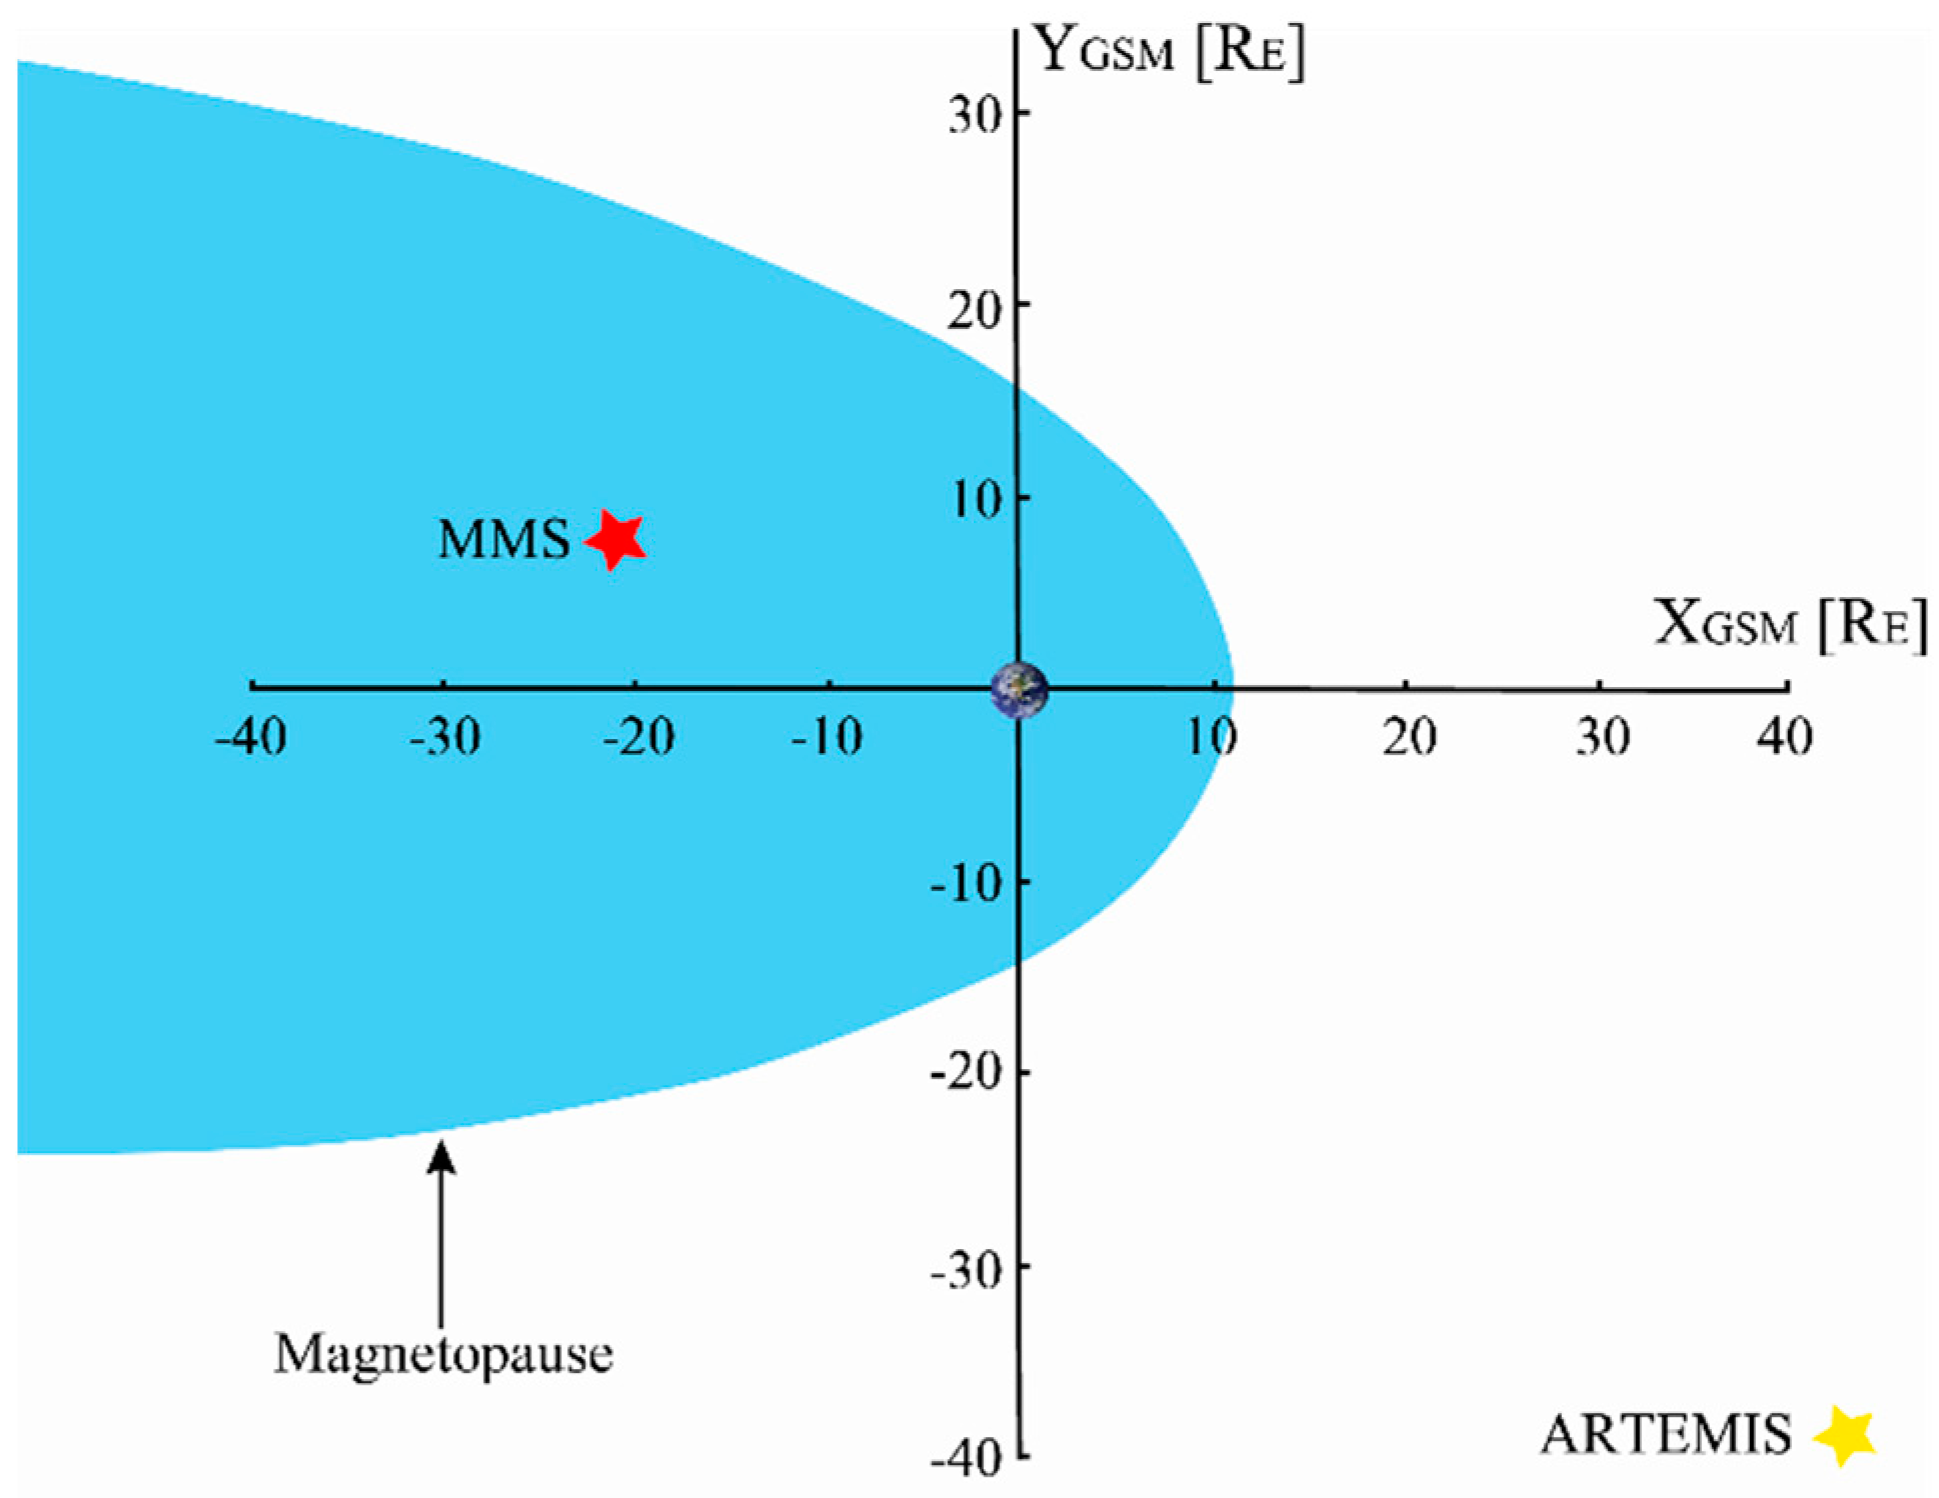
Figure 1. The locations of MMS (denoted by red pentagram) and ARTEMIS (denoted by yellow pentagram) in the GSM coordinates on 20 July 2017. The cyan grid region denotes the magnetosphere. The location of the magnetopause is calculated with Sibeck’s model [48]. GSM = Geocentric Solar Magnetospheric.
Atmosphere 11 00831 g001
Figure 2. MMS1 observations of a cold and dense plasma sheet (CDPS) on 20 July 2017. (a) Magnetic field Bx component (blue curve), By component(green curve), and Bz component(red curve); (b) electron (black curve) and ion (green curve) number density; (c) electron temperature; (d) ion temperature (black), cold ion temperature (green), and hot ion temperature divided by 5 (blue); (e) the ratio of the ion to electron temperature (black) and the ratio of the cold ion to electron temperature (green); (f) ion velocity Vx component (blue curve), Vy component (green curve), and Vz component (red curve); (g) pitch angle distribution of electrons with an energy of 2–200 eV; (h) ion differential energy flux (0.01–30 keV); and (i) plasma β. The orbit of MMS is presented at the bottom of panel i.
Atmosphere 11 00831 g002
Figure 3. Direct comparison of the ion populations between the CDPS and the solar wind on 20 July 2017. ARTEMIS observations of (a) the Interplanetary Field (IMF) Bz component and (b) ion differential energy flux in the solar wind. MMS1 observations of (c) the ion differential energy flux in the CDPS and (d) He+ number density. (e) Cross-correlation coefficient of the ion number density between the CDPS and the solar wind. The orbit of ARTEMIS is presented at the bottom of panel c.
Atmosphere 11 00831 g003
Figure 4. The locations of MMS (denoted by red pentagram) and ARTEMIS (denoted by yellow pentagram) in the GSM coordinates on 4 August 2017.The figure is in the same format as Figure 1.
Atmosphere 11 00831 g004
Figure 5. MMS1 observations of a CDPS on 4 August 2017.The figure is in the same format as Figure 2.
Atmosphere 11 00831 g005
Figure 6. Direct comparison of the ion populations between the CDPS and the solar wind on 4 August 2017. The figure is in the same format as Figure 3.
Atmosphere 11 00831 g006
Figure 7. Parameters of the solar wind observed by ARTEMIS. On 20 July 2017: (a)Magnetic field strength (blue) and magnetic field Bz component (red); (b) Interplanetary magnetic field (IMF) clock angle; (c) ion number density; (d) the ratio of the ion to electron temperature; (e) ion differential energy flux (0.01–30 keV).On 3 August 2017: (f) Magnetic field strength (blue) and magnetic field Bz component (red); (g) IMF clock angle; (h) ion number density; (i) the ratio of the ion to electron temperature; (j) ion differential energy flux (0.01–30 keV).
Atmosphere 11 00831 g007