Growth Response of Endemic Black Pine Trees to Meteorological Variations and Drought Episodes in a Mediterranean Region


Abstract
1. Introduction
2. Material and Methods
2.1. Overview
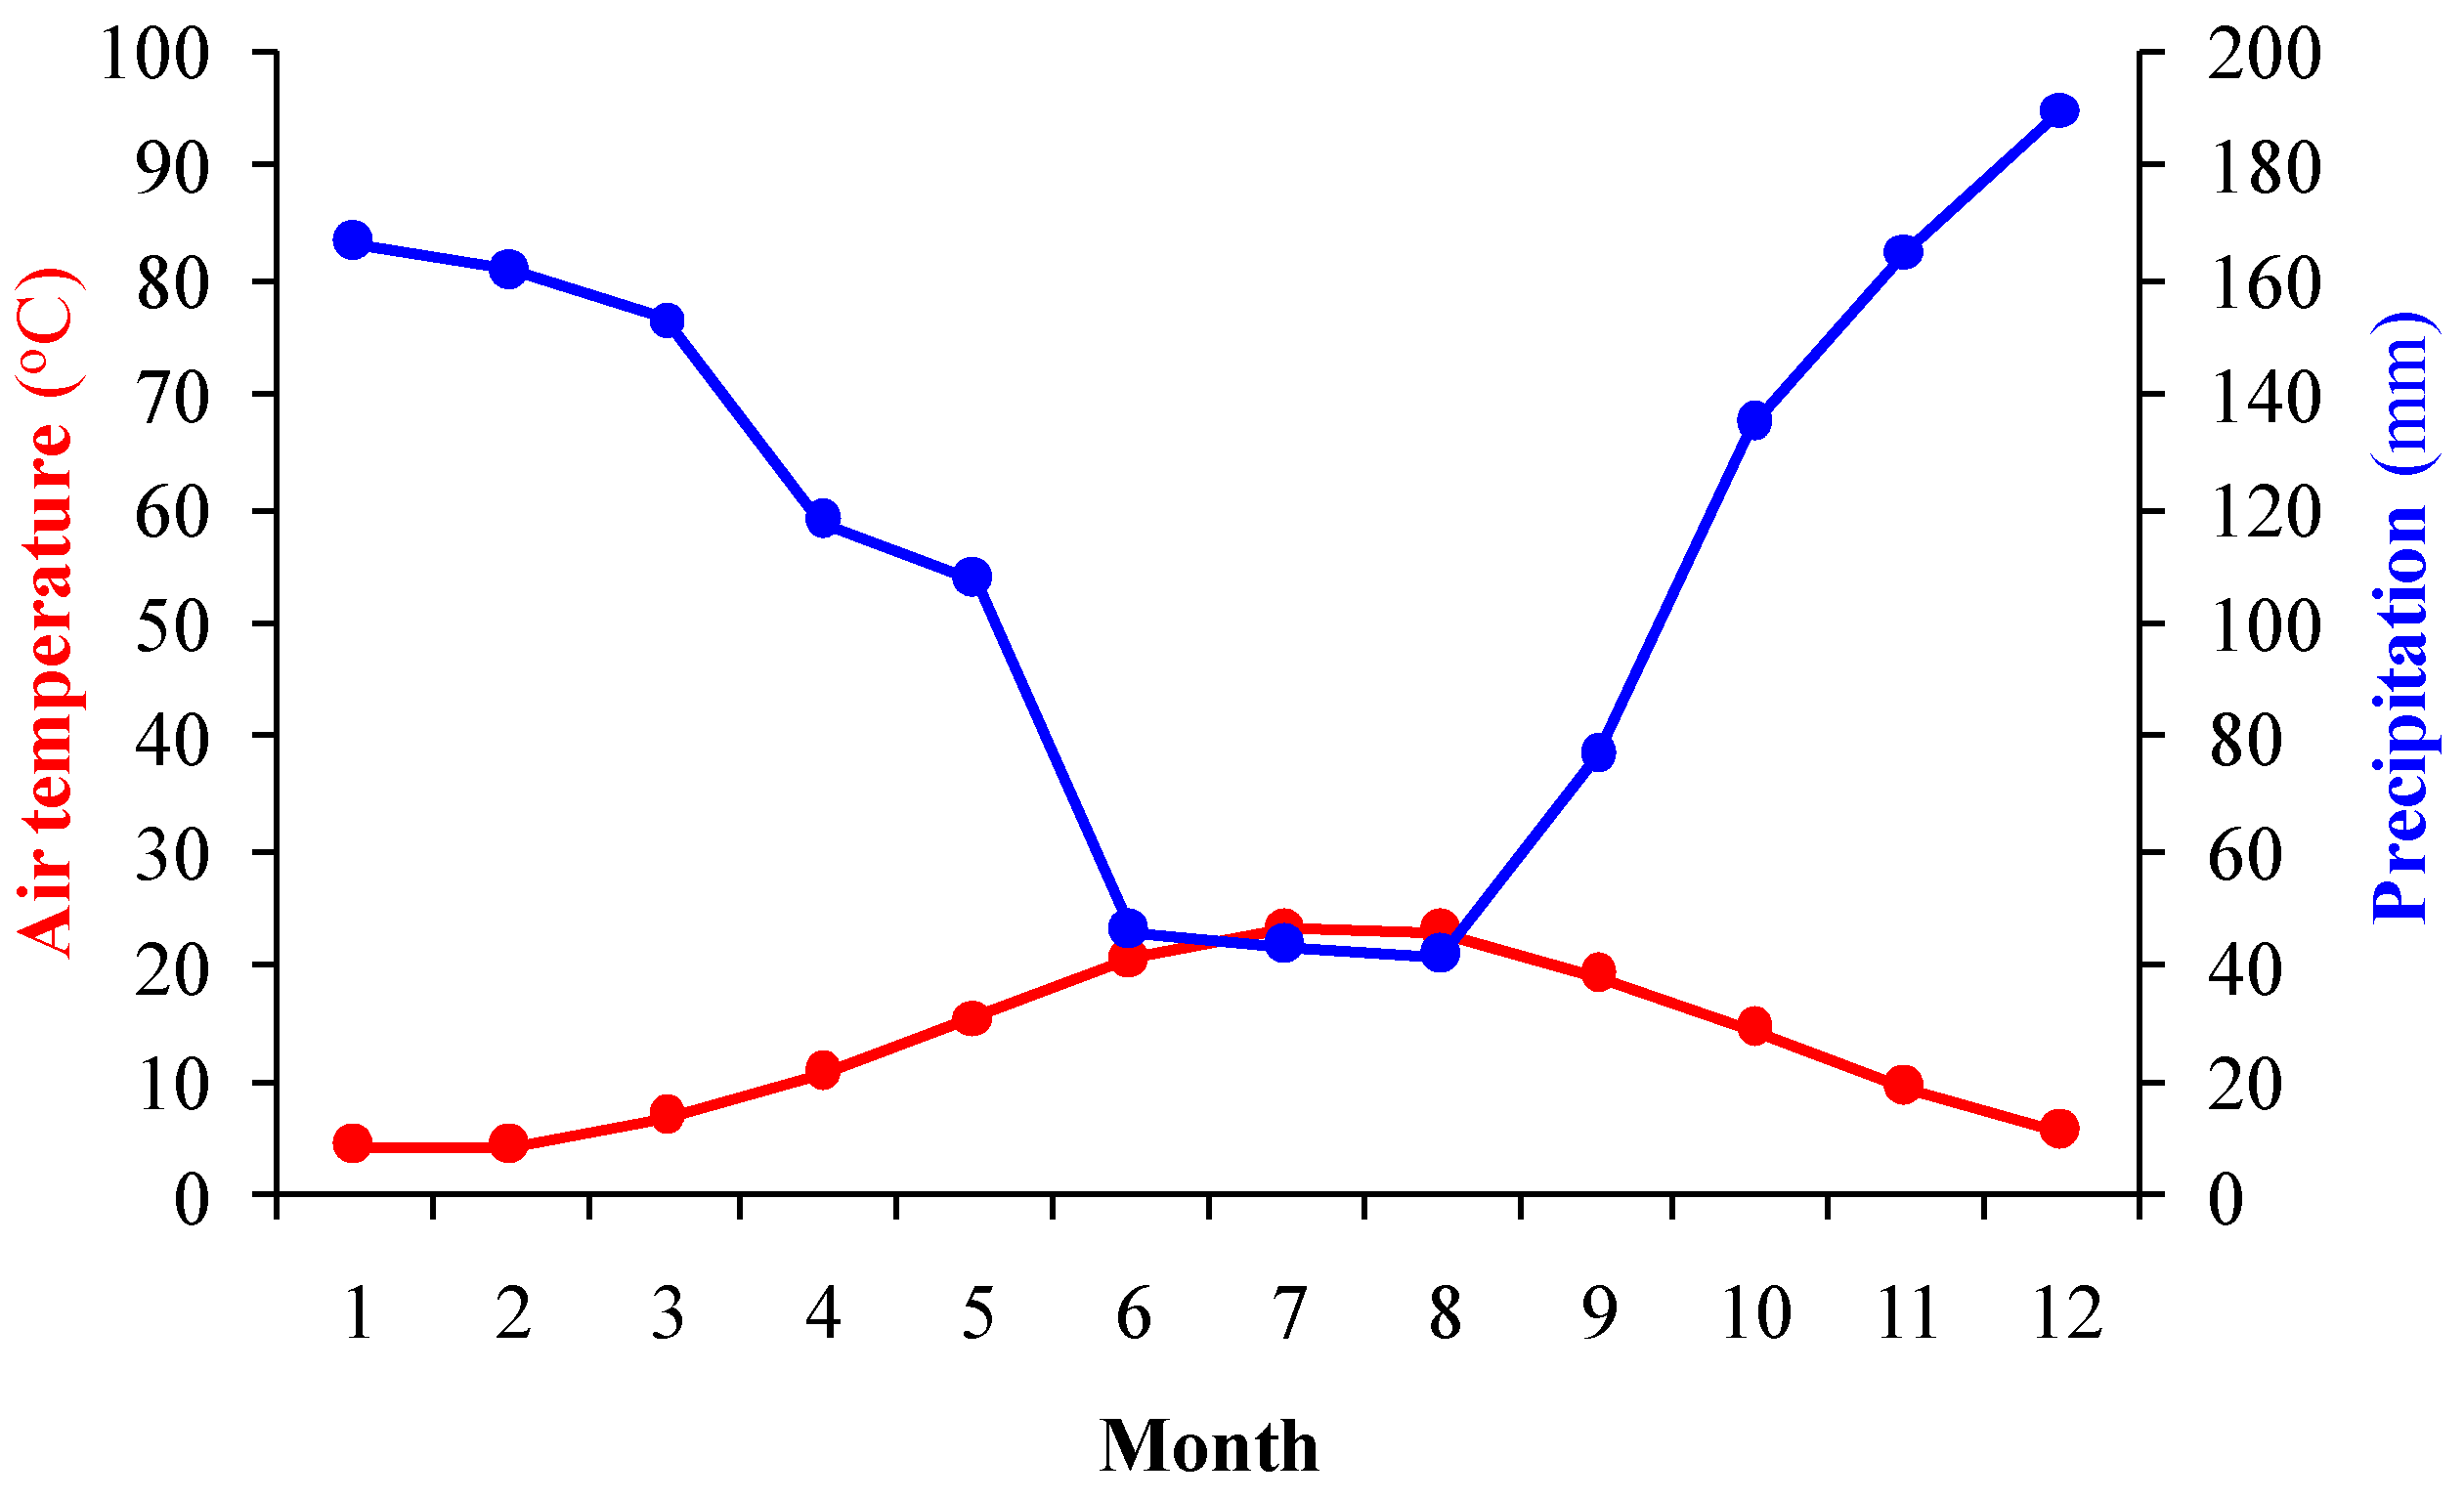
2.2. Study Area
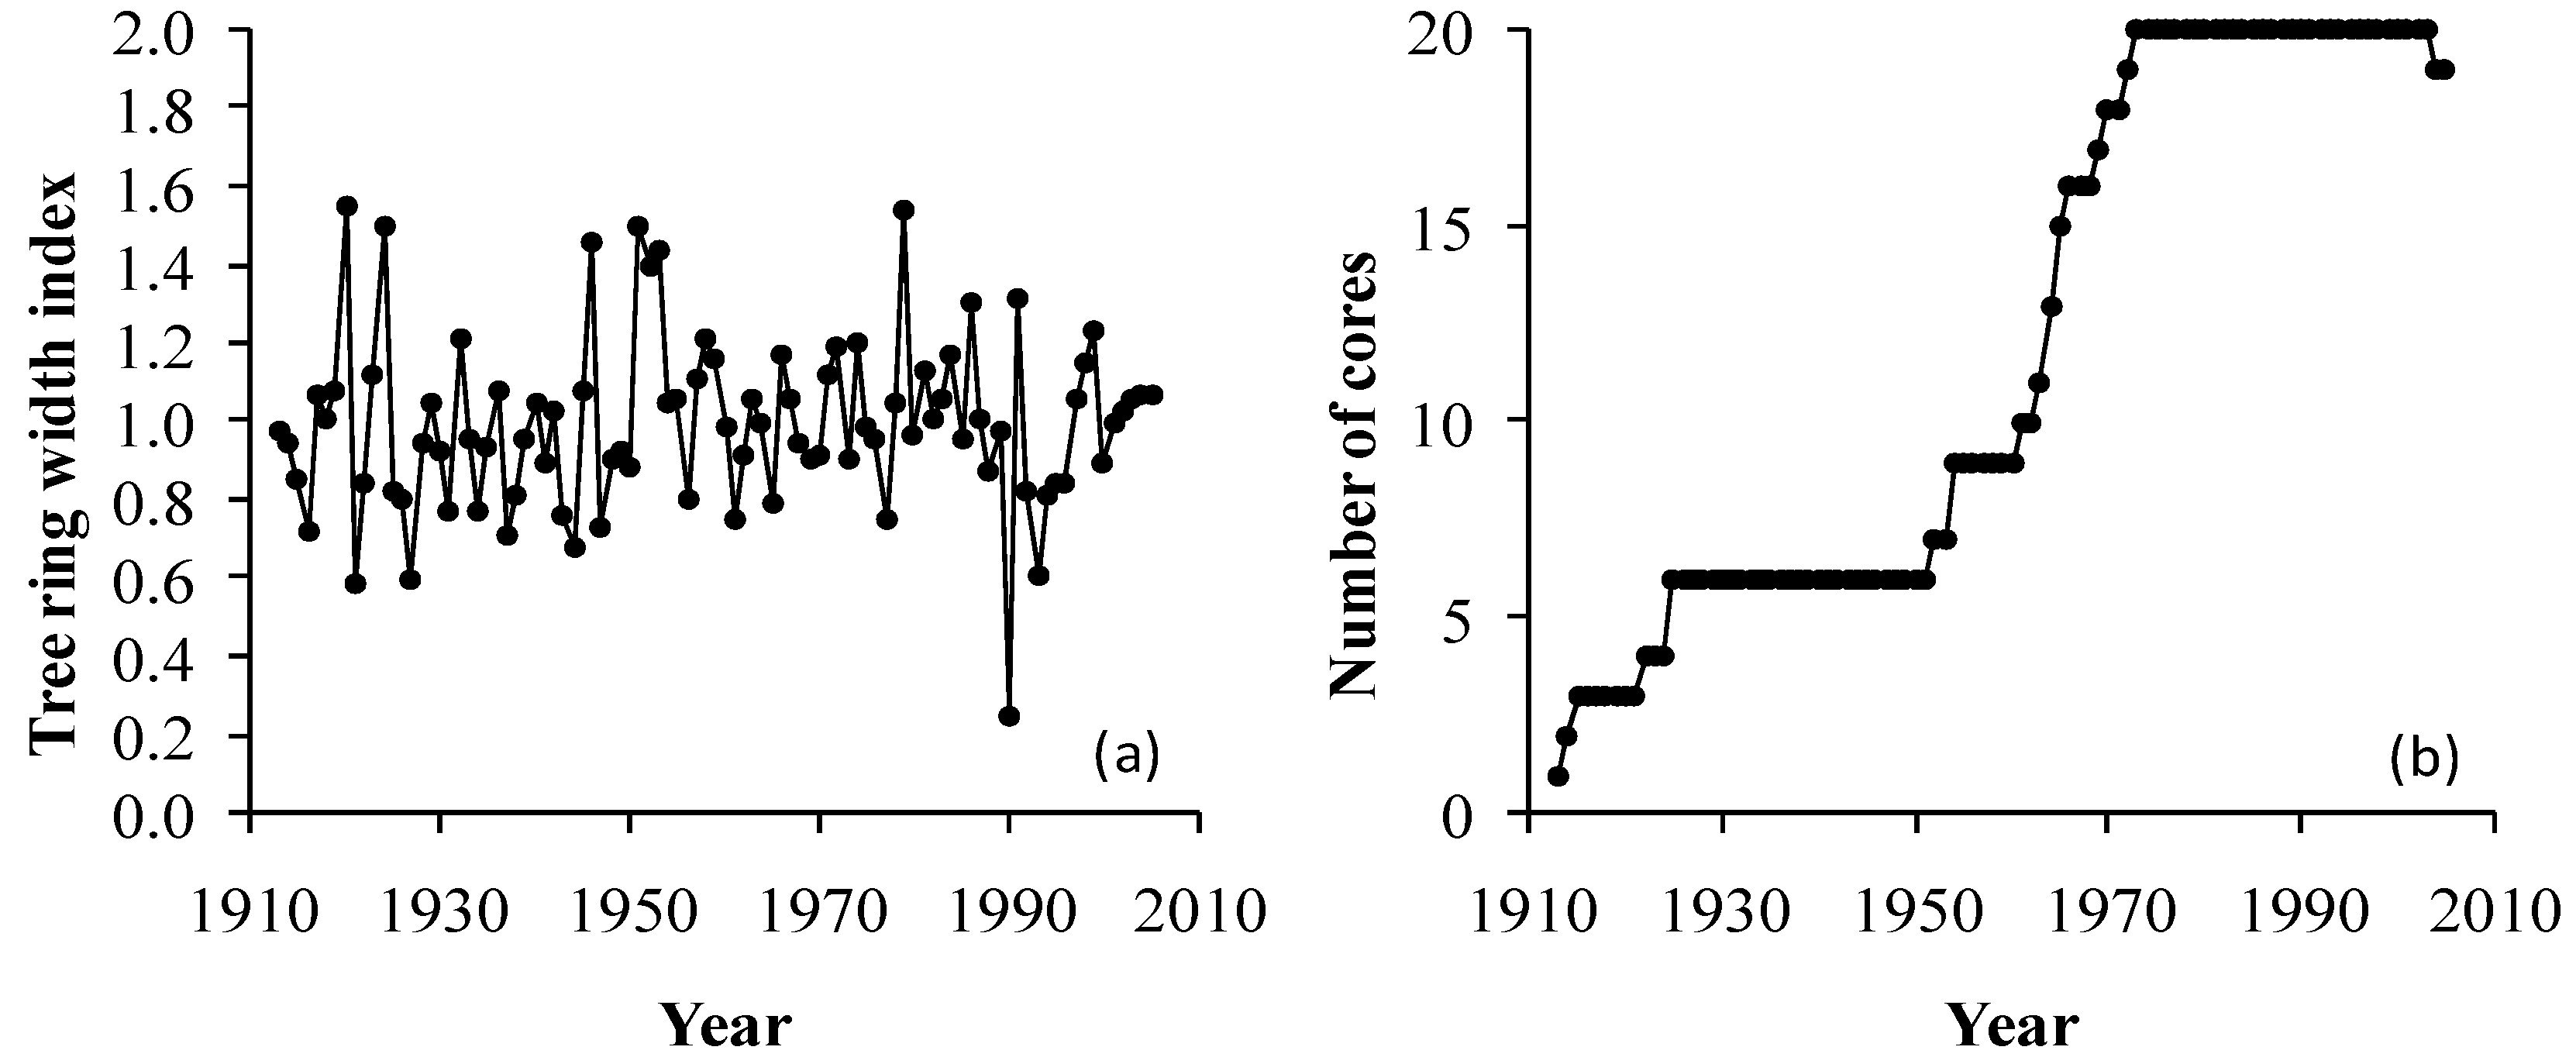
2.3. Tree-Ring Data and Analysis
2.4. Meteorological Data and Parameters
2.5. Drought Indices
3. Results
3.1. Tree-Growth Response to Meteorological Factors
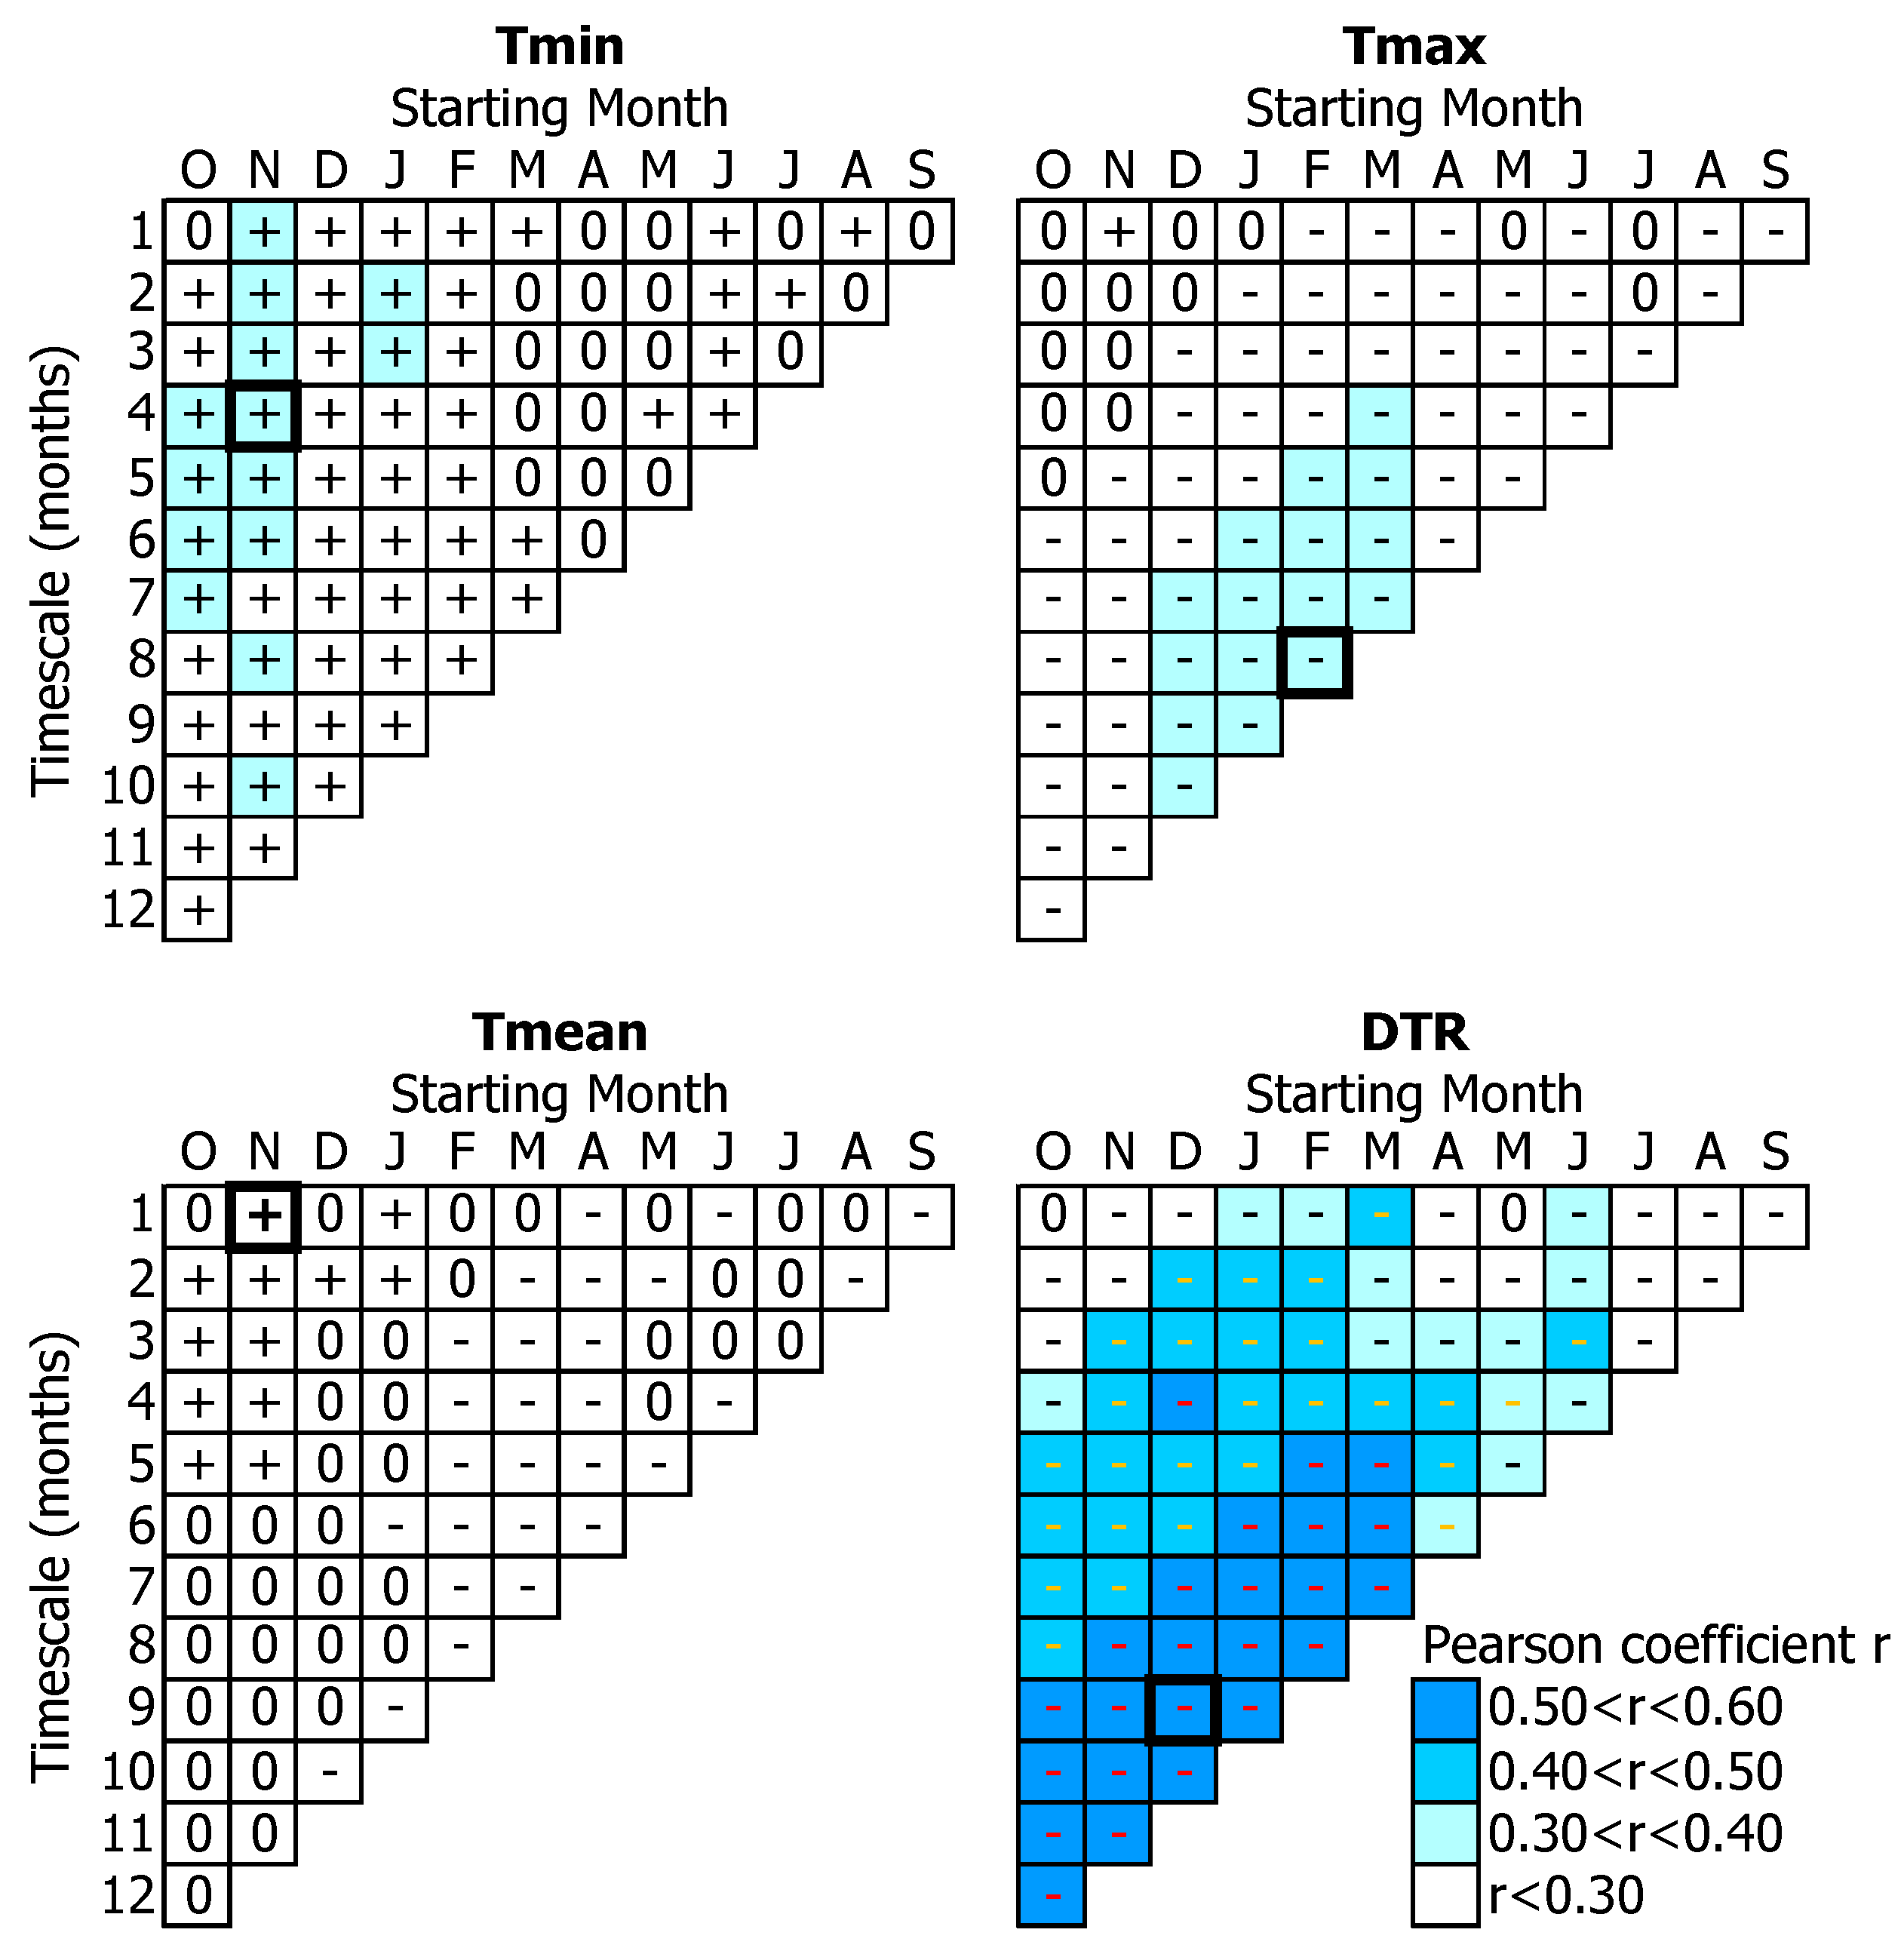
3.1.1. Temperature-Related Parameters
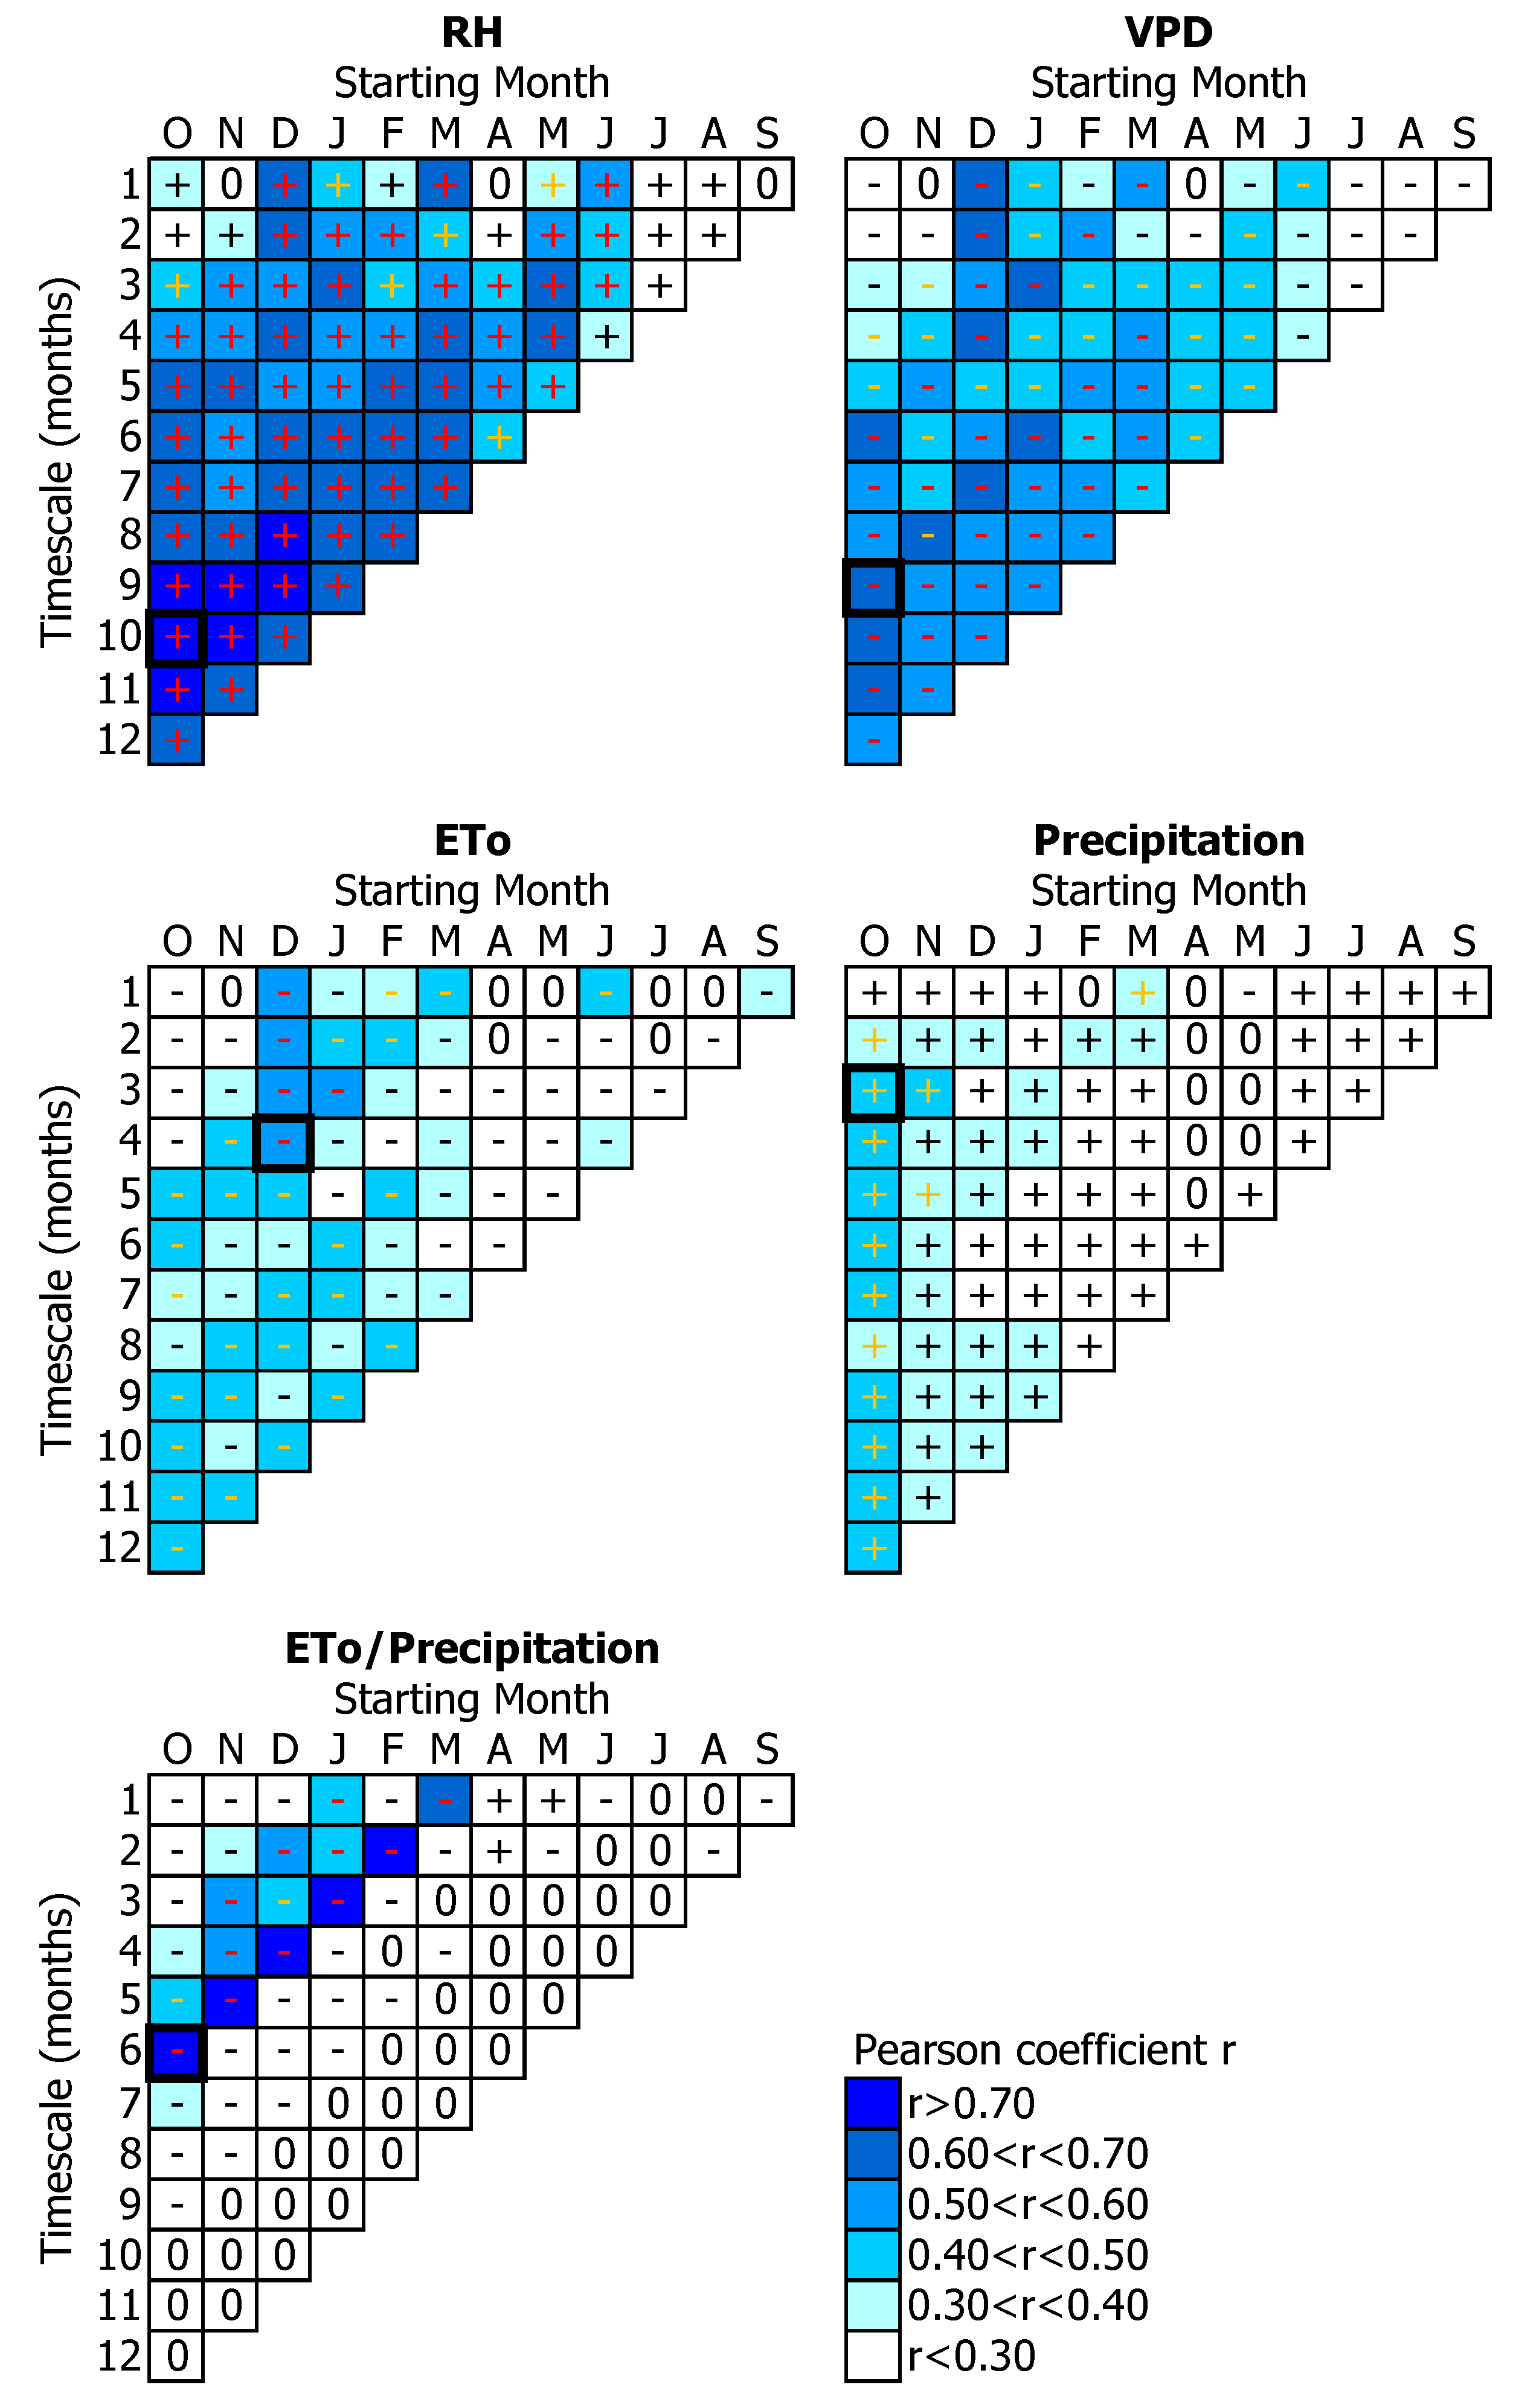
3.1.2. Water-Related Parameters
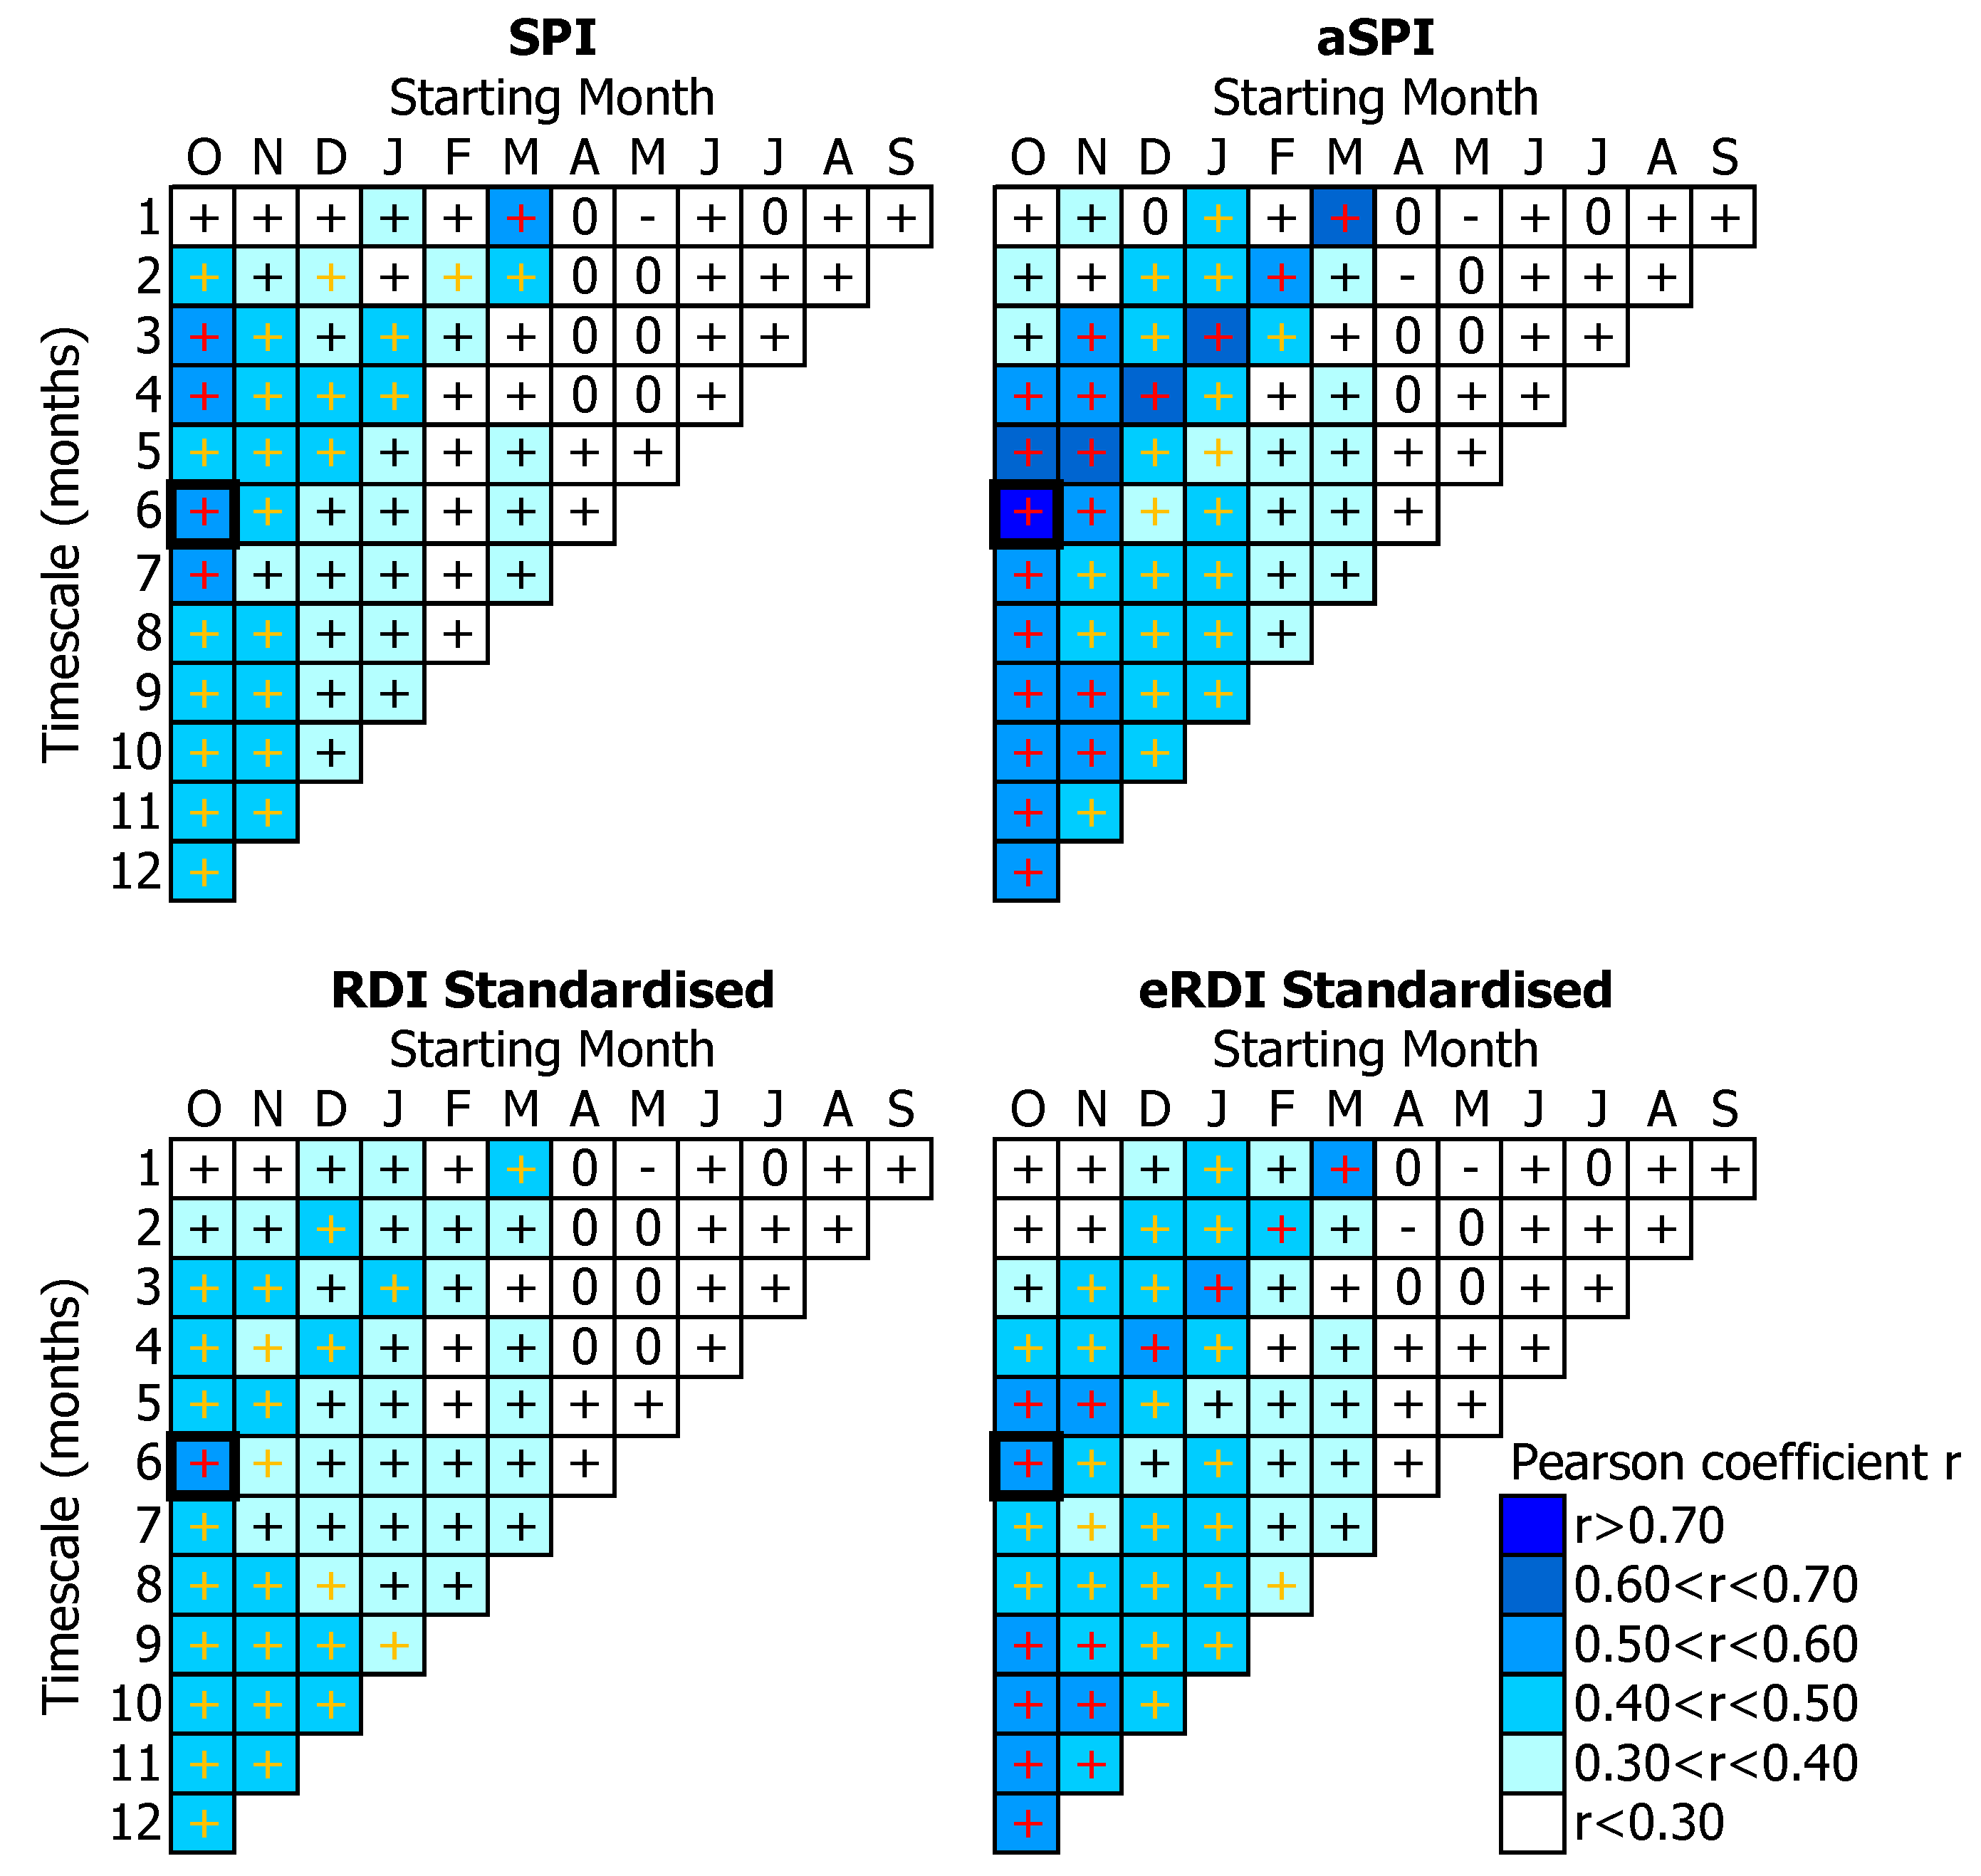
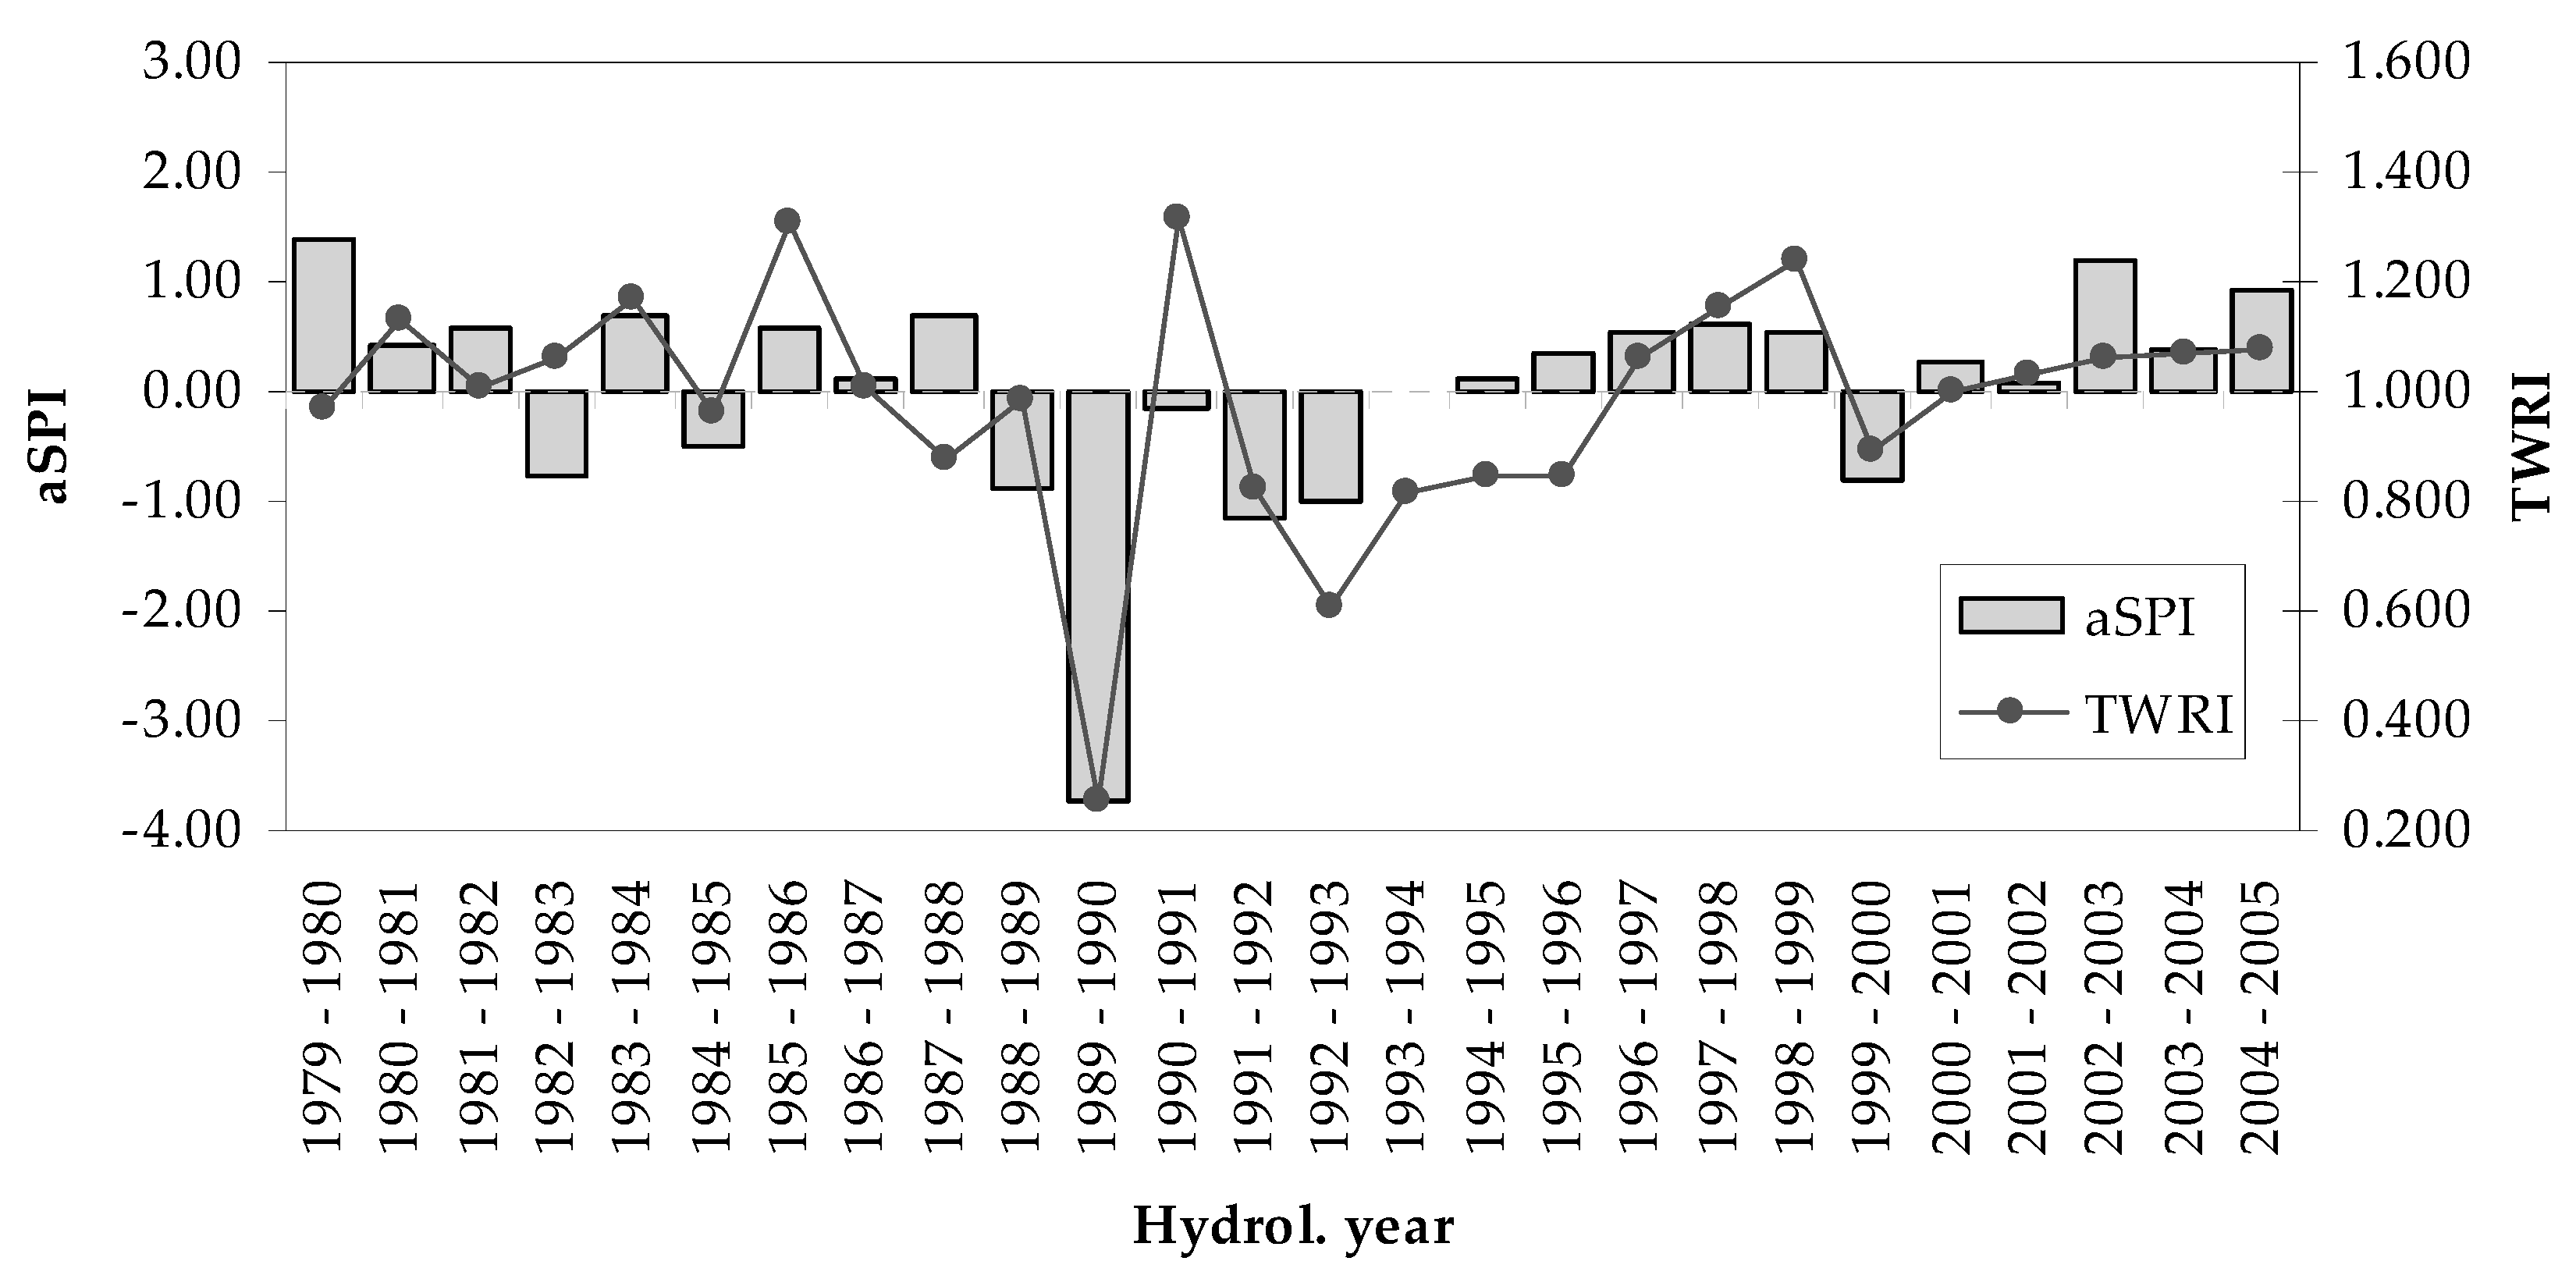
3.2. Tree-Growth Response to Drought
4. Discussion
4.1. Temperature Effects on Tree-Growth
4.2. Water Availability Effects on Tree-Growth
4.3. Drought Effects on Tree-Growth
4.4. Suitability of Drought Indices
5. Conclusions
Author Contributions
Funding
Acknowledgments
Conflicts of Interest
References
- Diffenbaugh, N.S.; Giorgi, F. Climate change hotspots in the CMIP5 global climate model ensemble. Clim. Chang. 2012, 114, 813–822. [Google Scholar] [CrossRef] [PubMed]
- Myers, N.; Mittermeier, R.A.; Mittermeier, C.G.; Da Fonseca, G.A.B.; Kent, J. Biodiversity hotspots for conservation priorities. Nature 2000, 403, 853–858. [Google Scholar] [CrossRef] [PubMed]
- Field, C.B.; Barros, V.; Stocker, T.F.; Dahe, Q. Managing the Risks of Extreme Events and Disasters to Advance Climate Change Adaptation: Special Report of the Intergovernmental Panel on Climate Change; Cambridge University Press: Cambridge, UK, 2012. [Google Scholar]
- Tsiros, I.X.; Nastos, P.; Proutsos, N.D.; Tsaousidis, A. Variability of the aridity index and related drought parameters in Greece using climatological data over the last century (1900–1997). Atmos. Res. 2020, 240, 104914. [Google Scholar] [CrossRef]
- Penuelas, J.; Hunt, J.M.; Ogaya, R.; Jump, A.S. Twentieth century changes of tree-ring δ13C at the southern range-edge of Fagus sylvatica: Increasing water-use efficiency does not avoid the growth decline induced by warming at low altitudes. Glob. Chang. Biol. 2008, 14, 1076–1088. [Google Scholar] [CrossRef]
- Sarris, D.; Christodoulakis, D.; Körner, C. Recent decline in precipitation and tree growth in the eastern Mediterranean. Glob. Chang. Biol. 2007, 13, 1187–1200. [Google Scholar] [CrossRef]
- Proutsos, N.; Liakatas, A.; Alexandris, S.; Tsiros, I. Carbon fluxes above a deciduous forest in Greece. Atmósfera 2017, 30, 311–322. [Google Scholar] [CrossRef]
- Specht, R. Primary Production in Mediterranean-Climate Ecosystems Regenerating after Fire; Ecosystems of the World; Elsevier: Amsterdam, The Netherlands, 1981. [Google Scholar]
- Akkemik, Ü. Dendroclimatology of umbrella pine (Pinus pinea L.) in Istanbul, Turkey. Tree-Ring Bull. 2000, 56, 17–20. [Google Scholar]
- Cherubini, P. Studio dendroecologico su Pinus pinea L. in due differenti stazioni sulla costa mediterranea in Toscana (Italia). Dendrochronologia 1993, 11, 87–99. [Google Scholar]
- Perez-Antelo, A.; Fernandez-Cancio, A. A dendrochronology of Pines pinea in Central Spain. In Proceedings of the Tree Rings and Environment: Proceedings of the International Dendrochronological Symposium, Ystad, Sweden, 3–9 September 1990; pp. 254–255. [Google Scholar]
- European Commission. Interpretation Manual of European Union Habitats–EUR28; European Commission, DG Environment: Brussels, Belgium, 2013; Volume 144. [Google Scholar]
- Zaghi, D. Management of Natura 2000 Habitats. In 9530*(Sub)-Mediterranean Pine Forests with Endemic Black Pines; European Commission: Brussels, Belgium, 2008; Volume 27. [Google Scholar]
- Andreu-Hayles, L.; Merino, E.G.; Macias, M.; Ribas, M.; Bosch, O.; Camarero, J.J. Climate increases regional tree-growth variability in Iberian pine forests. Glob. Chang. Biol. 2007, 13, 804–815. [Google Scholar] [CrossRef]
- Szymczak, S.; Joachimski, M.M.; Bräuning, A.; Hetzer, T.; Kuhlemann, J. Are pooled tree ring δ13C and δ18O series reliable climate archives—A case study of Pinus nigra spp. laricio (Corsica/France). Chem. Geol. 2012, 308, 40–49. [Google Scholar] [CrossRef]
- Marqués, L.; Camarero, J.J.; Gazol, A.; Zavala, M.A. Drought impacts on tree growth of two pine species along an altitudinal gradient and their use as early-warning signals of potential shifts in tree species distributions. For. Ecol. Manag. 2016, 381, 157–167. [Google Scholar] [CrossRef]
- LeBourgeois, F. Climatic signals in earlywood, latewood and total ring width of Corsican pine from western France. Ann. For. Sci. 2000, 57, 155–164. [Google Scholar] [CrossRef]
- Fkiri, S.; Guibal, F.; Fady, B.; El Khorchani, A.; Khaldi, A.; Khouja, M.L.; Nasr, Z. Tree-rings to climate relationships in nineteen provenances of four black pines sub-species (Pinus nigra Arn.) growing in a common garden from Northwest Tunisia. Dendrochronologia 2018, 50, 44–51. [Google Scholar] [CrossRef]
- Eilmann, B.; Rigling, A. Tree-growth analyses to estimate tree species’ drought tolerance. Tree Physiol. 2012, 32, 178–187. [Google Scholar] [CrossRef] [PubMed]
- Granda, E.; Camarero, J.J.; Gimeno, T.E.; Martínez-Fernández, J.; Valladares, F. Intensity and timing of warming and drought differentially affect growth patterns of co-occurring Mediterranean tree species. Eur. J. For. Res. 2013, 132, 469–480. [Google Scholar] [CrossRef]
- Herrero, A.; Zamora, R. Plant Responses to Extreme Climatic Events: A Field Test of Resilience Capacity at the Southern Range Edge. PLoS ONE 2014, 9, e87842. [Google Scholar] [CrossRef] [PubMed]
- Móricz, N.; Garamszegi, B.; Rasztovits, E.; Bidló, A.; Horváth, A.; Jagicza, A.; Illés, G.; Vekerdy, Z.; Somogyi, Z.; Gálos, B. Recent Drought-Induced Vitality Decline of Black Pine (Pinus nigra Arn.) in South-West Hungary—Is This Drought-Resistant Species under Threat by Climate Change? Forests 2018, 9, 414. [Google Scholar] [CrossRef]
- Levanič, T.; Popa, I.; Poljanšek, S.; Nechita, C. A 323-year long reconstruction of drought for SW Romania based on black pine (Pinus nigra) tree-ring widths. Int. J. Biometeorol. 2013, 57, 703–714. [Google Scholar] [CrossRef]
- Martin-Benito, D.; Beeckman, H.; Cañellas, I. Influence of drought on tree rings and tracheid features of Pinus nigra and Pinus sylvestris in a mesic Mediterranean forest. Eur. J. For. Res. 2013, 132, 33–45. [Google Scholar] [CrossRef]
- Sangüesa-Barreda, G.; Camarero, J.J.; Sánchez-Salguero, R.; Gutiérrez, E.; Linares, J.C.; Génova, M.; Ribas, M.; Tíscar, P.A.; López-Sáez, J.A. Droughts and climate warming desynchronize Black pine growth across the Mediterranean Basin. Sci. Total Environ. 2019, 697, 133989. [Google Scholar] [CrossRef]
- Shishkova, V.; Panayotov, M. Climate-growth relationship of Pinus nigra tree-ring width chronology from the Rhodope Mountains, Bulgaria. Bulg. J. Agric. Sci. 2013, 19, 225–228. [Google Scholar]
- Szymczak, S.; Joachimski, M.M.; Bräuning, A.; Hetzer, T.; Kuhlemann, J. Comparison of whole wood and cellulose carbon and oxygen isotope series from Pinus nigra ssp. laricio (Corsica/France). Dendrochronologia 2011, 29, 219–226. [Google Scholar] [CrossRef]
- Holmes, R.L. Computer-assisted quality control in tree-ring dating and measurement. Tree-Ring Bull. 1983, 43, 69–78. [Google Scholar]
- Cook, E.; Holmes, R. Users Manual for Program ARSTAN; Laboratory of Tree–Ring Research; University of Arizona: Tucson, AZ, USA, 1986. [Google Scholar]
- Tigkas, D.; Vangelis, H.; Tsakiris, G. DrinC: A software for drought analysis based on drought indices. Earth Sci. Inform. 2015, 8, 697–709. [Google Scholar] [CrossRef]
- FAO. ETo calculator. In Land and Water Digital Media Series No 36; FAO: Rome, Italy, 2009; Available online: http://www.fao.org/land-water/databases-and-software/eto-calculator (accessed on 6 April 2020).
- IBM Corp. IBM SPSS Statistics for Windows; Version 23.0; IBM Corp.: Armonk, NY, USA, 2015; Available online: https://www.ibm.com/analytics/spss-statistics-software (accessed on 6 April 2020).
- NATURA 2000—Standard Data Forms, Site GR2520006. Available online: http://natura2000.eea.europa.eu/Natura2000/SDF.aspx?site=GR2520006 (accessed on 2 April 2020).
- Cherlet, M.; Hutchinson, C.; Reynolds, J.; Hill, J.; Sommer, S.; Von Maltitz, G. World Atlas of Desertification: Rethinking Land Degradation and Sustainable Land Management; Publications Office of the European Union: Brussels, Belgium, 2018. [Google Scholar]
- LIFE+ Project PINUS: Restoration of Pinus Nigra Forests on Mount Parnonas (GR2520006) through a Structured Approach. Available online: http://www.parnonaslife.gr/en (accessed on 2 April 2020).
- Kuang, Y.-W.; Sun, F.F.; Wen, D.; Zhou, G.; Zhao, P. Tree-ring growth patterns of Masson pine (Pinus massoniana L.) during the recent decades in the acidification Pearl River Delta of China. For. Ecol. Manag. 2008, 255, 3534–3540. [Google Scholar] [CrossRef]
- Fritts, H. Tree Rings and Climate; Elsevier: Amsterdam, The Netherlands, 1976. [Google Scholar]
- Cook, E.R.; Kairiukstis, L.A. Methods of Dendrochronology: Applications in the Environmental Sciences; Springer: Berlin, Germany, 1990. [Google Scholar] [CrossRef]
- Fuka, D.R.; Walter, M.T.; MacAlister, C.; DeGaetano, A.T.; Steenhuis, T.S.; Easton, Z.M. Using the Climate Forecast System Reanalysis as weather input data for watershed models. Hydrol. Process. 2014, 28, 5613–5623. [Google Scholar] [CrossRef]
- Tigkas, D.; Vangelis, H.; Tsakiris, G. Introducing a Modified Reconnaissance Drought Index (RDIe) Incorporating Effective Precipitation. Procedia Eng. 2016, 162, 332–339. [Google Scholar] [CrossRef]
- Vangelis, H.; Tigkas, D.; Tsakiris, G. The effect of PET method on Reconnaissance Drought Index (RDI) calculation. J. Arid Environ. 2013, 88, 130–140. [Google Scholar] [CrossRef]
- Zarei, A.R.; Mahmoudi, M.R. Evaluation of changes in RDIst index effected by different Potential Evapotranspiration calculation methods. Water Resour. Manag. 2017, 31, 4981–4999. [Google Scholar] [CrossRef]
- Allen, R.G.; Pereira, L.S.; Raes, D.; Smith, M. Crop Evapotranspiration-Guidelines for Computing Crop Water Requirements, FAO Irrigation and Drainage Paper 56; FAO: Rome, Italy, 1998. [Google Scholar]
- Tetens, O. Uber einige meteorologische Begriffe. Z. Geophys. 1930, 6, 297–309. [Google Scholar]
- Mishra, A.; Singh, V.P. Drought modeling—A review. J. Hydrol. 2011, 403, 157–175. [Google Scholar] [CrossRef]
- Tsakiris, G.; Loukas, A.; Pangalou, D.; Vangelis, H.; Tigkas, D.; Rossi, G.; Cancelliere, A. Drought characterization. In Drought Management Guidelines Technical Annex; Iglesias, A., Moneo, M., López-Francos, A., Eds.; CIHEAM/EC MEDA Water: Zaragoza, Spain, 2007; pp. 85–102. [Google Scholar]
- Al-Faraj, F.A.M.; Scholz, M.; Tigkas, D.; Boni, M. Drought indices supporting drought management in transboundary watersheds subject to climate alterations. Water Policy 2015, 17, 865–886. [Google Scholar] [CrossRef]
- Lee, S.; Yoo, S.-H.; Choi, J.-Y.; Bae, S. Assessment of the Impact of Climate Change on Drought Characteristics in the Hwanghae Plain, North Korea Using Time Series SPI and SPEI: 1981–2100. Water 2017, 9, 579. [Google Scholar] [CrossRef]
- Li, R.; Tsunekawa, A.; Tsubo, M. Assessment of agricultural drought in rainfed cereal production areas of northern China. Theor. Appl. Clim. 2017, 127, 597–609. [Google Scholar] [CrossRef]
- Shokoohi, A.; Morovati, R. Basinwide Comparison of RDI and SPI Within an IWRM Framework. Water Resour. Manag. 2015, 29, 2011–2026. [Google Scholar] [CrossRef]
- Tigkas, D.; Vangelis, H.; Tsakiris, G. The RDI as a composite climatic index. Eur. Water 2013, 41, 17–22. [Google Scholar]
- Zarch, M.A.A.; Sivakumar, B.; Sharma, A. Droughts in a warming climate: A global assessment of Standardized precipitation index (SPI) and Reconnaissance drought index (RDI). J. Hydrol. 2015, 526, 183–195. [Google Scholar] [CrossRef]
- Karavitis, C.; Tsesmelis, D.; Skondras, N.A.; Stamatakos, D.; Alexandris, S.; Fassouli, V.; Vasilakou, C.G.; Oikonomou, P.D.; Gregorič, G.; Grigg, N.S.; et al. Linking drought characteristics to impacts on a spatial and temporal scale. Water Policy 2014, 16, 1172–1197. [Google Scholar] [CrossRef]
- McKee, T.B.; Doesken, N.J.; Kleist, J. The relationship of drought frequency and duration to time scales. In Proceedings of the 8th Conference on Applied Climatology, Anaheim, CA, USA, 17–22 January 1993. [Google Scholar]
- Edwards, D.; McKee, T. Characteristics of 20th Century Droughts in the United States at Multiple Time Scales; Climatology Report, 97–2; Department of Atmospheric Sciences, Colorado State University: Fort Collins, CO, USA, 1997. [Google Scholar]
- Tsakiris, G.; Pangalou, D.; Vangelis, H. Regional Drought Assessment Based on the Reconnaissance Drought Index (RDI). Water Resour. Manag. 2007, 21, 821–833. [Google Scholar] [CrossRef]
- Tigkas, D. Drought characterisation and monitoring in regions of Greece. Eur. Water 2008, 23, 29–39. [Google Scholar]
- Al-Faraj, F.A.M.; Tigkas, D. Impacts of Multi-year Droughts and Upstream Human-Induced Activities on the Development of a Semi-arid Transboundary Basin. Water Resour. Manag. 2016, 30, 5131–5143. [Google Scholar] [CrossRef]
- Bautista-Capetillo, C.; Carrillo, B.; Picazo, G.; Júnez-Ferreira, H. Drought Assessment in Zacatecas, Mexico. Water 2016, 8, 416. [Google Scholar] [CrossRef]
- Liberato, M.L.R.; Ramos, A.M.; Gouveia, C.M.; Sousa, P.M.; Russo, A.; Trigo, R.M.; Santo, F.E. Exceptionally extreme drought in Madeira Archipelago in 2012: Vegetation impacts and driving conditions. Agric. For. Meteorol. 2017, 232, 195–209. [Google Scholar] [CrossRef]
- Sabau, N.C.; Man, T.E.; Armas, A.; Balaj, C.; Giru, M. Characterization of agricultural droughts using standardized precipitation index (SPI) and bhalme-mooley drought index (BDMI). Environ. Eng. Manag. J. 2015, 14, 1441–1454. [Google Scholar] [CrossRef]
- Tigkas, D.; Tsakiris, G. Early Estimation of Drought Impacts on Rainfed Wheat Yield in Mediterranean Climate. Environ. Process. 2015, 2, 97–114. [Google Scholar] [CrossRef]
- Zarei, A.R.; Moghimi, M.M.; Bahrami, M. Comparison of reconnaissance drought index (RDI) and effective reconnaissance drought index (eRDI) to evaluate drought severity. Sustain. Water Resour. Manag. 2019, 5, 1345–1356. [Google Scholar] [CrossRef]
- Tigkas, D.; Vangelis, H.; Tsakiris, G. Drought characterisation based on an agriculture-oriented standardised precipitation index. Theor. Appl. Clim. 2019, 135, 1435–1447. [Google Scholar] [CrossRef]
- Tigkas, D.; Vangelis, H.; Tsakiris, G. An Enhanced Effective Reconnaissance Drought Index for the Characterisation of Agricultural Drought. Environ. Process. 2017, 4, 137–148. [Google Scholar] [CrossRef]
- Stamm, G.G. Problems and Procedures in Determining Water Supply Requirements for Irrigation Projects. In Irrigation of Agricultural Lands; Hagan, R.M., Haise, H.R., Edminster, T.W., Eds.; American Society of Agronomy: Madison, WI, USA, 1967; pp. 769–785. [Google Scholar]
- D’Arrigo, R.D.; Kaufmann, R.K.; Davi, N.; Jacoby, G.C.; Laskowski, C.; Myneni, R.; Cherubini, P. Thresholds for warming-induced growth decline at elevational tree line in the Yukon Territory, Canada. Glob. Biogeochem. Cycles 2004, 18, GB3021. [Google Scholar] [CrossRef]
- Pisaric, M.; Carey, S.K.; Kokelj, S.V.; Youngblut, D. Anomalous 20th century tree growth, Mackenzie Delta, Northwest Territories, Canada. Geophys. Res. Lett. 2007, 34, L05714. [Google Scholar] [CrossRef]
- Wilmking, M.; Juday, G.P.; Barber, V.A.; Zald, H.S.J. Recent climate warming forces contrasting growth responses of white spruce at treeline in Alaska through temperature thresholds. Glob. Chang. Biol. 2004, 10, 1724–1736. [Google Scholar] [CrossRef]
- Macias, M.; Andreu, L.; Bosch, O.; Camarero, J.J.; Gutiérrez, E. Increasing Aridity is Enhancing Silver Fir Abies Alba Mill.) Water Stress in its South-Western Distribution Limit. Clim. Chang. 2006, 79, 289–313. [Google Scholar] [CrossRef]
- Barber, V.A.; Juday, G.P.; Finney, B.P. Reduced growth of Alaskan white spruce in the twentieth century from temperature-induced drought stress. Nature 2000, 405, 668–673. [Google Scholar] [CrossRef] [PubMed]
- Klesse, S.; Ziehmer, M.M.; Rousakis, G.; Trouet, V.; Frank, D. Synoptic drivers of 400 years of summer temperature and precipitation variability on Mt. Olympus, Greece. Clim. Dyn. 2015, 45, 807–824. [Google Scholar] [CrossRef]
- Martin-Benito, D.; Kint, V.; Del Río, M.; Muys, B.; Cañellas, I. Growth responses of West-Mediterranean Pinus nigra to climate change are modulated by competition and productivity: Past trends and future perspectives. For. Ecol. Manag. 2011, 262, 1030–1040. [Google Scholar] [CrossRef]
- Martin-Benito, D.; Del Río, M.; Cañellas, I. Black pine (Pinus nigra Arn.) growth divergence along a latitudinal gradient in Western Mediterranean mountains. Ann. For. Sci. 2010, 67, 401. [Google Scholar] [CrossRef]
- Martin-Benito, D.; Cherubini, P.; Del Río, M.; Cañellas, I. Growth response to climate and drought in Pinus nigra Arn. trees of different crown classes. Trees 2008, 22, 363–373. [Google Scholar] [CrossRef]
- Penuelas, J.; Gordon, C.; Llorens, L.; Nielsen, T.; Tietema, A.; Beier, C.; Bruna, P.; Emmett, B.; Estiarte, M.; Gorissen, A. Nonintrusive Field Experiments Show Different Plant Responses to Warming and Drought Among Sites, Seasons, and Species in a North-South European Gradient. Ecosystems 2004, 7, 598–612. [Google Scholar] [CrossRef]
- Büntgen, U.; Martínez-Peña, F.; Aldea, J.; Rigling, A.; Fischer, E.M.; Camarero, J.J.; Hayes, M.J.; Fatton, V.; Egli, S. Declining pine growth in Central Spain coincides with increasing diurnal temperature range since the 1970s. Glob. Planet. Chang. 2013, 107, 177–185. [Google Scholar] [CrossRef]
- Gimeno, T.E.; Camarero, J.J.; Granda, E.; Pías, B.; Valladares, F. Enhanced growth of Juniperus thurifera under a warmer climate is explained by a positive carbon gain under cold and drought. Tree Physiol. 2012, 32, 326–336. [Google Scholar] [CrossRef]
- Gu, L.; Baldocchi, D.D.; Wofsy, S.C.; Munger, J.W.; Michalsky, J.J.; Urbanski, S.P.; Boden, T.A. Response of a Deciduous Forest to the Mount Pinatubo Eruption: Enhanced Photosynthesis. Science 2003, 299, 2035–2038. [Google Scholar] [CrossRef] [PubMed]
- Proutsos, N.; Liakatas, A.; Alexandris, S. Ratio of photosynthetically active to total incoming radiation above a Mediterranean deciduous oak forest. Theor. Appl. Clim. 2019, 137, 2927–2939. [Google Scholar] [CrossRef]
- Easterling, D.R.; Kang, S.M.; Hofmann, A.; Le, D.; Springer, M.L.; Stock, P.; Blau, H.M. Maximum and Minimum Temperature Trends for the Globe. Science 1997, 277, 364–367. [Google Scholar] [CrossRef]
- Leal, S.; Eamus, D.; Grabner, M.; Wimmer, R.; Cherubini, P. Tree rings of Pinus nigra from the Vienna basin region (Austria) show evidence of change in climatic sensitivity in the late 20th century. Can. J. For. Res. 2008, 38, 744–759. [Google Scholar] [CrossRef]
- Akkemik, Ü.; Aras, A. Reconstruction (1689–1994 AD) of April–August precipitation in the southern part of central Turkey. Int. J. Climatol. J. R. Meteorol. Soc. 2005, 25, 537–548. [Google Scholar] [CrossRef]
- Poljanšek, S.; Ceglar, A.; Levanič, T. Long term January–March and May–August temperature reconstructions from tree-ring records from Bosnia and Herzegovina. Clim. Past Discuss. 2012, 8, 4401–4442. [Google Scholar] [CrossRef]
- Levanič, T.; Toromani, E. Austrian pine (Pinus nigra Arnold.) tree-ring width chronology from northeast Albania–preliminary results. In Proceedings of the Conference: TRACE–Tree rings in Archaeology, Climatology and Ecology, Otočec, Slovenija, 22–25 April 2010; pp. 104–109. [Google Scholar]
- Panayotov, M.P.; Zafirov, N.; Cherubini, P. Fingerprints of extreme climate events in Pinus sylvestris tree rings from Bulgaria. Trees 2013, 27, 211–227. [Google Scholar] [CrossRef]
- Guada, G.; Camarero, J.J.; Sánchez-Salguero, R.; Cerrillo, R.M.N. Limited Growth Recovery after Drought-Induced Forest Dieback in Very Defoliated Trees of Two Pine Species. Front. Plant Sci. 2016, 7, 859. [Google Scholar] [CrossRef]
- Herguido, E.; Granda, E.; Benavides, R.; García-Cervigón, A.I.; Camarero, J.J.; Valladares, F.; Sevillano, E.H. Contrasting growth and mortality responses to climate warming of two pine species in a continental Mediterranean ecosystem. For. Ecol. Manag. 2016, 363, 149–158. [Google Scholar] [CrossRef]
- Janssen, E.; Kint, V.; Bontemps, J.-D.; Ozkan, K.; Mert, A.; Köse, N.; Içel, B.; Muys, B. Recent growth trends of black pine (Pinus nigra J.F. Arnold) in the eastern mediterranean. For. Ecol. Manag. 2018, 412, 21–28. [Google Scholar] [CrossRef]
- Martin-Benito, D.; Del Río, M.; Heinrich, I.; Helle, G.; Cañellas, I. Response of climate-growth relationships and water use efficiency to thinning in a Pinus nigra afforestation. For. Ecol. Manag. 2010, 259, 967–975. [Google Scholar] [CrossRef]
- Sánchez-Salguero, R.; Navarro-Cerrillo, R.M.; Camarero, J.J.; Fernández-Cancio, Á. Selective drought-induced decline of pine species in southeastern Spain. Clim. Chang. 2012, 113, 767–785. [Google Scholar] [CrossRef]
- LeBourgeois, F.; Mérian, P.; Courdier, F.; Ladier, J.; Dreyfus, P. Instability of climate signal in tree-ring width in Mediterranean mountains: A multi-species analysis. Trees 2012, 26, 715–729. [Google Scholar] [CrossRef]
- Doğan, M.; Köse, N. Influence of Climate on Radial Growth of Black Pine on the Mountain Regions of Southwestern Turkey. Plants 2019, 8, 276. [Google Scholar] [CrossRef] [PubMed]
- Huxman, T.E.; Smith, M.D.; Fay, P.A.; Knapp, A.K.; Shaw, M.R.; Loik, M.E.; Smith, S.D.; Tissue, D.T.; Zak, J.C.; Weltzin, J.F.; et al. Convergence across biomes to a common rain-use efficiency. Nature 2004, 429, 651–654. [Google Scholar] [CrossRef] [PubMed]


| Drought Index Value | Category |
|---|---|
| ≥2.00 | Extremely wet |
| 1.50 to 1.99 | Severely wet |
| 1.00 to 1.49 | Moderately wet |
| 0 to 0.99 | Near normal (mildly wet) |
| 0 to −0.99 | Near normal (mild drought) |
| −1.00 to −1.49 | Moderate drought |
| −1.50 to −1.99 | Severe drought |
| ≤−2 | Extreme drought |
| Monthly Precipitation Class (mm) | Effective Precipitation (% of Precipitation) |
|---|---|
| 0.0–25.4 | 90–100 |
| 25.4–50.8 | 85–95 |
| 50.8–76.2 | 75–90 |
| 76.2–101.6 | 50–80 |
| 101.6–127.0 | 30–60 |
| 127.0–152.4 | 10–40 |
| >152.4 | 0–10 |
© 2020 by the authors. Licensee MDPI, Basel, Switzerland. This article is an open access article distributed under the terms and conditions of the Creative Commons Attribution (CC BY) license (http://creativecommons.org/licenses/by/4.0/).
Share and Cite
Proutsos, N.; Tigkas, D. Growth Response of Endemic Black Pine Trees to Meteorological Variations and Drought Episodes in a Mediterranean Region. Atmosphere 2020, 11, 554. https://doi.org/10.3390/atmos11060554
Proutsos N, Tigkas D. Growth Response of Endemic Black Pine Trees to Meteorological Variations and Drought Episodes in a Mediterranean Region. Atmosphere. 2020; 11(6):554. https://doi.org/10.3390/atmos11060554
Chicago/Turabian StyleProutsos, Nikolaos, and Dimitris Tigkas. 2020. "Growth Response of Endemic Black Pine Trees to Meteorological Variations and Drought Episodes in a Mediterranean Region" Atmosphere 11, no. 6: 554. https://doi.org/10.3390/atmos11060554
APA StyleProutsos, N., & Tigkas, D. (2020). Growth Response of Endemic Black Pine Trees to Meteorological Variations and Drought Episodes in a Mediterranean Region. Atmosphere, 11(6), 554. https://doi.org/10.3390/atmos11060554