1. Introduction
Bioaerosols are airborne particles of biological origin, e.g., particles such as pollen, fungi, bacteria, protozoa and viruses, as well as their products and byproducts. The vast majority of them are sufficiently small to enter and deposit within the human respiratory system. Therefore, it is vital to detect, identify and quantify bioaerosols, especially when considering their adverse effects on human health [
1,
2,
3,
4]. Besides, numerous studies have shown that bioaerosols play an important role in atmospheric processes [
5,
6,
7], which provides an additional impetus for their sampling and identification of species or quantity.
Because bioaerosols are very diverse in terms of size, species and biological properties, so are the requirements for their detection. Numerous bioaerosol sampling methods [
1] are available, including filtration, impaction, impingement and electrostatic precipitation [
2,
3]. Microscopy, flow cytometry, quantitative polymerase chain reaction, adenosine triphosphate (ATP)-based bioluminescence, culture-based techniques and other methods [
4,
5] can then be used to analyze the collected biological particles. The physical and biological collection performance of various bioaerosol sampling devices depends on multiple variables, including sampling time and flow rate, bioaerosol type and the sample analysis method [
4,
5,
6,
7]. However, despite advances in sampling and detection technologies, bioaerosols are still difficult to quantify [
8,
9,
10]. Their analysis is frequently affected by two problems: the collected air volume is too low to be representative of the investigated environment and/or the concentration of the collected biological particles is too low for the intended bioassays [
11,
12]. These issues may be at least partially addressed by sampling larger volumes of air—by increasing the sampling time or by increasing the sampling flowrate [
10,
13]. However, depending on the environment, the available sampling devices or the sampling time limitations, such solutions may not yield the necessary sample concentrations, especially if large volumes of collection liquid are used [
2]. Among the most popular collection media in bioaerosol sampling is the liquid-based one because such a method allows capturing a wide range of particle concentrations without overloading the media and it is compatible with multiple sample analysis techniques, such as those mentioned above [
14,
15]. However, when the sample concentration is too low, the sample has to be concentrated to enable detection and provide reliable quantification results.
The concentration of liquid-based samples has been typically performed using centrifugation and filtration methods. However, as discussed below, both techniques have certain drawbacks. Filtration is among the most widely used bioaerosol sampling methods, and it has been adapted for concentrating collected samples. First, the liquid collection medium is passed through a filter. Then, in the second step, the captured particles are eluted from the filter into a small amount of water or other liquids [
16]. The resulting filter with the biological particles can also be analyzed directly by microscopy or directly placed onto agar for incubation [
8,
17,
18]. The latter approach improves the detection limit of the captured biological particles. However, the filtration of high liquid volumes or samples with a high quantity of material can resist the liquid flow [
4]. Hence, more powerful vacuum pumps or a periodical replacement of the filter is required [
5]. Moreover, the elution process has other drawbacks such as a particle loss and an extended sample preparation time [
17]; thus, specific protocols have to be developed to improve elution efficiency [
17].
The other typical concentration method is by centrifugation. Here, particles in the collection liquid are centrifuged into a pellet, the supernatant is removed and the pellet is resuspended in a smaller volume of liquid resulting in a more concentrated sample. However, it has been observed that centrifugation has a limited ability to concentrate some microorganisms and the process affects the physical and biological recovery of mold spores and other particles from the samples [
11,
12,
13,
19,
20]. Mbareche, Brisebois, Veillette and Duchaine (2017) indicated that centrifugation was not appropriate for mold spores and material recovery [
6]. Fungi are especially difficult to concentrate due to their hydrophobic properties [
6].
Given the need to improve sample concentration processes in bioaerosol research, here we investigated the performance of two liquid sample-concentrating techniques, namely, accelerated evaporation (Smart Evaporator C1, BioChromato, Inc., San Diego, CA) and concentration using automated filtration and elution (two models of Concentrating Pipettes, InnnovaPrep LLC., Drexel, MO). While these techniques have merit for their application in bioaerosol research, they have not been widely used in the bioaerosol field. Therefore, this study had the following objectives: (1) to compare the final volume and time needed to concentrate samples using the Evaporator; (2) to quantify particle losses determined by microscopy and culture-based analysis when using the two concentrating techniques in laboratory and outdoor field tests; and (3) determine the concentration factor (CF) of the devices based on the initial and final concentrations of the liquid-based particles.
2. Materials and Methods
2.1. Concentrators
We used two different types of concentrating devices (
Figure 1) to concentrate the liquid-based (bio)aerosol samples: a BioChromato Smart Evaporator (BioChromato, Inc., San Diego, CA, USA) and two Concentrating Pipette (CP) models (CP-150 and CP-Select) (InnovaPrep, LLC., Drexel, MO, USA). The BioChromato Evaporator uses a vacuum-assisted vortex concentration method, where a spiral plug is used to close a container in which particles suspended in a solvent are to be concentrated. The plug is then connected to a vacuum pump that provides the airflow. The spiral plug generates a helical flow of air or inert gas over the surface of the solvent (e.g., water), thereby increasing the surface area, which increases the evaporation speed. The spiral plug comes in various sizes for compatibility with containers of different sizes. The device also has a heating block, which allows increasing the temperature of the container and the solvent, thereby accelerating the evaporation process. The combination of flowing air, increased surface area and temperature results in the accelerated evaporation of the solvent, thus facilitating the concentration process.
The CP-150 is an earlier version of the concentrating pipette instrument, and the CP-Select is the current version that was introduced in 2019. Both CP models (i.e., CP-150 and CP-Select) use filtration to transfer particles from liquid onto the surface of a flat membrane filter. A wet foam elution process is then employed to detach the particles from the membrane filter’s surface and wash them off into a small liquid volume. In this study, the term elution refers to the removal of particles from the flat filter and their deposition into the final amount of liquid.
The CP-150 had three settings for the final elution volume: L (Large), M (Medium) and S (Small). The new CP-Select model allows to select the quantity and duration of the elution pulses, and these parameters dictate the final volume. To simplify the comparison between the two models, we determined the quantity and duration of the elution pulses of CP-Select that resulted in M and S volumes that were pre-set in the CP-150.
2.2. Test particles and Their Preparation
Tests with the Evaporator and the two CP models (CP-150 and CP-Select) were conducted using green fluorescent polystyrene latex (PSL) particles (Duke Scientific Corp., Palo Alto, CA, USA) of 1.0, 2.0 and 2.9 μm in diameter, pure-cultured bacteria and outdoor bioaerosol samples. The sizes of the PSL particles were selected to represent the typical sizes of bacterial cells and fungal spores [
7,
8].
Since estimating the particle numbers in the initial and final suspensions using microscopy as described below is a labor-intensive procedure, and the concentrators were available for a limited time, not all the particles were concentrated with all the devices. Specifically, the BioChromato Evaporator and the CP-150 were investigated first and we used 1.0 and 2.9 µm PSL. The CP-Select was investigated at a later time and here we worked with 2.0 µm PSL; 2.0 µm represented the mean size of the size range investigated earlier (
Table 1). The concentration experiment using 1.0 PSL and the CP-150 was exploratory in nature and it was performed at the L setting of the final solution volume and with only one consecutive elution. The rest of the experiments with the CP-150 were carried out with 2.9 µm PSL and at the M and S settings of the final solution volume (
Table S1).
For the laboratory tests with PSL particles, the stock solutions of the PSL particles were diluted with Milli-Q water to achieve initial PSL particle suspensions with 1% of solids.
The test microorganisms used in this study,
Bacillus subtilis,
Pseudomonas stutzeri, and
Pseudomonas fluorescens, were representatives of sensitive and hardy organisms and are commonly found in indoor and outdoor environments [
9,
10,
21,
22].
For the laboratory tests, the bacterial cells were gently scraped from bacterial growth on agar surfaces using an inoculation loop, inoculated in a nutrient broth (CM0001, Oxoid LTD., Basingstoke, Hampshire, England) and then incubated for 18 h at 30 °C for B. subtilis and at 26 °C for P. stutzeri and P. fluorescens. After the incubation, all the cells were harvested by centrifuging the broth for five minutes at 7000 rpm (BR-4 centrifuge, Jouan, DEC Inc., Lorton, VA, USA). Then, the cells were washed by resuspending the pellets in sterile Milli-Q water (Milli-Q Direct 8, EMD Millipore Corp., Billerica, MA, USA). The washing was repeated three times. The final washed cells were resuspended in 40 mL of sterile Milli-Q water. The initial concentrations of bacteria ranged from 1.29 × 10⁵ #/mL to 1.58 × 10⁷ #/mL.
During the outdoor tests, the bioaerosol samples were collected using a BioSampler (SKC Inc., Eighty-four, PA, USA) with 20 mL of Milli-Q water for 2 h. In order to compensate for liquid evaporation, the sampling cup was refilled with Milli-Q water every 15 min and the final sample volume was set to 20 mL. The collected field samples were concentrated using CP-150 only.
2.3. Test Parameters and Procedure
In the concentration process using the BioChromato evaporator, 20-mL liquid samples with PSL particles of 1.0 and 2.9 μm in diameter and B. subtilis bacteria were concentrated by adjusting the following operating conditions of the concentrator: the heater temperature (°C) and the airflow rate (L/min). As part of the testing process, we also measured the time needed to reach the final sample volume.
For the CP-models, the PSL particles of 2.0 and 2.9 μm in diameter and the bacterial cells of B. subtilis, P. stutzeri and P. fluorescens were suspended in initial volumes of 40 mL or 50 mL. Then, they were concentrated using the CP-150 or CP-Select with an 0.4 µm pore-sized concentrating pipette (Polycarbonate Track Etch flat membrane filter, InnovaPrep, Inc., Drexel, MO, USA). The following parameters of the CP models were investigated: setting for the final liquid volume—S (Small), M (Medium), and L (Large)—and the number of repeated elutions. The elution process used a surfactant (Tween 20 at 0.075%) to remove the particles captured on the flat filter. During the repeated elutions, we attempted to remove any particles that remained on the filter and deposit them into the final solution. Of course, by repeating the elution process, the final solution volume increased but the repeat minimized any potential losses, i.e., the particles remaining on the filter. For the newer CP-Select model, we also adjusted the length of time during which the valve for elution fluid remained open as well as the number of elution pulses (i.e., the number of cycles that the elution valve will open and close during an elution cycle).
The instrument allowed us to precisely control the valve open time from 25 ms to 999 ms to adjust the final volume. Multiple elution pulses were usually used for the final volumes > 200 µL.
For bacteria and fungi, a master suspension with a desired particle concentration was prepared. To determine the particle concentrations in the initial suspension, 0.1 mL aliquot was removed from the master solution of each particle type and then reconstituted to 1 mL by adding Milli-Q water. From this, six 0.1 mL aliquots were used: three for the microscopy analysis and three for the culture-based analysis. For the culturable counting, spread plates were made by evenly spreading 0.1 mL aliquots of the bacterial cell suspension onto the plates in triplicate: tryptic soy agar (TSA, MilliporeSigma, St. Louis, MO, USA) for the bacterial cells and malt extract agar (MEA, MilliporeSigma, St. Louis, MO, USA) for the fungal spores. The agar plates were incubated at room temperature, and the colonies were counted after 3 and 5 days for the TSA and MEA media, respectively.
The total number of bacterial cells was determined by acridine orange epifluorescence microscopy using the Axioskop 20 (Carl Zeiss MicroImaging Inc., Thornwood, NY, USA) according to a previously published method [
18]. The fungal spores were counted using direct light microscopy (Axioskop 20, Carl Zeiss MicroImaging Inc., Thornwood, NY, USA); here, a glass coverslip was affixed to the hemocytometer chamber (Hausser Scientific Company, Horsham, PA, USA) and 0.01 mL of the sample aliquot was transferred to a hemocytometer chamber for counting [
18,
23]. The particles in the chamber were counted and their count was converted into a liquid-based concentration (#/mL). The PSL particles were counted using the same procedure as for the fungal spores.
The liquid-based concentrations, C
bacteria, and C
fungi, were calculated as follows:
where
n is the average cell count in each microscope view field,
X (=6125) is the number of fields for the entire 25 mm filter and
D is the dilution factor. When counting fungi, the factor of 10,000 converts the counts in the hemocytometer counting chamber into the concentration of fungi as #/mL.
When testing the concentrating devices, we used 20 mL of suspension for the Evaporator and 40 mL or 50 mL for the CP models. Most of the initial samples had a volume of 40 mL, but in a subset of cases with the CP-150, we also explored a higher volume of 50 mL. All the final volumes were between 0.1 mL and 1 mL, and upon completion of the concentration process, a 0.1 mL was aliquoted from each concentrated sample. The 0.1 mL aliquot was reconstituted to 1.0 mL volume by adding Milli-Q water, from which six 0.1 mL aliquots were removed. Three aliquots were used for the microscopy-based analysis and three for the culture-based analysis of the final concentration using the same process as described above.
Based on the microscopy and culture data, we determined the particle losses and the concentration factor (CF) as follows:
The loss of the total particles and the loss of the culturable particles were calculated separately because of the two different aspects of the concentration process. Firstly, there was a physical concentration of particles and any loss here was reflected by the loss of total particles, regardless of its effect on particle viability or culturability. Secondly, any physical handling of biological particles is known to affect their viability or culturability, metabolic activity and survival [
24,
25]. Therefore, losses could be different based on the microscopy-based and culture-based analysis methods, which are different metrics to analyze the presence of microbial particles.
Concentration factor (CF), both for total particles and culturable particles:
where the initial and final concentrations are the concentrations of particles in the initial and final sample, respectively, determined using either microscopy (#/mL) or culture-based (CFU/mL) analysis; the initial and final volumes are the entire liquid volume in mL before and after concentration; recovery is the fraction of the initial particle number that was measured in the final liquid after the concentration process.
3. Results
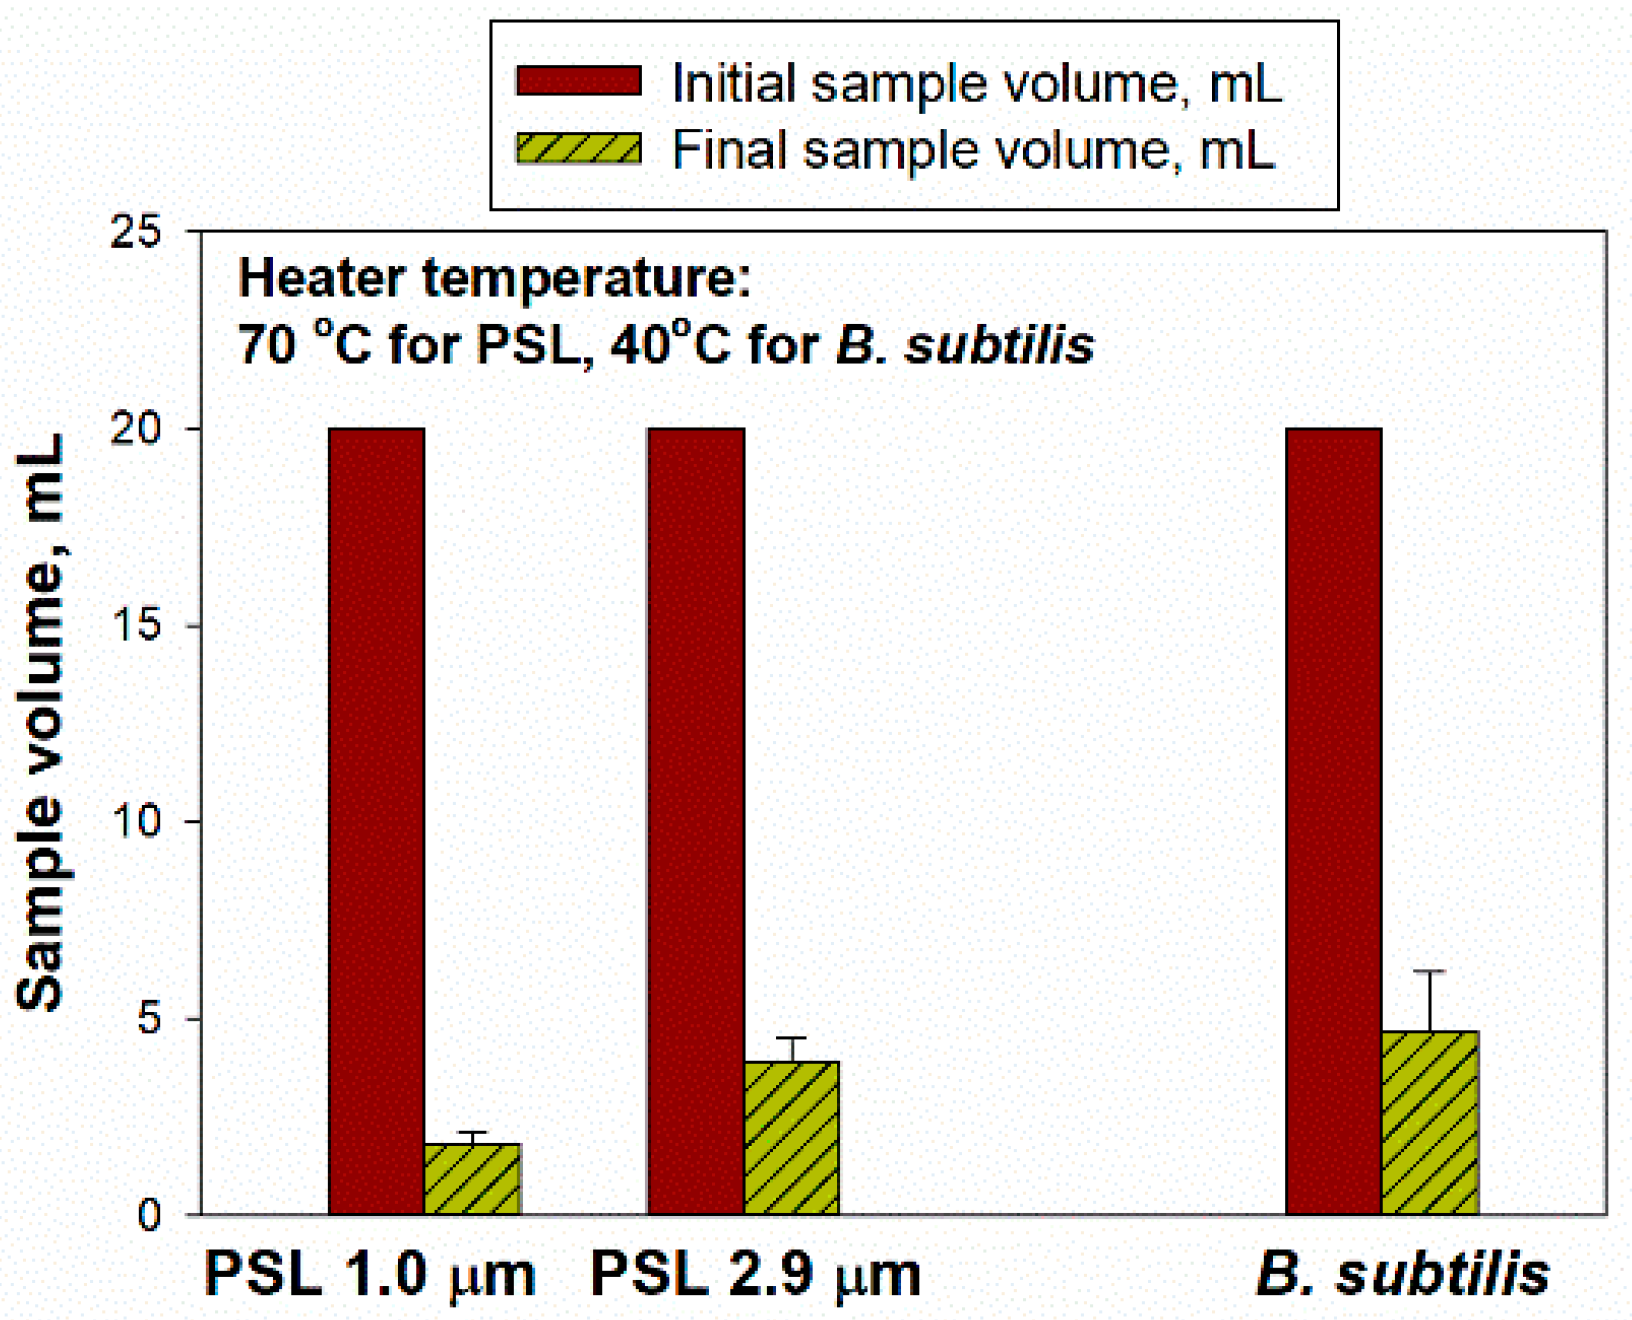
For sample concentration using the BioChromato evaporator, we performed preliminary tests with 20 mL of initial suspension at a heater temperatures of 70 °C for the PSL and 40 °C for
B. subtilis. Our target was to achieve the final volume of less than 5 mL, which took as long as 120 min to achieve. Therefore, 120 min evaporation time was selected for the subsequent experiments, while the other experimental conditions remained the same. Here, 20 mL initial suspensions with the PSL particles of two different sizes (of 1.0 and 2.9 µm with 1% solids) and
B. subtilis bacterial cells (initial concentration of 1.06 × 10
8–1.24 × 10
8 #/mL) were used, and the final volumes were 1.80 ± 0.30 mL for 1.0 μm PSL, 3.90 ± 0.60 mL for 2.9 μm PSL and 4.67 ± 1.53 mL for
B. subtilis (
Figure 2).
The initial and final suspension volumes when concentrating 40–50 mL samples using the two CP-models (CP-150 and CP-Select) are shown in
Figure 3. Here, we used PSL particles of two different sizes (2.0 and 2.9 µm, with 1% solids in suspension) and three types of bacterial cells (
B. subtilis,
P. stutzeri and
P. fluorescens).
When the liquid samples of PSL and bacterial cells with initial volumes of 40–50 mL were concentrated, the final volumes ranged from 0.14 to 0.86 mL for the CP-150 (
Figure 3a), and the time needed to concentrate the sample was between 20–38 s; for the CP-Select, the final volumes ranged from 0.29 to 0.69 mL (
Figure 3b), and the time needed to concentrate the sample was between 18 and 27 s. The final volumes achieved by the CP-150 differed depending on the setting for the elution fluid volume (L: Large, M: Medium, and S: Small) and the number of consecutive elutions (1E: one elution, 2E: two elutions, and 3E: three elutions). The final volumes for
B. subtilis with 1E were 0.14 ± 0.00 mL for the S volume setting and 0.86 ± 0.00 mL for the M volume settings (
p = 0.1). With 2E and 3E, the final volumes for 2.9 μm PSL were 0.62 ± 0.01 mL and 0.56 ± 0.01 mL for the M volume settings, respectively; the S setting was only tested at 3E and the final volume was 0.27 ± 0.03 mL. This amount was significantly different from that at the M setting and three elutions (
p = 0.001). For the bacterial cells, three elutions were applied in the S setting instead of the M setting to obtain a lower final volume and increase the concentration factor. When three consecutive elutions at the setting S were used, the final volumes for suspension with
P. stutzeri (with an initial concentration of 4.91 × 10
5 ± 2.09 × 10
5 #/mL) and
B. subtilis (with an initial concentration of 3.51 × 10
5 ± 7.87 × 10
4 #/mL) were similar: 0.20 ± 0.08 mL and 0.28 ± 0.04 mL, respectively, yet significantly different (
p = 0.021).
Before concentrating samples with the CP-Select model, we determined the valve open time (in ms) that corresponded to the M and S elution volume settings of the CP-150 model: 70 ms for the M and 30 ms for the S Data with the CP-150 showed that using three consecutive elutions minimized particle losses (
Figure 4a) (for
B. subtilis, 20.44% and 12.22% at the M and S settings, respectively) and this was confirmed with the initial experiments with the CP-Select (data not shown). Therefore, three consecutive elutions were applied for all the particle suspensions concentrated with CP-Select (2.0 μm PSL, and
B. subtilis and
P. fluorescens bacteria) and both elution time/elution volume settings: 70 ms for M and 30 ms for S. The resulting final volumes at the setting M were 0.68 ± 0.09 mL for PSL, 0.69 ± 0.03 mL for
B. subtilis (with an initial concentration of 1.60 × 10
5 ± 3.92 × 10
4 #/mL), and 0.69 ± 0.01 mL for
P. fluorescens (with an initial concentration of 4.52 × 10
5 ± 2.94 × 10
5 #/mL); at the S volume setting, the final volumes were 0.29 ± 0.06 mL for 2.0 μm PSL, 0.29 ± 0.09 mL for
B. subtilis (with an initial concentration of 1.42 × 10
5 ± 2.25 × 10
5 #/mL) and 0.33 ± 0.06 mL for
P. fluorescens (with an initial concentration of 2.80 × 10
5 ± 1.23 × 10
5 #/mL) (
Figure 3b). The final volumes at both the S and M settings did not depend on the particle type (
p = 0.1). For the CP-Select, the final volumes at the M and S settings did not depend on the particle type:
p > 0.05 as per ANOVA.
Particle losses due to the concentration process by the investigated devices, as quantified by counting particle quantities in the initial and final liquid solutions using microscopy, are shown in
Figure 4. The particle losses using the two CP models (CP-150 and CP-Select) ranged from 5.60% ± 0.70% to 25.50% ± 0.90% for the PSL particles (1.0 µm, 2.0 µm, and 2.9 µm, with 1% solids in suspension) and from 0.20% ± 0.19% to 67.22% ± 30.42% for the bacterial cells (
B. subtilis,
P. stutzeri, and
P. fluorescens) (
Figure 4a,b). The losses caused by the Evaporator were generally lower. They ranged from 3.70% ± 1.37% to 13.32% ± 5.04% for the PSL particles (1.0 µm and 2.9 µm with 1% solids), and they were 23.89% ± 3.56% for
B. subtilis (with the initial concentration of 4.03 × 10
8 ± 1.61 × 10
8 #/mL).
When using the CP-150, there was no difference in the losses of
B. subtilis bacteria between the M and S settings, and this observation was valid for both one and three consecutive elutions. The same could be said when the
B. subtilis solution was concentrated with the CP-Select. However, there was a statistically significant difference in the fraction of particles lost depending on the final volume setting (M vs. S) when concentrating the suspensions with
P. fluorescens bacteria (
p = 0.01) (
Figure 4c).
P. fluorescens is a Gram-negative bacterium and it has a different surface structure compared to the Gram-positive
B. subtilis. It is a longer rod compared to bacilli, and pseudomonads often have flagella [
26]. We speculated that the longer rods and flagella of
P. fluorescens helped it to firmly attach to a filter during the filtration process and a longer wash/removal time was needed to remove these bacteria from the filter during the elution. Since the elution at the S setting was shorter than at the M setting, more bacteria remained on the filter and contributed to losses. The same reason would explain the higher losses of
P. stutzeri compared to
B. subtilis at the same elution setting S (
Figure 4c).
When comparing the data between one and three consecutive elutions performed with the CP-150 when eluting a suspension with B. subtilis, we can see that the loss of particles has decreased. At the M setting, the losses decreased from 42.11% to 20.44% (p = 0.046) and at the S setting, the losses decreased from 25.11% to 12.22% (p = 0.044). Some particles were likely left on the flat filter after the initial elution process. This resulted in particle loss in the final solution. The consecutive elutions removed some of those particles from the flat membrane filter into the final liquid solution, thereby decreasing the particle loss. However, having multiple elutions increases the final liquid volume.
When we compared the CP-150 and CP-Select at three consecutive elutions for the concentration of B. subtilis, we observed that at the M setting, the losses decreased from 20.44% to 0.20% (p = 0.005) and at the S setting the average losses decreased from 12.22% to 3.93% (p = 0.203). Moreover, when we compared the losses of pseudomonads (P. stutzeri and P. fluorescens) at the setting S, the average losses decreased from 67.22% with CP-150 to 36.67% with CP- Select (p = 0.158). The data suggest that the elution and concentration process in the CP-Select is more advanced than in the CP-150. It is hard to say what the exact reason is due to the proprietary nature of the technology. Still, we speculate that the introduction of the pulsating elution in the CP-Select helped to remove particles from the filter.
We also polled the CP data when concentrating the PSL particles, and these results are presented in
Table S1 and described in the
Supplemental Materials. In short, there was no statistically significant difference between both particle losses and the CF values between the 2.0 and 2.9 µm PSL particles:
p = 0.70 and 0.39 for the particles loss at the final volume settings M and S, respectively;
p = 0.14 and 0.06 for the CF at the final volume settings M and S, respectively.
In general, when using the CP devices, higher losses were observed with the bacteria compared to PSL particles, and the losses of Gram-negative pseudomonads were higher than the losses of Gram-positive B. subtilis. The higher losses of bacteria compared to the PSL particles could be explained by a higher affinity of bacteria to the flat filter, leading to their reduced elution from the filter. However, the losses could be reduced by using pulsed removal as in the CP-Select. The differences between the Gram-negative and Gram-positive bacteria were likely due to their different shapes (pseudomonads are longer rods) and different surface structure, which led to the stronger adhesion of pseudomonads to the flat filter.
Since there were no repeated elutions with the Evaporator, we analyzed the particle losses as a function of particle size (
Figure 4d). In essence, there were statistical differences in the particle losses between the particle types:
p = 0.033 when PSL of 1.0 and 2.9 µm in diameter were compared,
p < 0.001 for losses between PSL of 1.0 µm in diameter and
B. subtilis, and
p = 0.041 for losses between PSL of 2.9 µm and
B. subtilis. When the BioChromato is operated, a strong vacuum-assisted vortex pattern of the liquid motion is established. The larger PSL particles have more inertia and stronger momentum compared to the smaller PSL particles, and that allows them to break the surface tension of water and escape into the air, which leads to their higher losses.
B. subtilis has different surface properties compared to the PSL particles, i.e., their surface is not as smooth compared to PSL, and we speculate that this helps the bacteria break the surface tension while rotating in the liquid leading to their escape. Besides, the bacteria are rod-shaped particles, and if the tip of a bacterium presses against the surface layer of water, this creates a strong local pressure against the water boundary and enables those bacteria to escape. Additional experiments would be needed to investigate the exact reasons for the differences in losses among those three particle types.
The loss of culturable bacterial cells when using the CP-150 at the S volume setting was 45.80% ± 5.50% for
B. subtilis (with an initial concentration of 3.71 × 10
3 ± 5.97 × 10
3 CFU/mL) and 81.60% ± 22.20% for
P. stutzeri (with 1.53 × 10
2 ± 0.65 × 10
2 CFU/mL) and at the M volume setting, the loss was 43.20% ± 3.70% for
B. subtilis (with an initial concentration of 5.25 × 10
4 ± 4.01 × 10
3 CFU/mL) (
Figure 5). The loss of culturable
B. subtilis bacteria when using the CP-Select was 34.20% ± 4.90% at the M volume setting and 42.80% ± 7.00% at the S volume setting. When concentrating the suspension with
P. fluorescens bacteria using the CP-Select, the losses of the culturable bacteria were 81.30% ± 9.30% at the M volume setting and 90.20% ± 5.00% at the S volume setting.
For the culturable
B. subtilis, the difference in loss between the M and S settings was not significantly different for both devices. The same could be said for the culturable
P. fluorescens concentrated by the CP-Select at the M and S settings. The loss of culturable
P. stutzeri processed with the CP-150 was similar to the losses of
P. fluorescens concentrated by the CP-Select (
p = 0.158). On the other hand, the losses of pseudomonads were statistically higher compared to the losses of
B. subtilis. Pseudomonads are Gram-negative bacteria and they are less resistant to environmental stressors compared to the Gram-positive
B. subtilis [
26]. The elution process used a surfactant to remove the particles from the filter and this process likely rendered a high fraction of the pseudomonads uncultivable. We also observed the negative effects of a surfactant on the integrity of Gram-negative cells in another study [
27]. Besides, the process of filtration and the passing of the suspension through a filter tip involves shear stress, and this also added to the loss of culturable pseudomonads [
28].
It should be added, however, that the loss of culturable B. subtilis was significantly reduced when the samples were concentrated at the M setting using the CP-Select compared to the losses with the CP-150 (p = 0.022). At the S final volume setting, the difference was not statistically significant (p = 0.956).
In addition to the laboratory test, an outdoor field test was conducted on a college campus in New Brunswick, NJ. The bacterial cells and fungal spores were collected using a BioSampler (SKC Inc.) with 20 mL of collection liquid and the collected liquid samples were concentrated using the CP-150. The concentrations of bacteria and fungi in the samples before and after processing them with the CP-150 were determined using the same microscopy and culturable methods as described previously. When these outdoor samples were concentrated using the CP-150 and then analyzed by the direct light microscopy with acridine orange staining, we not only observed no loss of either bacterial cells or fungal spores but instead, there were higher particle counts for both the bacterial cells and the fungal spores after the concentration process (
Table 2). The increase in particle numbers was most likely due to the deagglomeration of particle agglomerates and aggregates containing bacterial cells and fungal spores during the elution step, which involves using a surfactant. Thus, any particle losses were compensated and even overcome by the deagglomeration. Deagglomeration of microbial “clumps” was observed in other research [
7], including when analyzing the performance of microbial samplers such as impingers [
29]. The deagglomeration phenomenon was not observed in the laboratory tests, where single cultures and well mixed suspensions were used and there were a minimum number of agglomerates. Obviously, the deagglomeration phenomenon warrants further investigation, and the field samples could be investigated in terms of biomass before and after the concentration process, while the biological particles, their agglomerates and fragments could be examined using FESEM (field-emission scanning electron microscope) as described elsewhere [
11].
On the other hand, when we examined the culturable concentrations in the initial and final suspensions of the environmental samples, the losses were 45.21% ± 7.66% for bacterial cells (with an initial concentration of 1.53 × 10
1 ± 3.46 × 10
0 CFU/mL) and 75.28% ± 16.41% for fungal spores (with an initial concentration of 4.80 × 10
1 ± 1.98 × 10
1 CFU/mL) (
Figure 6).
Thus, contrary to the total microorganism loss, the losses of the culturable microorganisms were similar to those observed in the laboratory experiments. Firstly, only 0.1–10% [
7,
12,
14] of bioaerosol particles are culturable [
14], and their culturability depends on many factors, including microorganism species, culture medium, method of aerosolization and method of analysis. When the samples were processed by the CP-150, the concentration process itself, which used filtration and surfactant, likely decreased the culturability of the eluted microorganisms. Apparently, the loss of culturability was higher than the gain of individual microbial particles due to deagglomeration. Due to such a stark difference between the losses of total and culturable particles in the field samples, more work is needed to determine the applicability of this technique for field samples.
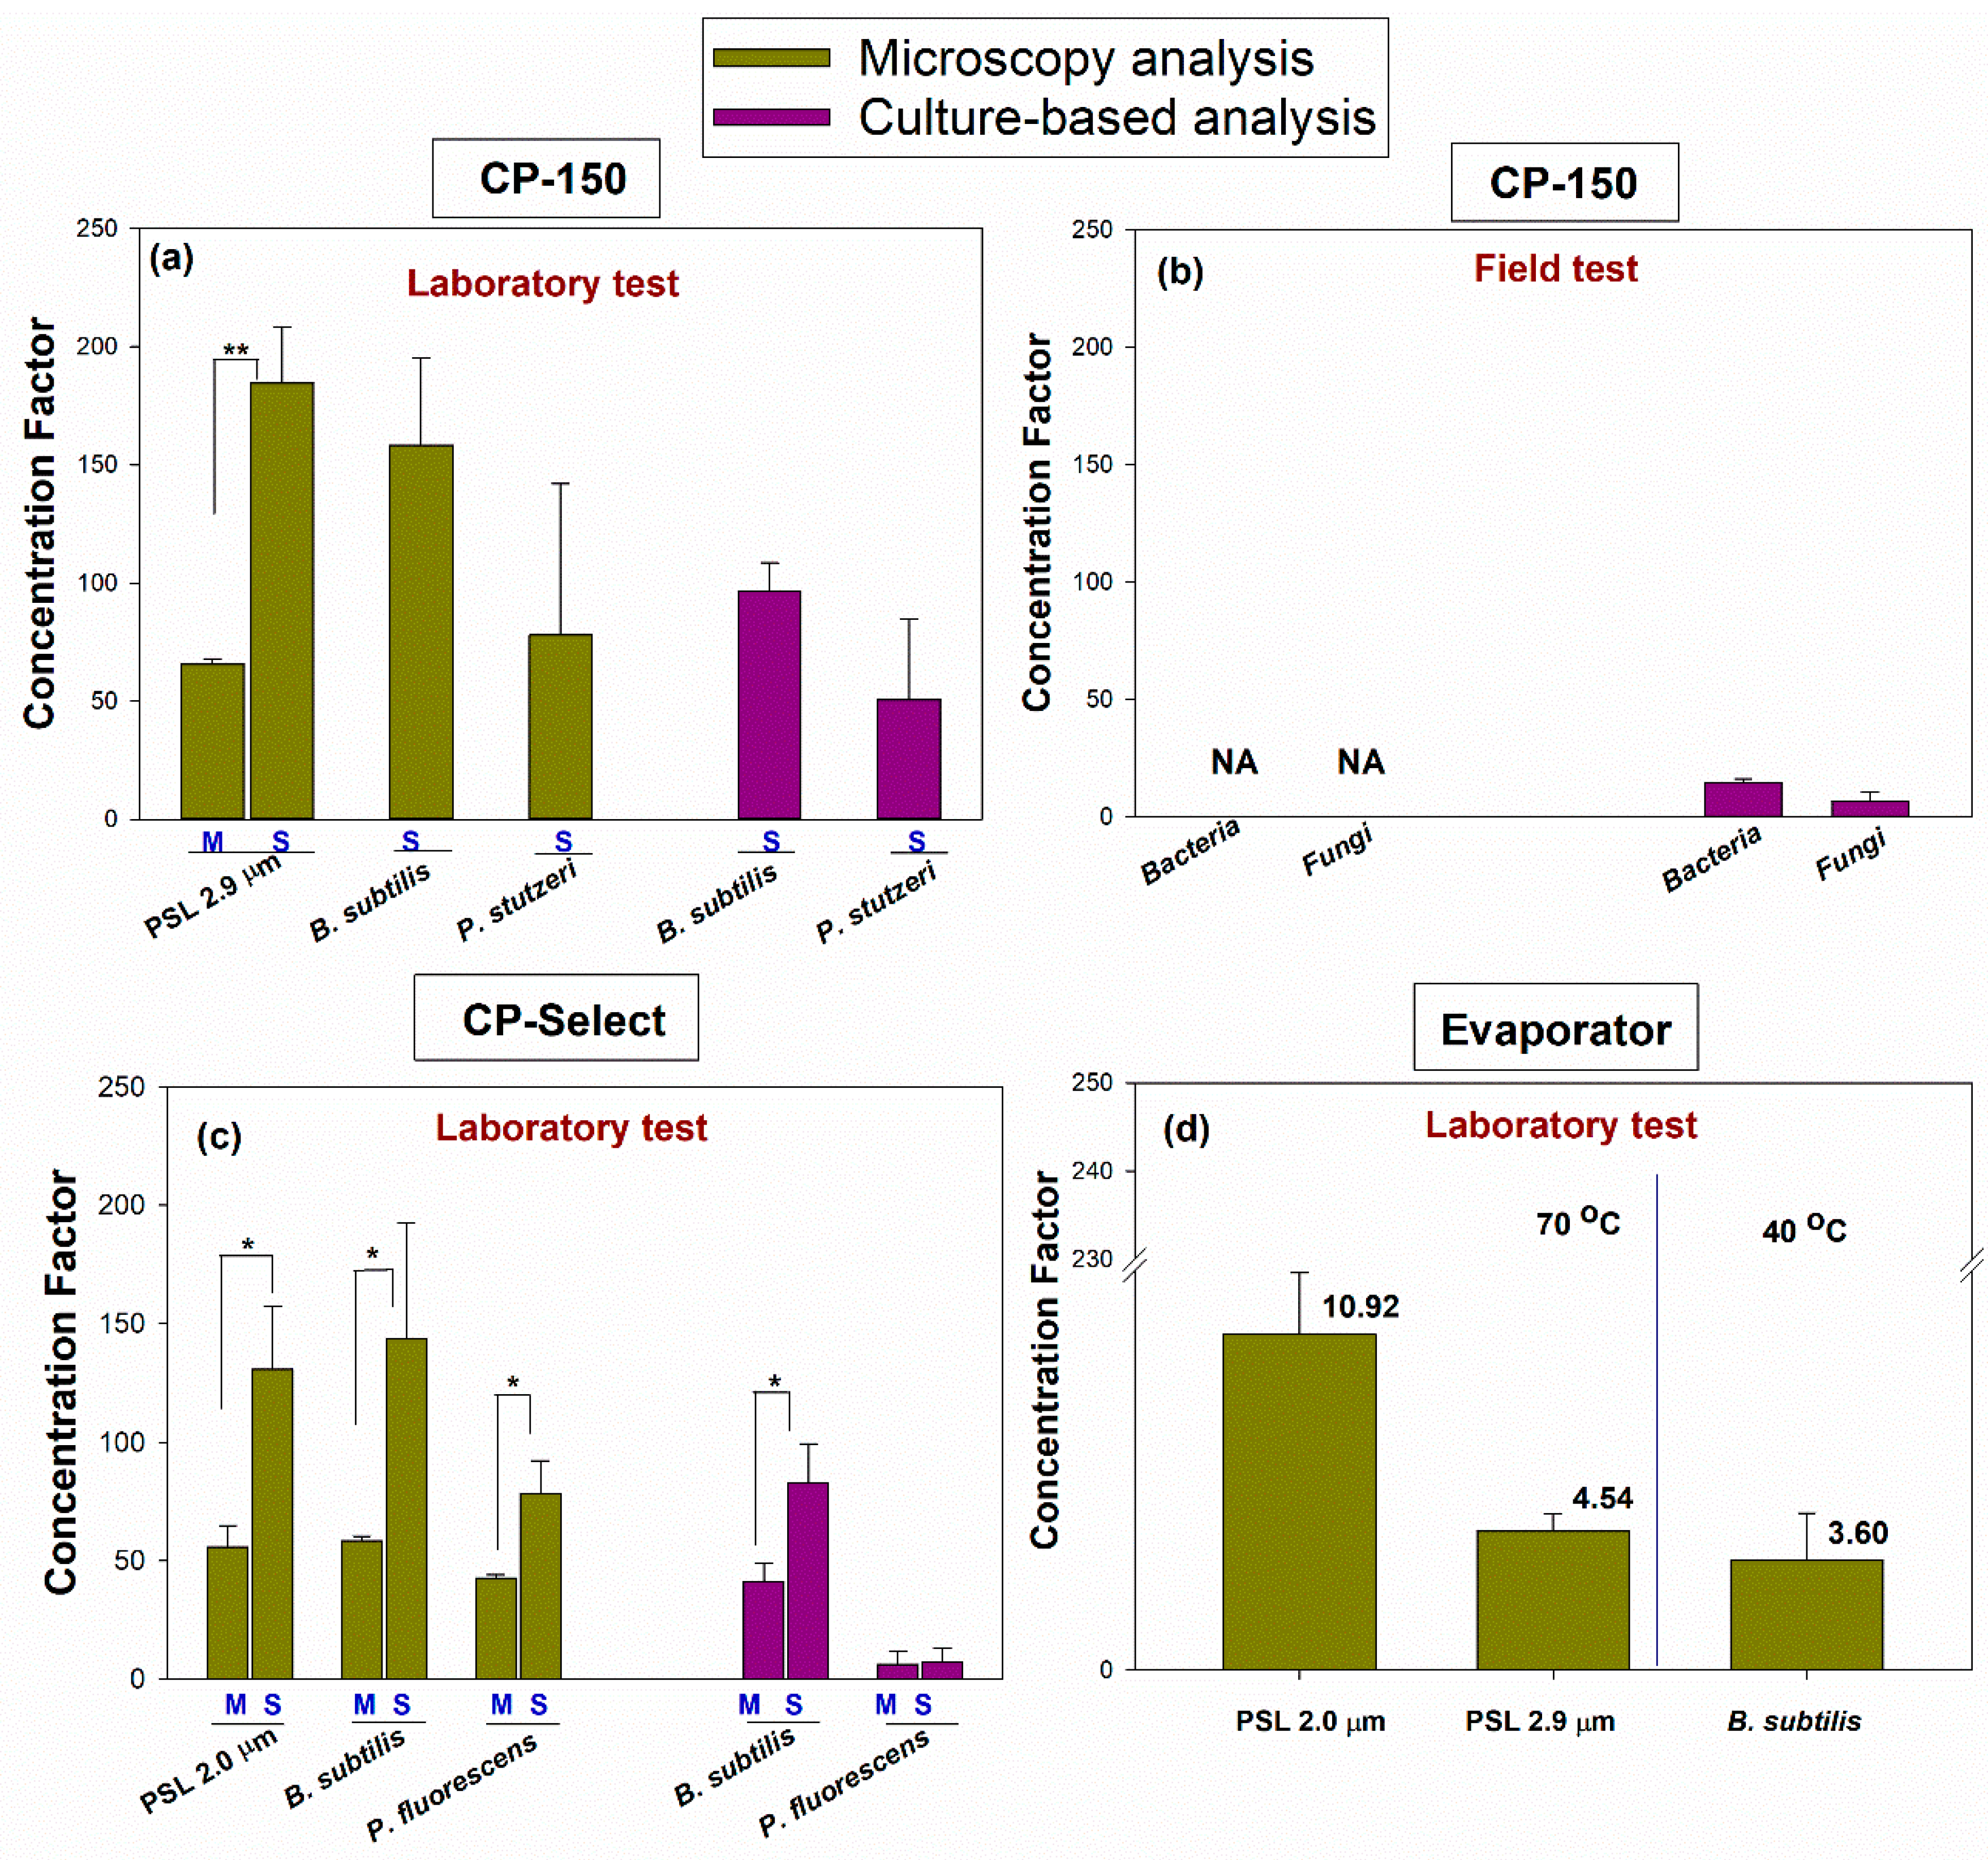
In the final step of the project, we calculated the concentration factor (CF) as per Equation (5), and the results are presented in
Figure 7. The CF allows us to compare the different concentration devices in their various settings and when processing the total and culturable microorganisms. When the total particles were counted using microscopy, the CF varied from 3.59 to 10.92 for the BioChromato Evaporator, from 45.59 to 184.64 for the CP-150, and from 42.77 to 143.62 for the CP-Select.
Specifically, the CF was 10.92 ± 2.00 for 1.0 µm PSL, 4.54 ± 0.56 for 2.9 µm PSL, and 3.59 ± 1.53 for B. subtilis when using the BioChromato Evaporator. The CF was 65.70 ± 2.27 for 2.9 µm PSL (at the M volume setting), 184.64 ± 23.77 for 2.9 µm PSL (at the S volume setting), 158.37 ± 36.88 for B. subtilis (at the S volume setting), 77.93 ± 64.07 for P. stutzeri (at the S volume setting), 58.10 ± 4.42 for the bacterial cells in the field test (at the M volume setting) and 45.59 ± 5.01 for the fungal cells in the field test (at the M volume setting) when using the CP-150. The CF was 55.77 ± 9.18 for 2.0 µm PSL (at the M volume setting), 58.47 ± 1.98 for B. subtilis (at the M volume setting), 42.77 ± 1.39 for P. fluorescens (at the M volume setting), 130.86 ± 26.47 for PSL of 2.0 µm (at the S volume setting), 143.62 ± 48.84 for B. subtilis (at the S volume setting) and 78.49 ± 13.77 for P. fluorescens (at the S volume setting) when using the CP-Select.
When we determined the CF for the culturable microorganisms, it ranged from 8.21 to 96.52 for the CP-150, and from 6.29 to 82.95 for the CP-Select. Specifically, when using the CP-150, the CF ranged from 96.52 ± 11.97 for
B. subtilis (at the S volume setting) to 50.55 ± 34.09 for
P. stutzeri (at the S volume setting). For the field test and sample concentration using the CP-150, the CF was 18.42 ± 1.71 for the bacterial cells (at the M volume setting) and 8.21 ± 5.10 for the fungal cells (at the M volume setting). When the CP Select was used with
B. subtilis, the CF was 41.12 ± 7.98 at the M volume setting and 82.95 ± 16.39 at the S volume setting. When the CP Select was used with
P. fluorescens, the CF was 6.29 ± 5.64 at the M volume and 7.19 ± 6.00 at the S volume setting (
Figure 7).
As shown in
Figure 7, there was a statistically significant difference in the concentration factor due to the different elution volumes M and S (
p = 0.001 for microscopy analysis) for 2.9 µm PSL when the CP-150 was used. For the CP-Select, when concentrating the total particles, there were statistical differences in the CF for 2.0 µm PSL (
p = 0.01),
B. subtilis (
p = 0.039) and
P. fluorescens (
p = 0.011) as a function of the M and S final volume settings. The only statistically significant difference in the CF based on the culturable microorganism analysis was observed for
B. subtilis (
p = 0.016) between the M and S elution fluid volume settings.
We are not presenting the CF for the total microorganisms based on the field sample processing using the CP-150, i.e., when the microorganisms were counted using acridine orange microscopy. Here, as discussed above, in the processed samples, we counted more microorganisms than in the pre-concentration samples, likely due to the deagglomeration of the cells as a result of the surfactant being used in the elution process. While the efficient deagglomeration of microorganisms helps to determine their concentration in the final sample, the calculation and presentation of the CF would be misleading because the actual microorganism concentration in the pre-concentration sample was underestimated due to agglomeration. Future studies would have to deagglomerate samples before they are processed with a concentrator to determine the potential particle losses.
4. Discussion
The emergence and application of new concentration processes have shown promise to advance our ability to quantify bioaerosols collected in liquid. This is especially important for low concentration samples and the techniques described here could find applications in various bioaerosol studies, including in studies of airborne microbiome. There are several methods to concentrate liquid samples, including a continuous flow microfluidic device [
19], a tangential-flow, hollow-fiber ultrafiltration [
13] and a vacuum centrifuge concentrator [
20]. However, to the best of our knowledge, their performance in terms of particle losses and concentration factor is not available. Our study seems to be the first to provide such information. Particle loss and the concentration factor are critical parameters when any concentration process is used for sample quantification.
In our study, the performance of two concentrators (a BioChromato Evaporator and two CP-models) was evaluated by comparing the final concentrated solution volumes, the time needed to concentrate the samples and the losses of the total and culturable particles during the concentration process. Most experiments were performed in the laboratory with well characterized particle suspensions, while some tests were performed using actual bioaerosol samples collected in the field.
The BioChromato evaporator needed 120 min to reduce the initial samples of 20 mL to the final samples with volumes of less than 5 mL. At the same time, the CP process was able to concentrate the initial sample with volumes of 40–50 mL down to 0.3–0.8 mL in 18–38 s. It is a substantial difference, and it becomes especially important when multiple bioaerosol samples have to be processed. The difference between the two instrument types was due to their different operational principles. The BioChromato uses evaporation and it requires a long time even at increased liquid surface areas and increased liquid temperatures. The CP devices capture particles onto a porous membrane filter from which the particles are removed by using a detergent and liquid charged by soluble gas at 90 psi. As a result, the sample processing is speedy compared to evaporation.
Both sample concentration processes show promise to increase the concentrations of particles in the processed suspensions. To apply any concentration technique to quantify bioaerosol samples, one needs to know if there are any particle losses due to sample processing as that affects the accuracy of the results. This information was not available for either concentration technique investigated in this study. We found that when processing the total particles (e.g., regardless of their culturability status), the losses for the Evaporator were 3.70–23.89%; for the CP-models, the losses ranged from 0.20% to 67.22%. For the culturable particles processed with the CP devices, the loss of culturable particles ranged from 42.85% to 90.19%. The losses of Gram-negative pseudomonads were especially high compared to the more stress-resistant Gram-positive
B. subtilis. These losses have to be taken into account because they substantially affect sample quantification accuracy. However, our work showed that the losses could be minimized by adjusting the settings of the CP devices, i.e., using three consecutive elutions instead of just one. This adjustment worked well for the total particles, especially when using the newer model–CP-Select. One has to keep in mind that the increase in the number of consecutive elutions will increase the final solution volume. In some circumstances, the extent of losses also seems to depend on the final elution volume setting (
Figure 4c).
The processing of field bioaerosol samples using the CP-150 yielded a higher quantity of total biological particles in the final solution than in the initial solution, most likely due to the use of the detergent which deagglomerated the particle clusters [
30,
31]. As a result, the loss of total particles when processing the field samples could not be determined. However, the higher particle number post-concentration would not influence results by analysis techniques that were based on total microbial material, e.g., qPCR (quantitative polymerase chain reaction) or similar techniques. Future work should examine the compatibility of concentration techniques with various analysis methods, including qPCR. On the other hand, the use of the CP-150 to concentrate culturable field samples yielded results that were in line with our earlier observations in the laboratory experiments.
However, despite the particle losses, both concentrating techniques yielded higher particle concentrations in the processed samples, thus improving the detection limit needed to process the bioaerosol samples. The range of the concentration factor (CF) for the Evaporator was 3.59–10.92 and the CF values for the CP devices were much higher (approximately by 15x) compared to those obtained by the Evaporator: they ranged from 55.77 to 184.64 for total particles, and from 6.29 to 96.52 for culturable bacteria. The difference was due to the lower final suspension volumes in the CP devices and in some cases, lower particle losses. The field samples in our study represented a separate case when determining the CF. Firstly, the CF was not obtained for the total particles due to particle gain post-concentration. Secondly, although the CF for culturable microorganisms from the field study was in the range of values observed in the laboratory experiments, it was towards the lower end of those values. It is apparent that more work will be needed to examine the applicability of the investigated concentration techniques for field studies.
Overall, our data suggest that both concentration techniques reduced the volume of liquid samples and improved the sample detection limit, which will help to overcome some of the challenges of bioaerosol quantification. The CP models reached concentration factors as high as 200, and the concentration process was rather speedy. At the same time, the user has to be aware of the potential particle losses, especially for culturable particles. The accurate estimate of particle losses was essential when samples were to be quantified. As we have shown above, the losses could be accurately defined with laboratory tests. Still, an extensive application of these concentration techniques in field studies will require more intense and thorough preparation.
One of the limitations of this study is that a limited number of field samples were processed using these techniques, and no field samples were processed using a BioChromato evaporator. This issue will be addressed in future studies. Moreover, since all the instruments were graciously provided by the manufacturers on a trial basis, it was not possible to repeat all the experiments with all the devices. Nonetheless, the executed experiments allowed us to gain insights into the performance of these devices. Additionally, we have a limited understanding of how the losses depend on a biological particle type and whether the final samples may become enriched with certain microbial species. In this case, the sample will be biased towards those species. The differences in the losses between the Gram-negative and Gram-positive bacteria suggest that it could be the case. Therefore, we need more studies to investigate the potential biases that could be introduced by applying the investigated concentration techniques as well as other approaches that are used to enrich low-concentration environmental bioaerosol samples. Another avenue in future research would be to investigate the ability of various concentration devices to concentrate samples with viral particles for their faster detection.


