Article

Source Apportionment of PM2.5 in Florence (Italy) by PMF Analysis of Aerosol Composition Records

1
Department of Physics and Astronomy, University of Florence and National Institute of Nuclear Physics (INFN), Via Sansone 1, 50019 Sesto Fiorentino (FI), Italy
2
National Institute of Nuclear Physics (INFN), Via Sansone 1, 50019 Sesto Fiorentino (FI), Italy
3
Department of Chemistry, University of Florence, Via della Lastruccia 3, 50019 Sesto Fiorentino (FI), Italy
*
Author to whom correspondence should be addressed.
Atmosphere 2020, 11(5), 484; https://doi.org/10.3390/atmos11050484
Submission received: 10 March 2020 / Revised: 2 May 2020 / Accepted: 4 May 2020 / Published: 9 May 2020
(This article belongs to the Special Issue Recent Advances of Air Pollution Studies in Italy)

Abstract

:
An extensive field campaign was carried out in Florence (Tuscany) to investigate the PM2.5 composition and to identify its sources. The scientific objective of this study is providing a reliable source apportionment, which is mandatory for the application of effective mitigation actions. Particulate matter (PM) was collected for one year, simultaneously in a traffic site, in an urban background, and in a regional background site. While the use of two filter types (quartz and Teflon) allowed obtaining a comprehensive chemical characterization (elemental and organic carbon, ions, elements) by the application of different analytical techniques, the location of the three sampling sites allowed getting a better separation among local, urban, regional and transboundary sources. During shorter periods, the aerosol was also collected by means of a streaker sampler and PIXE (Particle Induced X-ray Emission) analysis of these samples allowed the assessment of hourly resolution elemental time trends. Positive matrix factorisation (PMF) identified seven main sources: traffic, biomass burning, secondary sulphate, secondary nitrates, urban dust, Saharan dust and marine aerosol. Traffic mass concentration contributions were found to be strong only at the traffic site (~8 μg·m−3, 33% of PM2.5). Biomass burning turned out to be an important PM2.5 source in Florence (~4 μg·m−3), with very similar weights in both city sites while at the regional background site its weight was negligible. Secondary sulphate is an important PM2.5 source on a regional scale, with comparable values in all three sites (~3.5 μg·m−3). On average, the contribution of the “natural” components (e.g., mineral dust and marine aerosols) to PM2.5 is moderate (~1 μg·m−3) except during Saharan dust intrusions where this contribution is higher (detected simultaneously in all three sites). High-time resolution data confirmed and reinforced these results.

1. Introduction

Particulate matter (PM) represents a serious pollution problem in many urban sites. High population densities in urban areas and related activities result in increased PM emissions, which in turn lead to higher ambient concentrations and greater exposure to them. In many urban sites PM10 and PM2.5 (PM with an aerodynamic diameter less than 2.5 µm and 10 µm, respectively) levels are often above their limit values. In Europe, the air quality directive 2008/EC/50 establishes that the daily mean value of PM10 may not exceed 50 µg m−3 more than 35 times in a year and the annual mean value of PM10 (PM2.5) may not exceed 40 (25) µg m−3 [1].
High PM concentrations have a high impact on human health [2]. According to different studies of the World Health Organization [3], exposure to PM can cause or aggravate cardiovascular and lung diseases, heart attacks and arrhythmias. It can also affect the central nervous system, the reproductive system and cause cancer. In particular, smaller particles are more harmful than larger ones as they get deeper inside the respiratory system and clear relationships have been observed between exposure to PM2.5 and adverse health effects [4]: as a result, PM2.5 is an air pollution metric widely used to assess air quality, with the EU having set targets for reduction in PM2.5 levels and population exposure (EU directive 2008/EC/50).
A number of different primary sources both natural and anthropogenic contribute to PM formation in an urban environment (e.g., vehicle tailpipes, vehicle wear products, industrial emissions, biomass burning, mineral dust), together with secondary aerosol production in the atmosphere [5]. Moreover, the adverse effects of this pollution mix are often enhanced by orographic and climatic conditions. Many cities are indeed located at a lower elevation with respect to their surroundings. In this “closed-basin” structure, the effectiveness of atmospheric dispersion mechanisms is strongly reduced. Continental climate further worsens the situation, as cold high-pressure winter conditions (with frequent thermal inversions) reduce the mixing layer height, causing pollution accumulation near the ground.
Florence (~400,000 inhabitants) is located in the central part of Italy, 80 km east of the Tyrrhenian Sea. The few big industries formerly present in the town have moved away from the centre; nevertheless, the high traffic intensity, the topographical configuration of the site (a closed basin), and its continental climate favour recurrent heavy pollution episodes.
A robust source apportionment of urban PM is a complex task due to the chemical complexity of urban aerosols, which is linked to the simultaneous presence of multiple sources and to the secondary processes occurring in the urban boundary layer. Receptor models, like positive matrix factorisation (PMF), may be used to achieve this goal, however, to obtain reliable results, a high number of PM samples should be collected, and an extensive chemical speciation applied [5,6,7].
In the framework of the regional project PATOS2 (Particolato Atmosferico in TOScana II), an extensive field campaign was carried out in Florence (Tuscany) in 2009–2010 to investigate the PM2.5 composition and to identify its sources: obtained results are summarized in this paper, mainly focusing on PMF outcomes.
In particular, the present source apportionment study takes advantage of the combination of a one-year daily dataset, characterized by an extended chemical speciation, with a short-term high-time resolution (1-hour) and size-segregated dataset, obtained by PIXE analyses of streaker samples. Chemical speciation of daily samples included elemental and organic carbon, elements and ions; a subset of samples was analysed to determine the concentration of levoglucosan, which is an important tracer of biomass burning [8]. Our study strongly benefits from the availability of data simultaneously collected in three sites of different typology (traffic, urban background and regional background), which allowed us to achieve a clear separation among local, urban, regional and transboundary sources.
The scientific objective of this study is providing a reliable source apportionment, which is mandatory for the application of effective mitigation actions. This work complements and deepens previous source apportionment studies that have been carried out in the same area, but with significant differences and limitations with respect to the present one. In early studies [9,10] the data set was limited to the elemental composition and the PM10 source apportionment was carried out by principal component factor analysis, leading to the identification of four main aerosol source categories (traffic, oil combustion and sulphate, soil dust and sea-salt). In 2004, a PM1 mass closure (elements, ions, EC-OC) and source apportionment study was carried out in Florence, Genoa and Milan [11]: organics and ammonium sulphates accounted for the largest part of PM1 mass in Florence, however only elements were used in PMF. Other studies focused on the impact of air pollution on cultural heritage [12,13,14]. More recently, composition and sources of PM in Florence were studied in the framework of the AIRUSE LIFE+ project, whose aim was characterizing PM similarities and heterogeneities in urban areas from southern Europe [7,15]. In this LIFE+ study a reliable PM10 and PM2.5 source apportionment was carried out in an urban background station in Florence in 2013, [7]: results of this study will be compared with those of the current work.

2. Measurement Techniques

Aerosol samples were collected from March 2009 to March 2010 in three air quality monitoring stations of the Environmental Protection Agency of Tuscany, representative of areas with distinctive profiles as listed below (maps and pictures are available as supplementary material):
-
Viale Gramsci station (Florence), located in the eastern part of the urban area along the main ring road of the city, designated as a traffic site (TS);
-
Via Bassi station (Florence), located in a residential area in the northeast of Florence, designated as an urban background site (UB);
-
Mauro Gordato station near Livorno. Although partially influenced by the nearby costal activity, it may be considered as a regional background station for what concerns the other anthropogenic sources. Here it is designated as a rural background site (RB).
PM2.5 samples were collected on a daily basis (from midnight to midnight) every second day, by three low volume (2.3 m3/h) samplers (FAI HYDRA Dual Sampler), each of them equipped with two inlets in order to simultaneously collect the aerosol on Teflon and quartz fibre filters. PM2.5 daily mass concentrations were obtained by weighing the Teflon filters by an analytical balance (10 μg sensitivity) in controlled conditions of temperature (20 ± 1 °C) and relative humidity (50 ± 5%).
Samples collected on Teflon filters were then cut in three parts. One half was analysed by PIXE [16] to measure the concentrations of all the elements with atomic number Z > 10 with the external set-up described in Lucarelli et al., 2014 [17]; detection limits (DLs) were in the 1–20 ng m−3 range, while uncertainties were determined by a systematic component (5%, due to calibration) and a statistic contribution (from 2 to 20% or higher when concentrations approach DLs). One quarter was analysed by ion chromatography (IC), one Thermo Fisher Dionex DX1000 and one Thermo Fisher Dionex DX500 ion chromatographs working in parallel, to quantify the soluble component (sample extraction in ultra-pure MilliQ water in ultrasonic bath) of inorganic cations, inorganic anions and low molecular weight organic anions; DLs were lower than 0.5 ng m−3 and reproducibility was better than 5% [18]. One quarter was analysed by inductively coupled plasma atomic emission Spectroscopy (ICP-AES), using a Varian 720-ES spectrometer, to assess the soluble component (sample extraction in ultrasonic bath with MilliQ water acidified at pH 1.5–2 with ultra-pure nitric acid) of selected metals; DLs were lower than 1 ng·m−3 and uncertainties were ~10% [19]. Samples collected on quartz fibre filters were analysed by thermo-optical analysis (TOT), using a Sunset analyser implementing a NIOSH-like protocol (CEN/TC 264, 2011; [20]) to measure total, organic and elemental carbon (TC, OC, EC); DLs were ~200 ng·m−3 while uncertainties were 5–10% for OC-TC and 10–20% for EC. A subset of 83 samples was analysed to determine the concentration of levoglucosan by HPLC/ESI-MS/MS, using an HPLC (Agilent 1100) with a triple quadrupole tandem mass spectrometer (API 4000, Applied Biosystems/MDS SCIEX) [8].
During shorter periods (1–2 weeks for each site), the aerosol was also collected by a low volume (1 lpm) two-stage streaker sampler [21]. In this device, a preimpactor removes PM with aerodynamic diameter > 10 μm and an impactor stage deposits the aerosol coarse fraction (2.5–10 μm) on a thin foil while the fine fraction (< 2.5 μm) is collected on a nuclepore filter. The two collecting substrata (the foil and the filter) are paired on a cartridge that rotates at constant speed for a week: this produces a circular continuous deposition of particulate matter on both stages. PIXE analysis of these samples by a properly collimated proton beam, which scans the deposit in steps corresponding to 1 h of aerosol sampling, provides the elemental concentrations with hourly time resolution [22,23].
PMF was applied to the whole data set (daily and hourly samples separately) aiming at the identification of major aerosol sources and quantification of their contribution to PM mass concentration, using the EPA PMF software. PMF is an advanced factor analysis technique based on a weighted least square fit approach [24]; it uses realistic error estimates to weigh data values and imposes non-negativity constraints in the factor computational process. Briefly, the PMF factor model may be written as:
X = G × F + E
where X is a known n by m matrix of the m measured chemical species in n samples; G is an n by p matrix of the contributions of the p sources to the n samples; F is a p by m matrix of factors composition (source profiles). G and F are factor matrices to be determined and E is defined as a residual matrix.
Input data were prepared using the procedure suggested by Polissar et al, 1998 [25]. Daily data from the two sampling sites in Florence (TS and UB) were combined in a single input matrix; this method, which is based on the reasonable assumption that the source chemical profiles do not vary between the two sampling sites, strongly increases the statistical significance and robustness of the analysis. For daily samples, matrix G and F were normalized by multilinear regression analysis, i.e., by regressing the total PM mass concentration measured for each sample against the factor scores, to obtain absolute source profiles and contributions. For hourly data, only elemental concentrations are measured and no information about the PM mass concentration is available: in this case, only relative source profiles (elemental ratios within the composition of the identified sources) can be obtained and source time series are in arbitrary units. PMF results for a varying number of factors (form 4 to 8) were systematically explored, looking at Q values (i.e., values reached by the objective function which is minimized by the model) distribution of residuals, G-space plots, physical sense of source profiles and contributions to find out the most reasonable solution.
HYSPLIT air mass backward trajectories [26] were calculated for all the studied period at different end-point altitudes (from 500 to 2000 m a.g.l., at 43.78 N 11.25 E) and at different hours of the day (0, 6, 12 and 18 hours UTC), to look over the connections between air mass provenience and PM composition/sources. In particular, these data were used for the study of Saharan intrusions: on the basis of these calculations, all the sampling days were classified as “HYSPLIT Saharan days (HSDs)” and “HYSPLIT non-Saharan days (HnSDs)”, and changes in PM levels and composition during these two subsamples investigated.

3. Results

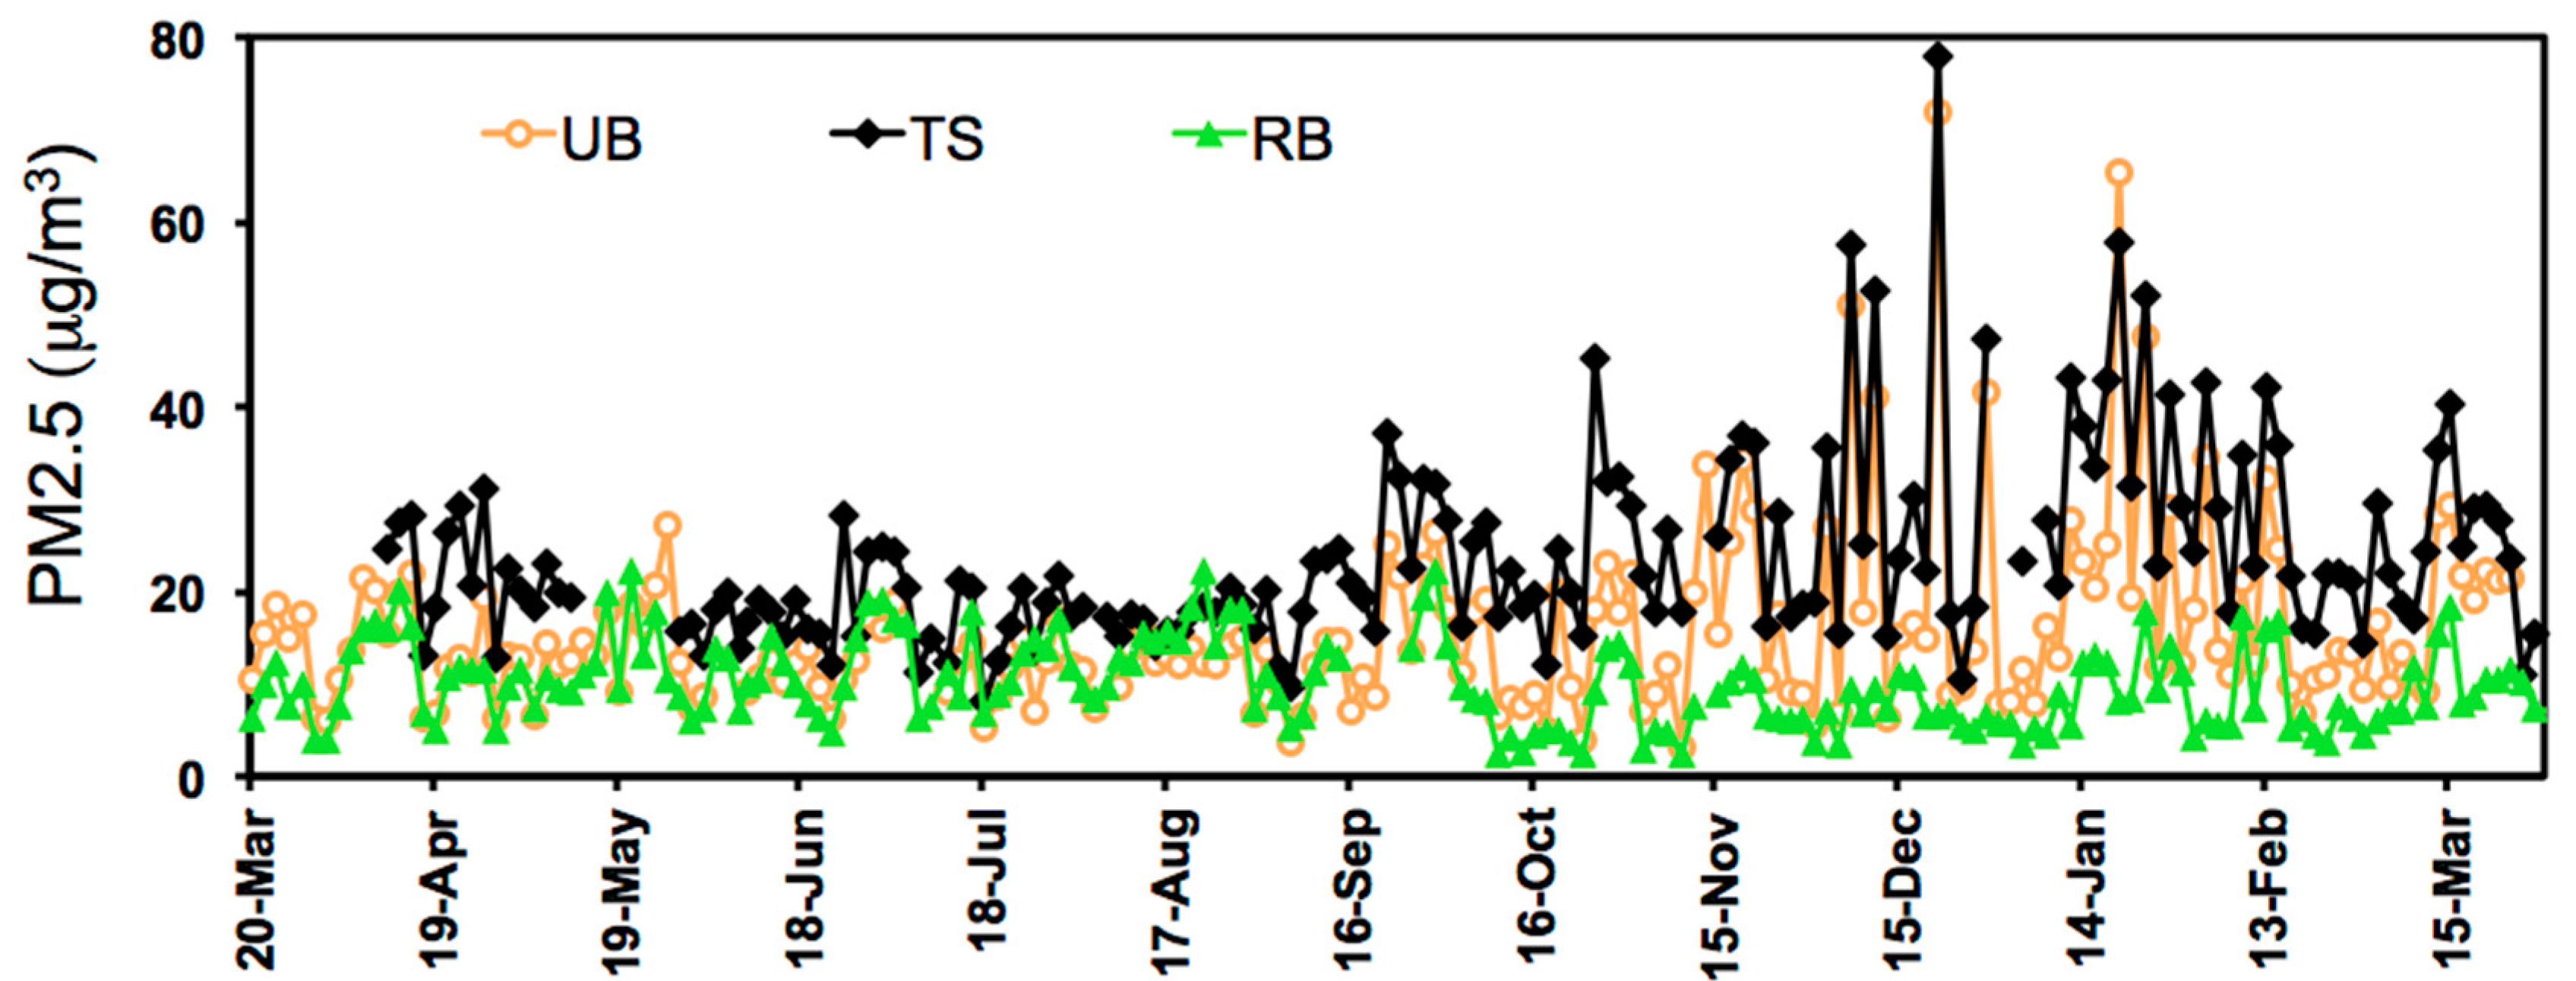
3.1. PM Daily Mass Concentration

PM2.5 daily mass concentrations in the three sampling sites are shown in Figure 1, while average values are reported in Table 1.
As could be expected, the highest mean PM2.5 value was registered in the TS (23.4 μg·m−3), the lowest in the RB (10.0 μg·m−3) and an intermediate value was found for the UB (15.5 μg·m−3). These values may be compared to the annual EU target value of PM2.5 (25 μg·m−3, 2008/50/EC [1]).
As can be seen in Figure 1, the most evident feature is a strong seasonal pattern of PM in Florence (TS and UB), with higher concentration during the winter period (peaks up to 50–80 μg·m−3). These high concentrations during the cold season may be explained by the presence of winter-specific sources like domestic heating, but also by the meteorological conditions. It is indeed known that in the Florence area typical winter weather conditions are characterised by high atmospheric stability and reduced height of the boundary layer, which induces the accumulation of PM pollutants.

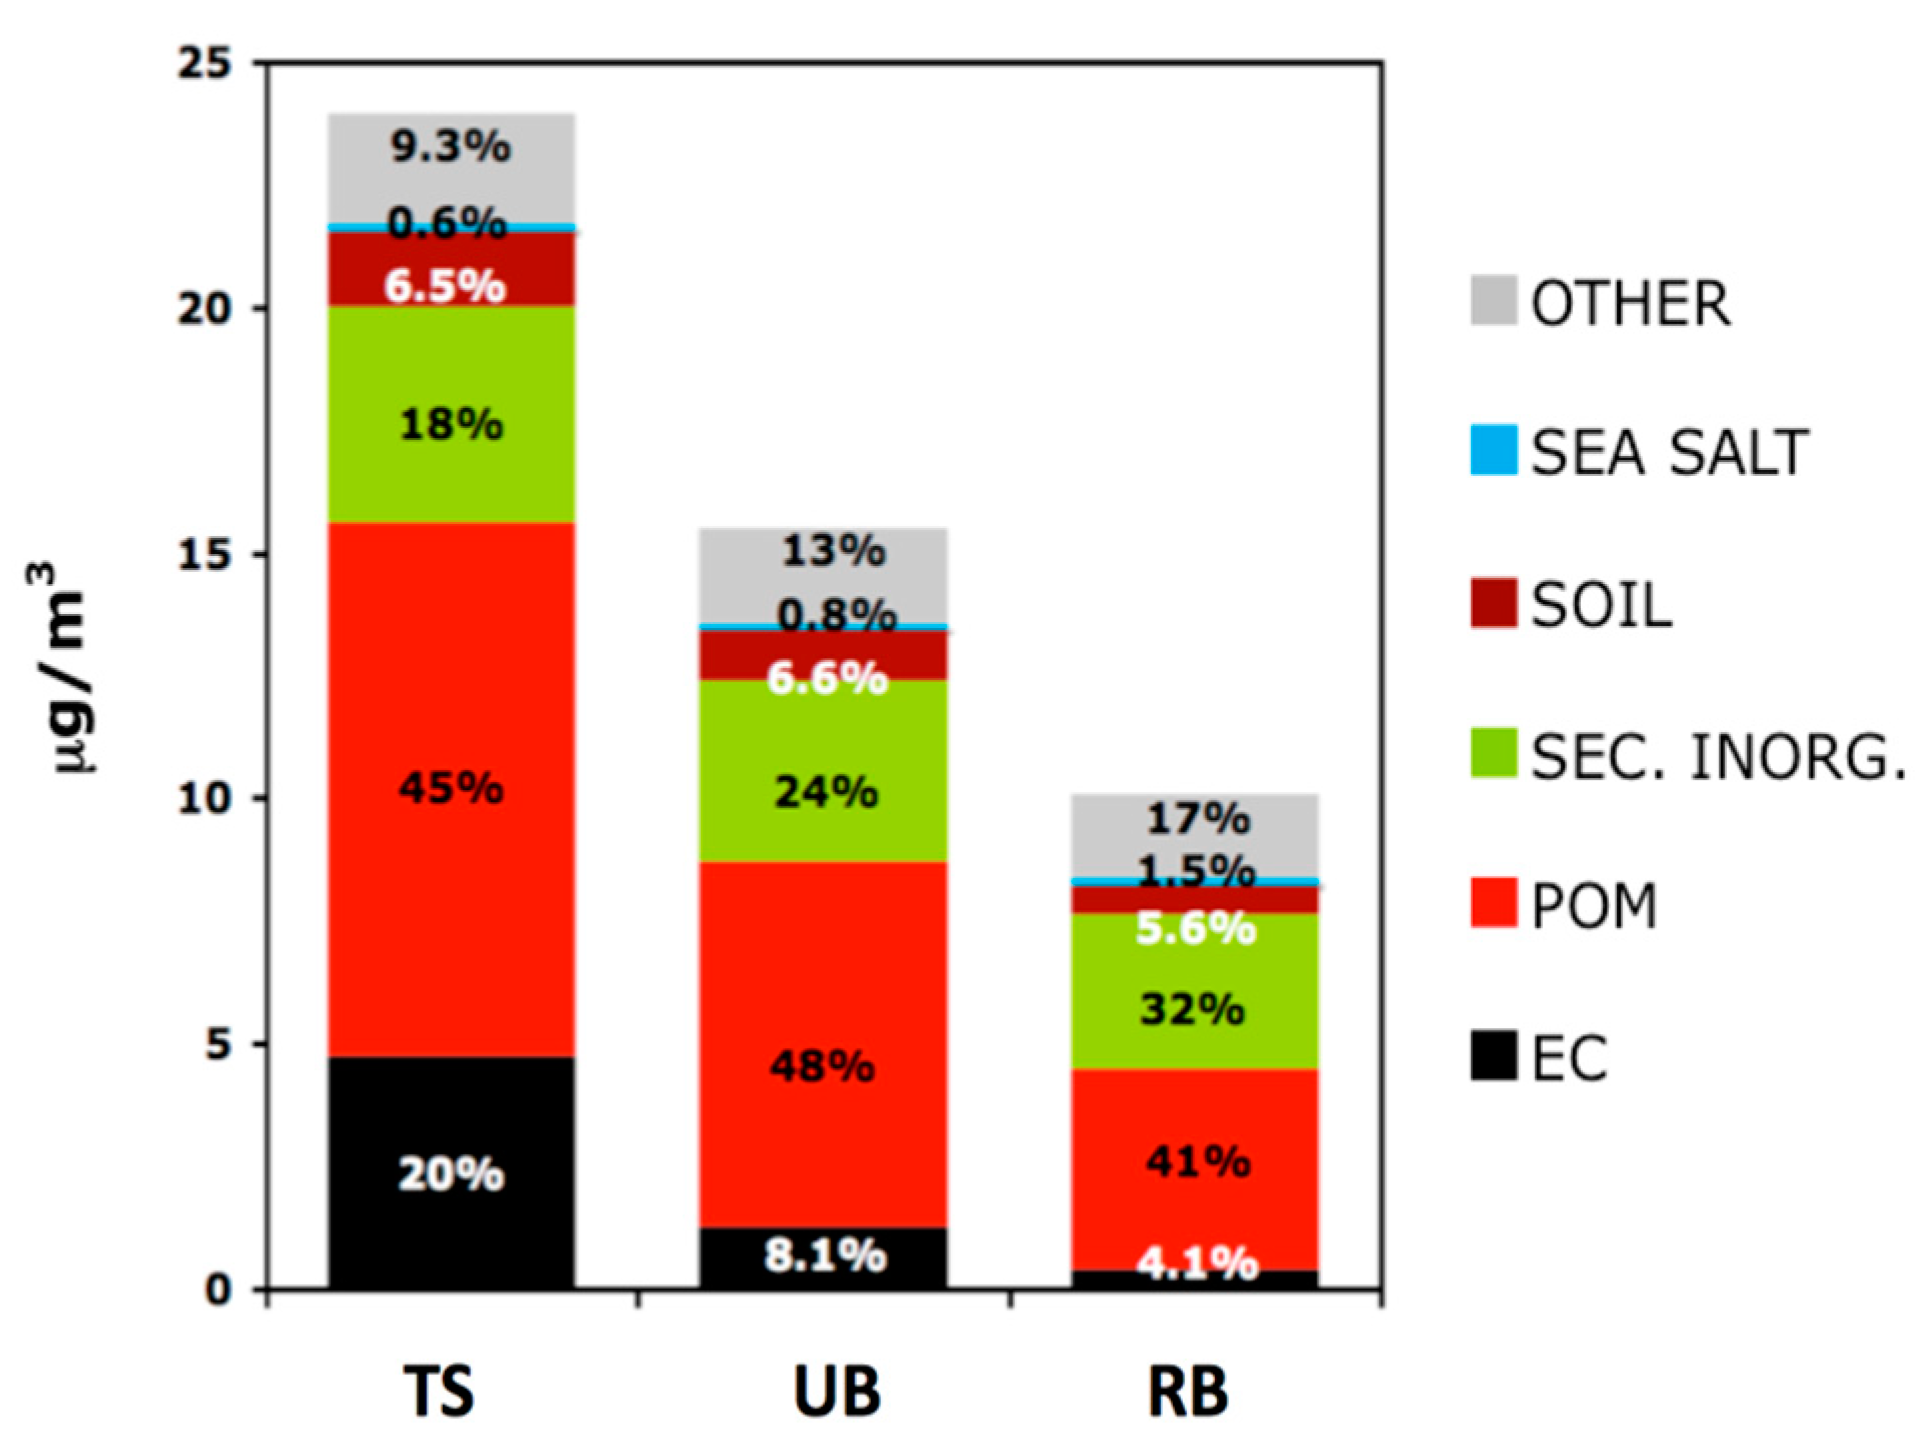
3.2. PM Chemical Composition and Mass Closure

The contribution of main aerosol components to PM2.5 was estimated on the basis of the measured chemical composition. Annual average values for the three sampling sites are reported in Figure 2. Particulate organic matter (POM), i.e., the sum of all the organic compounds, was estimated by multiplying the OC concentration by specific POM/OC factors to take into account the contribution of the other light elements contained in these compounds (like H, N and O). Different factors have been shown to be valid for different types of sites, with increasing values from traffic to rural sites: in agreement with literature, factors 1.4, 1.6 and 2.0 were used in this study for the TS, UB and RB, respectively [27,28]. The secondary inorganic component was obtained just adding nitrate, sulphate and ammonium. Mineral dust was calculated following the oxide formula method, i.e., as the sum of all the main crustal element oxides [29], with K and Fe enrichments corrected by using typical elemental ratios for the upper crust composition [30].
The highest contribution comes from the carbon component (POM+EC), followed by secondary inorganics (sum of nitrate, sulphate and ammonium), while the soil dust and sea spray contributions are quite small. The EC concentration is particularly high at TS site, where it alone represents about 20% of PM2.5 mass: this result could be expected as EC is a well-known tracer of traffic exhaust, especially from diesel engines [31]. POM percentage is particularly high in Florence, both at the traffic site and at the urban background.
Figure 3 shows the “spatial and seasonal distribution” of the major PM components (POM, EC, nitrate and sulphate). Sulphates are quite homogeneously distributed over the regional territory (low differences among TS–UB–RB) and do not show significant seasonal patterns, beside a moderate increase during spring and summer. As known, sulphate is a secondary aerosol component, which originates by photochemical reactions from atmospheric SO2 [32], which is in turn mainly emitted by thermoelectric plants. The enhanced photochemistry in the warm season favours these reactions. Moreover, the higher air circulation in spring-summer fosters their distribution on the regional area.
The EC concentration shows a strong gradient in function of the sampling site, decreasing from the TS to the RB, while its seasonality is moderate.
POM and nitrate show a strong dependence on both the sampling site and season, with the higher values registered in the urban sites during the cold period, correlated with higher PM2.5 concentrations. This behaviour may be explained by the presence of local urban sources of POM and nitrate that are more active in the cold season, like domestic heating. However, an important role is likely played by meteorology, as the typical winter atmospheric stability of Florence promotes the accumulation of local pollutants during this season. Moreover, the lower temperature in winter reduces the volatility of nitrate compounds [32].

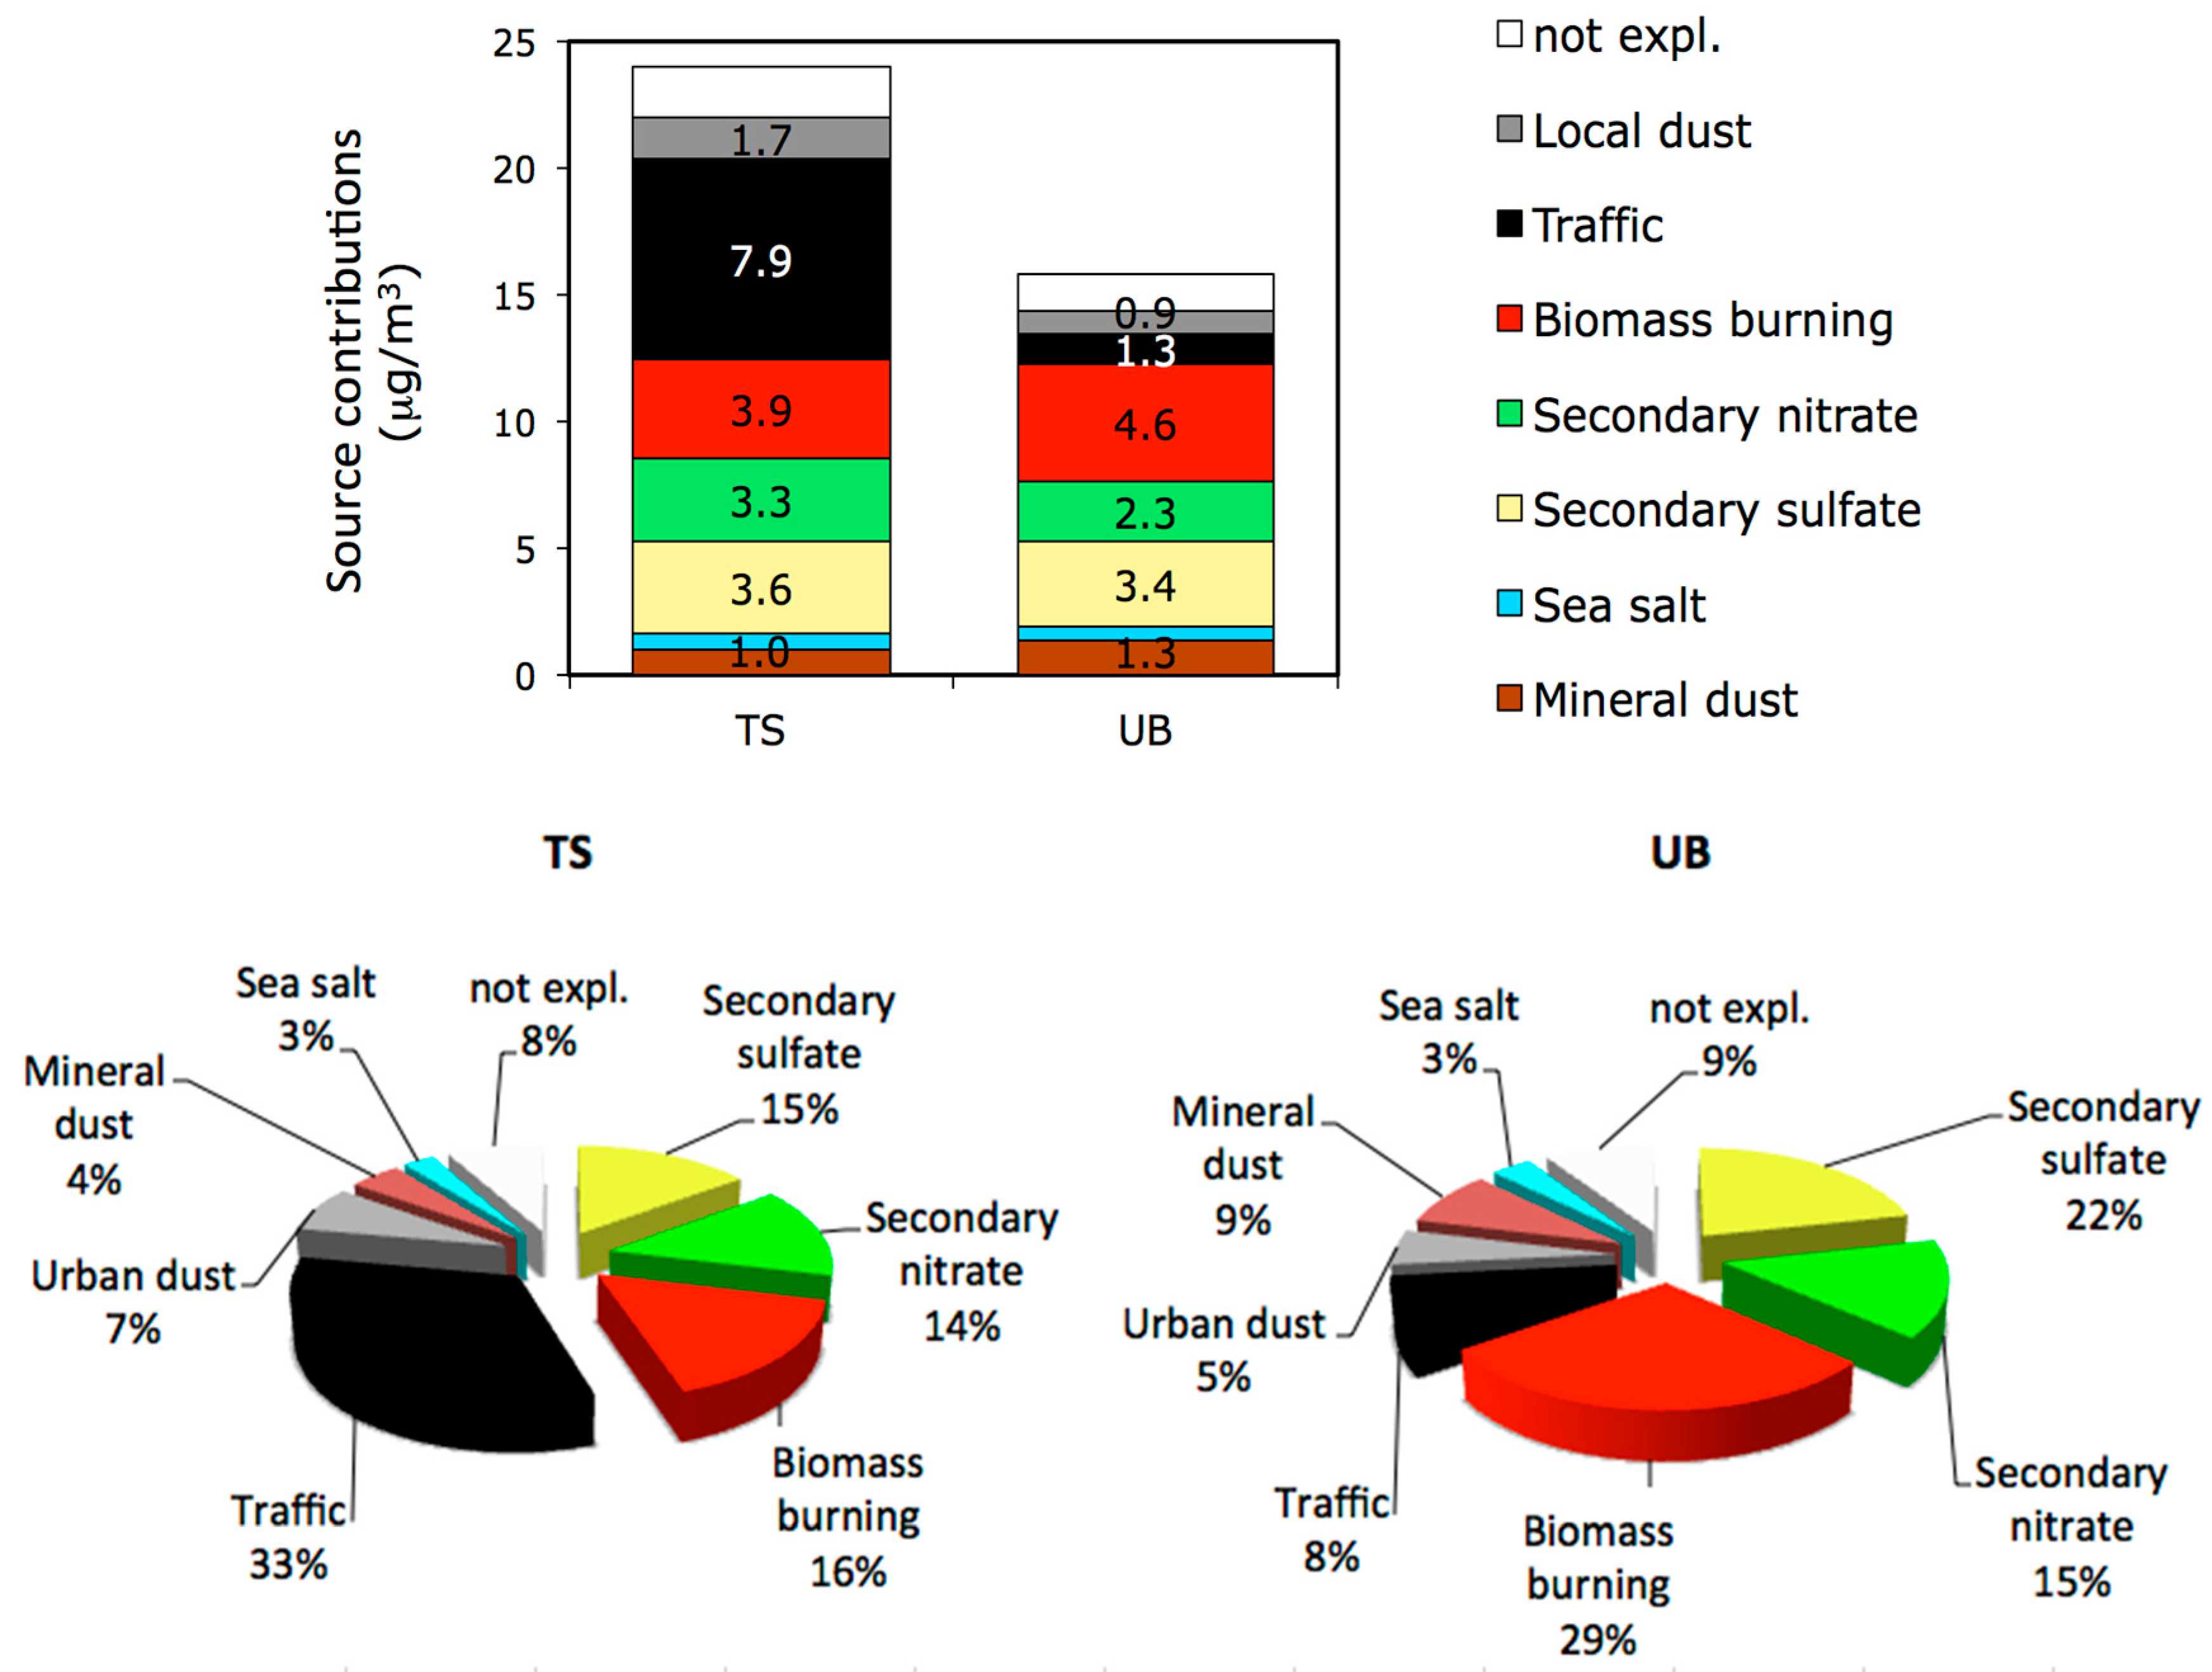
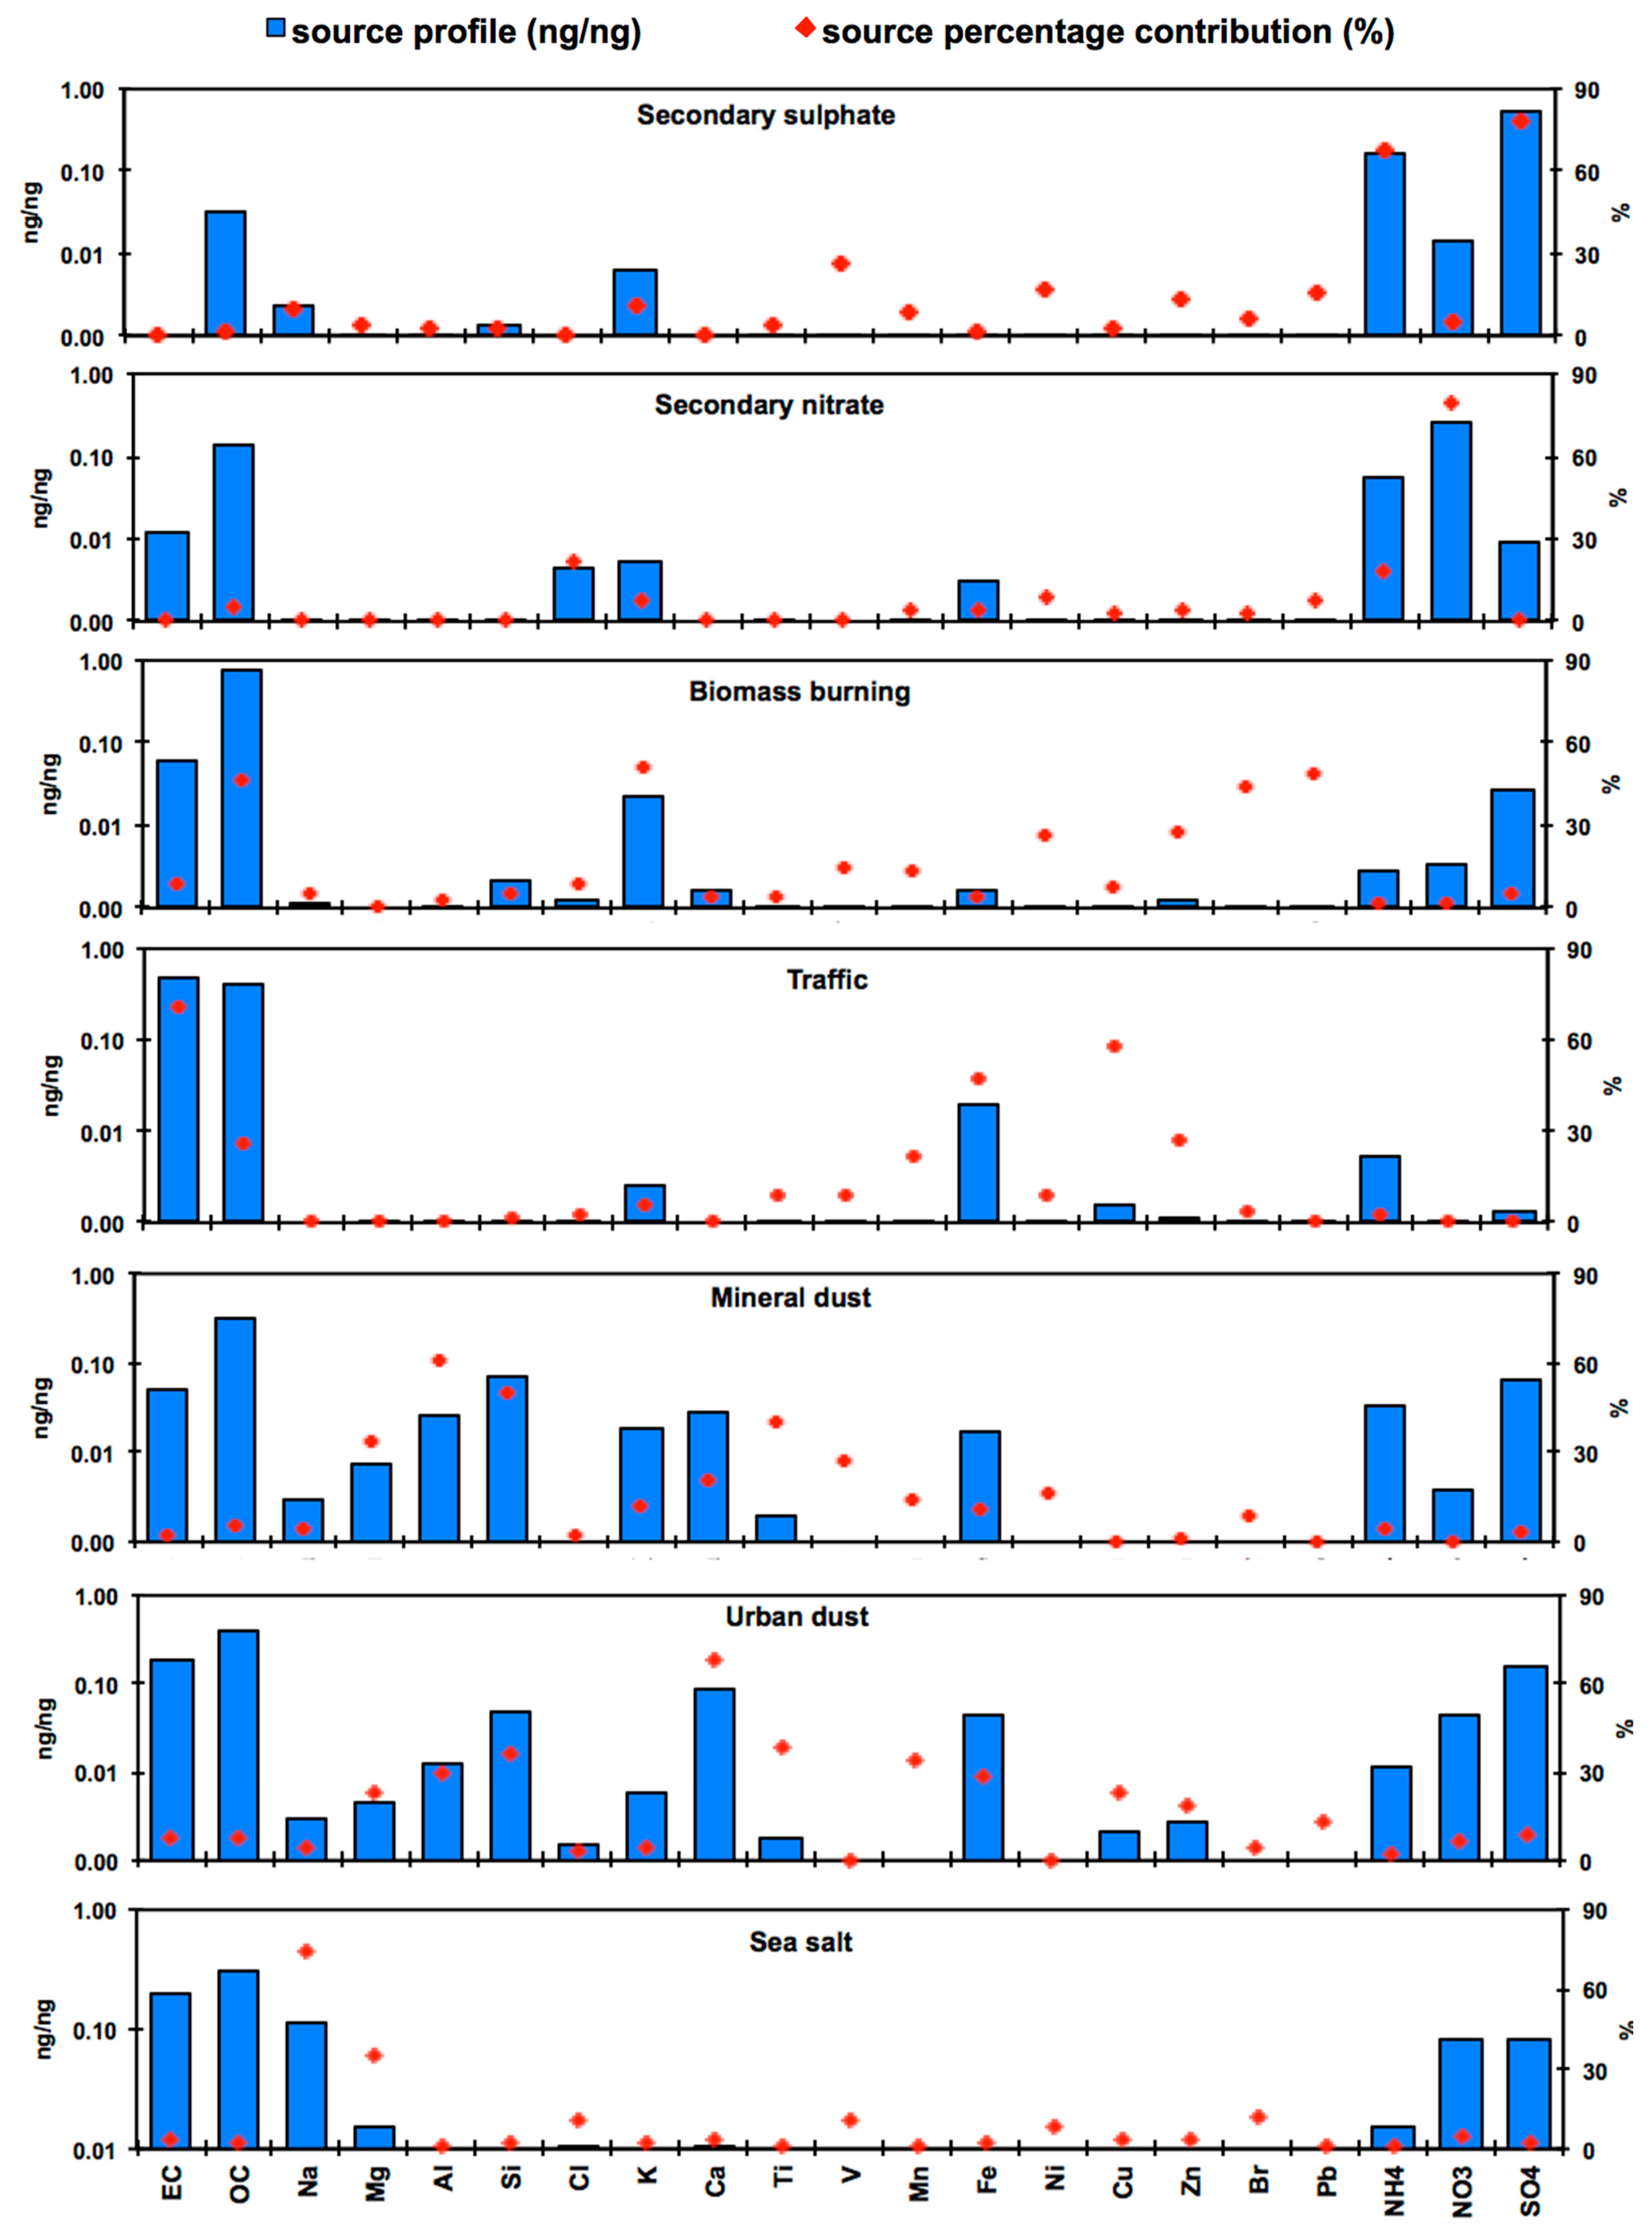
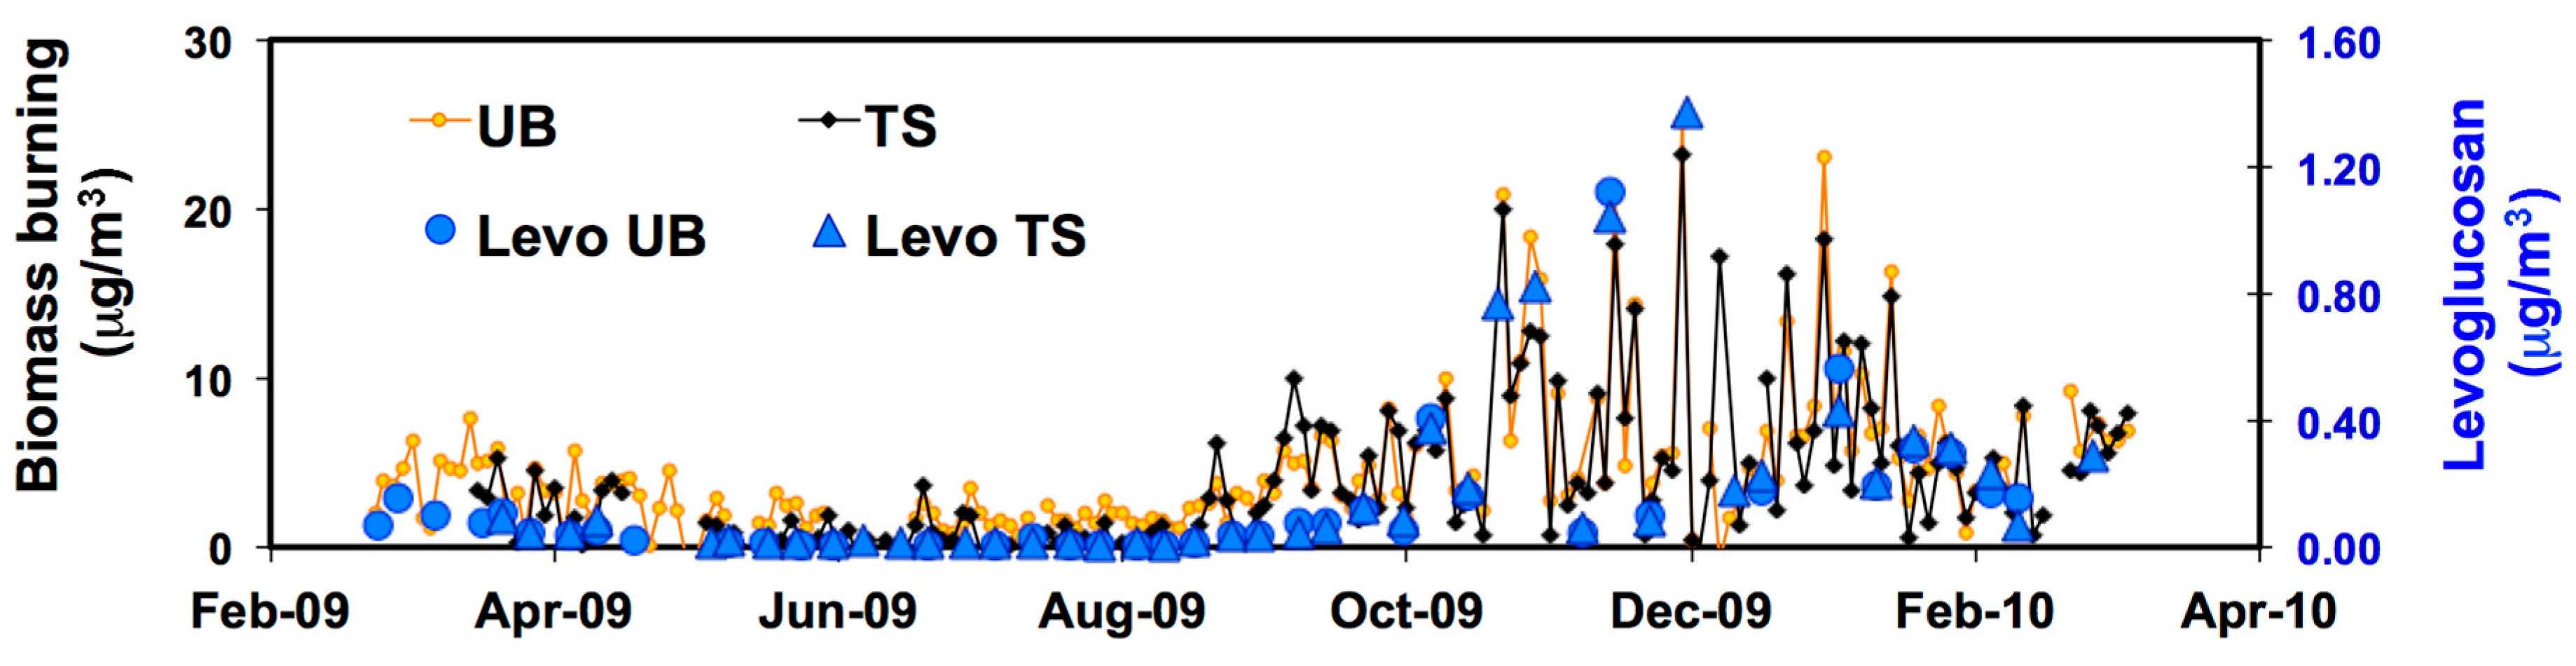
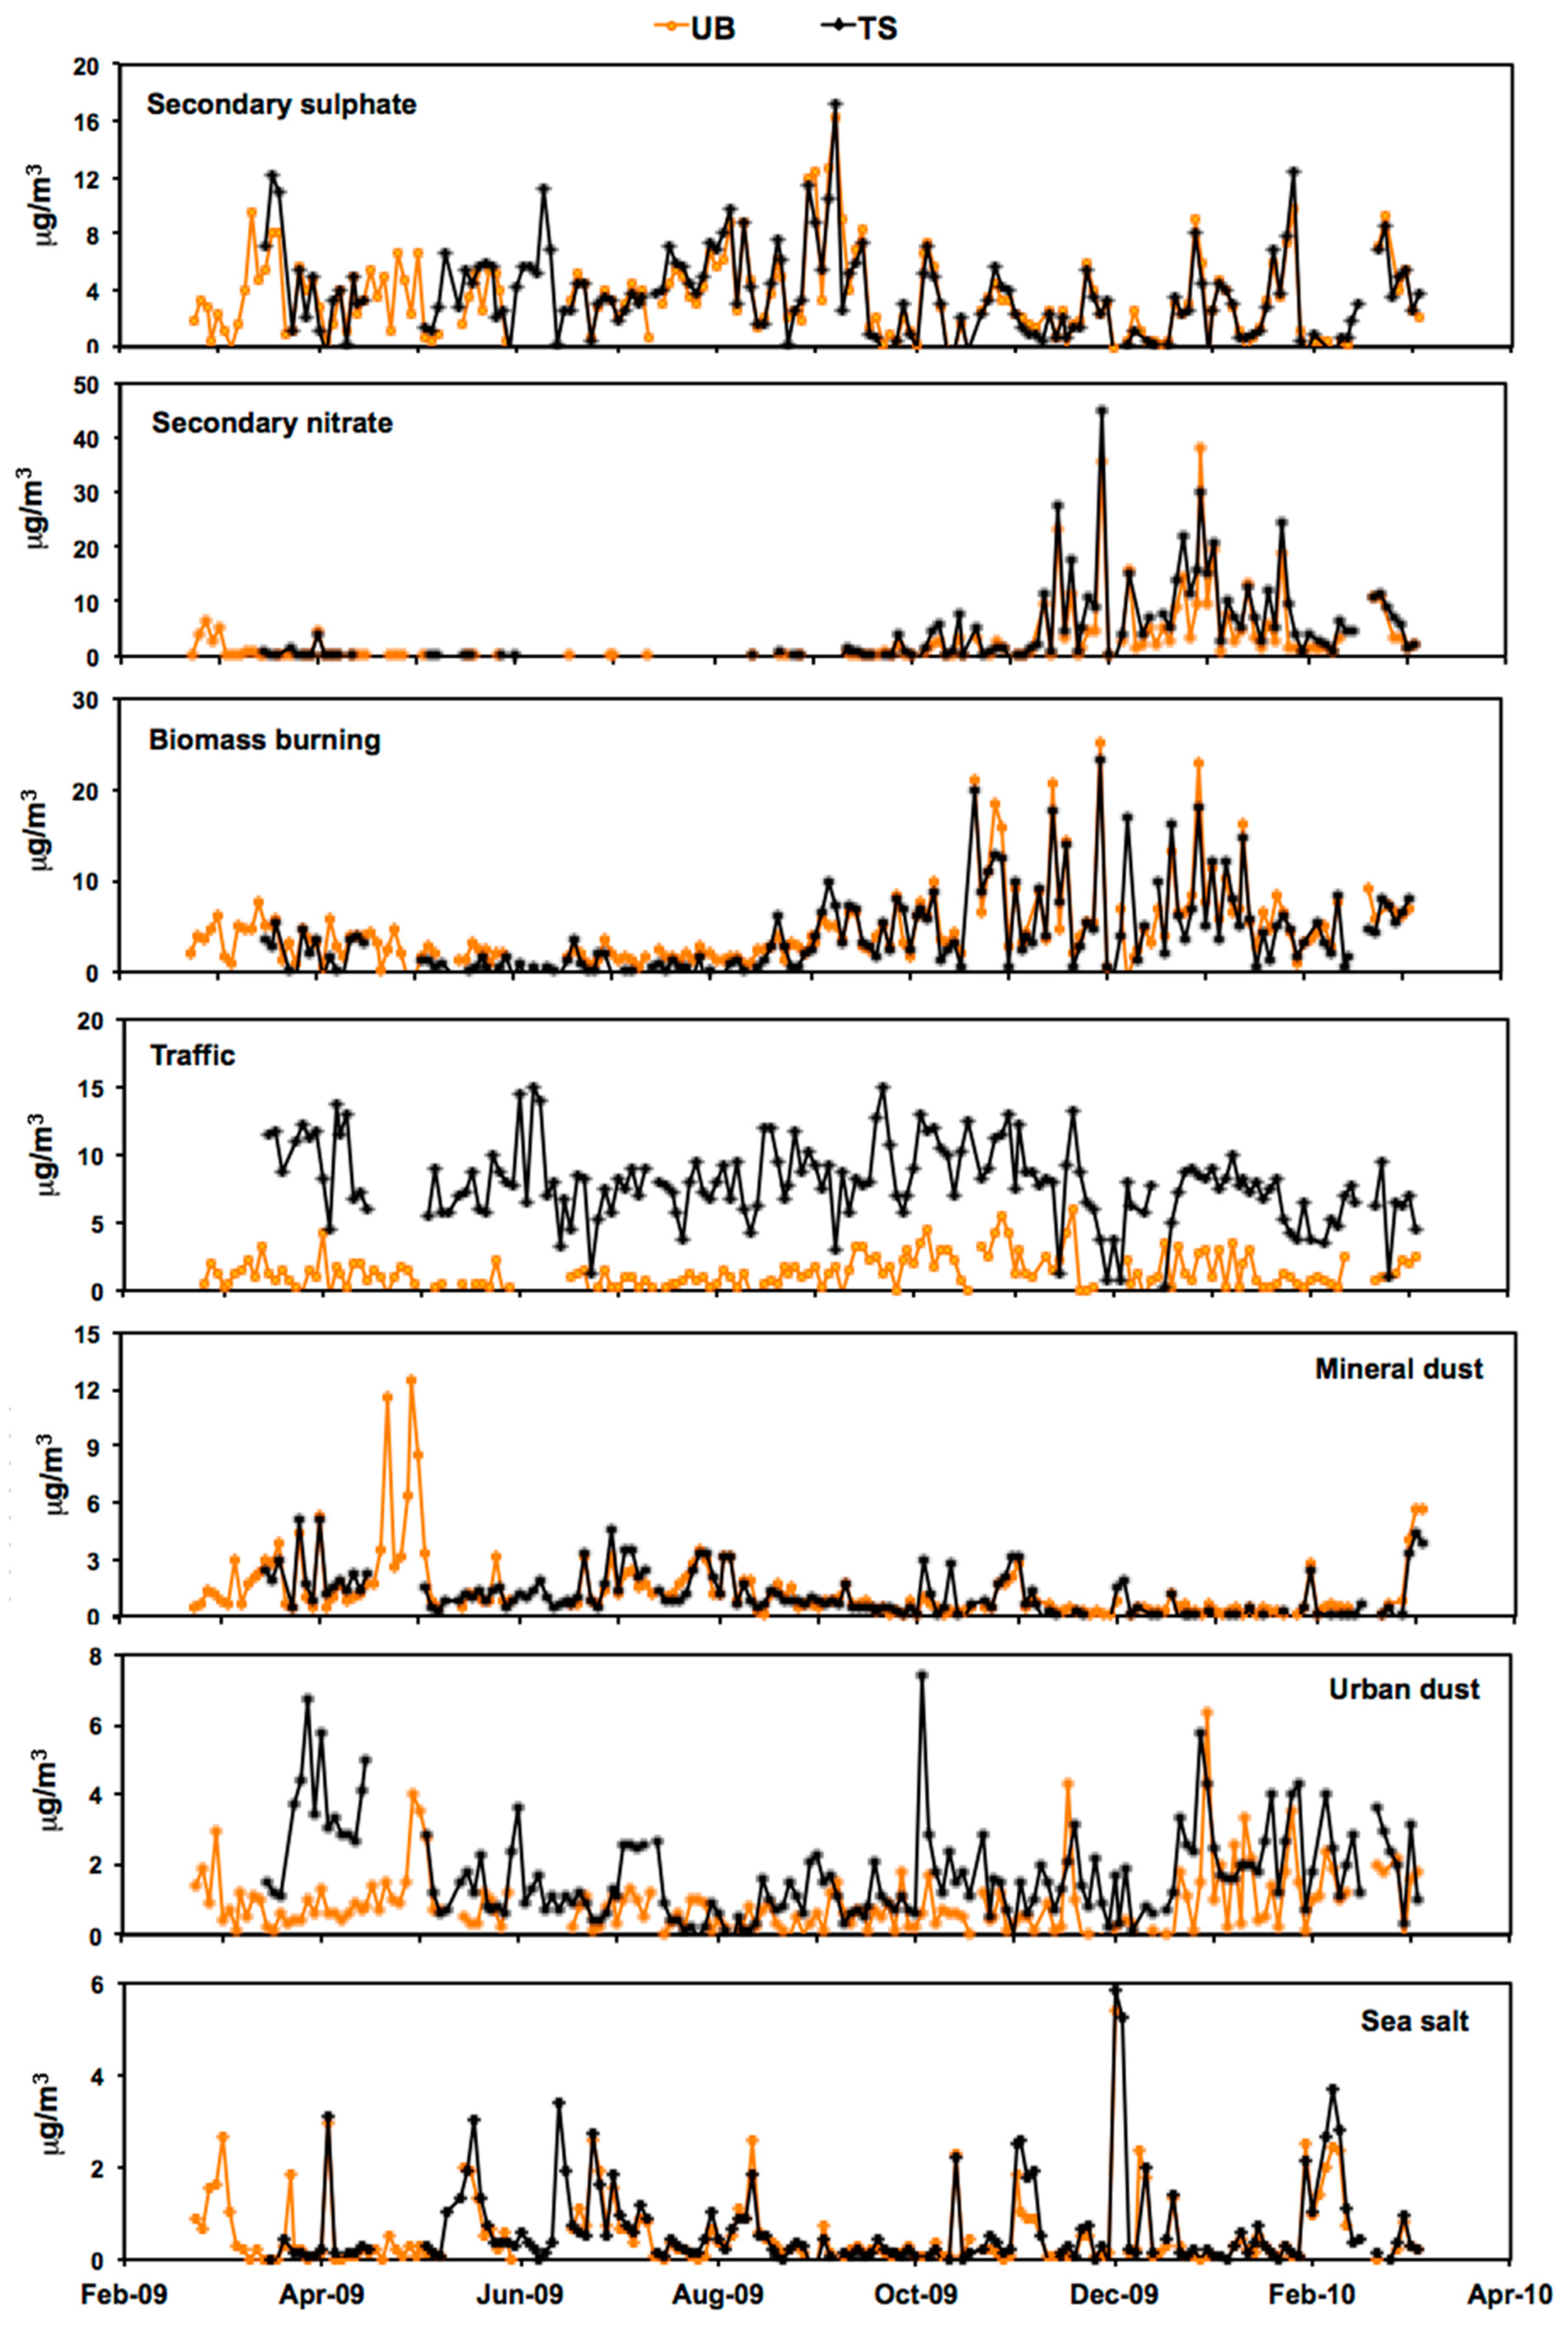
3.3. Source Apportionment

As previously explained, PMF analysis was carried out separately on the daily and the hourly data sets. In the case of the daily PM2.5 samples, data from the two sampling sites in Florence (TS and UB) were combined in a single input matrix of 21 chemical species (EC, OC; Na, Mg, Al, Si, Cl, K, Ca, Ti, V, Mn, Fe, Ni, Cu, Zn, Br, Pb; NH4+, NO3, SO42−) by 324 cases (UB: 166, TS: 158).
PMF identified seven sources: four anthropogenic i.e., traffic, biomass burning, secondary nitrates, secondary sulphates, two natural sources, i.e., mineral dust and sea salt and one mixed source, i.e., urban dust. These sources explained on average more than 90% of the total PM10 mass; a linear regression of model-reconstructed PM2.5 vs. measured PM2.5 yielded a correlation coefficient R = 0.94 with a slope of 0.95, indicating that resolved factors effectively accounted for most of the variations in PM2.5 mass concentration.
The average source apportionment is shown in Figure 4. As can be seen, the absolute contributions of the different sources at the TS and UB sites are quite similar, with the exception of the traffic component, which, as expected, is sensibly higher in the TS: in the first approximation, we can say that the difference of total PM between the two sites can be ascribed to this source. In regard to relative contributions, the TS site traffic is the main source (33%), followed by biomass burning (16%), secondary sulphate (15%), and secondary nitrate (14%), while significantly smaller contributions are given by urban dust (7%), mineral dust (4%) and sea salt (3%). In the UB site the highest percentage contribution is given by biomass burning (29%), followed by secondary sulphate (22%) and secondary nitrate (15%); traffic accounts only for 8% of the PM2.5 mass, urban dust for 5%, mineral dust for 9%, and sea salt for 3%.
Source profiles are shown in Figure 5, while the time trends of daily source contributions for UB and TS are reported in Figure 6 (gaps in the data are due to sampler malfunctioning).
The secondary sulphates source category is mainly composed of SO42- and NH4+ and it is likely associated with a regional secondary component, which originates by photochemical reactions from atmospheric SO2 [32], which is in turn mainly emitted by thermoelectric power plants, and quickly distributed on a regional scale. Daily concentrations of this source are indeed almost identical in the two sampling sites as shown in Figure 6; average values (±the st.dev. of the mean) are 3.6 ± 0.2 μg·m−3 at the TS and 3.4 ± 0.2 μg·m−3 at the UB. Similar concentrations were found in previous source apportionment studies in Tuscany [7,23,33]. Higher concentrations values were found in spring and summer periods, when, as mentioned before, the enhanced photochemistry and the higher air circulation favour the formation of secondary sulphates and their distribution on the regional area. The presence of OC suggests that sulfuric acid catalyses heterogeneous reactions of atmospheric organic carbon species when secondary sulphate is produced, resulting in the formation of secondary organic aerosols [34].
The secondary nitrate source is mainly composed of NO3, NH4+ and, to a lesser extent, OC. It is associated with a secondary component produced by local combustion processes like domestic heating and vehicular emissions, which are the main sources of NOx, which is in turn oxygenated to NO3 [32]. The time trend of this source is characterized by a very strong seasonality, with high values in winter and close to zero values in summer. As mentioned before (Section 3.2), this behaviour may be ascribed to the switch off of domestic heating during spring and summer, but also to the higher atmospheric stability and lower nitrate volatility in winter. Although the temporal pattern is the same at TS and UB sampling sites, absolute values are higher at TS (average values are 3.3 ± 0.4 μg·m−3 at TS and 2.3 ± 0.3 μg·m−3 at UB). This difference can be easily explained by the extra emission of NOx associated with traffic and measured at TS site.
The biomass burning source, mainly composed by OC and EC, is characterized by typical trace elements like K, Cl, Zn, Br and Pb. The OC/EC ratio in its profile is within the ranges reported in literature for a biomass burning source [23,35,36]. The time pattern, which is almost identical at TS and UB sites, shows a strong seasonality with higher values in winter, due to the use of biomass burning for domestic heating, and extremely low concentrations in spring and summer. This source gives a slightly higher mass contribution in the UB site (average values are 3.9 ± 0.4 μg·m−3 at TS and 4.6 ± 0.3 μg·m−3 at UB), which is a residential area near the surrounding hills; nevertheless, the similarity of the temporal trends, together with the fact that chimneys are thought to be sparse inside the city centre, point to a diffuse source in the residential area around Florence. The identification of this source as biomass burning is also confirmed by the concentration of levoglucosan, which is a specific tracer of this source. This compound was measured only for a subset of samples (84), hence it was not included in PMF, however measured concentrations were compared with the daily concentrations of the PMF source shown in Figure 7 and a good agreement was observed, with a levoglucosan/source ratio of 0.05, which is in the range reported in literature for a biomass burning source [35,36].
The traffic source is mainly composed of OC and EC and traced by specific elements like Fe, Cu and Zn that are associated with this source [5,7,10,21,36]. It includes both exhaust and nonexhaust emissions. The OC/EC ratio (0.85) is typical of primary traffic emissions [37]. This source gives a very high mass contribution at TS (7.9 ± 0.2 μg·m−3), while its weight is sensibly lower at UB (1.3 ± 0.1 μg·m−3).
The two sources, mineral dust and urban dust, are both characterized by crustal elements (Mg, Al, Si, Ca, Ti, Fe). However, while in the mineral dust profile the elemental ratios are quite similar to those reported for the continental upper crust [30], significant enrichments, especially in Ca and Fe, can be observed in the profile of the urban dust source, which is also more “contaminated” by EC, OC, sulphate and nitrate. Enrichment factors (EF), calculated with respect to Al using the average continental upper crust composition [30], in the mineral dust (MD) and in the urban dust (UB) profiles are (MD–UD): 1.0–1.4 (Mg), 0.9–1.4 (Si), 2.4–16 (Ca), 1.4–2.7 (Ti), 1.1–5.9 (Mn) and 1.0–6.0 (Fe).
The time series of the mineral dust source have a high correlation between UB and TS sampling sites shown in Figure 8, and similar absolute values (average concentration ~ 1 μg·m−3 in both sites). Intense isolated mass concentration peaks that are simultaneous in all the sampling sites characterize it. HYSPLIT back-trajectory analysis [26] revealed that these peaks occurred when air masses provenience was from the Sahara Desert area, as shown in Figure 8.
Conversely, the time series of the urban dust source is different between the two sites, with higher values at TS (average values are 1.7 ± 0.1 μg·m−3 at TS and 0.9 ± 0.1 μg·m−3 at UB). On the basis of these results, we associate the first source mainly with a natural crustal contribution from long-range transport of continental dust (especially from North Africa). The second source, on the other hand, appears to be linked to local urban dust, enriched with anthropogenic components, and resuspended by the action of vehicular traffic. In fact, in this component there are elements that can be produced by pneumatics, brakes and asphalt wear (i.e., Fe, Cu, EC, OC), while the Ca enrichment may be due to construction works.
The sea salt source, mainly characterized by Na, Mg and Cl, also includes OC, nitrates and sulphates, and is depleted of Cl, compared to the composition of sea salt. As known from the literature, the loss of Cl can be caused by heterogeneous reactions between the sodium chloride of the PM and the nitric and sulfuric acids present in the gas phase in the atmosphere [32]. The trend of this source is characterized by simultaneous peaks at TS and UB sites, in correspondence with the arrival of air masses from the sea. In any case, the average contribution is modest (~ 0.5 μg·m−3 at both sites).
PMF analysis of the RB daily data set (21 chemical species: EC, OC; Na, Mg, Al, Si, Cl, K, Ca, Ti, V, Mn, Fe, Ni, Cu, Zn, Br, Pb; NH4+, NO3, SO42− by 170 cases) identified six sources (source profiles are reported in Supplementary Materials Table S1): secondary nitrates, secondary sulphates, sea salt, mineral dust, mixed anthropogenic PM and heavy oil combustion. The mixed source, which is characterised by high loadings of OC, K, Cu, Zn and Pb, is likely due to traffic, biomass burning and other anthropogenic emissions. The heavy oil combustion source, mainly composed by OC and sulphate, is characterized by typical trace elements like Ni and V. As mentioned before, this site is partially influenced by the nearby costal activities: this source is thus likely linked to ship emissions and harbour activities. An exhaustive treatment of the sources at this site is not of interest here, but rather a use of these results to evaluate the background level for some of the sources we found at the UB and TS sites of Florence. In particular, the average concentration of the secondary sulphate source at the UB site was 3.4 μg·m−3, which is absolutely comparable with values found at TS (3.6 μg·m−3) and UB (3.4 μg·m−3), thus confirming the regional character of this source. Conversely, the average concentration of secondary nitrate at RB (0.7 μg·m−3) resulted in significantly lower values than those found at TS (3.3 μg·m−3) and UB (2.3 μg·m−3), thus confirming the local nature of this secondary source, which is linked to local NOx emissions. The contribution of the mixed anthropogenic source (2.5 μg·m−3) also resulted in a significantly lower value than the sum of the traffic, biomass burning and urban dust sources at TS (13 μg·m−3) and UB (6.8 μg·m−3). Regarding the natural sources, the contribution of the mineral dust source at the RB (0.6 μg·m−3) was lower but similar to values found for Florence, while the contribution of the sea salt source (0.7 μg·m−3) was higher at RB, as was reasonably expected, given the proximity of this site to the sea.
In this work, the combined use of the streaker sampler plus PIXE analysis allowed obtaining high-time resolved and size-segregated data, i.e., the elemental concentrations with hourly time resolution, in the fine and coarse aerosol fractions, for about 2 weeks in winter and 2 weeks in autumn. PMF analysis of the fine fraction identified the following sources: traffic, biomass burning, secondary sulphate, soil dust and sea salt. As the sampling period did not include Saharan intrusions, the analysis was not able to distinguish long range transported mineral dust from local urban dust. Moreover, as PIXE cannot detect nitrogen, the secondary nitrate source could not be identified. Furthermore, a quantitative comparison of this PMF results with those found by PMF analysis of daily samples was not possible, as sources obtained by the analysis of the hourly samples were in arbitrary units. An advanced PMF analysis, performed by the use of the multitime method, which allows combining together daily and hourly data, was applied to the TS dataset and can be found in Crespi et al., 2016 [38]. Here, results of PMF analysis of hourly samples were used to corroborate and validate the above discussed source apportionment, as the hourly temporal pattern of a factor may be extremely useful to support its interpretation as a specific aerosol source.
To this aim, the hourly temporal series of the biomass burning and traffic sources are shown in Figure 9. As can be seen, the temporal pattern of the biomass burning source exhibits daily variations with mass concentration peaks during evening and night hours. This behaviour reinforces its identification as a biomass burning source for domestic heating. The traffic source time trend shows a different periodic pattern, with peaks during traffic rush hours: an increase of this source can indeed be observed every working day morning at about 8:00 a.m. (as highlighted by the red arrows in Figure 9), while a significant reduction can be seen during Sunday (with the shift of the morning peak from 8:00 a.m. to 10:00 a.m.–11:00 a.m.).

4. Conclusions

A one-year PM source apportionment study was carried out in the urban area of Florence (Italy). This work took advantage of the simultaneous sampling at a traffic site (TS), at an urban background (UB) and at a regional background (RB) station, as well as of the combination of a one-year daily data with high-time resolution data (collected for a shorter period). Daily samples, which were analysed by different techniques to determine elements, ions and carbon fractions, allowed a reliable source apportionment by PMF and gave information on the seasonal time trend of the identified sources. The location of the three sampling sites allowed a better separation between local, urban, regional and transboundary sources. The analysis of hourly data confirmed and reinforced the source identification.
Although mean PM2.5 mass concentrations were not particularly high (TS: 23.4 μg·m−3, UB: 15.5 μg·m−3, RB: 10.0 μg·m−3), high daily PM2.5 concentrations were observed at the TS and UB sites during the cold season (with several cases above 25 μg·m−3 and peaks up to 50–80 μg·m−3), due to winter-specific sources, but also due to the Florence orographic condition and continental climate (with typical atmospheric stability and reduced height of the boundary layer in winter).
PMF identified seven main sources: traffic, biomass burning, secondary sulphate, secondary nitrates, urban dust, Saharan dust and marine aerosol. Secondary sulphate turned out to be an important PM2.5 source on a regional scale, with very similar values in all three sites (~ 3.5 μg·m−3, corresponding to 22% of PM2.5 at the UB site), thus confirming the regional character of this source, which had already been observed in previous studies in Tuscany [23]. Conversely, the weight of the secondary nitrate source showed a strong gradient from the TS (3.3 μg·m−3) to the UB (2.3 μg·m−3) and RB (0.7 μg·m−3) sites, thus confirming the local nature of this secondary source, which is linked to local NOx emissions. At the UB site this source accounts for 15% of PM2.5.
Biomass burning (for domestic heating) transpired an important PM2.5 source in Florence, with similar weights in the two city sites (~ 4 μg·m−3, corresponding to 29% of PM2.5 at the UB site). It is important to note that due to its strong seasonality, the contribution of this source is particularly high in winter, when PM concentrations are also higher. While the importance of this source’s contribution to particulate pollution has been widely demonstrated for Northern Italy [35,36,39,40,41], its impact in Central Italy has been assessed by a small number of studies [7,8,23,33].
The traffic source gave a strong contribution only at the TS site (7.9 μg·m−3, 33% of PM2.5), while it accounted only for 8% of PM2.5 at the UB site (1.3 μg·m−3). However, it should be noted that other source categories likely receive an indirect contribution from vehicular traffic. As previously mentioned, the urban dust source (which contributes for 5% of PM2.5 at the UB and 7% at the TS site) includes elements that can be produced by the wearing of pneumatics, brakes and asphalt, as well as by construction works; moreover, urban dust is likely resuspended by the action of vehicular traffic. Furthermore, it is clear that NOx produced by traffic emissions may strongly contribute to the secondary nitrate source category (we have indeed found that the weight of this source is sensibly higher at the TS).
The contribution of the “natural” components (mineral dust and marine aerosols) to PM2.5 was on average moderate (~1 μg·m−3), but it reached higher values during Saharan dust intrusions (simultaneously detected in the three sites).
These results are in good agreement with those of a PM2.5 source apportionment study carried out in the framework of the AIRUSE project [7] in 2013 in Florence at the same urban background station (the UB site here). In this work, very similar sources with comparable weights were indeed identified: secondary sulphate (4.2 μg·m−3, 30% of PM2.5), secondary nitrate (1.9 μg·m−3, 14% of PM2.5), biomass burning (2.8 μg·m−3, 20% of PM2.5), vehicle exhaust and nonexhaust (2.8 μg·m−3, 20% of PM2.5), local dust (0.3 μg·m−3, 2% of PM2.5), Saharan dust (0.2 μg·m−3, 1% of PM2.5), and fresh and aged sea salt (0.3 μg·m−3, 2% of PM2.5) [7]. Average contributions of secondary sulphate, secondary nitrate and sea salt are very similar in the two studies, and also biomass burning does not show a strong difference. The contribution of the traffic source is higher in AIRUSE, but that of local and urban dust is lower: if we note that in the current study the urban dust source partially includes contributions from vehicular traffic, the overall picture is quite similar.
Findings of this study can be used for the development of effective mitigation actions. On the basis of the source apportionment results, it can be inferred that the sole reduction of the traffic source will not be sufficient to strongly lower the PM2.5 mass concentration. An important regional background due to secondary sulphate indeed affects the PM levels in Florence, as well as a significant contribution of local biomass burning for domestic heating. The lowering of vehicle circulation could produce a reduction of not only the traffic source, but also the urban dust and secondary nitrate sources. It is also important to remember that the biomass burning and secondary nitrate sources are very high in winter when the mass of PM in Florence is also higher. To reduce the number of exceedances of the PM2.5 limit values, it is therefore important to act on these sources.

Supplementary Materials

The following are available online at https://www.mdpi.com/2073-4433/11/5/484/s1, SAMPLING SITES: maps and pictures, Table S1: data-sets.

Author Contributions

Conceptualization, S.N. and F.L.; Formal Analysis, S.N.; Investigation, S.N., R.T., M.S., F.L.; Methodology, G.C., M.C., S.N., S.B.; Measurements: S.N., M.C., M.G., S.B., M.S., R.T., F.L.; Data Curation, S.N., M.G. and G.C.; Writing—Original Draft Preparation, S.N.; Writing—Review and Editing, S.N., G.C., M.C., F.G., S.B., M.S., R.T., F.L.; Visualization, F.G., M.G.; Supervision, S.N. and F.L.; Project Administration, F.L.; Funding Acquisition, F.L. All authors have read and agreed to the published version of the manuscript.

Funding

These studies were supported by the Regional Government of Tuscany, under the PATOS project, and by INFN (Istituto Nazionale di Fisica Nucleare).

Acknowledgments

The authors acknowledge the NOAA Air Resources Laboratory (ARL) for the provision of the HYSPLIT transport and dispersion model used in this publication.

Conflicts of Interest

The authors declare no conflict of interest.

References

  1. EC (European Commission). Directive 2008/50/EC of the European Parliament and of the Council of 21 May 2008 on ambient air quality and cleaner air for Europe. Off. J. Eur. Union 2008, 152, 1–44. [Google Scholar]
  2. Pope, C.A., III; Dockery, D.W. Health effects of fine particulate air pollution: Lines that connect. J. Air Waste Manag. Assoc. 2006, 56, 709–742. [Google Scholar] [CrossRef]
  3. WHO. Review of Evidence on Health Aspects of Air Pollution—REVIHAAP Project, Technical Report; World Health Organization Regional Office for Europe: Copenhagen, Denmark, 2013. [Google Scholar]
  4. Brook, R.D.; Rajagopalan, S.; Pope, C.A., 3rd; Brook, J.R.; Bhatnagar, A.; Diez-Roux, A.V.; Holguin, F.; Hong, Y.; Luepker, R.V.; Mittleman, M.A.; et al. Particulate matter air pollution and cardiovascular disease: An update to the scientific statement from the American heart association. Circulation 2010, 121, 2331–2378. [Google Scholar] [CrossRef] [Green Version]
  5. Viana, M.; Kuhlbusch, T.A.; Querol, X.; Alastuey, A.; Harrison, R.M.; Hopke, P.K.; Winiwarter, W.; Vallius, M.; Szidat, S.; Prévôt, A.S.H.; et al. Source apportionment of PM in Europe: A review of methods and results. J. Aerosol Sci. 2008, 39, 827–849. [Google Scholar] [CrossRef]
  6. Belis, C.A.; Karagulian, F.; Amato, F.; Almeida, M.; Artaxo, P.; Beddows, D.C.S.; Bernardoni, V.; Bove, M.C.; Carbone, S.; Cesari, D.; et al. A new methodology to assess the performance and uncertainty of source apportionment models II: The results of two European intercomparison exercises. Atmos. Environ. 2015, 123, 240–250. [Google Scholar] [CrossRef]
  7. Amato, F.; Alastuey, A.; Karanasiou, A.; Lucarelli, F.; Nava, S.; Calzolai, G.; Severi, M.; Becagli, S.; Gianelle, V.L.; Colombi, C.; et al. AIRUSE-LIFE+: A harmonized PM speciation and source apportionment in 5 Southern European cities. Atmos. Chem. Phys. 2016, 16, 3289–3309. [Google Scholar] [CrossRef] [Green Version]
  8. Giannoni, M.; Martellini, T.; Del Bubba, M.; Gambaro, A.; Zangrando, R.; Chiari, M.; Lepri, L.; Cincinelli, A. The use of levoglucosan for tracing biomass burning in PM2.5 samples in Tuscany (Italy). Environ. Pollut. 2012, 167, 7–15. [Google Scholar] [CrossRef]
  9. Lucarelli, F.; Mandò, P.A.; Nava, S.; Valerio, M.; Prati, P.; Zucchiatti, A. Elemental composition of urban aerosol collected in Florence, Italy. Nucl. Instrum. Methods B 2000, 161–163, 819–824. [Google Scholar] [CrossRef]
  10. Lucarelli, F.; Mandò, P.A.; Nava, S.; Prati, P.; Zucchiatti, A. One-year Study of the Elemental Composition and Source Apportionment of PM10 Aerosols in Florence, Italy. J. Air Waste Manag. Assoc. 2004, 54, 1372–1382. [Google Scholar] [CrossRef]
  11. Vecchi, R.; Chiari, M.; D’Alessandro, A.; Fermo, P.; Lucarelli, F.; Mazzei, F.; Nava, S.; Piazzalunga, A.; Prati, P.; Silvani, F.; et al. A mass closure and PMF source apportionment study on the sub-micron sized aerosol fraction at urban sites in Italy. Atmos. Environ. 2008, 42, 2240–2253. [Google Scholar] [CrossRef]
  12. Chiari, M.; Lucarelli, F.; Migliori, A.; Nava, S.; Valli, G.; Vecchi, R.; Garcia-Orellana, I.; Mazzei, F. PIXE analysis of PM10–2.5 and PM2.5 with hourly resolution from Michelozzo’s Courtyard in Palazzo Vecchio (Florence, Italy). Nucl. Instrum. Methods B 2006, 249, 552–555. [Google Scholar] [CrossRef]
  13. Nava, S.; Becherini, F.; Bernardi, A.; Bonazza, A.; Chiari, M.; García-Orellana, I.; Lucarelli, F.; Ludwig, N.; Migliori, A.; Sabbioni, C.; et al. An integrated approach to assess air pollution threats to cultural heritage in a semi-confined environment: The case study of Michelozzo’s Courtyard in Florence (Italy). Sci. Total Environ. 2010, 408, 1403–1413. [Google Scholar] [CrossRef]
  14. Ghedini, N.; Ozga, I.; Bonazza, A.; Dilillo, M.; Cachièr, H.; Sabbioni, C. Atmospheric aerosol monitoring as a strategy for the preventive conservation of urban monumental heritage: The Florence Baptistery. Atmos. Environ. 2011, 45, 5979–5987. [Google Scholar] [CrossRef]
  15. Diapouli, E.; Manousakas, M.I.; Vratolis, S.; Vasilatou, V.; Pateraki, S.; Bairachtari, K.A.; Querol, X.; Amato, F.; Alastuey, A.; Karanasiou, A.; et al. AIRUSE-LIFE +: Estimation of natural source contributions to urban ambient air PM10 and PM2. 5 concentrations in southern Europe—Implications to compliance with limit values. Atmos. Chem. Phys. 2017, 17, 3673–3685. [Google Scholar] [CrossRef] [Green Version]
  16. Lucarelli, F.; Calzolai, G.; Chiari, M.; Nava, S.; Carraresi, L. Study of atmospheric aerosols by IBA techniques: The LABEC experience. Nucl. Instrum. Methods B 2018, 417, 121–127. [Google Scholar] [CrossRef]
  17. Lucarelli, F.; Calzolai, G.; Chiari, M.; Giannoni, M.; Mochi, D.; Nava, S.; Carraresi, L. The upgraded external-beam PIXE/PIGE set-up at LABEC for very fast measurements on aerosol samples. Nucl. Instrum. Methods B 2014, 318, 55–59. [Google Scholar] [CrossRef]
  18. Becagli, S.; Ghedini, C.; Peeters, S.; Rottiers, A.; Traversi, R.; Udisti, R.; Chiari, M.; Jalba, A.; Despiau, S.; Dayan, U.; et al. MBAS (Methylene Blue Active Substances) and LAS (Linear Alkylbenzene Sulphonates) in Mediterranean coastal aerosols: Sources and transport processes. Atmos. Environ. 2011, 45, 6788–6801. [Google Scholar] [CrossRef]
  19. Traversi, R.; Becagli, S.; Calzolai, G.; Chiari, M.; Giannoni, M.; Lucarelli, F.; Nava, S.; Rugi, F.; Severi, M.; Udisti, R. A comparison between PIXE and ICP-AES measurements of metals in aerosol particulate collected in urban and marine sites in Italy. Nucl. Instrum. Methods B 2014, 318, 130–134. [Google Scholar] [CrossRef]
  20. Giannoni, M.; Calzolai, G.; Chiari, M.; Cincinelli, A.; Lucarelli, F.; Martellini, T.; Nava, S. A comparison between thermal-optical transmittance elemental carbon measured by different protocols in PM2.5 samples. Sci. Total Environ. 2016, 571, 195–205. [Google Scholar] [CrossRef]
  21. D’Alessandro, A.; Lucarelli, F.; Mandò, P.A.; Marcazzan, G.; Nava, S.; Prati, P.; Valli, G.; Vecchi, R.; Zucchiatti, A. Hourly elemental composition and source identification of fine and coarse PM10 particulate matter in four Italian towns. J. Aerosol Sci. 2003, 34, 243–259. [Google Scholar] [CrossRef]
  22. Calzolai, G.; Lucarelli, F.; Chiari, M.; Nava, S.; Giannoni, M.; Carraresi, L.; Prati, P.; Vecchi, R. Improvements in PIXE analysis of hourly particulate matter samples. Nucl. Instrum. Methods B 2015, 363, 99–104. [Google Scholar] [CrossRef]
  23. Nava, S.; Lucarelli, F.; Amato, F.; Becagli, S.; Calzolai, G.; Chiari, M.; Giannoni, M.; Traversi, R.; Udisti, R. Biomass burning contributions estimated by synergistic coupling of daily and hourly aerosol composition records. Sci. Total Environ. 2015, 511, 11–20. [Google Scholar] [CrossRef]
  24. Paatero, P.; Tapper, U. Positive Matrix Factorization: A Non-negative Factor Model with Optimal Utilization of Error Estimates of Data Values. Environmetrics 1994, 5, 111–126. [Google Scholar] [CrossRef]
  25. Polissar, A.V.; Hopke, P.K.; Paatero, P.; Malm, W.C.; Sisler, J.F. Atmospheric aerosol over Alaska, 2. Elemental composition and sources. J. Geophys. Res. 1998, 103, 19045–19057. [Google Scholar] [CrossRef]
  26. Draxler, R.R.; Rolph, G.D. HYSPLIT (HYbrid Single-Particle Lagrangian Integrated Trajectory) Model Access via NOAA ARL READY Website. 2010. Available online: http://ready.arl.noaa.gov/HYSPLIT.php (accessed on 2 May 2020).
  27. Turpin, B.J.; Lim, H. Species Contributions to PM2.5 Mass Concentrations: Revisiting Common Assumptions for Estimating Organic Mass. Aerosol Sci. Technol. 2001, 35, 602–610. [Google Scholar] [CrossRef]
  28. Chiari, M.; Calzolai, G.; Giannoni, M.; Lucarelli, F.; Nava, S.; Becagli, S. Use of proton elastic scattering techniques to determine carbonaceous fractions in atmospheric aerosols collected on Teflon filters. J. Aerosol Sci. 2015, 89, 85–95. [Google Scholar] [CrossRef]
  29. Nava, S.; Becagli, S.; Calzolai, G.; Chiari, M.; Lucarelli, F.; Prati, P.; Traversi, R.; Udisti, R.; Vecchi, R.; Valli, G. Saharan dust impact in central Italy: An overview on three years elemental data records. Atmos. Environ. 2012, 60, 444–452. [Google Scholar] [CrossRef]
  30. Mason, B. Principles of Geochemistry, 3rd ed.; Wiley: New York, NY, USA, 1966. [Google Scholar]
  31. Ntziachristos, L.; Ning, Z.; Geller, M.D.; Sheesley, R.J.; Schauer, J.J.; Sioutas, C. Fine, ultrafine and nanoparticle trace element compositions near a major freeway with a high heavy-duty diesel fraction. Atmos. Environ. 2007, 41, 5684–5696. [Google Scholar] [CrossRef]
  32. Seinfeld, J.H. Atmospheric Chemistry and Physics of Air Pollution; Wiley: New York, NY, USA, 1986. [Google Scholar]
  33. Lucarelli, F.; Barrera, V.; Becagli, S.; Chiari, M.; Giannoni, M.; Nava, S.; Traversi, R.; Calzolai, G. Combined use of daily and hourly data sets for the source apportionment of particulate matter near a waste incinerator plant. Environ. Pollut. 2019, 247, 802–811. [Google Scholar] [CrossRef] [Green Version]
  34. Jang, M.S.; Czoschke, N.M.; Lee, S.; Kamens, R.M. Heterogeneous atmospheric aerosol production by acid- catalyzed particle-phase reactions. Science 2002, 298, 814–817. [Google Scholar] [CrossRef]
  35. Piazzalunga, A.; Belis, C.; Bernardoni, V.; Cazzuli, O.; Fermo, P.; Valli, G.; Vecchi, R. Estimates of wood burning contribution to PM by the macro-tracer method using tailored emission factors. Atmos. Environ. 2011, 45, 6642–6649. [Google Scholar] [CrossRef]
  36. Bernardoni, V.; Vecchi, R.; Valli, G.; Piazzalunga, A.; Fermo, P. PM10 source apportionment in Milan (Italy) using time-resolved data. Sci. Total Environ. 2011, 409, 4788–4795. [Google Scholar] [CrossRef] [PubMed]
  37. Hoyle, C.R.; Boy, M.; Donahue, N.M.; Fry, J.L.; Glasius, M.; Guenther, A.; Hallar, A.G.; Huff Hartz, K.; Petters, M.D.; Petaja, T.; et al. A review of the anthropogenic influence on biogenic secondary organic aerosol. Atmos. Chem. Phys. 2011, 11, 321–343. [Google Scholar] [CrossRef] [Green Version]
  38. Crespi, A.; Bernardoni, V.; Calzolai, G.; Lucarelli, F.; Nava, S.; Valli, G.; Vecchi, R. Implementing constrained multi-time approach with bootstrap analysis in ME-2: An application to PM2.5 data from Florence (Italy). Sci. Total Environ. 2016, 541, 502–511. [Google Scholar] [CrossRef] [PubMed]
  39. Bernardoni, V.; Calzolai, G.; Chiari, M.; Fedi, M.; Lucarelli, F.; Nava, S.; Piazzalunga, A.; Riccobono, F.; Taccetti, F.; Valli, G.; et al. Radiocarbon analysis on organic and elemental carbon in aerosol samples and source apportionment at an urban site in Northern Italy. J. Aerosol Sci. 2013, 56, 88–99. [Google Scholar] [CrossRef]
  40. Paglione, M.; Gilardoni, S.; Rinaldi, M.; Decesari, S.; Zanca, N.; Sandrini, S.; Giulianelli, L.; Bacco, D.; Ferrari, S.; Poluzzi, V.; et al. The impact of biomass burning and aqueous-phase processing on air quality: A multi-year source apportionment study in the Po Valley, Italy. Atmos. Chem. Phys. 2019, 20, 1233–1254. [Google Scholar] [CrossRef] [Green Version]
  41. Pietrogrande, M.C.; Bacco, D.; Ferrari, S.; Ricciardelli, I.; Scotto, F.; Trentini, A.; Visentin, M. Characteristics and major sources of carbonaceous aerosols in PM2.5 in Emilia Romagna Region (Northern Italy) from four-year observations. Sci. Total Environ. 2016, 553, 172–183. [Google Scholar] [CrossRef]
Figure 1. Particulate matter (PM)2.5 daily mass concentrations at the traffic site (TS), urban background site (UB) and rural background site (RB) sampling sites (uncertainties, which are not reported for clarity sake, are of the order of few μg·m−3).
Atmosphere 11 00484 g001
Figure 2. Annual averages of PM2.5 main components in the TS, UB and RB sampling sites.
Atmosphere 11 00484 g002
Figure 3. Seasonal averages of POM, EC, nitrate and sulphate in the TS, UB and RB sampling sites.
Atmosphere 11 00484 g003
Figure 4. PM2.5 source apportionment obtained by positive matrix factorisation (PMF): annual average contributions of the identified sources, in the TS and UB sampling sites of Florence (absolute values, above, and percentage contributions, below).
Atmosphere 11 00484 g004
Figure 5. Source profiles obtained by PMF analysis of the TS–UB data set: normalised contributions of each specie to the chemical profile of each source (ng/ng, blue bars) and average percentage contribution of each source to the concentration of each element (%, red points).
Atmosphere 11 00484 g005
Figure 6. Daily source contributions in the urban background (UB, orange dots) and traffic site (TS, black dots). Gaps are due to sampler malfunctioning.
Atmosphere 11 00484 g006
Figure 7. Daily concentrations of the Levoglucosan and of the biomass burning source in the urban background (UB) and traffic site (TS).
Atmosphere 11 00484 g007
Figure 8. Daily contributions of the mineral dust source: Days identified as Saharan intrusions on the basis of calculated backward trajectories (HSDs) are highlighted by blue circles. As an example, the HYSPLIT chart corresponding to the most intense peak is reported.
Atmosphere 11 00484 g008
Figure 9. Hourly time trend of the traffic source (at the TS site, during the autumn intensive field campaign) and of the biomass burning source (at the UB site during the winter intensive field campaign). Vertical bars correspond to midnight, while red arrows are positioned at ~ 8:00 a.m. Gaps are due to sampler malfunctioning.
Atmosphere 11 00484 g009
Table 1. Mean (± standard deviation of the mean), median, 10° and 90° percentiles of PM2.5 mass concentrations of daily samples collected in the TS, UB and RB sampling sites.
Sampling SiteNumber of SamplesMean (μg·m−3)Median (μg·m−3)10° Perc. (μg·m−3)90°perc (μg·m−3)
RB19510.0 (±0.3)9.54.816.8
UB19115.5 (±0.7)13.26.825.5
TS18023.4 (±0.8)20.814.436.1

