The Role of Weather Types in Assessing the Rainfall Key Factors for Erosion in Two Different Climatic Regions


 ,
,  , ,
, ,
Abstract
1. Introduction
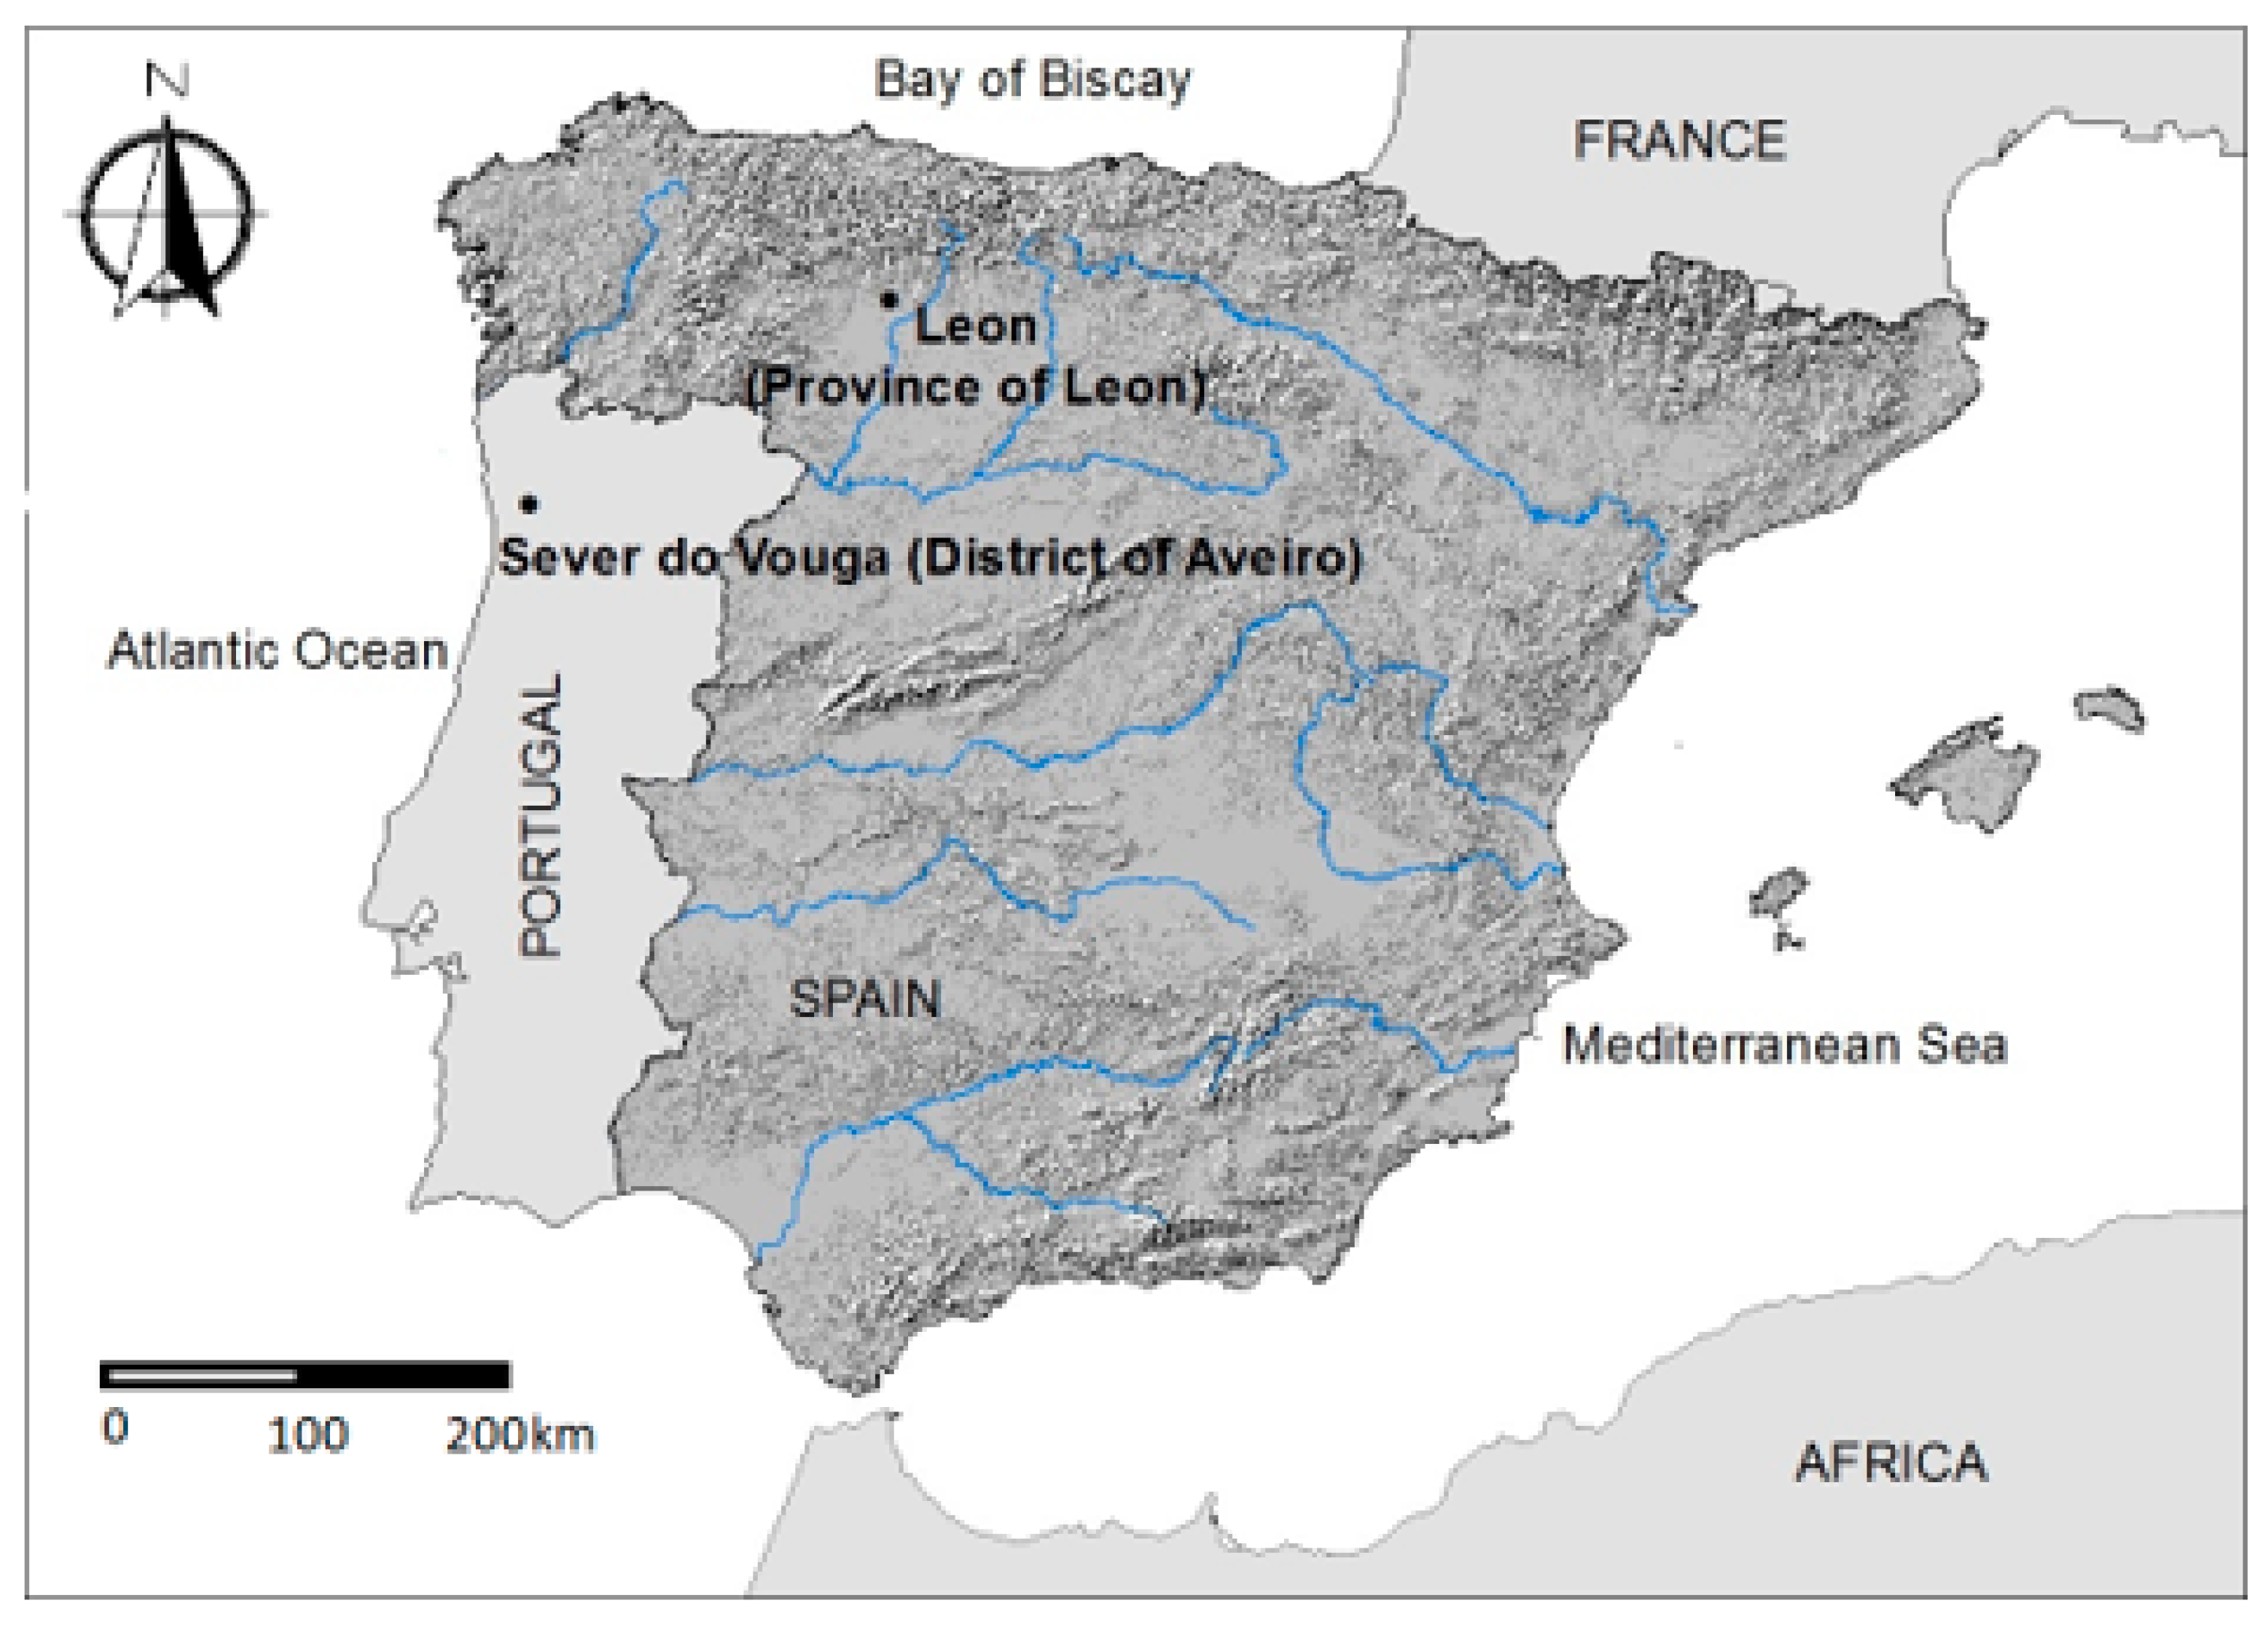
2. Experiments
3. Results and Discussions
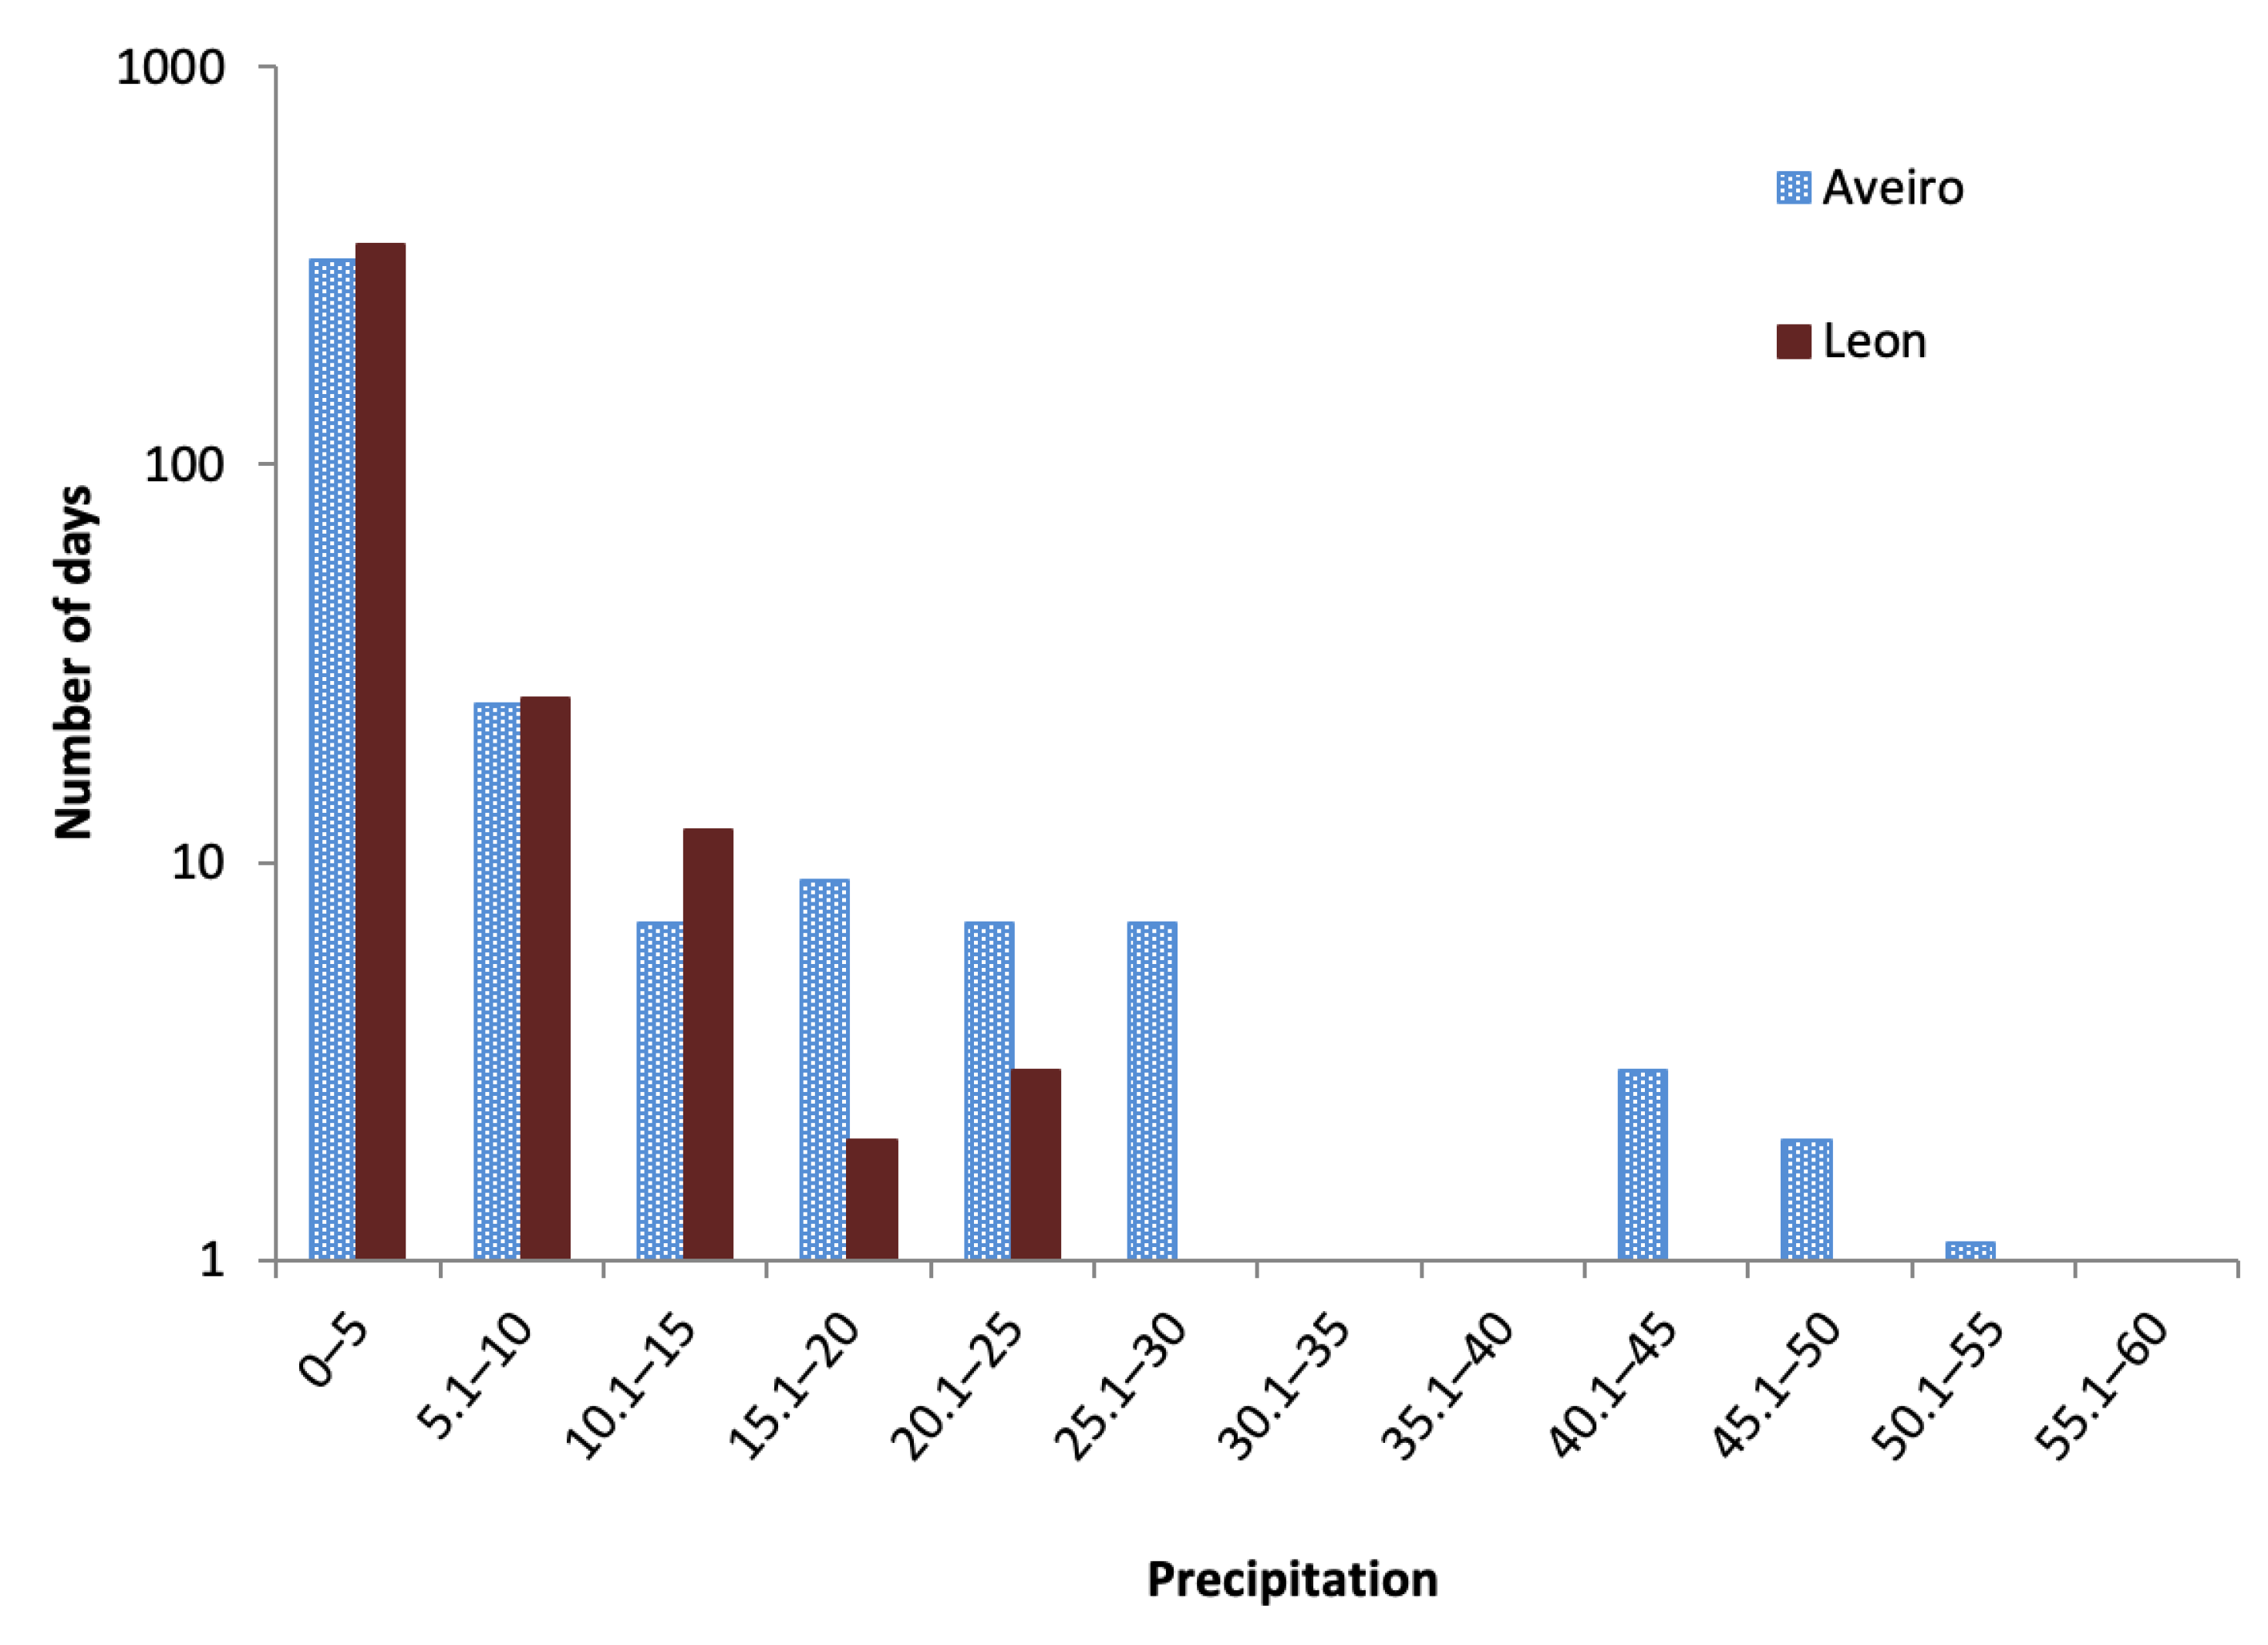
3.1. General Rainfall Characteristics
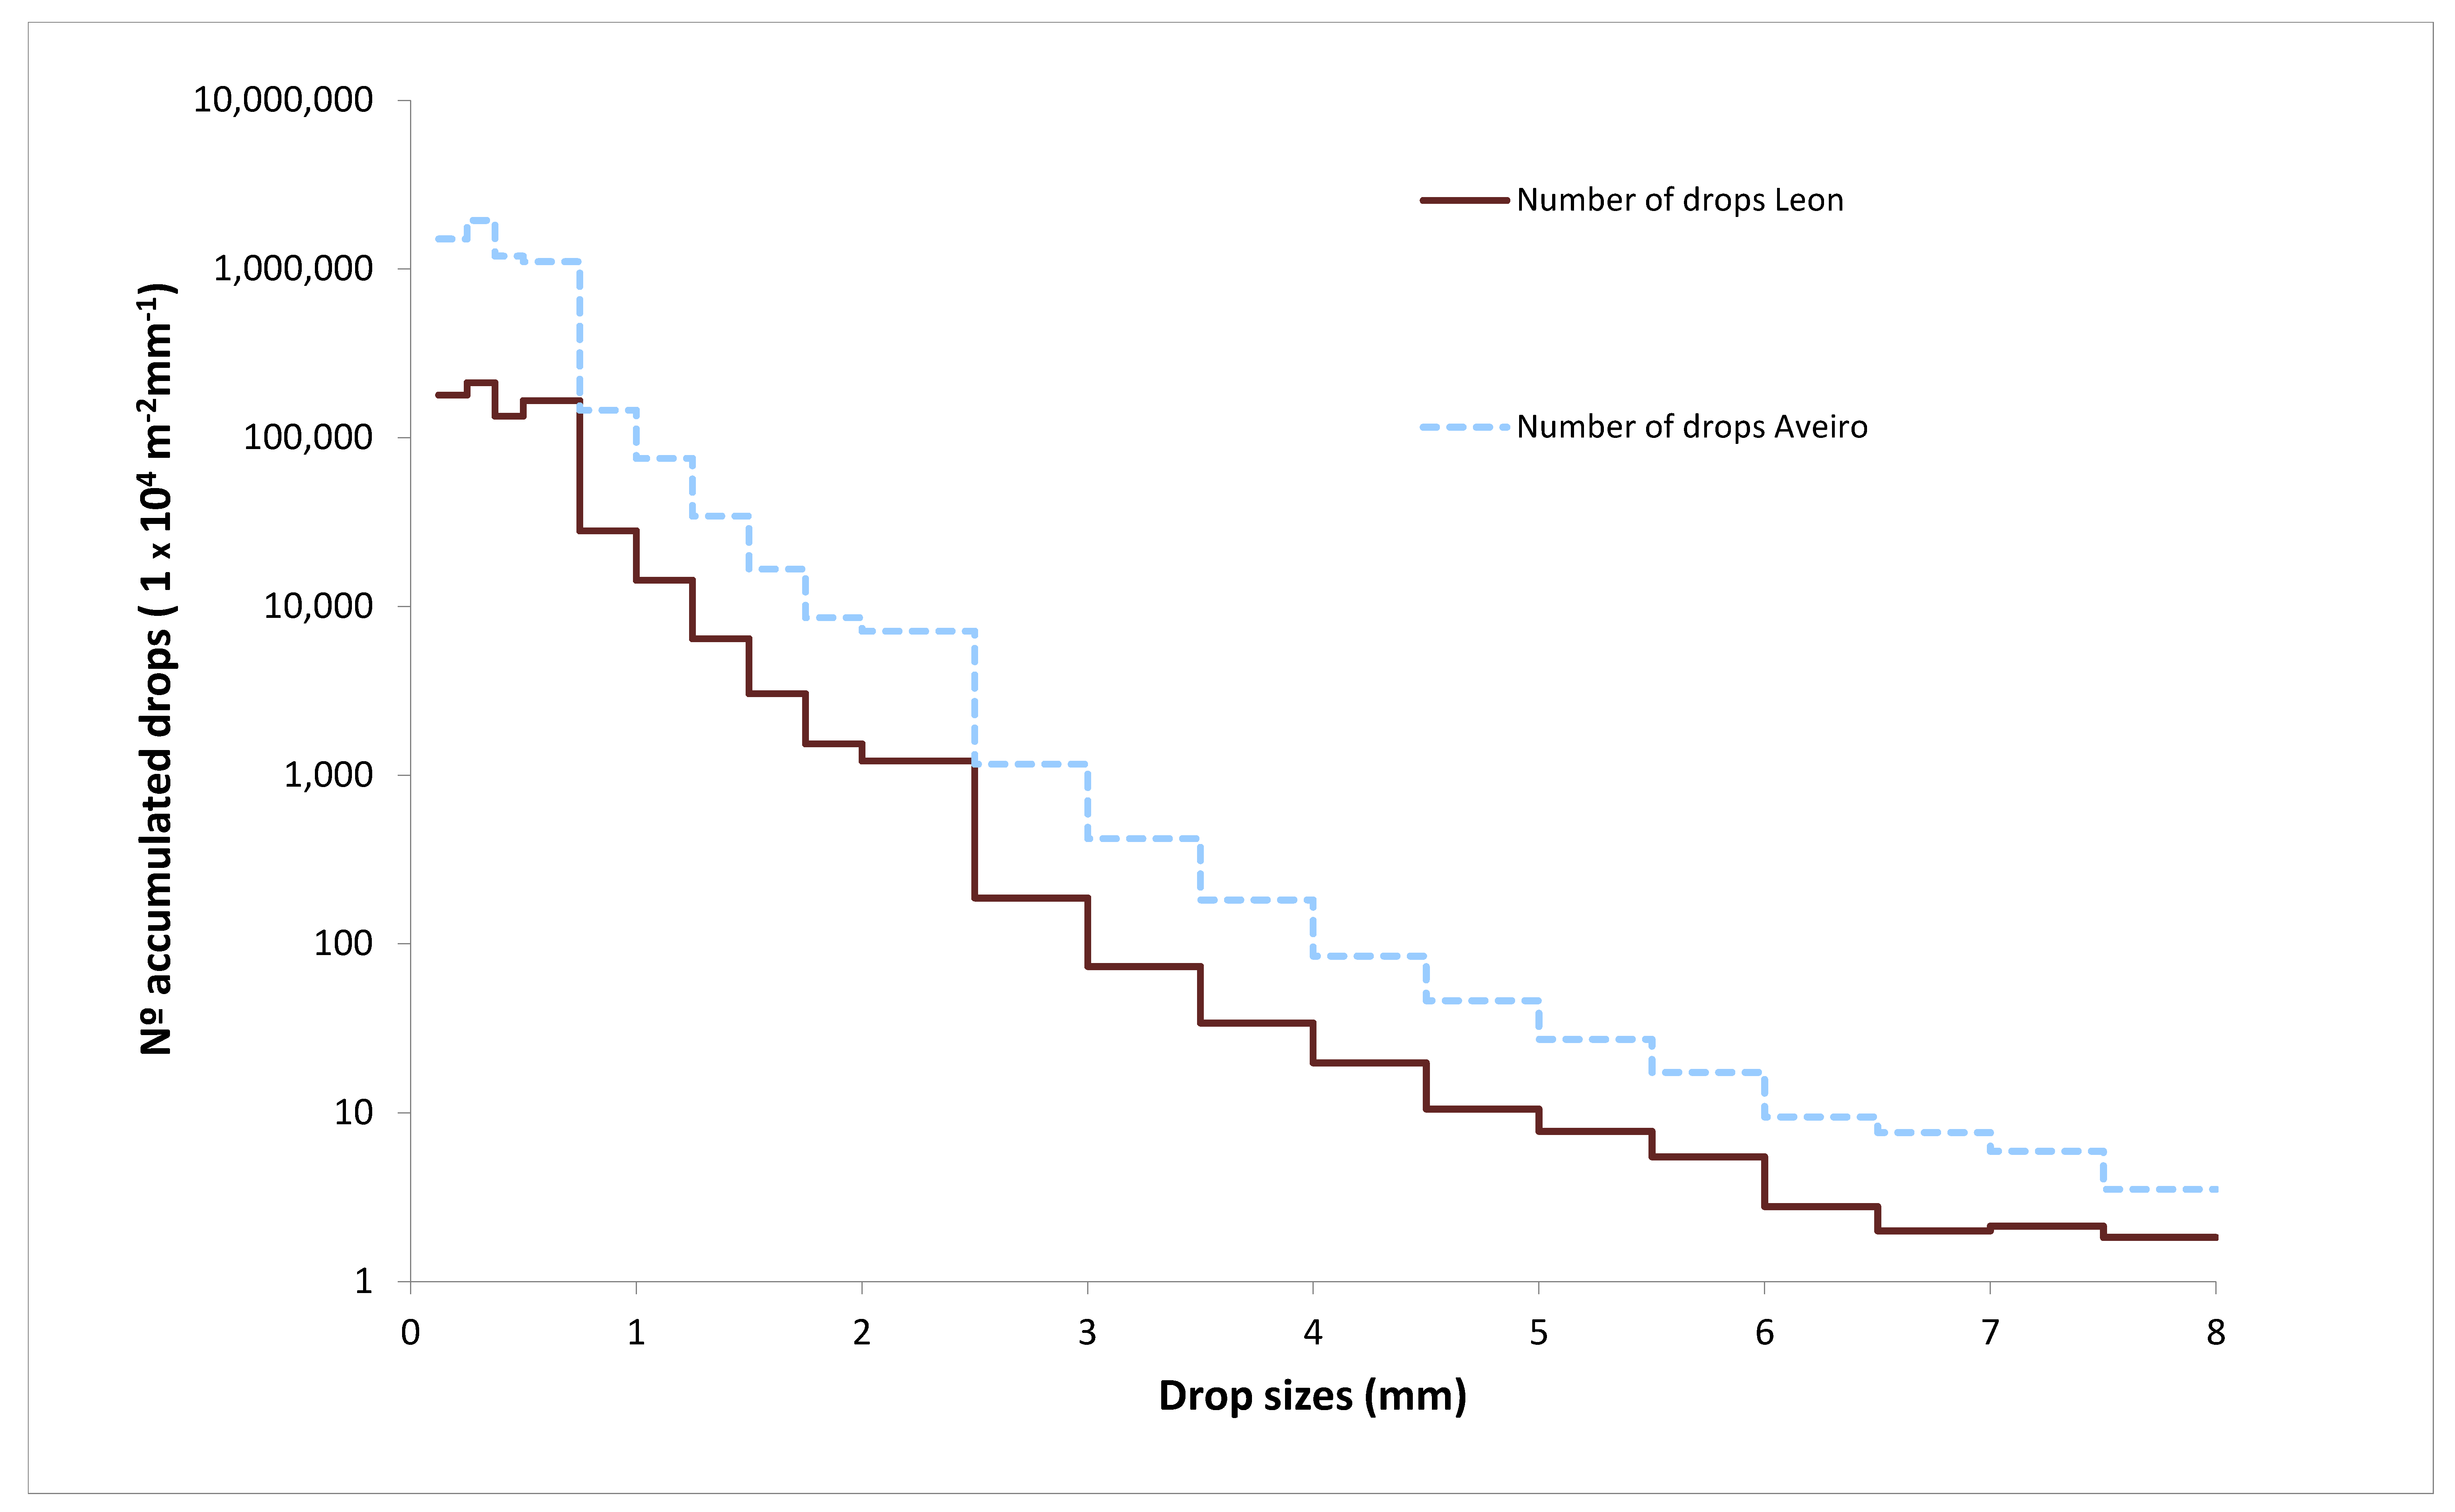
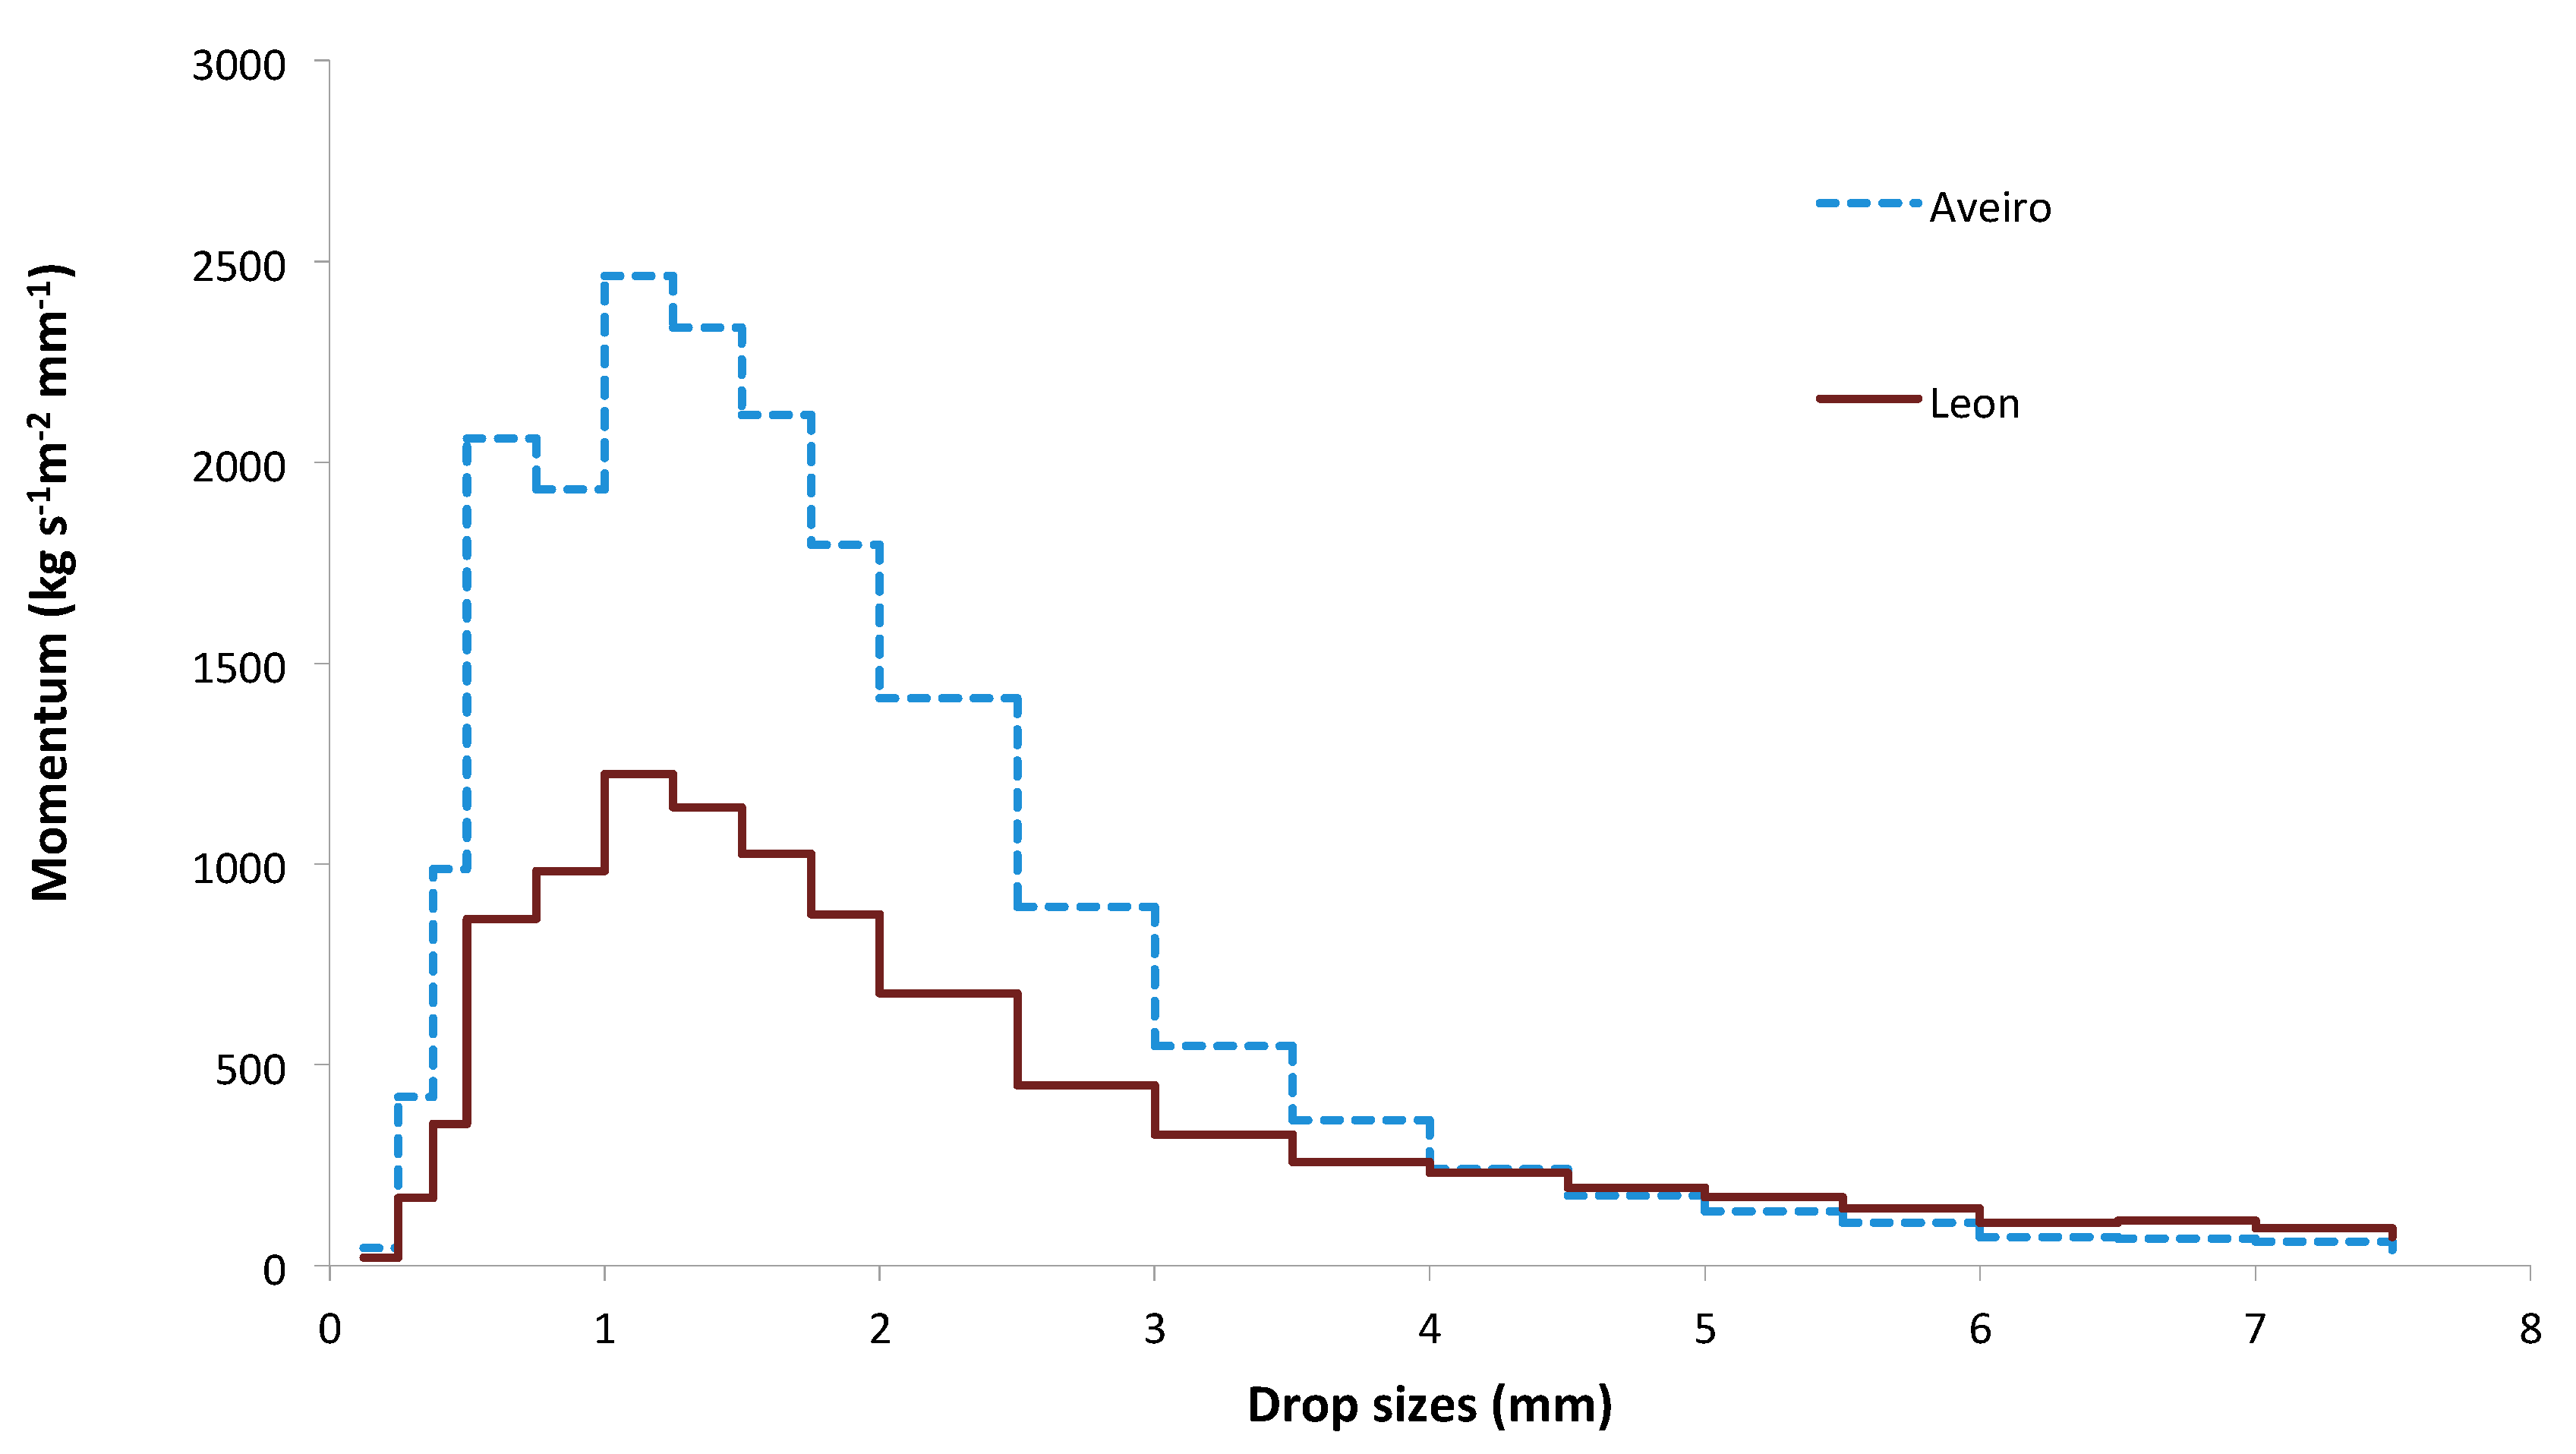
3.2. Raindrop Spectrum, Kinetic Energy and Linear Momentum
3.3. Types of Weather
4. Conclusions
Author Contributions
Funding
Acknowledgments
Conflicts of Interest
References
- Paschalidou, A.K.; Psistaki, K.; Charalampopoulos, A.; Vokou, D.; Kassomenos, P.; Damialis, A. Identifying patterns of airborne pollen distribution using a synoptic climatology approach. Sci. Total Environ. 2020, 714, 136625. [Google Scholar] [CrossRef]
- Rodrigues, M.; González-Hidalgo, J.C.; Peña-Angulo, D.; Jiménez-Ruano, A. Identifying wildfire-prone atmospheric circulation weather types on mainland Spain. Agric. For. Meteorol. 2019, 264, 92–103. [Google Scholar] [CrossRef]
- Peña-Angulo, D.; Nadal-Romero, E.; González-Hidalgo, J.C.; Albaladejo, J.; Andreu, V.; Bagarello, V.; Barhi, H.; Batalla, R.J.; Bernal, S.; Bienes, R.; et al. Spatial variability of the relationships of runoff and sediment yield with weather types throughout the Mediterranean basin. J. Hydrol. 2019, 571, 390–405. [Google Scholar] [CrossRef]
- Zwiebel, J.; Van Baelen, J.; Anquetin, S.; Pointin, Y.; Boudevillain, B. Impacts of orography and rain intensity on rainfall structure. The case of the HyMeX IOP7a event. Q. J. R. Meteorol. Soc. 2016, 142, 310–319. [Google Scholar] [CrossRef]
- Fernandez-Gonzalez, S.; del Rio, S.; Castro, A.; Penas, A.; Fernandez-Raga, M.; Calvo, A.; Fraile, R. Connection between NAO, weather types and precipitation in Leon, Spain (1948–2008). Int. J. Climatol. 2012, 32, 2181–2196. [Google Scholar] [CrossRef]
- Ramos, A.M.; Cortesi, N.; Trigo, R.M. Circulation weather types and spatial variability of daily precipitation in the Iberian Peninsula. Front. Earth Sci. 2014, 2, 1–17. [Google Scholar] [CrossRef]
- Gimeno, L.; Nieto, R.; Trigo, R.M.; Vicente-Serrano, S.M.; Lopez-Moreno, J.I. Where does the Iberian Peninsula moisture come from an answer based on a lagrangian approach. J. Hydrometeorol. 2010, 11, 421–436. [Google Scholar] [CrossRef]
- Trigo, R.M.; Pozo-Vazquez, D.; Osborn, T.J.; Castro-Diez, Y.; Gamiz-Fortis, S.; Esteban-Parra, M.J. North Atlantic Oscillation influence on precipitation, river flow and water resources in the Iberian Peninsula. Int. J. Climatol. 2004, 24, 925–944. [Google Scholar] [CrossRef]
- Cortesi, N.; Trigo, R.M.; Gonzalez-Hidalgo, J.C.; Ramos, A.M. Modelling monthly precipitation with circulation weather types for a dense net-work of stations over Iberia. Hydrol. Earth. Syst. Sci. 2013, 17, 665–678. [Google Scholar] [CrossRef]
- De Luis, M.; Brunetti, M.; Gonzalez-Hidalgo, J.; Longares, L.; Martin-Vide, J. Changes in seasonal precipitation in the Iberian Peninsula during 1946–2005. Glob. Planet. Chang. 2010, 74, 27–33. [Google Scholar] [CrossRef]
- Wetterzentrale. Available online: http://www.wetterzentrale.de (accessed on 31 October 2019).
- Angulo-Martinez, M.; Begueria, S.; Navas, A.; Machin, J. Splash erosion under natural rainfall on three soil types in NE Spain. Geomorphology 2012, 175–176, 38–44. [Google Scholar] [CrossRef]
- Iserloh, T.; Fister, W.; Seeger, M.; Willger, H.; Ries, J. A small portable rainfall simulator for reproducible experiments on soil erosion. Soil Tillage Res. 2012, 124, 131–137. [Google Scholar] [CrossRef]
- Van Dijk, A.I.J.M.; Bruijnzeel, L.A.; Rosewell, C.J. Rainfall intensity-kinetic energy relationships: A critical literature appraisal. J. Hydrol. 2002, 261, 1–23. [Google Scholar] [CrossRef]
- Thurai, M.; Bringi, V.; Manic, A.; Sekeljic, N.; Notaros, B. Investigating raindrop shapes, oscillation modes, and implications for radio wave propagation. Radio Sci. 2014, 49, 921–932. [Google Scholar] [CrossRef]
- Raupach, T.H.; Berne, A. Spatial interpolation of experimental raindrop size distribution spectra. Q. J. R. Meteorol. Soc. 2016, 142, 125–137. [Google Scholar] [CrossRef]
- Angulo-Martinez, M.; Begueria, S.; Kysely, J. Use of disdrometer data to evaluate the relationship of rainfall kinetic energy and intensity (KE-I). Sci. Total Environ. 2016, 568, 83–94. [Google Scholar] [CrossRef]
- Sanchez-Moreno, J.F.; Mannaerts, C.M.; Jetten, V.; Löffler-Mang, M. Rainfall kinetic energy–intensity and rainfall momentum–intensity relationships for Cape Verde. J. Hydrol. 2012, 454–455, 31–40. [Google Scholar] [CrossRef]
- Belo-Pereira, M.; Dutra, E.; Viterbo, P. Evaluation of global precipitation data sets over the Iberian Peninsula. J. Geophys. Res. Atmos. 2011, 116, 1–16. [Google Scholar] [CrossRef]
- Del Rio, S.; Herrero, L.; Fraile, R.; Penas, A. Spatial distribution of recent rainfall trends in Spain (1961–2006). Int. J. Climatol. 2011, 31, 656–667. [Google Scholar] [CrossRef]
- Michailidou, C.; Maheras, P.; Arseni-Papadimititriou, A.; Kolyva-Machera, F.; Anagnostopoulou, C. A study of weather types at Athens and Thessaloniki and their relationship to circulation types for the cold-wet period, part II: Discriminant analysis. Theor. Appl. Climatol. 2009, 97, 179–194. [Google Scholar] [CrossRef]
- Paredes, D.; Trigo, R.; Garcia-Herrera, R.; Trigo, I. Understanding precipitation changes in Iberia in early spring: Weather typing and storm-tracking approaches. J. Hydrometeorol. 2006, 7, 101–113. [Google Scholar] [CrossRef]
- Meteopt. Metorology Service of Portugal. 2015. Available online: http://www.meteopt.com/forum/topico/diversidade-climatica.4708/page-51 (accessed on 18 November 2015).
- Provincial council Leon, S. Clima of Leon. Diputacion de Leon. 2015. Available online: http://www.dipuleon.es/frontdipuleon/frontDipuleonAction.do?action=viewCategory&categoryName=El+clima&id=27631 (accessed on 24 December 2015).
- Fernandez-Raga, M.M.; Castro, A.; Marcos, E.; Palencia, C.; Fraile, R. Weather types and rainfall microstructure in Leon, Spain. Int. J. Climatol. 2016. [Google Scholar] [CrossRef]
- Aena. Tiempo Aeropuerto de Leon. 2015. Available online: http://www.aena.es/csee/satellite/AeropuertoLeon/es/Page/1132835453229/ (accessed on 18 November 2015).
- Font, I. Climatologia de España y Portugal; Ediciones Universidad de Salamanca: Salamanca, Spain, 2000; p. 424. [Google Scholar]
- Snirh. Sistema Nacional de Informacion de Recursos Hidricos de Portugal. 2010. Available online: http://snirh.pt (accessed on 18 November 2015).
- Fernandez-Raga, M.; Castro, A.; Palencia, C.; Calvo, A.I.; Fraile, R. Rain events on 22 October 2006 in Leon (Spain): Drop size spectra. Atmos. Res. 2009, 93, 619–635. [Google Scholar] [CrossRef]
- Trigo, R.Y.; Dacamara, C. Circulation weather types and their influence on the precipitation regime in Portugal. Int. J. Climatol. 2000, 20, 1559–1581. [Google Scholar] [CrossRef]
- Fernandez-Raga, M.; Fraile, R.; Keizer, J.J.; Teijeiro, M.E.V.; Castro, A.; Palencia, C.; Calvo, A.I.; Koenders, J.; Marques, R.L.D. The kinetic energy of rain measured with an optical disdrometer: An application to splash erosion. Atmos. Res. 2010, 96, 225–240. [Google Scholar] [CrossRef]
- Jones, P.; Osborn, T.; Harpham, C.; Briffa, K. The development of Lamb weather types: From subjective analysis of weather charts to objective approaches using reanalyses. Weather 2014, 69, 128–132. [Google Scholar] [CrossRef]
- Lamb, H. British Isles Weather types and a register of daily sequence of circulation patterns: 1861–1971. Geophys. Mem. 1972, 116, 85. [Google Scholar]
- Jenkinson, A.; Collison, F. An initial climatology of gales over the North sea. In Synoptic Climatology Branch Memorandum; Meteorological Office: London, UK, 1977. [Google Scholar]
- Cortesi, N.; Gonzalez-Hidalgo, C.; Trigo, R.; Ramos, A.M. Weather types and spatial variability of precipitation in the Iberian Peninsula. Int. J. Climatol. 2014, 34, 2661–2677. [Google Scholar] [CrossRef]
- Fernandez-Raga, M. Estudio de la Precipitacion Mediante Disdrometros. Una Aplicacion Particular: Erosion por Salpicadura. Ph.D. Thesis, University of León, León, Spain, 2012; 307p. [Google Scholar]
- Silva, I.; de Oliveira, J.; Fontes, L.; Arraes, F. Frequency distribution of rainfall for the South-Central region of Ceara, Brazil. Rev. Cienc. Agron. 2013, 44, 481–487. [Google Scholar] [CrossRef]
- Marques, R.; Mello, C.; Silva, A.; Franco, C.; Oliveira, A. Performance of the probability distribution models applied to heavy rainfall daily events.Desempenho de distribuições de probabilidades aplicadas a eventos extremos de precipitação diaria. Cienc. E Agrotecnologia 2014, 38, 335–342. [Google Scholar] [CrossRef]
- Yu, N.; Delrieu, G.; Boudevillain, B.; Hazenberg, P.; Uijlenhoet, R. Unified Formulation of Single- and Multimoment Normalizations of the Raindrop Size Distribution Based on the Gamma Probability Density Function. J. Appl. Meteorol. Climatol. 2014, 53, 166–179. [Google Scholar] [CrossRef]
- Gonzalez-Pola, C.M. Variabilidad Climatica Oceanica en la Region Sureste del Golfo de Vizcaya. Ph.D. Thesis, Instituto Español de Oceanografia, Madrid, Spain, 2008; 192p. [Google Scholar]
- Adirosi, E.; Baldini, L.; Lombardoc, F.; Russob, F.; Napolitano, F.; Volpic, E.; Tokay, A. Comparison of different fittings of drop spectra for rainfall retrievals. Adv. Water Resour. 2015, 83, 55–67. [Google Scholar] [CrossRef]
- Mariani, L.; Jimenez, J.J.; Torres, E.A.; Amezquita, E.; Decaens, T. Rainfall impact effects on ageing casts of a tropical anecic earthworm. Eur. J. Soil Sci. 2007, 58, 1525–1534. [Google Scholar] [CrossRef]
- Roldan Soriano, M. Estimacion de la energia cinetica de la lluvia a partir de la precipitacion diaria. Nueva metodologia para el calculo del factor “R”. Aplicacion en España. In Congresos Forestales; Junta de Castilla y Leon, Avila: Valladolid, Spain, 2009; pp. 1–17. ISBN 9878493685461. [Google Scholar]
- Van Dijk, A.I.J.M.; Meesters, A.G.C.A.; Bruijnzeel, L.A. Exponential distribution theory applied to splash detachment and transports experiments. J. Appl. Meteor. 2002, 18, 654–660. [Google Scholar] [CrossRef]
- Lorenzo, M.; Iglesias, I.; Taboada, J.; Gomez-Gesteira, M. Relationship between monthly rainfall in northwest Iberian Peninsula and North Atlantic sea surface temperature. Int. J. Climatol. 2010, 30, 980–990. [Google Scholar] [CrossRef]
- Romero, R.; Sumner, G.; Ramis, C.; Genoves, A. A classification of the atmospheric circulation patterns producing significant daily rainfall in the Spanish mediterranean area. Int. J. Climatol. 1999, 19, 765–785. [Google Scholar] [CrossRef]


| Lamb’s Weather Types | |||||
|---|---|---|---|---|---|
| Anticyclonic | Directional or Pure Types | Cyclonic | |||
| A | anticyclonic | C | cyclonic | ||
| ANE | anticyclonic-northeasterly | NE | northeasterly | CNE | cyclonic-northeasterly |
| AE | anticyclonic-easterly | E | easterly | CE | cyclonic-easterly |
| ASE | anticyclonic-southeasterly | SE | southeasterly | CSE | cyclonic-southwesterly |
| AS | anticyclonic-southerly | S | southerly | CS | cyclonic-southerly |
| ASW | anticyclonic-southwesterly | SW | southwesterly | CSW | cyclonic-southwesterly |
| AW | anticyclonic-westerly | W | westerly | CW | cyclonic-westerly |
| ANW | anticyclonic-northwesterly | NW | northwesterly | CNW | cyclonic-northwesterly |
| AN | anticyclonic-northerly | N | northerly | CN | cyclonic-northerly |
| Site | Number of Complete Events Detected | Average Duration | Percentage of Events According to Their Duration | Gamma Distribution | ||||
|---|---|---|---|---|---|---|---|---|
| <20 | 20–40 | 40–60 | >60 | Alfa | Beta | |||
| (min) | (min) | (min−1) | ||||||
| Aveiro | 313 | 66 | 46% | 19% | 10% | 25% | 0.523 | 0.0080 |
| Leon | 245 | 56 | 46% | 20% | 12% | 22% | 0.806 | 0.0144 |
| Characteristics of Rainfall Parameters | Aveiro | León | Aveiro | León | ||
|---|---|---|---|---|---|---|
| Average | Maximum | Average | Maximum | Total Sample | Total Sample | |
| N of drops (m−2) | 2.9 × 10⁷ | 1.3 × 10⁹ | 9.9 × 10⁶ | 2.9 × 10⁸ | 1.03 × 10¹⁰ | 3.35 × 10⁹ |
| Drop size (mm) | 0.45 | 7.75 | 0.37 | 7.75 | ||
| Cumulative precipitation (mm) | 3.25 | 55.8 | 1.28 | 25.7 | 1.14 × 10³ | 582 |
| Intensity of precipitation (mm·h−1) | 2.78 | 119 | 1.66 | 82 | ||
| Kinetic energy per unit area (J·m−2·mm−1) | 0.24 | 58.9 | 0.14 | 52 | 1.57 × 10⁴ | 9.54 × 10³ |
| Momentum (kg·m−2·s−1·mm−1) | 870 | 2464 | 452 | 1223 | 8.84 × 10³ | 3.02 × 10³ |
| Reflectivity (mm6·m−3) | 3.16 × 10³ | 1.77 × 10⁶ | 4.23 × 10³ | 1.49 × 10⁶ | ||
| Lambda (mm−1) | 2.63 | 4.8 | 3.49 | 7.11 | ||
| Lamb Classification | Parameters | Mode (mm) | |||||
|---|---|---|---|---|---|---|---|
| Aveiro | León | ||||||
| Weather Type | β (mm−1) | α | β (mm−1) | α | Aveiro | León | |
| Anticyclonic | (A) | 9.46 | 3.07 | 4.40 | 1.86 | 0.22 | 0.19 |
| Anticyclonic-easterly | (AE) | 0.84 | 0.44 | 1.24 | 0.80 | 0 | 0 |
| Anticyclonic-northerly | (AN) | 4.35 | 1.45 | 2.79 | 0.97 | 0.10 | 0 |
| Anticyclonic-northeasterly | (ANE) | 1.02 | 0.48 | 6.41 | 2.48 | 0 | 0.23 |
| Anticyclonic-northwesterly | (ANW) | 6.01 | 2.78 | 5.26 | 2.46 | 0.30 | 0.28 |
| Anticyclonic-southerly | (AS) | - | - | 2.46 | 0.97 | - | 0 |
| Anticyciclonic southeasterly | (ASE) | 0.81 | 0.88 | 0.65 | 0.71 | 0 | 0 |
| Anticyclonic-westerly | (AW) | 12.01 | 4.61 | 5.82 | 2.12 | 0.30 | 0.19 |
| Cyclonic | (C) | 3.47 | 1.74 | 5.42 | 2.27 | 0.21 | 0.23 |
| Cyclonic-easterly | (CE) | 2.81 | 1.18 | 3.79 | 1.89 | 0.06 | 0.24 |
| Cyclonic-northerly | (CN) | 6.45 | 3.16 | 3.38 | 1.64 | 0.34 | 0.19 |
| Cyclonic-northeasterly | (CNE) | 5.16 | 2.70 | 1.52 | 0.78 | 0.33 | 0 |
| Cyclonic-northwesterly | (CNW) | 4.92 | 2.96 | 7.53 | 3.96 | 0.40 | 0.39 |
| Cyclonic-southerly | (CS) | 5.76 | 2.91 | 9.49 | 4.03 | 0.33 | 0.32 |
| Cyclonic-southeasterly | (CSE) | 4.08 | 1.68 | 2.39 | 1.35 | 0.17 | 0.14 |
| Cyclonic-southwesterly | (CSW) | 3.91 | 1.96 | 5.56 | 2.90 | 0.25 | 0.34 |
| Cyclonic-westerly | (CW) | 3.03 | 1.63 | 4.91 | 2.16 | 0.21 | 0.24 |
| Northerly | (N) | 20.77 | 4.75 | 3.39 | 1.79 | 0.18 | 0.23 |
| Northeasterly | (NE) | 2.74 | 1.17 | 2.30 | 0.97 | 0.06 | 0 |
| Northwesterly | (NW) | 9.02 | 3.84 | 4.07 | 1.89 | 0.32 | 0.22 |
| Southerly | (S) | 1.44 | 0.89 | 2.32 | 1.27 | 0 | 0.12 |
| Southeasterly | (SE) | 10.60 | 3.73 | 0.38 | 0.39 | 0.26 | 0 |
| Southwesterly | (SW) | 4.43 | 2.07 | 4.16 | 1.90 | 0.24 | 0.22 |
| Westerly | (W) | 4.48 | 2.30 | 5.41 | 2.47 | 0.29 | 0.27 |
| Weather Type | Number of Days | Aveiro | Leon | ||||
|---|---|---|---|---|---|---|---|
| Kinetic Energy per Day | Kinetic Energy | Momentum | Kinetic Energy per Day | Kinetic Energy | Momentum | ||
| J/(m2 day) | J/m2 | kg m/s | J/(m2 day) | J/m2 | kg m/s | ||
| Anticyclonic | |||||||
| A | 87 | 0.02 | 1.95 | 1.31 | 0.02 | 1.65 | 0.72 |
| AE | 9 | 0.17 | 1.55 | 0.38 | 0.35 | 3.11 | 0.80 |
| AN | 14 | 0.01 | 0.14 | 0.06 | 0.57 | 7.99 | 2.92 |
| ANE | 21 | 0.10 | 2.18 | 0.55 | 0.01 | 0.17 | 0.09 |
| ANW | 11 | 1.87 | 20.57 | 10.01 | 0.26 | 2.88 | 1.32 |
| ASE | 8 | 0.57 | 4.55 | 1.07 | 0.12 | 0.97 | 0.23 |
| AW | 11 | 2.09 | 22.98 | 15.92 | 0.76 | 8.38 | 4.32 |
| Cyclonic: | |||||||
| C | 21 | 6.01 | 126.28 | 47.63 | 1.22 | 25.71 | 12.33 |
| CE | 7 | 1.91 | 13.35 | 4.75 | 3.76 | 26.35 | 10.32 |
| CN | 2 | 27.36 | 54.71 | 26.87 | 5.81 | 11.62 | 4.36 |
| CNE | 7 | 0.83 | 5.83 | 2.56 | 3.76 | 26.31 | 7.30 |
| CNW | 1 | 50.49 | 50.49 | 20.84 | 5.17 | 5.17 | 2.62 |
| CS | 3 | 1.46 | 4.39 | 2.04 | 1.63 | 4.88 | 2.95 |
| CSE | 3 | 4.29 | 12.86 | 5.44 | 12.66 | 37.98 | 12.11 |
| CSW | 4 | 43.03 | 172.12 | 68.25 | 15.72 | 62.89 | 28.49 |
| CW | 2 | 126.77 | 253.55 | 89.22 | 17.13 | 34.27 | 15.50 |
| Pure: | |||||||
| N | 16 | 0.00 | 0.04 | 0.05 | 2.30 | 36.80 | 13.59 |
| NE | 55 | 0.05 | 2.77 | 0.97 | 0.12 | 6.69 | 2.19 |
| NW | 10 | 4.46 | 44.59 | 26.42 | 2.63 | 26.26 | 10.79 |
| S | 2 | 0.39 | 0.78 | 0.21 | 20.97 | 41.95 | 13.29 |
| SE | 13 | 0.11 | 1.42 | 0.97 | 0.91 | 11.89 | 2.70 |
| SW | 8 | 12.25 | 98.02 | 41.72 | 3.98 | 31.80 | 13.24 |
| W | 20 | 8.94 | 178.77 | 74.55 | 1.16 | 23.29 | 10.88 |
© 2020 by the authors. Licensee MDPI, Basel, Switzerland. This article is an open access article distributed under the terms and conditions of the Creative Commons Attribution (CC BY) license (http://creativecommons.org/licenses/by/4.0/).
Share and Cite
Fernández-Raga, M.; Fraile, R.; Palencia, C.; Marcos, E.; Castañón, A.M.; Castro, A. The Role of Weather Types in Assessing the Rainfall Key Factors for Erosion in Two Different Climatic Regions. Atmosphere 2020, 11, 443. https://doi.org/10.3390/atmos11050443
Fernández-Raga M, Fraile R, Palencia C, Marcos E, Castañón AM, Castro A. The Role of Weather Types in Assessing the Rainfall Key Factors for Erosion in Two Different Climatic Regions. Atmosphere. 2020; 11(5):443. https://doi.org/10.3390/atmos11050443
Chicago/Turabian StyleFernández-Raga, María, Roberto Fraile, Covadonga Palencia, Elena Marcos, Ana María Castañón, and Amaya Castro. 2020. "The Role of Weather Types in Assessing the Rainfall Key Factors for Erosion in Two Different Climatic Regions" Atmosphere 11, no. 5: 443. https://doi.org/10.3390/atmos11050443
APA StyleFernández-Raga, M., Fraile, R., Palencia, C., Marcos, E., Castañón, A. M., & Castro, A. (2020). The Role of Weather Types in Assessing the Rainfall Key Factors for Erosion in Two Different Climatic Regions. Atmosphere, 11(5), 443. https://doi.org/10.3390/atmos11050443