Article

Clear Night Sky Polarization Patterns Under the Super Blue Blood Moon

1
School of Automation Science and Electrical Engineering, Beihang University, Beijing 100191, China
2
School of Instrumentation and Optoelectronics Engineering, Beihang University, Beijing 100191, China
3
Beijing Advanced Innovation Center for Big Data-Based Precision Medicine, Beihang University, Beijing 100191, China
*
Author to whom correspondence should be addressed.
Atmosphere 2020, 11(4), 372; https://doi.org/10.3390/atmos11040372
Submission received: 24 February 2020 / Revised: 25 March 2020 / Accepted: 2 April 2020 / Published: 10 April 2020
(This article belongs to the Section Atmospheric Techniques, Instruments, and Modeling)

Abstract

:
Investigating celestial polarization patterns in the case of different environments is important for exploring the atmospheric radiative transfer mechanism. Although intensive studies on clear sky, foggy sky, and even total solar eclipse sky have been conducted, the polarization distribution generated by the moonlight has not been well investigated. This study analyzes celestial polarization patterns generated by the Super Blue Blood Moon (SBBM) through several comparative studies. The polarization patterns under the SBBM are collected, analyzed, and compared with both those generated by the ideal single-scattering Rayleigh model and those in the normal sky. From the analysis of the relative variation of the celestial polarization characteristics including the Degree of Polarization (DoP) and Angle of Polarization (AoP), the changes of the extremum, frequency, symmetric line, and neutral points are discussed. As a result, SBBM polarization patterns change at the beginning of the partial eclipse, and the neutral points vary from traditional neutral points. The value of DoP gradually decreases as the obscuration ratio of the Moon increases. The AoP is no longer symmetrical about the celestial meridian. As a conclusion, it is suggested that the variation of the polarized skylight during the SBBM should be considered in atmospheric model calculation for nocturnal biological activity and navigation information computation.

Graphical Abstract

1. Introduction

Caused by atmospheric scattering, skylight polarization significantly impacts biological orientation [1,2,3]. Many animals, including bees [4], bats [5], spiders [6,7], and dung beetles [8], can sense the polarized light generated by sunlight or moonlight. The polarized light serves as a compass cue [9,10]. In other applications, skylight polarization is a viable option for navigation [11,12] and remote sensing [13,14]. It is commonly used to obtain the attitude and position of carriers [15] and to detect atmospheric composition or optical properties [16,17]. Recently, atmospheric polarization applications have expanded to include atmospheric sunlit sky polarization [18], in-water polarization [19,20], and moonlit sky polarization [21,22].
In measuring skylight polarization, the influence of different environmental factors (e.g., cloud and fog) [23] must be considered. This is integral to investigations in polarized radiance distribution. A radiative transfer model based on the measurement of the intensity, color, and polarization of sky during a total solar eclipse was developed by [24]. The effects of different aerosol particles on celestial polarization patterns were investigated in [25] by using the radiative transfer model. Furthermore, the polarization was used for aerosol retrieval [26,27,28] as it was able to provide more information than intensity. Other than that, the relationship between aerosol optical thickness and clouds with the stability of celestial polarization patterns was investigated in [29]. Sky polarization patterns have been detected not only under a clear sky [30], but also under a foggy sky [31] and an overcast sky [32]. Studies indicated that the Angle of Polarization (AoP) was a very robust pattern under all possible sky conditions, whereas the Degree of Polarization (DoP) differed considerably from that of corresponding clear sky.
Polarization patterns exist in various conditions. This includes environmental variation, as well as light source variation. In 2001, the polarization patterns of the moonlit sky were investigated [33]. The main polarization characteristics (DoP and AoP) in the sunlit sky and moonlit sky were compared. It was found that celestial polarization patterns were practically identical if the zenith angle of the Moon was identical to that of the Sun. In 2011, lunar skylight polarization signals polluted by urban lighting were studied [34]. As a result, lunar skylight was clearly visible at 28 km away from the urban center of light pollution. Recently, a study on the skylight polarization patterns of both sunlit and moonlit skies over the ocean was performed [35]. These experiments showed that celestial polarization patterns over the sea had extremely similar patterns to those over the land.
The above studies demonstrated the stability of celestial polarization patterns among varying environments, varying light sources, and varying locations. In contrast, during a total solar eclipse, variant polarization characteristics were observed. The DoP and AoP were considerably different, and the neutral point of skylight polarization near the zenith existed during totality [36,37,38]. To further investigate the differences in celestial patterns, this study addresses the polarization patterns of a special phenomenon, the Super Blue Blood Moon (SBBM).
The SBBM is a spectacular natural phenomenon that takes place when the blue Moon (the second Full Noon in a calendar month), Super Moon (the Moon is closer to its perigee), and Blood Moon (the typical red color of the Moon during a total lunar eclipse) occur simultaneously. During this phenomenon, the Moon is sheltered by the Earth for several hours. Underlying celestial polarization patterns vary according to the illuminant. Several studies on nocturnal animal behaviors during a lunar eclipse were conducted. The hunting activity of bats was significantly higher during the lunar eclipse than before and after when the Full Moon was visible [39,40]. A series of behavioral experiments confirmed that a total lunar eclipse could cause abrupt cessation of the red-fronted lemurs’ activity [41]. The vertical migration of Meganyctiphanes norvegica was also influenced during the lunar eclipse [42]. Adult mosquito flight activity was monitored during a total eclipse of the Moon. It was observed that the numbers of each species changed during the lunar eclipse [43]. Therefore, the lunar eclipse has an effect on the creatures’ activities. However, few works exist on the celestial polarization patterns specifically under the SBBM. The polarization properties investigated during solar eclipses [24,44] can inform investigations surrounding the SBBM and have provided a foundational background for this investigation. This study aims to identify changes in polarization patterns during the SBBM and compare these to patterns under a normal sky.
To investigate the polarization patterns generated by the SBBM, polarization data were collected with a polarimetric camera. The variation in celestial polarization patterns was recorded, from the beginning of the partial eclipse to its end. The polarization characteristics were then simulated based on the single-scattering Rayleigh model [45], according to the locational environment of the experimental data. The divergence of the polarization patterns under the SBBM from those of the theoretical model was then considered. Additionally, the polarization patterns under the SBBM were compared with the normal polarization patterns measured on the day after the eclipse. In the analyses of the relative variation in celestial polarization characteristics, the changes in extremum, frequency, symmetric line, and neutral points are discussed. Focusing on the changes of celestial polarization patterns during the SBBM, the contributions of this work can be summarized as follows. (1) The celestial polarization patterns generated by the SBBM are analyzed by a series of comparative experiments including the patterns in both normal sky and ideal sky. (2) The major characteristics of celestial polarization that can reflect atmospheric optical properties and affect animal behaviors are discussed. (3) The connection between the skylight polarization patterns and the stage of total lunar eclipse is summarized. Atmospheric optical phenomena associated with lunar skylight are always the subject of research. The scattered moonlight forms regular polarization patterns, and the research on these patterns is mainly about the DoP and AoP, which are the most important characteristics in nocturnal celestial polarization patterns. With the extensive applications of skylight polarization in navigation, there is an increasing number of research works on the stability of AoP and DoP in various environments based on imaging polarimetry. The change in skylight polarization during a lunar eclipse has not, however, been noticed. Several biological behavioristics experiments were conducted to study the relationship with the lunar eclipse. However, research of polarization patterns on this phenomenon is still so sporadic that it cannot provide reliable evidence about biological activities.
To the best knowledge of the authors, variations in celestial polarization patterns of a full-sky under the SBBM have never been investigated previously. Accordingly, this study aims to make a preliminary exploration and to afford celestial polarization materials.

2. Methods and Experiments

2.1. Experiments

The experiment was performed at the Xinglong Observatory of the National Astronomical Observatories, Chinese Academy of Sciences, during the SBBM on 31 January 2018. The parameters of this SBBM are shown in Table 1. In this article, the Local Time (LT), which is equal to UTC+8 (Coordinated Universal Time), was used to indicate the time of the experiments. At the location of the measurement, the entire process of the lunar eclipse was observed from the beginning 19:48 (LT) to the end 23:11 (LT) of the partial eclipse. The sky was clear during the entire stage of the eclipse, and so, cloud interference was avoided.
At the same observatory, a comparative experiment was performed on 1 February 2018. However, in the second observation, the celestial polarization patterns were disturbed by clouds. Thus, only partial patterns between 22:30 (LT) and 23:51 (LT) were recorded. Nevertheless, important patterns could still be recorded.
The imaging polarimetry system was composed of a Nikon D610 equipped with a fisheye lens (SIGMA, F = 3.5, focal length 8mm) and a rotatable polarizing filter ( ϕ 72 mm) mounted on the lens. This system was mounted on a tripod for stability during the experiment. The polarizing filter was rotated in four directions ( 0 ° , 45 ° , 90 ° , and  135 ° ), to record a group of four sky images. All instruments were arranged so that the optical axis was parallel to the connection between the zenith and the observer. The parameters of the measurement can be seen in Table 2.

2.2. Methods

2.2.1. Skylight Polarization Calculations

The polarization information is generally represented with the Stokes vector S = [ I , Q , U , V ] [46], in which, I, Q, U, V represent the total light intensity, the two orthogonal directions’ light intensity, and the circularly-polarized light intensity, respectively. V is negligible in the atmospheric scattering usually [47]. The relationship between the polarization information and the Stokes parameters can be established by measuring light intensity in different polarization directions. In this article, by using the information of light intensity measured in four directions, the DoP and AoP can be calculated by the equation:
d = Q 2 + U 2 I
α = 1 2 arctan U Q
where d and α represent the DoP and AoP of the point observed, respectively. According to the principle of Rayleigh scattering, the E-vector of point observed is perpendicular to the plane composed of the incident light and the scattered light. According to the single-scattering Rayleigh model, the DoP and AoP in the simulation can be expressed as:
d = d max sin 2 γ ( 1 + cos 2 γ )
tan α = ( cos θ sin θ l sin θ cos φ l φ cos θ l ) ( sin φ l φ cos θ l )
where the value of maximum DoP d m a x is 1. θ l , φ l are the elevation angle and azimuth angle of the Moon. θ , φ are the elevation angle and azimuth angle of the point observed.  γ is the angular distance between the point observed and the Moon.

2.2.2. Neutral Points Recognition

A neutral point is located in the geometric center of the unpolarized area in DoP. The position of neutral point can be determined by the following procedure. Firstly, a threshold is selected to segment the lowest polarization area of the image. Then, an opening operation is performed based on the image generated above to obtain the maximum connected region as the neutral region. The ellipse fitting algorithm [48] of the least squares principle based on boundary of the connected region is executed to obtain the elliptic equation:
f ( x , y ) = A x 2 + B x y + C y 2 + D x + E y + F = 0
Minimize the sum of squared distance between the boundary of the connected region ( x i , y i ) , i = 1 , 2 , , n and the ellipse to compute the parameters p a r a = A , B , C , D , E , F .
p a r a * = arg min p a r a i = 1 n f 2 x i , y i
Lastly, the coordinate of the center of the ellipse is the position of the neutral point.

3. Results and Discussion

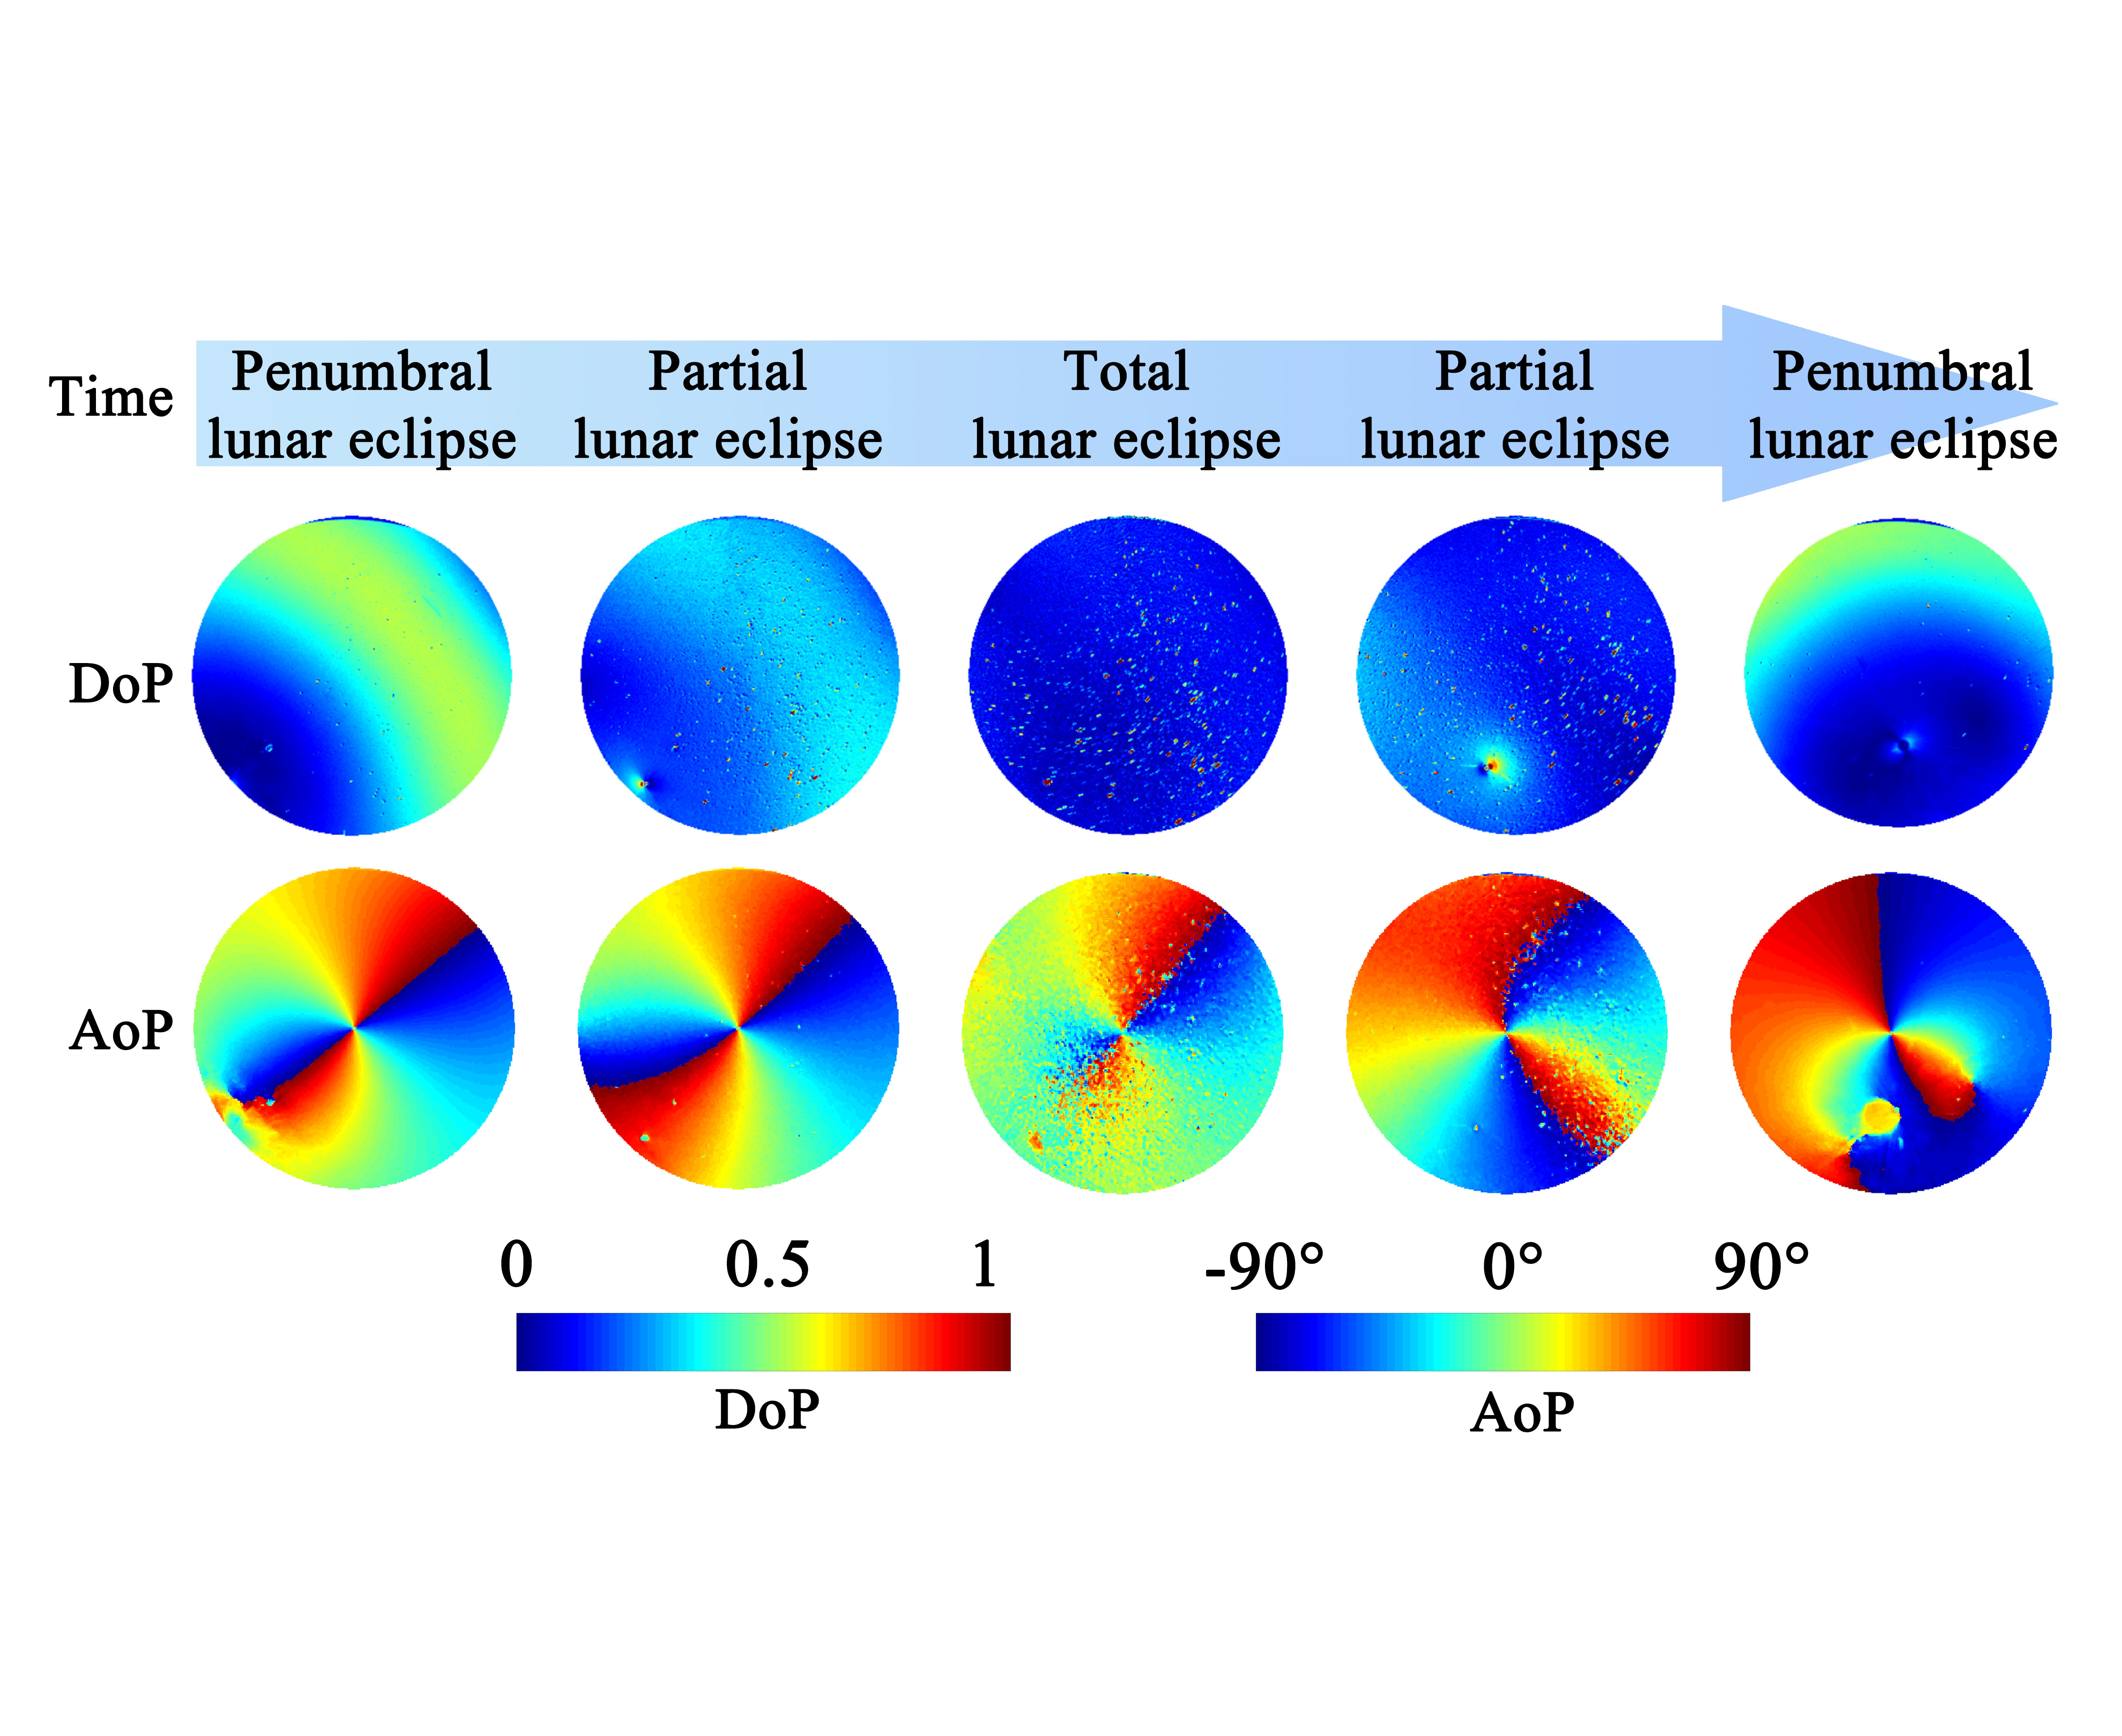
3.1. Variation of Polarization Patterns During SBBM

Representative polarization patterns are chronologically ordered in Figure 1. The entire process of the partial and total eclipse from 19:48 (LT) to 23:11 (LT) was recorded. The moments before the second contact (19:48 LT) and after the fifth contact (23:11 LT) are illustrated to compare the change of patterns.

3.1.1. DoP Changes During Eclipse

The value of the DoP, which was minimal during the total eclipse (Stage 3), decreased as the obscuration ratio of the Moon disk increased (Figure 1). This could also be seen in the DoP frequency distribution with the passage of time (Figure 2). The lower DoP frequency gradually increased with the advent of the lunar eclipse. During the total eclipse, the lower DoP values dominated the proportion (Figure 2e,f).
In comparing the patterns from measured values to those from the theoretical model simulation, the maximum DoP was located at 90 ° away from the Moon and decreased towards the Moon and anti-Moon. This is seen in Figure 1a–f, Figure 1h–j, and Figure 3. Although similar, the characteristic of the DoP along the line parallel to lunar-anti-lunar meridian (Figure 3) was different in specific values at unlikely stages. The maximum DoP of the lunar-anti-lunar meridian gradually decreased from 0.55 to 0.35 during Stage 2 (Figure 3b–d) as the obscuration ratio increased. The maxima in Figure 3g,h also decreased as the obscuration ratio increased. The value at 60 ° could not represent the maximum of DoP as the influence of the Moon.
The minimum DoP at Stage 1 was approximately zero (Figure 3a). Within five minutes following the beginning of the partial eclipse, the minimum was nearly 0.025 (Figure 3b). This minimum gradually increased during Stage 2 (Figure 3b–d). This change is also shown in Figure 2c,d, from which the Ratio(DoP < 0.05) is approximated to be zero. In particular, in Figure 2b, Ratio(DoP < 0.05) is greater than 5%. This is likely because Figure 2b is near the beginning of the partial eclipse and thus has a small obscuration percent. The DoP values changed particularly abruptly in the total eclipse (Figure 3e,f). Both the maximum and minimum DoP of lunar-anti-lunar meridian decreased during the total eclipse.
Additionally, the lowest DoP area (usually the region around the neutral point) was not located in the lunar-anti-lunar meridian. The lowest DoP area was located at the position left of the lunar-anti-lunar meridian and right of the lunar-anti-lunar meridian, as can be observed from Figure 1d–g, respectively. It should be noted that there are two unpolarized areas in Figure 1h–j. This also indicated that the symmetric line suffered a change.
The DoP combined with AOP is often used to calculate the celestial compass information in the absence of GNSS (Global Navigation Satellite System). In this process, DoP was used to judge the effectiveness of polarization information as a threshold due to its high sensitivity to the environments. The decreases of DoP values during the SBBM indicated that the effectiveness of DoP declined as navigation information. The resulting uncertainty of the polarization information would reduce the navigation accuracy. Besides, the DoP threshold is also used by animals in their orientation behavior. The polarized light that can be detected by animals must be above the threshold that is able to be perceived [49]. The results mentioned above suggested the DoP decreased as the obscuration ratio increased. Hence, our study could shed light on the influence of SBBM on both the polarization navigation and animals’ activity.

3.1.2. AoP Changes During Eclipse

In comparing the second and forth columns of Figure 1, significant consistency between the measurements and theoretical models in Stage 1 was evident. The patterns in Stage 2 (Figure 1b–d) began to change at 19:49 (Figure 1b), which approached the beginning of the partial eclipse. A point with uncertain AoP directions, which should be located at the lunar-anti-lunar meridian, but was instead farther from the meridian, emerges in Figure 1h. In Stage 5, there were two such points.
Additionally, the symmetric line (boundary between red and blue), which represents the E-vector perpendicular to the lunar-anti-lunar meridian, was not a straight line as in the simulation (forth column of Figure 1). Especially, at Stages 4 and 5, the symmetric line curved away from the lunar meridian instead. During the total eclipse, the symmetric line did not rotate with the change of lunar azimuth.
The celestial polarization patterns had a symmetry plane defined by the celestial zenith and the Moon or Sun. This symmetry allows many creatures to perceive the polarization compass as a navigation cue [50]. The changes in polarization pattern symmetry can enlighten us about the anomalies in biological activity during the lunar eclipse. Besides, this symmetry is also used for autonomous navigation as the azimuth reference. Several navigation algorithms based on the symmetry of polarization patterns were proposed as the AOP images are quite stable under most of the sky conditions [29]. However, these navigation methods may be invalid during the SBBM because of the changes of symmetry.
According to comparisons of the experimental data with the data from the theoretical model, there were several changes in the polarization patterns of the sky during the eclipse. However, because of the differences between the theoretical model and normal polarization patterns, particularly in neutral points, it was essential to compare the polarization patterns of the SBBM night with the normal polarization patterns of moonlit sky.

3.2. Comparison of SBBM and Normal Sky Polarization Patterns

A comparative experiment was performed on 1 February 2018 at the same experiment location as the previous day. The patterns of the comparative measurement are shown in Figure 4. The frequency change of the DoP is shown in Figure 5.
By comparing the polarization patterns in the normal sky with the SBBM night, differences between them can be summarized as follows:
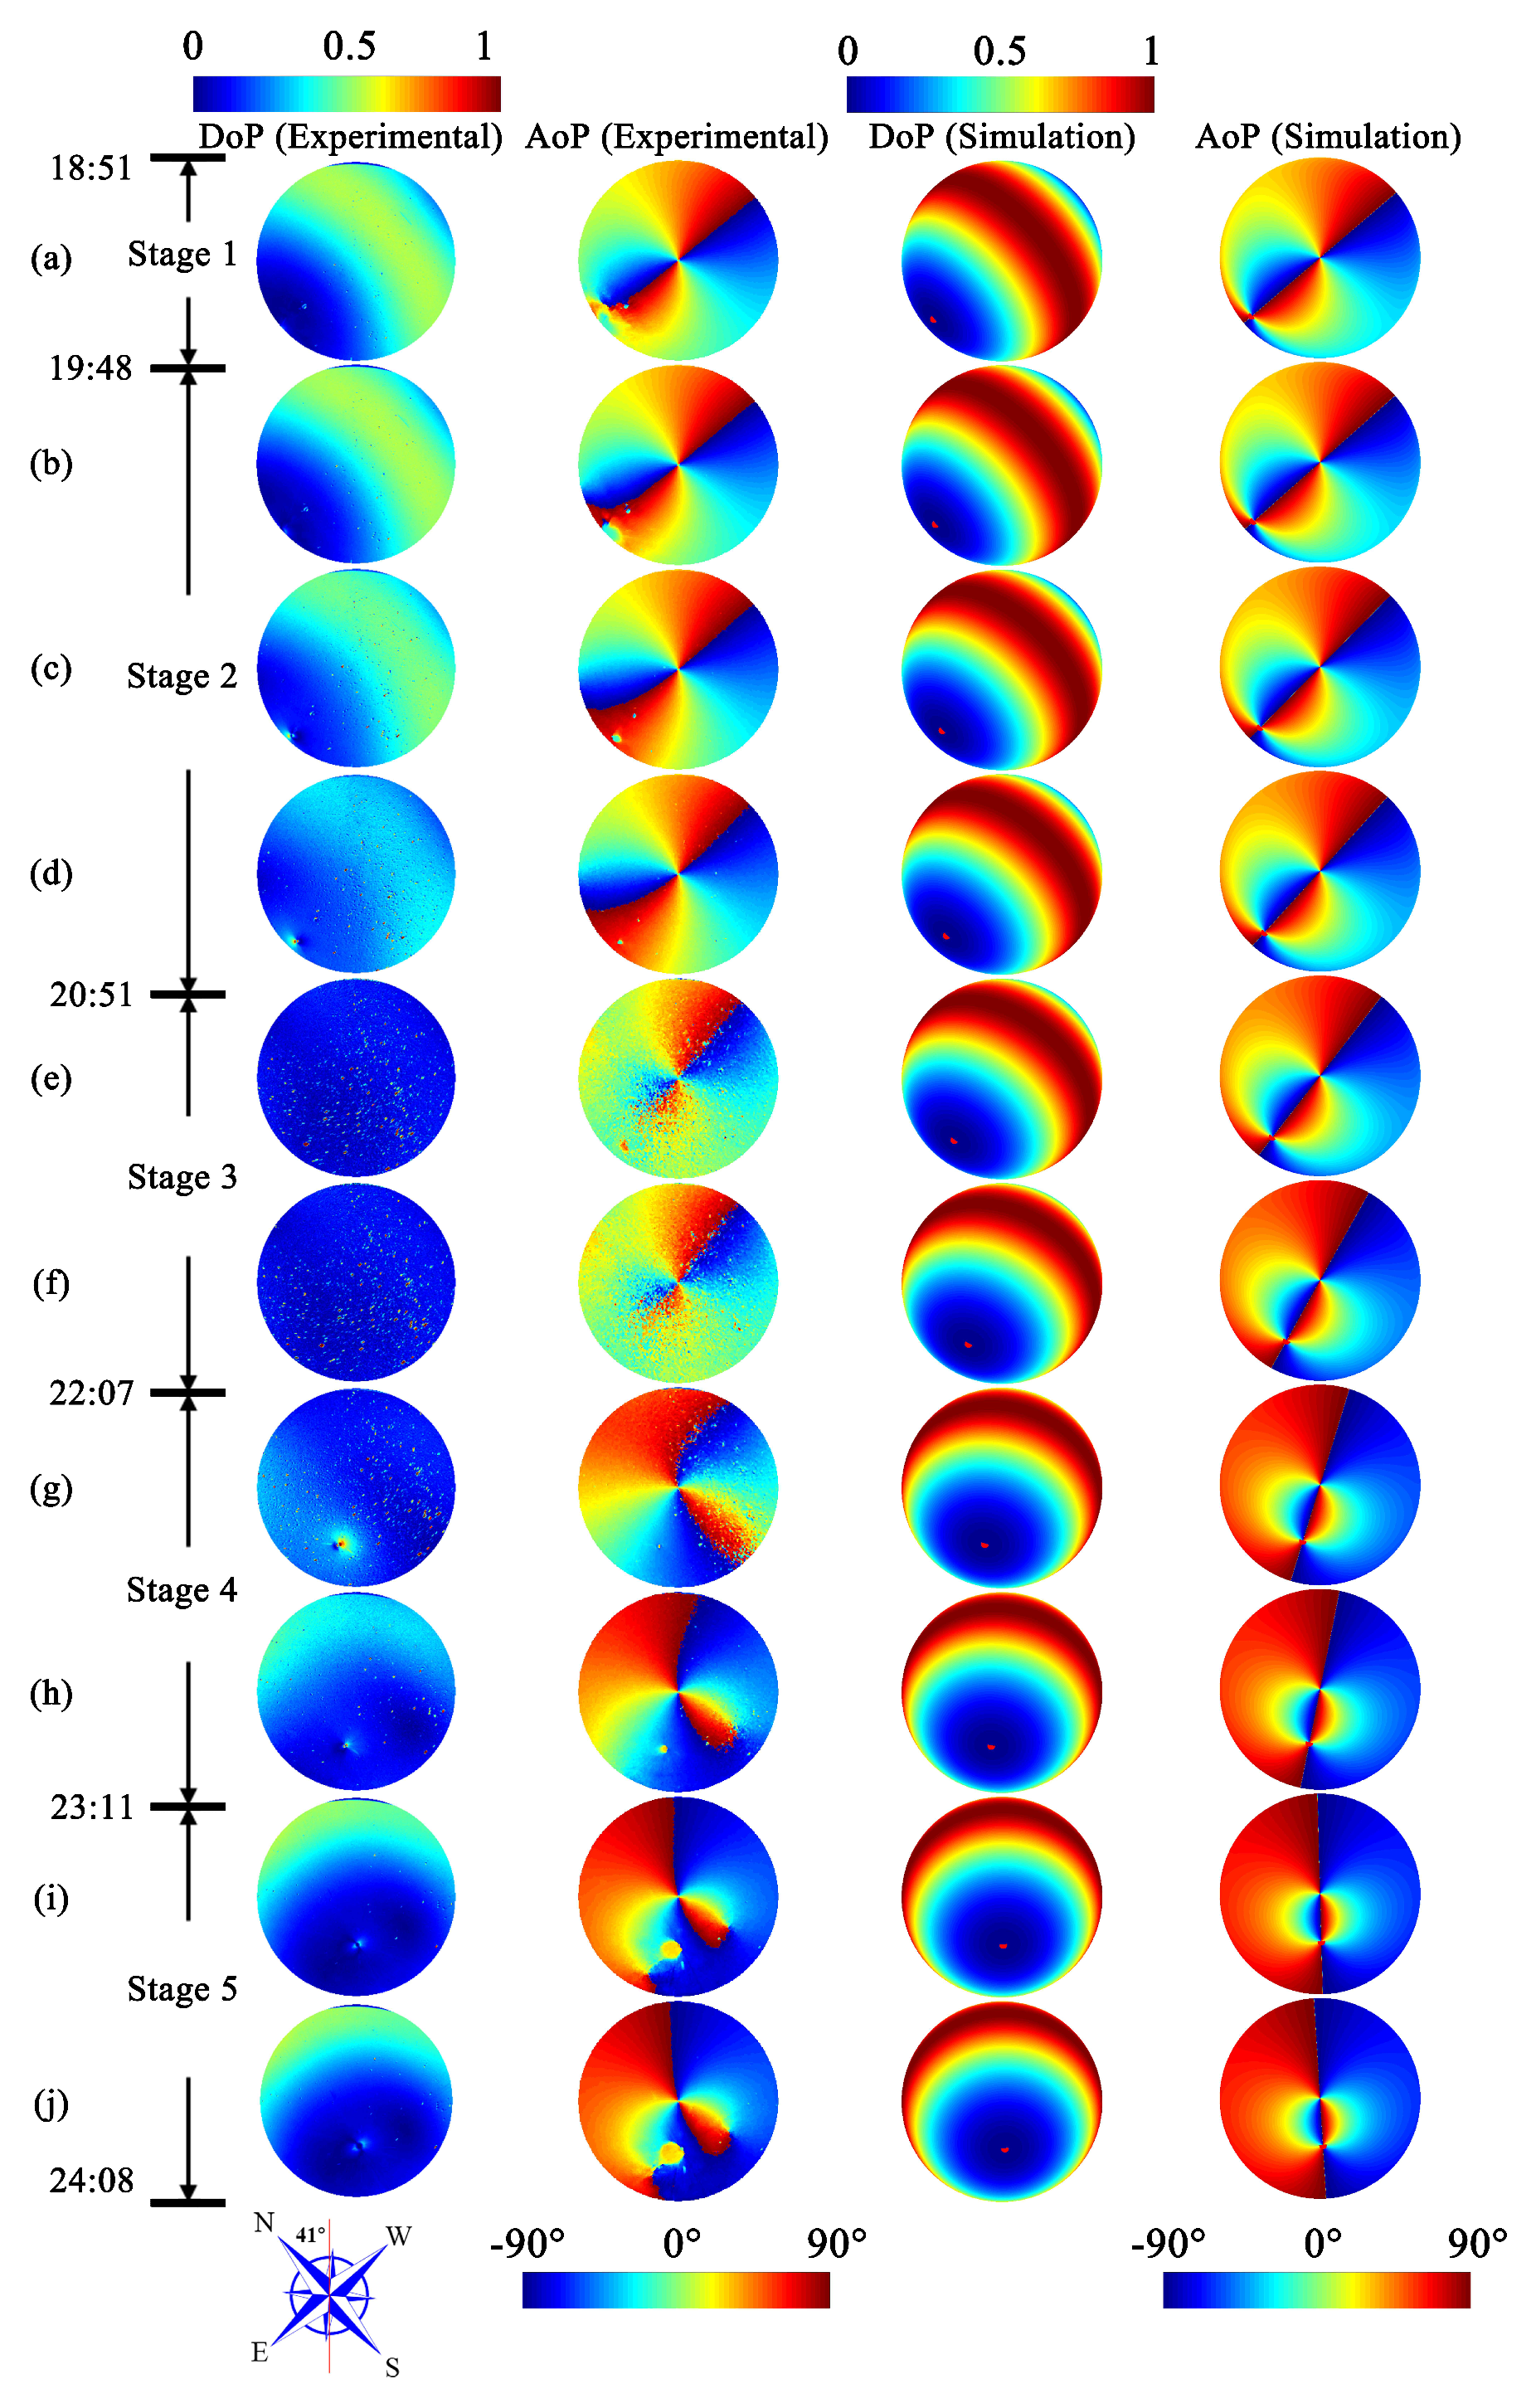
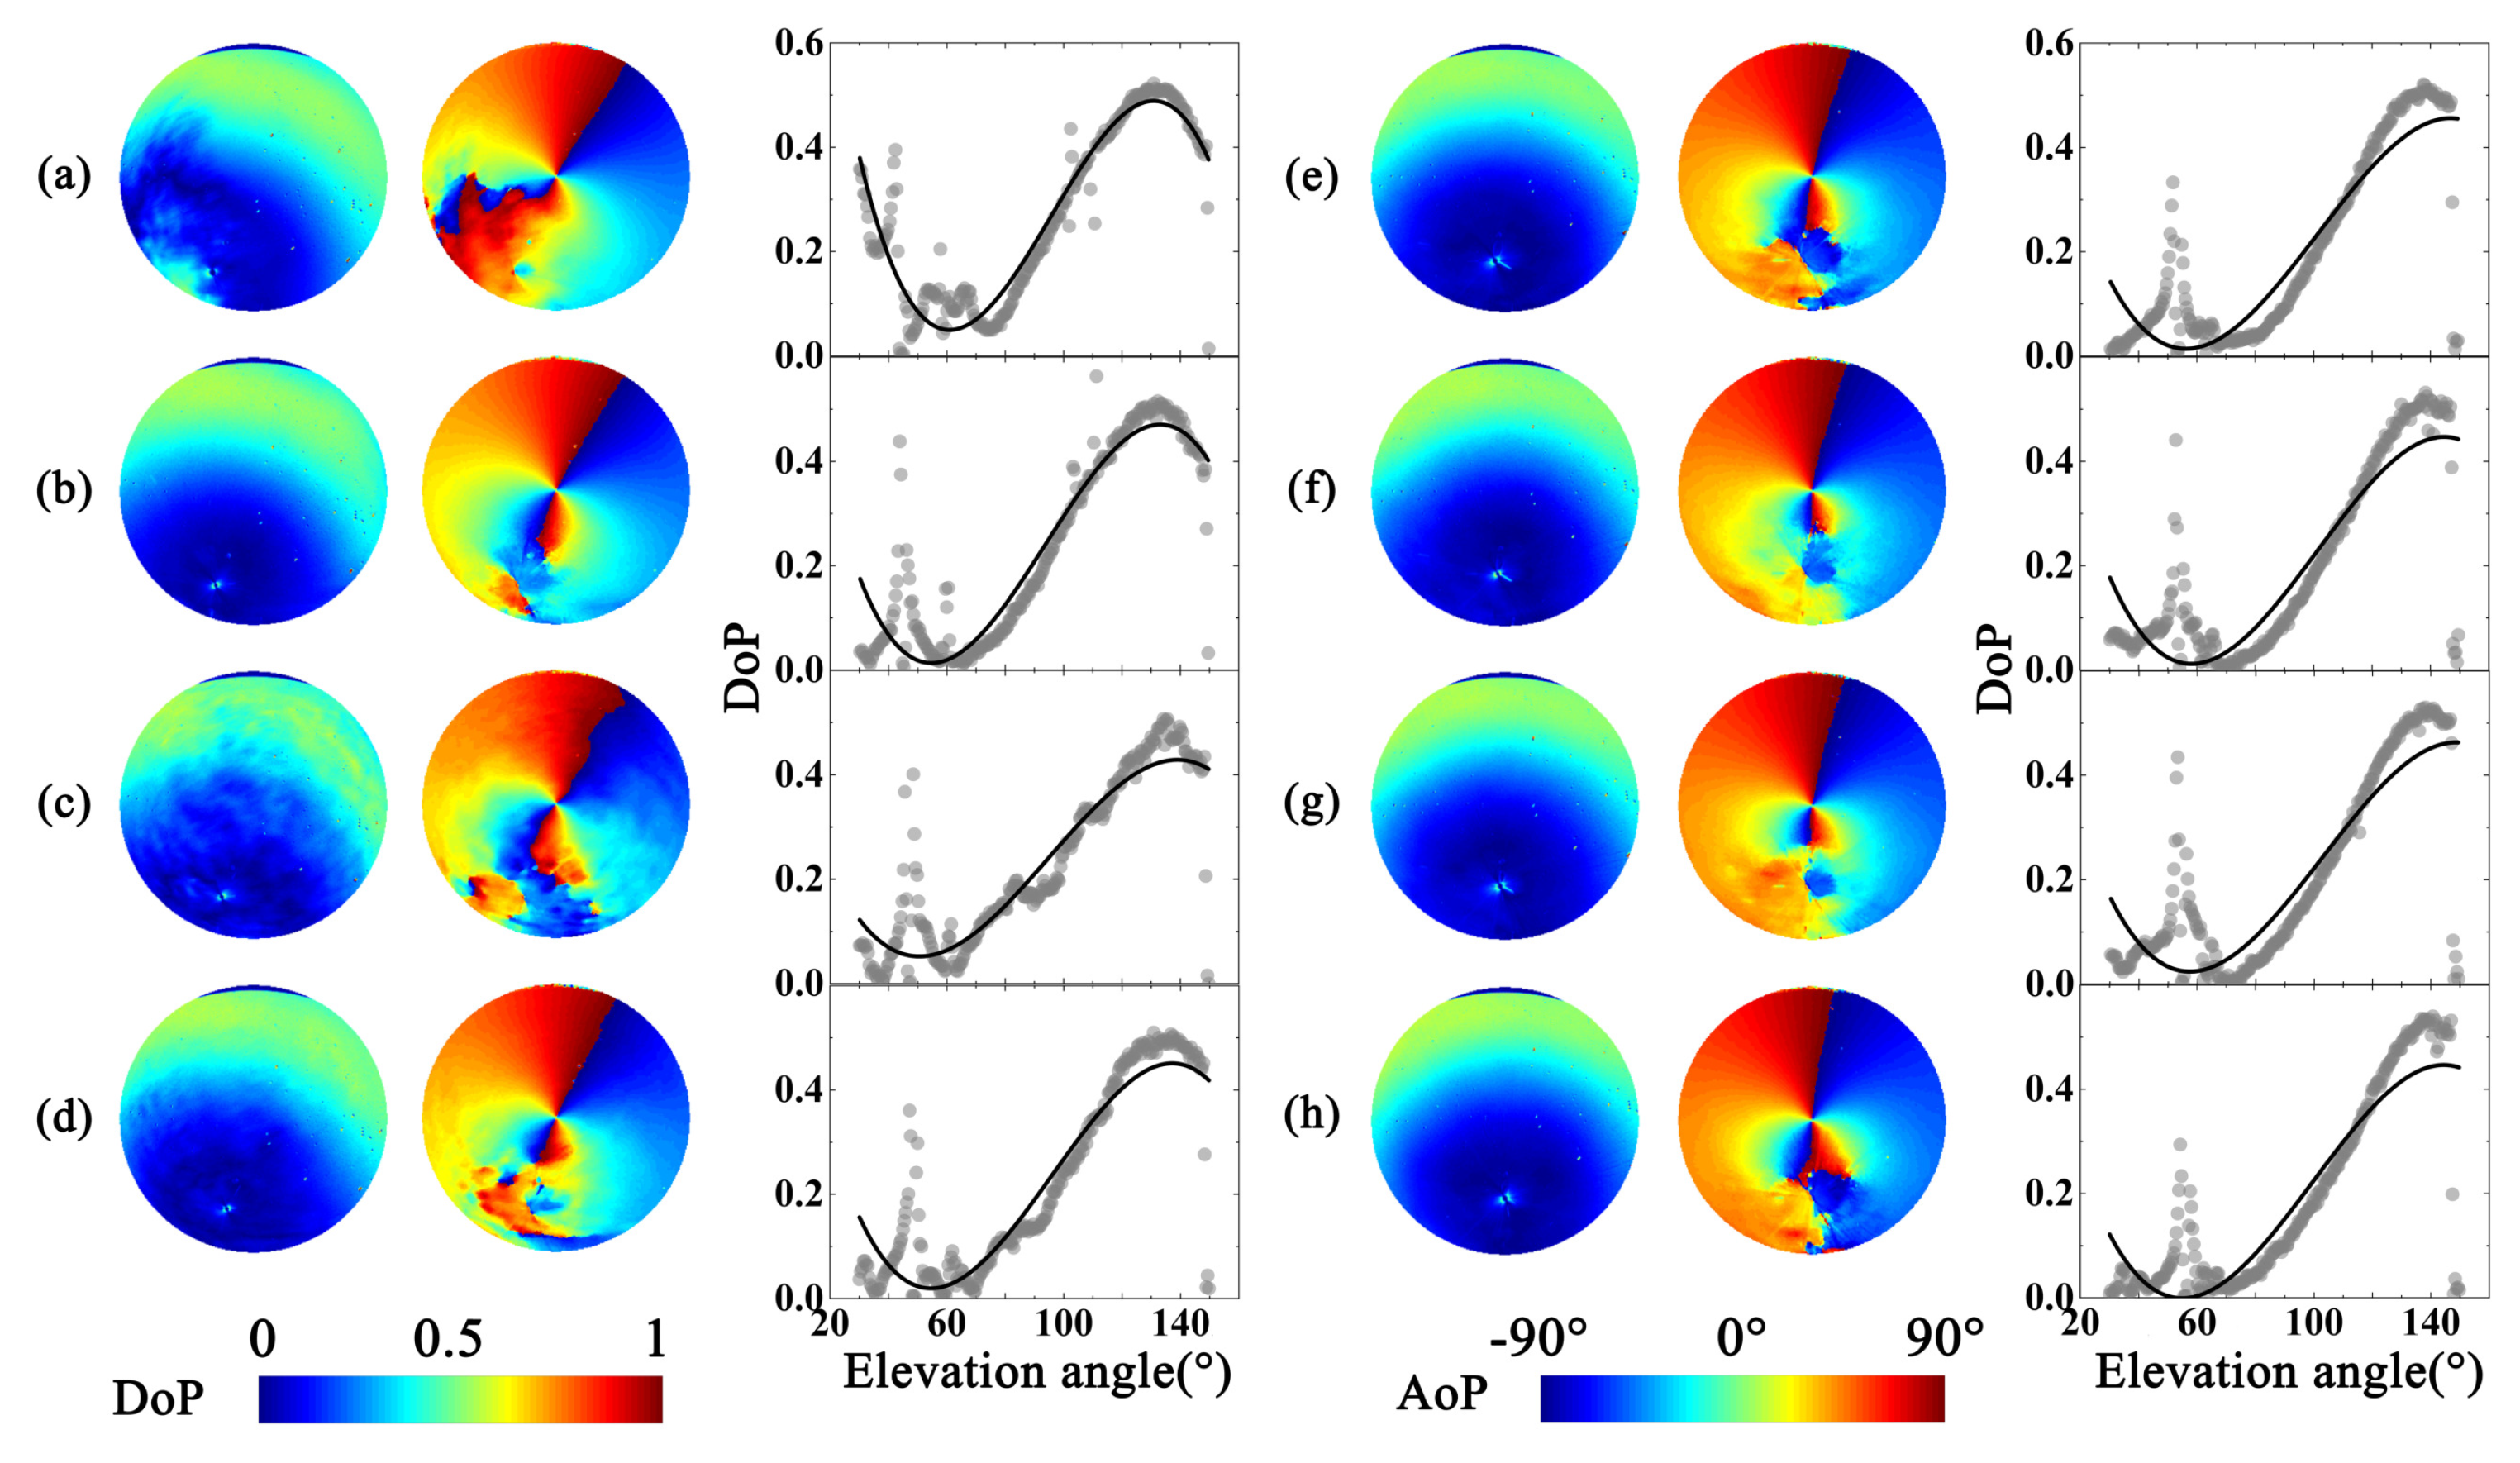
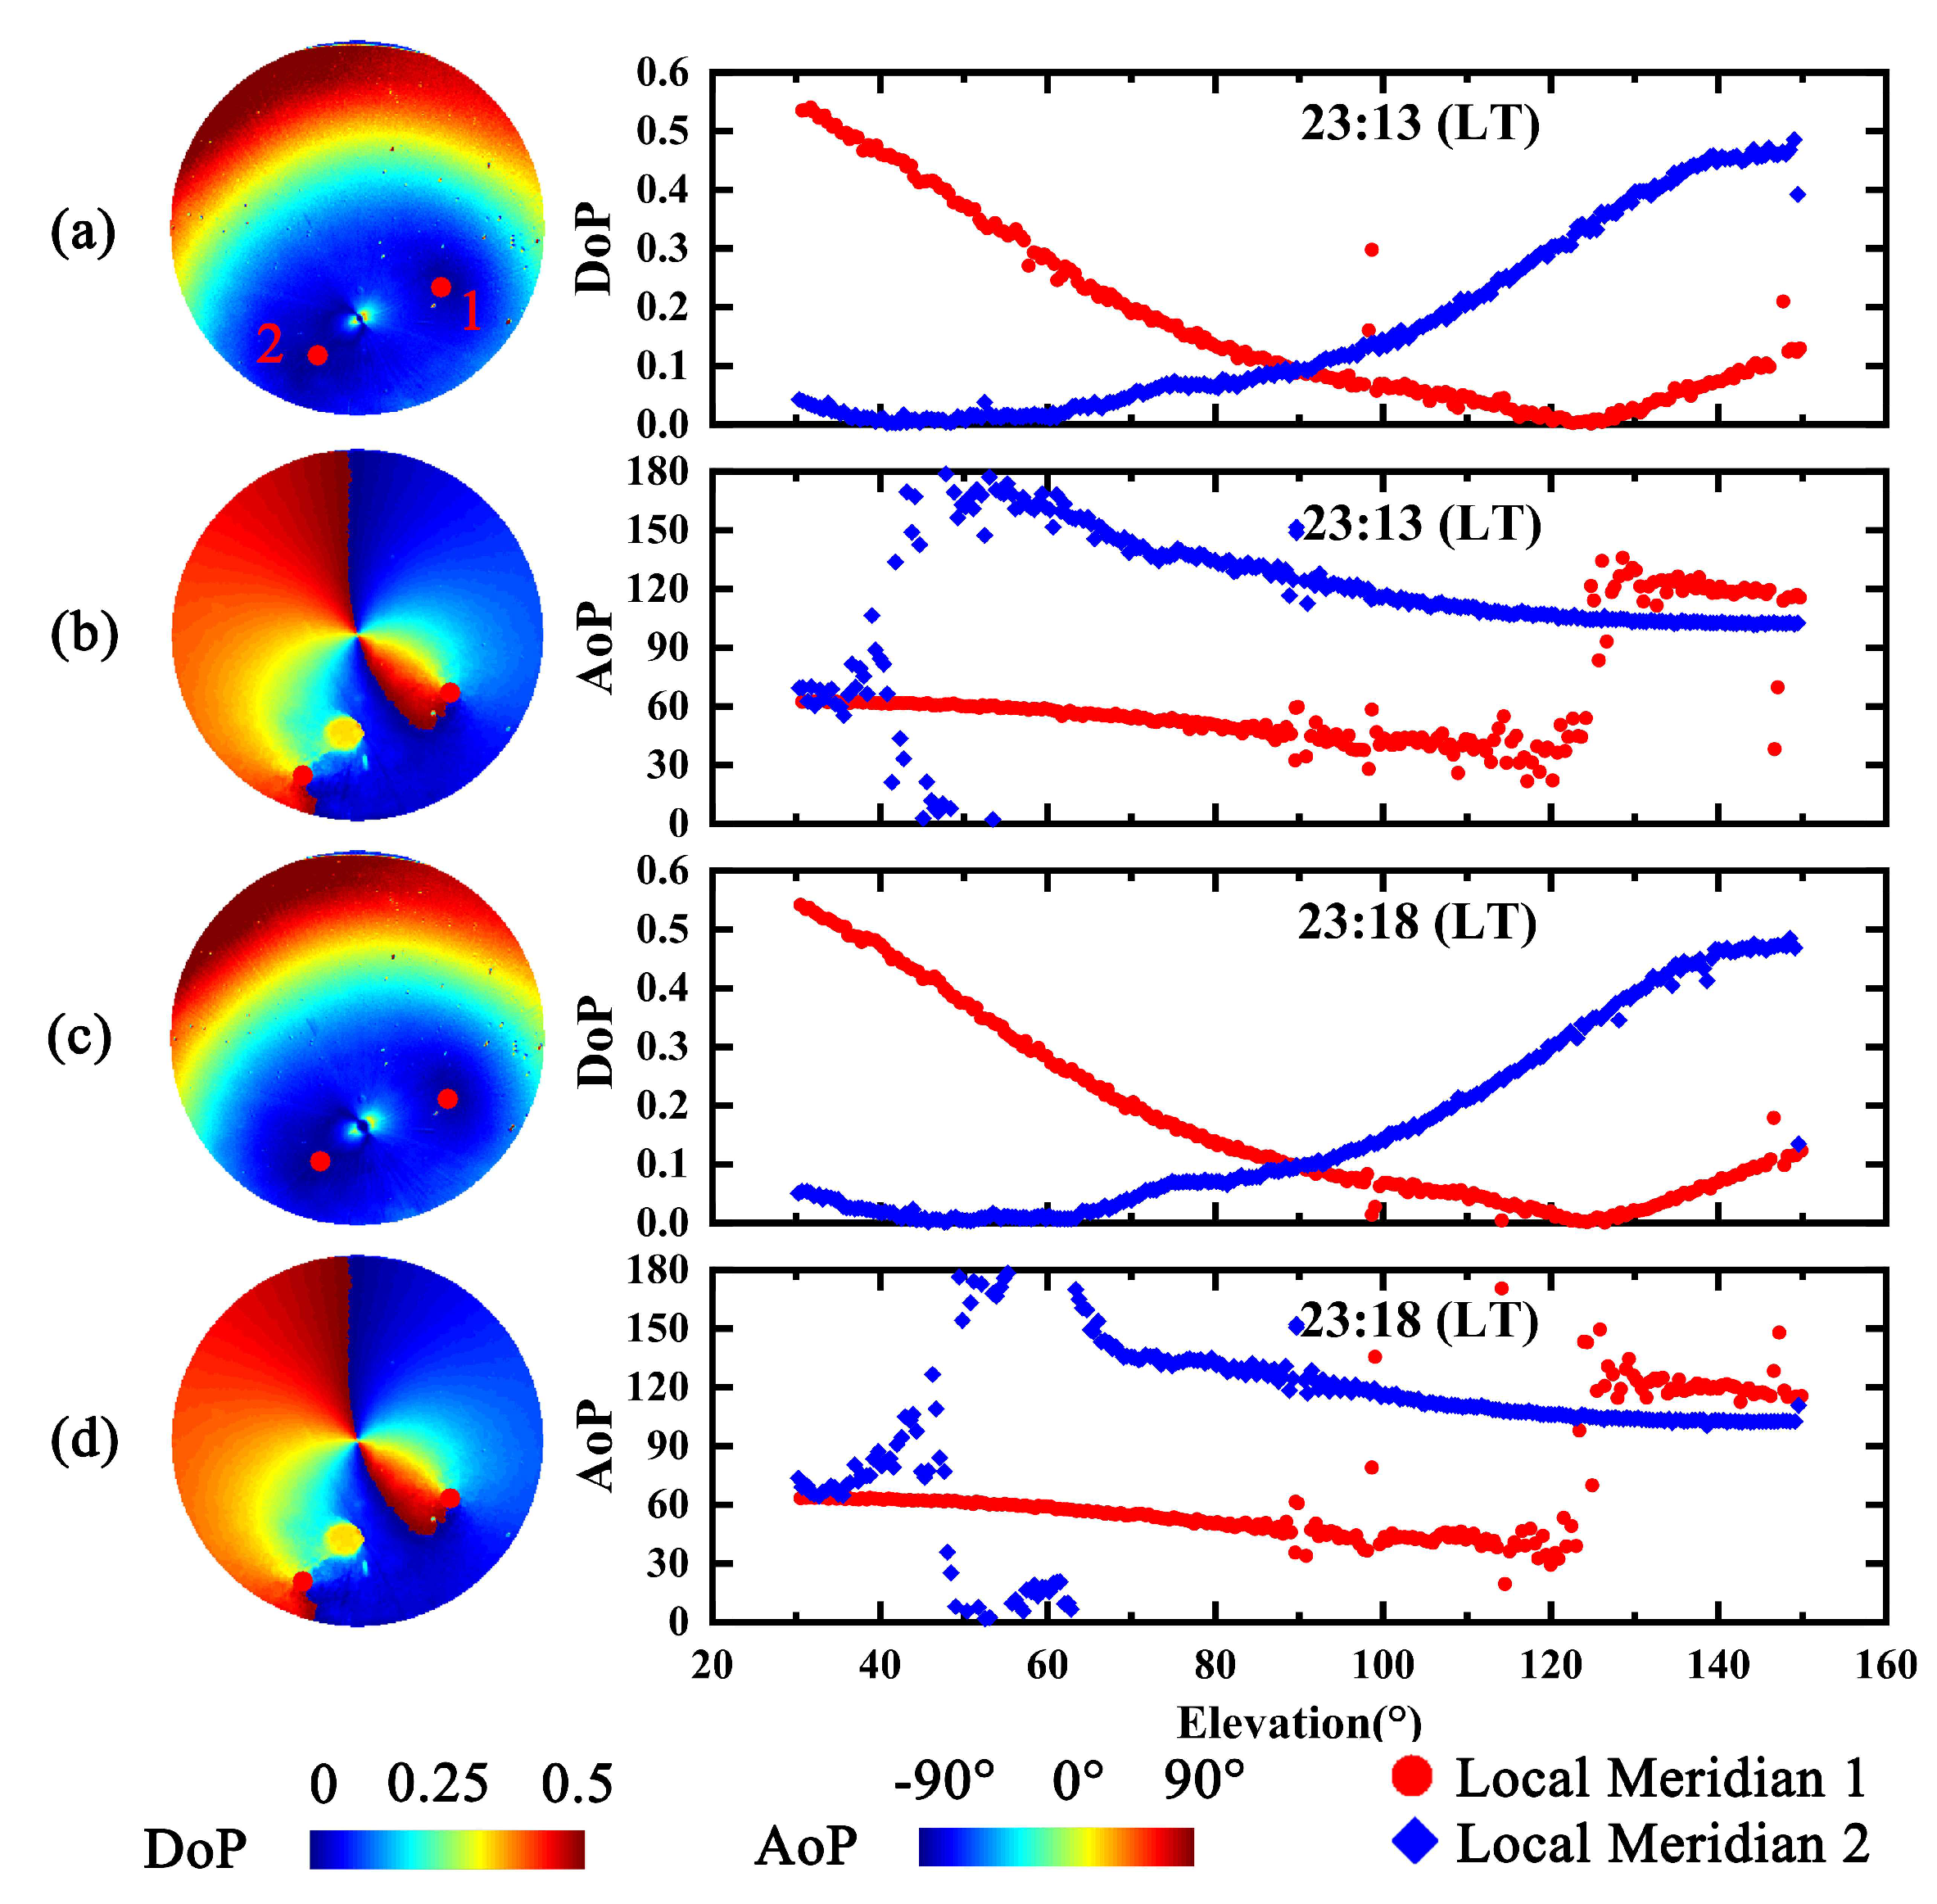
  • The symmetric line along the lunar-anti-lunar meridian approximated a straight line in the polarization patterns of the normal night sky at the lunar elevation from 43 ° to 56 ° during the measurement. In this elevation range, a point with uncertain directions off the lunar-anti-lunar meridian in the AoP does not appear in Figure 4. However, during the SBBM night, the symmetric line started to deviate from the meridian at 54 ° of lunar elevation, and the point with uncertain directions in AoP gradually appeared during the course of elevation from 54 ° to 57 ° , reaching total clarity at 57 ° .
  • The lowest DoP area is on the right of lunar-anti-lunar meridian at 54 ° of the lunar elevation in Figure 1g. However, this does not exist in Figure 4f,g at the same lunar elevation. Additionally, the lowest DoP area is on the right of the meridian at 57 ° lunar elevation (Figure 1h), but there is no such area at similar 56 ° lunar elevation of normal sky (Figure 4h).
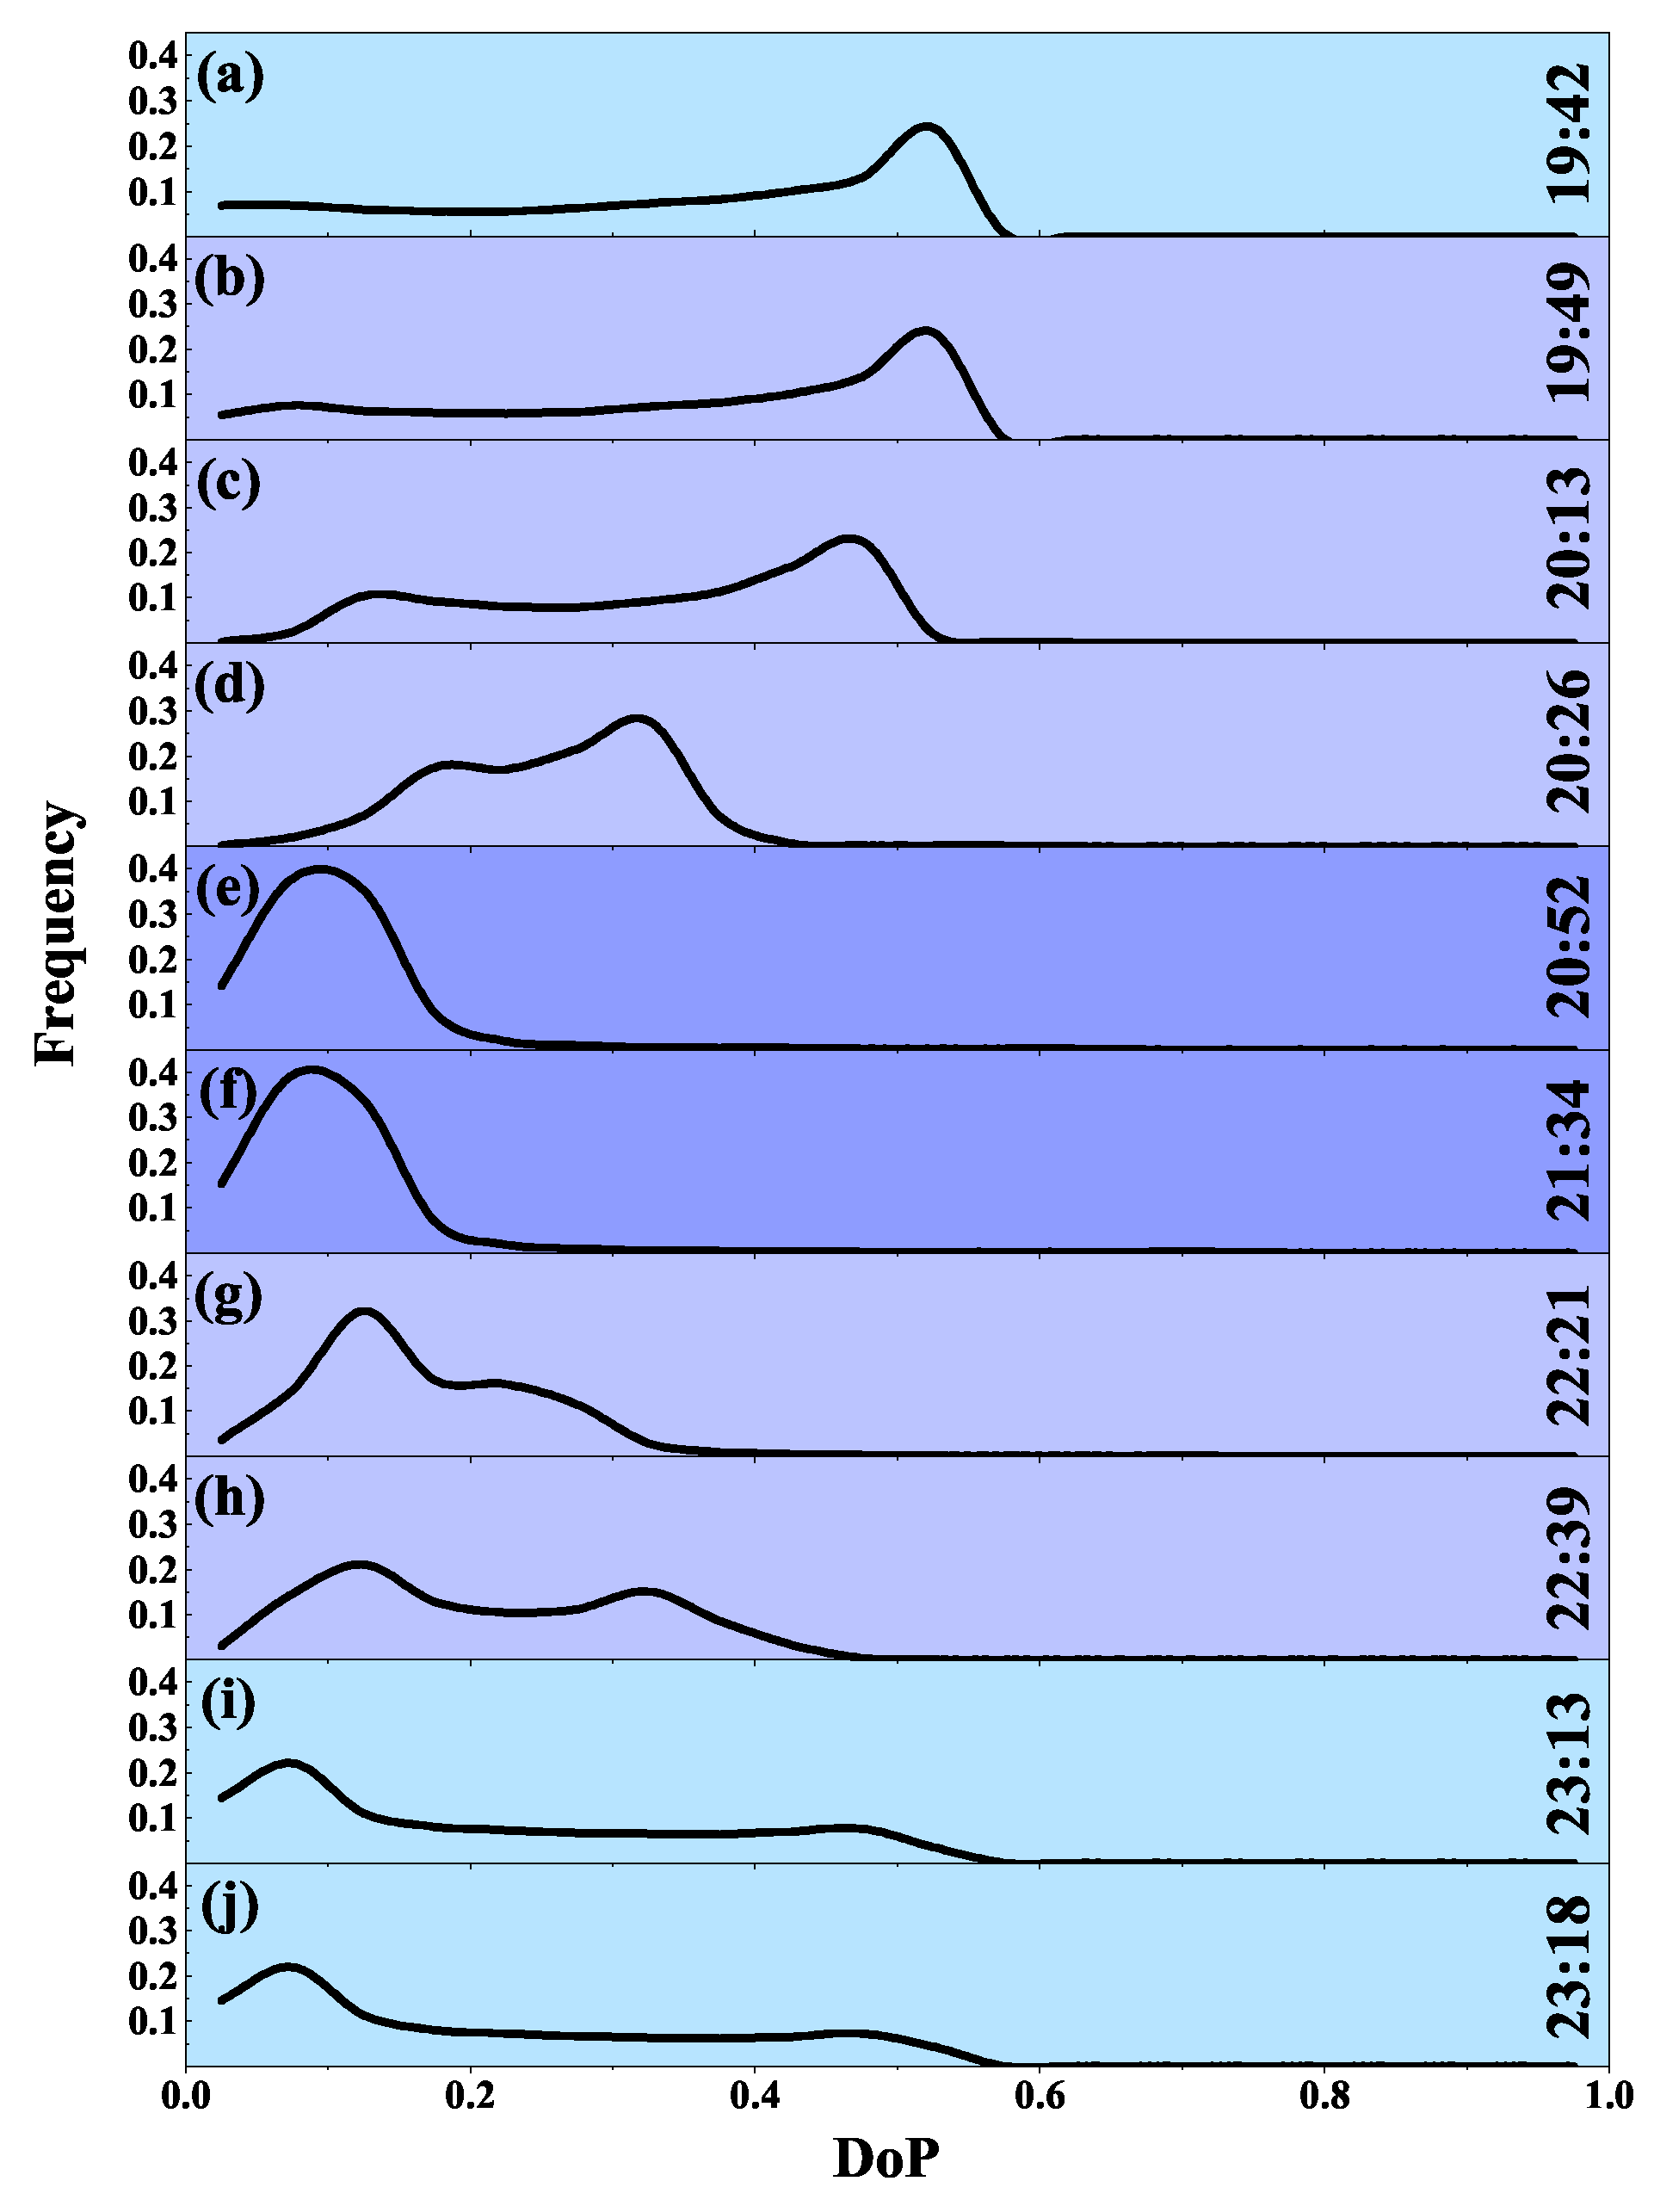
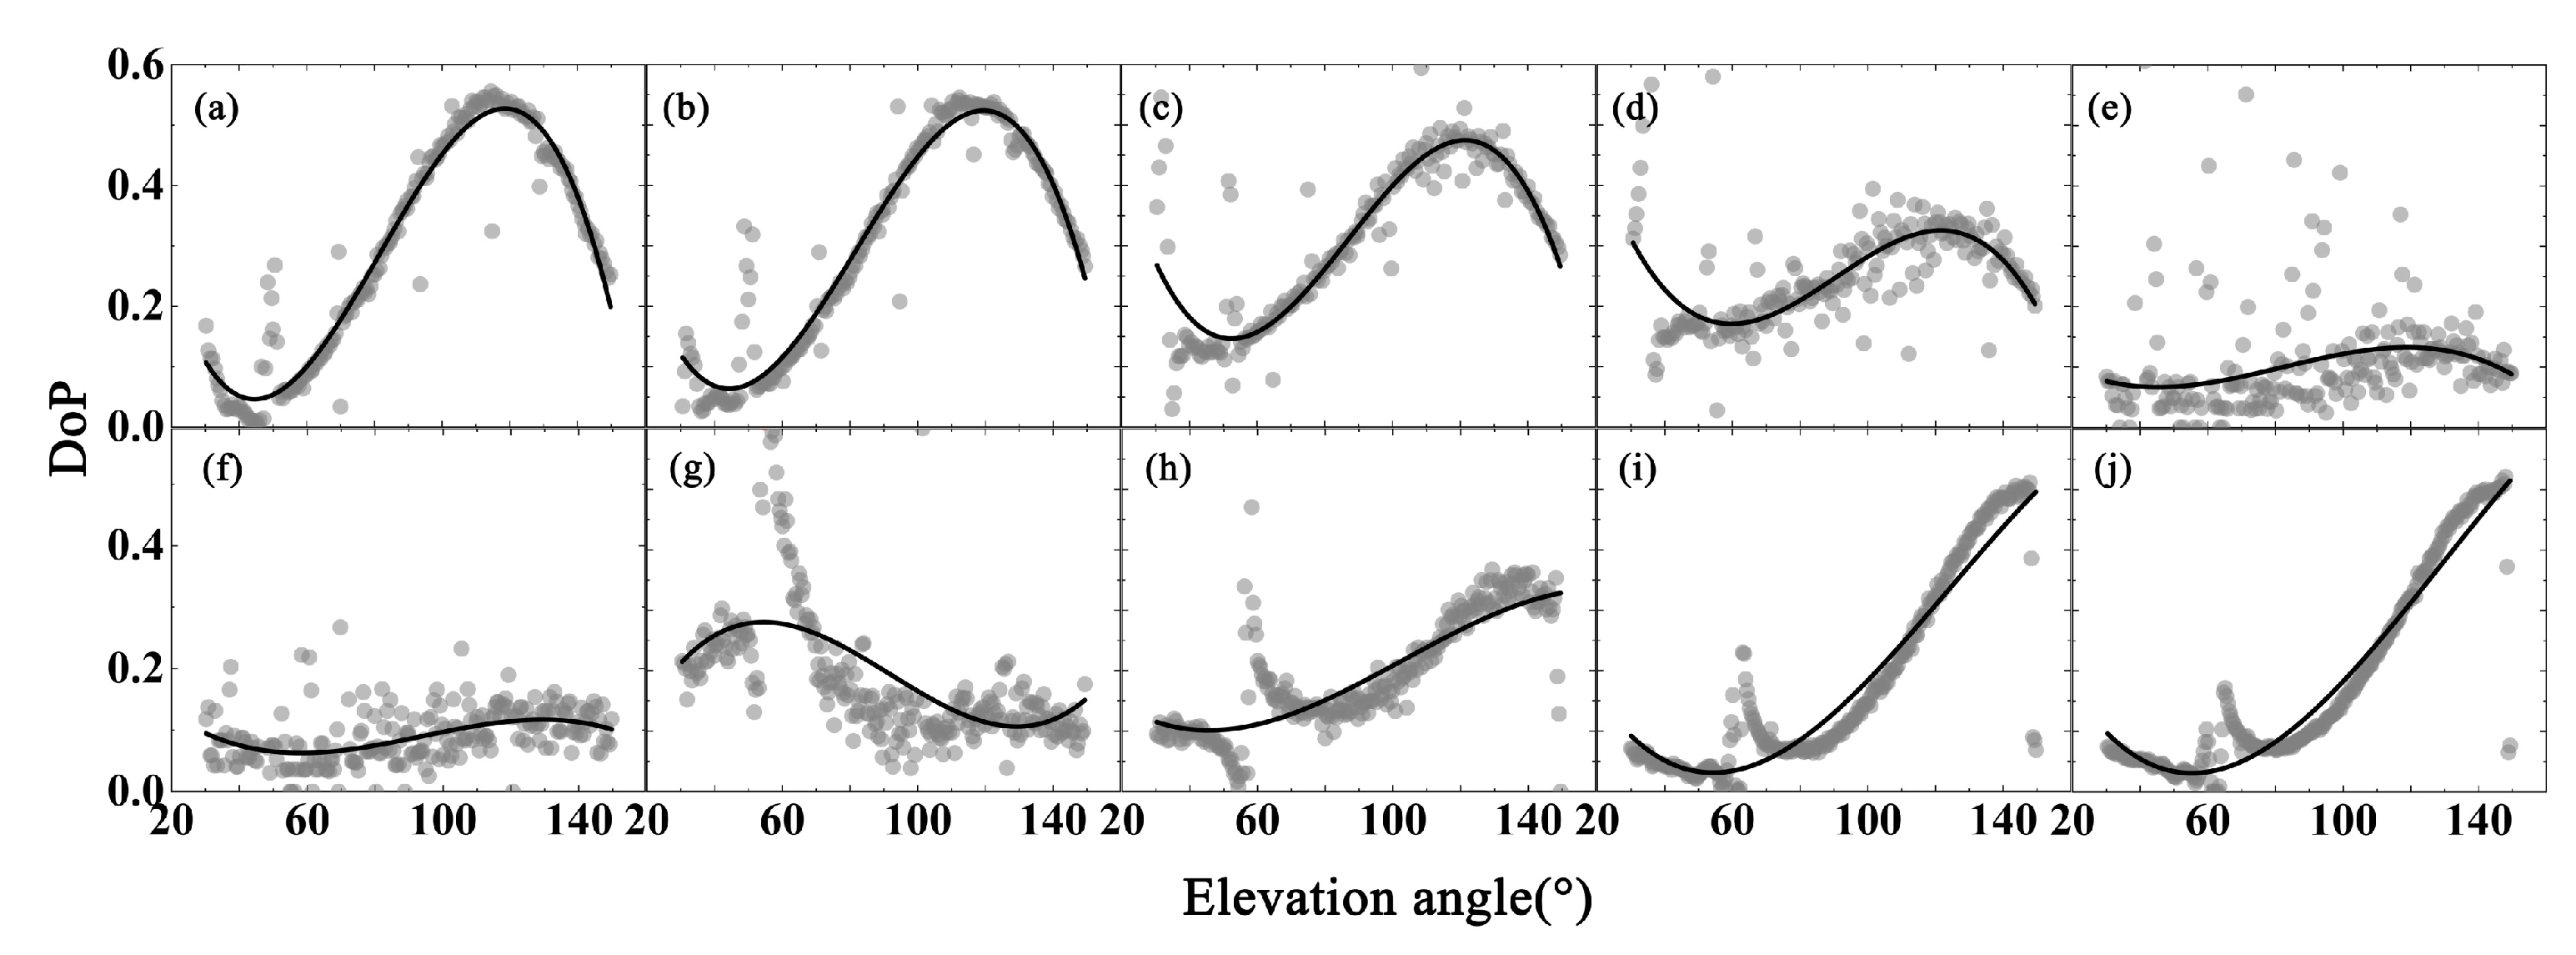
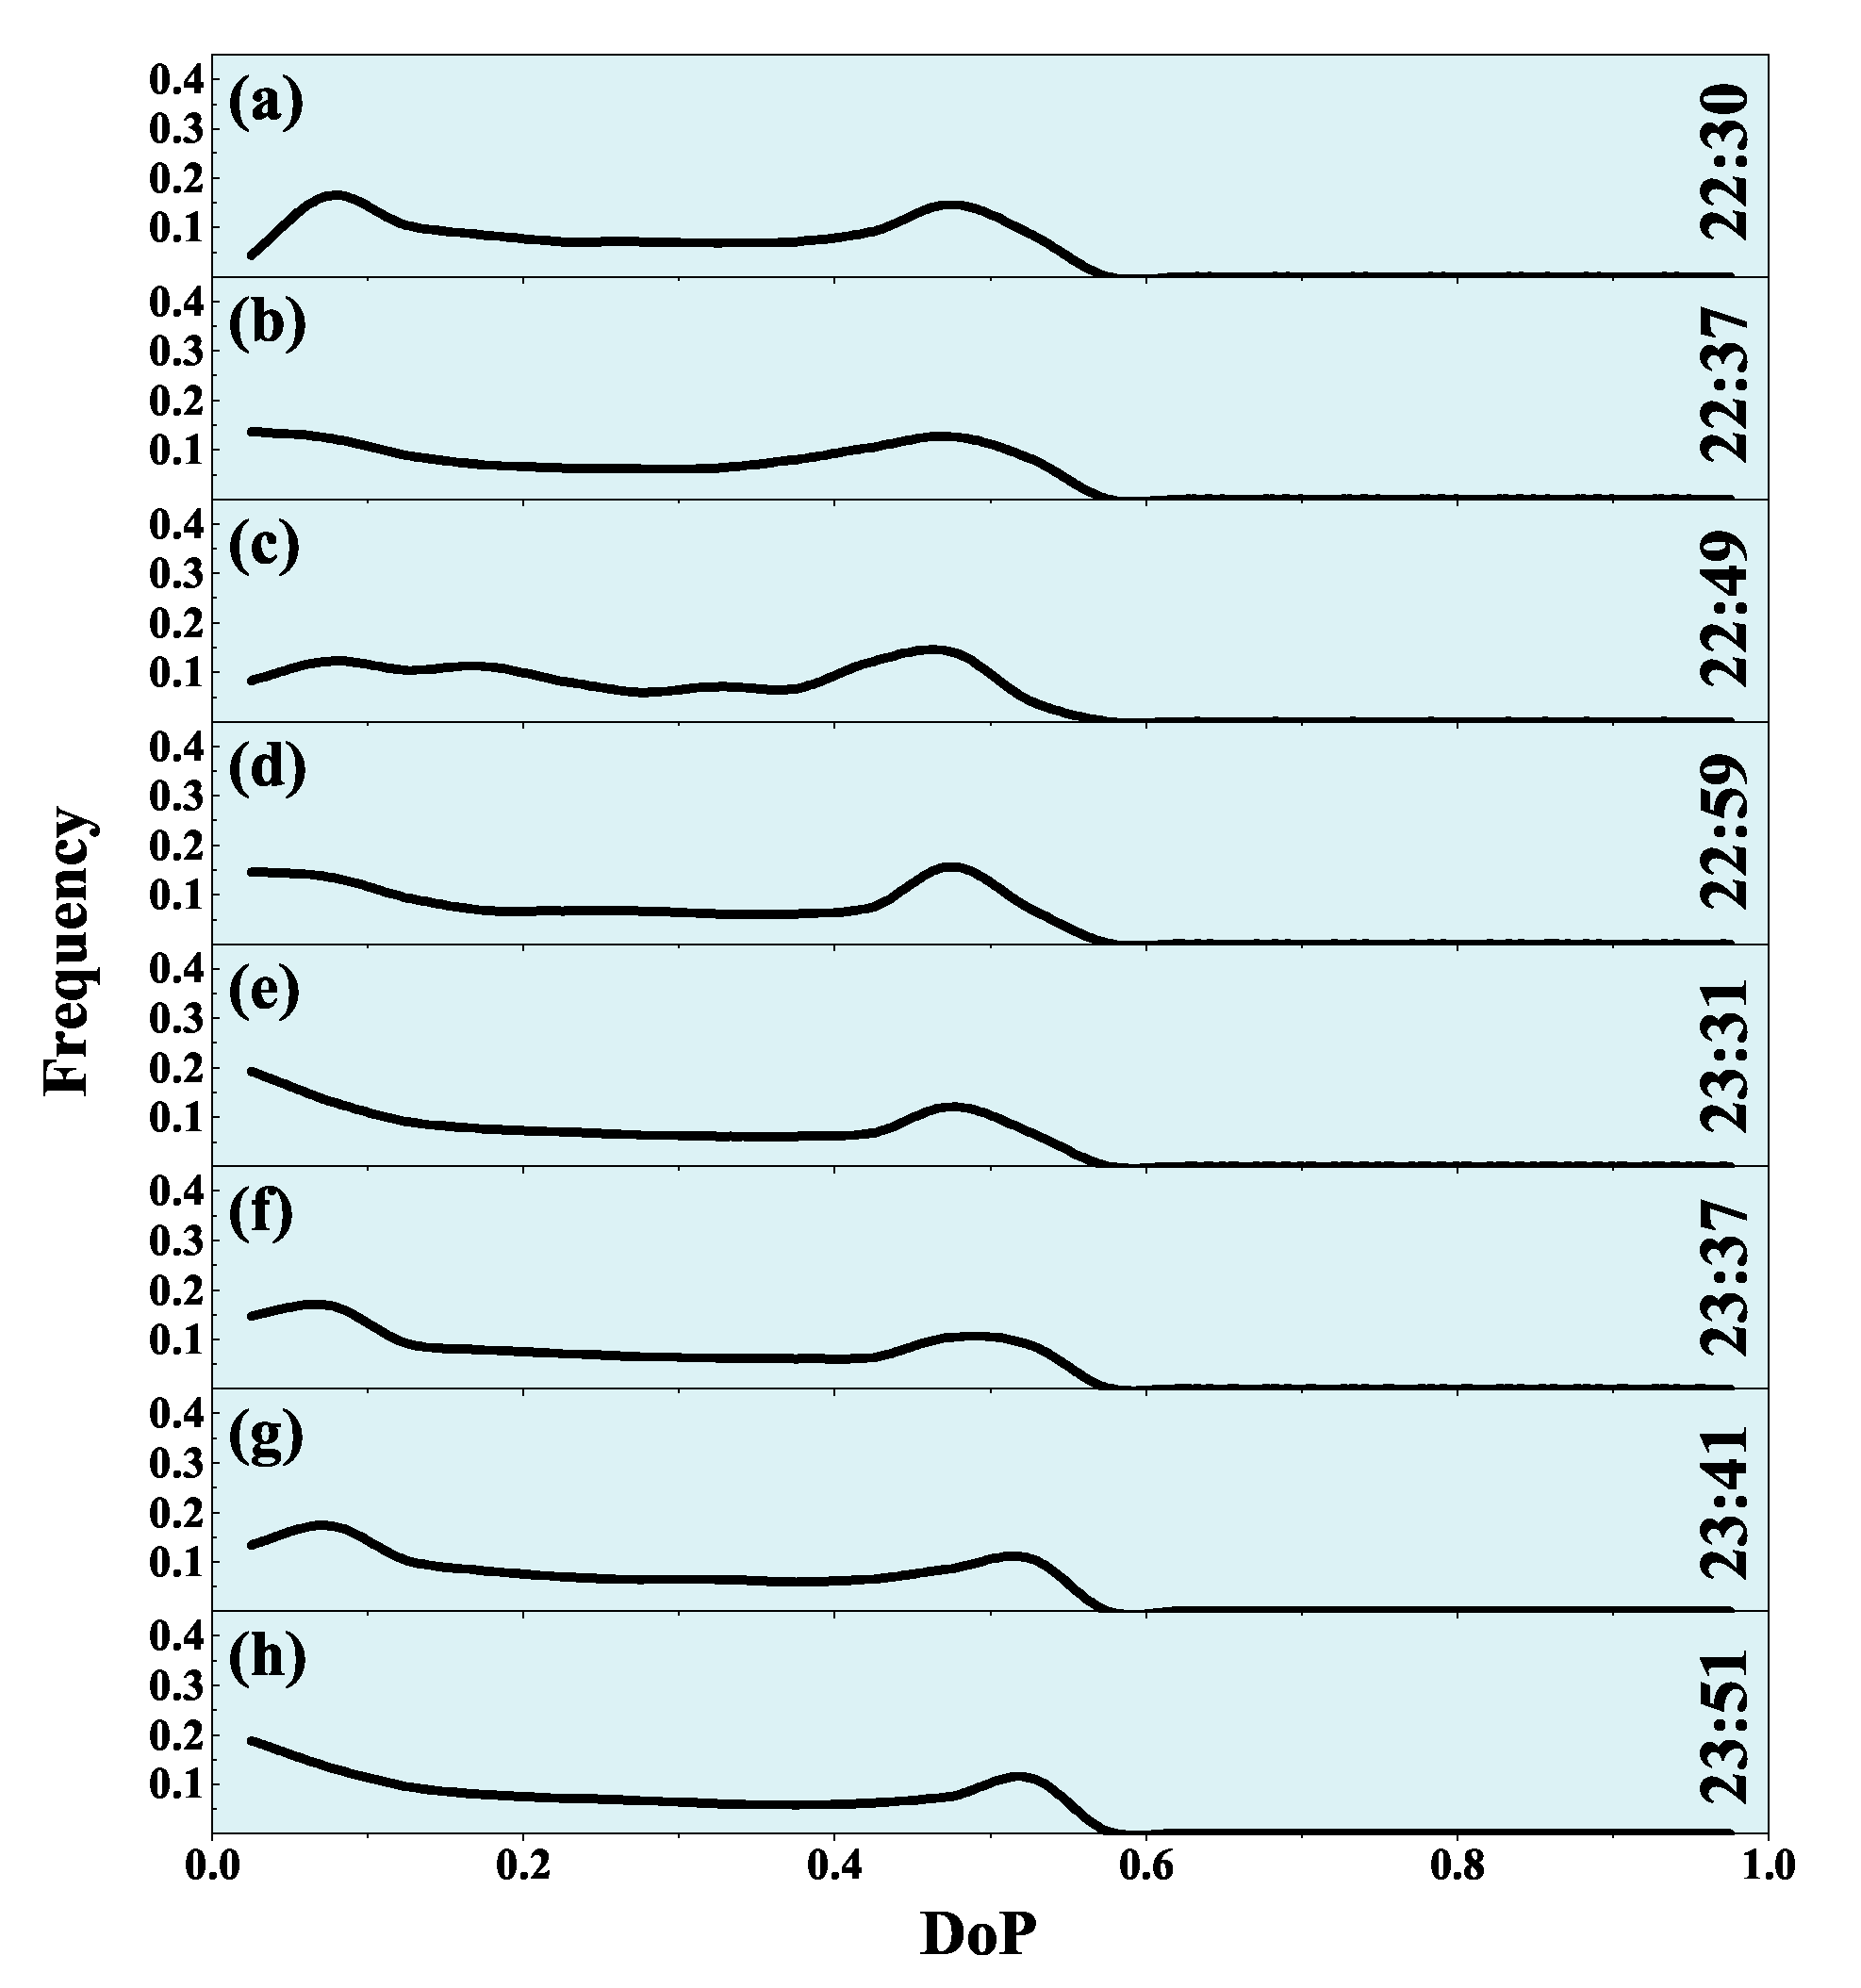
  • The distribution of the DoP gradually concentrated on a lower DoP during the partial eclipse and then converged to values below 0.2 during the total eclipse. In contrast, the distribution of the DoP in the normal sky was more stable.
  • Both situations suffered from moonlight disturbance. On the lunar-anti-lunar meridian, the lowest DoP in the normal sky always approached zero. In contrast, the lowest DoP during the lunar eclipse was equal to zero only when the Moon was in the penumbra. This could also be seen in the normal sky Ratio(DoP < 0.05), which was greater than 15% (Figure 5), with the exception of cloud disturbance (Figure 5a–c). Furthermore, the Ratio(DoP < 0.05) of the normal sky was bigger than that during the partial eclipse. The maximum DoP was stable at 0.5 in normal sky, while during the eclipse, the maximum of DoP decreased as the percent obscuration increased.

3.3. Characteristic Analyses of Neutral Points During the Eclipse

Figure 1 shows that the points with the lowest DoP and uncertain directions of AoP took place at Stages 4 and 5. To investigate the relationship between these points and the commonly known neutral points, the points at Stage 5 are analyzed in the sequel.
According to previous studies [38,51], a neutral point like the well-known Arago, Babinet, Brewster, and the fourth neutral point should obey three rules: (1) A neutral point is located in the unpolarized area where the DoP equals zero. (2) The DoP increases along the meridian from the neutral point to 90 ° angular distance from the illuminant and then decreases. (3) The AoP suffers a 90 ° change from negative polarization (the direction of polarization of scattered light parallel to the main plane of scattering) to positive polarization (the direction of polarization perpendicular to the main plane of scattering), passing through the neutral point along the meridian.
In celestial polarization patterns, a neutral point possesses the lowest DoP where the value always approaches zero. The value of DoP near the neutral point gradually increases with the neutral point as the center. Several studies found that DoP around the neutral point was low and approximated a circle or ellipse in the polarization patterns [52]. Hence, to verify the relationship between the neutral points in the SBBM sky and the traditional neutral points of the normal sky, an ellipse fitting algorithm [48] was used to obtain the geometric center (represented by red points in the graphs measuring DoP) of the unpolarized area (Figure 6). The contour junctions of the AoP are represented by red points in Figure 6. The red points in the DoP graphs are near the position of the corresponding points in the AoP graphs.
Along the local meridian passing through the red points in Figure 6, the behaviors of the DoP are described on the right of Figure 6. The DoP changes from zero (close to the Moon) to the maximum (away from the Moon) for both of the two neutral points in Figure 6. The maximum DoP value of Neutral Point 1 along the local meridian was larger than that of Point 2. Figure 6b,d shows the AoP value along the local meridian passing through the red points. The AoP value changed by 90 ° at Point 1. However, this situation was different from the traditional neutral points, whose AoP value shifted from 120 ° to 30 ° rather than from 90 ° to 0 ° . Additionally, the AoP value at Point 2 shifted from 90 ° to 0 ° . This situation was more consistent with the neutral point definition.
According to the above analyses, the characteristics of the neutral points were largely consistent with the definition of the traditional neutral points of the normal sky. The primary differences were only that the neutral point was not located on the lunar-anti-lunar meridian, and the dramatic change of the AoP did not shift from positive to negative polarization. However, the neutral points did not exist in the single-scattering Rayleigh model or normal skylight polarization patterns. This situation occurred with the advent of SBBM. This was not the first time as besides four traditional neutral points, other neutral points were discovered. The polarization patterns in similar special natural phenomenon were demonstrated by scholars in research on the solar eclipse. A neutral point near the zenith was observed during the total solar eclipse occurring in 1999 [36]. After that, several types of neutral points, which included a type of neutral points with a local minimum of DoP, but no switch of the AoP crossing the points along the meridian, occurring in the total solar eclipse were mentioned by [37]. In addition, the neutral points near the zenith and horizon during the total solar eclipse were observed by [38]. There are reasons to believe that the abnormal celestial polarization patterns typically occur with the special natural phenomenon, and particular neutral points indeed exist in such phenomenon.

4. Conclusions

The atmospheric polarization distribution patterns during the SBBM were investigated. As a result, the celestial polarization patterns during the SBBM night suffered a change at the beginning of the partial eclipse. As the obscuration ratio of the Moon increased, the distribution of the DoP gradually concentrated on a lower DoP. The AoP was asymmetrical about the meridian. The neutral point was not located on the lunar-anti-lunar meridian, and its characteristics were different from the traditional neutral point. The findings in this article have potential application prospects in some fields, especially in understanding the biological perception mechanism. Some influential factors that have potential relationships with various research fields were analyzed, such as the changes of DoP, which is used as a threshold in polarized navigation, and the changes of the symmetry of celestial polarization patterns, which may affect biological activity. This study made a preliminary exploration of the celestial polarization characteristics under the SBBM. However, the polarization patterns that occurred during the SBBM night were complex. It is the intention of the authors that further experiments be conducted and more observational data be obtained to quantify the phenomenon of the SBBM discussed herein.

Supplementary Materials

The following are available online at https://www.mdpi.com/2073-4433/11/4/372/s1: Table S1: Degree of Polarization (DoP) during the Super Blue Blood Moon (SBBM), Table S2: Angle of Polarization (AoP) during the Super Blue Blood Moon (SBBM), Table S3: Degree of Polarization (DoP) on 1 February 2018, Table S4: Angle of Polarization (AoP) on 1 February 2018.

Author Contributions

Conceptualization, Y.Y. and Y.W.; formal analysis, P.H.; investigation, J.Y., S.W., and Q.Z.; data curation, S.W. and Q.Z.; writing, Y.Y.; supervision, Y.W.; funding acquisition, Y.W. All authors read and agreed to the published version of the manuscript.

Funding

This research was funded by the National Natural Science Foundation of China (61627810, 61320106010, 61573019).

Acknowledgments

This study was supported by the National Natural Science Foundation of China (61627810, 61320106010, 61573019). The authors also thank the helpful comments and suggestions of the reviewers and Editor.

Conflicts of Interest

The authors declare no conflict of interest.

Abbreviations

The following abbreviations are used in this manuscript:
SBBMSuper Blue Blood Moon
AoPAngle of Polarization
DoPDegree of Polarization
LTLocal Time
UTCCoordinated Universal Time
GNSSGlobal Navigation Satellite System

References

  1. Bech, M.; Homberg, U.; Pfeiffer, K. Receptive fields of locust brain neurons are matched to polarization patterns of the sky. Curr. Biol. 2014, 24, 2124–2129. [Google Scholar] [CrossRef] [PubMed] [Green Version]
  2. Evangelista, C.; Kraft, P.; Dacke, M.; Labhart, T.; Srinivasan, M.V. Honeybee navigation: Critically examining the role of the polarization compass. Philos. Trans. R. Soc. B 2014, 369, 12. [Google Scholar] [CrossRef] [PubMed] [Green Version]
  3. Thorpe, W.H. Orientation and Methods of Communication of the Honey Bee and its Sensitivity to the Polarization of the Light. Nature 1949, 164, 11. [Google Scholar] [CrossRef] [PubMed]
  4. Rossel, S.; Wehner, R. Polarization vision in bees. Nature 1986, 323, 128. [Google Scholar] [CrossRef]
  5. Greif, S.; Borissov, I.; Yovel, Y.; Holland, R.A. A functional role of the sky’s polarization pattern for orientation in the greater mouse-eared bat. Nat. Commun. 2014, 5, 4. [Google Scholar] [CrossRef] [Green Version]
  6. Dacke, M.; Doan, T.A.; O’Carroll, D.C. Polarized light detection in spiders. J. Exp. Biol. 2001, 204, 2481–2490. [Google Scholar]
  7. Dacke, M.; Nilsson, D.E.; Warrant, E.J.; Blest, A.D.; Land, M.F.; O’Carroll, D.C. Built-in polarizers form part of a compass organ in spiders. Nature 1999, 401, 470. [Google Scholar] [CrossRef]
  8. Dacke, M.; Byrne, M.J.; Scholtz, C.H.; Warrant, E.J. Lunar orientation in a beetle. Proc. R. Soc. B 2004, 271, 361–365. [Google Scholar] [CrossRef] [Green Version]
  9. Dacke, M.; Nilsson, D.E.; Scholtz, C.H.; Byrne, M.; Warrant, E.J. Animal behavior: Insect orientation to polarized moonlight. Nature 2003, 424, 33. [Google Scholar] [CrossRef]
  10. Wehner, R. Desert ant navigation: How miniature brains solve complex tasks. J. Comp. Physiol. A 2003, 189, 579–588. [Google Scholar] [CrossRef] [Green Version]
  11. Fan, C.; Hu, X.P.; Lian, J.X.; Zhang, L.L.; He, X.F. Design and Calibration of a Novel Camera-Based Bio-Inspired Polarization Navigation Sensor. IEEE Sens. J. 2016, 16, 3640–3648. [Google Scholar] [CrossRef]
  12. Tang, J.; Zhang, N.; Li, D.; Wang, F.; Zhang, B.; Wang, C.; Shen, C.; Ren, J.; Xue, C.; Liu, J. Novel robust skylight compass method based on full-sky polarization imaging under harsh conditions. Opt. Express 2016, 24, 15834–15844. [Google Scholar] [CrossRef]
  13. Alexandrov, M.D.; Cairns, B.; Emde, C.; Ackerman, A.S.; van Diedenhoven, B. Accuracy assessments of cloud droplet size retrievals from polarized reflectance measurements by the research scanning polarimeter. Remote. Sens. Environ. 2012, 125, 92–111. [Google Scholar] [CrossRef] [Green Version]
  14. Fomin, B.; Falaleeva, V. A polarized atmospheric radiative transfer model for calculations of spectra of the stokes parameters of shortwave radiation based on the line-by-line and Monte Carlo methods. Atmosphere 2012, 3, 451–467. [Google Scholar] [CrossRef] [Green Version]
  15. Yang, J.; Du, T.; Niu, B.; Li, C.; Qian, J.; Guo, L. A Bionic Polarization Navigation Sensor Based on Polarizing Beam Splitter. IEEE Access 2018, 6, 11472–11481. [Google Scholar] [CrossRef]
  16. Tan, S.; Zhang, X.; Shi, G. MODIS Cloud Detection Evaluation Using CALIOP over Polluted Eastern China. Atmosphere 2019, 10, 333. [Google Scholar] [CrossRef] [Green Version]
  17. De Oliveira, A.M.; Souza, C.T.; de Oliveira, N.P.; Melo, A.K.; Lopes, F.J.; Landulfo, E.; Elbern, H.; Hoelzemann, J.J. Analysis of Atmospheric Aerosol Optical Properties in the Northeast Brazilian Atmosphere with Remote Sensing Data from MODIS and CALIOP/CALIPSO Satellites, AERONET Photometers and a Ground-Based Lidar. Atmosphere 2019, 10, 594. [Google Scholar] [CrossRef] [Green Version]
  18. Harrington, D.M.; Kuhn, J.R.; Ariste, A.L. Daytime sky polarization calibration limitations. J. Astron. Telesc. Instrum. Syst. 2017, 3, 018001. [Google Scholar] [CrossRef] [Green Version]
  19. Bhandari, P.; Voss, K.J.; Logan, L.; Twardowski, M. The variation of the polarized downwelling radiance distribution with depth in the coastal and clear ocean. J. Geophys. Res. Ocean. 2011, 116. [Google Scholar] [CrossRef] [Green Version]
  20. Xu, Z.; Yue, D.K.; Shen, L.; Voss, K.J. Patterns and statistics of in-water polarization under conditions of linear and nonlinear ocean surface waves. J. Geophys. Res. Ocean. 2011, 116. [Google Scholar] [CrossRef] [Green Version]
  21. Barta, A.; Farkas, A.; Szaz, D.; Egri, A.; Barta, P.; Kovacs, J.; Csak, B.; Jankovics, I.; Szabo, G.; Horvath, G. Polarization transition between sunlit and moonlit skies with possible implications for animal orientation and Viking navigation: Anomalous celestial twilight polarization at partial moon. Appl. Opt. 2014, 53, 5193–5204. [Google Scholar] [CrossRef] [Green Version]
  22. Cronin, T.W.; Warrant, E.J.; Greiner, B. Celestial polarization patterns during twilight. Appl. Opt. 2006, 45, 5582–5589. [Google Scholar] [CrossRef]
  23. Horvath, G.; Barta, A.; Gal, J.; Suhai, B.; Haiman, O. Ground-based full-sky imaging polarimetry of rapidly changing skies and its use for polarimetric cloud detection. Appl. Opt. 2002, 41, 543–559. [Google Scholar] [CrossRef]
  24. Shaw, G.E. Sky brightness and polarization during the 1973 African eclipse. Appl. Opt. 1975, 14, 388–394. [Google Scholar] [CrossRef]
  25. Chen, W.; Bai, S.; Wang, D.; Zhao, H.; Li, Z. Aerosol-induced changes in sky polarization pattern: Potential hint on applications in polarimetric remote sensing. Int. J. Remote Sens. 2019, 1–18. [Google Scholar] [CrossRef] [Green Version]
  26. Hasekamp, O.P.; Litvinov, P.; Butz, A. Aerosol properties over the ocean from PARASOL multiangle photopolarimetric measurements. J. Geophys. Res. 2011, 116. [Google Scholar] [CrossRef] [Green Version]
  27. Gao, M.; Zhai, B.A.P.W.; Franz, Y.H.; Knobelspiesse, P.K.; Werdell, J.; Ibrahim, A.; Cairns, B.; Chase, A. Inversion of Multiangular Polarimetric Measurements over Open and Coastal Ocean Waters: A Joint Retrieval Algorithm for Aerosol and Water-leaving Radiance Properties. Atmos. Meas. Tech. 2019, 12, 3921–3941. [Google Scholar] [CrossRef] [Green Version]
  28. Wang, H.; Yang, L.; Zhao, M.; Du, W.; Liu, P.; Sun, X. The Normalized Difference Vegetation Index and Angular Variation of Surface Spectral Polarized Reflectance Relationships: Improvements on Aerosol Remote Sensing Over Land. Earth Space Sci. 2019, 6, 982–989. [Google Scholar] [CrossRef] [Green Version]
  29. Zhao, H.; Xu, W.; Zhang, Y.; Li, X.; Zhang, H.; Xuan, J.; Jia, B. Polarization patterns under different sky conditions and a navigation method based on the symmetry of the AOP map of skylight. Opt. Express 2018, 26. [Google Scholar] [CrossRef]
  30. Gál, J.; Horváth, G.; Meyer-Rochow, V.B.; Wehner, R. Polarization patterns of the summer sky and its neutral points measured by full-sky imaging polarimetry in Finnish Lapland north of the Arctic Circle. Proc. R. Soc. Lond. Ser. A Math. Phys. Eng. Sci. 2001, 457, 1385–1399. [Google Scholar] [CrossRef]
  31. Hegedüs, R.; Åkesson, S.; Wehner, R.; Horváth, G. Could Vikings have navigated under foggy and cloudy conditions by skylight polarization? On the atmospheric optical prerequisites of polarimetric Viking navigation under foggy and cloudy skies. Proc. R. Soc. A Math. Phys. Eng. Sci. 2007, 463, 1081–1095. [Google Scholar] [CrossRef]
  32. Hegedüs, R.; Åkesson, S.; Horváth, G. Polarization patterns of thick clouds: Overcast skies have distribution of the angle of polarization similar to that of clear skies. J. Opt. Soc. Am. A 2007, 24, 2347–2356. [Google Scholar] [CrossRef] [PubMed]
  33. Gál, J.; Horváth, G.; Barta, A.; Wehner, R. Polarization of the moonlit clear night sky measured by full-sky imaging polarimetry at full Moon: Comparison of the polarization of moonlit and sunlit skies. J. Geophys. Res. 2001, 106, 22647–22653. [Google Scholar] [CrossRef]
  34. Kyba, C.C.; Ruhtz, T.; Fischer, J.; Hölker, F. Lunar skylight polarization signal polluted by urban lighting. J. Geophys. Res. 2011, 116. [Google Scholar] [CrossRef] [Green Version]
  35. Guan, L.; Li, S.; Zhai, L.; Liu, S.; Liu, H.; Lin, W.; Cui, Y.; Chu, J.; Xie, H. Study on skylight polarization patterns over the ocean for polarized light navigation application. Appl. Opt. 2018, 57, 6243–6251. [Google Scholar] [CrossRef]
  36. Pomozi, I.; Gal, J.; Horvath, G.; Wehner, R. Fine structure of the celestial polarization pattern and its temporal change during the total solar eclipse of 11 August 1999. Remote Sens. Environ. 2001, 76, 181–201. [Google Scholar] [CrossRef]
  37. Horváth, G.; Pomozi, I.; Gál, J. Neutral points of skylight polarization observed during the total eclipse on 11 August 1999. Appl. Opt. 2003, 42, 465–475. [Google Scholar] [CrossRef] [Green Version]
  38. Sipöcz, B.; Hegedüs, R.; Kriska, G.; Horváth, G. Spatiotemporal change of sky polarization during the total solar eclipse on 29 March 2006 in Turkey: Polarization patterns of the eclipsed sky observed by full-sky imaging polarimetry. Appl. Opt. 2008, 47, H1–H10. [Google Scholar] [CrossRef]
  39. Usman, K.A.; Habersetzer, J.; Subbaraj, R.; Gopalkrishnaswamy, G.; Paramanandam, K. Behaviour of bats during a lunar eclipse. Behav. Ecol. Sociobiol. 1980, 7, 79–81. [Google Scholar] [CrossRef]
  40. Singaravelan, N.; Marimuthu, G. Moonlight inhibits and lunar eclipse enhances foraging activity of fruit bats in an orchard. Curr. Sci. 2002, 82, 1020–1022. [Google Scholar]
  41. Donati, G.; Lunardini, A.; Kappeler, P.; Borgognini Tarli, S. Nocturnal activity in the cathemeral red-fronted lemur (Eulemur fulvus rufus), with observations during a lunar eclipse. Am. J. Primatol. 2001, 53, 69–78. [Google Scholar] [CrossRef]
  42. Tarling, G. The effect of lunar eclipse on the vertical migration behavior of Meganyctiphanes norvegica (Crustacea: Euphausiacea) in the Ligurian Sea. J. Plankton Res. 1999, 21, 1475–1488. [Google Scholar] [CrossRef] [Green Version]
  43. Janousek, T.E.; Olson, J.K. Effect of a lunar eclipse on the flight activity of mosquitoes in the upper Gulf Coast of Texas. J. Am. Mosq. Control Assoc. 1994, 10, 222–224. [Google Scholar]
  44. Können, G.P. Skylight polarization during a total solar eclipse: A quantitative model. J. Opt. Soc. Am. A 1987, 4, 601–608. [Google Scholar] [CrossRef]
  45. Suhai, B.; Horváth, G. How well does the Rayleigh model describe the E-vector distribution of skylight in clear and cloudy conditions? A full-sky polarimetric study. J. Opt. Soc. Am. A 2004, 21, 1669–1676. [Google Scholar] [CrossRef]
  46. Bickel, W.S.; Bailey, W.M. Stokes vectors, Mueller matrices, and polarized scattered light. Am. J. Phys. 1985, 53, 468. [Google Scholar] [CrossRef]
  47. Wu, L.; Gao, J.; Fan, Z.; Zhang, J. Measurements of skylight polarization: A case study in urban region with high-loading aerosol. Appl. Opt. 2015, 54. [Google Scholar] [CrossRef]
  48. Yan, B.; Wang, B.; Li, Y. Optimal ellipse fitting method based on least-square principle. J. Beijing Univ. Aeronaut. Astronaut. 2008, 34, 295–298. [Google Scholar]
  49. James, J.F.; John, D.K.; El Basil, J.; Jochenm, S.; Lana, K.; Emily, B.; Marcus, J.B.; Dan-Eric, N.; Sönke, J.; Marie, D. Orienting to polarized light at night-matching lunar skylight to performance in a nocturnal beetle. J. Exp. Biol. 2018. [Google Scholar] [CrossRef] [Green Version]
  50. Warrant, E.; Dacke, M. Visual Navigation in Nocturnal Insects. Physiology 2016, 31, 182–192. [Google Scholar] [CrossRef] [Green Version]
  51. Coulson, K.L. Polarization and Intensity of Light in the Atmosphere; A. Deepak Publishing: Hampton, VA, USA, 1988. [Google Scholar]
  52. Berry, M.V.; Dennis, M.R.; Lee, R.L. Polarization singularities in the clear sky. New J. Phys. 2004, 6, 162. [Google Scholar] [CrossRef]
Figure 1. Chronological celestial polarization patterns (aj) corresponding to the recording time on 31 January 2018 listed in Table 2. The Degree of Polarization (DoP; Table S1) and Angle of Polarization (AoP; Table S2) from the celestial patterns measured during the Super Blue Blood Moon (SBBM) are presented in the first and second columns, respectively. Ideal celestial polarization patterns of the DoP and AoP based on the single-scattering Rayleigh model were simulated at the same time and location as the first two experimental data columns. The time shown above is Local Time (LT).
Atmosphere 11 00372 g001
Figure 2. Frequency changes of the Degree of Polarization (DoP) in different stages of the Super Blue Blood Moon (SBBM). The stages of lunar eclipse are represented by different colors. (aj) Frequency of DoP in realistic sky corresponding to the recording time on 31 January in Table 2. The time shown above is Local Time (LT).
Atmosphere 11 00372 g002
Figure 3. Degree of Polarization (DoP) corresponding to the direction parallel to the lunar-anti-lunar meridian. (aj) corresponding to the recording time on 31 January in Table 2. The dots and solid lines represent the values of DoP and their fitted curve, respectively.
Atmosphere 11 00372 g003
Figure 4. Celestial polarization patterns on 1 February 2018 at the same location and facility as on 31 January 2018. The Degree of Polarization (DoP; Table S3) and Angle of Polarization (AoP; Table S4) of the measurement are shown in the first, second, fourth, and fifth columns. The characteristics of the DoP along the lunar-anti-lunar meridian are shown in the third and sixth columns in which the dots and solid lines represent the values of DoP and their fitted curve, respectively. (ah) Polarization patterns in normal sky corresponding to the recording time on 1 February in Table 2.
Atmosphere 11 00372 g004
Figure 5. Frequency change of the Degree of Polarization (DoP) during the normal sky. (ah) Frequency of DoP in normal sky corresponding to the recording time on 1 February in Table 2. The time shown above is Local Time (LT).
Atmosphere 11 00372 g005
Figure 6. Degree of Polarization (DoP) and Angle of Polarization (AoP) of the Super Blue Blood Moon (SBBM) night at 23:13 Local Time (LT) [(a,b) and 23:18 (LT) (c,d). The geometric centers of unpolarized area in the DoP graphs are represented by the red points. The red points with uncertain AoP directions are shown in the AoP graphs. Red points located at the bottom right corner are expressed as Neutral Point 1 and at the bottom left corner as Neutral Point 2. The DoP and AoP along the local meridian passing through red Points 1 and 2 are shown on the right.
Atmosphere 11 00372 g006
Table 1. Parameters of the Super Blue Blood Moon (SBBM) on 31 January 2018.
Date31 January 2018Time Zone: Local Time (LT)
Latitude 40 ° 23 44  N
Longitude 117 ° 34 47  E
Time of lunar eclipsePenumbral begins (first contact):18:51
Partial eclipse begins (second contact):19:48
Total eclipse begins (third contact):20:51
Greatest eclipse:21:29
Total eclipse ends (fourth contact):22:07
Partial eclipse ends (fifth contact):23:11
Penumbral ends (sixth contact):24:08
Umbral magnitude1.3155
Penumbral magnitude2.2941
Table 2. Parameters of the measurement at Local Time (LT).
12345678910
Recording time (31 January)19:4219:4920:1320:2620:5221:3422:2122:3923:1323:18
Lunar elevation ( ° )26273234394654576162
Recording time (1 February)22:3022:3722:4922:5923:3123:3723:4123:51
Lunar elevation ( ° )4344474853545456

