Article

Impact of Air–Wave–Sea Coupling on the Simulation of Offshore Wind and Wave Energy Potentials

1
Department of Earth Sciences, Uppsala University, 752 36 Uppsala, Sweden
2
Rosenstiel School of Marine and Atmospheric Science, University of Miami, Miami, FL 33146, USA
*
Author to whom correspondence should be addressed.
Atmosphere 2020, 11(4), 327; https://doi.org/10.3390/atmos11040327
Submission received: 15 January 2020 / Revised: 24 March 2020 / Accepted: 25 March 2020 / Published: 28 March 2020
(This article belongs to the Special Issue Waves and Wave Climate Analysis and Modeling)

Abstract

:
Offshore wind and wave energy potentials are commonly simulated by atmosphere and wave stand-alone models, in which the Atmosphere–Wave–Ocean (AWO) dynamical coupling processes are neglected. Based on four experiments (simulated by UU-CM, Uppsala University-Coupled model) with four different coupling configurations between atmosphere, waves, and ocean, we found that the simulations of the wind power density (WPD) and wave potential energy (WPE) are sensitive to the AWO interaction processes over the North and Baltic Seas; in particular, to the atmosphere–ocean coupling processes. Adding all coupling processes can change more than 25% of the WPE but only less than 5% of the WPD in four chosen coastal areas. The impact of the AWO coupling processes on the WPE and WPD changes significantly with the distance off the shoreline, and the influences vary with regions. From the simulations used in this study, we conclude that the AWO coupling processes should be considered in the simulation of WPE and WPD.

1. Introduction

In a warming global climate, more extreme weather events are expected to occur, such as super hurricanes, extreme precipitation events, and flooding. Fossil fuels are one of the major contributors to greenhouse gas emission. To reduce the greenhouse gas emission, renewable energy sources, such as wind and wave energy, are future alternatives to fossil fuels. Offshore wind and wave energy have attracted the attention of the scientific community and the energy industry due to their advantages [1,2]. In recent years, many offshore wind and wave farms have been (or plan to be) built around the world, in particular in Europe.
A spatio-temporal energy resource assessment is one of the most critical steps before implementing wave energy converters or constructing wind turbines. The numerical simulation is an important tool for the energy resource assessment and provides valuable information for the wind/wave farm site chosen as well as their daily operation. The energy potential of waves and wind is usually simulated by stand-alone models with the boundary forcing from external data sets [3,4,5,6], in which the two-way interaction processes between the atmosphere, wave, and ocean are neglected. However, many studies have shown that the Atmosphere–Wave–Ocean (AWO) interaction processes are essential for the wind and wave simulations [7].
The sea surface roughness, an important factor for atmospheric models, can be significantly altered by ocean waves. To capture the wave influences, many sea-state-dependent surface roughness parameterizations have been developed and implemented in atmospheric models [8,9]. Under high winds, sea spray-induced intensive wave breaking decreases the sea surface effective roughness length and affects the wind stress [10]. Different from wind waves, swell waves affect the marine atmospheric boundary layer to a much higher layer through changing the momentum flux and atmospheric mixing [9,11,12,13]. Tuning model parameterizations is a common way to improving model performance. However, the wave influences cannot be captured by a stand-alone atmospheric model through tuning model parameterizations [14]. Twenty-three years storms are simulated using an atmosphere–wave-coupled model, Larsen et al. [15] found that the coupled model improves the wind simulation considerably when compared with the measurements from five offshore sites around Denmark, in particular when the mean wind speed at 10 m U 10 > 20   m   s 1 . On the low wind and swell conditions, the wind simulation is improved when sea-state-dependent wind stress parameterization is implemented into an atmosphere–wave-coupled system [12]. Based on computational fluid dynamics (CFD) simulations with a moving mesh that resolves the ocean waves, Kalvig et al. [16] found that the wind field at the turbine rotor height varies with different wave states. The atmospheric stability is another important factor when estimating the offshore wind power [17], which is primarily determined by the air–sea temperature difference. Without the two-way atmosphere–ocean interaction processes, the marine atmospheric stability altered by the updated sea surface temperature (SST) cannot be captured.
In addition to the wind speed, many other interaction processes can also affect the wave potential energy (WPE) simulation. In coastal areas, coastal wave reflection alters the directional properties of coastal sea state [18]. Ocean currents shift the wave frequency through the Doppler effect [19]. In coastal areas, the complicated current distribution makes the Doppler effect on waves more important for the simulation of WPE. The sea surface height induced by tide or ocean circulation affects the wave simulation by changing the coastal water level. The wave–tide interaction impact on the wave and tide energy has been investigated in a few studies [20,21].
The wave–current interaction alters the SST and currents by changing the upper ocean turbulence [22], and they indirectly affect the wind and wave energy simulation. Only a fully coupled system can capture those two-way dynamical interaction processes between different components. The assessment of the potential of wind and wave energy needs high-resolution simulations with detailed information about the spatial distribution of the energy potentials. The coupling processes are more important for the simulation of potential wind and wave energy since the coupling influence is more important with the increase of model resolution [23]. Many coupled modelling systems have been developed for studying the impacts of coupling processes on the atmosphere and ocean circulations, such as Coupled Ocean–Atmosphere–Waves–Sediment Transport (COAWST) [24,25], Uppsala University-Coupled Model (UU-CM) [7], ALADIN-POM-coupled model [26], the regional coupled prediction system UKC2 and UKC3 [27,28], etc. Those coupled systems have been applied for studying various atmospheric/oceanic systems. Compared with uncoupled systems, improved results have been reported from coupled systems on the simulations of cyclones, extreme winds, dense water formation events, and etc. [23,29,30,31].
The importance of AWO interaction processes has attracted the attention of the research community. However, the impact of those AWO interaction processes on the potential wind and wave energy simulation are rarely investigated. As summarized by [32], there is still a gap between the knowledge of science and its application in offshore wind energy simulation. An improved two-way AWO coupling system is important for the offshore wind and wave energy forecast. In this study, we focus on the impact of AWO coupling processes on the simulation of wind and wave energy potentials. We try to answer the question: Is it necessary to consider AWO dynamical interaction processes when simulating wind and wave energy potentials? The paper is organized as follows: Section 2 introduces the coupled model and the sensitivity experiments, as well as the methods used for estimating wind and wave energy potentials. The results are presented in Section 3 and discussed in Section 4. Finally, conclusions are summarized in Section 5.

2. Method and Experiments

2.1. Energy Potential Parameters

The Wind Power Density (WPD, unit: W   m   s 2 ) is a parameter for estimating the wind energy at a location, which is defined as
P a = 1 2 ρ a U z 3 ¯ ,
where U z is the wind speed at the hub height of a wind turbine (typically 50–120 m), and ρ a is the air density in k g   m 3 . The output from the model levels is interpolated into the hub height [33,34]. The air density is calculated based on the pressure, humidity, and temperature from the model output. In this study, we use z = 120 m above the mean sea surface level as an example for analysing the AWO impact on the WPD.
The WPE (available wave power per meter of wave crest) can be estimated by
P w = ρ w g 0 2 π 0 C G ( f , θ ) F ( f , θ ) d f d θ ,
where ρ w is the density of water in k g   m 3 , f represents the frequency, θ denotes the wave direction, and F ( f , θ ) is the wave spectrum density, and the group velocity C G can be calculated by [35]
C G = 1 2 1 + 2 k d s i n h ( 2 k d ) c ,
where k represents the wave number, d is the water depth, and c is the wave phase speed. In this study, the WPE is estimated by Equation (2) using the 2D wave spectrum in each model output step. The WPE can also be estimated from the integrated parameters when the 2D wave spectrum is not available [36].

2.2. Numerical Model

The fully coupled model, UU-CM (Uppsala University-Coupled model, [7]), is used in this study. The UU-CM includes the atmosphere, wave and ocean sub-component models. The three sub-component models run online at the same time, passing the results to other sub-component models every 30 min. The coupling variables between the sub-component models are shown in Figure 1. The coupler, OASIS3-MCT [37], is used for the information exchange between the three sub-components. For detailed information of the system refer to [7]. In this section, only a summary of the system is given.

2.2.1. WRF

The Weather Research and Forecasting (WRF) model, which is a three-dimensional non-hydrostatic atmospheric model [38], is used as the atmospheric component in UU-CM. The wind stress in the WRF model is estimated by
τ a = ρ a C d ( U 10 u 0 ) | U 10 u 0 | .
Here, u 0 is the surface current, U 10 is the mean wind at 10 m above the mean sea surface, and C d is the drag coefficient which is estimated by,
C d = κ 2 ln 2 ( z 10 / z 0 ) ,
where κ is von Kármán’s constant, z 10 = 10 m and z 0 = α c u * 2 / g is the air-side surface roughness length. u * and α c are the air-side friction velocity and the Charnock coefficient, respectively. The Charnock coefficient, α c , in the stand-alone WRF model is estimated by
α c = 0.011 + 0.007 × min max [ ( U 10 10 ) / 8 , 0 ] , 1.0 .
The domain of the WRF model is shown in Figure 2 with 5 km horizontal resolution and 31 vertical layers. The ERA-Interim data [39] provides the initial and lateral boundary conditions for the WRF model every six hours. The ERA-Interim data is a global atmospheric reanalysis data set with a spatial resolution of about 80 km (T255 spectral) on 60 vertical levels. The data was downloaded from https://apps.ecmwf.int/datasets/.

2.2.2. WW3

The WaveWatch-III (WW3) model [40] is a third generation wave model, which is the wave component of UU-CM. The balance equation for the wave action density spectrum N = F / σ is expressed as
N t + ( c g + u ) N + k · ( c k N ) = S σ .
Here, σ represents the intrinsic circular frequency. The group velocity is represented as c g , c k is the spectral advection velocity, k is the wave number, and u is the ocean current. The source term is donated as S. The Charnock coefficient is calculated using the 2D wave spectra in WW3 [41],
α c = α ^ 1 τ in / τ a
where α ^ = 0.0095 [42], τ in is the wave-supported stress calculated from 2D wave spectra [41],
τ in = ρ w g 0 2 π 0 k ω S in d ω d θ .
Here, S in is the wind input term, and ω is the angular frequency. The air-side stress can be found by iteratively calculating the roughness length from the modified Charnock coefficient. This is done the same as the coupling of ECWAM to the atmospheric model (see pp. 122–124 in [43]).
The momentum flux from waves to ocean currents is expressed as,
τ ds = ρ w g 0 2 π 0 k ω S ds d ω d θ .
Here, S ds is the dissipation term. The turbulent kinetic energy (TKE) injected into the upper ocean through wave breaking is
Φ oc = ρ w g 0 2 π 0 S ds d ω d θ .
The domain of the wave model is shown in Figure 2 as the colour area with a horizontal resolution of 2 nautical miles (3.7 km). The colour represents the topographical information for the wave model. The wave spectrum is discredited into 25 directions and 27 frequencies (from 0.0418 Hz to 0.4114 Hz). The six-hourly ERA-Interim data provides the boundary of the wave spectrum (27 frequencies and 25 directions) and ice cover information. The ETOPO5 is used to provide bathymetry information.

2.2.3. NEMO

The ocean component in UU-CM is the Nucleus of European Modelling of the Ocean (NEMO) model [44]. The NEMO model is a 3D-circulation model system. In this study, the physical core engines, sea–ice dynamics and thermodynamics were activated in the system. The governing equations in NEMO are expressed as [45],
D u D t = 1 ρ w p ( u s · ) u + u × f z ^ + u s × f z ^ + D u g z ^
D c D t = u s · c + D c
p z = ρ w g
· u = 0
· u s = 0
η t = h z = H z = η ( u h + u s ) d z .
Here, p is the pressure; u s is the Stokes drift; g is the gravitational acceleration, and z ^ is the vertical unit vector; η is the sea-surface height; D u and D c are the parameterisations of sub-grid scale physical processes for momentum and tracer equations, respectively.
For stand-alone ocean models, the stress in the ocean-side is assumed to be the same as the air-side stress, i.e., τ oc = τ a . The TKE flux injected by wave breaking is estimated by
Φ oc = 100 ρ w u * 3 ,
in which, u * is the ocean-side friction velocity. The roughness length in ocean models, which is used to calculate the ocean near surface mixing length, is estimated by
z 0 TKE = max ( 70 , 000 × u * 2 / g , 0.02 ) .
In reality, surface waves can redistribute the stress in time and space. Accordingly, the ocean-side stress in the fully coupled model can be expressed as
τ oc = τ a τ in τ ds ,
where τ ds is the momentum flux from the wave field to mean currents (always negative). τ ds is calculated from 2D wave spectra in the wave model. The water-side roughness can be estimated by
z 0 TKE = max ( H s , 0.02 )
where H s is the significant wave height.
The NEMO model has the same domain (the color area shown in Figure 2) and horizontal resolution (3.7 km) as the WW3 model. The topography data is also the same as the one used in WW3. The Janssen climatology data [46] provides the temperature and salinity boundary and initial condition for the NEMO model. The current and sea surface height boundary conditions are provided by the climatology data of ORAS4 with 1-degree horizontal resolution (downloaded from http://icdc.cen.uni-hamburg.de/projekte/easy-init/easy-init-ocean.html).

2.3. Experiments

Four experiments with different AWO coupling processes are used to investigate the impact of coupling processes on the simulation of wind and wave energy potentials. The coupling process differences in the four experiments are listed in Table 1. All the variable exchange between the different models are through OASIS3-MCT. In all of the two-way coupling experiments (Exp2, Exp3, and Exp4), the momentum flux is conservation at the air–sea interface.
  • Exp1: Exp1 is the control experiment, which is a one-way coupling experiment between WRF and WW3 components. The NEMO model is switched off. In this experiment, WW3 receives the wind field from WRF. WRF does not get any information from the wave model. In other words, this experiment is the same as that we run atmosphere and wave stand-alone models separately.
  • Exp2: In this experiment, the WRF and WW3 models are used. The difference from Exp1 is that the Charnock coefficient estimated by WW3 (sea-state-dependent Charnock coefficient) is used in WRF. In other words, WRF model incorporates the wave information in the simulations. Thus, the surface fluxes, such as wind stress, heat fluxes, and humidity fluxes, will be altered as a response to the sea-state-dependent Charnock coefficient. On the wave side, the new wind information forcing the wave model has indirect wave feedback, and the wave energy simulation is altered indirectly. The simulation difference between Exp2 and Exp1 is due to the atmosphere–wave interaction processes.
  • Exp3: The WRF, NEMO and WW3 are switched on in this experiment. The differences between Exp3 and Exp2 are that the atmosphere–ocean coupling processes are included in the system. The forcing data for NEMO is from the WRF model, which provides wind stress, short and long wave radiations, and net water flux (see Table 1). The variables that the NEMO model sends back to the WRF include surface currents and SST. The other settings are the same as in Exp2. Thus, the WPE and WPD difference between Exp3 and Exp2 is due to the atmosphere–ocean coupling processes.
  • Exp4: The wave–current interactions are activated in Exp4, which include (1) the sea-state-dependent water-side stress, (2) sea-state-dependent TKE flux, (3) Stokes drift impact on the currents (in terms of Coriolis–Stokes force and Stokes advection in the momentum and tracer equations), (4) wave impact on ocean surface TKE roughness length, and (5) ocean current impact on waves. The water level impact on the wave simulation is also added in this experiment. The water level information is from NEMO model where the tide impact is also included. The other settings are the same as in Exp3 (see Table 1 for the details of those processes). Thus, the difference between Exp4 and Exp3 is due to the wave–current interaction processes.
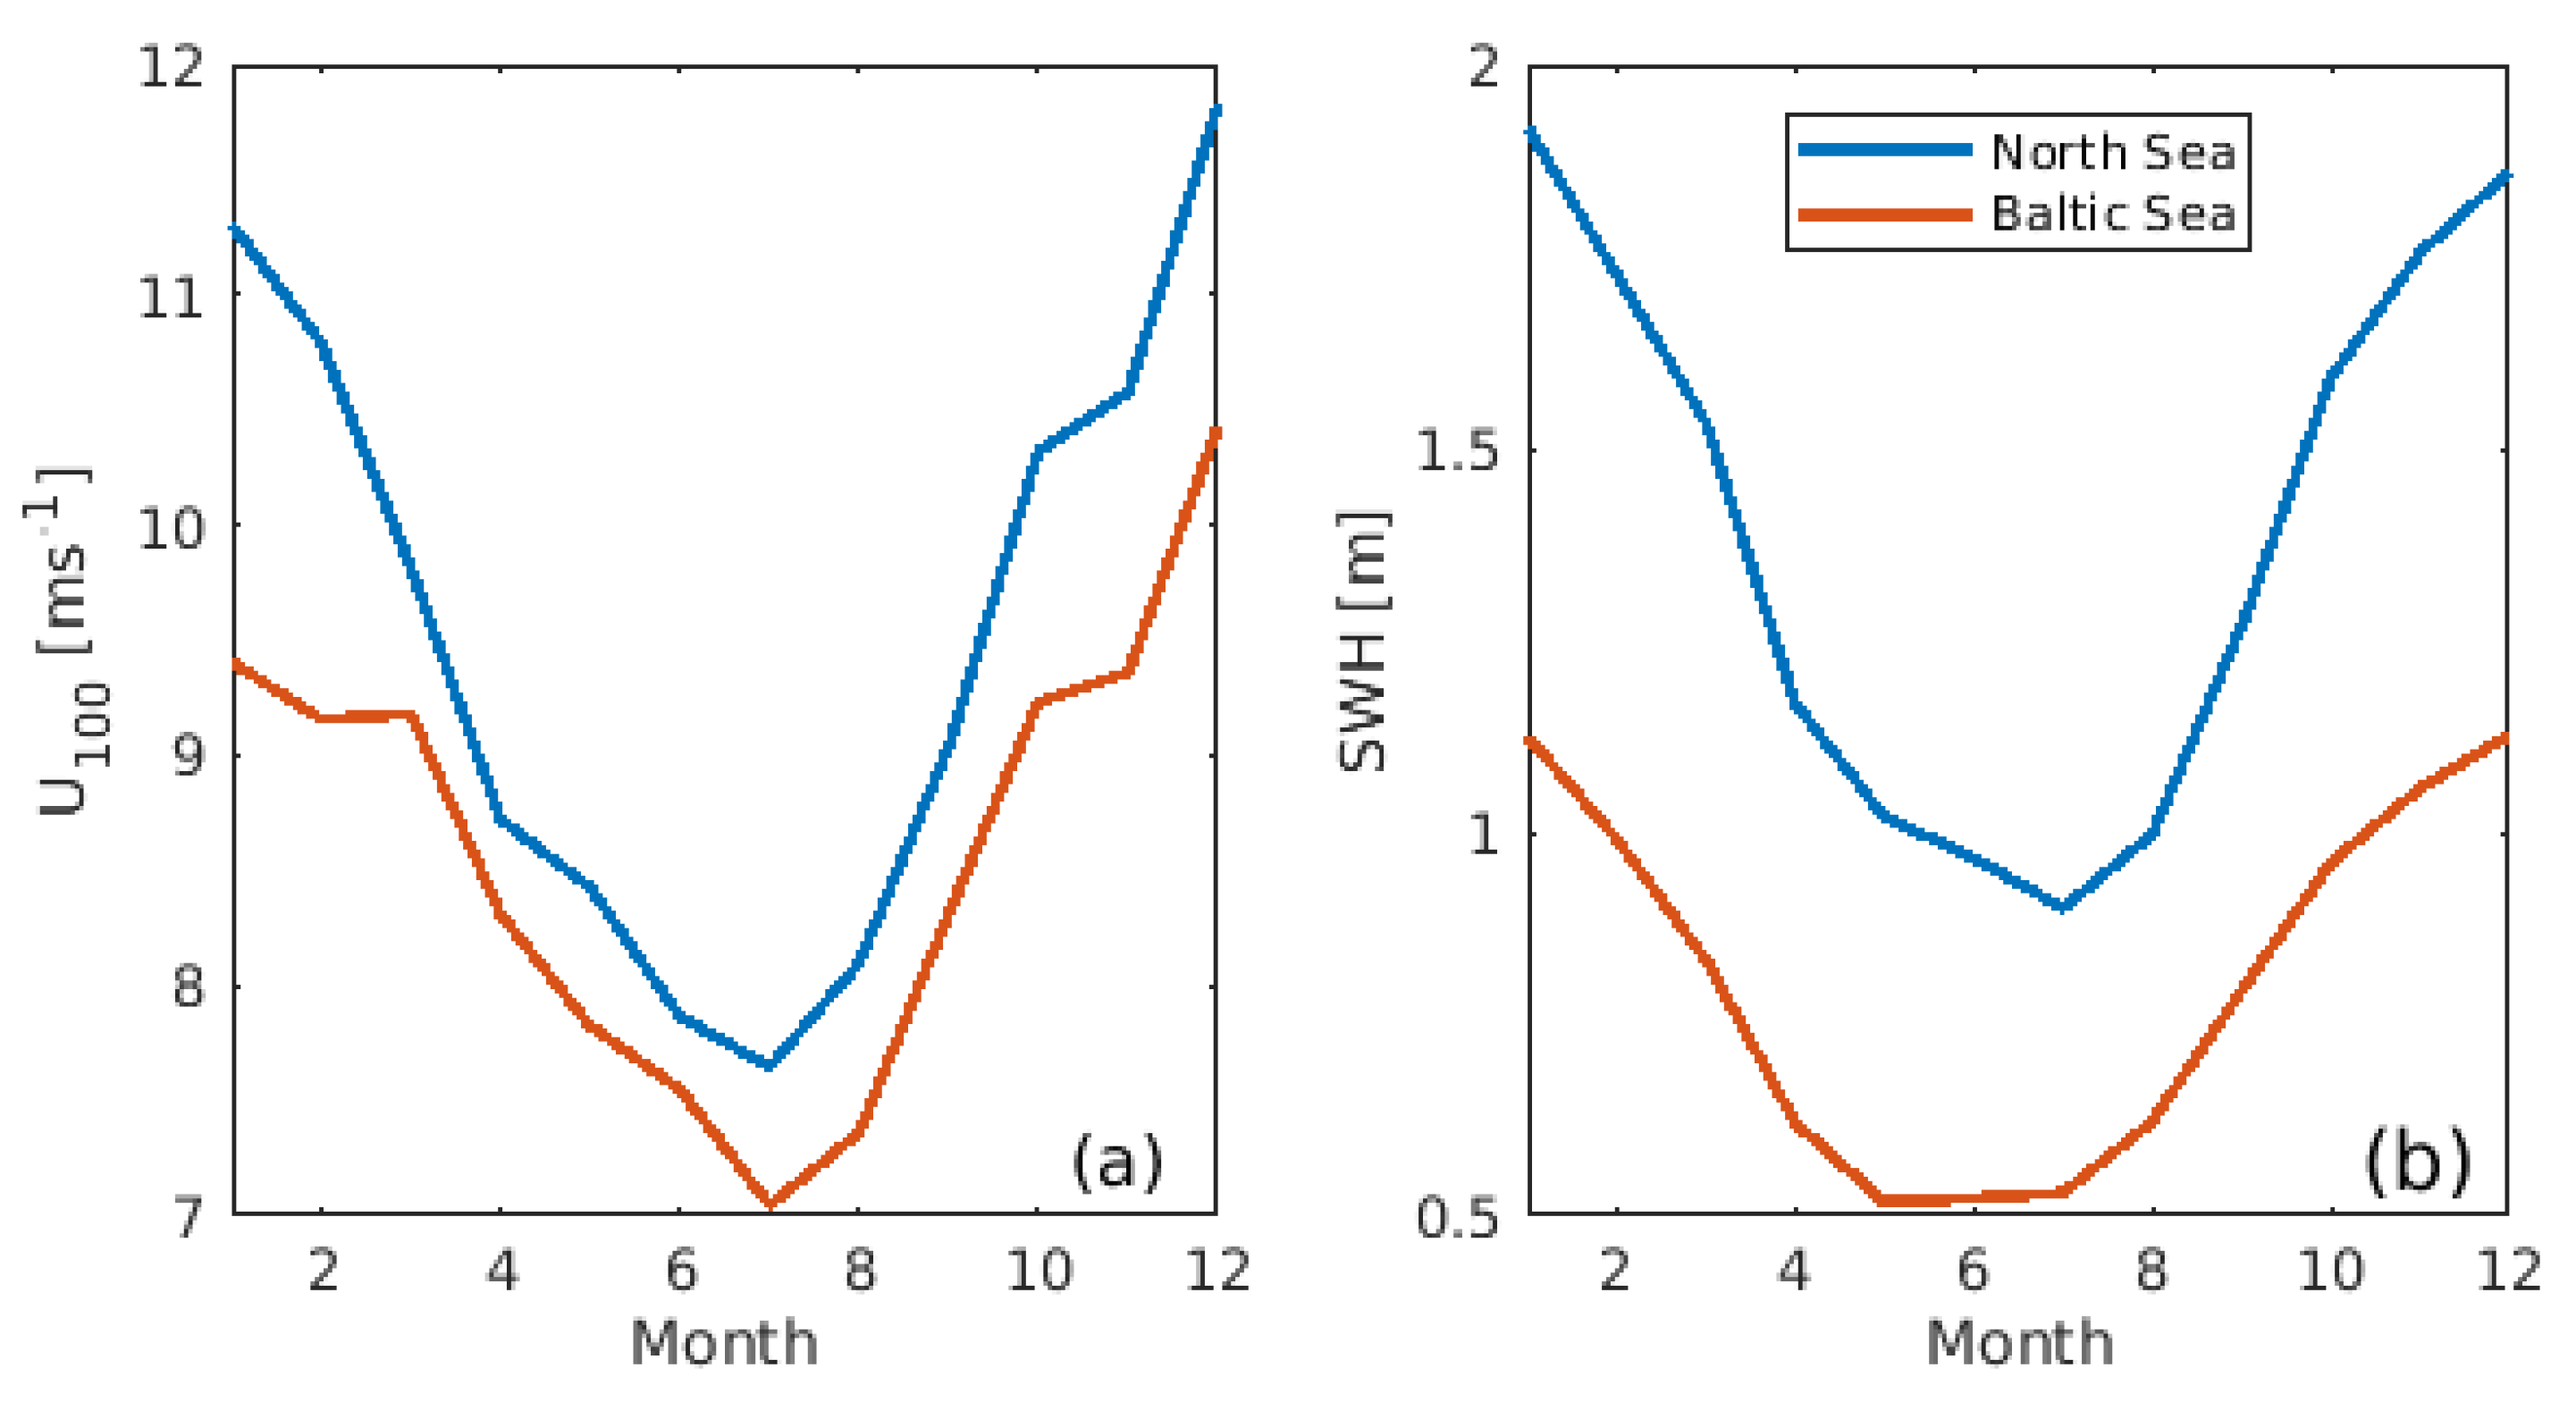
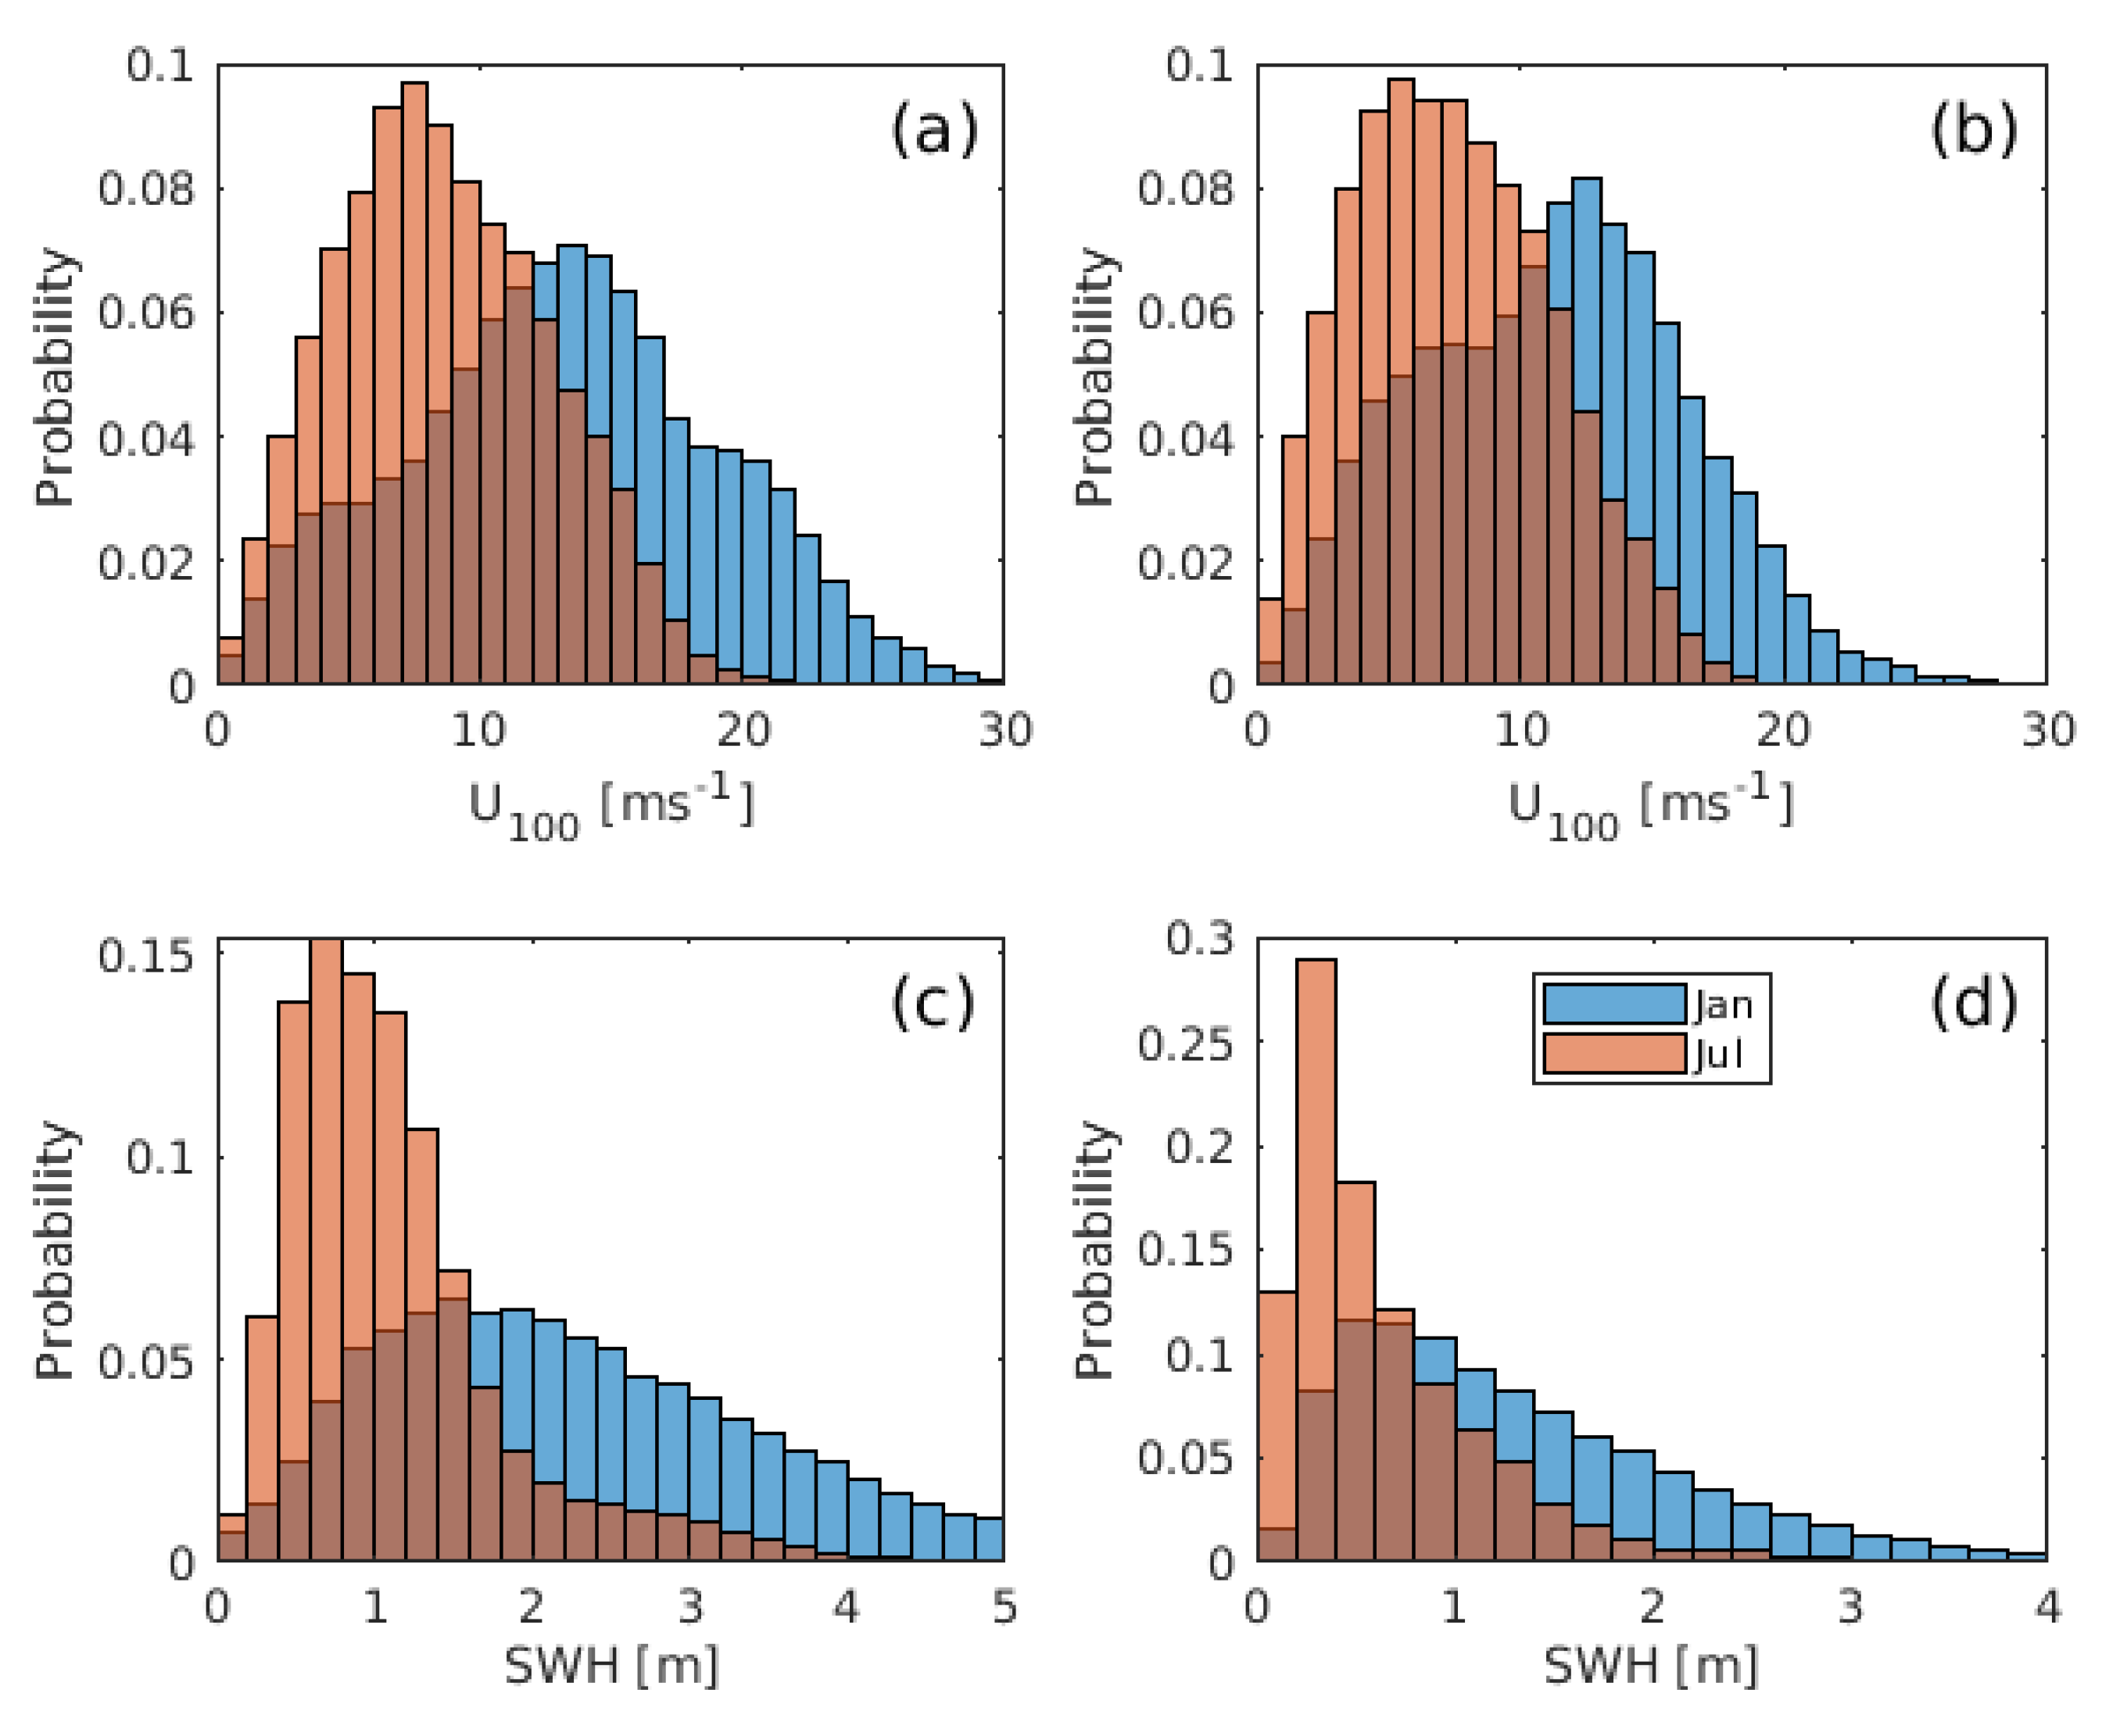
The mean wind speed and significant wave height in each month during 2010–2019 from ERA5 over the Baltic Sea and the North Sea are shown in Figure 3. There are clear annual patterns with high wind and wave in winter months and low wind and wave in summer months. In the winter months, the mean wind speed at 100 m is higher than 10 m s 1 (9 m s 1 ) in the North Sea (Baltic Sea). In the summer month, it decreases to smaller than 8 (7) m s 1 in the Baltic Sea and the North Sea. The mean significant wave height in January and December is twice higher than in July. Thus, two one-month-long simulations (January and July in 2015) done in [7] are used to investigate the impact of the AWO coupling on the energy simulation. The two 1-month simulations represent two typical scenarios in the simulation domain, a cold and windy winter month (January) and a warm and calm summer month (July). The normalized distribution of U 100 and significant wave height in the North Sea and Baltic Sea in the two months is shown in Figure 4. One can see that the high probability of U 100 and significant wave height is in a broader range in January than that in July. In the Baltic Sea, more than 50% of the significant wave height is less than 0.6 m. The impact of coupling processes on WPE and WPD highly depends on the sea state. Thus, those two months (January and July) represent the AWO impact on the generalized winter and summer months in the simulation domain. The simulation results have been compared with in situ and remote sensing measurements in [7]. The coupled system improves the simulation results when compared with the ERA5 reanalysis data and the remote sensing data. However, it does not have a significant improvement compared with in situ measurements. One possible reason is that we did not tune the model. The detail of the comparison between measurements and simulation results refer to [7]. In the following sections, we only focus on the impact of the coupling processes on the wind and wave energy potential simulations. The 3-hourly instantaneous variables from the simulations are used for the following analysis.

3. Results

3.1. Mean Energy Potentials

The mean WPD and WPE in January and July 2015 are shown in the subplots a and e of Figure 5 and Figure 6, respectively. The energy potentials of wind and waves in January are more than three times larger than in July in the north part of the North Sea. Generally, the spatial distribution patterns of the mean WPD in January are similar to that in July, except for the magnitude. However, the highest WPE areas in July are shifted to the northeast of the North Sea from the southeast of the North Sea. It is because the wind direction in the North Sea changed from west in January to northwest in July (see Figure 7a,b). Accordingly, the wind fetch is larger in July than in January, and the highest WPE area is shifted to the northeast in the North Sea.
The mean WPD varies significantly from the north to south in the Baltic Sea. In January, the mean WPD in the south Baltic Sea is more than 1900   W   m 2 (> 2300   W   m 2 in most areas of the North Sea), while in July it is up to 1000   W   m 2 . Getting near to the coastline, the WPD decreases significantly, in particular, at the Swedish coast. It is worth noting that the WPD is higher than the other coastal areas in the Baltic Sea in the two months.
Similar to the WPD, the WPE decreases from north to south in the Baltic Sea. The WPE in the southwest part of the Baltic Sea is > 14   W   m 1 in January, while it is > 6   W   m 1 in July. In the west part of the North Sea, the WPE is > 30   k W   m 1 in January, while it is > 6   k W   m 1 in July. In both the Baltic Sea and the North Sea, the WPE is generally higher in the east part than in the west part at the same latitude (Figure 6a,e). The direction of the wind and waves are from southwest to northeast (see Figure 7). The fetch limits the wave growth in the west coast and leads to the distribution pattern of the WPE, and it agrees with the climatological simulations presented in [6].

3.2. Impact of Coupling on Mean Energy Potentials

Comparing with Exp1, the atmosphere–wave coupling (Exp2, through implementing the sea-state-dependent wind stress) increases the WPD up to 2% ( 50   W   m 2 ) in January, while it reduces the WPD up to 3% ( 30   W   m 2 ) in July except some increases in the north part of the Baltic Sea (Figure 5b,f). Comparing with its influence in the North Sea, the atmosphere–wave coupling has less influence on the WPD in the Baltic Sea in January. In January, the atmosphere–wave coupling increases the WPE up to 3% ( 1   k W   m 1 ) in the most areas of the simulation domain except some decrease in some Baltic sea coasts (Figure 6b). In July, it reduces the WPE up to 4% ( 0.2   k W   m 1 ) compared with Exp1 but some increases in the Gulf of Bothnia and Polish coast areas (Figure 6f).
The atmosphere–ocean coupling processes (mainly through the feedback of SST and currents on the atmosphere, Exp3–Exp2) have much larger influences on the WPD and WPE than that from the other coupling processes investigated in this study (see Figure 5 and Figure 6). Comparing with Exp2, the atmosphere–ocean coupling increases the WPD (less than 5%, 50   W   m 2 ) in most of the simulation areas except some coastal areas in January (Figure 5c). In July, the atmosphere–ocean coupling increases the WPD up to 10% ( 80   W   m 2 ) in most areas away from the coastline. However, it reduces the WPD in some coastal areas (the east and south coast of the Baltic Sea and the British east coast) in July (Figure 5g). One needs to note that the impact of atmosphere–ocean coupling on the WPD pattern is different from its influence on the mean wind speed at 10 m (in general, it reduces the mean surface wind, which is not shown here, see Figure 4 in [7]). The main reason is that the wind profile and air density is altered by the ocean-atmosphere coupling associated SST and currents differences. The changes of wind profile vary with location (see Section 4 for more detailed discussions).
In January, the atmosphere–ocean coupling (Exp3–Exp2) reduces the WPE up to 16% ( 5   W   m 2 ) in the centre and west of the North Sea, while in the Baltic Sea it is less than 10% (Figure 6c). In July, the atmosphere–ocean coupling (Exp3–Exp2) increases the WPE up to 0.5   k W   m 1 (10%) in the North Sea, however, in the centre of the Baltic Sea it reduces the WPE more than 1   k W   m 1 (20%) (Figure 6g). At the Polish coast, it increases the WPE about 1.5   k W   m 1 (20%) compared with Exp2 in July.
The wave–current coupling processes have a relative small influence on the WPD in January (less than 1% difference from Exp3, up to 30   W   m 2 , see Figure 5d). However, in July, it has a relatively large influence (with a magnitude of more than 40   W   m 2 , 4%) on the WPD in the Baltic Sea, but a smaller influence in the North Sea. The wave–current coupling processes reduce the WPE up to 1.2   k W   m 1 (6%) in most of the North Sea (except a significant increase in the south coast of Norway) in January. In July, the difference (Exp4–Exp3) is less than 0.8   k W   m 1 (8%) in the North Sea. In the Baltic Sea, the wave–current coupling processes have a more significant influence in the coastal areas that the areas away from the coast (Figure 6d,h).

3.3. Energy Potentials Dependence on the Distance From Coast

In this section and Section 3.4, four chosen areas, i.e., Danish west coast (labeled as A), British east coast (labeled as B), coastal areas of Lithuania and Latvia (labeled as C), and the Polish coast (labeled as D) (see the areas with red lines in Figure 2), are used to investigate the energy potentials changes with the distance off the coastline (hereinafter referred to as L). The AWO coupling processes impact on the WPD and WPE changes with L is also investigated. The data from all the grid points of the four chosen areas are used to calculate the mean and standard deviation of the parameters shown in Figure 8, Figure 9, Figure 10, Figure 11, Figure 12, Figure 13 and Figure 14.
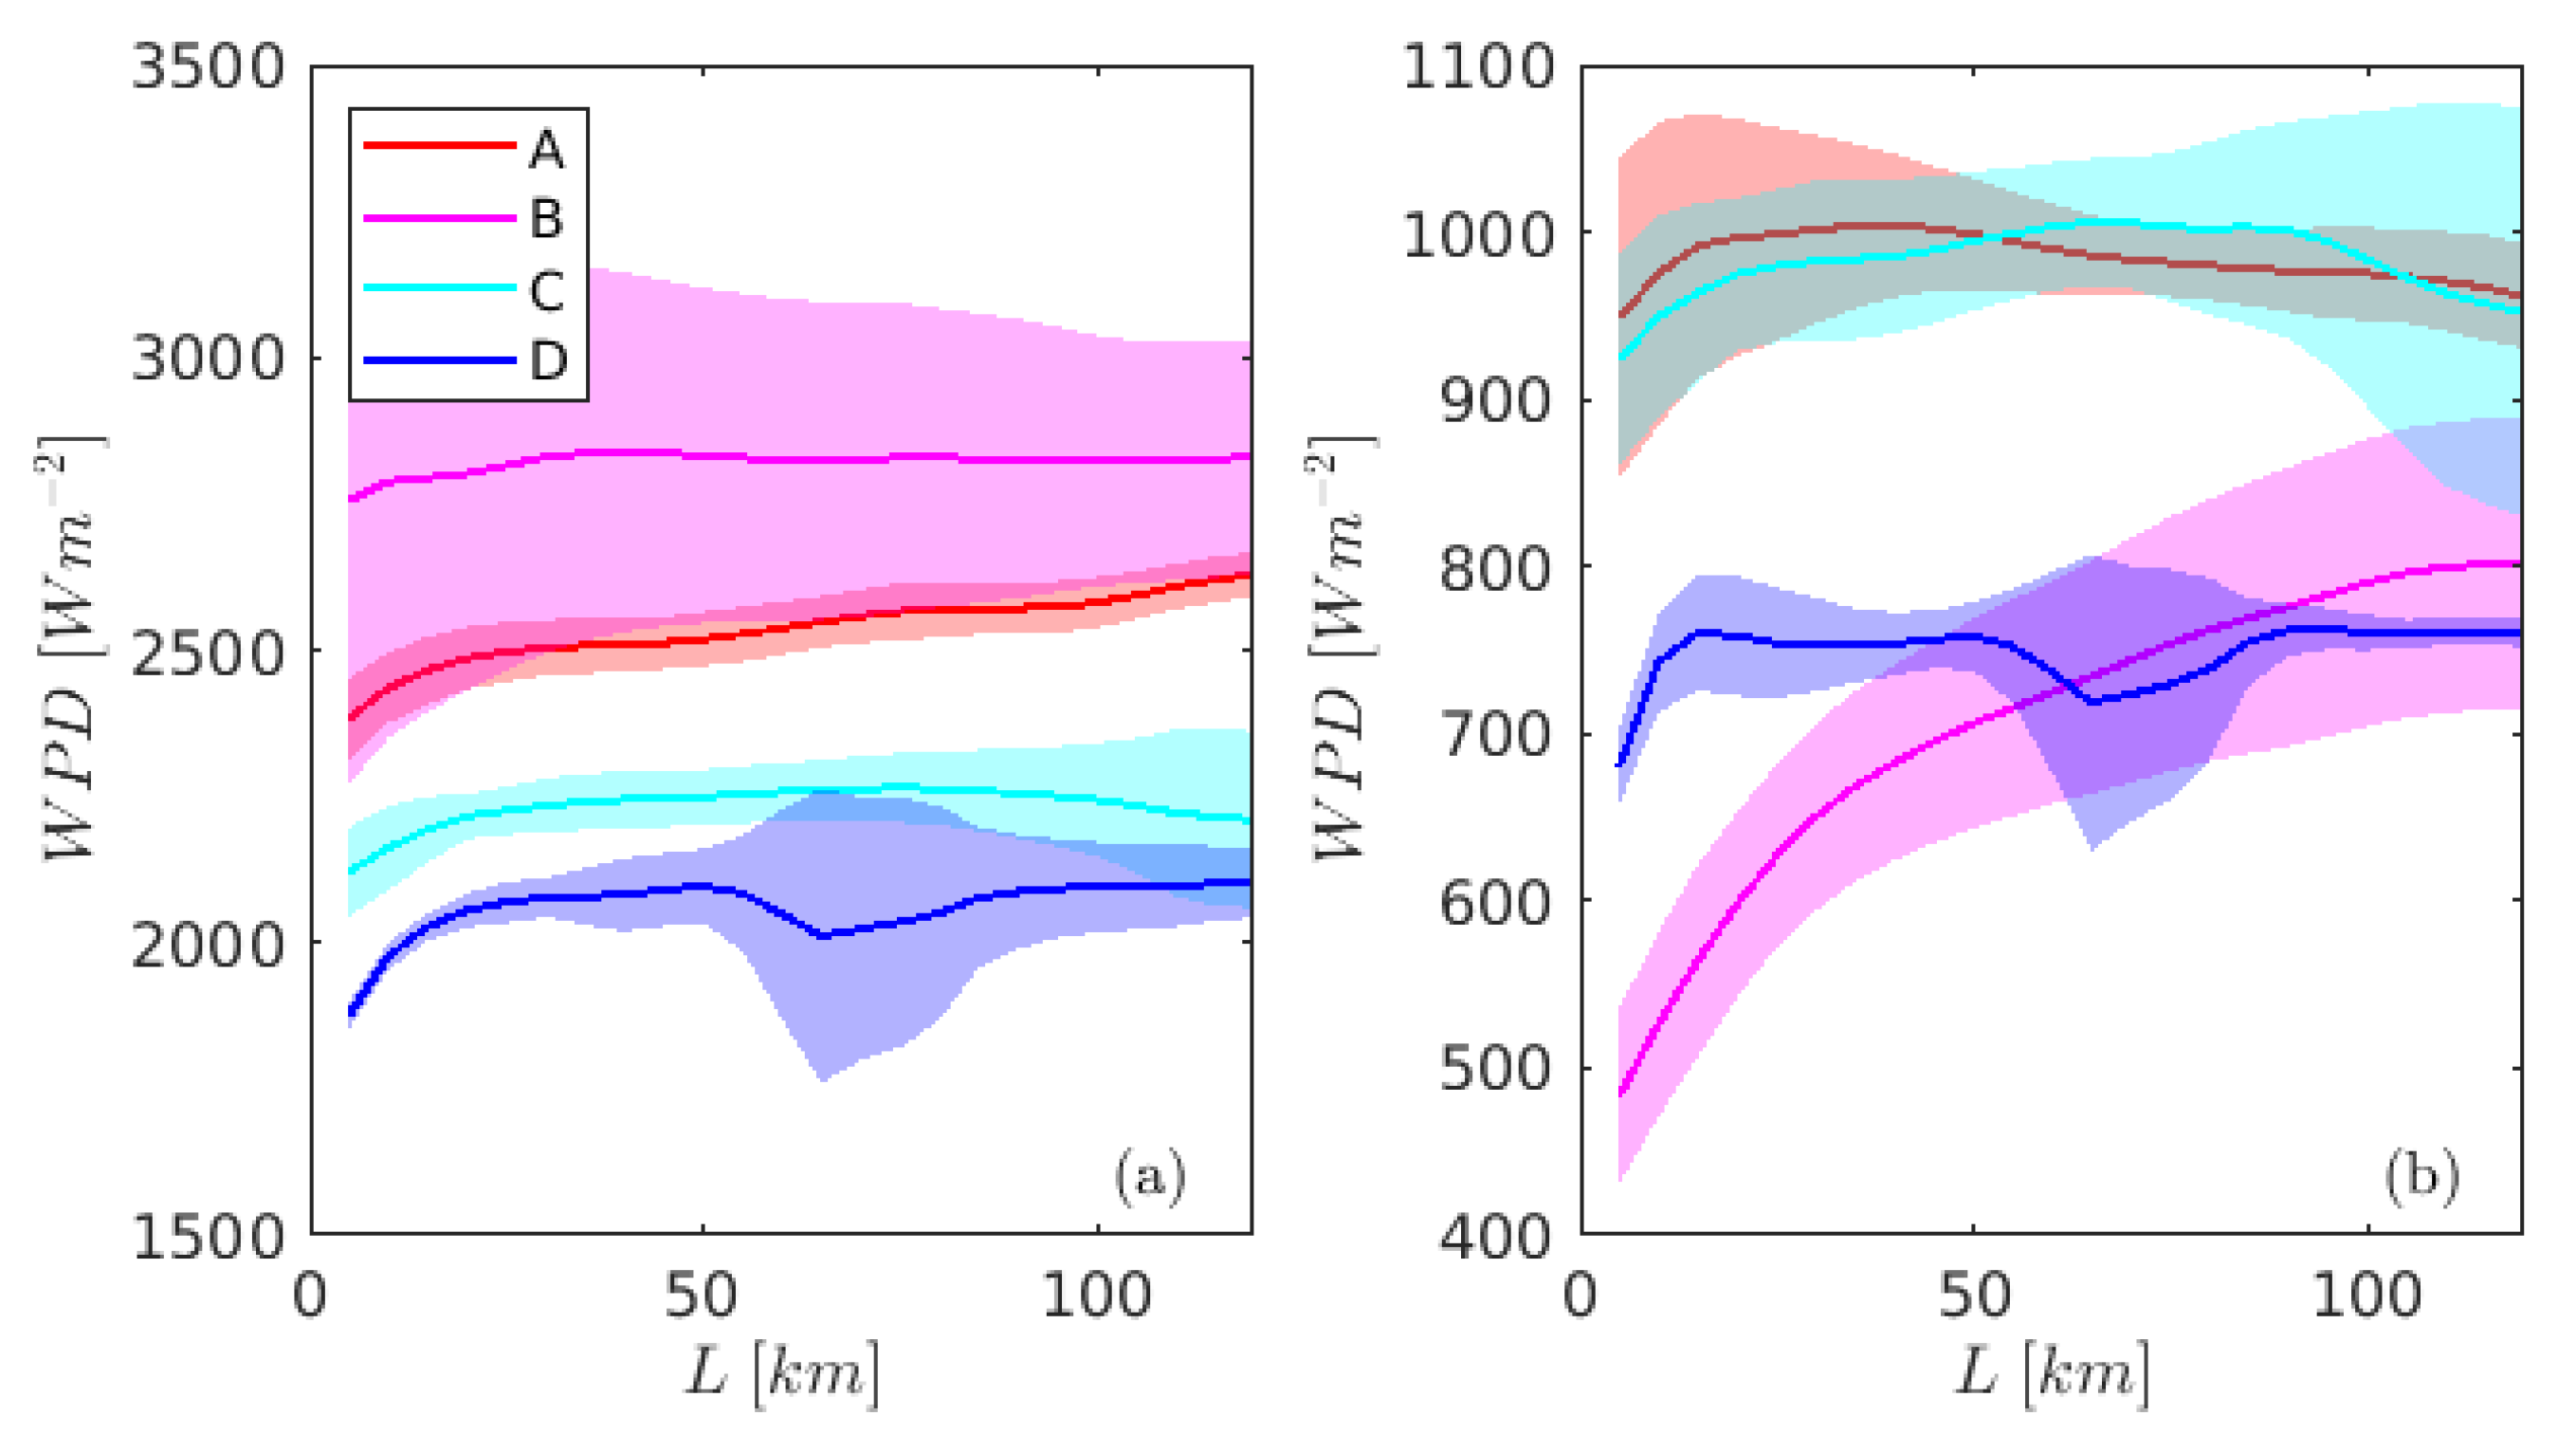
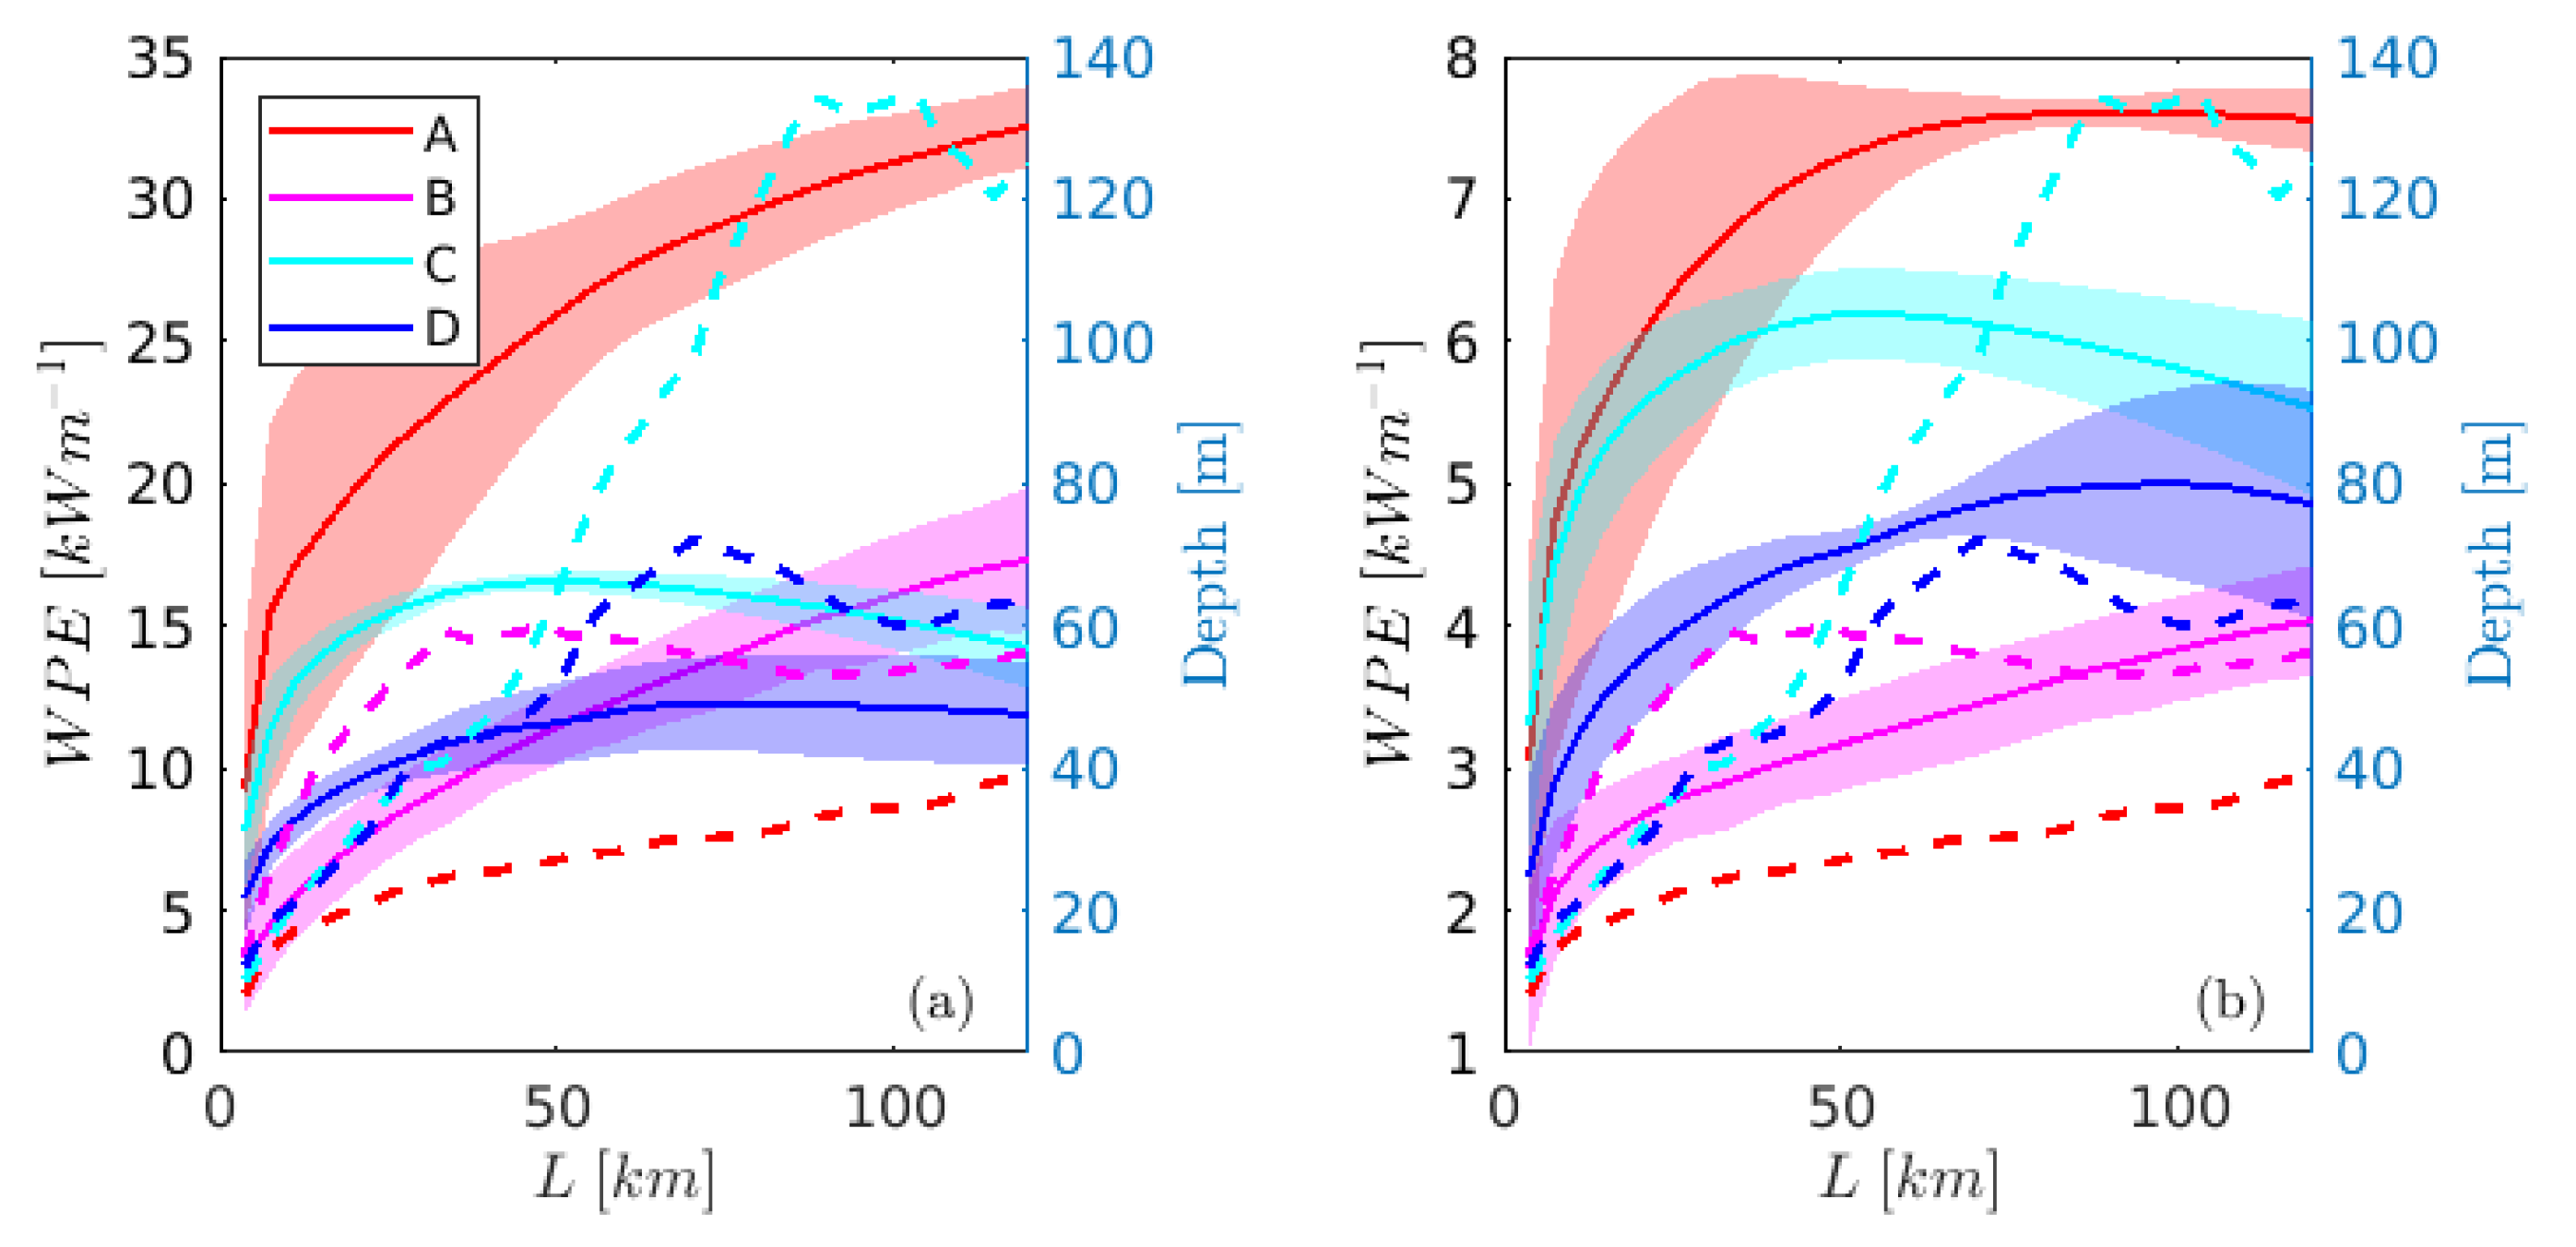
Figure 8 and Figure 9 show the WPD and WPE changes with L in January (a) and July (b), respectively. The mean water depth in the four areas is shown as dashed lines in Figure 9. In general, the WPD increases when L < 20 km for all the four areas in both January and July. In January, the WPD does not have a significant increasing trend with L for the range L > 20 km except for area A. In July, the WPD even starts to decrease with the L when L > 50 km for the areas A, C and D (see Figure 8b). The WPD in area B continues to increase with L in the range L < 120 km, which is different from the other three areas.
The WPE increases more quickly with increasing L than that for the WPD. The magnitude of WPE is nearly doubled in less than 30 km from the coastline in the area A and C (Figure 9). In area A, the WPE continuously increases with L in January. However, it stops to increase when L > 80 km in July. In area B (the British east coast), the WPE increases continuously when L < 120 km in both January and July. In area C, the WPE increases when L < 50 km, and then it starts to decrease with increasing L. The WPE does not change too much when L > 50 km in area D in January (Figure 9).

3.4. Coupling Influences with the Distance from the Coastline

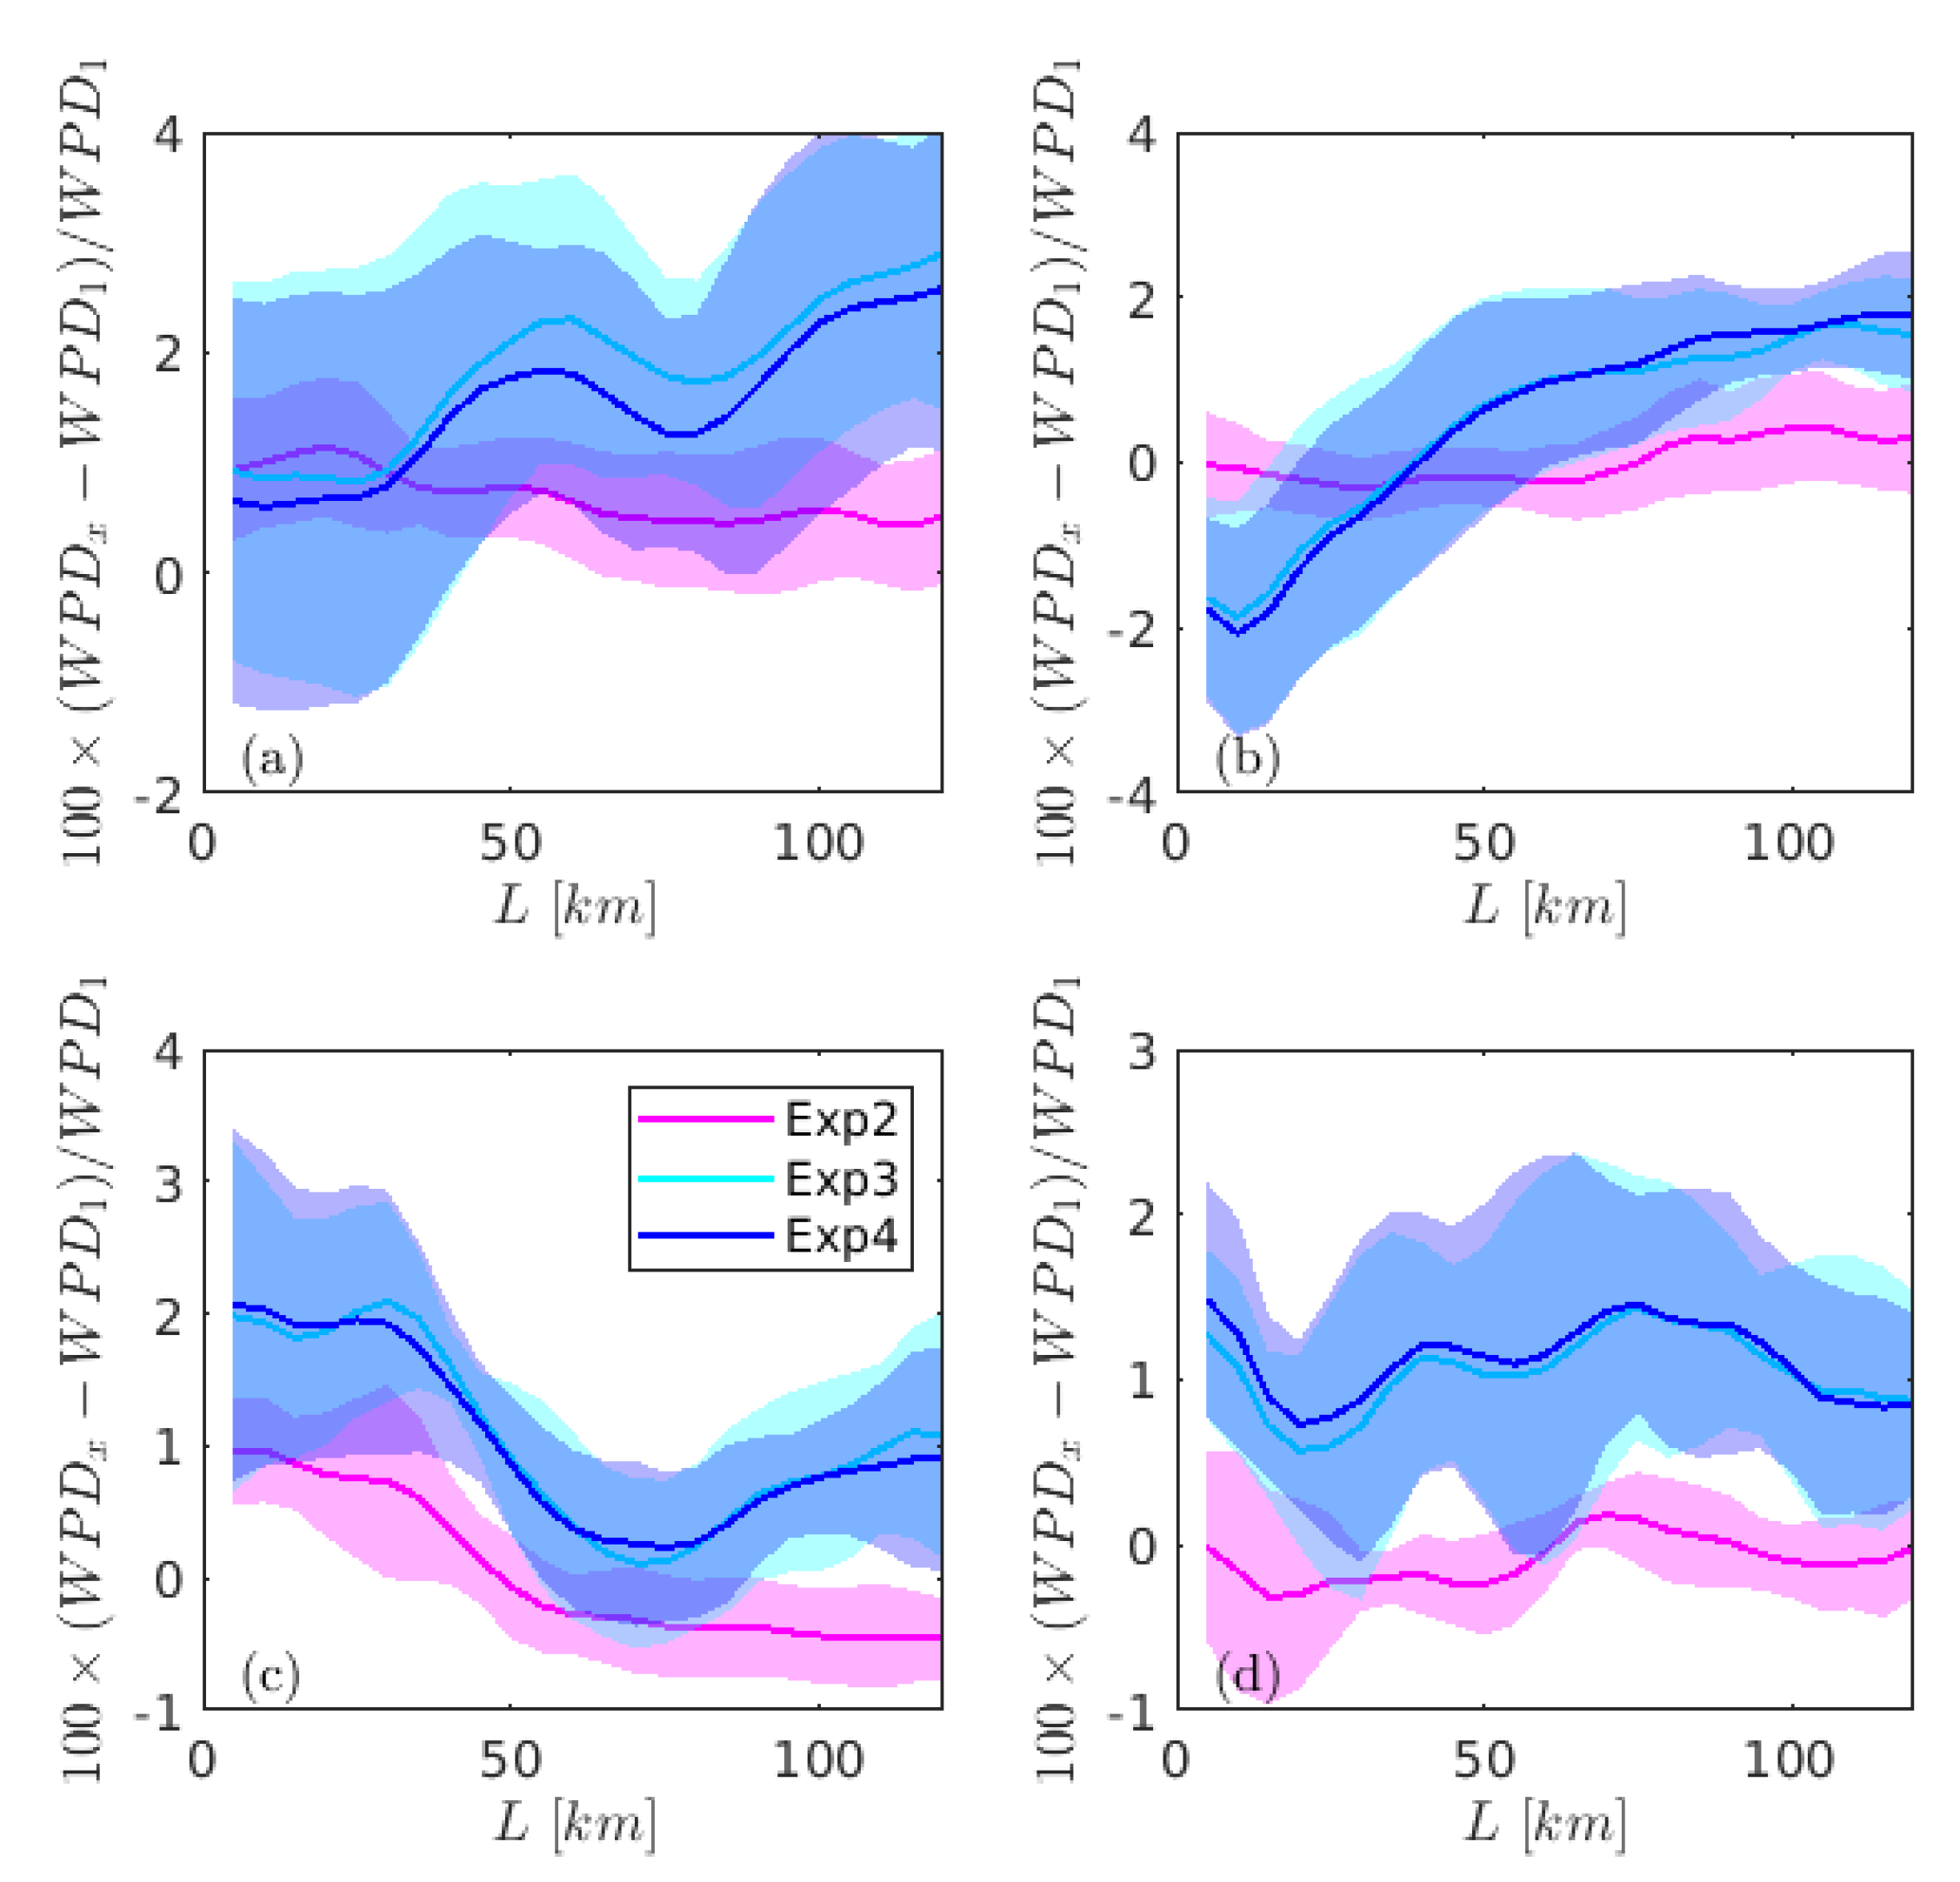
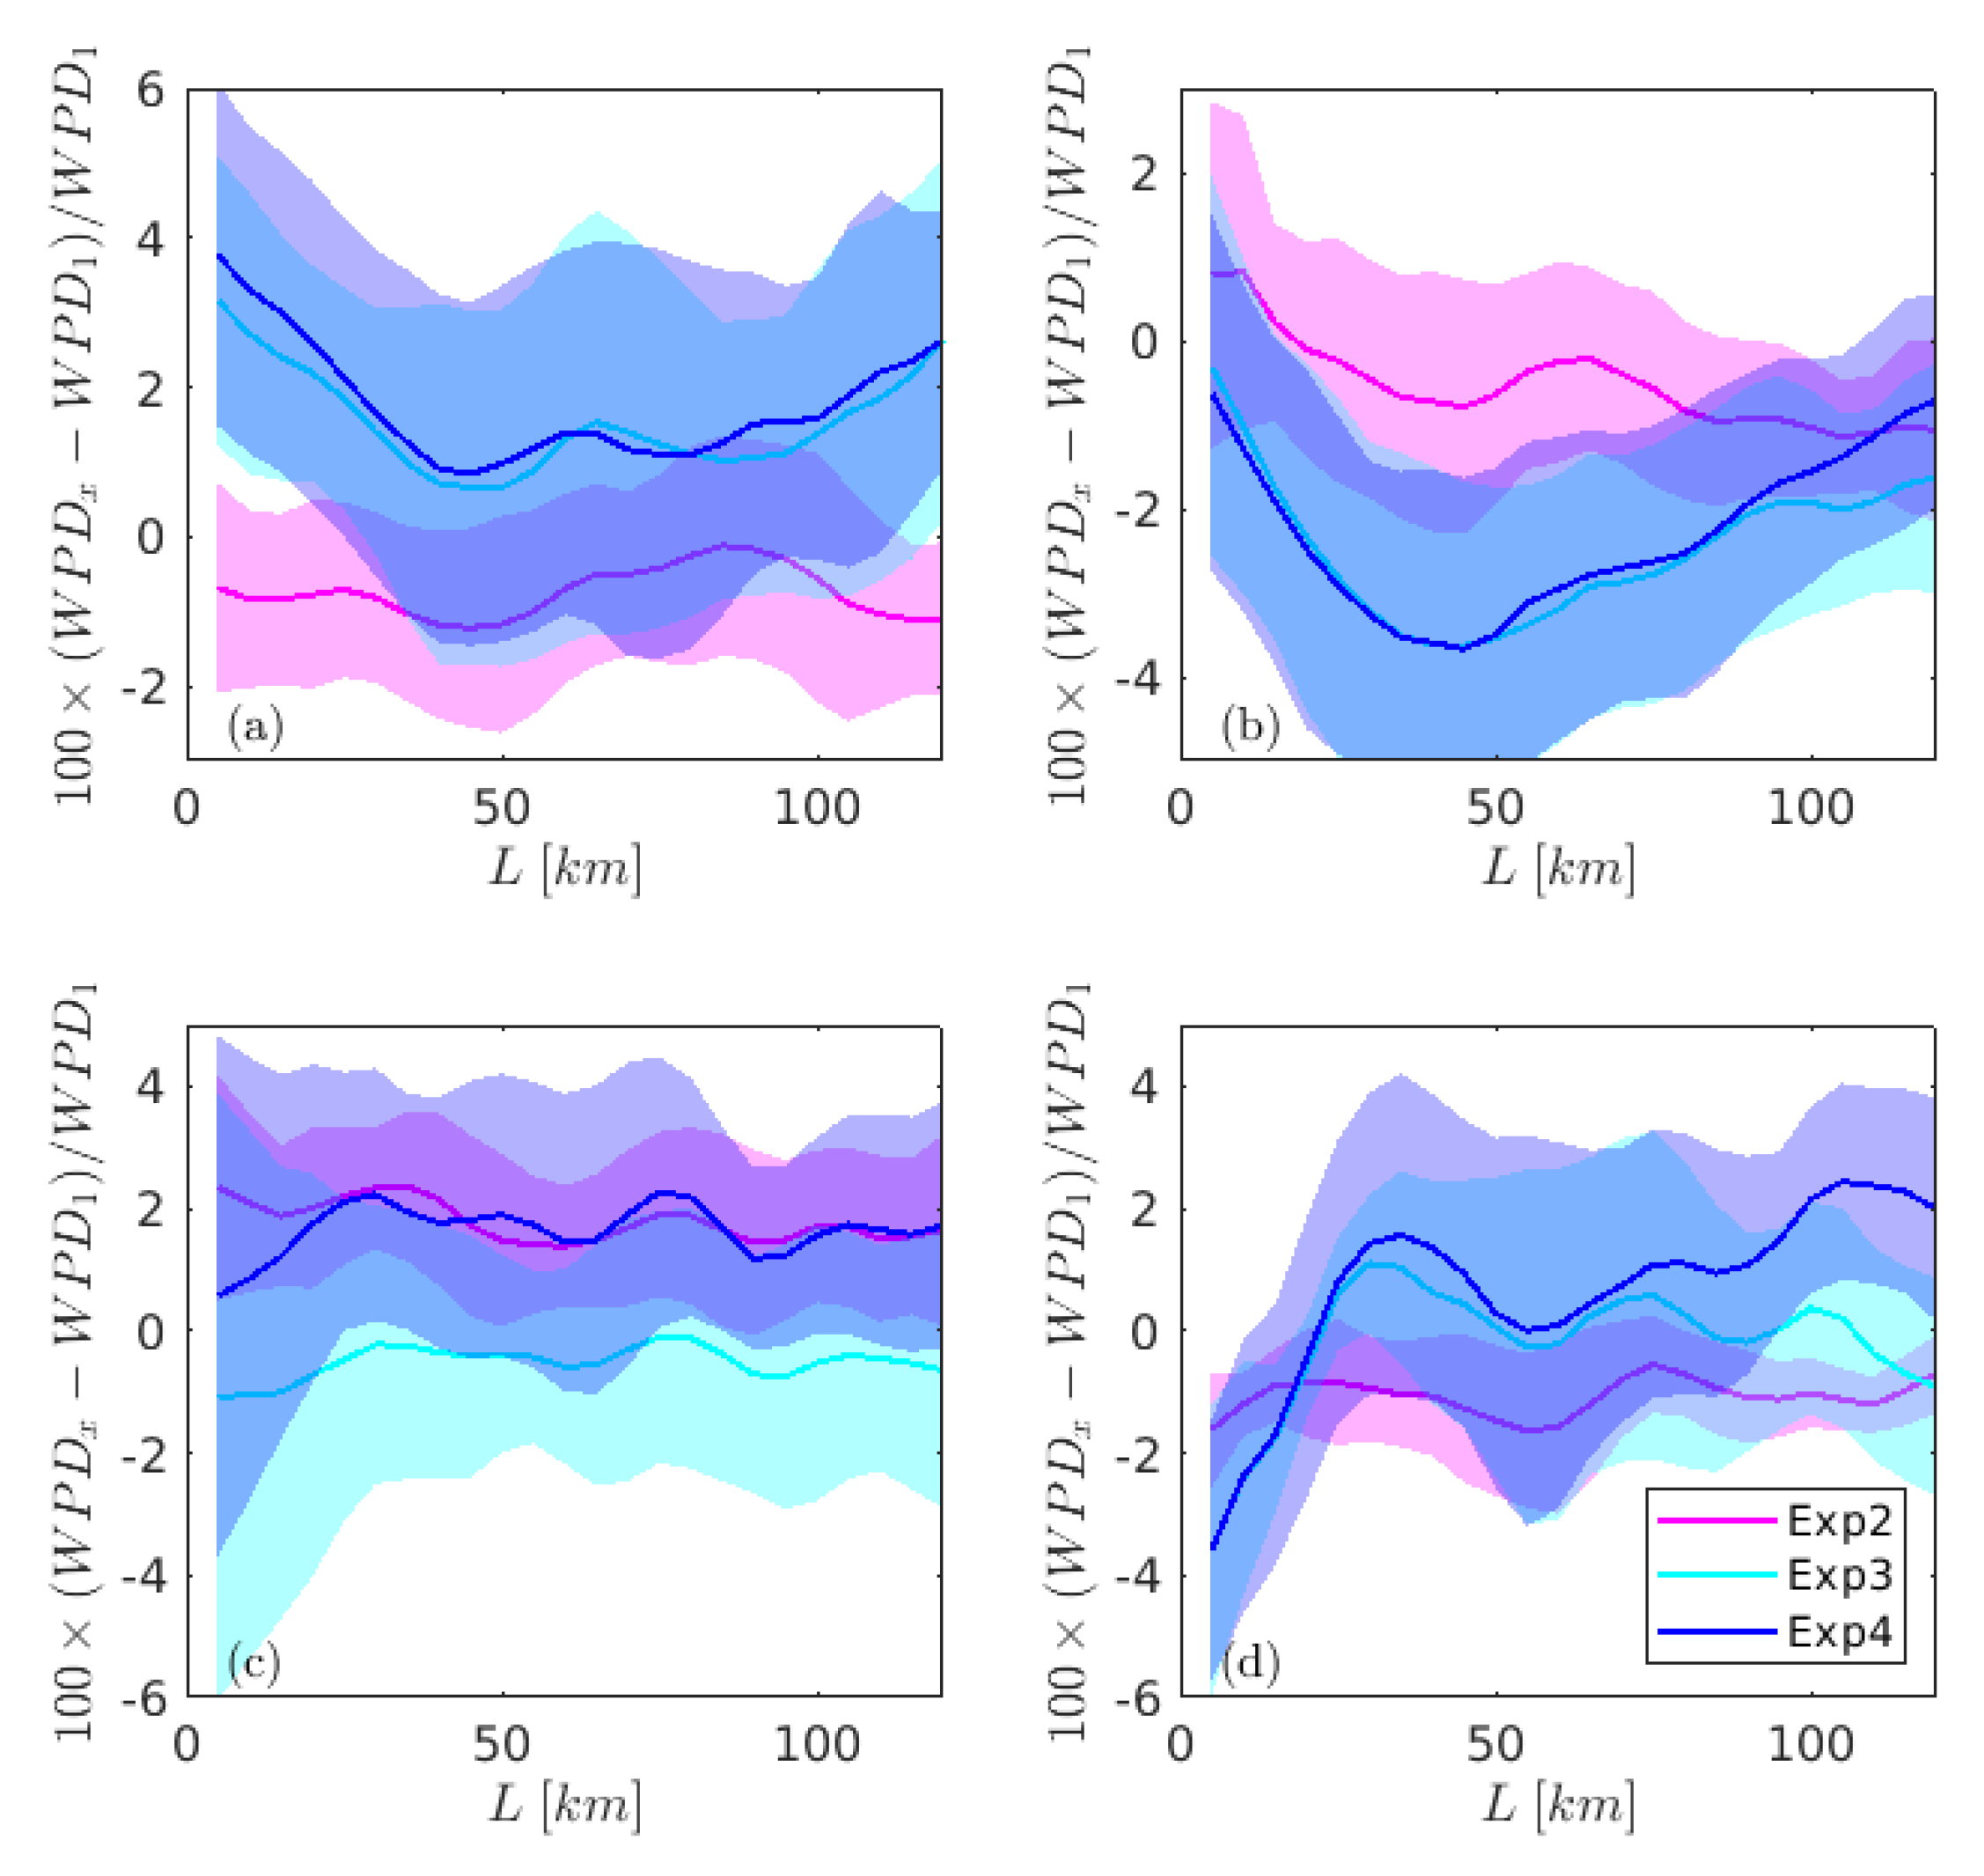
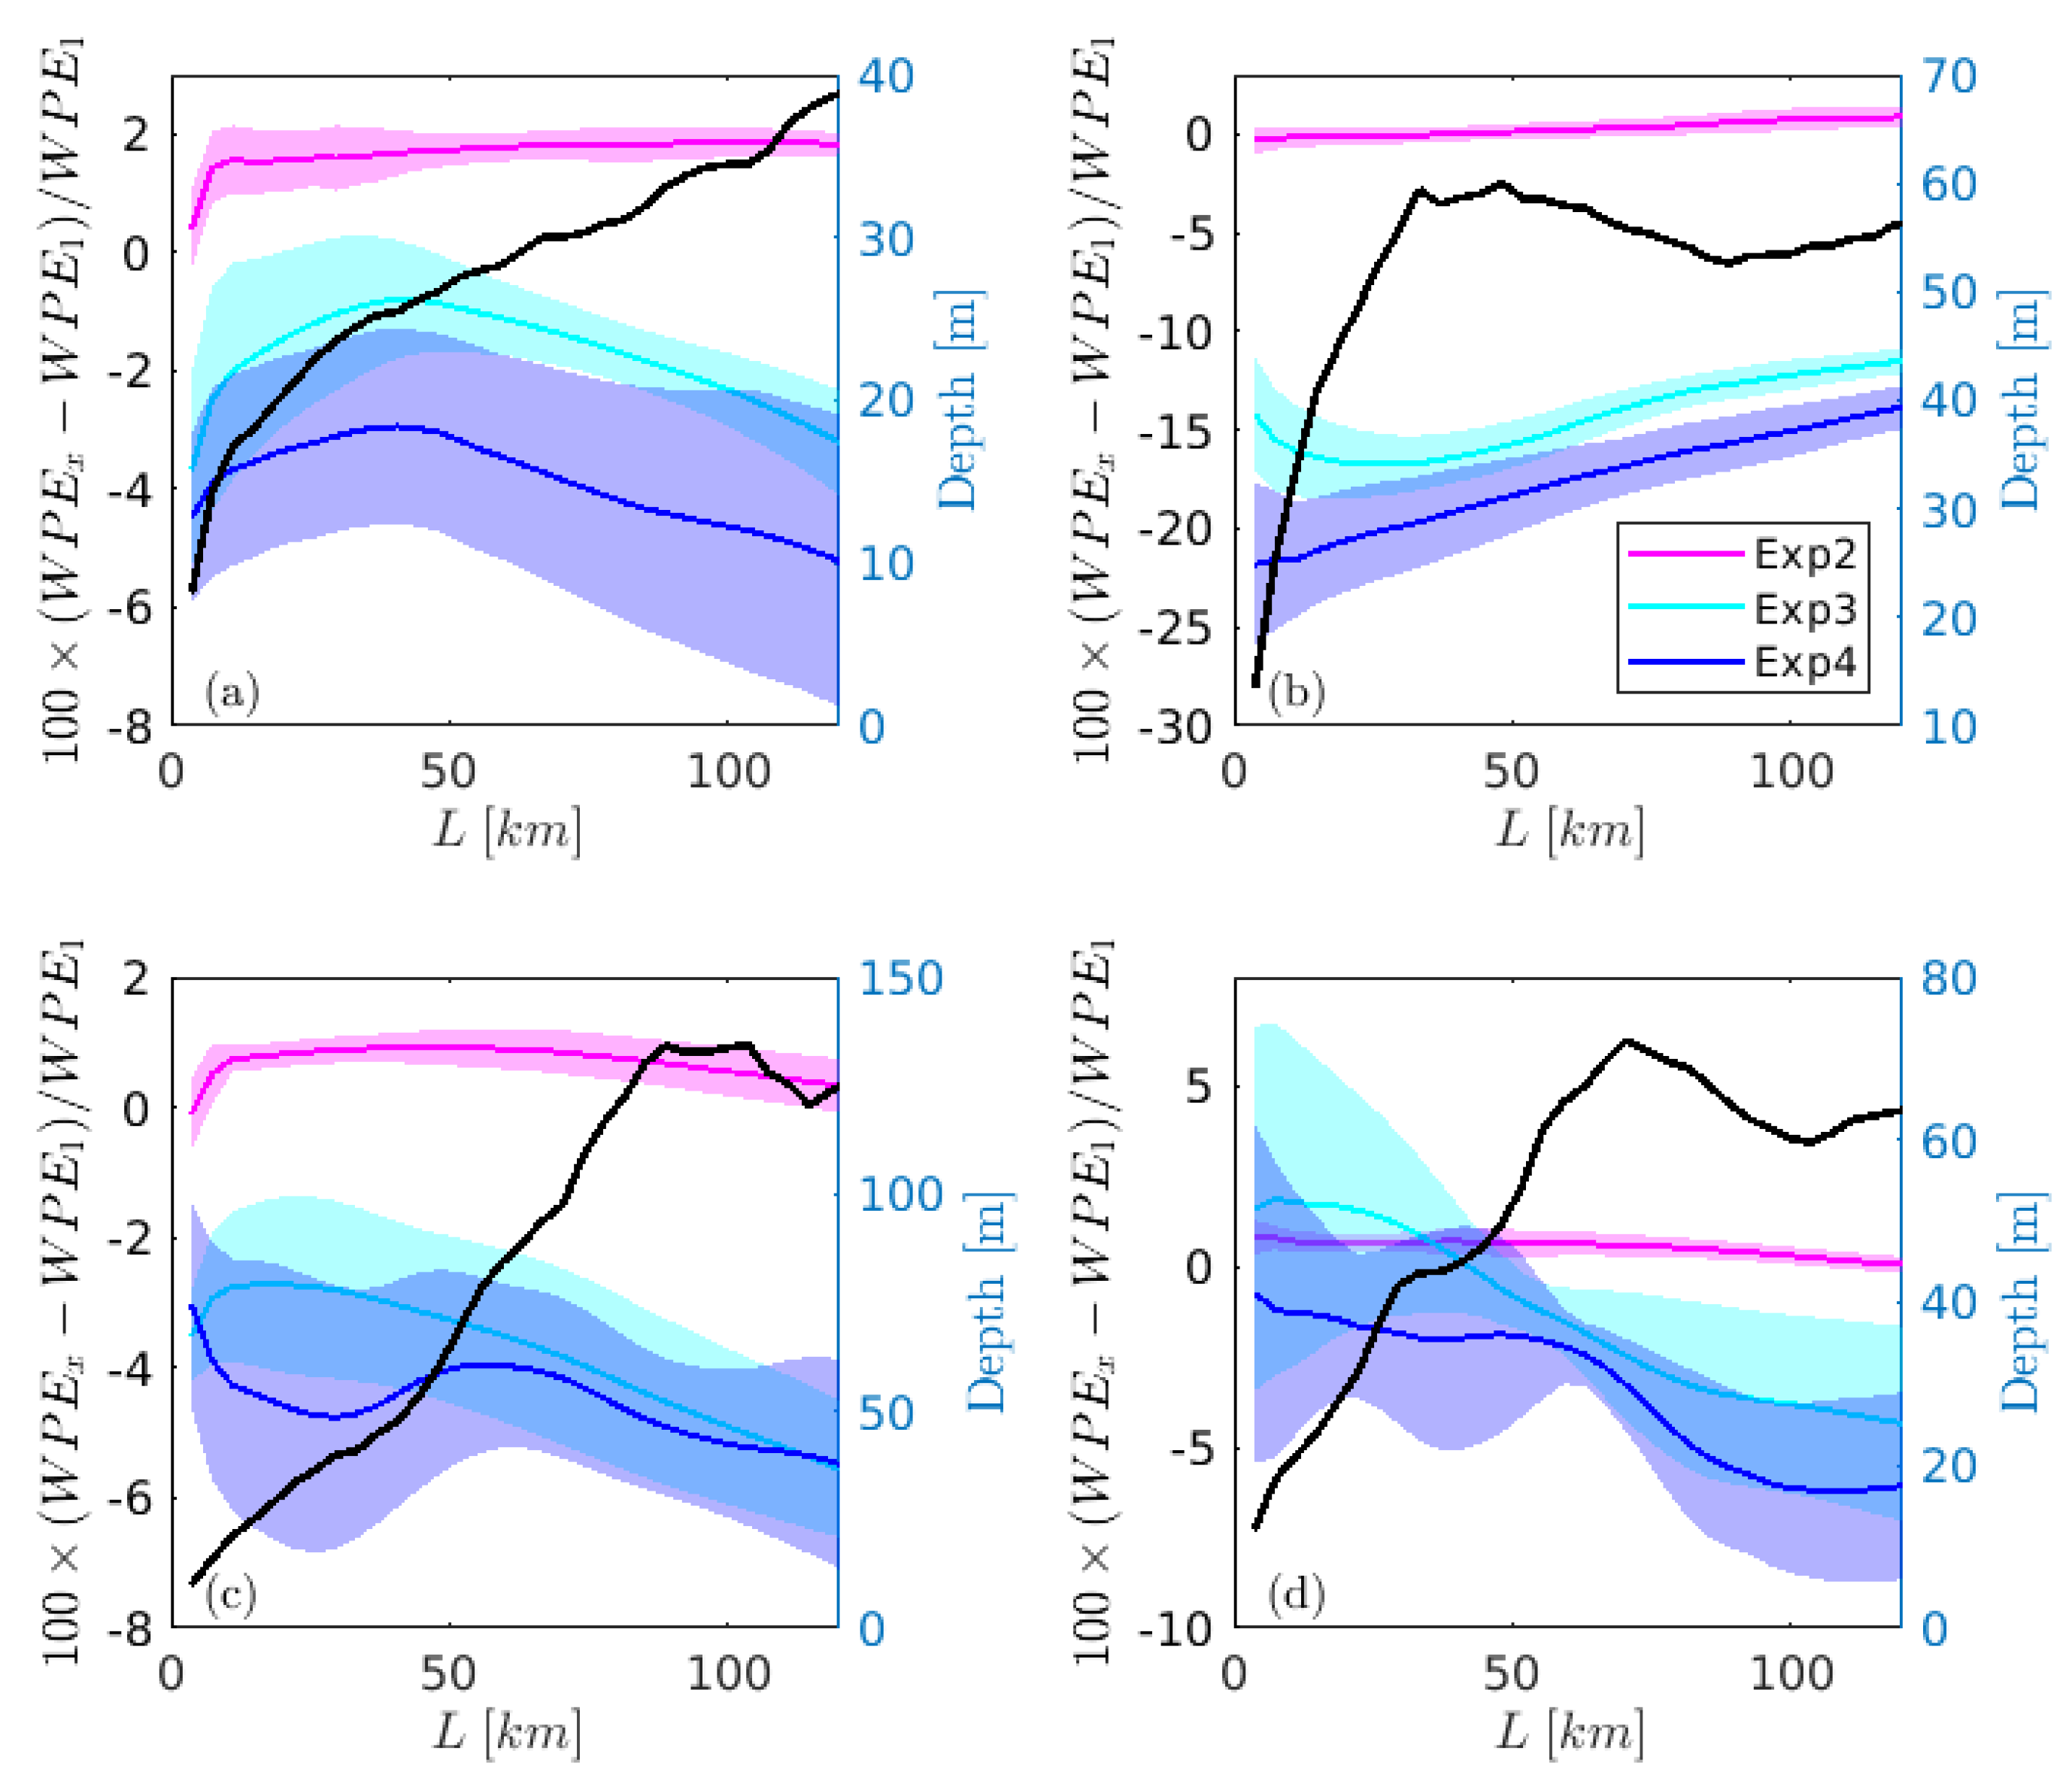
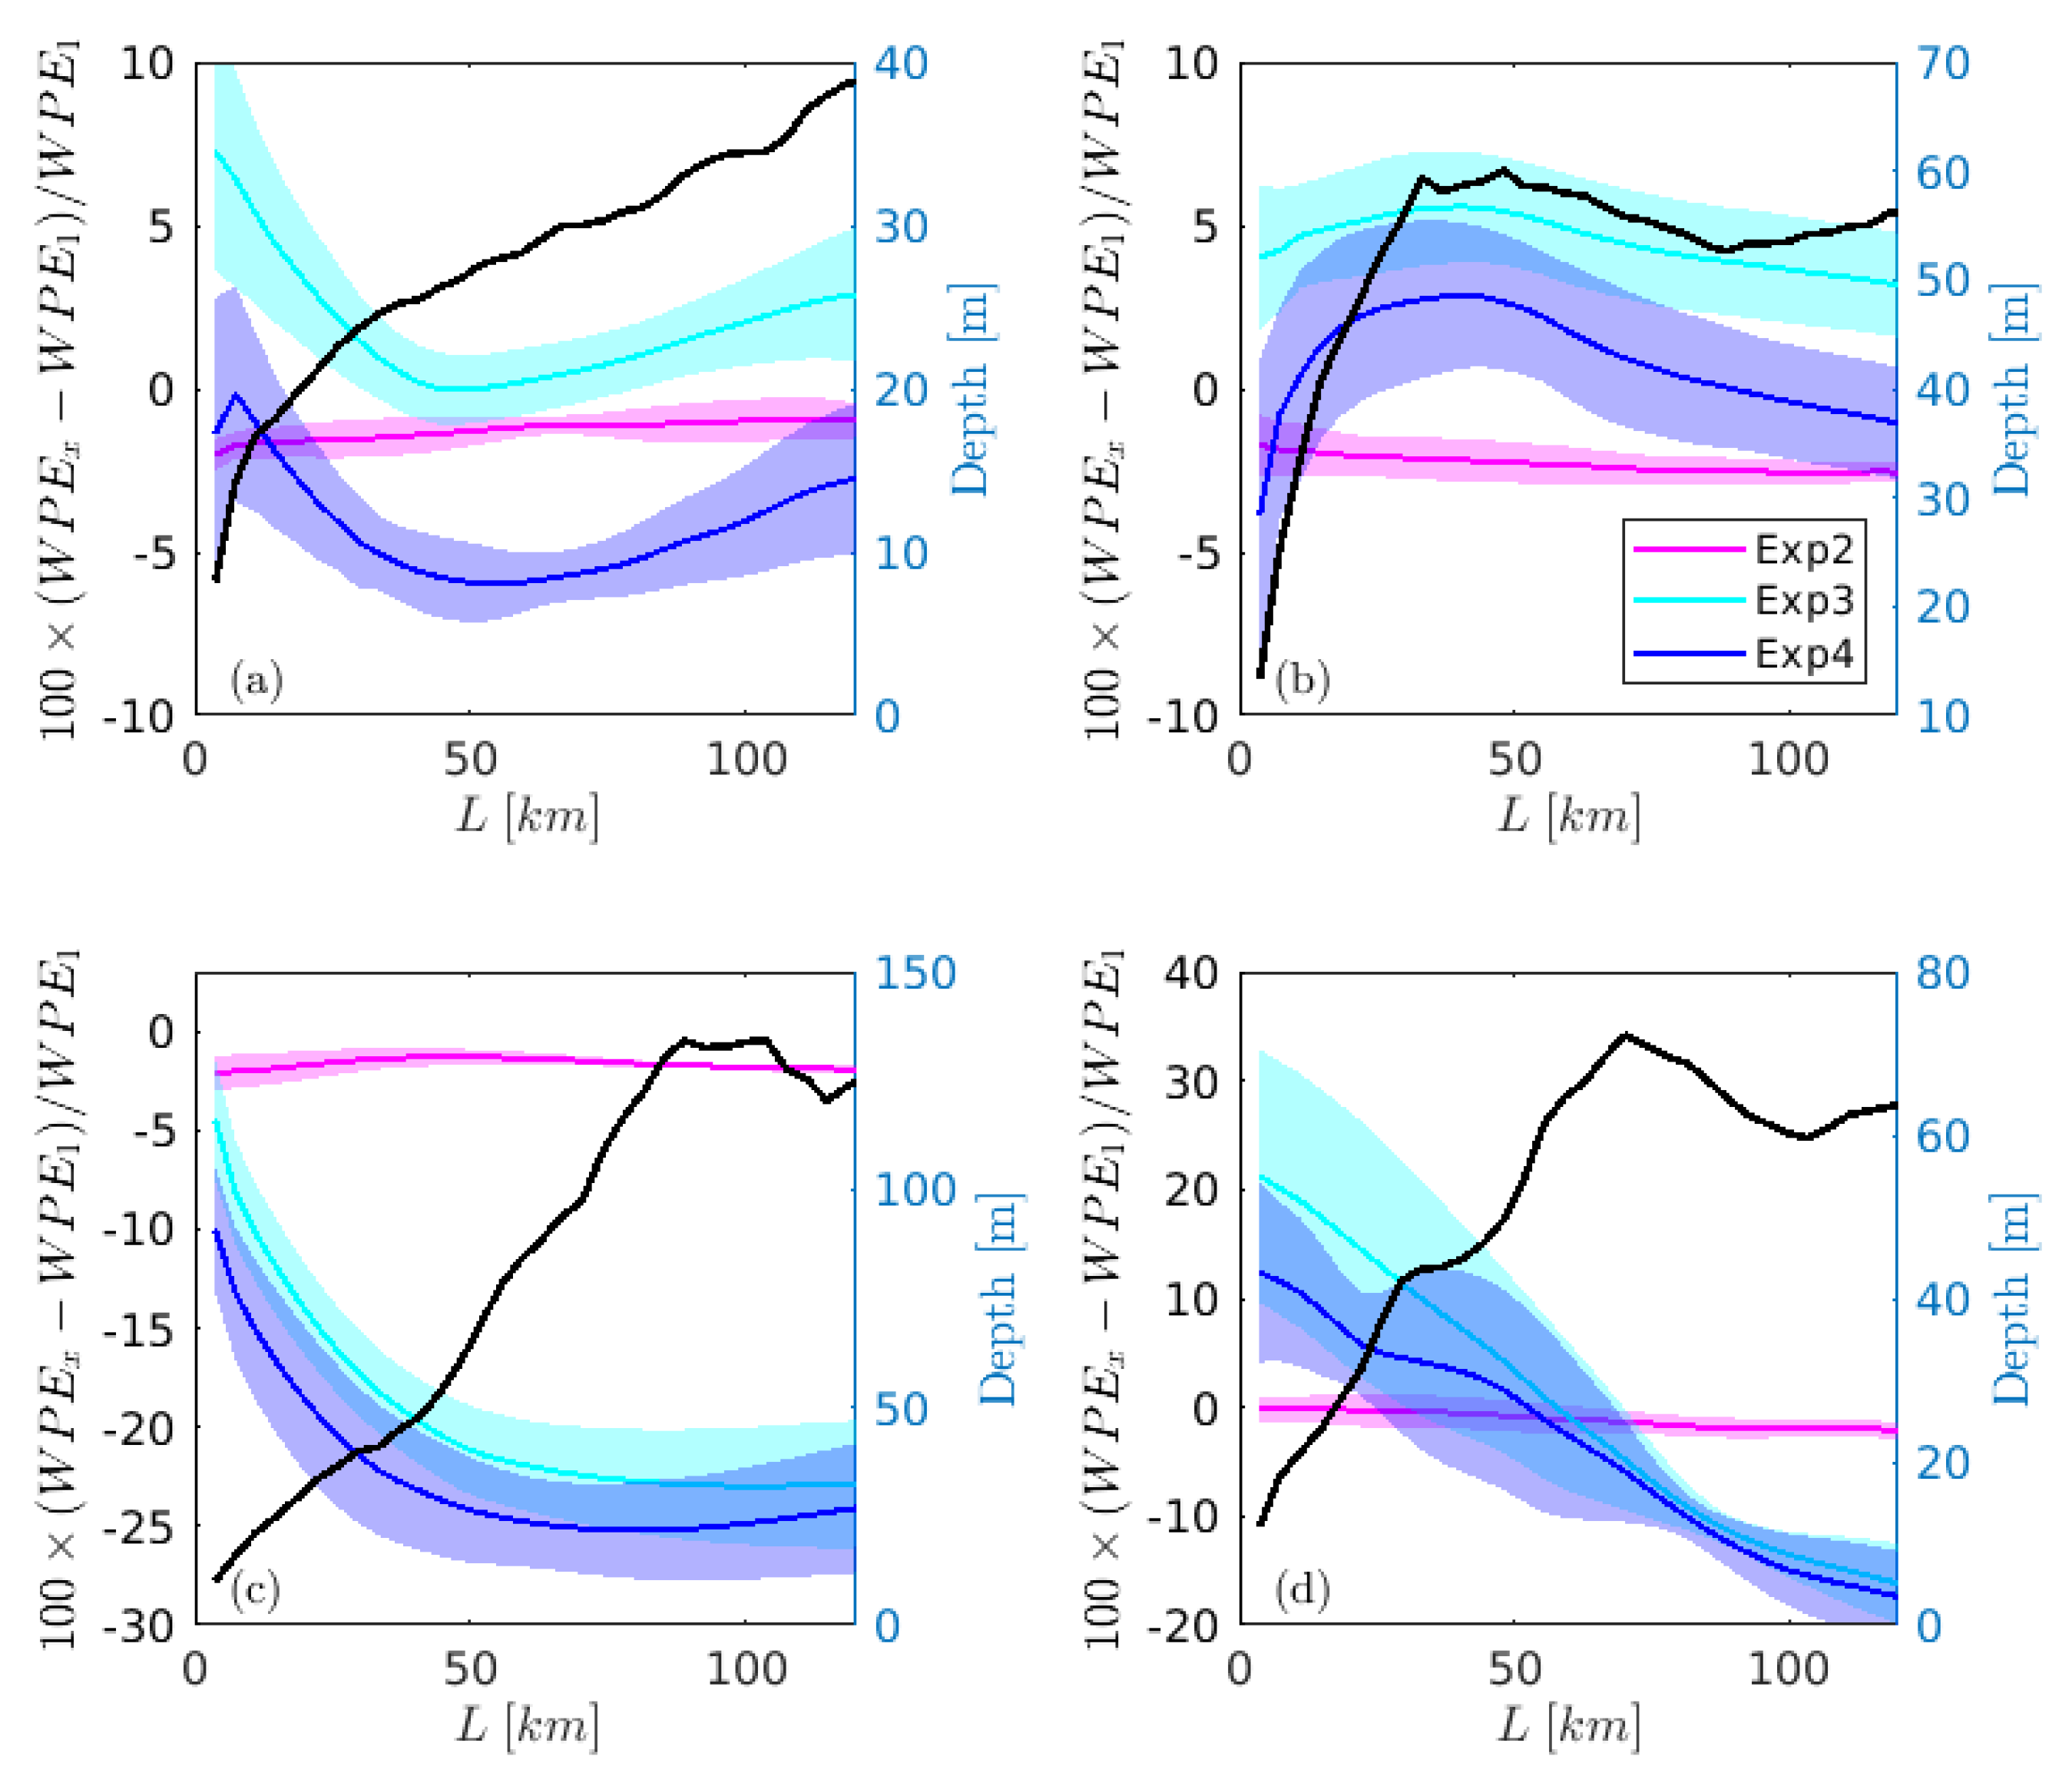
Close to the coastline, the AWO interaction processes change significantly compared with that in the open water, which can directly or indirectly affect the WPD and WPE. The relative difference of WPD and WPE between the experiments with coupling processes (Exp2, Exp3, and Exp4) and the control experiment (Exp1) are shown in Figure 10 and Figure 11 (WPD) and Figure 12 and Figure 13 (WPE).
The relative difference of WPD between Exp2 and Exp1 (atmosphere–wave coupling influence) does not have a significant distance-dependent trend except in area C in January (the influence decreases with L for L < 40 km). For the WPE, the atmosphere–wave coupling increases (decreases) the WPE in all the four areas in January (July). The relative difference increases with L when L < 10 km in the area A and C in January.
The influence of atmosphere–ocean coupling (Exp3) has a significant L dependent pattern in the simulation of the WPD and WPE in both January and July (Figure 10, Figure 11, Figure 12 and Figure 13). The pattern varies with areas and seasons. The atmosphere–ocean coupling impact on the WPE is more sensitive to the distance away from the coast than that for the WPD. This is because that the WPE can be affected by the ocean currents, which are significantly altered by the coastal topography.
In January, the relative difference of the WPD between Exp3 and Exp1 decreases from 2% to 0.5% with increasing L when L < 70 km in the area C and then it starts to increase with increasing L. In area D, the relative difference of the WPD between Exp3 and Exp1 decreases from 1.5% to 0.5% for L < 20 km, and it increases with L when 20 < L < 80 km in January. In contrast, the absolute relative difference increases with L when L < 30 km in area C in July. In July, the relative difference between Exp3 and Exp1 decreases from 4% to 0.5% in the range L < 40 km in area A, while in area B it increases from 0.4% to 3.5%.
The atmosphere–ocean coupling decreases the WPE in January except for the area D when L < 40 km. However, it increases the WPE in July for area A, B, and D ( L < 60 km). The relative difference of WPE between Exp3 and Exp1 could be more than 15%, for example, the area D with L < 10 km in July (see Figure 13d). In area A, the magnitude of the relative difference of the WPE between Exp3 and Exp1 decreases when L < 40 km and then it starts to increase when L > 40 km in both January and July (Figure 12a and Figure 13a). In the other three areas (B, C, and D), the relative difference of the WPE between Exp3 and Exp1 depends on L and varies significantly with location. This indicates that the SST, as well as the sea surface current from the NEMO model, may substantially differ from the one from the ERA-Interim. Those differences lead to a significant change in the wind speed at 10 m (Figure 4 in [7]). One can see that it even shifts the increasing trend of the WPE to a decreasing trend when L = 40 ( L = 60 ) km in January (July) in area D.
Compared with Exp3, adding the wave–current interaction processes (Exp4) has a slight influence (less than 1%) on the WPD, except in area C during July (Figure 11c). However, the relative difference of WPE between Exp3 and Exp1 is reduced up to 10% in the near-shore region of area B when adding the wave–current interaction in January (Figure 12b). When all the AWO coupling processes are added, they can change the simulation of the WPE more than 25% (area C in July); however, they only change the WPD less than 4%.

4. Discussion

The atmosphere, waves, and ocean are a dynamical coupled system. However, the simulation and forecast of wind and wave potential energy are mainly based on stand-alone atmosphere or wave models. Thus, it may introduce some uncertainties in the simulation results because the dynamical coupling processes in stand-alone models are neglected. Therefore, it is worth to investigate whether the coupling processes should be considered when simulating wind and wave energy potentials. Most of the existing wind farms are located within 10 km offshore. Due to the dramatic increase of the wind and wave resource in the further away from the shore, new wind farms are planned to be up to 80 km further offshore [47]. Thus, the influence of OWA interaction on the energy simulation in different areas away from coastline is also an important factor when estimating the ROI (Return On Investment) of wind/wave farms.

4.1. Sea-State-Dependent Stress

The atmosphere–wave coupling impact on the atmosphere is implemented through a sea-state-dependent Charnock coefficient estimated by the WW3 model. The coupling associated sea surface roughness alters the surface wind and air density. It generally increases the surface wind in January because the Charnock coefficient (or the roughness length) is smaller than that from the stand-alone atmosphere model under high wind conditions (not shown here). During moderate winds, the Charnock coefficient from WW3 is larger than that from the stand-alone WRF, which leads to a slightly lower WPD in July. The interaction between waves and the ocean topography could significantly enhance the wave breaking in coastal areas, and it changes the wind stress. This is one reason that the atmosphere–wave coupling impact on the WPD is different in the coastal areas than that in the other areas (see Figure 10, Figure 11, Figure 12 and Figure 13).
In this study, the wind stress is estimated based on the Monin–Obukhov similarity theory (MOST) using the sea-state-dependent roughness length (Charnock coefficient). However, measurements and numerical simulations [48,49] have indicated that the MOST is invalid under swell conditions ( C p / U 10 > 1.2 , where C p is the peak phase speed of waves, and U 10 is the mean wind speed at 10 m). The logarithmic wind profile is one assumption in nearly all atmospheric models. However, a swell-induced low-level wind jet, occurring in the surface layer, has been observed and simulated in previous studies [48,50,51]. Accordingly, the low-level wind jet induced by swell can significantly alter the calculation of the WPD. However, the wind profile modified by swell cannot be captured in traditional atmospheric models. Based on a hybrid numerical model (LES coupled with high-order spectral-wave simulations), Xiao et al. [52] found that swell introduces a periodic oscillation in the extracted WPD from a fixed turbine, and it has much larger influences on the floating turbine case. The produced power and the tangential forces on the rotor blades can be altered by ocean waves [16]. Thus, the surface wave impact on the wind profile needs to be investigated in a further study when mapping the WPD over coastal areas.

4.2. Feedback from SST and Current Coupling

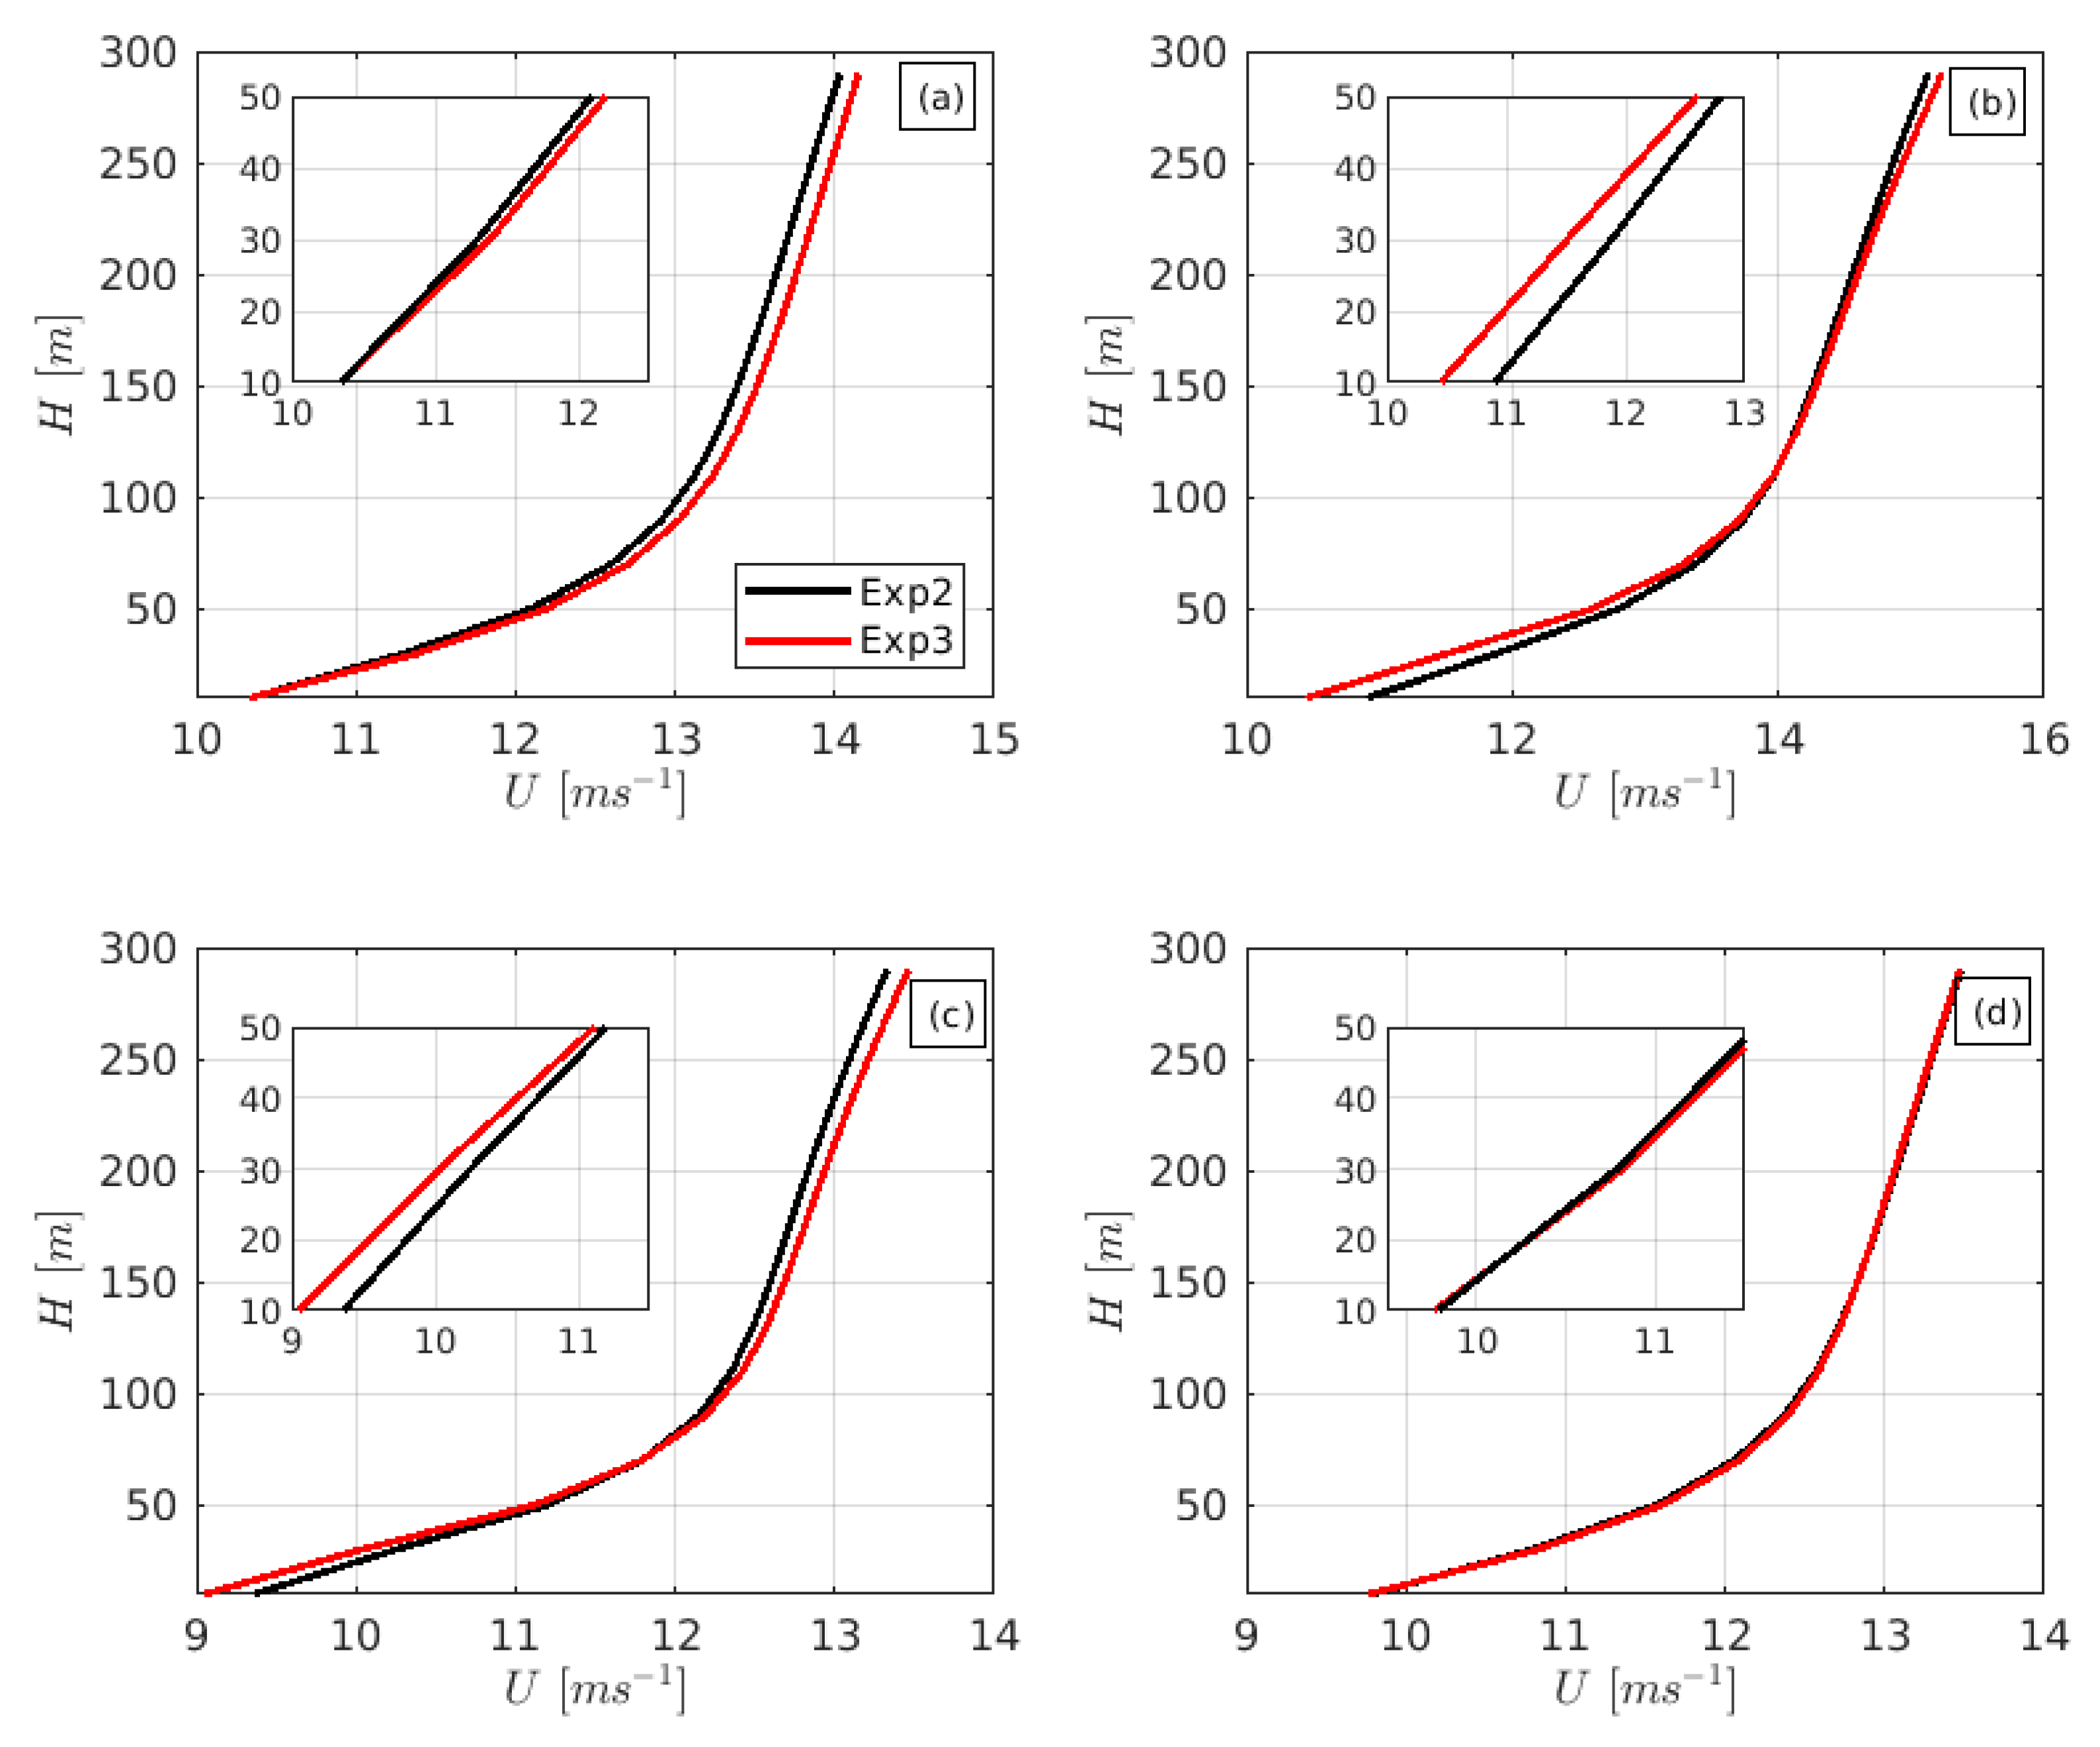
Comparing with the SST from the ERA-Interim (Exp1), the SST from the ocean model has a much higher resolution which can capture many fine SST structure, especially in coastal areas. For example, the ocean model captures the coastal upwelling associated lower SST which stabilizes the surface atmosphere. Accordingly, it changes the surface wind, air density, as well as the surface wind profile [45,53]. The oceanic thermal feedback to the atmosphere slackens of the wind toward the coast within coastal upwelling regions [54]. Besides, the horizontal SST gradients caused by these coupling processes can change the large scale atmospheric dynamics, which can affect not only the surface wind speed but also the entire marine atmospheric boundary layer. As shown in Figure 14, the atmosphere–ocean coupling decreases the wind speed close to the surface while it increases the wind speed at 120 m in area A, B, and C. The influence on the mean wind profile in area D is very small. This can explain that the atmosphere–ocean coupling processes reduces the wind speed at 10 m (Figure 4 in [7]) and the WPE (Figure 6), but increases the WPD (Figure 5).
The current’s feedback to the atmosphere increases/decreases the wind stress when the direction of the wind and current align/oppose with each other. Recent studies indicate that the current’s feedback to the atmosphere act as a sink for ocean energy at the submesoscale currents and as a source for atmospheric energy related to the Ekman pumping induced by currents [55]. In coastal areas, the current direction can be significantly shifted away from the mean wind direction due to the influence of the topography and the shape variation of the coastline. Accordingly, the coupling processes can have an even more complex impact on the wind and wave simulations when approaching the coast.

4.3. Wave–Current Coupling Influence

The wave impact on the ocean circulation processes implemented in the coupled system includes the sea-state-dependent wind stress and TKE flux, Coriolis–Stokes force, Stokes advection, and wave impact on the TKE roughness length. Those processes alter the upper ocean mixing, SST, and the sea surface current. Accordingly, they can indirectly affect the WPD (through changing the wind speed and air density) and WPE.
Due to the modulation of the current, the wave height will increase (decrease) when the wave and current are in the opposite (same) direction [56]. The wave frequency can be shifted by the currents through the Doppler effect. Besides, the wave bottom friction coefficient will be increased due to current influences [57]. The changes of the wave spectrum will consequently impact on the wind stress through the sea-state-dependent Charnock coefficient. Due to the indirect influences on the wind speed, the wave–current coupling has a more significant impact on the WPE than that on WPD (see Figure 5 and Figure 6).

4.4. Resolution Influences

The horizontal resolution used in this study is relatively coarse (5 km in the atmosphere model and 3.7 km in the wave and ocean models). Some high-resolution AWO coupling processes may not be captured, e.g., submesoscale air–sea interaction processes [58,59]. However, since the aim of this study is to investigate whether the AWO coupling processes are critical when simulating wave and wind energy potentials, these simulations can still qualitatively capture the coupling influences on the WPE and WPD. In further studies, a higher resolution AWO-coupled model is needed to investigate the submesoscale coupling processes impact on the WPD and WPE.

4.5. Wind Direction Influences

The AWO coupling impact on the WPE and WPD varies with the wind direction due to the difference of fetch and topography. Comparing with the offshore wind, the onshore wind produces larger waves due to a larger wave fetch. Accordingly, the rougher sea surface increases wind stress and reduces the coastal WPE. Besides, the AWO coupling has a more significant influence on the coastal WPD and WPE during the onshore wind since the wind flow has a memory of the air–sea interaction processes over the open water. During the two one-month simulations in this study, the wind direction does not vary significantly, and we do not have enough data for analyzing the AWO impact on the WPE and WPD under different wind direction at a specific location.

5. Conclusions

The impact of the AWO coupling processes on the simulation of wind and wave energy potentials is investigated in this study using a fully AWO coupled model. The implemented coupling processes in the model include the sea-state-dependent stress and TKE flux, the Stokes impact on the ocean in terms of Coriolis–Stokes force and Stokes advection, SST and current feedback to the atmosphere, and others. Instead of investigating the statistical characteristics of the energy potentials, here, we focus on the influence of those processes on the simulation of the wind and wave energy potentials. Thus, two one-month long (January and July) simulations are used to study the influences of the coupling processes on the simulation of energy potentials.
In general, the WPD and WPE increase with the increasing of the distance from the coastline. The increasing trend varies with location and season. In some areas, it even decreases slightly when the distance to the coastline is more than 60 km.
The atmosphere–ocean coupling has more significant influences on the WPD and WPE than that from atmosphere–wave and wave–ocean coupling processes. The atmosphere–ocean coupling can significantly change the wind profile through the atmospheric stability difference caused by the SST. Thus, the atmosphere–ocean coupling impact on the U 10 is different from its impact on the WPD. The atmosphere–wave–ocean coupling alters less than 5% of the simulation of WPD in the four chosen areas. However, their influence on the WPE can be more than 25%.
The impact of AWO coupling on the WPD and WPE largely depends on the distance away from the coastline, especially for the WPE. It varies with location and season. In some areas, the relative difference of WPE between the experiments with and without AWO coupling can be up to 5% in 10 km (see Figure 13c).
Overall, the simulation results show that the AWO coupling effect bears significant influence in simulating the WPD and WPE. This influence depends remarkably on the distance from the coastline. Thus, the AWO coupling processes need to be considered in the simulations of the WPD and WPE.

Author Contributions

Conceptualization, methodology, simulations, and formal analysis, L.W.; writing–original draft preparation, L.W.; writing–review and editing, L.W., M.S. and E.S.; All authors have read and agreed to the published version of the manuscript.

Funding

Lichuan Wu is supported by Formas (project 2017-00516) and ÅForsk Foundation (project 17-393). Erik Sahlée acknowledges support from Swedish Energy Agency (project 47054-1) and the Swedish strategic research program StandUp for Wind.

Acknowledgments

The simulations were performed on resources provided by the Swedish National Infrastructure for Computing (SNIC) at National Supercomputer Centre (NSC) at Linköping University.

Conflicts of Interest

The authors declare no conflict of interest.

References

  1. Esteban, M.D.; Diez, J.J.; López, J.S.; Negro, V. Why offshore wind energy? Renew. Energy 2011, 36, 444–450. [Google Scholar] [CrossRef] [Green Version]
  2. Rusu, E.; Onea, F. A review of the technologies for wave energy extraction. Clean Energy 2018, 2, 10–19. [Google Scholar] [CrossRef] [Green Version]
  3. Dvorak, M.J.; Archer, C.L.; Jacobson, M.Z. California offshore wind energy potential. Renew. Energy 2010, 35, 1244–1254. [Google Scholar] [CrossRef]
  4. Iglesias, G.; López, M.; Carballo, R.; Castro, A.; Fraguela, J.A.; Frigaard, P. Wave energy potential in Galicia (NW Spain). Renew. Energy 2009, 34, 2323–2333. [Google Scholar] [CrossRef]
  5. Mattar, C.; Borvarán, D. Offshore wind power simulation by using WRF in the central coast of Chile. Renew. Energy 2016, 94, 22–31. [Google Scholar] [CrossRef]
  6. Nilsson, E.; Rutgersson, A.; Dingwell, A.; Björkqvist, J.V.; Pettersson, H.; Axell, L.; Nyberg, J.; Strömstedt, E. Characterization of Wave Energy Potential for the Baltic Sea with Focus on the Swedish Exclusive Economic Zone. Energies 2019, 12, 793. [Google Scholar] [CrossRef] [Green Version]
  7. Wu, L.; Breivik, O.; Rutgersson, A. Ocean-Wave-Atmosphere Interaction Processes in a Fully Coupled Modeling System. J. Adv. Model. Earth Syst. 2019, 11, 3852–3874. [Google Scholar] [CrossRef] [Green Version]
  8. Guan, C.; Xie, L. On the linear parameterization of drag coefficient over sea surface. J. Phys. Oceanogr. 2004, 34, 2847–2851. [Google Scholar] [CrossRef]
  9. Jiang, Q.; Sullivan, P.; Wang, S.; Doyle, J.; Vincent, L. Impact of swell on air–sea momentum flux and marine boundary layer under low-wind conditions. J. Atmos. Sci. 2016, 73, 2683–2697. [Google Scholar] [CrossRef]
  10. Soloviev, A.V.; Lukas, R.; Donelan, M.A.; Haus, B.K.; Ginis, I. The air-sea interface and surface stress under tropical cyclones. Sci. Rep. 2014, 4, 5306. [Google Scholar] [CrossRef]
  11. Rutgersson, A.; Smedman, A.S.; Högström, U. Use of conventional stability parameters during swell. J. Geophys. Res. Oceans 2001, 106, 27117–27134. [Google Scholar] [CrossRef]
  12. Wu, L.; Rutgersson, A.; Sahlée, E.; Guo Larsén, X. Swell impact on wind stress and atmospheric mixing in a regional coupled atmosphere-wave model. J. Geophys. Res. Oceans 2016, 121, 4633–4648. [Google Scholar] [CrossRef] [Green Version]
  13. Wu, L.; Hristov, T.; Rutgersson, A. Vertical profiles of wave-coherent momentum flux and velocity variances in the marine atmospheric boundary layer. J. Phys. Oceanogr. 2018, 48, 625–641. [Google Scholar] [CrossRef]
  14. Wu, L.; Sproson, D.; Sahlée, E.; Rutgersson, A. Surface wave impact when simulating midlatitude storm development. J. Atmos. Ocean. Technol. 2017, 34, 233–248. [Google Scholar] [CrossRef] [Green Version]
  15. Larsén, X.G.; Du, J.; Bolaños, R.; Imberger, M.; Kelly, M.C.; Badger, M.; Larsen, S. Estimation of offshore extreme wind from wind-wave coupled modeling. Wind Energy 2019, 22, 1043–1057. [Google Scholar] [CrossRef] [Green Version]
  16. Kalvig, S.; Manger, E.; Hjertager, B.H.; Jakobsen, J.B. Wave influenced wind and the effect on offshore wind turbine performance. Energy Procedia 2014, 53, 202–213. [Google Scholar] [CrossRef] [Green Version]
  17. Motta, M.; Barthelmie, R.J.; Vølund, P. The influence of non-logarithmic wind speed profiles on potential power output at Danish offshore sites. Wind Energy Int. J. Prog. Appl. Wind Power Convers. Technol. 2005, 8, 219–236. [Google Scholar] [CrossRef]
  18. Ardhuin, F.; Roland, A. Coastal wave reflection, directional spread, and seismoacoustic noise sources. J. Geophys. Res. Oceans 2012, 117. [Google Scholar] [CrossRef] [Green Version]
  19. Uchiyama, Y.; McWilliams, J.C.; Restrepo, J.M. Wave-current interaction in nearshore shear instability analyzed with a vortex force formalism. J. Geophys. Res. Oceans 2009, 114. [Google Scholar] [CrossRef] [Green Version]
  20. Hashemi, M.R.; Neill, S.P.; Robins, P.E.; Davies, A.G.; Lewis, M.J. Effect of waves on the tidal energy resource at a planned tidal stream array. Renew. Energy 2015, 75, 626–639. [Google Scholar] [CrossRef] [Green Version]
  21. Hashemi, M.R.; Neill, S.P. The role of tides in shelf-scale simulations of the wave energy resource. Renew. Energy 2014, 69, 300–310. [Google Scholar] [CrossRef]
  22. Qiao, F.; Yuan, Y.; Yang, Y.; Zheng, Q.; Xia, C.; Ma, J. Wave-induced mixing in the upper ocean: Distribution and application to a global ocean circulation model. Geophys. Res. Lett. 2004, 31. [Google Scholar] [CrossRef]
  23. Wahle, K.; Staneva, J.; Koch, W.; Fenoglio-Marc, L.; Ho-Hagemann, H.; Stanev, E.V. An atmosphere–wave regional coupled model: Improving predictions of wave heights and surface winds in the southern North Sea. Ocean Sci. 2017, 13, 289–301. [Google Scholar] [CrossRef] [Green Version]
  24. Warner, J.C.; Sherwood, C.R.; Signell, R.P.; Harris, C.K.; Arango, H.G. Development of a three-dimensional, regional, coupled wave, current, and sediment-transport model. Comput. Geosci. 2008, 34, 1284–1306. [Google Scholar] [CrossRef]
  25. Warner, J.C.; Armstrong, B.; He, R.; Zambon, J.B. Development of a coupled ocean–atmosphere–wave– sediment transport (COAWST) modeling system. Ocean Model. 2010, 35, 230–244. [Google Scholar] [CrossRef] [Green Version]
  26. Strajnar, B.; Cedilnik, J.; Fettich, A.; Ličer, M.; Pristov, N.; Smerkol, P.; Jerman, J. Impact of two-way coupling and sea-surface temperature on precipitation forecasts in regional atmosphere and ocean models. Q. J. R. Meteorol. Soc. 2019, 145, 228–242. [Google Scholar] [CrossRef] [Green Version]
  27. Lewis, H.W.; Castillo Sanchez, J.M.; Graham, J.; Saulter, A.; Bornemann, J.; Arnold, A.; Fallmann, J.; Harris, C.; Pearson, D.; Ramsdale, S.; et al. The UKC2 regional coupled environmental prediction system. Geosci. Model Dev. 2018, 11, 1–42. [Google Scholar] [CrossRef] [Green Version]
  28. Lewis, H.W.; Castillo Sanchez, J.M.; Arnold, A.; Fallmann, J.; Saulter, A.; Graham, J.; Bush, M.; Siddorn, J.; Palmer, T.; Lock, A.; et al. The UKC3 regional coupled environmental prediction system. Geosci. Model Dev. 2019, 12, 2357–2400. [Google Scholar] [CrossRef] [Green Version]
  29. Carniel, S.; Benetazzo, A.; Bonaldo, D.; Falcieri, F.M.; Miglietta, M.M.; Ricchi, A.; Sclavo, M. Scratching beneath the surface while coupling atmosphere, ocean and waves: Analysis of a dense water formation event. Ocean Model. 2016, 101, 101–112. [Google Scholar] [CrossRef]
  30. Staneva, J.; Alari, V.; Breivik, Ø.; Bidlot, J.R.; Mogensen, K. Effects of wave-induced forcing on a circulation model of the North Sea. Ocean Dyn. 2017, 67, 81–101. [Google Scholar] [CrossRef]
  31. Ricchi, A.; Miglietta, M.M.; Barbariol, F.; Benetazzo, A.; Bergamasco, A.; Bonaldo, D.; Cassardo, C.; Falcieri, F.M.; Modugno, G.; Russo, A.; et al. Sensitivity of a Mediterranean tropical-like cyclone to different model configurations and coupling strategies. Atmosphere 2017, 8, 92. [Google Scholar] [CrossRef] [Green Version]
  32. Kalvig, S.; Gudmestad, O.T.; Winther, N. Exploring the gap between ‘best knowledge’and ‘best practice’in boundary layer meteorology for offshore wind energy. Wind Energy 2014, 17, 161–171. [Google Scholar] [CrossRef]
  33. Langodan, S.; Viswanadhapalli, Y.; Dasari, H.P.; Knio, O.; Hoteit, I. A high-resolution assessment of wind and wave energy potentials in the Red Sea. Appl. Energy 2016, 181, 244–255. [Google Scholar] [CrossRef]
  34. Davy, R.; Gnatiuk, N.; Pettersson, L.; Bobylev, L. Climate change impacts on wind energy potential in the European domain with a focus on the Black Sea. Renew. Sustain. Energy Rev. 2018, 81, 1652–1659. [Google Scholar] [CrossRef] [Green Version]
  35. Mirzaei, A.; Tangang, F.; Juneng, L. Wave energy potential assessment in the central and southern regions of the South China Sea. Renew. Energy 2015, 80, 454–470. [Google Scholar] [CrossRef]
  36. Zheng, C.W.; Wu, G.X.; Chen, X.; Wang, Q.; Gao, Z.S.; Chen, Y.G.; Luo, X. CMIP5-Based Wave Energy Projection: Case Studies of the South China Sea and the East China Sea. IEEE Access 2019, 7, 82753–82763. [Google Scholar] [CrossRef]
  37. Craig, A.; Valcke, S.; Coquart, L. Development and performance of a new version of the OASIS coupler, OASIS3-MCT_3.0. Geosci. Model Dev. 2017, 10, 3297–3308. [Google Scholar] [CrossRef] [Green Version]
  38. Skamarock, W.; Klemp, J. A Description of the Advanced Research WRF; Version 3, NCAR Technical Report, Note NCAR/TN-4751STR; National Center for Atmospheric Research: Boulder, CO, USA, 2005; 113p. [Google Scholar] [CrossRef]
  39. Dee, D.P.; Uppala, S.; Simmons, A.; Berrisford, P.; Poli, P.; Kobayashi, S.; Andrae, U.; Balmaseda, M.; Balsamo, G.; Bauer, D.P.; et al. The ERA-Interim reanalysis: Configuration and performance of the data assimilation system. Q. J. R. Meteorol. Soc. 2011, 137, 553–597. [Google Scholar] [CrossRef]
  40. WAVEWATCH III Development Group. User Manual and System Documentation of WAVEWATCH III; Version 5.16; WAVEWATCH III Development Group: College Park, MD, USA, 2016. [Google Scholar]
  41. Janssen, P. Wave-induced stress and the drag of air flow over sea waves. J. Phys. Oceanogr. 1989, 19, 745–754. [Google Scholar] [CrossRef] [Green Version]
  42. Bidlot, J.; Janssen, P.; Abdalla, S.; Hersbach, H. A Revised Formulation of Ocean Wave Dissipation and Its Model Impact; ECMWF: Reading, UK, 2007. [Google Scholar]
  43. Janssen, P.; Janssen, P.A. The Interaction of Ocean Waves and Wind; Cambridge University Press: Cambridge, UK, 2004. [Google Scholar]
  44. Madec, G. NEMO Ocean Engine. 2015. Available online: https://epic.awi.de/id/eprint/39698/1/NEMO_book_v6039.pdf (accessed on 28 March 2020).
  45. Wu, L.; Staneva, J.; Breivik, Ø.; Rutgersson, A.; Nurser, A.G.; Clementi, E.; Madec, G. Wave effects on coastal upwelling and water level. Ocean Model. 2019, 140, 101405. [Google Scholar] [CrossRef]
  46. Janssen, F.; Schrum, C.; Backhaus, J.O. A climatological data set of temperature and salinity for the Baltic Sea and the North Sea. Dtsch. Hydrogr. Z. 1999, 51, 5. [Google Scholar] [CrossRef]
  47. Charlotte, H.; Jake, B.; Ferhat, B.; Niels-Erik, C. Wind Energy Resources of the South Baltic Sea. In Proceedings of the World Renewable Energy Congress-Sweden, Linköping; Sweden, 8–13 May 2011. [Google Scholar]
  48. Smedman, A.; Högström, U.; Bergström, H.; Rutgersson, A.; Kahma, K.; Pettersson, H. A case study of air-sea interaction during swell conditions. J. Geophys. Res. Oceans 1999, 104, 25833–25851. [Google Scholar] [CrossRef]
  49. Sullivan, P.P.; Edson, J.B.; Hristov, T.; McWilliams, J.C. Large-eddy simulations and observations of atmospheric marine boundary layers above nonequilibrium surface waves. J. Atmos. Sci. 2008, 65, 1225–1245. [Google Scholar] [CrossRef] [Green Version]
  50. Semedo, A.; Saetra, Ø.; Rutgersson, A.; Kahma, K.K.; Pettersson, H. Wave-induced wind in the marine boundary layer. J. Atmos. Sci. 2009, 66, 2256–2271. [Google Scholar] [CrossRef] [Green Version]
  51. Wu, L.; Rutgersson, A.; Nilsson, E. Atmospheric boundary layer turbulence closure scheme for wind-following swell conditions. J. Atmos. Sci. 2017, 74, 2363–2382. [Google Scholar] [CrossRef]
  52. Xiao, S.; Yang, D. Large-Eddy Simulation-Based Study of Effect of Swell-Induced Pitch Motion on Wake-Flow Statistics and Power Extraction of Offshore Wind Turbines. Energies 2019, 12, 1246. [Google Scholar] [CrossRef] [Green Version]
  53. Sproson, D.; Sahlée, E. Modelling the impact of Baltic Sea upwelling on the atmospheric boundary layer. Tellus A Dyn. Meteorol. Oceanogr. 2014, 66, 24041. [Google Scholar] [CrossRef]
  54. Renault, L.; Hall, A.; McWilliams, J.C. Orographic shaping of US West Coast wind profiles during the upwelling season. Clim. Dyn. 2016, 46, 273–289. [Google Scholar] [CrossRef]
  55. Renault, L.; McWilliams, J.C.; Gula, J. Dampening of submesoscale currents by air-sea stress coupling in the californian upwelling system. Sci. Rep. 2018, 8, 13388. [Google Scholar] [CrossRef]
  56. Cao, Y.; Dong, C.; Uchiyama, Y.; Wang, J.; Yin, X. Multiple-Scale Variations of Wind-Generated Waves in the Southern California Bight. J. Geophys. Res. Oceans 2018, 123, 9340–9356. [Google Scholar] [CrossRef] [Green Version]
  57. Mao, M.; Xia, M. Wave–current dynamics and interactions near the two inlets of a shallow lagoon–inlet–coastal ocean system under hurricane conditions. Ocean Model. 2018, 129, 124–144. [Google Scholar] [CrossRef]
  58. Wenegrat, J.; Arthur, R. Response of the atmospheric boundary layer to submesoscale sea surface temperature fronts. Geophys. Res. Lett. 2018, 45, 13–505. [Google Scholar] [CrossRef]
  59. Shao, M.; Ortiz-Suslow, D.G.; Haus, B.K.; Lund, B.; Williams, N.J.; Özgökmen, T.M.; Laxague, N.J.; Horstmann, J.; Klymak, J.M. The Variability of Winds and Fluxes Observed Near Submesoscale Fronts. J. Geophys. Res. Oceans 2019, 124, 7756–7780. [Google Scholar] [CrossRef]
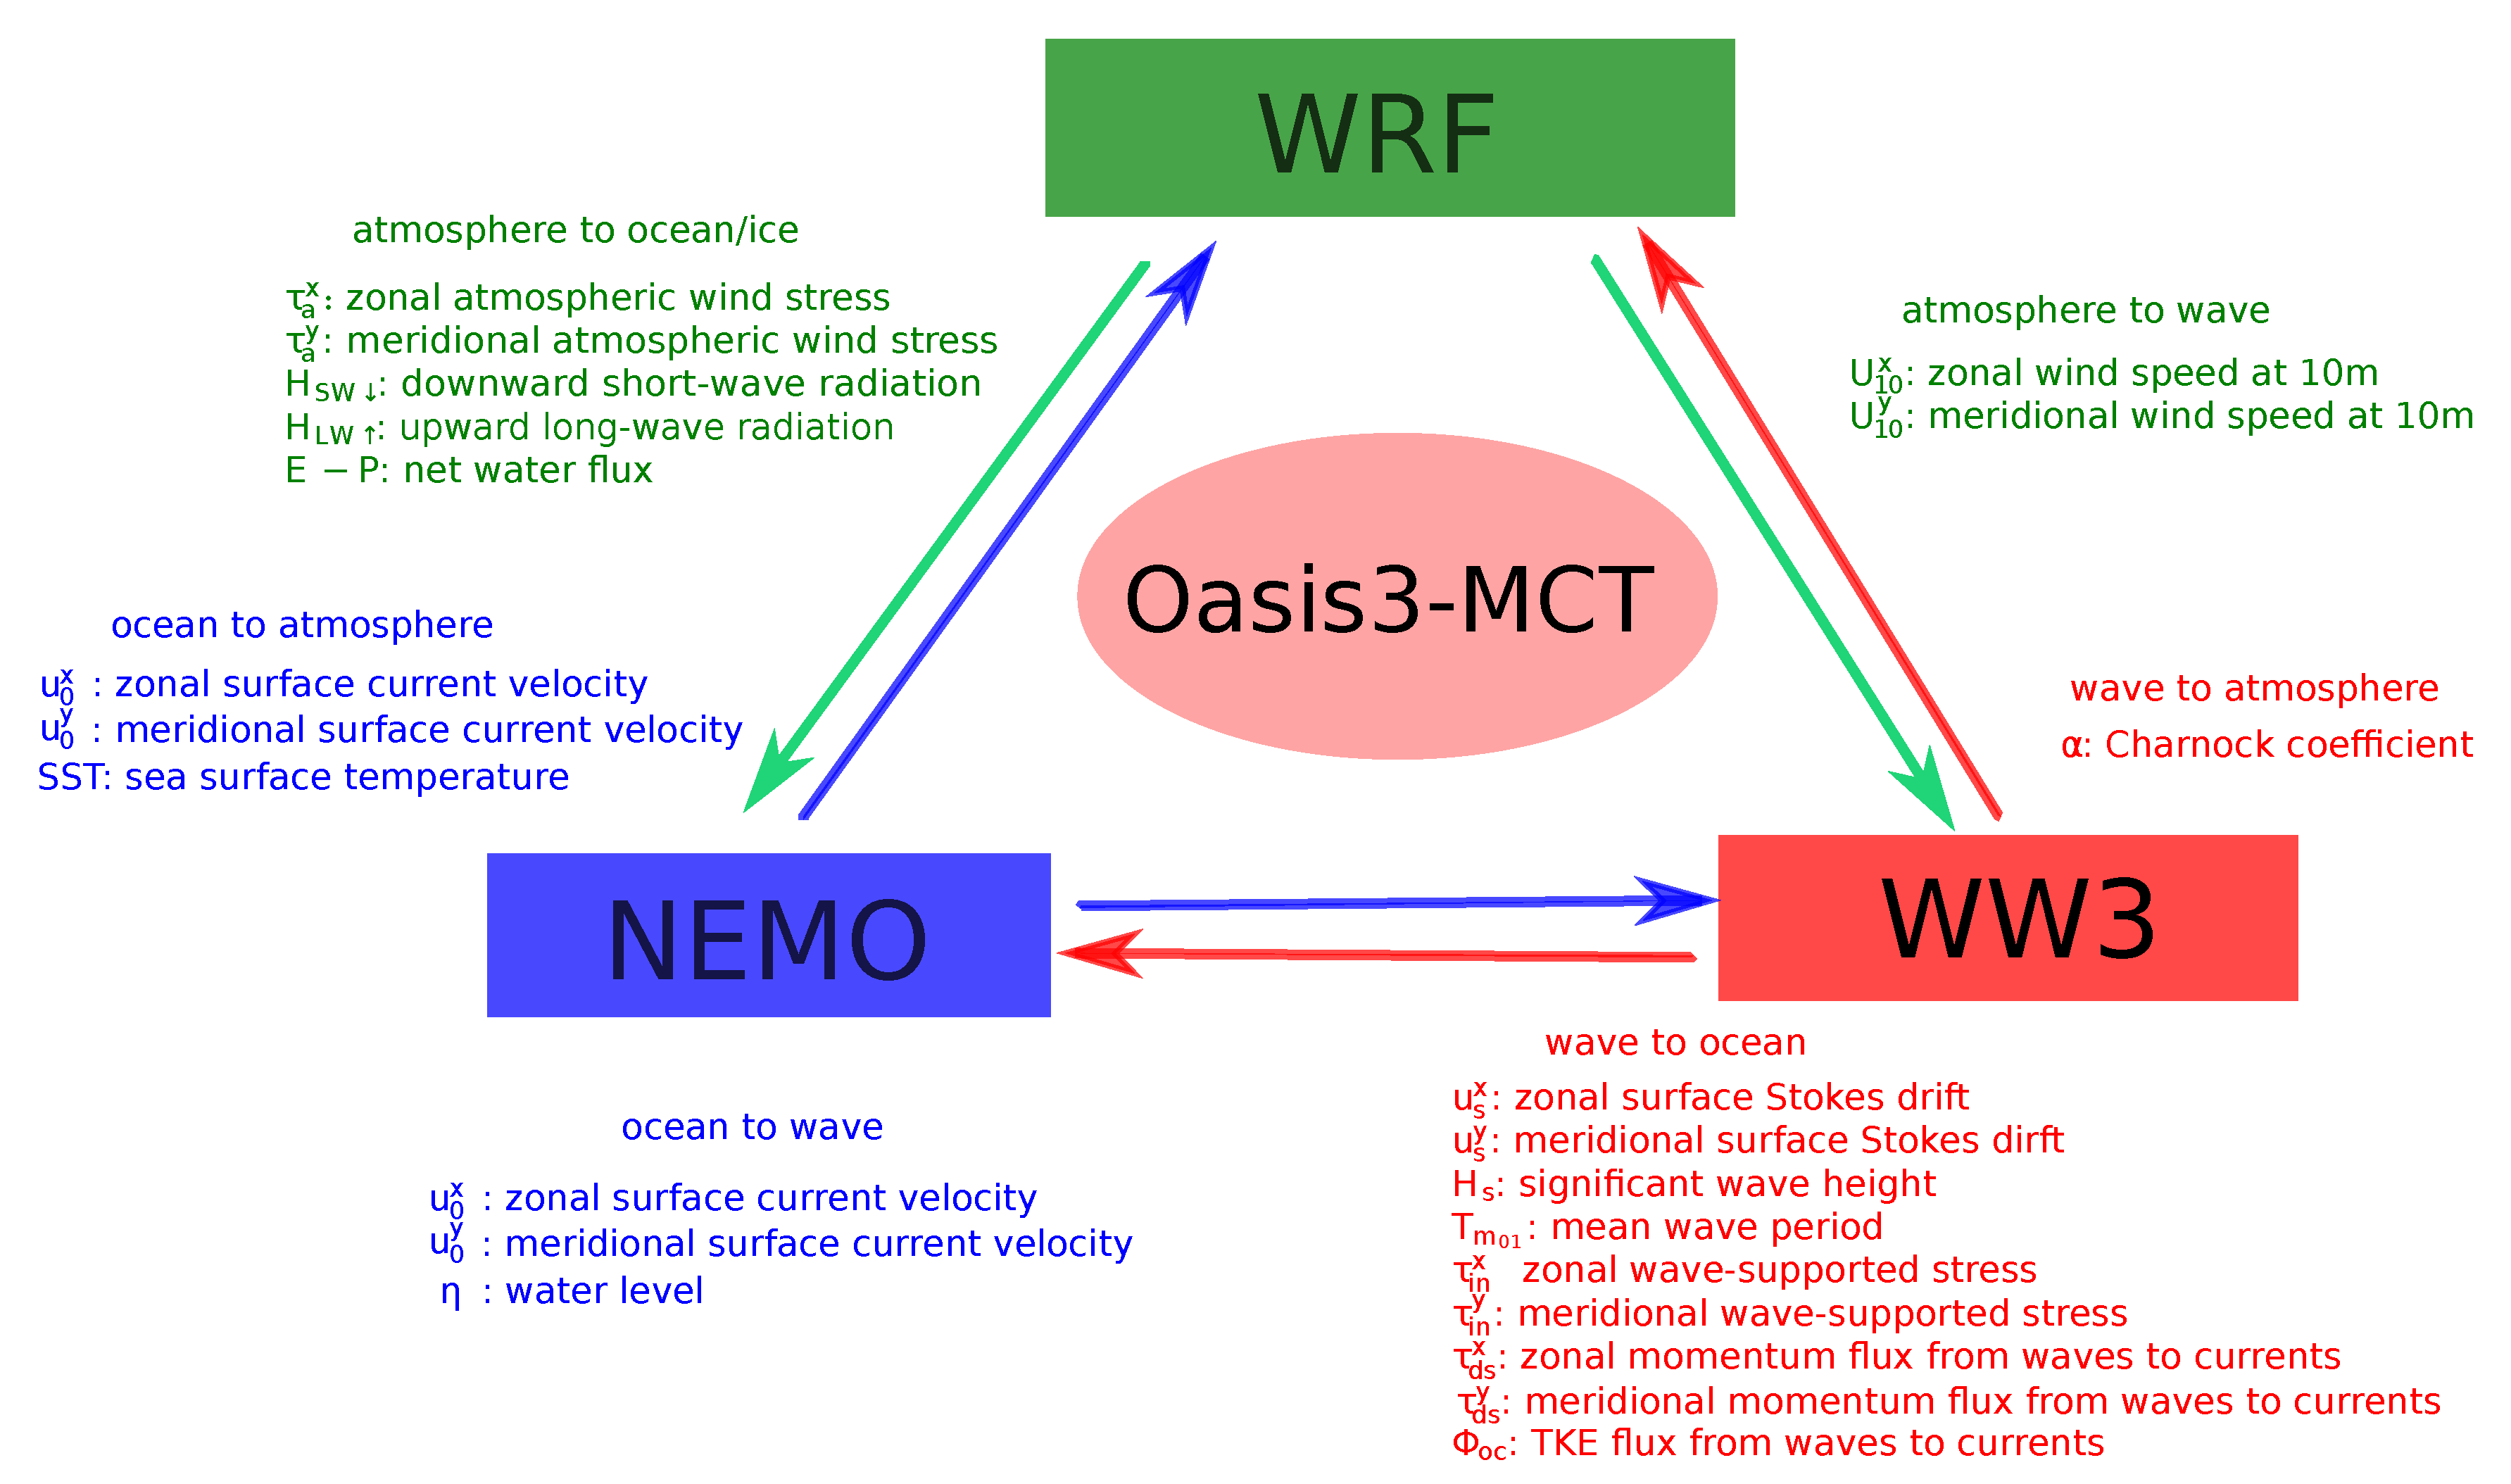
Figure 1. The coupling strategy and variables in Uppsala University-Coupled model (UU-CM).
Atmosphere 11 00327 g001
Figure 2. The domain of the Weather Research and Forecasting (WRF) is shown in the outer box. The colored area is the domain of Nucleus of European Modelling of the Ocean (NEMO) and WaveWatch-III (WW3), where the color represents the topography information in the wave and ocean model (unit: m).
Atmosphere 11 00327 g002
Figure 3. The average monthly wind speed at 100 m above mean sea surface (a) and significant wave height (b) during 2010–2019 over the Baltic Sea and North Sea. Only the sea points from ERA5 are used in the plot.
Atmosphere 11 00327 g003
Figure 4. The normalized distribution of wind (a,b) and wave (c,d) for the North Sea (a,c) and the Baltic Sea (b,d) in January and July 2015. Data are from ERA5.
Atmosphere 11 00327 g004
Figure 5. Results for wind power density (WPD) from different experiments (columns) and the different months (rows) where the top row shows results for January and the bottom row for July (2015). Column 1 (a,e) represents the mean WPD from the control experiment Exp1. Column 2 (b,f) the influence of wave–atmosphere interaction on WPD (normalized, unit %), i.e., Exp2–Exp1. Column 3 (c,g) shows the effect of adding atmosphere–ocean interaction in the simulations of WPD, i.e., Exp3–Exp2 (normalized, unit %). Column 4 (d,h) shows the effect of included influence of wave–current interaction when simulating WPD (normalized, unit %).
Atmosphere 11 00327 g005
Figure 6. Results for WPE from the different experiments (columns) and the different months (rows) where the top row shows results for January and the bottom row for July (2015). Column 1 (a,e) represents the mean WPE from the control experiment Exp1. Column 2 (b,f) the influence of wave–atmosphere interaction on WPE (normalized, unit %), i.e., Exp2–Exp1. Column 3 (c,g) shows the effect of adding atmosphere–ocean interaction in the simulations of WPE, i.e., Exp3–Exp2 (normalized, unit %). Column 4 (d,h) shows the effect of included influence of wave–current interaction when simulating WPE (normalized, unit %).
Atmosphere 11 00327 g006
Figure 7. The mean wind direction (the top row) and wave direction (the bottom row). Column 1 (a,c) represents the results from Exp1 in January and July in column 2 (b,d). All the direction is the direction from which it originates (unit: ).
Atmosphere 11 00327 g007
Figure 8. The WPD as function of the distance from the coast for January (a) and July (b) in the four chosen areas from Exp1. A, B, C, and D represent the Danish west coast, British east coast, coastal areas of Lithuania and the Polish coast, respectively (shown in Figure 2). The shaded areas represent the standard deviation.
Atmosphere 11 00327 g008
Figure 9. The WPE as function of the distance from the coast for January (a) and July (b) in the four chosen areas from Exp1. The shaded areas represent the standard deviation. The mean water depth changes with the distance from the coastline are shown as dashed lines.
Atmosphere 11 00327 g009
Figure 10. The relative difference of WPD between the sensitivity experiments (i.e., Exp2, Exp3, and Exp4) and Exp1 for the four chosen areas: (a) A, (b) B, (c) C and (d) D in January 2015. The shaded areas represent the standard deviation.
Atmosphere 11 00327 g010
Figure 11. The relative difference of WPD between the sensitivity experiments (i.e., Exp2, Exp3, and Exp4) and Exp1 for the four chosen areas: (a) A, (b) B, (c) C and (d) D in July 2015. The shaded areas represent the standard deviation.
Atmosphere 11 00327 g011
Figure 12. The relative difference of WPE between sensitivity experiments (i.e., Exp2, Exp3, and Exp4) and Exp1 for the four chosen areas: A (a), (b) B, (c) C and (d) D in January 2015. The shaded areas represent the standard deviation. The black solid lines represent the water depth changes with distance from the coastline.
Atmosphere 11 00327 g012
Figure 13. The relative difference of WPE between sensitivity experiments (i.e., Exp2, Exp3, and Exp4) and Exp1 for the four chosen areas: A (a), (b) B, (c) C and (d) D in July 2015. The shaded ares represent the standard deviation. The black solid lines represent the water depth changes with distance from the coastline.
Atmosphere 11 00327 g013
Figure 14. The mean wind profile in January from Exp2 and Exp3 at the four chosen areas: (a) A, (b) B, (c) C and (d) D. The insert plots show in the wind profile below 50 m.
Atmosphere 11 00327 g014
Table 1. The Atmosphere–Wave–Ocean (AWO) interaction processes in the four experiments.
Exp1Exp2Exp3Exp4
Charnock coefficient α c in WRFEquation (6)Equation (8)Equation (8)Equation (8)
Wind forcing for WW3from WRFfrom WRFfrom WRFfrom WRF
SSTERA-InterimERA-Interimfrom NEMOfrom NEMO
Surface currents in WRF00from NEMOfrom NEMO
Forcing data for NEMO××from WRFfrom WRF
Stokes drift for NEMO××0from WW3
Wind stress for NEMO×× τ o c = τ a Equation (20)
TKE flux to NEMO××Equation (18)Equation (11)
Roughness length in NEMO××Equation (19)Equation (21)
Currents in WW3××0from NEMO
Water level××0from NEMO