Spatial and Temporal Variations of Atmospheric CO2 Concentration in China and Its Influencing Factors
Abstract
1. Introduction
2. Data and Methods
2.1. Data
2.1.1. CO2 Data
2.1.2. Ancillary Data
2.2. Statistical Analysis Methods
2.2.1. Standard Deviation Ellipse Analysis
2.2.2. Pixel-Based Time Series Analysis
3. Results
3.1. Validation of XCO2 Concentrations via in situ Data
3.2. Seasonal XCO2 Variations
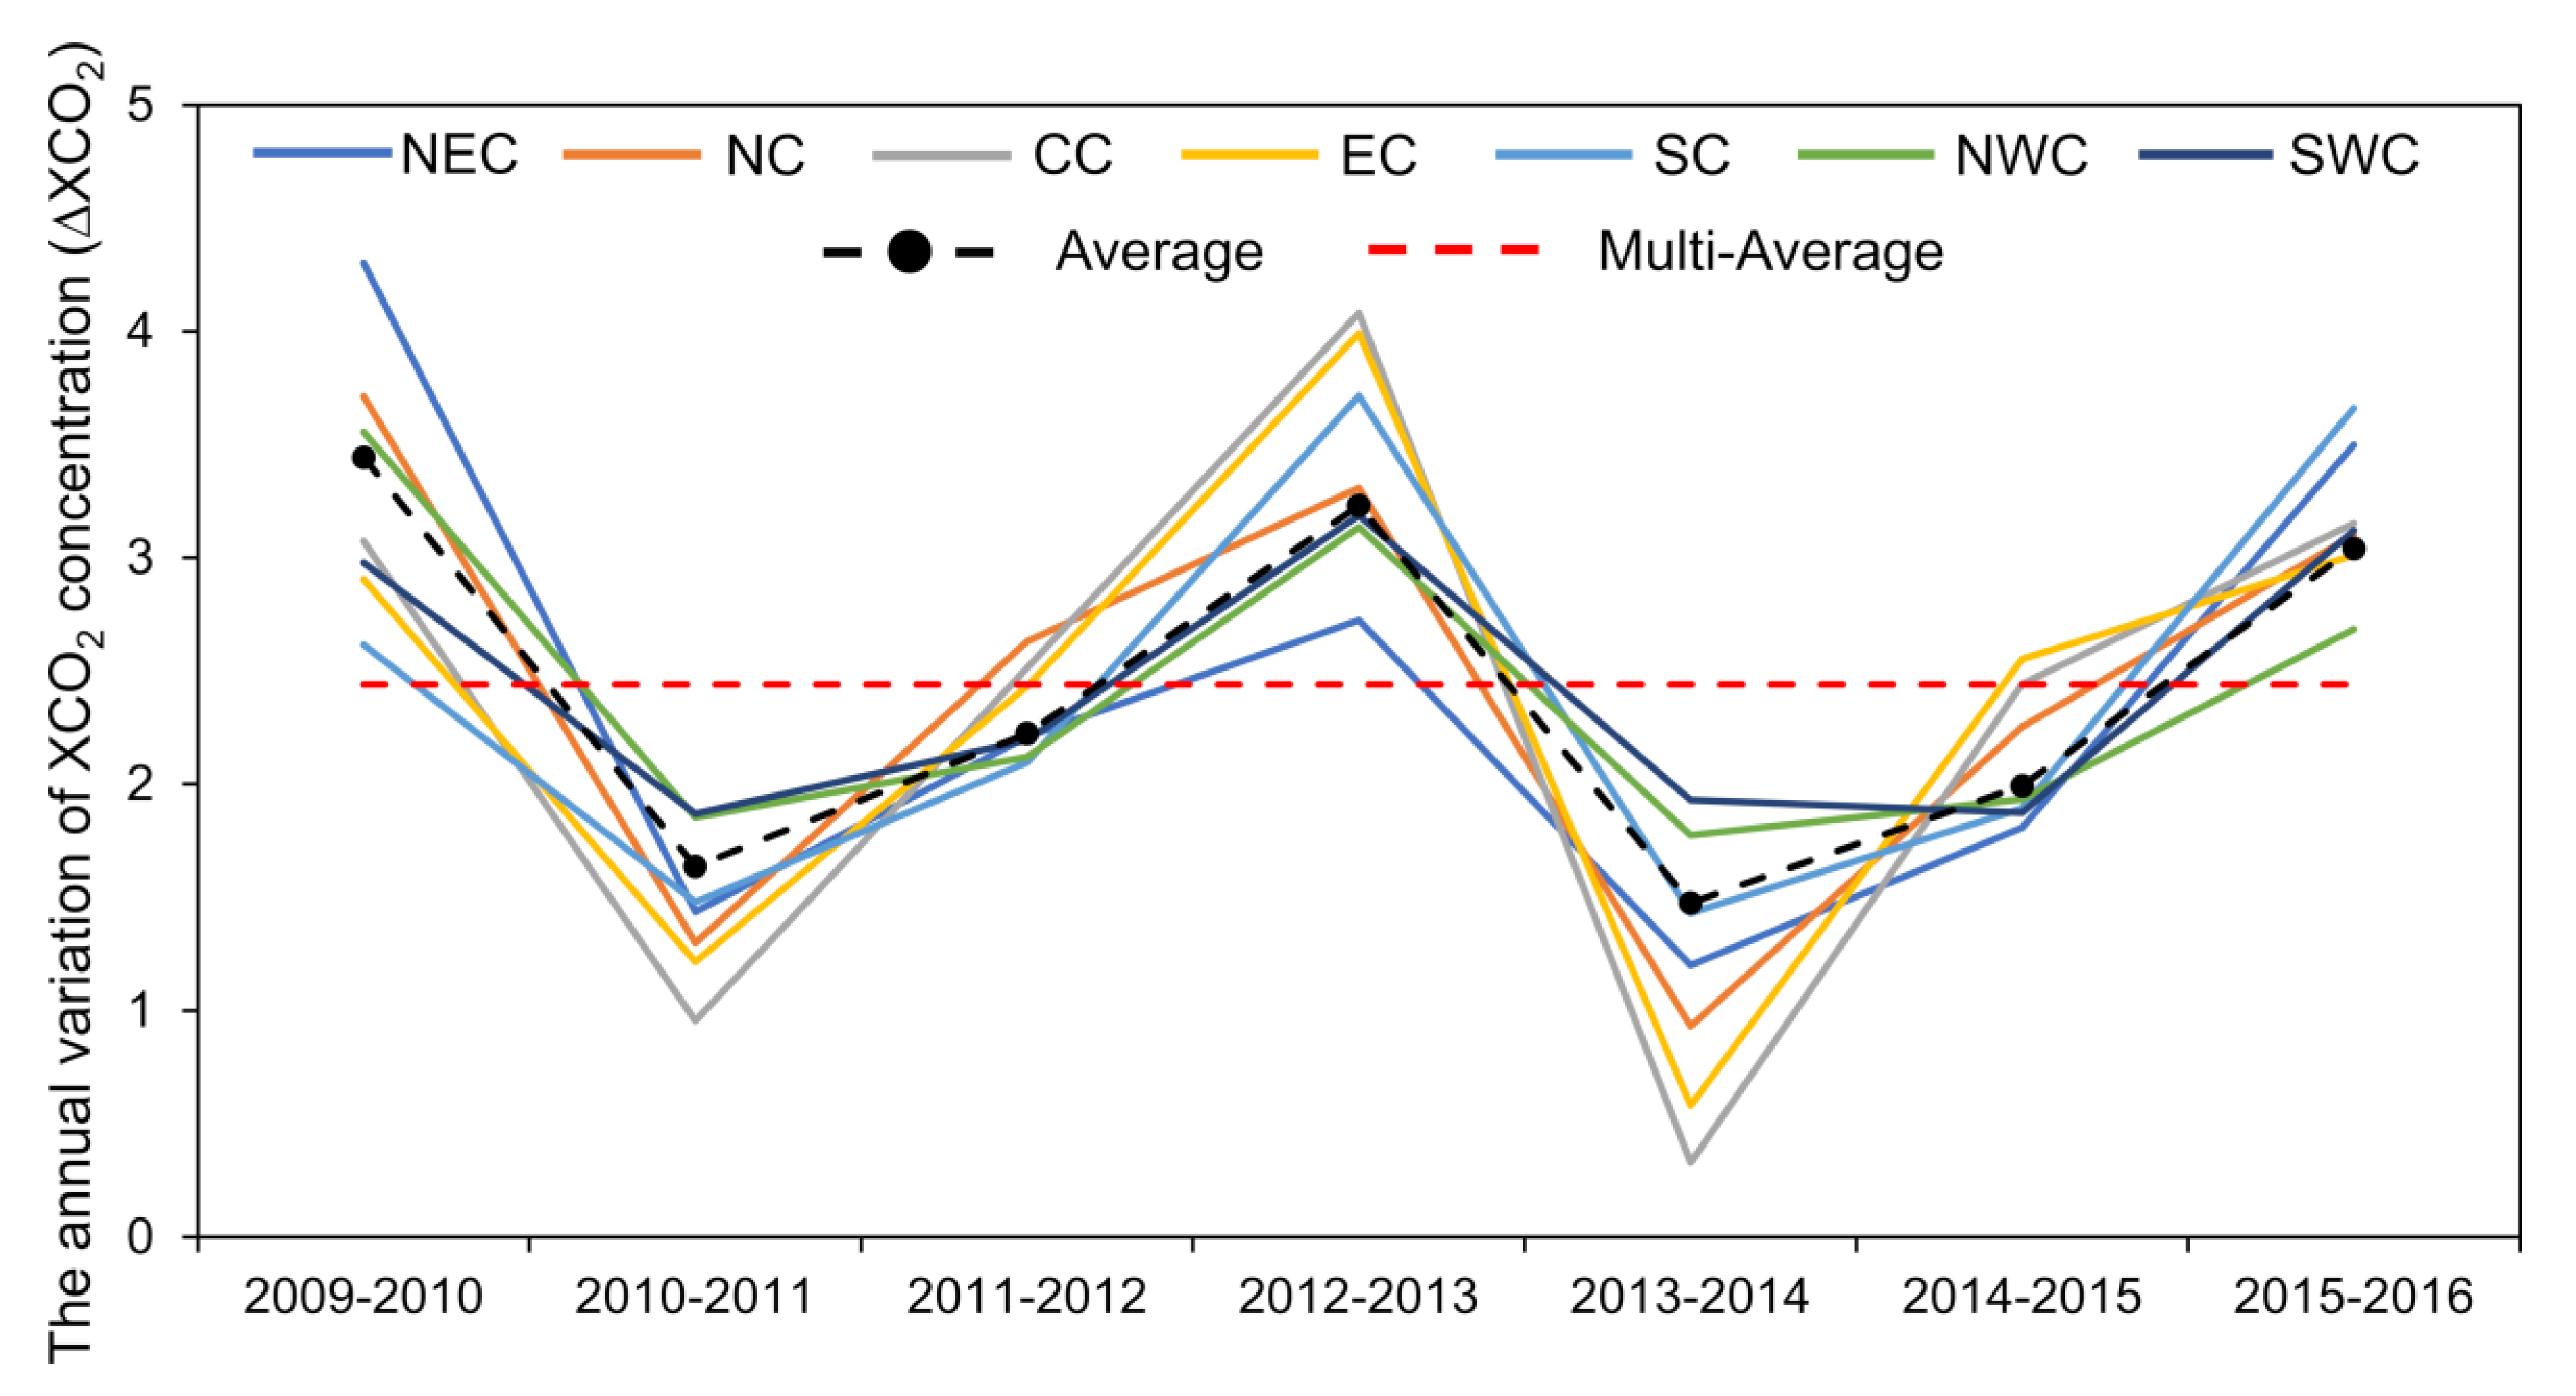
3.3. Interannual Variations in XCO2
4. Discussion
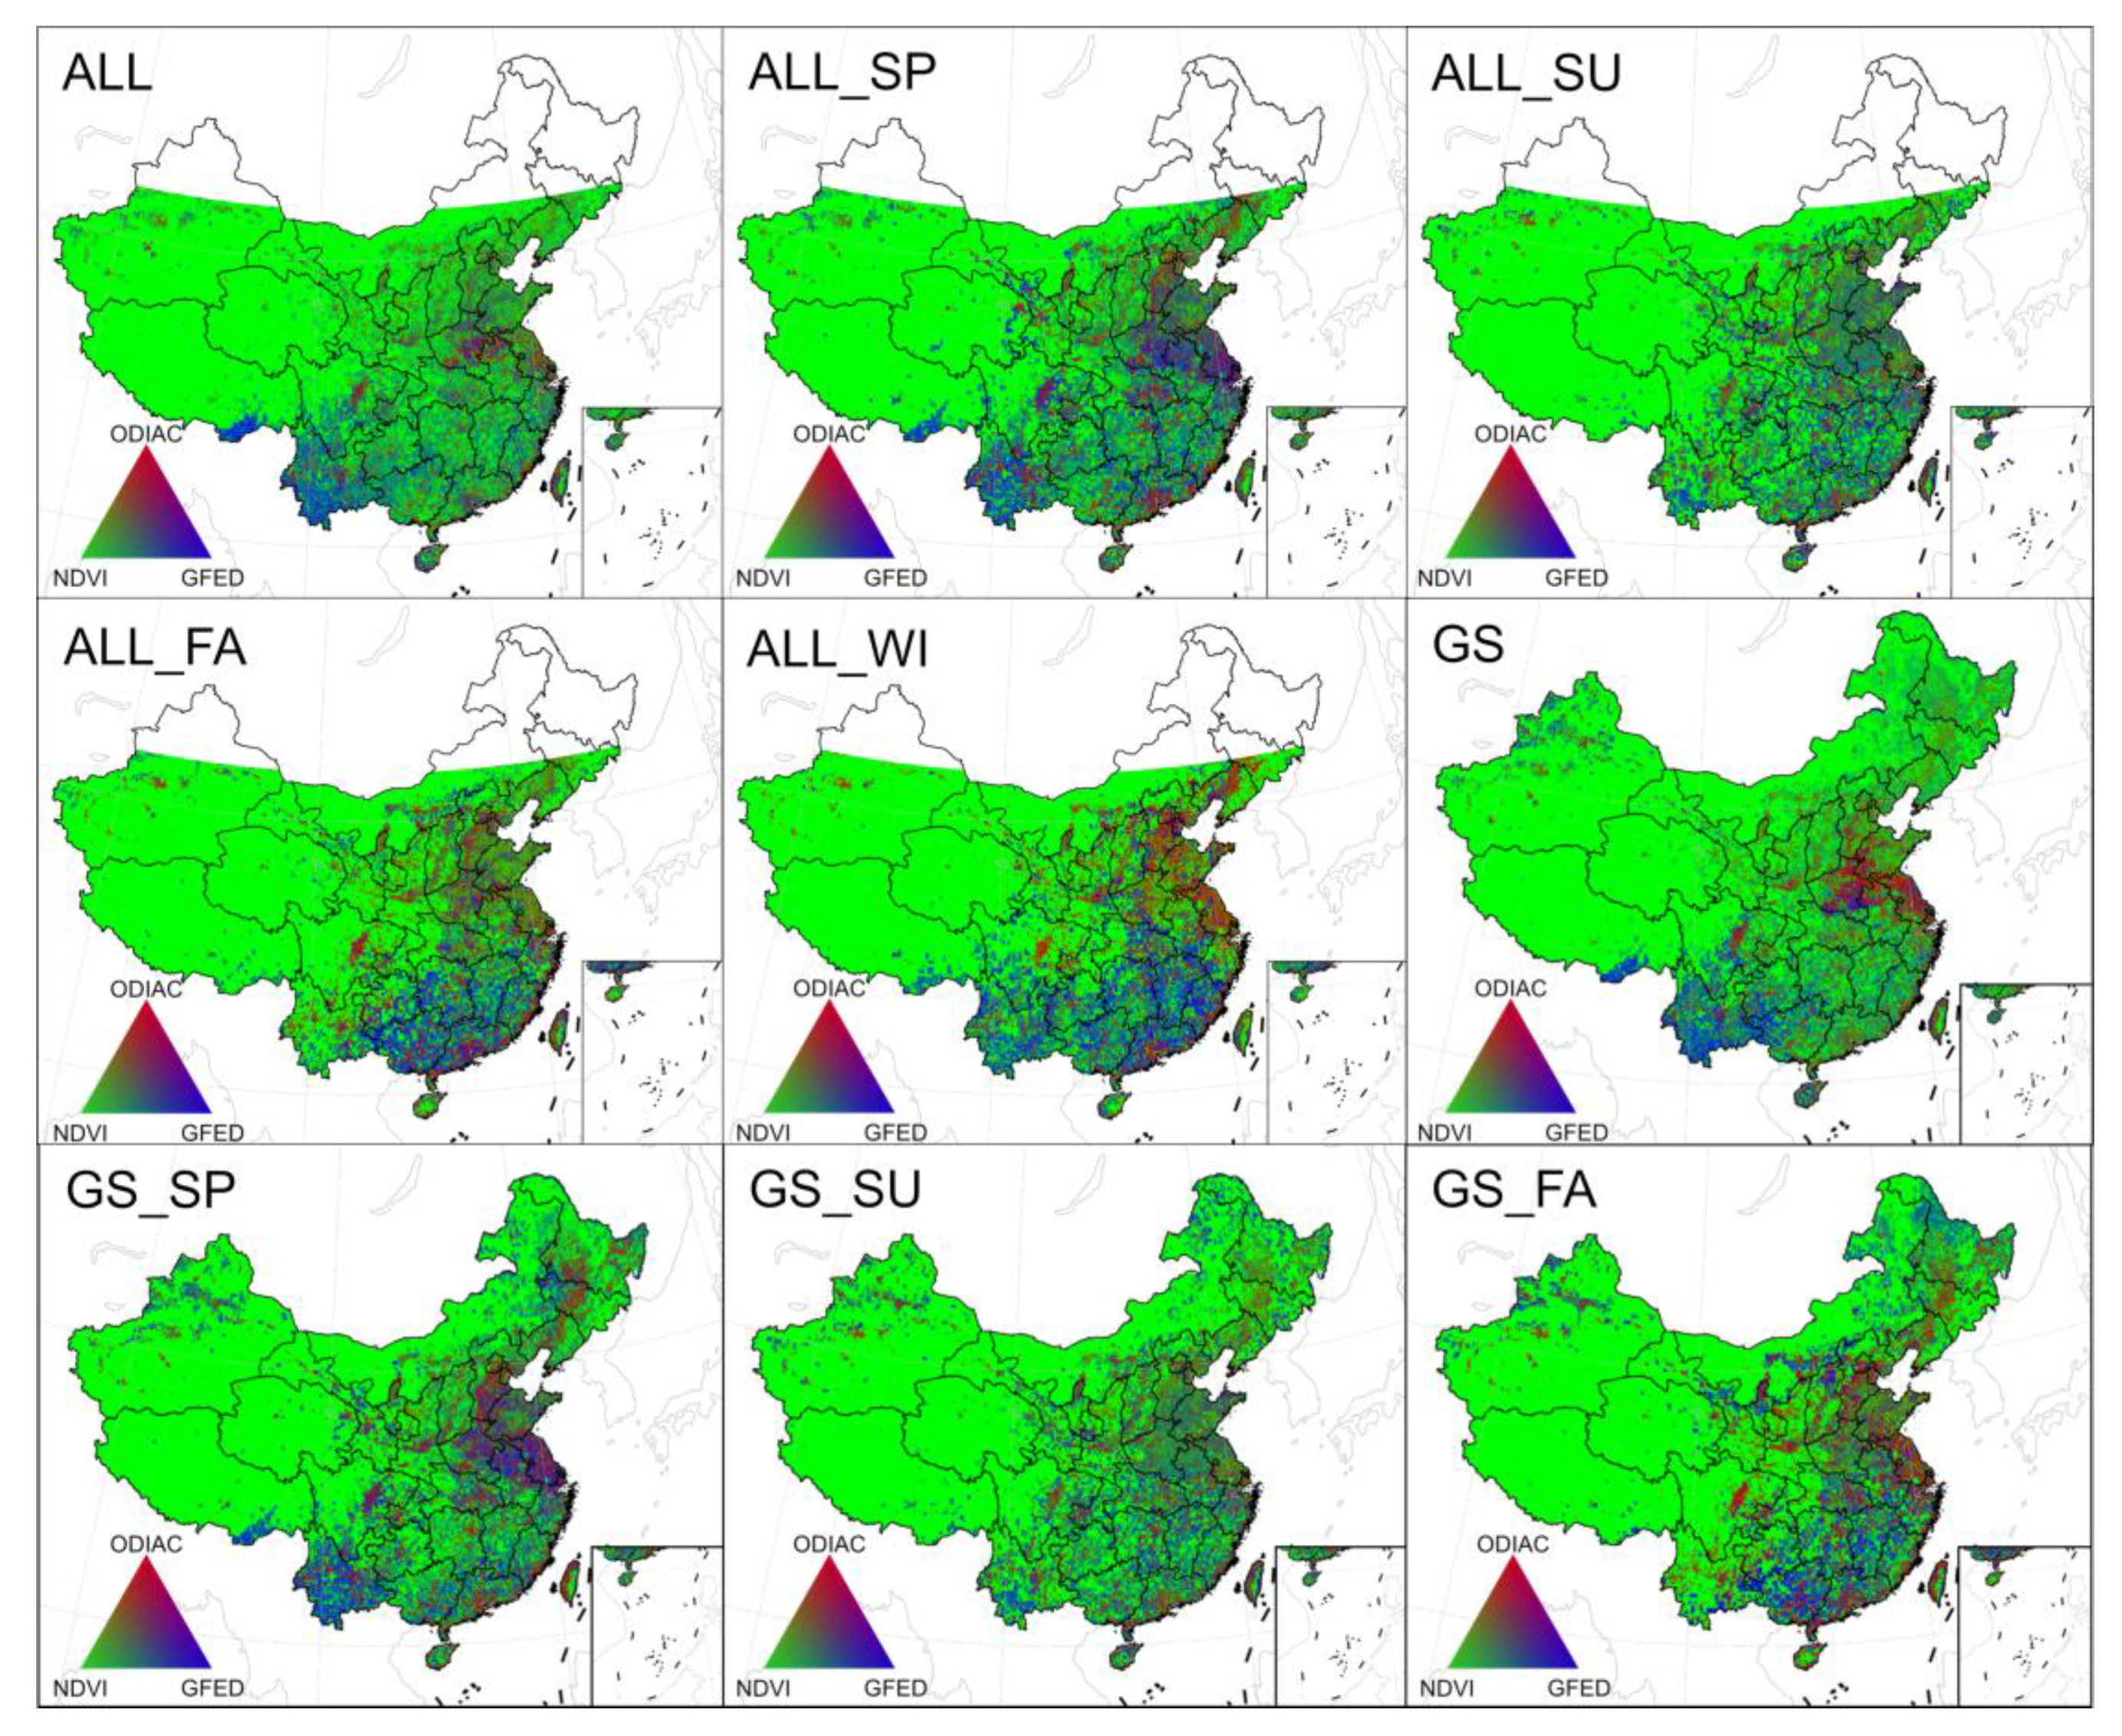
4.1. Major Influencing Factors of XCO2 in China
4.2. Contribution of XCO2 in China
5. Conclusions
Author Contributions
Funding
Acknowledgments
Conflicts of Interest
References
- Intergovernmental Panel on Climate Change. Climate Change 2013: The Physical Science Basis. Contribution of Working Group I to the Fifth Assessment Report of the Intergovernmental Panel on Climate Change; Cambridge University Press: Cambridge, UK, 2013; p. 1535. [Google Scholar]
- Schneising, O.; Buchwitz, M.; Reuter, M.; Heymann, J.; Bovensmann, H.; Burrows, J.P. Long-term analysis of carbon dioxide and methane column-averaged mole fractions retrieved from SCIAMACHY. Atmos. Chem. Phys. 2011, 11, 2863–2880. [Google Scholar] [CrossRef]
- World Data Centre for Greenhouse Gases. Available online: https://gaw.kishou.go.jp/ (accessed on 1 February 2020).
- Guan, D.; Peters, G.P.; Weber, C.; Hubacek, K. Journey to world top emitter: An analysis of the driving forces of China’s recent CO2 emissions surge. Geophys. Res. Lett. 2009, 36, L04709. [Google Scholar] [CrossRef]
- Cheng, S.; Zhou, L.; Tans, P.P.; An, X.; Liu, Y. Comparison of atmospheric CO2, mole fractions and source–sink characteristics at four WMO/GAW stations in China. Atmos. Environ. 2018, 180, 216–225. [Google Scholar] [CrossRef]
- Le Quéré, C.; Andrew, R.M.; Friedlingstein, P.; Sitch, S.; Pongratz, J.; Manning, A.; Korsbakken, J.I.; Peters, G.P.; Canadell, J.; Jackson, R.B.; et al. Global Carbon Budget 2017. Earth Syst. Sci. Data Discuss. 2018, 10, 405–448. [Google Scholar] [CrossRef]
- Buermann, W.; Lintner, B.R.; Koven, C.; Angert, A.; Pinzon, J.E.; Tucker, C.J.; Fung, I.Y. The changing carbon cycle at Mauna Loa Observatory. Proc. Natl. Acad. Sci. USA 2007, 104, 4249–4254. [Google Scholar] [CrossRef] [PubMed]
- Chevallier, F.; Deutscher, N.; Conway, T.J.; Ciais, P.; Ciattaglia, L.; Dohe, S.; Frohlich, M.; Gomez-Pelaez, A.J.; Griffith, D.; Hase, F.; et al. Global CO2 fluxes inferred from surface air-sample measurements and from TCCON retrievals of the CO2 total column. Geophys. Res. Lett. 2011, 38, L24810. [Google Scholar] [CrossRef]
- Jing, Y.; Wang, T.; Zhang, P.; Chen, L.; Xu, N.; Ma, Y. Global Atmospheric CO2 Concentrations Simulated by GEOS-Chem: Comparison with GOSAT, Carbon Tracker and Ground-Based Measurements. Atmosphere 2018, 9, 175. [Google Scholar] [CrossRef]
- Heymann, J.; Reuter, M.; Buchwitz, M.; Schneising, O.; Bovensmann, H.; Burrows, J.P.; Massart, S.; Kaiser, J.; Crisp, D. CO2 emission of Indonesian fires in 2015 estimated from satellite-derived atmospheric CO2 concentrations. Geophys. Res. Lett. 2017, 44, 1537–1544. [Google Scholar] [CrossRef]
- Buchwitz, M.; Reuter, M.; Schneising, O.; Noël, S.; Gier, B.; Bovensmann, H.; Burrows, J.P.; Boesch, H.; Anand, J.; Parker, R.J.; et al. Computation and analysis of atmospheric carbon dioxide annual mean growth rates from satellite observations during 2003–2016. Atmos. Chem. Phys. 2018, 18, 17355–17370. [Google Scholar] [CrossRef]
- Reuter, M.; Bovensmann, H.; Buchwitz, M.; Burrows, J.P.; Connor, B.J.; Deutscher, N.; Griffith, D.W.T.; Heymann, J.; Keppel-Aleks, G.; Messerschmidt, J.; et al. Retrieval of atmospheric CO2 with enhanced accuracy and precision from SCIAMACHY: Validation with FTS measurements and comparison with model results. J. Geophys. Res. Atmos. 2011, 116, D04301. [Google Scholar] [CrossRef]
- Noël, S.; Bramstedt, K.; Hilker, M.; Liebing, P.; Plieninger, J.; Reuter, M.; Rozanov, A.; Sioris, C.; Bovensmann, H.; Burrows, J.P.; et al. Stratospheric, CH4 and, CO2 profiles derived from SCIAMACHY solar occultation measurements. Atmos. Meas. Tech. 2016, 9, 1485–1503. [Google Scholar] [CrossRef]
- Wang, X.; Zhang, X.Y.; Zhang, L.Y.; Ling, G.; Lin, T. Interpreting seasonal changes of low-tropospheric CO2, over China based on SCIAMACHY observations during 2003–2011. Atmos. Environ. 2015, 103, 180–187. [Google Scholar]
- Jacob, D.; Turner, A.J.; Maasakkers, J.D.; Sheng, J.; Sun, K.; Liu, X.; Chance, K.; Aben, I.; McKeever, J.; Frankenberg, C. Satellite observations of atmospheric methane and their value for quantifying methane emissions. Atmos. Chem. Phys. 2016, 16, 14371–14396. [Google Scholar] [CrossRef]
- Zeng, Z.-C.; Lei, L.; Strong, K.; Jones, D.B.A.; Guo, L.; Liu, M.; Deng, F.; Deutscher, N.; Dubey, M.K.; Griffith, D.W.T.; et al. Global land mapping of satellite-observed CO2 total columns using spatio-temporal geostatistics. Int. J. Digit. Earth 2017, 10, 426–456. [Google Scholar] [CrossRef]
- Jiang, X.; Crisp, D.; Olsen, E.; Kulawik, S.S.; Miller, C.E.; Pagano, T.; Liang, M.-C.; Yung, Y.L. CO2 annual and semiannual cycles from multiple satellite retrievals and models. Earth Space Sci. 2016, 3, 78–87. [Google Scholar] [CrossRef]
- De Kauwe, M.G.; Keenan, T.F.; Medlyn, B.E.; Prentice, I.C.; Terrer, C. Satellite based estimates underestimate the effect of CO2 fertilization on net primary productivity. Nat. Clim. Chang. 2016, 6, 892–893. [Google Scholar] [CrossRef]
- Yokota, T.; Yoshida, Y.; Eguchi, N.; Ota, Y.; Tanaka, T.; Watanabe, H.; Maksyutov, S. Global Concentrations of CO2 and CH4 Retrieved from GOSAT: First Preliminary Results. SOLA 2009, 5, 160–163. [Google Scholar] [CrossRef]
- Turner, A.J.; Jacob, D.J.; Wecht, K.J.; Maasakkers, J.D.; Lundgren, E.; Andrews, A.E.; Biraud, S.C.; Boesch, H.; Bowman, K.W.; Deutscher, N.; et al. Estimating global and North American methane emissions with high spatial resolution using GOSAT satellite data. Atmospheric Chem. Phys. Discuss. 2015, 15, 7049–7069. [Google Scholar] [CrossRef]
- Sheng, J.; Jacob, D.J.; Turner, A.J.; Maasakkers, J.D.; Benmergui, J.; Bloom, A.A.; Arndt, C.; Gautam, R.; Zavala-Araiza, D.; Boesch, H.; et al. 2010–2016 methane trends over Canada, the United States, and Mexico observed by the GOSAT satellite: contributions from different source sectors. Atmospheric Chem. Phys. Discuss. 2018, 18, 12257–12267. [Google Scholar] [CrossRef]
- Kikuchi, N.; Yoshida, Y.; Uchino, O.; Morino, I.; Yokota, T. An advanced retrieval algorithm for greenhouse gases using polarization information measured by GOSAT TANSO-FTS SWIR I: Simulation study. J. Geophys. Res. Atmos. 2016, 121, 13129–13157. [Google Scholar] [CrossRef]
- Makoto, I.; Isamu, M.; Osamu, U.; Nakatsuru, T.; Yoshida, Y.; Yokota, T.; Wunch, D.; Wennberg, P.; Roehl, C.M.; Griffith, D.W.T.; et al. Bias corrections of GOSAT SWIR XCO2 and XCH4 with TCCON data and their evaluation using aircraft measurement data. Atmos. Meas. Tech. 2016, 9, 3491–3512. [Google Scholar]
- Guo, M.; Li, J.; Xu, J.; Wang, X.F.; He, H.S.; Wu, L. CO2 emissions from the 2010 Russian wildfires using GOSAT data. Environ. Pollut. 2017, 226, 60–68. [Google Scholar] [CrossRef] [PubMed]
- Basu, S.; Guerlet, S.; Butz, A.; Houweling, S.; Hasekamp, O.; Aben, I.; Krummel, P.B.; Steele, P.; Langenfelds, R.; Torn, M.S.; et al. Global CO2 fluxes estimated from GOSAT retrievals of total column CO2. Atmospheric Chem. Phys. Discuss. 2013, 13, 8695–8717. [Google Scholar] [CrossRef]
- Wang, J.S.; Kawa, S.R.; Collatz, G.J.; Sasakawa, M.; Gatti, L.V.; Machida, T.; Liu, Y.; Manyin, M.E. A global synthesis inversion analysis of recent variability in CO2 fluxes using GOSAT and in situ observations. Atmospheric Chem. Phys. Discuss. 2018, 18, 11097–11124. [Google Scholar] [CrossRef]
- Tian, Y.; Sun, Y.; Liu, C.; Xie, P.; Chan, K.; Xu, J.; Wang, W.; Liu, J. Characterization of urban CO2 column abundance with a portable low resolution spectrometer (PLRS): Comparisons with GOSAT and GEOS-Chem model data. Sci. Total. Environ. 2018, 612, 1593–1609. [Google Scholar] [CrossRef] [PubMed]
- Detmers, R.G.; Hasekamp, O.; Aben, I.; Houweling, S.; Van Leeuwen, T.T.; Butz, A.; Landgraf, J.; Köhler, P.; Guanter, L.; Poulter, B. Anomalous carbon uptake in Australia as seen by GOSAT. Geophys. Res. Lett. 2015, 42, 8177–8184. [Google Scholar] [CrossRef]
- Zhang, L.; Zhang, J. Analysis of the Seasonal Variation of CO2 Concentration in China Based on GOSAT Satellite Data. J. Indian Soc. Remote. Sens. 2018, 46, 1667–1675. [Google Scholar] [CrossRef]
- Houweling, S.; Baker, D.; Basu, S.; Boesch, H.; Butz, A.; Chevallier, F.; Deng, F.; Dlugokencky, E.J.; Feng, L.; Ganshin, A.; et al. An intercomparison of inverse models for estimating sources and sinks of CO2 using GOSAT measurements. J. Geophys. Res. Atmos. 2015, 120, 5253–5266. [Google Scholar] [CrossRef]
- Alexe, M.; Bergamaschi, P.; Segers, A.; Detmers, R.; Butz, A.; Hasekamp, O.; Guerlet, S.; Parker, R.J.; Boesch, H.; Frankenberg, C.; et al. Inverse modelling of CH4 emissions for 2010–2011 using different satellite retrieval products from GOSAT and SCIAMACHY. Atmos. Chem. Phys. 2015, 15, 113–133. [Google Scholar] [CrossRef]
- Janardanan, R.; Maksyutov, S.; Oda, T.; Saito, M.; Kaiser, J.; Ganshin, A.; Stohl, A.; Matsunaga, T.; Yoshida, Y.; Yokota, T. Comparing GOSAT observations of localized CO2 enhancements by large emitters with inventory-based estimates. Geophys. Res. Lett. 2016, 43, 3486–3493. [Google Scholar] [CrossRef]
- Guo, M.; Xu, J.; Wang, X.; He, H.; Li, J.; Wu, L. Estimating CO2 concentration during the growing season from MODIS and GOSAT in East Asia. Int. J. Remote Sens. 2015, 36, 4363–4383. [Google Scholar] [CrossRef]
- Huang, X.; Wang, T.; Talbot, R.; Xie, M.; Mao, H.; Li, S.; Zhuang, B.; Yang, X.; Fu, C.; Zhu, J.; et al. Temporal characteristics of atmospheric CO2 in urban Nanjing, China. Atmos. Res. 2015, 153, 437–450. [Google Scholar] [CrossRef]
- Lei, L.; Zhong, H.; He, Z.; Cai, B.; Yang, S.; Wu, C.; Zeng, Z.; Liu, L.; Zhang, B. Assessment of atmospheric CO2 concentration enhancement from anthropogenic emissions based on satellite observations. Chin. Sci. Bull. 2017, 62, 2941–2950. [Google Scholar] [CrossRef]
- Bie, N.; Lei, L.; Zeng, Z.; Cai, B.; Yang, S.; He, Z.; Wu, C.; Nassar, R. Regional uncertainty of GOSAT XCO2 retrievals in China: Quantification and attribution. Atmos. Meas. Tech. 2018, 11, 1251–1272. [Google Scholar] [CrossRef]
- Liang, A.; Gong, W.; Han, G. Comparison of Satellite-Observed XCO2 from GOSAT, OCO-2, and Ground-Based TCCON. Remote Sens. 2017, 9, 1033. [Google Scholar] [CrossRef]
- Silva, S.; Arellano, A.; Worden, H. Toward anthropogenic combustion emission constraints from space-based analysis of urban CO2/CO sensitivity. Geophys. Res. Lett. 2013, 40, 4971–4976. [Google Scholar] [CrossRef]
- Mousavi, S.; Falahatkar, S.; Farajzadeh, M. Assessment of seasonal variations of carbon dioxide concentration in Iran using GOSAT data. Nat. Resour. Forum 2017, 41, 83–91. [Google Scholar] [CrossRef]
- Shi, Y.; Matsunaga, T. Temporal comparison of global inventories of CO2 emissions from biomass burning during 2002–2011 derived from remotely sensed data. Environ. Sci. Pollut. Res. 2017, 24, 16905–16916. [Google Scholar] [CrossRef]
- Frankenberg, C.; Fisher, J.B.; Worden, J.; Badgley, G.; Saatchi, S.S.; Lee, J.E.; Toon, G.C.; Butz, A.; Jung, M.; Kuze, A.; et al. New global observations of the terrestrial carbon cycle from GOSAT: Patterns of plant fluorescence with gross primary productivity. Geophys. Res. Lett. 2011, 38, L17706. [Google Scholar] [CrossRef]
- Parker, R.; Boesch, H.; Cogan, A.; Fraser, A.; Feng, L.; Palmer, P.I.; Messerschmidt, G.; Deutscher, N.; Griffith, D.W.T.; Notholt, J.; et al. Methane observations from the Greenhouse Gases Observing SATellite: Comparison to ground-based TCCON data and model calculations. J. Geophys. Res. Atmos. 2011, 38, L15807. [Google Scholar] [CrossRef]
- Guo, M.; Wang, X.; Li, J.; Yi, K.; Zhong, G.; Tani, H. Assessment of Global Carbon Dioxide Concentration Using MODIS and GOSAT Data. Sensors 2012, 12, 16368–16389. [Google Scholar] [CrossRef] [PubMed]
- Liu, D.; Lei, L.; Guo, L.; Zeng, Z.C. A Cluster of CO2 Change Characteristics with GOSAT Observations for Viewing the Spatial Pattern of CO2 Emission and Absorption. Atmosphere 2015, 6, 1695–1713. [Google Scholar] [CrossRef]
- Shi, Y.; Matsunaga, T.; Noda, H. Interpreting Temporal Changes of Atmospheric CO2 Over Fire Affected Regions Based on GOSAT Observations. IEEE Geosci. Remote Sens. Lett. 2017, 14, 77–81. [Google Scholar] [CrossRef]
- Lim, C.; Kafatos, M.; Megonigal, P. Correlation between atmospheric CO2 concentration and vegetation greenness in North America: CO2 fertilization effect. Clim. Res. 2004, 28, 11–22. [Google Scholar] [CrossRef]
- Oda, T.; Maksyutov, S. A very high-resolution (1 km × 1 km) global fossil fuel CO2 emission inventory derived using a point source database and satellite observations of nighttime lights. Atmos. Chem. Phys. 2011, 11, 543–556. [Google Scholar] [CrossRef]
- Qiu, X.; Duan, L.; Chai, F.; Wang, S.; Yu, Q.; Wang, S. Deriving High-Resolution Emission Inventory of Open Biomass Burning in China based on Satellite Observations. Environ. Sci. Technol. 2016, 50, 11779–11786. [Google Scholar] [CrossRef]
- Giglio, L.; Randerson J., T.; van der Werf, G.R. Analysis of daily, monthly, and annual burned area using the fourth-generation global fire emissions database (GFED4). J. Geophys. Res. Biogeosci. 2013, 118, 317–328. [Google Scholar] [CrossRef]
- He, Q.; Gu, Y.; Zhang, M. Spatiotemporal patterns of aerosol optical depth throughout China from 2003 to 2016. Sci. Total Environ. 2019, 653, 23–35. [Google Scholar] [CrossRef]
- Shi, Y.; Matsunaga, T.; Yamaguchi, Y.; Li, Z.; Gu, X.; Chen, X. Long-term trends and spatial patterns of PM 2.5 -induced premature mortality in South and Southeast Asia from 1999 to 2014. Sci. Total Environ. 2018, 631–632, 1504–1514. [Google Scholar] [CrossRef]
- Wu, F. Studies on the Cause of Extreme Cold Temperature in Northeast China during March 2010 and Cold Surge, Ice-Snow and Frozen Disaster in South China during January 2008. Master’s Thesis, Ocean University of China, Qingdao, China, 2011. [Google Scholar]
- Chen, J.; Wang, X.; Zhou, W.; Wang, C.; Xie, Q.; Li, G.; Chen, S. Unusual Rainfall in Southern China in Decaying August during Extreme El Niño 2015/16: Role of the Western Indian Ocean and North Tropical Atlantic SST. J. Clim. 2018, 31, 7019–7034. [Google Scholar] [CrossRef]
- Zhai, P.; Yu, R.; Guo, Y. The Strong El Nino of 2015/16 and Its Dominant Impacts on Global and China’s Climate. J. Meteorol. Res. 2016, 30, 283–297. [Google Scholar] [CrossRef]
- Yuan, Y.; Gao, H.; Jia, X.L.; Wan, J.H. Influences of the 2014–2016 Super El Niño Event on Climate. Meteorol. Mon. 2016, 42, 532–539. [Google Scholar]
- Gong, H.; Wang, L.; Chen, W. Recently Strengthened Influence of ENSO on the Wintertime East Asian Surface Air Temperature. Atmosphere 2019, 10, 720. [Google Scholar] [CrossRef]
- Rodrigues, C.P.; Fontana, D.C.; Moraes, O.L.L.D.; Roberti, D.R. NDVI and CO2 flow in a soybean crop in Rio Grande do Sul, Brasil. Rev. Bras. Meteorol. 2013, 28, 95–104. [Google Scholar] [CrossRef]
- Wei, N. Temporal and Spatial Distribution Characteristics of Atmospheric CO2 Concentration in China Based on Satellite Remote Sensing and Its Influencing Factors. Master’s Thesis, East China Normal University, Shanghai, China, 2011. [Google Scholar]
- Yang, Y.; Yu, Z. Quantification and evaluation of atmospheric pollutant emissions from open biomass burning with multiple methods: A case study for Yangtze River Delta region, China. Atmos. Chem. Phys. Discuss. 2019, 19, 327–348. [Google Scholar] [CrossRef]
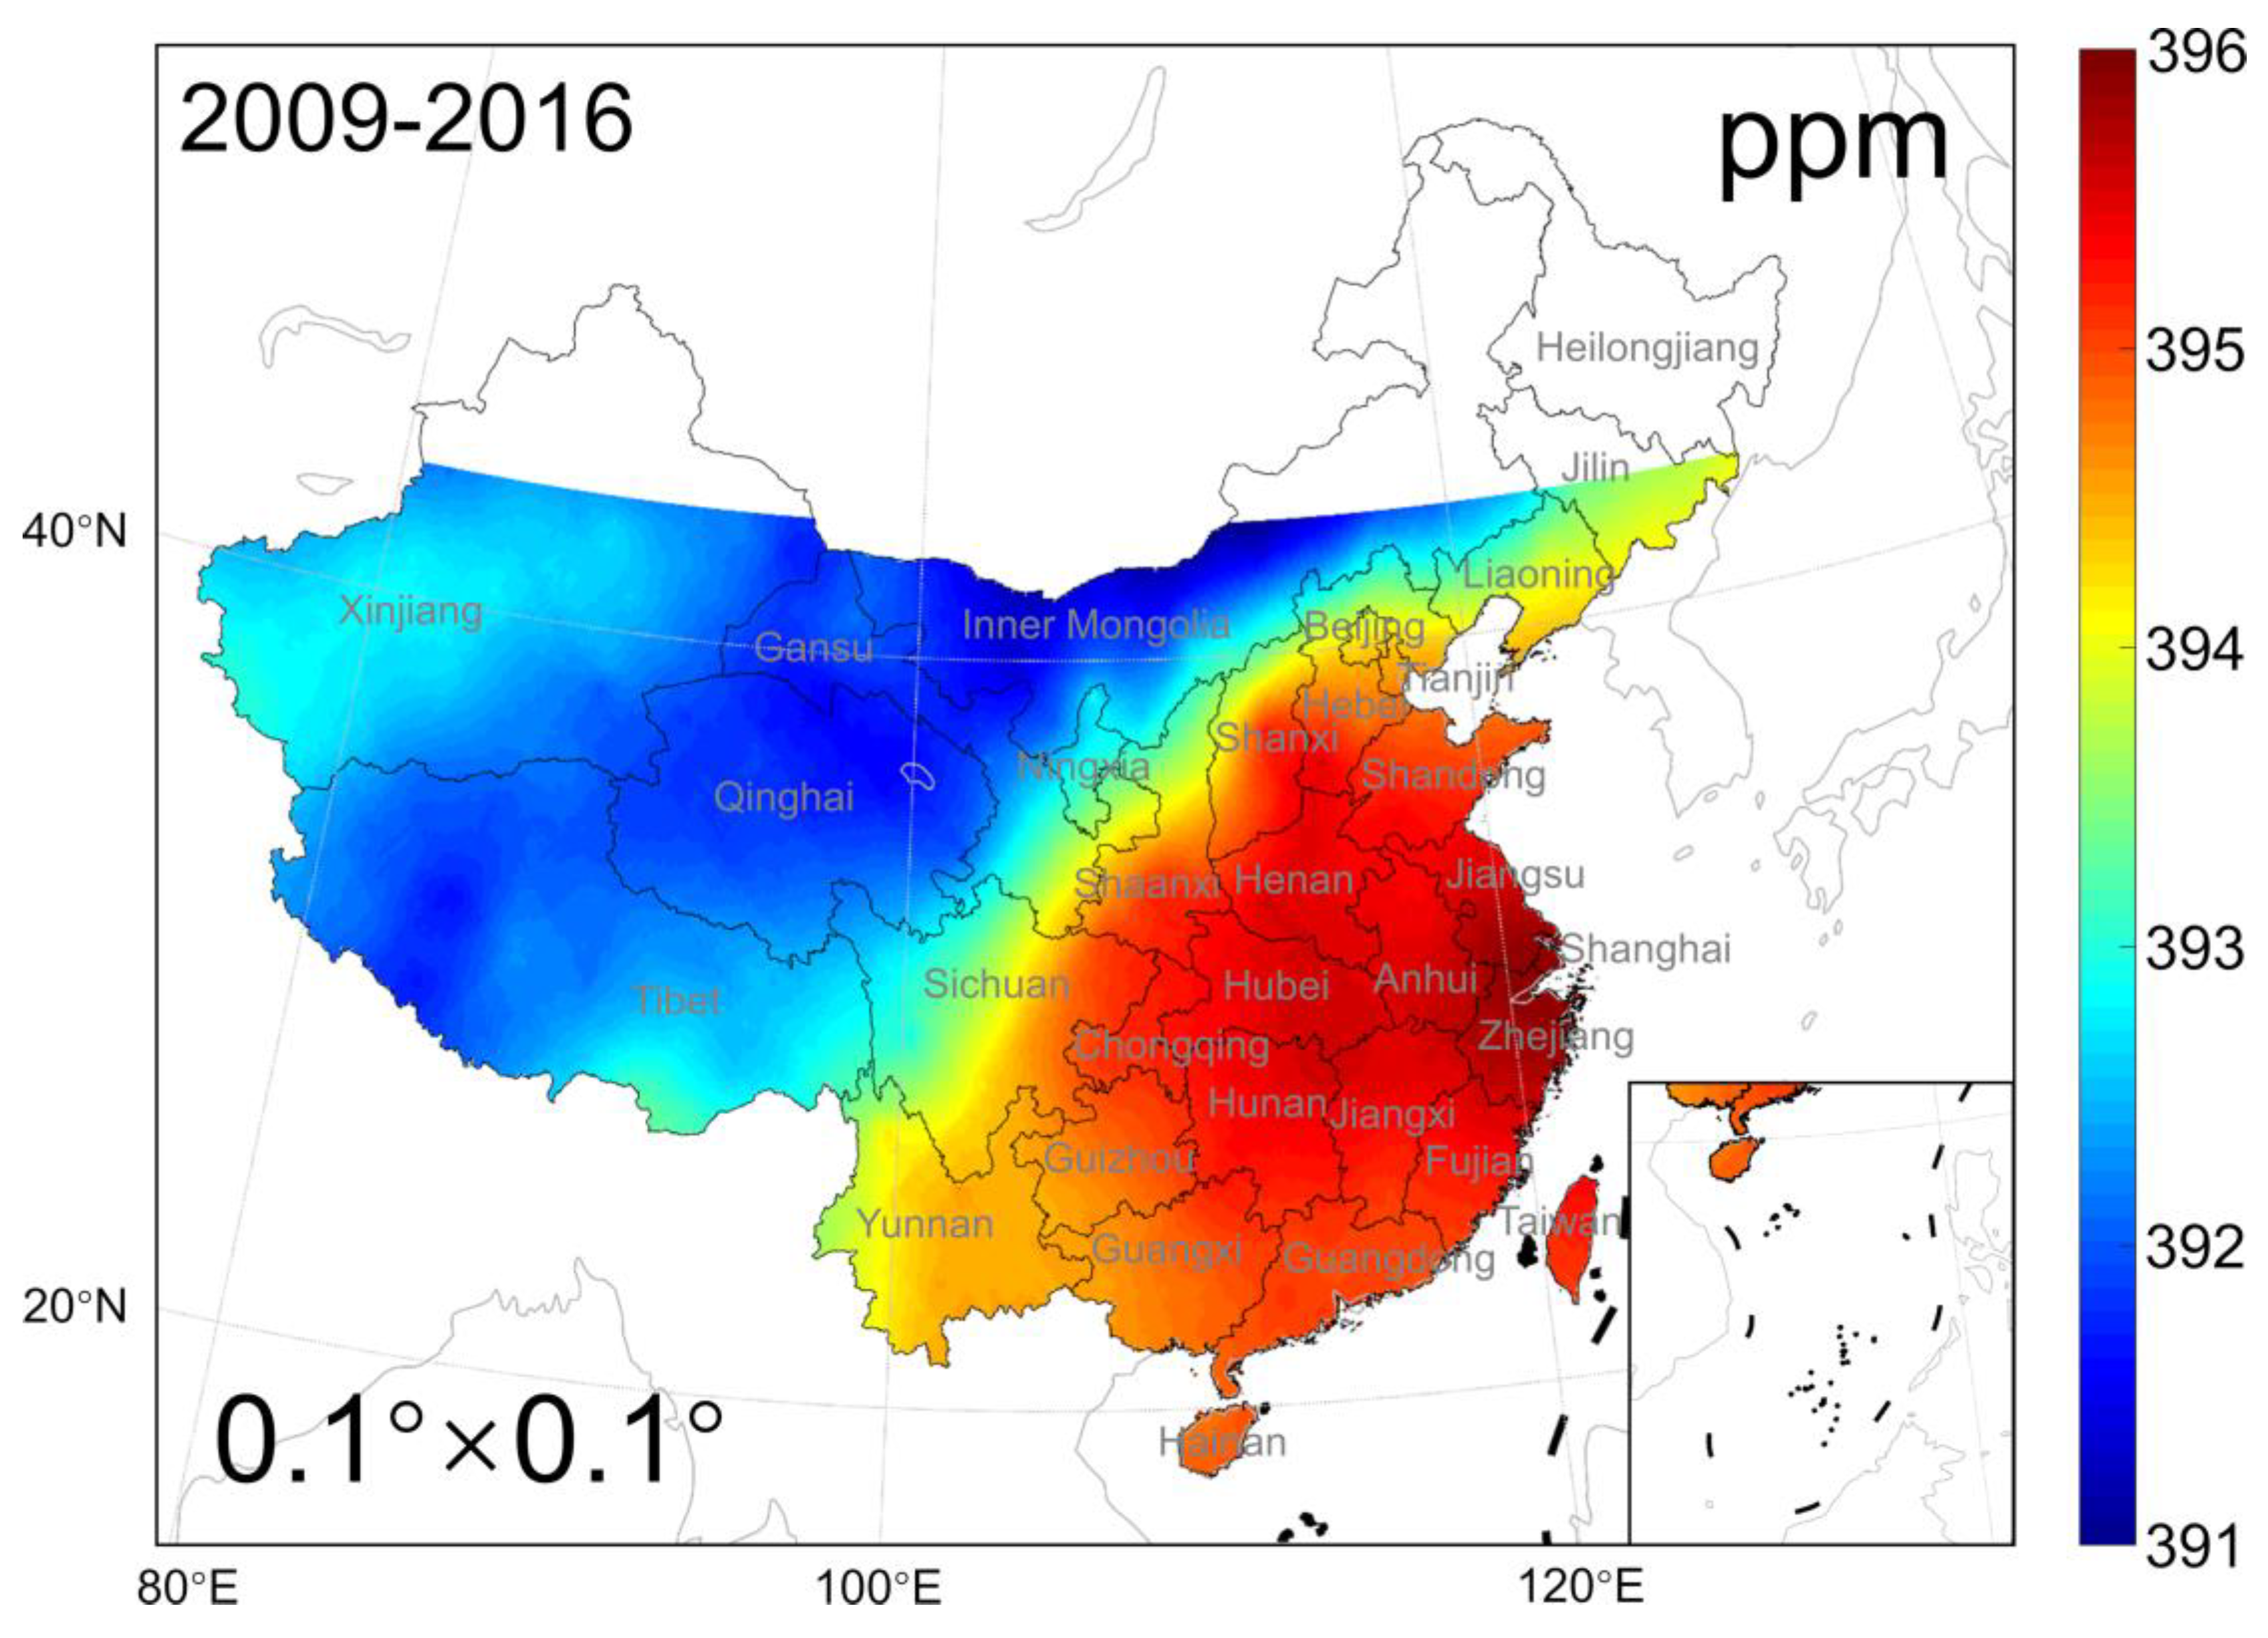

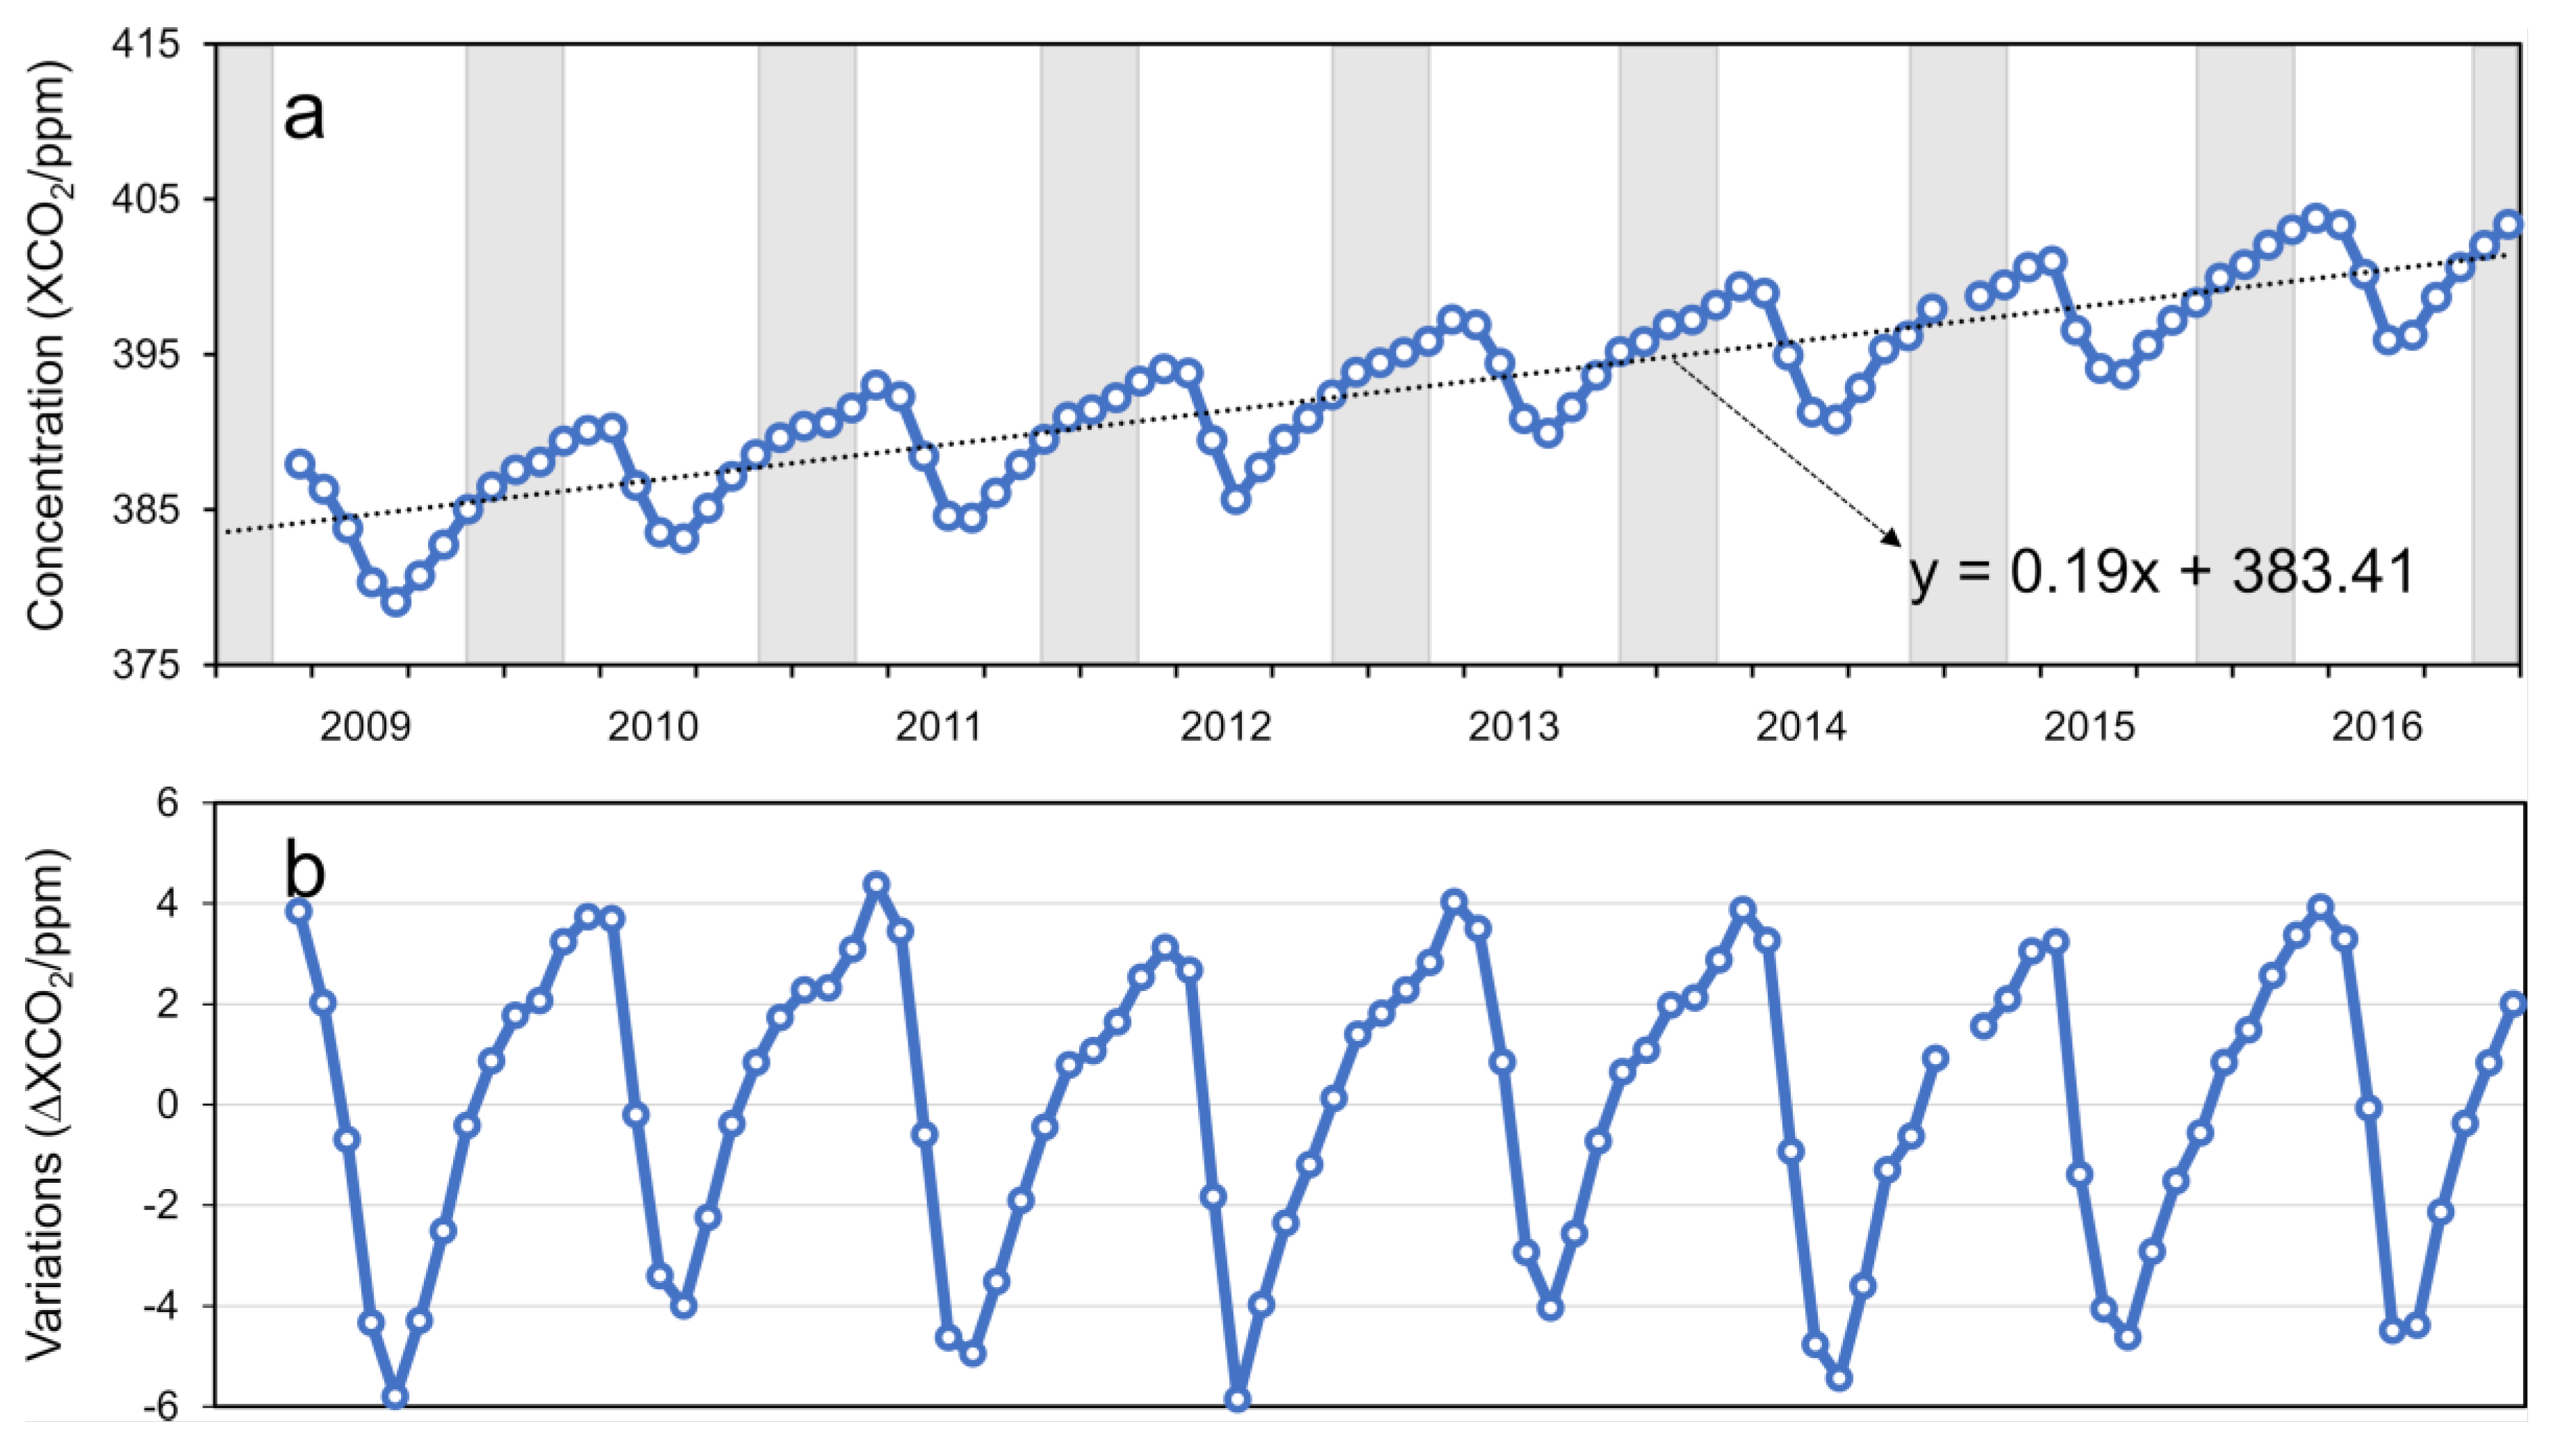
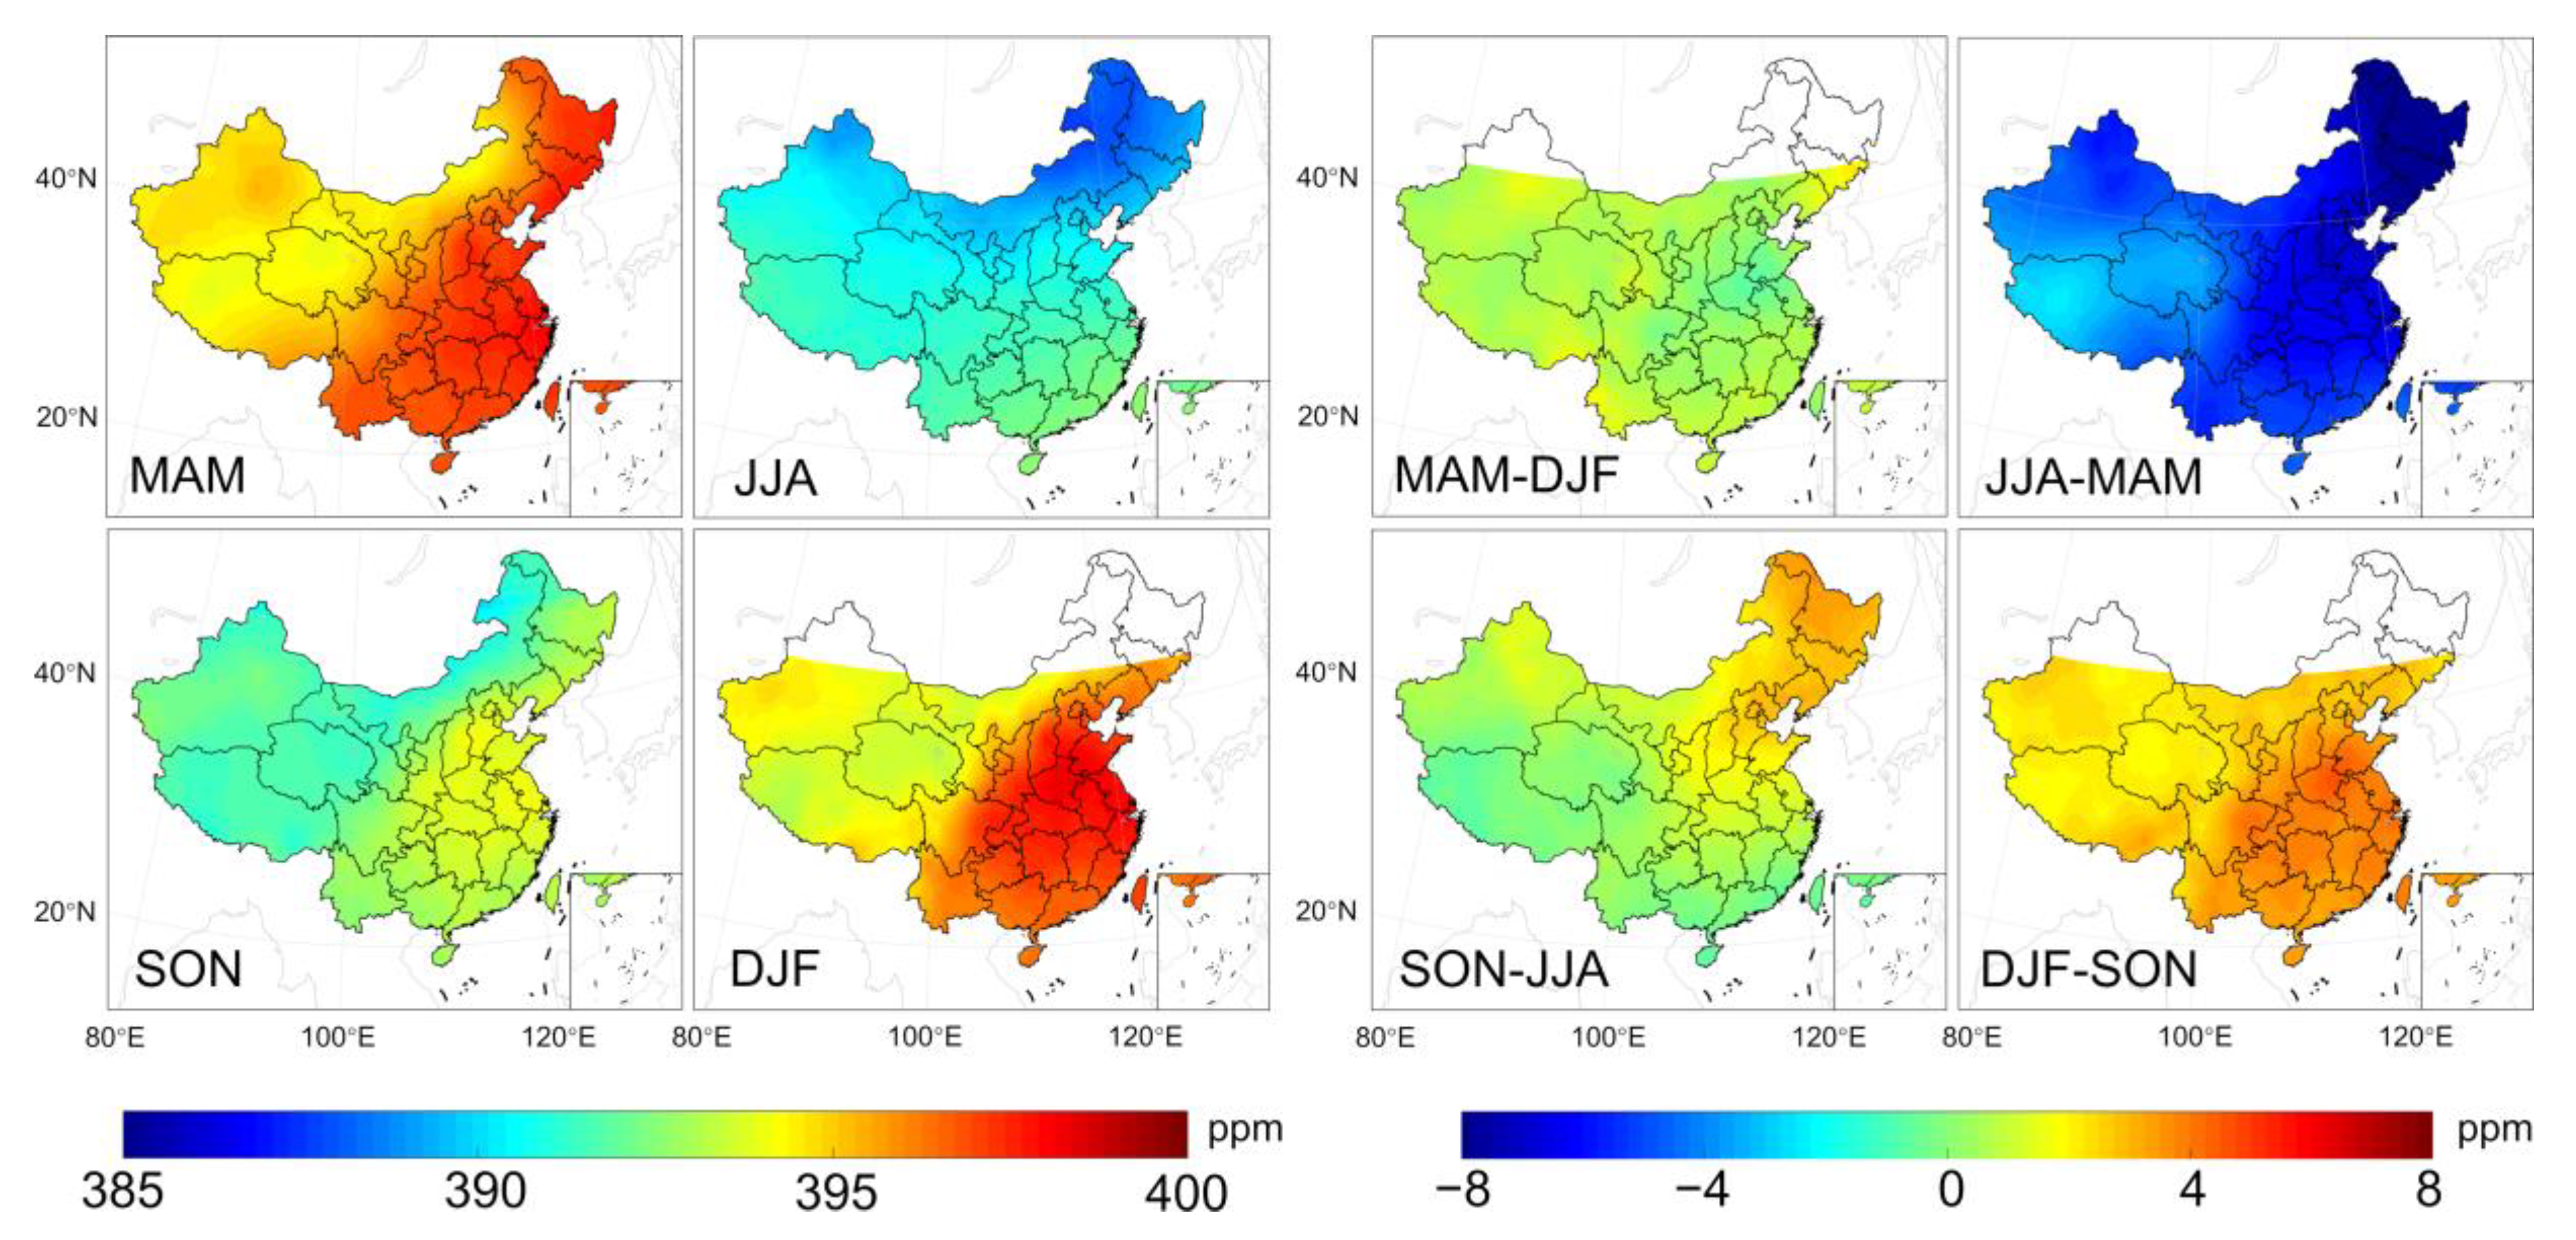
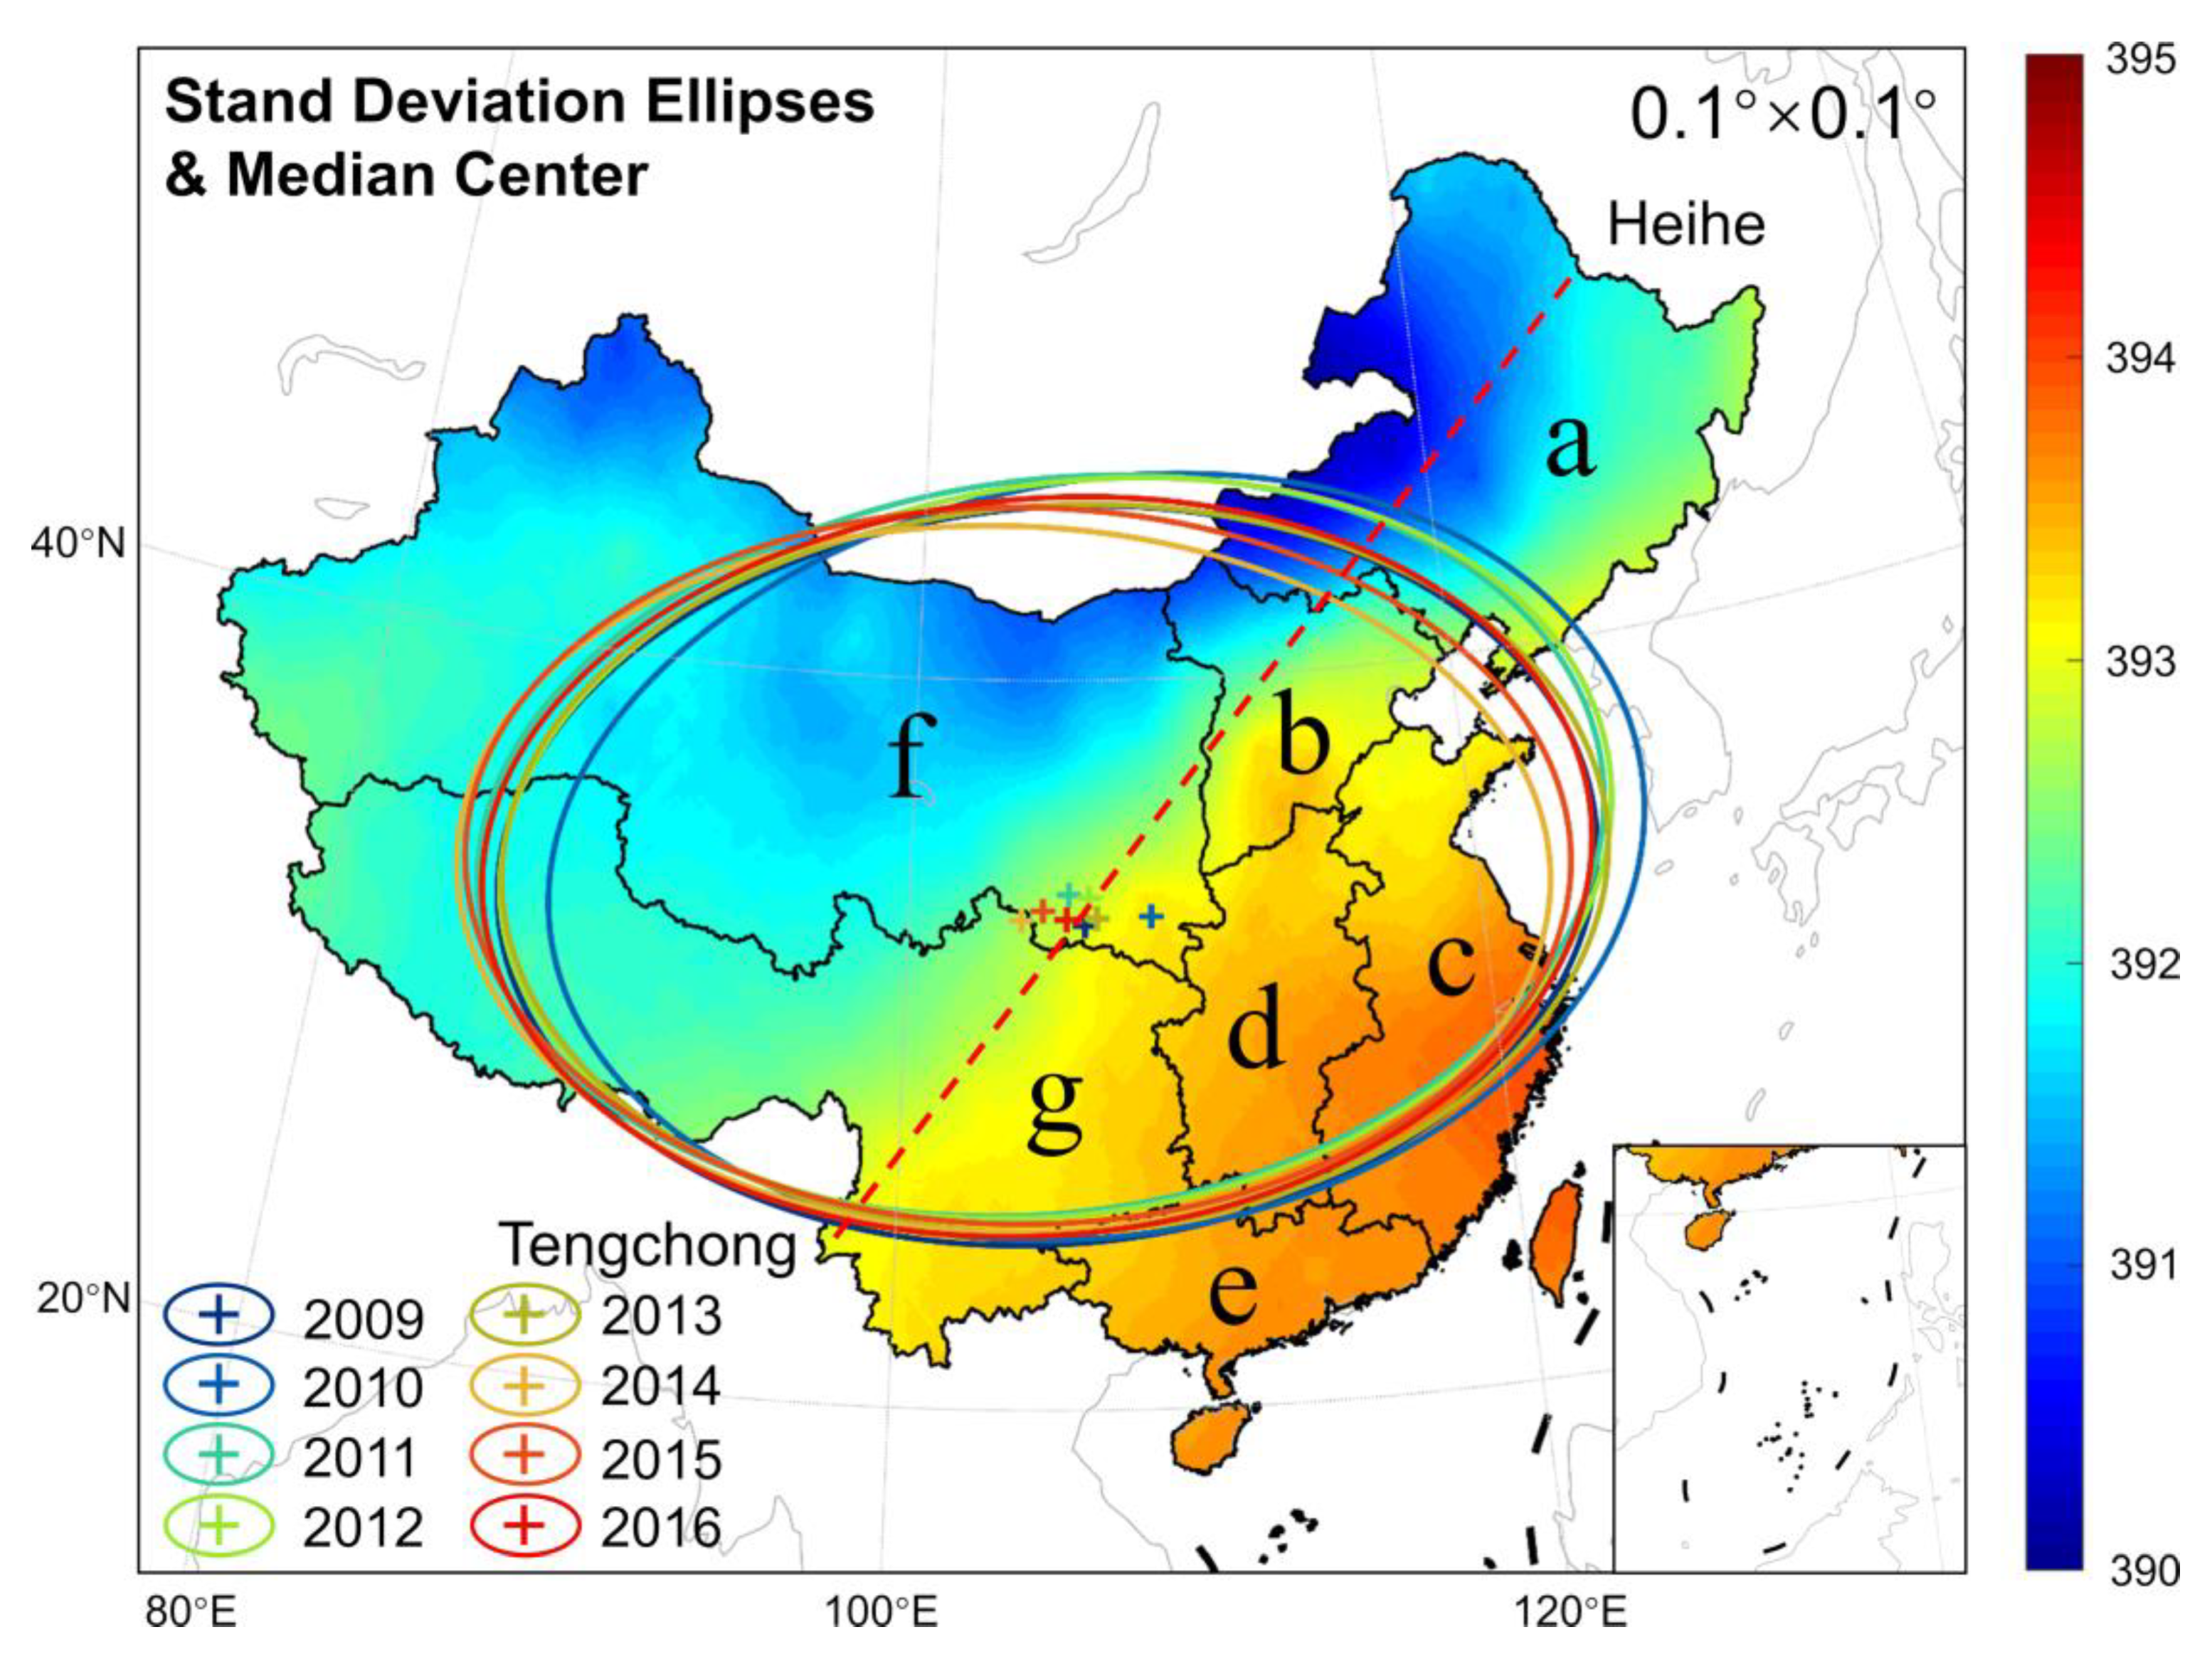


| Stations | Sample Number | Mean(ppm) | Std(ppm) | Correlation Coefficient | RMSE (ppm) | ||
|---|---|---|---|---|---|---|---|
| Measured | GOSAT | Measured | GOSAT | ||||
| Mt. WLG | 92 | 395.9 | 392.4 | 6.4 | 5.5 | 0.94 | 2.2 |
| Mt. Lulin | 90 | 395.3 | 395.1 | 7.8 | 5.7 | 0.95 | 2.5 |
| 2009 | 2010 | 2011 | 2012 | 2013 | 2014 | 2015 | 2016 | Mean | |
|---|---|---|---|---|---|---|---|---|---|
| NEC | 382.65 | 386.95 | 388.38 | 390.59 | 393.32 | 394.52 | 396.32 | 399.82 | 391.57 |
| NC | 383.71 | 387.43 | 388.72 | 391.35 | 394.66 | 395.59 | 397.85 | 400.95 | 392.53 |
| CC | 385.30 | 388.38 | 389.33 | 391.84 | 395.92 | 396.25 | 398.70 | 401.85 | 393.45 |
| EC | 385.36 | 388.26 | 389.48 | 391.91 | 395.90 | 396.48 | 399.03 | 402.04 | 393.56 |
| SC | 385.50 | 388.11 | 389.59 | 391.69 | 395.40 | 396.83 | 398.73 | 402.39 | 393.53 |
| NWC | 382.95 | 386.51 | 388.36 | 390.48 | 393.62 | 395.39 | 397.32 | 400.01 | 391.83 |
| SWC | 383.97 | 386.95 | 388.82 | 391.02 | 394.20 | 396.13 | 398.01 | 401.13 | 392.53 |
| Mean | 383.60 | 387.05 | 388.68 | 390.91 | 394.14 | 395.61 | 397.60 | 400.65 | 392.28 |
| Var. | − | 3.45 | 1.63 | 2.23 | 3.23 | 1.47 | 1.99 | 3.05 | 2.44 |
© 2020 by the authors. Licensee MDPI, Basel, Switzerland. This article is an open access article distributed under the terms and conditions of the Creative Commons Attribution (CC BY) license (http://creativecommons.org/licenses/by/4.0/).
Share and Cite
Lv, Z.; Shi, Y.; Zang, S.; Sun, L. Spatial and Temporal Variations of Atmospheric CO2 Concentration in China and Its Influencing Factors. Atmosphere 2020, 11, 231. https://doi.org/10.3390/atmos11030231
Lv Z, Shi Y, Zang S, Sun L. Spatial and Temporal Variations of Atmospheric CO2 Concentration in China and Its Influencing Factors. Atmosphere. 2020; 11(3):231. https://doi.org/10.3390/atmos11030231
Chicago/Turabian StyleLv, Zhenghan, Yusheng Shi, Shuying Zang, and Li Sun. 2020. "Spatial and Temporal Variations of Atmospheric CO2 Concentration in China and Its Influencing Factors" Atmosphere 11, no. 3: 231. https://doi.org/10.3390/atmos11030231
APA StyleLv, Z., Shi, Y., Zang, S., & Sun, L. (2020). Spatial and Temporal Variations of Atmospheric CO2 Concentration in China and Its Influencing Factors. Atmosphere, 11(3), 231. https://doi.org/10.3390/atmos11030231


