Article

Internal Model Variability of the Regional Coupled System Model GCOAST-AHOI

1
Institute of Coastal Research, Helmholtz-Zentrum Geesthacht, Max-Planck-Straße 1, 21502 Geesthacht, Germany
2
Institute of Oceanography, Center for Earth System Sustainability, Universität Hamburg, Bundesstrasse 53, 20146 Hamburg, Germany
*
Author to whom correspondence should be addressed.
Atmosphere 2020, 11(3), 227; https://doi.org/10.3390/atmos11030227
Submission received: 20 January 2020 / Revised: 14 February 2020 / Accepted: 21 February 2020 / Published: 26 February 2020
(This article belongs to the Special Issue Regional Climate Modeling: Ocean–Atmosphere Coupling)

Abstract

:
Simulations of a Regional Climate Model (RCM) driven by identical lateral boundary conditions but initialized at different times exhibit the phenomenon of so-called internal model variability (or in short, Internal Variability—IV), which is defined as the inter-member spread between members in an ensemble of simulations. Our study investigates the effects of air-sea coupling on IV of the regional atmospheric model COSMO-CLM (CCLM) of the new regional coupled system model GCOAST-AHOI (Geesthacht Coupled cOAstal model SysTem: Atmosphere, Hydrology, Ocean and Sea Ice). We specifically address physical processes parameterized in CCLM, which may cause a large IV during an extreme event, and where this IV is affected by the air-sea coupling. Two six-member ensemble simulations were conducted with GCOAST-AHOI and the stand-alone CCLM (CCLM_ctr) for a period of 1 September–31 December 2013 over Europe. IV is expressed by spreads within the two sets of ensembles. Analyses focus on specific events during this period, especially on the storm Christian occurring from 27 to 29 October 2013 in northern Europe. Results show that simulations of CCLM_ctr vary largely amongst ensemble members during the storm. By analyzing two members of CCLM_ctr with opposite behaviors, we found that the large uncertainty in CCLM_ctr is caused by a combination of two factors (1) uncertainty in parameterization of cloud-radiation interaction in the atmospheric model. and (2) lack of an active two-way air-sea interaction. When CCLM is two-way coupled with the ocean model, the ensemble means of GCOAST-AHOI and CCLM_ctr are relatively similar, but the spread is reduced remarkably in GCOAST-AHOI, not only over the ocean where the coupling is done but also over land due to the land-sea interactions.

Graphical Abstract

1. Introduction

Regional Climate Models (RCMs) are now commonly used to downscale global climate information and to provide climate information on regional to local scales. Simulations of RCMs are, however, associated with various sources of uncertainty. Understanding and potentially reducing these uncertainties is necessary to produce and deliver robust climate information, which, e.g., is of paramount importance for climate change impact studies [1]. In general, a downscaled regional climate projection is affected by different sources of uncertainty that are compounded through the steps used to produce the projection. For each downscaling chain link, the uncertainties can be categorized into three main parts: Forcing, model response and natural internal variability (e.g., [2]).
For global climate models (GCMs), the forcing uncertainty stems from prescribed future boundary conditions related to scenarios of human behavior and associated changes in land use, greenhouse gas, and aerosol emissions as well as from unknown changes in future natural forcings such as volcanic eruptions or changes in solar activity. Model uncertainty is expressed by different responses of climate models to the same external forcing [3]. Many processes in the climate system, such as convection or turbulence, have to be parameterized, as they cannot be resolved in currently operational GCMs. As GCMs use different techniques to discretize physics and dynamics and to parameterize sub-grid effects, they produce differences in the simulation of climate. This can also lead to different responses to changes in external forcing, i.e., different climate sensitivities, which describe the change in the annual global mean surface temperature in response to a change in the atmospheric CO2 concentration or other radiative forcings [4]. Internal variability is the natural variability of the climate system that occurs in the absence of external forcing. It derives from the chaotic nature of the climate system (e.g., [5]) and includes processes intrinsic to each compartment of the climate system as well as the interaction between them [3]. Note that a GCM’s internal variability affects its climate sensitivity and other simulated climate system properties such as effective ocean diffusivity and net anthropogenic aerosol forcing [6]. As the exact initial conditions of a GCM simulation are unknown, small errors in the initial conditions may grow exponentially, providing the uncertainty. The complex non-linear interactions between different components of the climate system, such as atmosphere and ocean, result in low-frequency fluctuations that cause internal variability.
For RCMs, the above listed uncertainties can be viewed as the forcing uncertainty since RCMs are driven by the GCM’s forcing at the lateral boundaries of RCMs [7]. Note that the numerical formulation of the lateral boundary conditions in an RCM is also often an artificial source of uncertainties. Apart from uncertainties introduced by the boundary forcing datasets and their formulation, it has been shown that RCMs are subject to uncertainties stemming from processes intrinsic to each RCM itself [8,9,10,11,12]. This model uncertainty in an RCM is caused analogously to that of a GCM, and it is sensitive to the RCM’s horizontal resolution since dynamics, and physical parameterizations are often resolution dependent. Internal variability, the natural variability of the climate system mentioned above, is hereafter regarded as internal climate variability, not to be confused with the term Internal Variability (IV), which is usually denoted as the internal model variability or the ensemble spread in simulations of an RCM. A larger IV or larger spread of an ensemble implies a larger uncertainty in the solution of the simulations.
It is well documented that the details of RCM simulations do differ when initialized with even slightly different initial conditions (see [11] and references therein). The IV of an RCM can be defined as the degree of irreproducibility in an RCM solution when it is forced by the same lateral boundary conditions but initialized from different initial states [13]. Our present study also estimates IV in this manner. In this case, an estimated IV of an RCM does not originate from forcing uncertainty but from a combination of internal climate variability and model uncertainty. Unlike the uncertainty induced by the internal climate variability, which is a natural characteristic of the climate system, the model uncertainty is an artificial source and can be reduced by improving the dynamics and physical parameterizations of the RCM.
Although it was found that forcing uncertainty is typically larger than model uncertainty in RCMs, [14], for hydrological variables such as precipitation, evaporation, and runoff, the IV in an RCM may become as large as IV in a GCM [15]. IV of RCMs depends on the climate of a specific region (e.g., dominated by local convection versus large-scale forcings), on domain location and size, model resolution, the season, and utilized physical parameterizations (e.g., [11,12,14,16,17,18,19,20,21]). In climate change projections, IV is usually estimated from a couple of realizations from one model using the same forcing but perturbed initial conditions [7].
All RCM studies mentioned above have used the common setup of atmosphere-only RCM that is forced by prescribed sea surface temperature (SST) over ocean surfaces. In the present study, we aim at reducing the model uncertainty imposed by IV of RCM results by using a coupled regional system model instead of an atmosphere-only RCM. Previous studies on the impact of using a coupled atmosphere-ocean RCM on IV have been contradictory. Several studies noted larger variabilities in coupled regional simulations than in uncoupled RCM simulations, for example, in heat fluxes over the Baltic Sea [22], seasonal heat fluxes over the Mediterranean [23] and SST over the North Sea [24,25]. The larger variability is consistent with the higher degree of freedom inherent in coupled models [26]. On the contrary, Schrum et al. [27] found a stabilizing effect of the coupling over the Baltic and North Seas that is expected to reduce the IV. Recently, improved simulations of extreme weather phenomena, such as heavy precipitation events and convective snow bands, were found in coupled hindcast simulations [28,29,30,31]. On the one hand, with regard to the general atmosphere circulation, a better capturing of extreme events may also be associated with a reduced IV with regard to simulating the respective events. On the other hand, considering precipitation and local-scale phenomena such as convection, this may also be associated with a higher IV where only a few ensemble members may actually capture a specific event.
In order to investigate the impact of the coupling on the RCM’s IV, we use the coupled model setup AHOI (Atmosphere-Hydrology-Ocean-Sea Ice), which has been developed as a part of the coastal model framework GCOAST (Geesthacht Coupled cOAstal model SysTem) [32,33]. GCOAST-AHOI (in short AHOI) comprises a regional atmospheric model, a hydrological discharge model, and a regional ocean model with a sea ice model included. In this study, we investigate how model uncertainty is affecting the IV of CCLM over the European domain. Here, we focus on IV during a specific extreme event and how this IV is affected by the air-sea coupling. As only one source of global forcing is used for CCLM, the forcing uncertainty is not a scope of the present study. Section 2 describes the GCOAST model compartments, the experimental design, and the observational data used to evaluate the model results. In Section 3, results are presented for the whole integration period as well as focusing on the storm Christian that occurred from 27 to 29 October 2013. Finally, we end up with a discussion of the results and conclusions.

2. Models, Experimental Design, and Data

2.1. Models

In this study, a subset AHOI of the GCOAST system is introduced for the first time and shown in Figure 1. It comprises the Atmospheric model CCLM, the Hydrological discharge model HD, and the ocean-sea ice model NEMO-LIM3, which are coupled via the coupler OASIS3-MCT [34].

2.1.1. Atmospheric Model CCLM

The non-hydrostatic limited-area atmospheric model COSMO-CLM vs. 5.0 [35], hereafter denoted by CCLM, is used as an atmospheric model in GCOAST-AHOI. The convective parameterization scheme of Tiedtke [36], which is a mass-flux scheme with a moisture-convergence closure, is used as the default in CCLM. The Tiedtke scheme distinguishes between shallow and deep convection based on the strength of the moisture convergence. The multi-layer soil and vegetation model TERRA [37] of CCLM includes 10 levels at depths of 0.005, 0.025, 0.07, 0.16, 0.34, 0.7, 1.42, 2.86, 5.74, and 11.5 m. CCLM employs the δ two-stream radiation scheme [38] for short and longwave fluxes (in eight spectral intervals) with full cloud-radiation feedback. Schultze and Rockel [39] recommended to not use the CCLM default aerosol climatological data of Tanre [40] but other datasets, such as from Tegen [41] or MAC [42], to reduce the negative shortwave radiation bias. We also found a similar effect of aerosols on shortwave radiation in both the uncoupled CCLM and the coupled system, so that we used the aerosol data from Tegen [41]. CCLM includes a three-dimensional Turbulent Kinetic Energy (3-D TKE) scheme, which is described by Doms et al. [43]. The main points of the TKE scheme for the present study are summarized in part 1 in the Supplementary Materials. In CCLM, there is an option to use spectral nudging (SN, [44,45]) to ensure that the large-scale weather situation of the model solution remains close to the large-scale components of the driving fields over the entire domain whereas smaller scales are left to be determined by the regional model [44]. A number of studies showed that using SN for RCMs reduced the model’s IV (see [46] and references therein).
Note that CCLM has been successfully applied in several regional coupled systems. For instance, CCLM was coupled with several ocean models such as NEMO_Nordic, ROMS, and TRIMNP (see [47] and related references therein, [29,30,48] or with the wave model WAM [32,49,50,51].

2.1.2. Hydrological Discharge Model HD

The HD model [52] with a resolution of 0.5° has already been used for many years in both the global Earth System Models (ESMs) such as MPI-ESM [53], ECHAM5/MPIOM [54,55] and in the regional ESMs, e.g., ROM [56], RegCM-ES [57], and REMO-MPIOM [58].
Recently, a high-resolution version of the hydrological discharge model HD vs. 4.0 has been developed to simulate the lateral freshwater fluxes at the land surface [59]. In the current study, this HD model version is applied over Europe at a spatial resolution of 5 min (ca. 8 and 9 km) and model time step of 1 h. The HD model requires daily time series of surface runoff and drainage (or sub-surface runoff) from the soil as input fields. The HD model separates the lateral water flow into the three flow processes of overland flow, baseflow, and river flow. While overland flow and baseflow are both computed using a single linear reservoir, river flow requires a cascade of five equal linear reservoirs. Overland flow corresponds to the fast flow component within a grid box and uses surface runoff as input. Baseflow represents the slow flow component within a grid box, and it is fed by drainage from the soil. The inflow from vicinity grid boxes contributes to the river flow. The sum of the three flow processes is equal to the total outflow from a grid box. The model parameters are functions of the topography gradient between grid boxes, the slope within a grid box, the grid box length, the lake area, and the wetland fraction of a particular grid box. The model input fields of surface runoff and drainage resulting from the forcing climate or land model resolutions are interpolated to the HD grid before being fed into the HD model.
HD has been newly coupled to CCLM and NEMO (see Section 2.1.3) via the coupler OASIS3-MCT vs. 3. In order to investigate the water balance amongst components atmosphere, ocean, and rivers before running the fully coupled AHOI system, runoff and drainage of the stand-alone CCLM were also provided to a stand-alone HD, to generate simulated discharge.
Water conservation is important while passing the lateral water fluxes from an atmospheric model via river runoff to an ocean model. No water should be lost during this process. As the resolutions and land-sea masks differ between the river runoff and the ocean model, coastal ocean boxes and, hence, river mouth points may not agree between the different models. Consequently, we linked each river mouth on the HD grid with the nearest river mouth box of the ocean model.

2.1.3. The Ocean-Sea Ice Model NEMO-LIM3

The GCOAST ocean model is based on the Nucleus for European Modelling of the Ocean NEMO, and LIM3 sea-ice dynamics and thermodynamics package [60]. NEMO solves the 3D primitive equations using hydrostatic and Boussinesq approximation. The sea surface discretization in the model considers a non-linear free surface with a variable volume. The momentum advection is both energy and enstrophy conserving, and a bi-Laplacian horizontal diffusion operator with a coefficient of −2.8 × 10⁻⁸ m4/s is applied. The lateral boundary condition for momentum along coastlines is free-slip. The lateral diffusion for the tracers is applied along with geopotential levels. Vertical turbulent viscosities/diffusivities are calculated using the Generic Length Scale (GLS) turbulence model [61] with the ‘k-eps’ (k-epsilon) closure scheme and the second-moment algebraic model of Canuto [62].
In the NEMO stand-alone set-up hourly atmospheric forcing fields (wind velocities at 10-m height, air temperature and dew point temperature at 2-m height, mean sea level pressure, downward solar and thermal radiations) derived from the stand-alone CCLM are used. The surface turbulence and momentum fluxes are estimated using the bulk formulation of Large and Yeager [63] (for more details, see part 2 in Supplementary Materials). Surface freshwater input is taken from CCLM hourly snowfall, and total precipitation, and river runoff is obtained from climatological data. In AHOI river runoff is passed from HD.
In AHOI the surface turbulent (latent and sensible) fluxes and momentum fluxes in NEMO are computed as an arithmetic average of two components: (1) The fluxes passed from CCLM (see part 1 in the Supplementary Materials and [43]) and (2) the fluxes estimated using the NEMO bulk formulation [63] with the atmospheric forcing fields are passed from CCLM. In fact, the default set up for coupling in NEMO is that the fluxes are passed from the atmospheric model. However, with these default set up SST biases in NEMO are relatively large both in uncoupled and coupled experiments. The new coupling method of combining the two components of surface turbulence and momentum fluxes, which come from two models (i.e., CCLM and NEMO) using different turbulence parameterization schemes, could reduce the SST bias. Note that a detailed investigation of this new coupling method is beyond the scope of this study.
Assessment of the NEMO v3.6 model against in-situ and satellite observations for the North Sea [50] and the Baltic Sea [64] demonstrated good model performance for sea level, ocean circulation as well as thermohaline characteristics. An inter-comparison of the NEMO performance with some other ocean models for the North Sea and Baltic Sea can be found in [65], which showed a relatively good skill of NEMO in reproducing SST. For that study, NEMO_Nordic vs.3.3.1, a version of NEMO designed for the North Sea and Baltic Sea, was coupled to RCAO4 [66,67] and CCLM [29,30,68]. In the present study, we are using the newer version of NEMO (vs.3.6) with a larger domain setup compared to NEMO_Nordic vs.3.3.1, following a recommendation by Ho-Hagemann et al. [29,30]. Using a larger domain for the ocean model, on the one hand, gives the ocean more degrees of freedom [69] by putting the boundary conditions in the deep ocean in the North Atlantic and not in the North Sea. On the other hand, more effects of air-sea coupling over the North Atlantic on the simulated climate over Europe can be taken into account. Sein et al. [70] pointed out that the choice of the coupled model domain based on simple geographical arguments is not sufficient, and decisions should be based on the fundamental understanding of oceanographic and atmospheric processes and their feedbacks.

2.2. Experimental Design

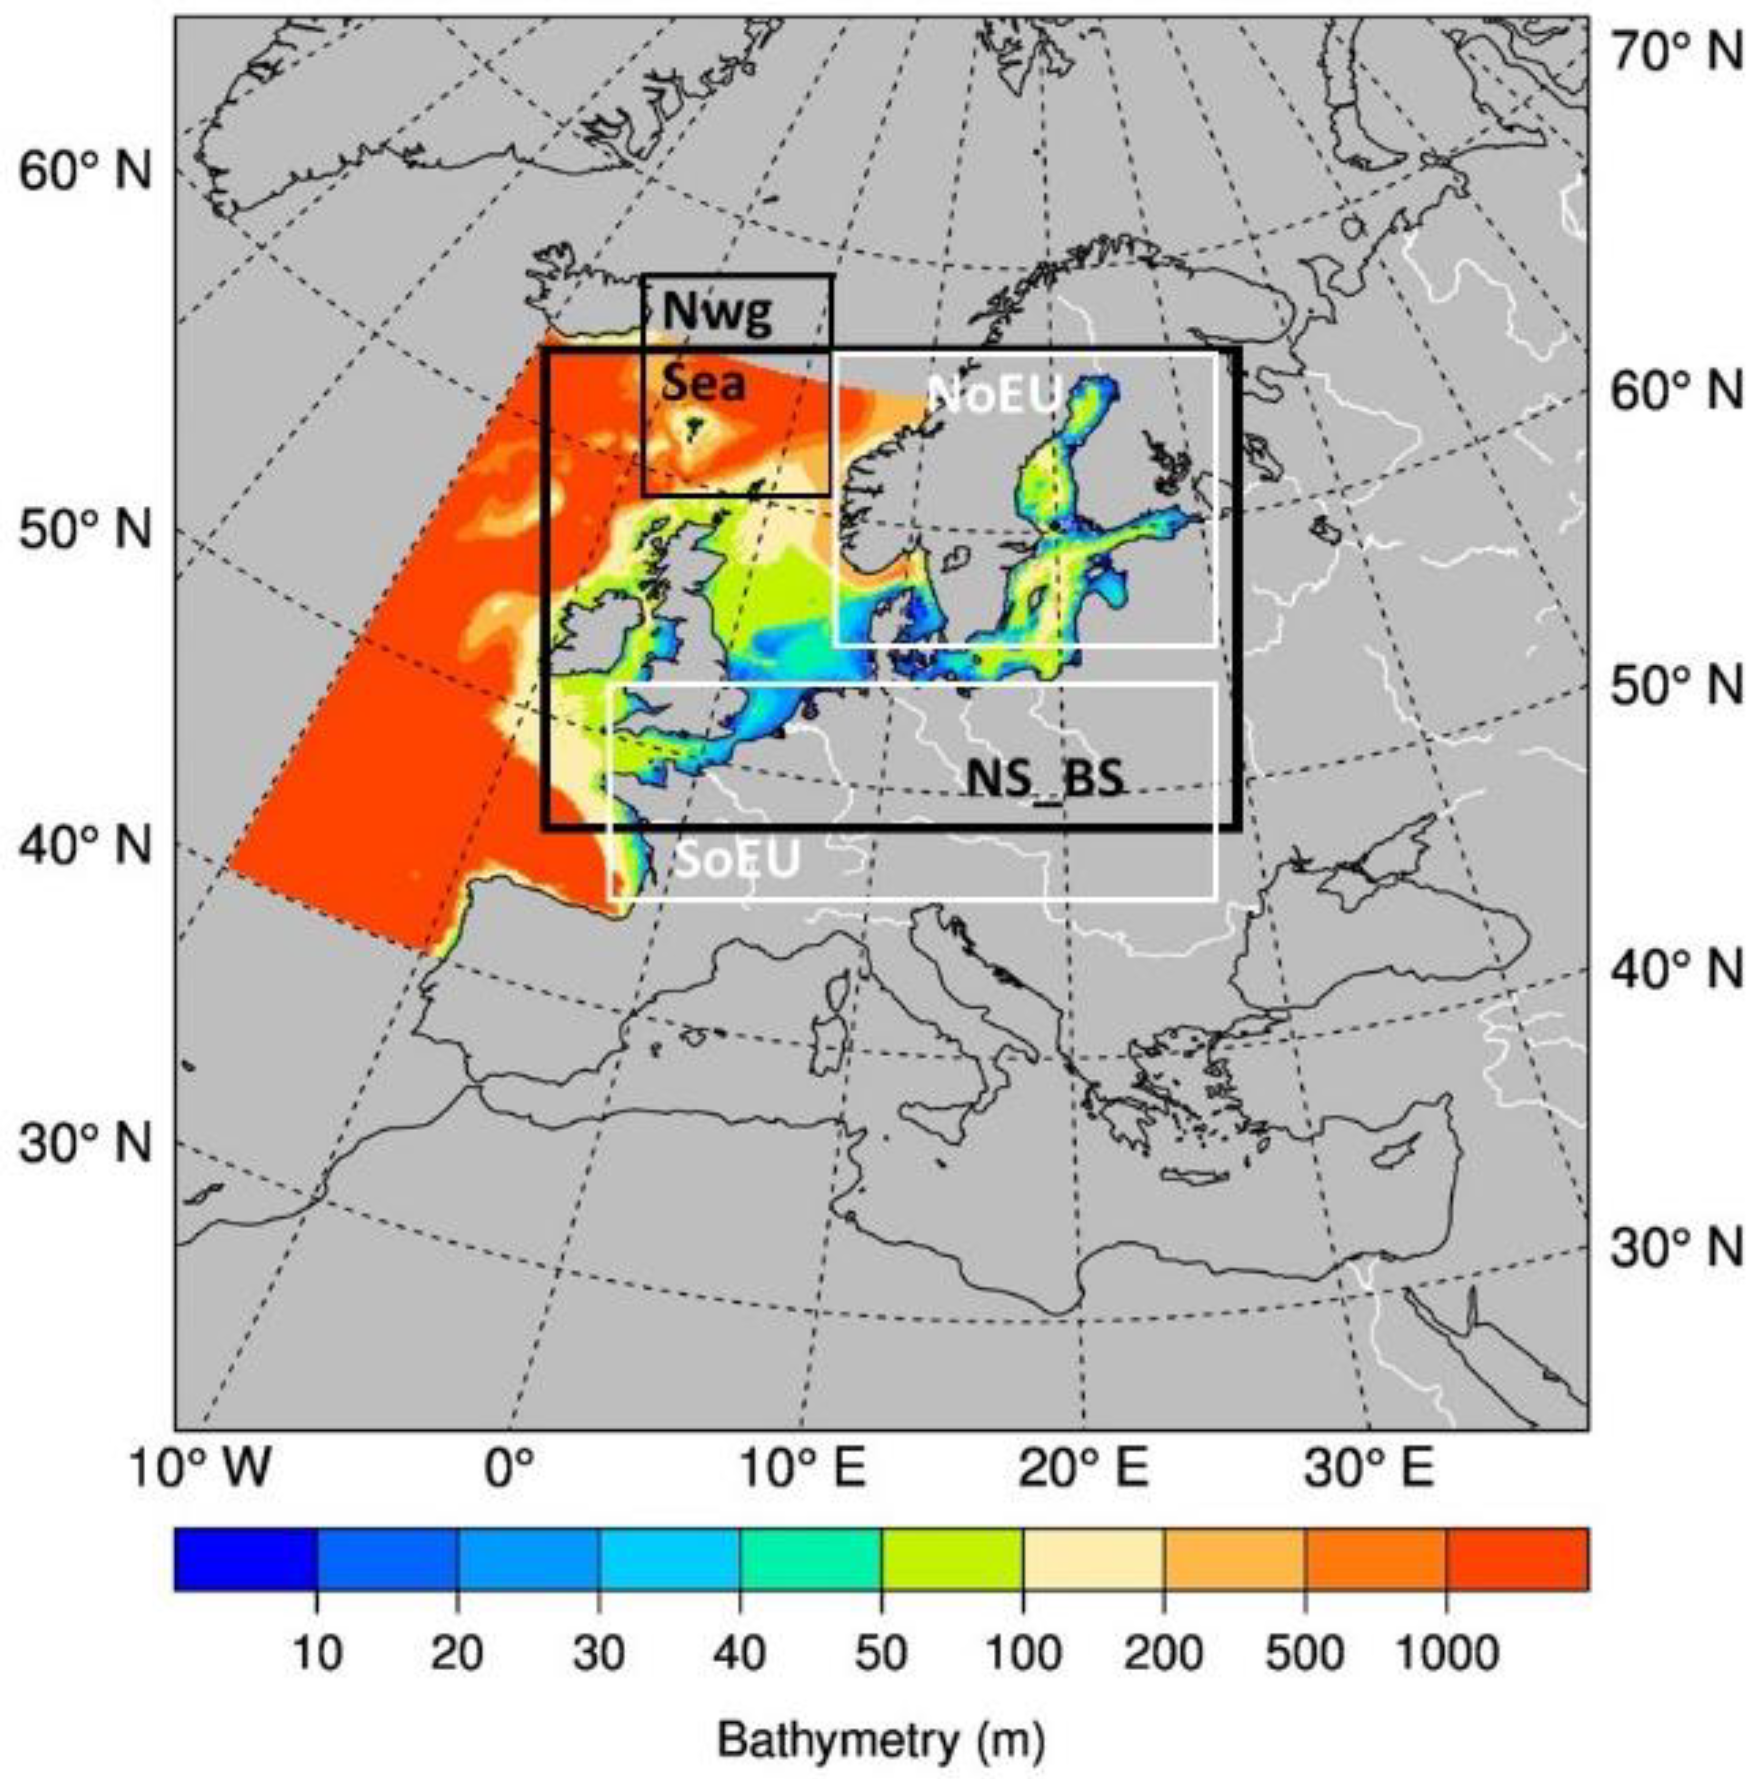
In this study, CCLM is set up to simulate the regional climate for the EURO-CORDEX domain at 0.11° horizontal resolution (Figure 2) and 40 vertical levels in the atmosphere. The EURO-CORDEX domain of CCLM is relatively large, therefore, the constraint imposed by the lateral boundary conditions is smaller so that CCLM has a chance to produce its own local weather. Lucas-Picher et al. [20] and Braun et al. [15] have shown that when the domain of an RCM is not small, the IV of an RCM may get larger (see also Section 1) and can play an important role in the uncertainty of the downscaled climate information. Separovic et al. [71] and Alexandru et al. [72] indicated that reduction of domain size or the application of SN can both considerably reduce IV in RCMs.
CCLM is driven by the one-hourly ERA5 reanalysis data at the lateral boundaries [73]. ERA5 currently covers the period of 1979 to the present and will extend back to 1950 in 2020, with a horizontal resolution of 31 km globally, 139 vertical levels up to 0.01 hPa and hourly output frequency. The running time step of CCLM is 75 s. HD is set up for the European domain using a grid with the spatial resolution of 1/12° (8–9 km) and a time step of 3600 s.
NEMO covers the region of the north-west European shelf, the North Sea, the Danish Straits and the Baltic Sea between −19.89° E to 30.16° E and 40.07° N to 65.93° N with a resolution of two nautical miles (ca 3.6 km). The vertical grid is the NEMO sigma-zlevel s-z*-hybrid grid with 50 levels and a tangential stretching below 200 m depth. The running time step of NEMO is 120 s. The lateral boundary forcing for tracers (temperature and salinity) is derived from hourly CMEMS FOAM-AMM7 model output [74]. The boundary forcing for water level and currents is split into three components: A tidal harmonic signal, a barotropic signal, and a baroclinic anomaly profile. The tidal harmonics forcing is reconstructed for each model time-step from the tidal constituents for M2, S2, N2, K2, K1, O1, Q1, P1, and M4 derived from the TPXOv8 model (Oregon State University Tidal Inversion, OTIS). The barotropic forcing includes tidal averaged sea surface elevation, and depth mean current and the baroclinic forcing—the anomaly of the current profile with respect to the combined tidal and barotropic signal. The Flather Radiation Scheme (FRS) [75] is used for the tidal harmonic and barotropic forcing, and the baroclinic forcing uses the FRS scheme. A tidal potential forcing with the same tidal constituents is applied over the whole model domain.
The coupling time step amongst CCLM, NEMO, and HD via OASIS is 3600 s. Variables exchanged amongst the compartment models are shown in Figure 1 and Table S1.
Several experiments were conducted for the time period of 1 September–31 December 2013. The time period was chosen as a test case due to an occurrence of two heavy storms Christian (27–29 October) and Xaver (4–6 December). It was demonstrated previously that the NEMO model performs well during these two storms [51].
Sieck [7] applied the RCM REMO over Europe and showed that its IV for mean sea level pressure is highest in spring, smallest in autumn and that IV of all points within the model domain is similar to land points only. For the 2-m temperature (T_2M), the largest IV appears in winter and then gradually reduces until autumn. The IV is higher if only land points are considered than if all points are taken into account. The first reason is over water the SST is strongly bound to the boundary forcing. The second reason is the soil scheme, which calculates soil and surface temperatures dynamically.
Laprise et al. [11] pointed out that the IV in an RCM is connected to the prevailing weather regime. Giorgi and Bi [12] also concluded that the IV in an RCM is more pronounced during extreme events. Therefore, although the considered time period (autumn) is the time when the IV of CCLM might be small as in the study of Sieck [7], the occurrence of the two storm events makes it worthy to investigate.
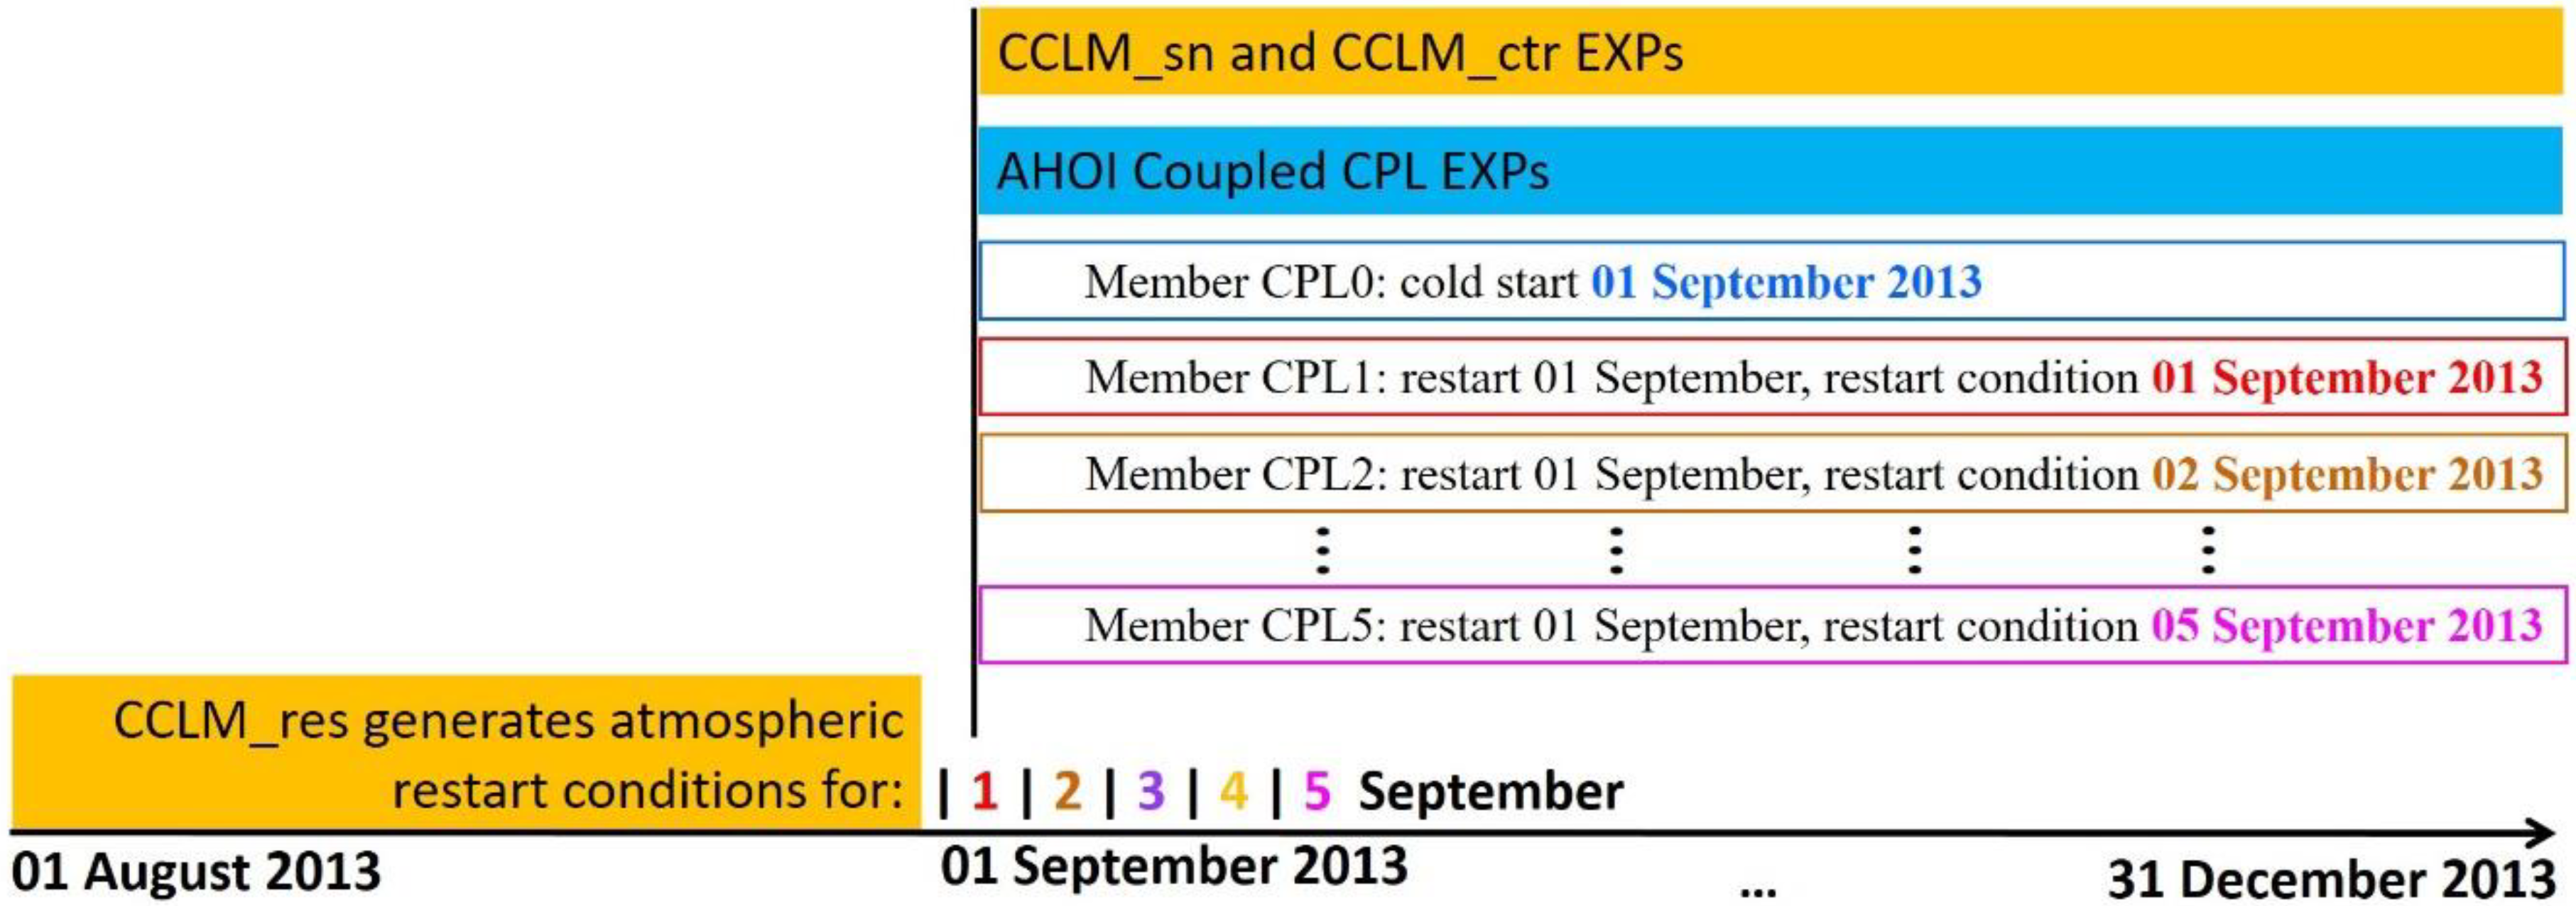
Table 1 and Figure 3 describe how the experiments in this study were designed. To generate an initial condition ensemble for the quantification of IV, we followed the approach used in [7] (c.f. figure 2.4 therein) with a modification. Sieck [7] generated 10 members of an ensemble by running the atmospheric model REMO with the initialization started on the 1 December 1978, 2 December 1978, …, 10 December 1978 and all end at 1 January 1979 to yield 10 restart conditions for 10 members of the ensemble to run until 1.1.1989. We started the spin-up run (CCLM_res or RES in Table 1) at 1 August 2013 and stopped at 1 September 2013, 2 September 2013, …, and 5 September 2013 to obtain the restart conditions for five ensemble members (CCLM1-5 for the stand-alone CCLM (hereafter denoted by CCLM_ctr) and CPL1-5 for AHOI) which all restart at 1 September 2013 but with these different restart conditions. The members CCLM0 and CPL0 use a cold start at 1 September 2013. The ensembles ens.CCLM and ens.CPL are ensemble means of six CCLM and CPL experiments, respectively. Note that only for the variables analyzed in sub-Section 3.3, the ens.CCLM and ens.CPL refer to the means of five members (CCLM1-5 and CPL1-5), because due to their cold starts on 1 September 2013, the initial soil states of CCLM0 and CPL0 differ from those of CCLM1-5 and CPL1-5, which noticeably influences the simulation of the considered variables. This method to generate the ensemble has both advantages and disadvantages compared to the original method [7]. The advantage is that we do not need to run a long-term simulation for the atmospheric model to generate ensemble members but still have restart conditions that are rather different. The analysis in Section 3 will show that for our domain, a few days after the restart (i.e., 1 September 2013), the spin-up process is usually over, and the discrepancy of members shows the IV. The disadvantage of our method is the difference in the soil state of experiment 0 to the other experiments 1–5. In the next study, new experiments will be conducted with a longer spin up for the atmospheric model and also for the ocean and sea-ice models.
In all AHOI coupled experiments, NEMO and HD start on 1 September 2013. In all experiments, CCLM is used without SN, except in CCLM_sn that is conducted as a reference experiment with the stand-alone CCLM using the SN technique. SN is applied every fourth-time step with a nudging factor of 0.5 for the horizontal wind components (U, V), beginning at a height level of 850 hPa with quadratically increasing strength toward higher layers. Below 850 hPa no SN is applied so that small weather phenomena, which often occur close to the surface, are not affected. In the present study, SN is used for CCLM_sn to yield a reference experiment because it can reproduce a more stable simulation (i.e., having a low IV) of the large-scale circulations which are imposed by the “perfect” boundary conditions from ERA5. However, in order to investigate the IV of an RCM, for the rest of the experiments, SN is not used. Unavailable “perfect” boundary forcing will be the case when the RCM forcing comes from a GCM simulation, in particular, true in future climate projections. This is likely the reason why SN has not been used for future scenarios. In this study, CCLM_sn also has a cold start on 1.9.2013, similar to CCLM0 and CPL0.
The IV generated by the CCLM or AHOI ensemble is estimated by using the same statistics introduced in the studies of Alexandru et al. [21] and Lucas-Picher et al. [20]. Basically, IV is defined as the inter-member spread which is similar to the standard deviation (SD) of the ensemble (Equation (1)):
SD = 1 N 1 i = 1 N ( x i x ¯ ) 2
where { x 1 , x 2 , , x N } are the values of each member for a given variable, x ¯ is the mean value of these members, and N is the number of the members (N = 6 in the present case).
In the analysis, the Pearson Correlation Coefficient (rCor) is used to evaluate the cross-correlation for each pair of simulated variables. rCor is calculated as following in Equation (2):
r Cor = n ( xy ) ( x ) ( y ) [ n x 2 ( x ) 2 ] [ n y 2 ( y ) 2 ]
where x and y are two time-series of two considered variables.

2.3. Observational and Reanalysis Data Sets

Initial and boundary forcing ERA5 reanalysis data are also used to assess simulated mean sea level pressure (MSLP), wind, temperature, and specific humidity of CCLM. ERA5 is the latest climate reanalysis produced by the European Centre for Medium-Range Weather Forecasts (ECMWF), providing hourly data on many atmospheric, land-surface, and sea-state parameters together with estimates of uncertainty. ERA5 data are available in the Copernicus Climate Data Store on a reduced Gaussian grid with 0.25° horizontal resolution, with atmospheric parameters on 37 pressure levels. For comparison with the model simulations, ERA5 data are interpolated onto the CCLM grid.
For wind speed evaluation, in addition, in-situ data from the two platforms, FINO1 and FINO3, provided by the FONA3 (Forschung für Nachhaltige Entwicklung, Research for Sustainable Development) funding program of BMWi (Bundesministerium fuer Wirtschaft und Energie, Federal Ministry for Economic Affairs and Energy) and the PTJ (Projekttraeger Juelich, project executing organization), in-situ data from GTS (the Global Telecommuncation System) of the WMO, and the in-situ MyOcean data provided by the Copernicus Marine Environment Monitoring Service (CMEMS) at several stations in the North Sea and Baltic Sea are used. Measurements at GTS and MyOcean stations are hourly data. Measurements at FINO1 and FINO3 platforms are 10-min sustained wind speed. The hourly mean wind speed at the FINO1 and FINO3 are determined by averaging the 10-min sustained wind speed.
The latent heat flux and specific humidity data of HOAPS (Hamburg Ocean Atmosphere Parameters and Fluxes from Satellite) v4.0 [76] are taken from The Satellite Application Facility for Climate Monitoring (CM SAF) and then interpolated onto the CCLM grid. The data from Spinning Enhanced Visible and InfraRed Imager (SEVIRI), onboard the Meteosat Second Generation (MSG) series of the European Organisation for the Exploitation of Meteorological Satellites (EUMETSAT) are also interpolated onto the CCLM grid for an assessment of cloud simulations.
For precipitation assessment, the daily observational data REGNIE (Deutscher Wetterdienst [DWD, German National Meteorological Service], available over Germany) on a grid of about 1 km resolution [77], and the gridded data EOBSv18.0 [78] covering Europe at a resolution of 25 km are used. EOBSv18.0 is interpolated onto the CCLM grid to compare with simulations over the EURO-CORDEX domain. However, the simulated precipitation is interpolated onto the REGNIE grid to validate rainfall simulations over Germany and the Elbe catchment. When focusing on the Elbe catchment, since the REGNIE data are available only over Germany, only the part of the Elbe catchment inside Germany is taken into account for averaging modeled data and REGNIE data to obtain daily time-series.

3. Results

In this section we compare simulated pressure, wind, temperature, energy balance, cloud, precipitation and runoff of the coupled system AHOI against CCLM_ctr and available observations. The simulated salinity of AHOI is compared with stand-alone NEMO forced by CCLM0. Most of the analyses that are shown in the present study focus on the period of September and October 2013 and on the heavy storm Christian that occurred on 27–29 October. For the latter, we especially consider its state on 28 October when Christian got matured while passing by the North Sea and had effects on the North Sea coastal areas and Scandinavia. The impact of the storm Christian on the simulated sea level and circulation over the North Sea is discussed by Staneva et al. [51]. Indeed, storm Christian formed on Saturday, 26 October 2013, over the western Atlantic as a secondary depression of the low-pressure system Burkhard [79]. On that day, the Christian storm was at its early development stage, and simulations of CCLM_ctr do not noticeably differ from those of AHOI at the storm location. Therefore, no detailed analysis will be provided for Christian on 26 October in the present study. However, differences in simulations of the low-pressure system Burkhard (the steering system to Christian) between AHOI and CCLM_ctr on 26 October and several days before can be found in the Supplementary Materials.

3.1. Pressure and Wind

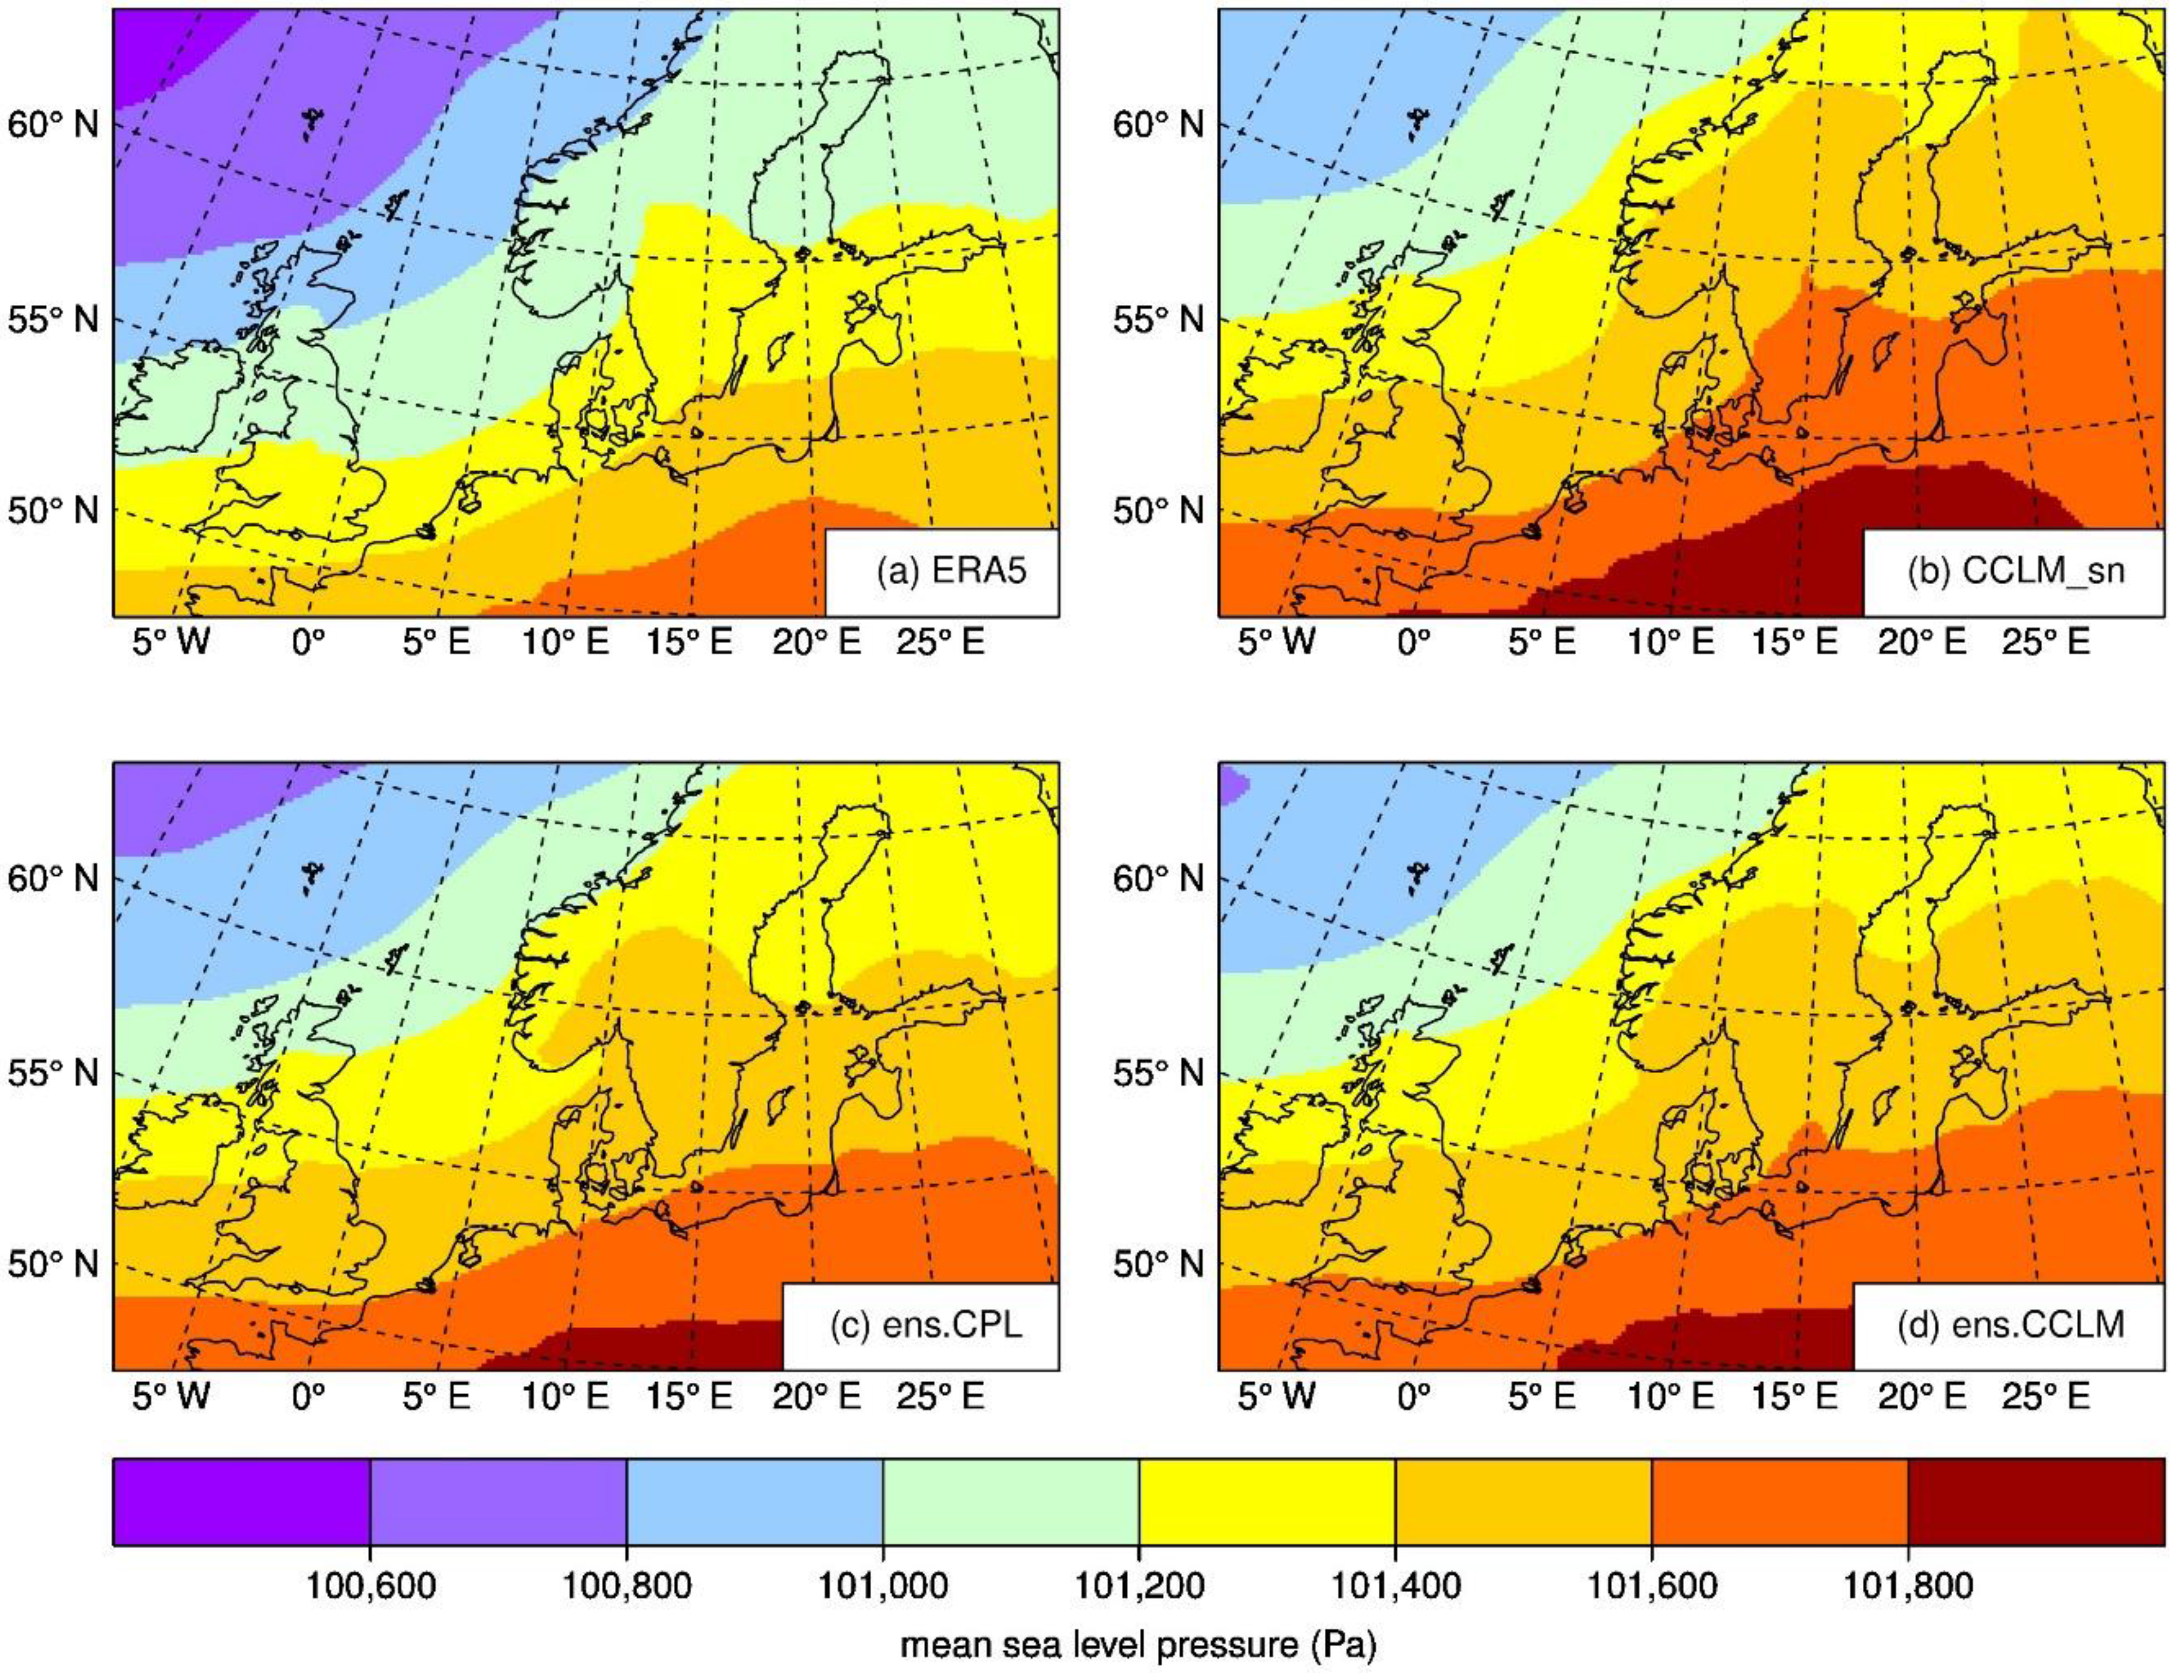
Figure 4 shows MSLP of the ERA5 forcing data as a reference and simulations of the CCLM_sn, the ensemble mean of coupled runs ens.CPL and the ensemble mean of the uncoupled runs ens.CCLM averaged for September and October 2013. Overall, the pattern of simulated MSLP of the ens.CPL is closer to the forcing ERA5 data. All simulated MSLPs are larger than ERA5 by about 200 Pa over land and over the NS_BS sub-domain (which is also shown in the one-hourly time-series of MSLP in Figure 5a) and by about 300–400 Pa over the North Atlantic Ocean. The four data sets have rather similar patterns in November–December 2013 (not shown). Note that the ERA5 MSLP is not part of the boundary forcing for CCLM.
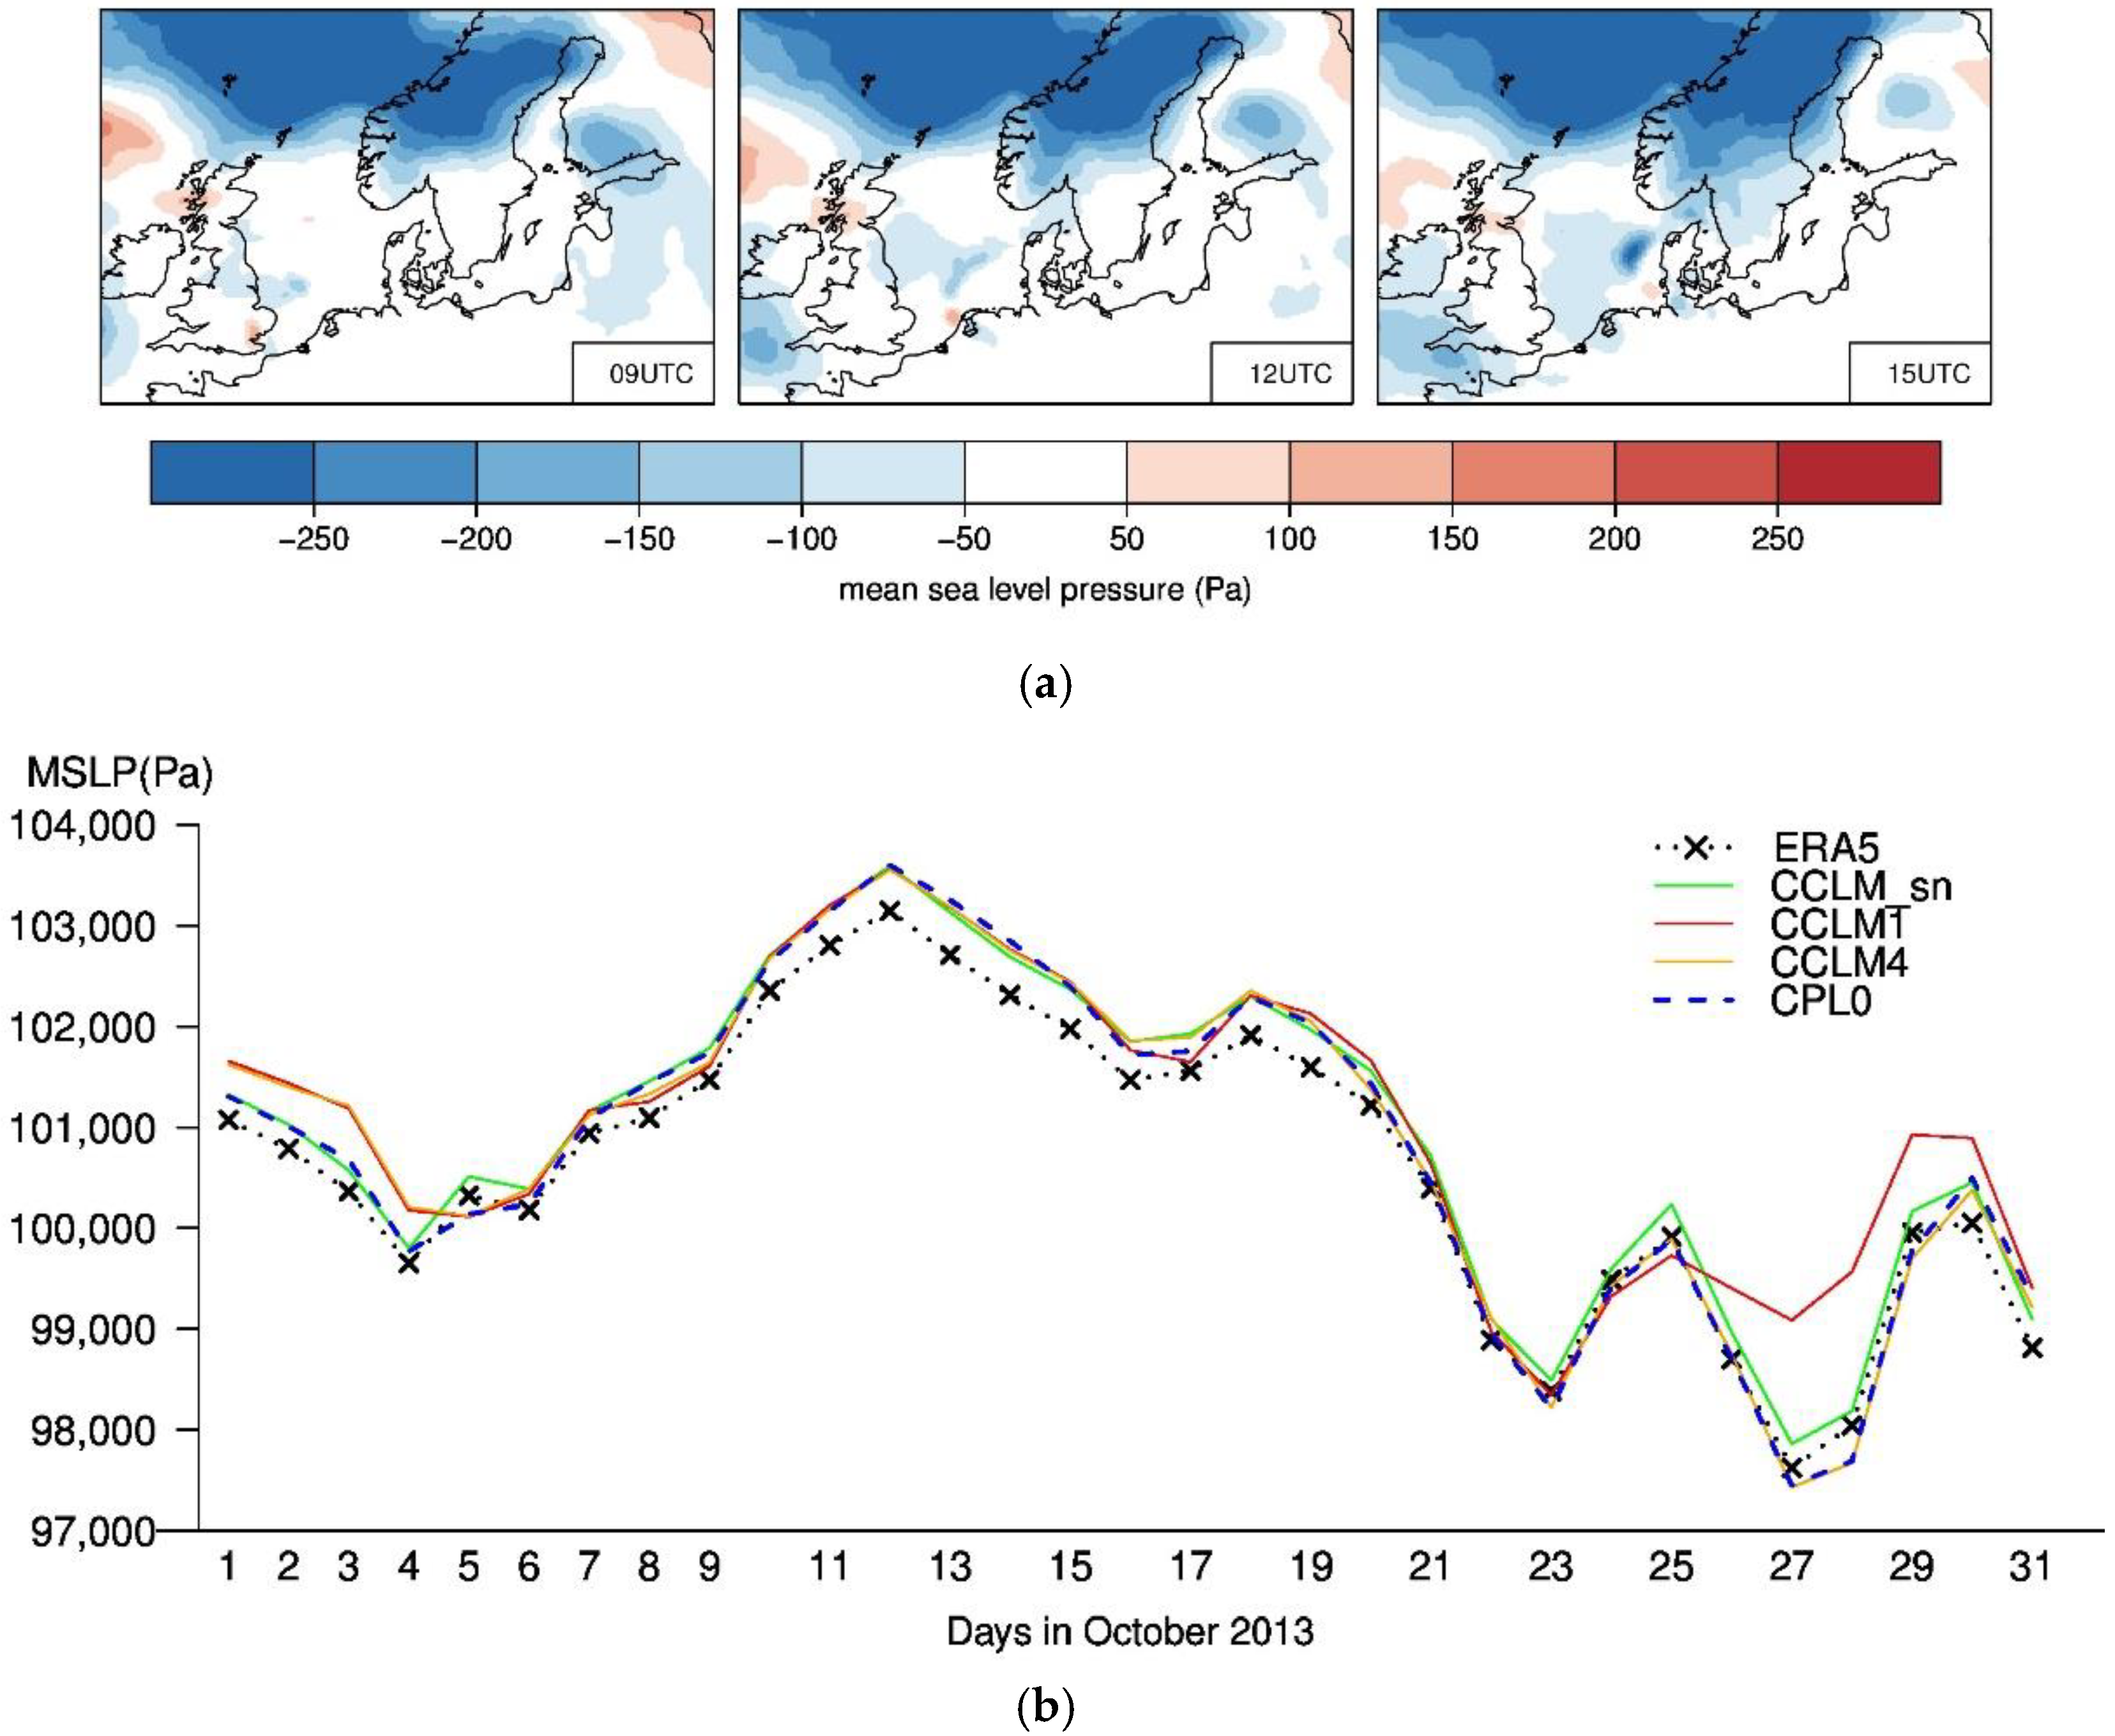
For both ensemble sets, the daily spreads of MSLP (Figure 5a), 10-m wind speed in eastward (U_10M, Figure 5b) and northward (V_10M, not shown) directions averaged over the entire NS_BS domain (cf. area covered in Figure 4) indicate a spin-up time of about five days at the beginning of September. After the spin-up, MSLP spreads of CCLM and AHOI are relatively similar with the spread of about 50–100 Pa, except three short periods around 25–26 September, 1–4 and 27–29 October when the spreads are about 150–200 Pa (Figure 5a). On 25 September a cyclone occurred in the North Sea where the spread of AHOI is up to 220 Pa less than CCLM_ctr. On 1 October the entire NS_BS area is mostly dominated by a high-pressure system. The AHOI MSLP spread of about 50 Pa averaged over the NS_BS area larger than CCLM_ctr on 1 October may be related to a shift to the west or east of the mean position of the high-pressure system amongst the AHOI ensemble members. On 4 and 27–28 October, a low-pressure system was found over the North Atlantic, in particular over the Norwegian Sea (NwgSea). The event of 27–28 October with the appearance of the low-pressure system Burkhard and the storm Christian is much more extreme than the event of 4 October, which can partly be seen in Figure 6b. The MSLP spread of AHOI on 27–28 October is less than CCLM_ctr of about 100 Pa averaged over the NS_BS area (Figure 5a) and up to about 500 Pa over the NwgSea are (figure not shown). The U_10M spreads of CCLM and AHOI are both about 0.5 m/s after the spin-up, but the spread of CCLM increases up to 1.4 m/s during the Christian event (Figure 5b). It seems that extreme events such as the heavy storm Christian are a big challenge to CCLM since simulations of CCLM are often more uncertain under disturbed weather conditions in extremes. From the second half of November to the end of December, the spreads of MSLP, U_10M and V_10M are much reduced and are very similar for CCLM and AHOI (not shown). This means that both CCLM_ctr and the coupled system AHOI are relatively stable in November–December.
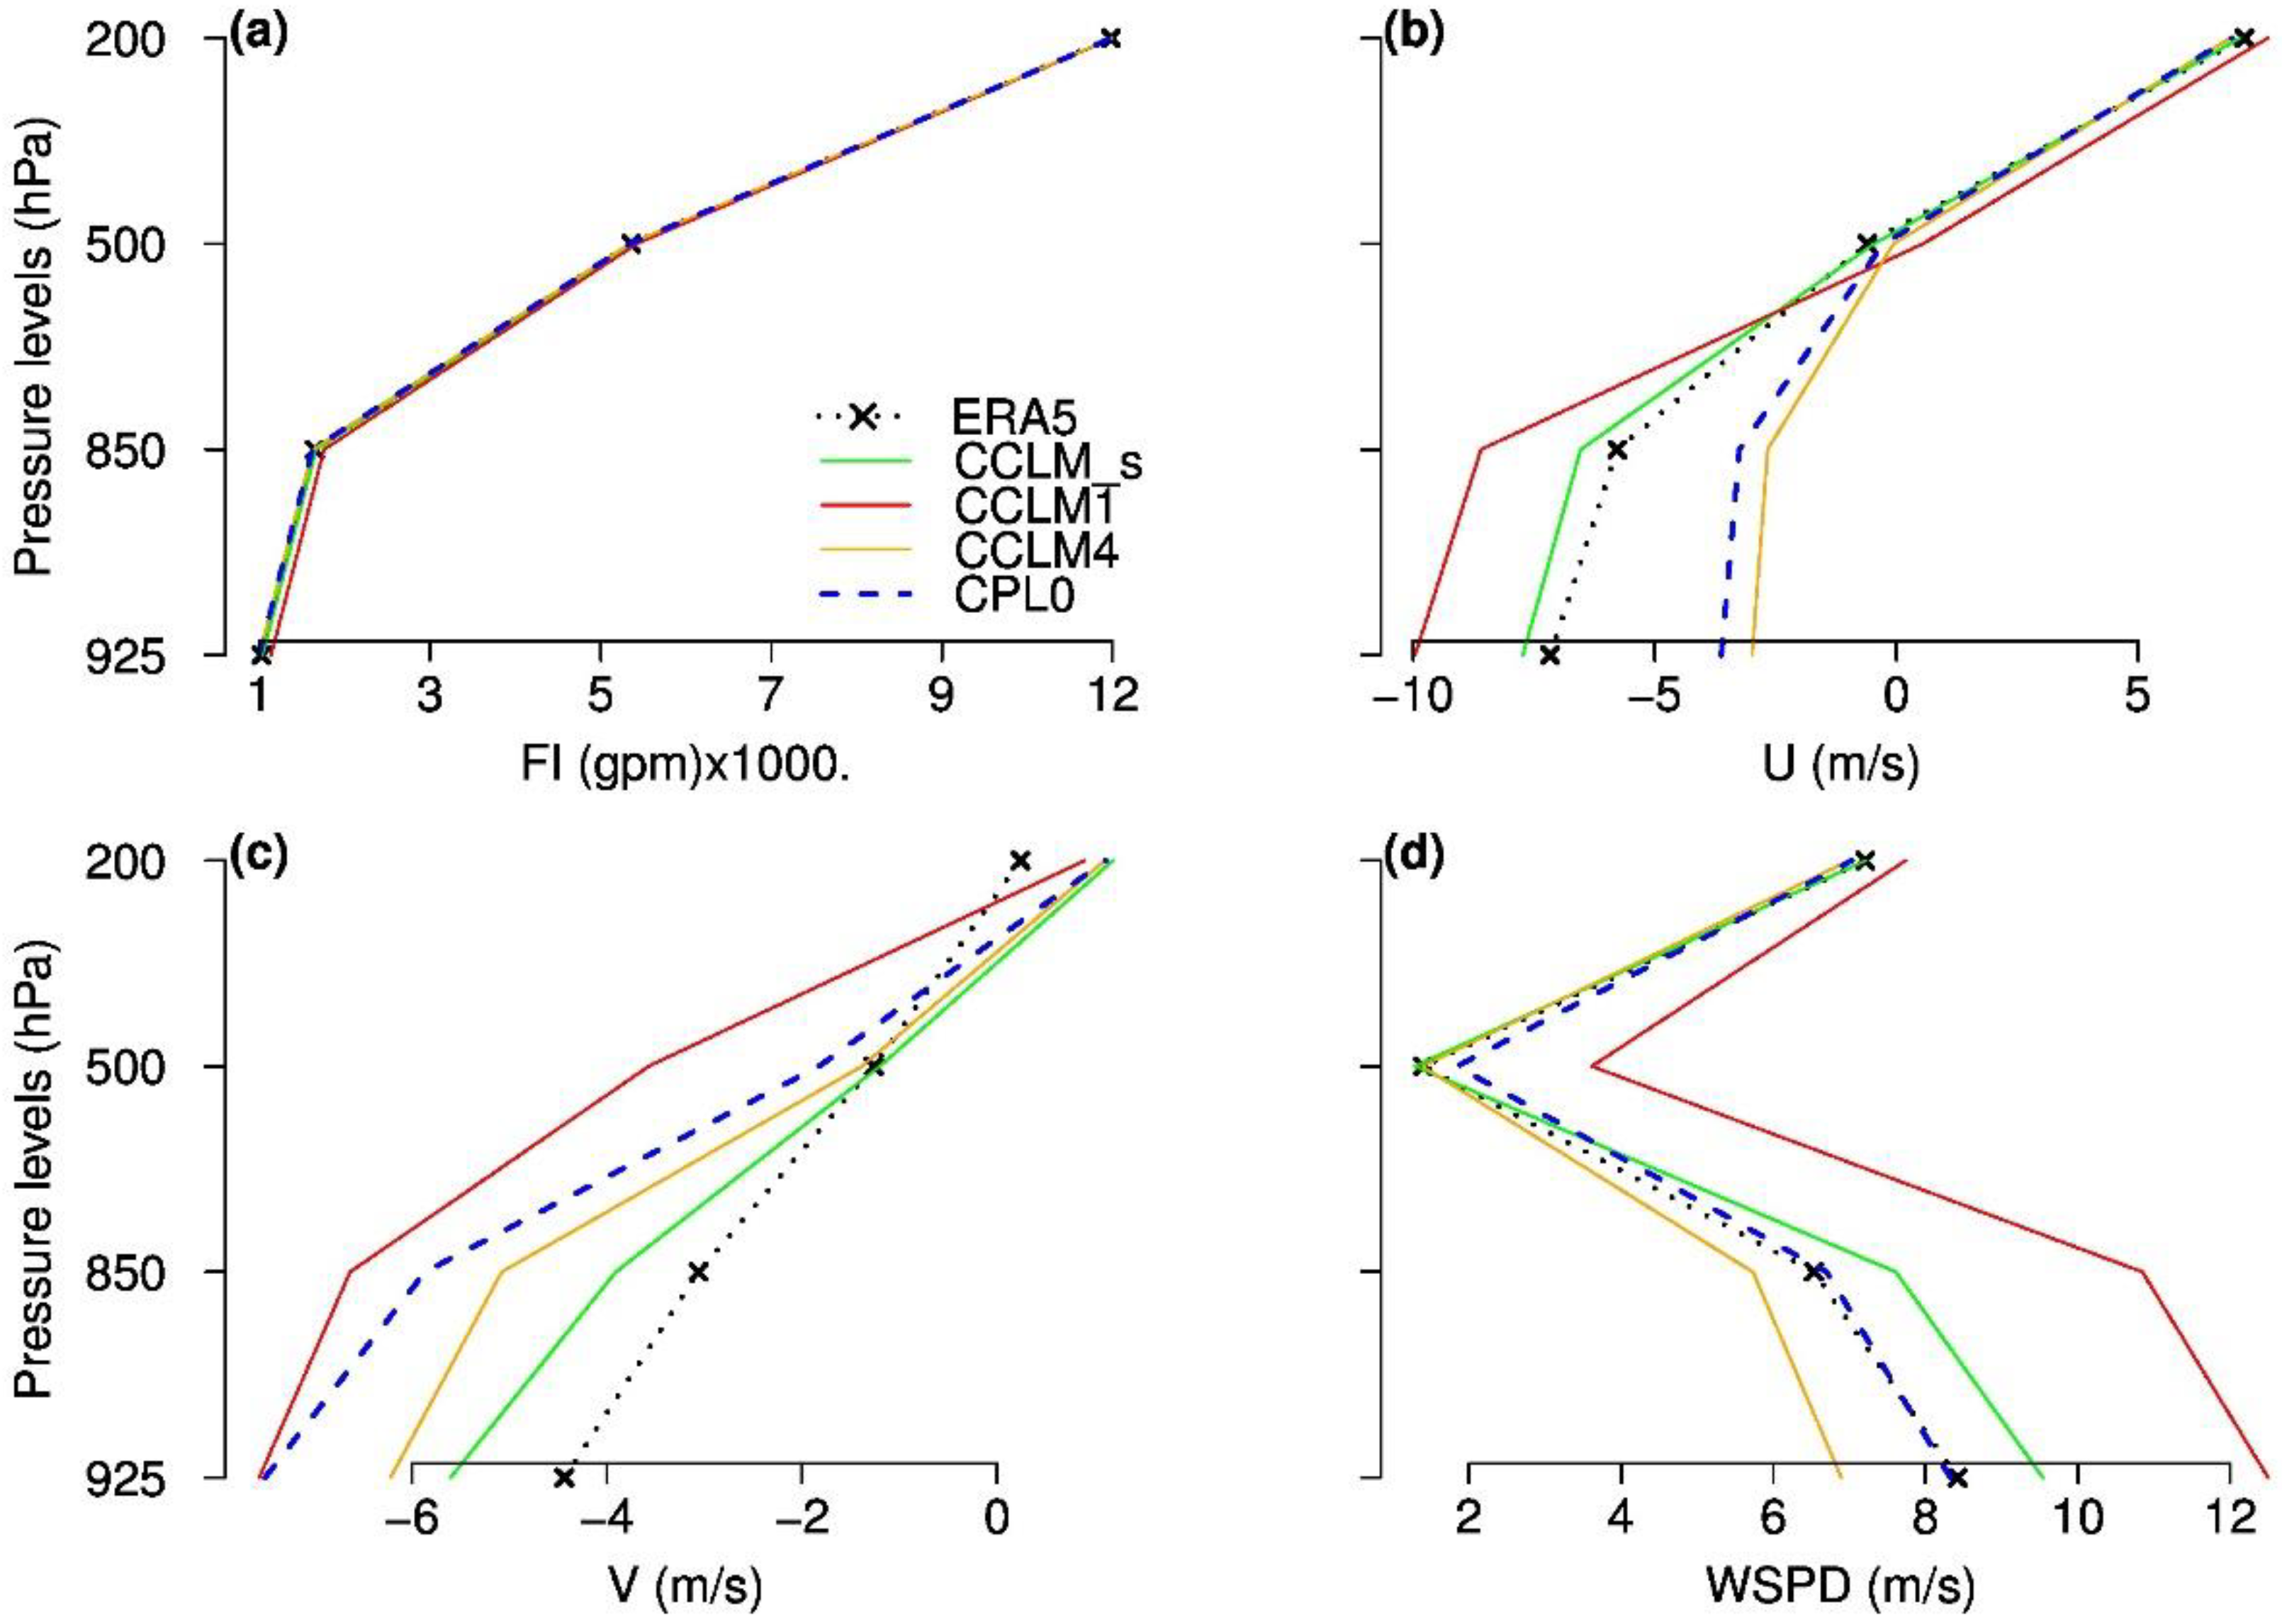
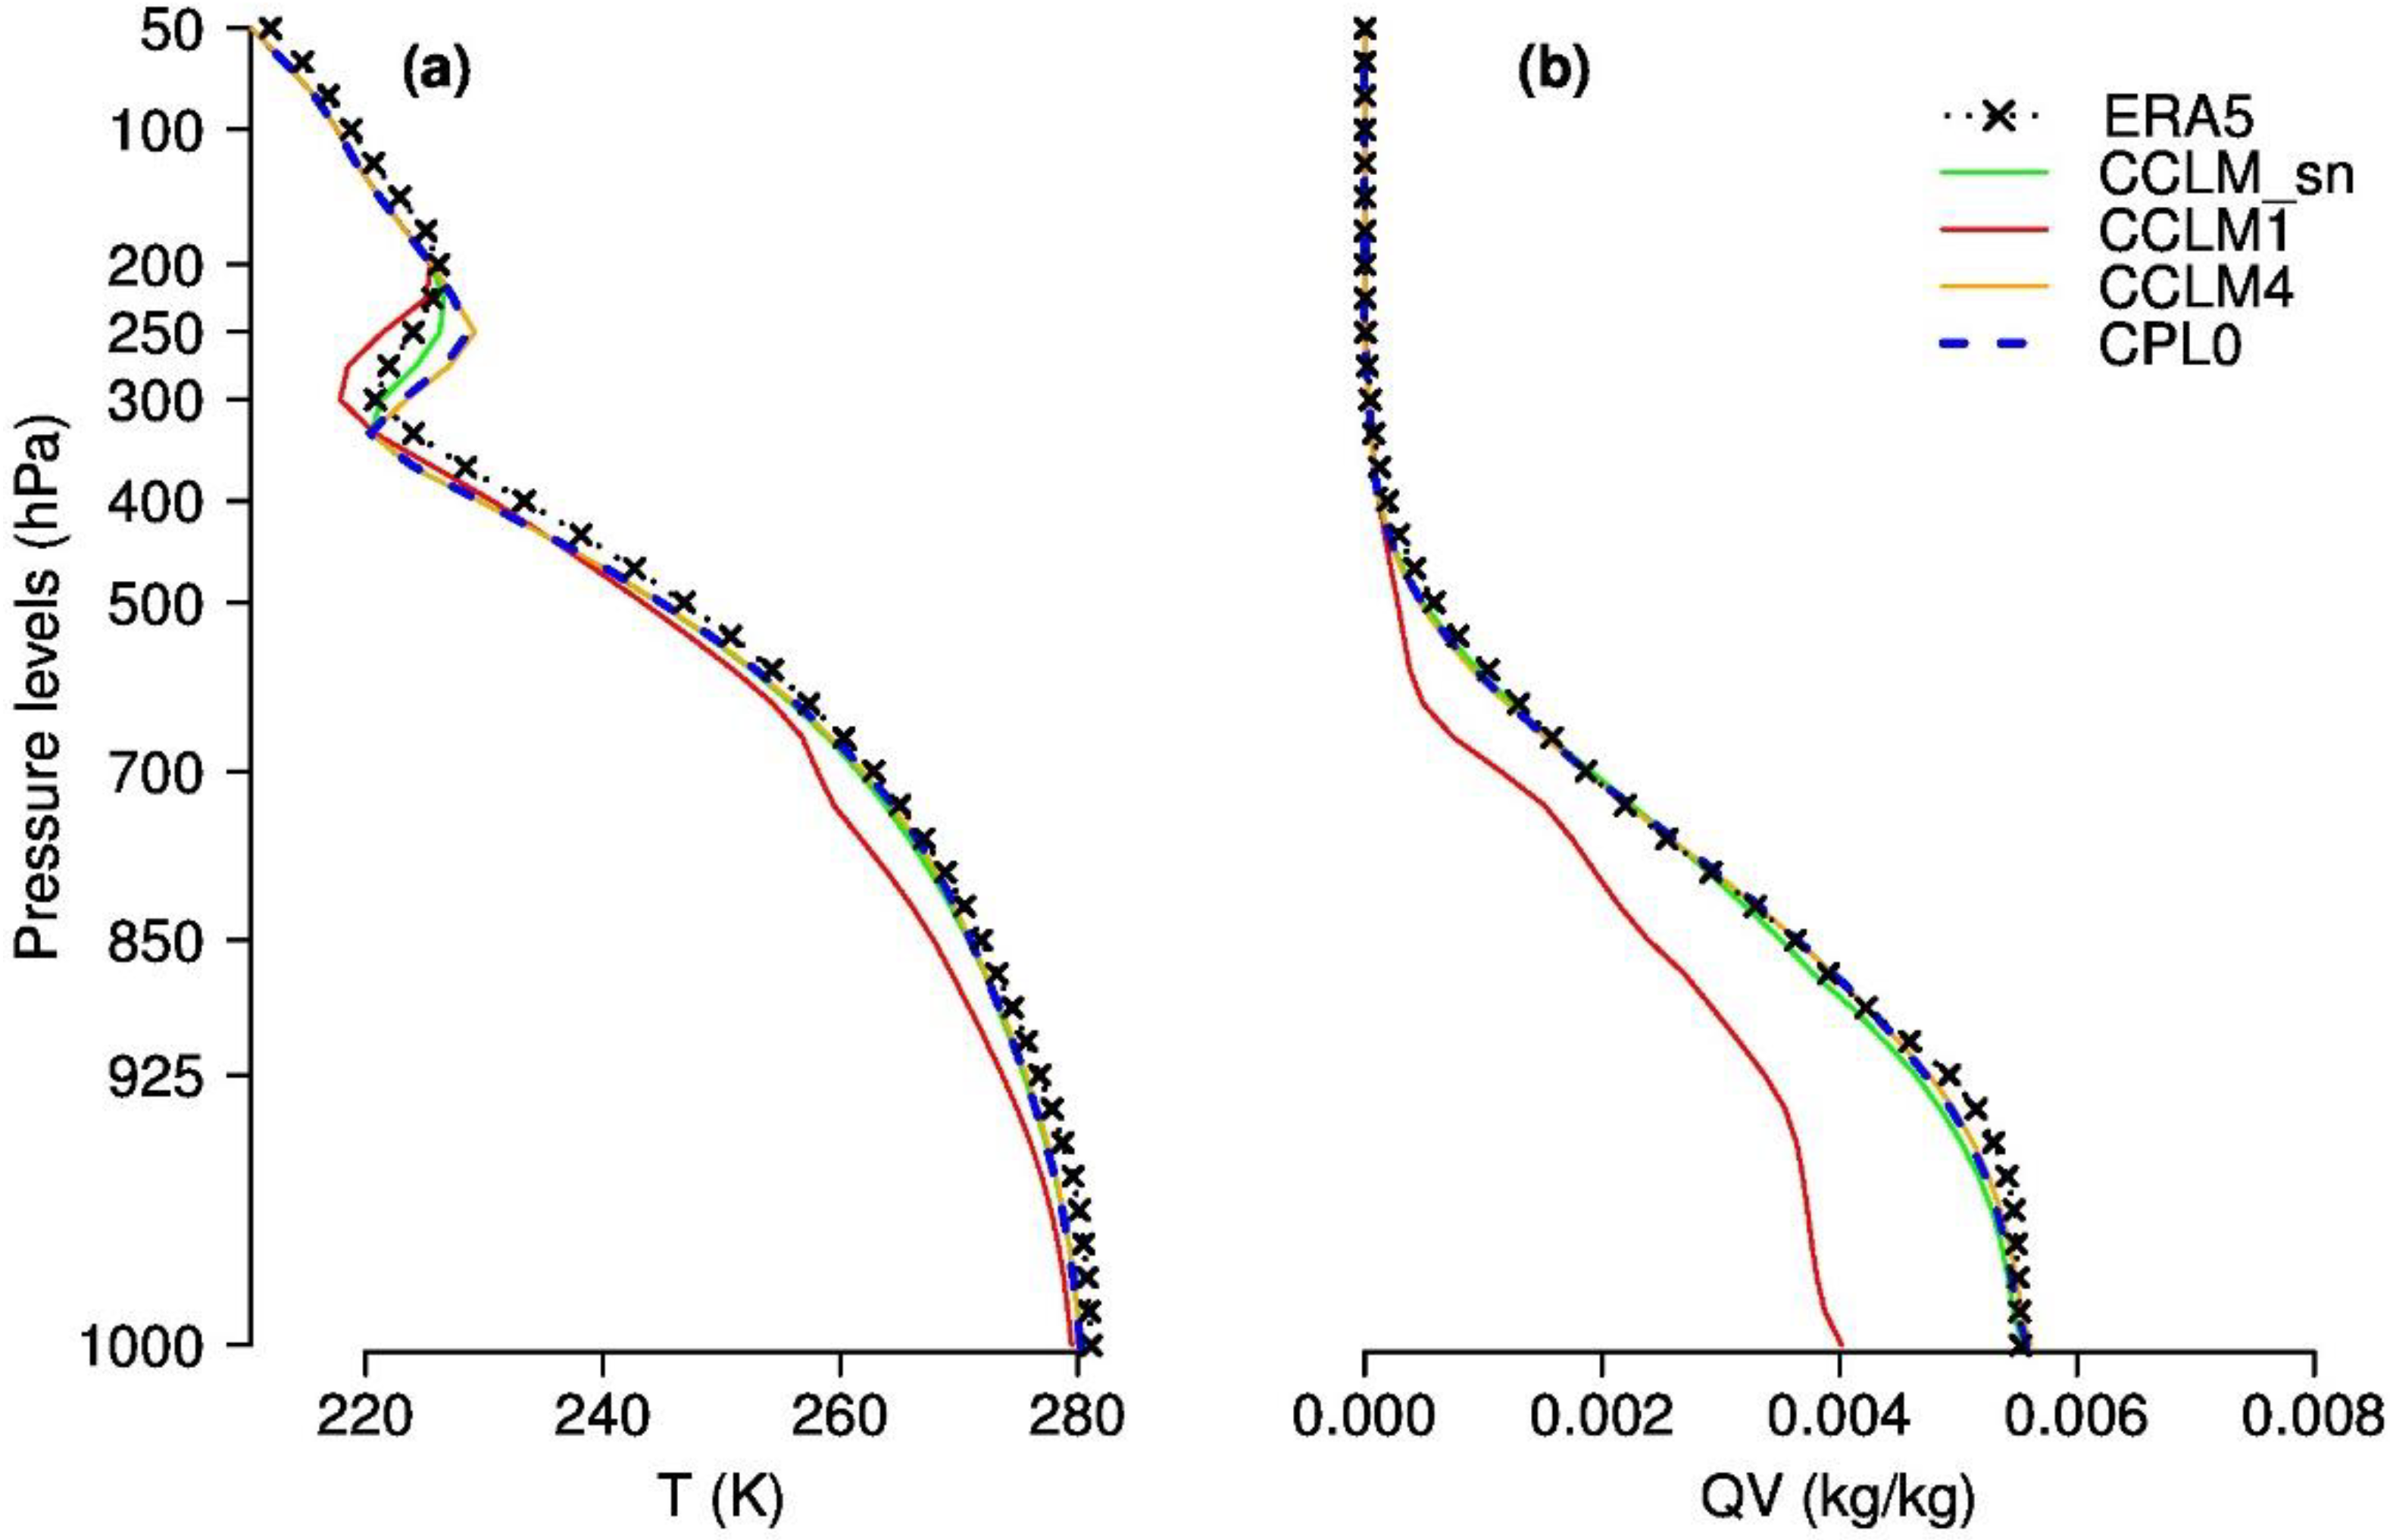
Figure 6a shows the difference of MSLP spread between ens.CPL and ens.CCLM for 09–15 UTC on 28 October 2013. Here, the blue color implies that AHOI reduces the large spread of CCLM_ctr almost over the entire considered area. The improvement of AHOI is found not only over the North Sea, where the storm Christian passed by but also, and more pronouncedly, over the Norwegian Sea (NwgSea) and Scandinavia, where the low Burkhard dominates. Therefore, in Figure 6b we also demonstrate selected time-series of daily MSLP averaged over the NwgSea area for October 2013. Apart from ERA5 and CCLM_sn, the stand-alone experiments CCLM1 and CCLM4 are shown because these two members contribute most and least, respectively, to the large spread of CCLM_ctr experiments during the storm. As all coupled experiments produce similar results, only CPL0 is plotted in Figure 6b. Figure 6b clearly shows that the MSLP over NwgSea is relatively close to ERA5 data for all these experiments, except for CCLM1 during 25–30 October, for which the MLSP is about 1000–2000 Pa larger than ERA5. On 28 October, this overestimation of MSLP is kept from the surface until the level of 850 hPa (Figure 7a). In contrast, U and V wind components, as well as wind speed (WSPD) of CCLM1 over the NwgSea, are 2–4 m/s larger than CCLM_sn, CPL0, CCLM4 and ERA5 (Figure 7b–d). The wind speed of CCLM1 continues to be larger than the other experiments from the surface to the high levels in the atmosphere. Concurrently, temperature, and specific humidity of CCLM1 are smaller than for ERA5 and the other experiments (Figure 8).
A change in wind speed and direction can cause a change in transport of air mass, leading to modified characteristics of the air mass such as temperature and humidity. In CCLM1, over NwgSea, the stronger wind speed leads to more evaporation and, therefore, larger latent heat flux and smaller specific humidity. However, U and V wind components near the surface are both negative (north-east wind), which generates an advection of the air mass to the south-west of the domain, resulting in an increase of specific humidity over the North Sea and west Great Britain and a reduction of specific humidity over the NwgSea (not shown). In short, CCLM1 reproduces a shallower low Burkhard with stronger wind speed, a colder and drier air mass over the NwgSea compared to ERA5, CCLM_sn, CCLM4, and all coupled experiments.
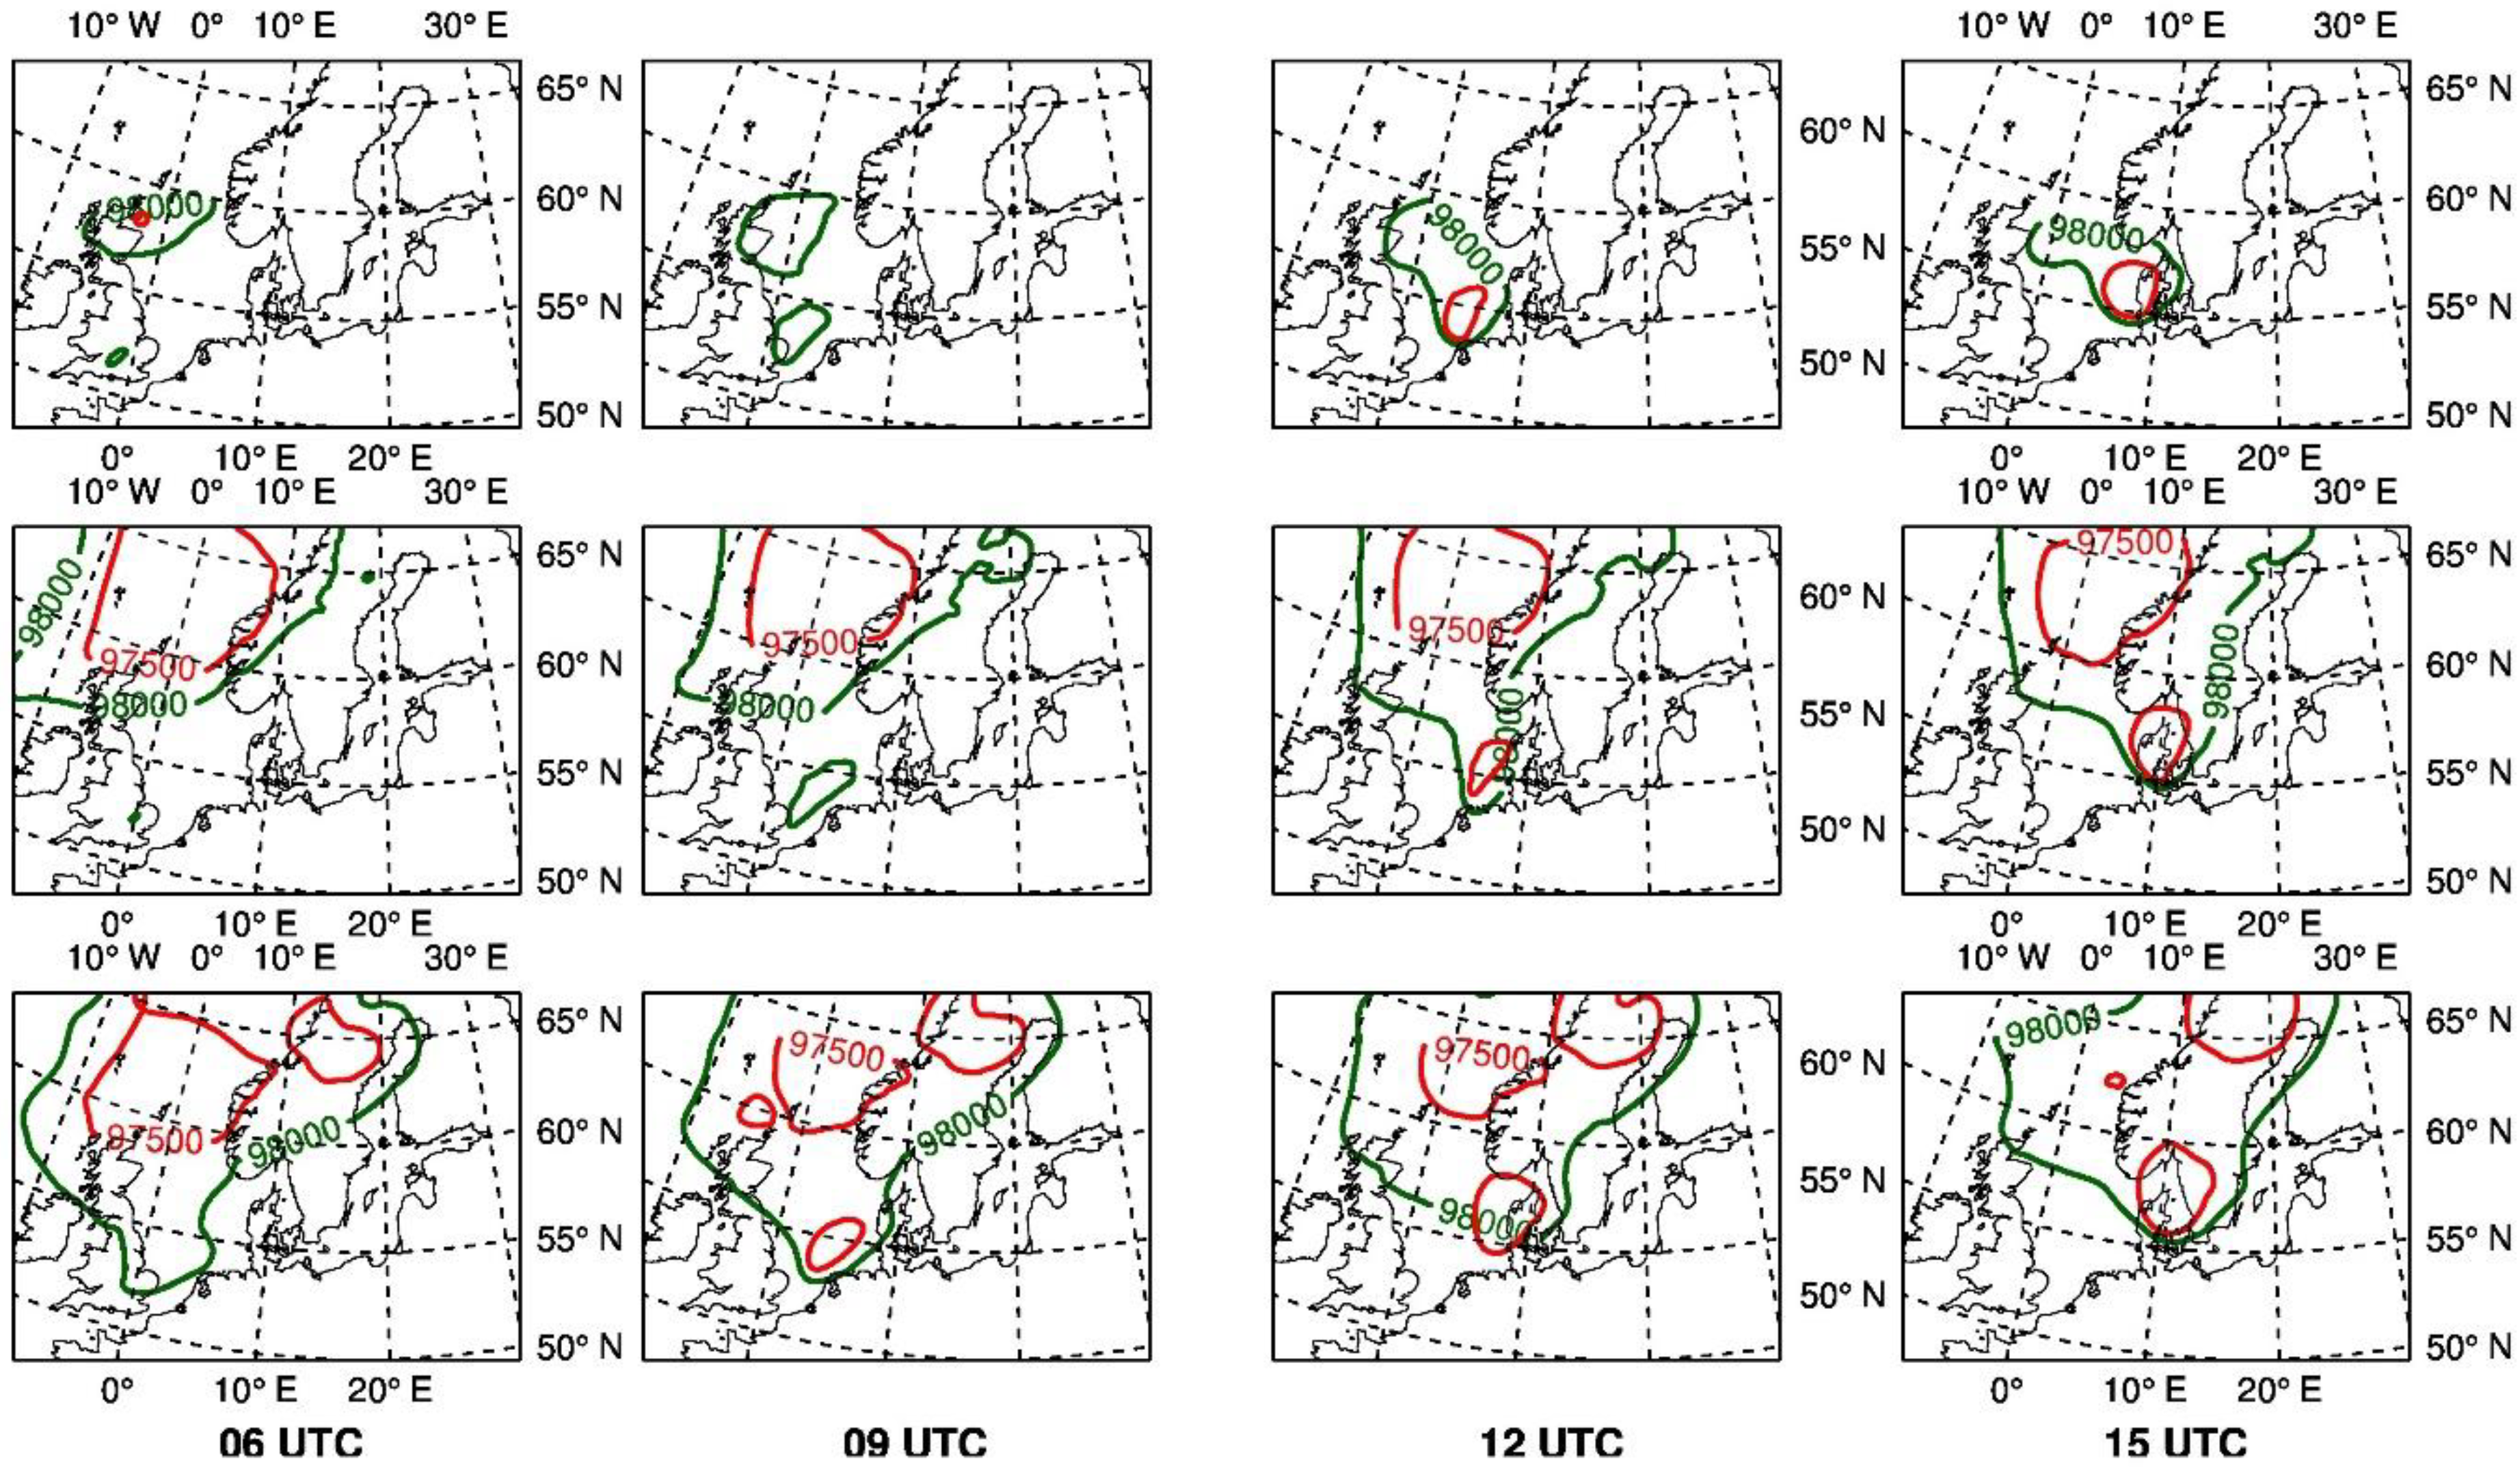
The poor performance of CCLM1 for the low-pressure system Burkhard over the NwgSea has affected the storm Christian over the North Sea, as shown in Figure 9. The three-hourly evolution patterns of MSLP during 28 October 2013 clearly show an interaction between the two lows Burkhard (over the NwgSea) and Christian (over the North Sea) in CCLM4 (Figure 9, middle row), similar to ERA5 (Figure 9, bottom row) and the CPL experiments (not shown), which is much less visible in CCLM1 (Figure 9, top row) due to the overestimation of MSLP over the NwgSea. As a consequence, the propagation speed of Christian in CCLM1 is slower than in CCLM4 (which is closer to ERA5), and the storm intensity is also somewhat smaller (the area inside the closed isometric line of 975 hPa, red contour), although the paths of the storm in CCLM1 and CCLM4 are similar. Hence, the larger IV of CCLM_ctr on the large scale can influence the propagation speed and intensity of the mid-latitude storms such as it is the case of Christian.
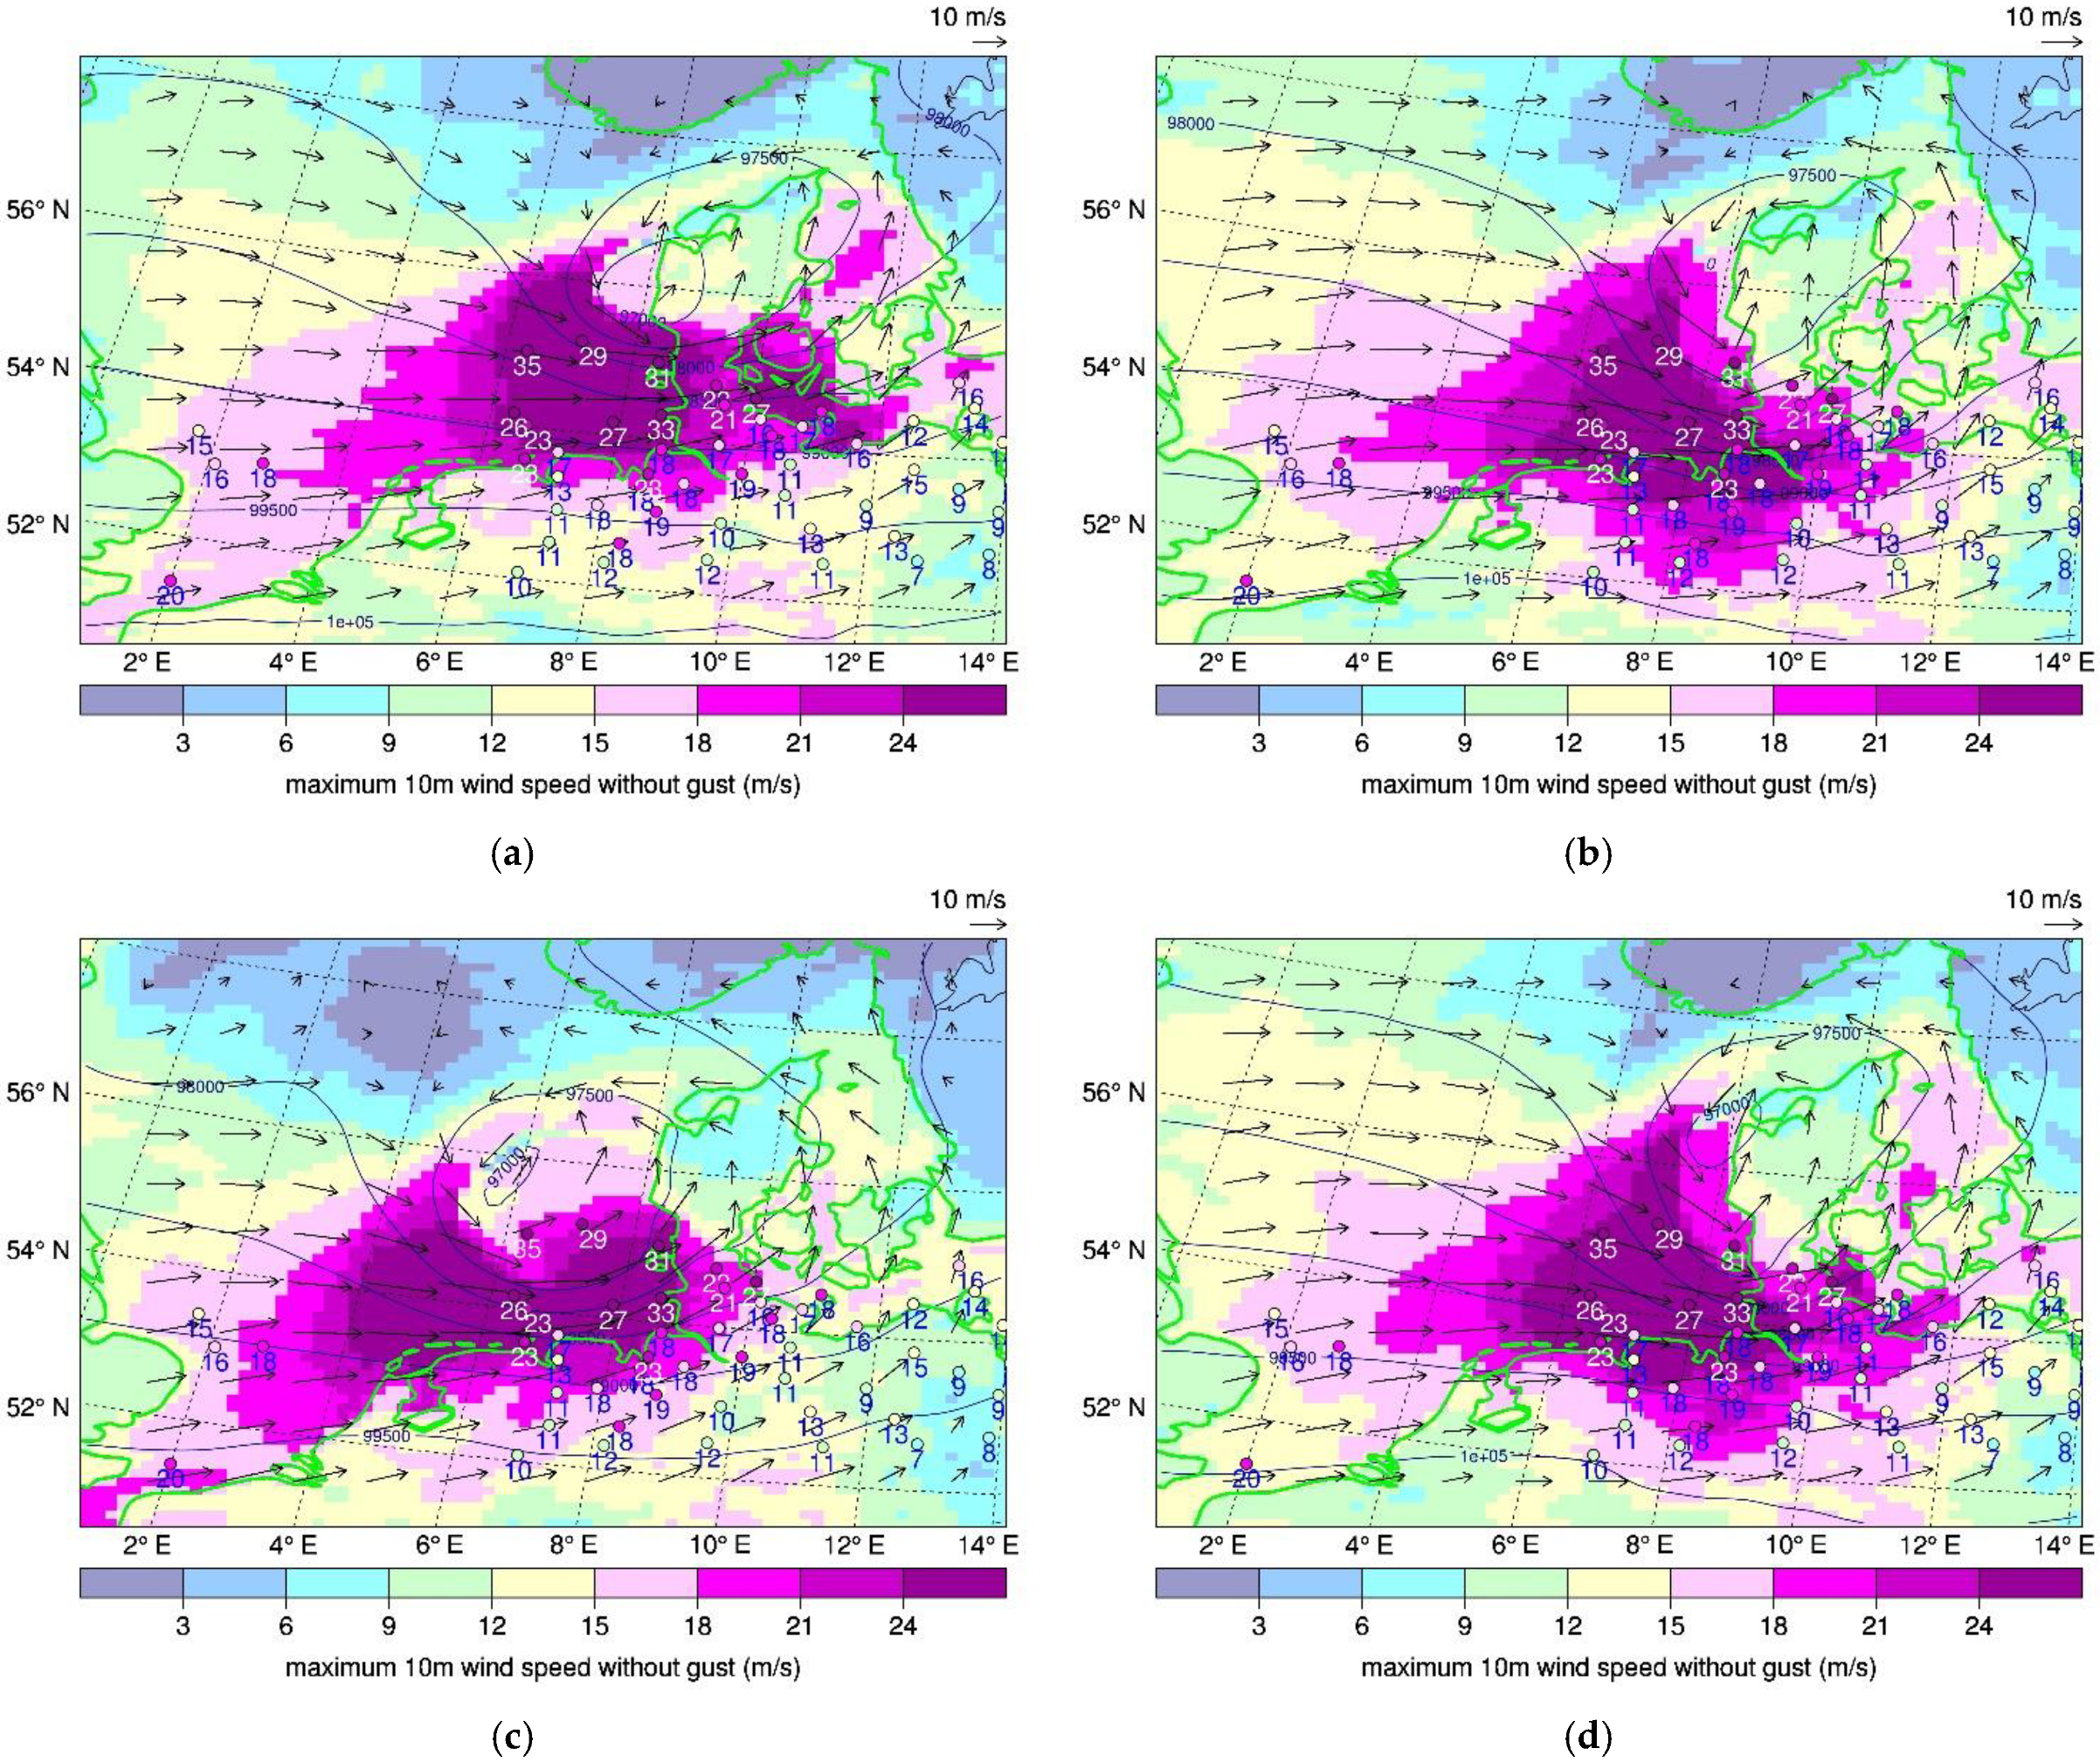
Different intensity of the storm in CCLM1 can also be seen in the map of maximum sustained wind speed, in particular on the south-west part of the storm core. Figure 10 shows the maximum sustained wind speed on 14 UTC, 23 October 2013, over the German Bight. Here, the reference experiment CCLM_sn (Figure 10a) can be used to evaluate CCLM and AHOI because it has good performance in reproducing the wind speed compared with the CMEMS MyOcean and GTS data (the numbers shown in the Figure 10). While CPL0 (Figure 10b) and CCLM4 (Figure 10d) are relatively similar to the CCLM_sn (Figure 10a), the storm reproduced by CCLM1 is still too far to the west outside of Denmark and the maximum wind speed of CCLM1 is underestimated by about 4–5 m/s at FINO3 (7.15 E, 55.2 N), but overestimated by about 2–3 m/s at FINO1 (6.59 E, 54.02 N) (not shown). On the contrary, in the northwest of the storm, the wind speed of CCLM1 is smaller than in the other experiments. As analyzed in Figure 7d, the wind speed of CCLM1 over the NwgSea area is larger than in the other experiments. It can be concluded that a modification in large-scale pressure over the NwgSea of CCLM1 might lead to the redistribution of the wind speed over the North Sea and had an influence on the intensity of the storm Christian. How this interaction happens will be investigated in the next Section.

3.2. Temperature and Energy

3.2.1. Temperature

Normally, an important part of the global air motion in the mid-latitudes of the Earth takes the form of waves wandering around the planet, oscillating irregularly between the tropical and polar regions. When these waves swing northward, they transport warm air from the tropics to Europe, Russia, or the US, and when they swing southward, they do the same with cold air from the Arctic [80]. This is a well-known feature of our planet’s atmospheric circulation system. Yet temperature differences are the main driver of airflow, thereby influencing the planetary waves. Additionally, continents generally warm and cool more readily than the oceans. These two factors are crucial for the changing pattern of the mid-latitude airflow.
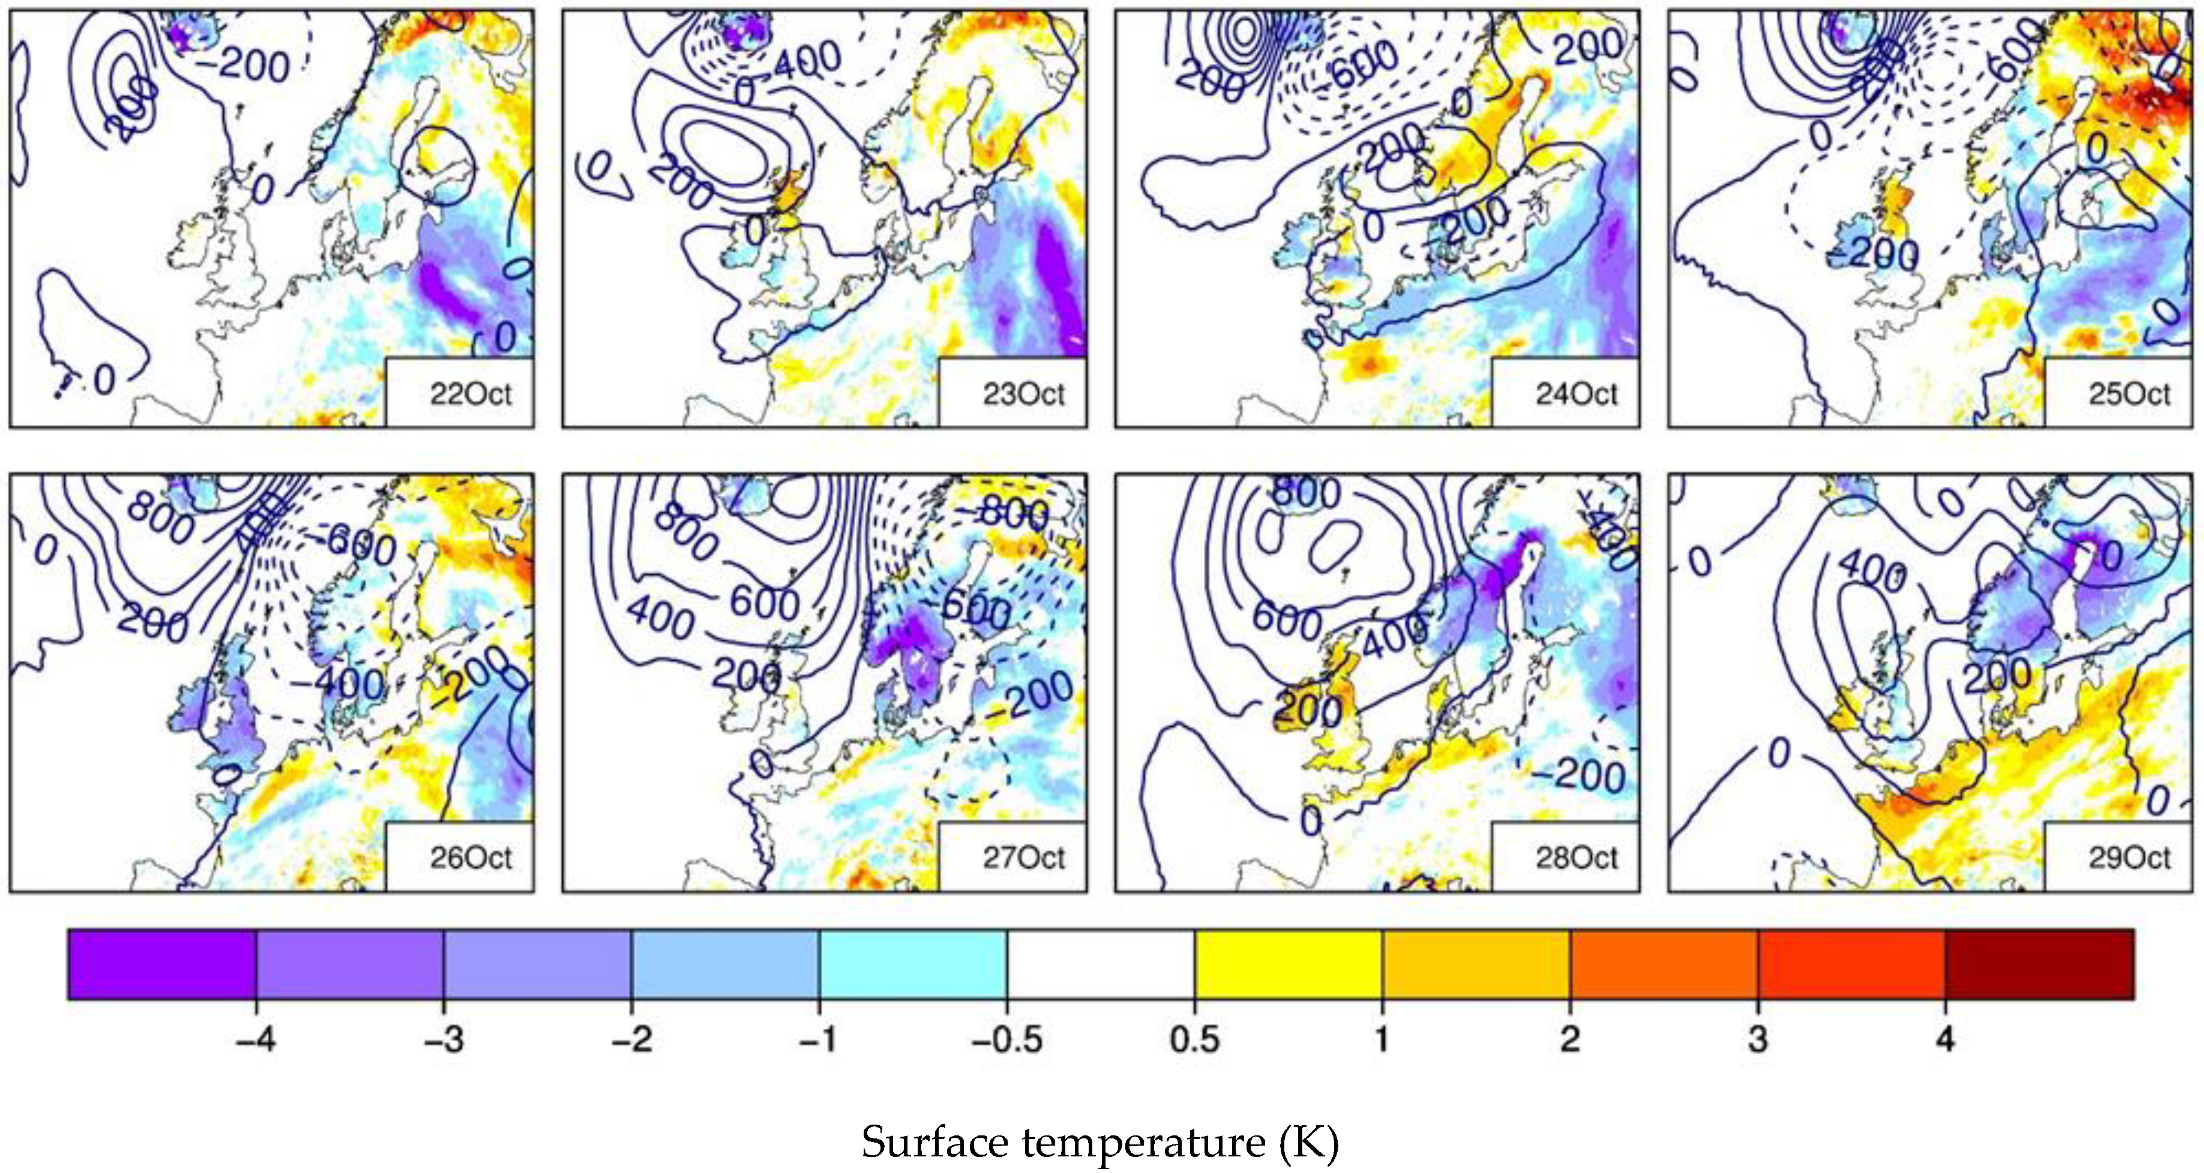
In Figure 11 we demonstrate the difference between CCLM1 and CCLM4 in air pressure (contour) at level 500 hPa and surface temperature T_S (in color) from 22 to 29 October 2013. We aim to understand how the modification of air pressure over the NwgSea is associated with changes in surface temperature over the NwgSea and its vicinity. One has to note that, there is no difference in SST over the ocean as both CCLM1 and CCLM4 are forced by the ERA5 SST. However, a large difference in T_S is found over land, in particular about three to four degrees over a large area in northern Europe (NoEU) on 25 October. The air pressure difference between CCLM1 and CCLM4 is small on 22 October but increases by time to a large amount over NwgSea on 27 and 28 October as it can also be seen in Figure 6b for the MSLP. The dipole-pattern of air pressure difference over NwgSea can be interpreted as a shift of a low in CCLM1. Since 24 October, the low over NwgSea in CCLM1 moved too fast to the east compared with CCLM4, which generated a negative pressure bias over NwgSea and a positive bias to the west. On the way moving eastward on 25 to 27 October, pressure in the center of the low Burkhard got lower in CCLM1, i.e., the intensity of this low was enhanced in CCLM1 more strongly than in CCLM4. This intensification might be associated with the warmer land surface over the NoEU in CCLM1. With the same SSTs but different land surface temperatures, the land-sea heat contrast of CCLM1 is larger than CCLM4, thus, their large-scale circulations differ. Here, we found a link of the pressure difference over the NwgSea to the land surface temperature difference over the NoEU which can be interpreted as the land-sea interaction in the climate system. From 27 to 29 October, rainfall generated due to this low over NoEU in CCLM1 is larger than CCLM4 leading to negative T_S bias (see Figure S1) and higher air pressure over the entire northern part of the considered domain on 28–29 October. Together with the change of air pressure, wind direction and speed at 500 hPa are also affected, e.g., with the most pronounced difference in wind speed of about 15 m/s over the NwgSea on 23–24 October and about 12–15 m/s over Scandinavia and north of the Baltic Sea on 27 October (see Figure S2).
Similar results are found when comparing CCLM1 and CPL0 (Figure S3) with a bit stronger effect on several days (e.g., 24, 25 October) as the SST of CCLM1 is colder than CPL0, which enhances the surface temperature gradient. North-south or west-east surface temperature gradients are an important factor to modify air pressure as well as wind direction and speed, thereby affecting the transport of air masses and changing the air mass characteristics. The drier and colder air mass of CCLM1 in Figure 8 is one obvious example.
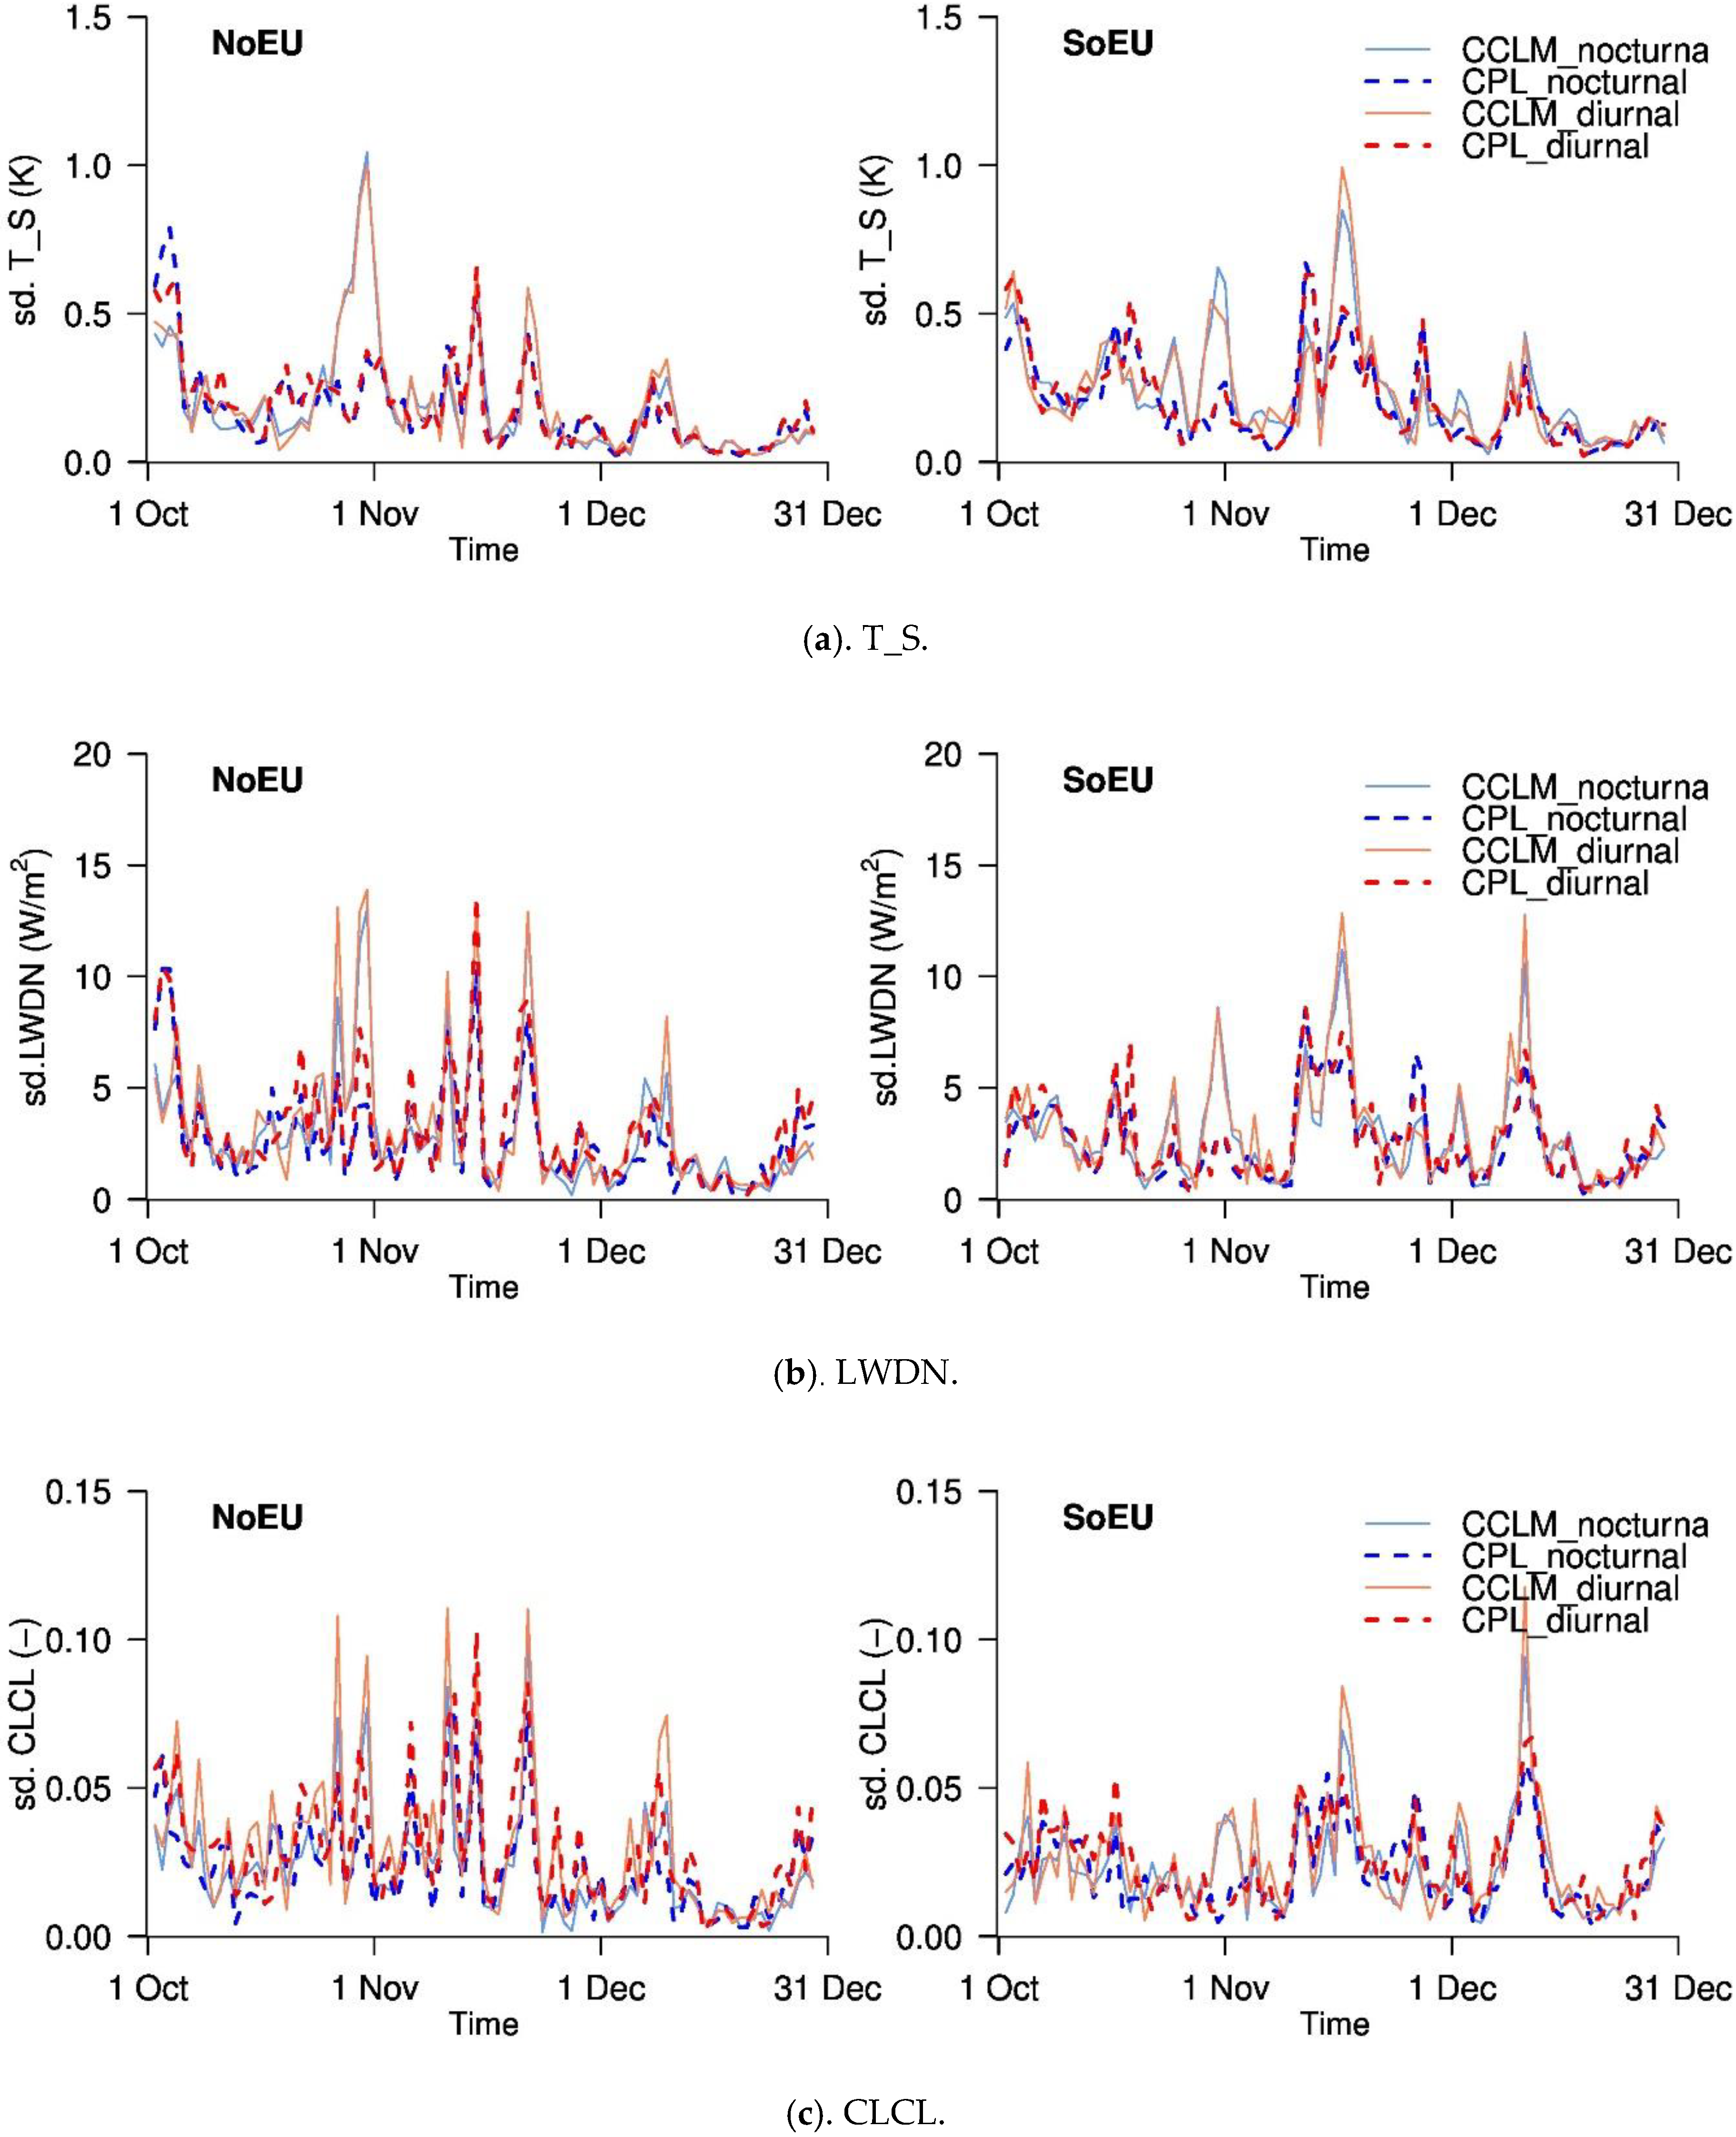
As the surface temperature over land is found to be important for the stable simulation of air pressure and wind, we analyze CCLM_ctr and AHOI spreads of T_S and T_2M together with net surface short-wave radiation (SWnet), surface longwave downward radiation (LWDN), cloud cover at low level (CLCL) and high level (CLCH). Figure 12a–c show spreads of T_S, LWDN, and CLCL, respectively, as an example.
For all variables, we consider daytime (diurnal, from 6 UTC to 17 UTC) and nighttime (nocturnal, from 18 UTC to 5 UTC of the next day) values during 1 October–31 December 2013. September is excluded in Figure 12 as the spin-up time. Figure 12 shows that variability magnitudes of AHOI (dashed lines) are often smaller than those for CCLM_ctr (solid lines), especially during the storm Christian event, and the difference between AHOI and CCLM_ctr is more pronounced over NoEU than over SoEU. The spread of T_S and T_2M of CCLM_ctr over NoEU is about 0.5 degrees on 27–29 October and increases to more than one degree in several days afterward. This temperature spread (Figure 12a) is associated with the spread of LWDN of about 14 W/m2 (Figure 12b) and cloud fraction of about 10% (Figure 12c) over NoEU. Over SoEU, on 30 and 31 October and 16 and 17 November, there is also a reduction of the spread of all the variables in AHOI compared to CCLM, although this reduction is smaller than over NoEU during 27–29 October. Meanwhile, CCLM_ctr and AHOI have similar SWnet spreads (not shown) with a reduction of spreads of short-wave radiation from September to December which fits the seasonal variation of incoming short-wave radiation. Compared with downward long-wave radiation during this time period, the contribution of short-wave to the energy budget is much smaller. Hence, the spreads of T_S and T_2M depend more strongly on the spread of downward long-wave radiation. However, over SoEU, on 11 and 12 December the dependence is less strong. In these days, spreads of LWDN, CLCH and CLCL of AHOI are all reduced compared to CCLM_ctr with even a larger amount than on 17 November. AHOI T_S spread is similar to CCLM, and AHOI T_2M spread is only about 0.2 °C smaller than CCLM because these temperature spreads of CCLM are already small. This stability of temperature in December in CCLM and AHOI is associated with the stability of MSLP indicated in sub-Section 3.1.
As mentioned above, CCLM_ctr uses prescribed SST from ERA5 while SST of AHOI is simulated by NEMO. The ensemble mean of AHOI SST averaged over the simulation period of September–December 2013 differs by about ± 0.5–1 °C from the ERA5 SST. Over the North Atlantic to the west part of the NB_BS sub-domain, AHOI can have a warm bias of about 1.5 °C. Averaged over the entire NB_BS sub-domain AHOI SST has a spread of about 0.3 °C until about the 15th day after the simulations start and converges afterwards (not shown). The time-series SST of AHOI averaged over the NB_BS sub-domain show a warm bias of about 0.5 °C compared with ERA5 SST (not shown). We speculate that the ocean in AHOI must be warmer or more active to keep the energy balance of the system. In the next section, the energy balance will be analyzed in detail.

3.2.2. Energy Balance

In the previous section, we described the impact of land-sea interaction as well as the teleconnection between the Atlantic Ocean and the European continent, on the stability of climate simulations of CCLM. In this section, we investigate the energy budget over the NwgSea area where the largest difference between CCLM1 and CCLM4 exists (Figure 13). The surface energy balance formulation can be found in part 3 in the Supplementary Materials.
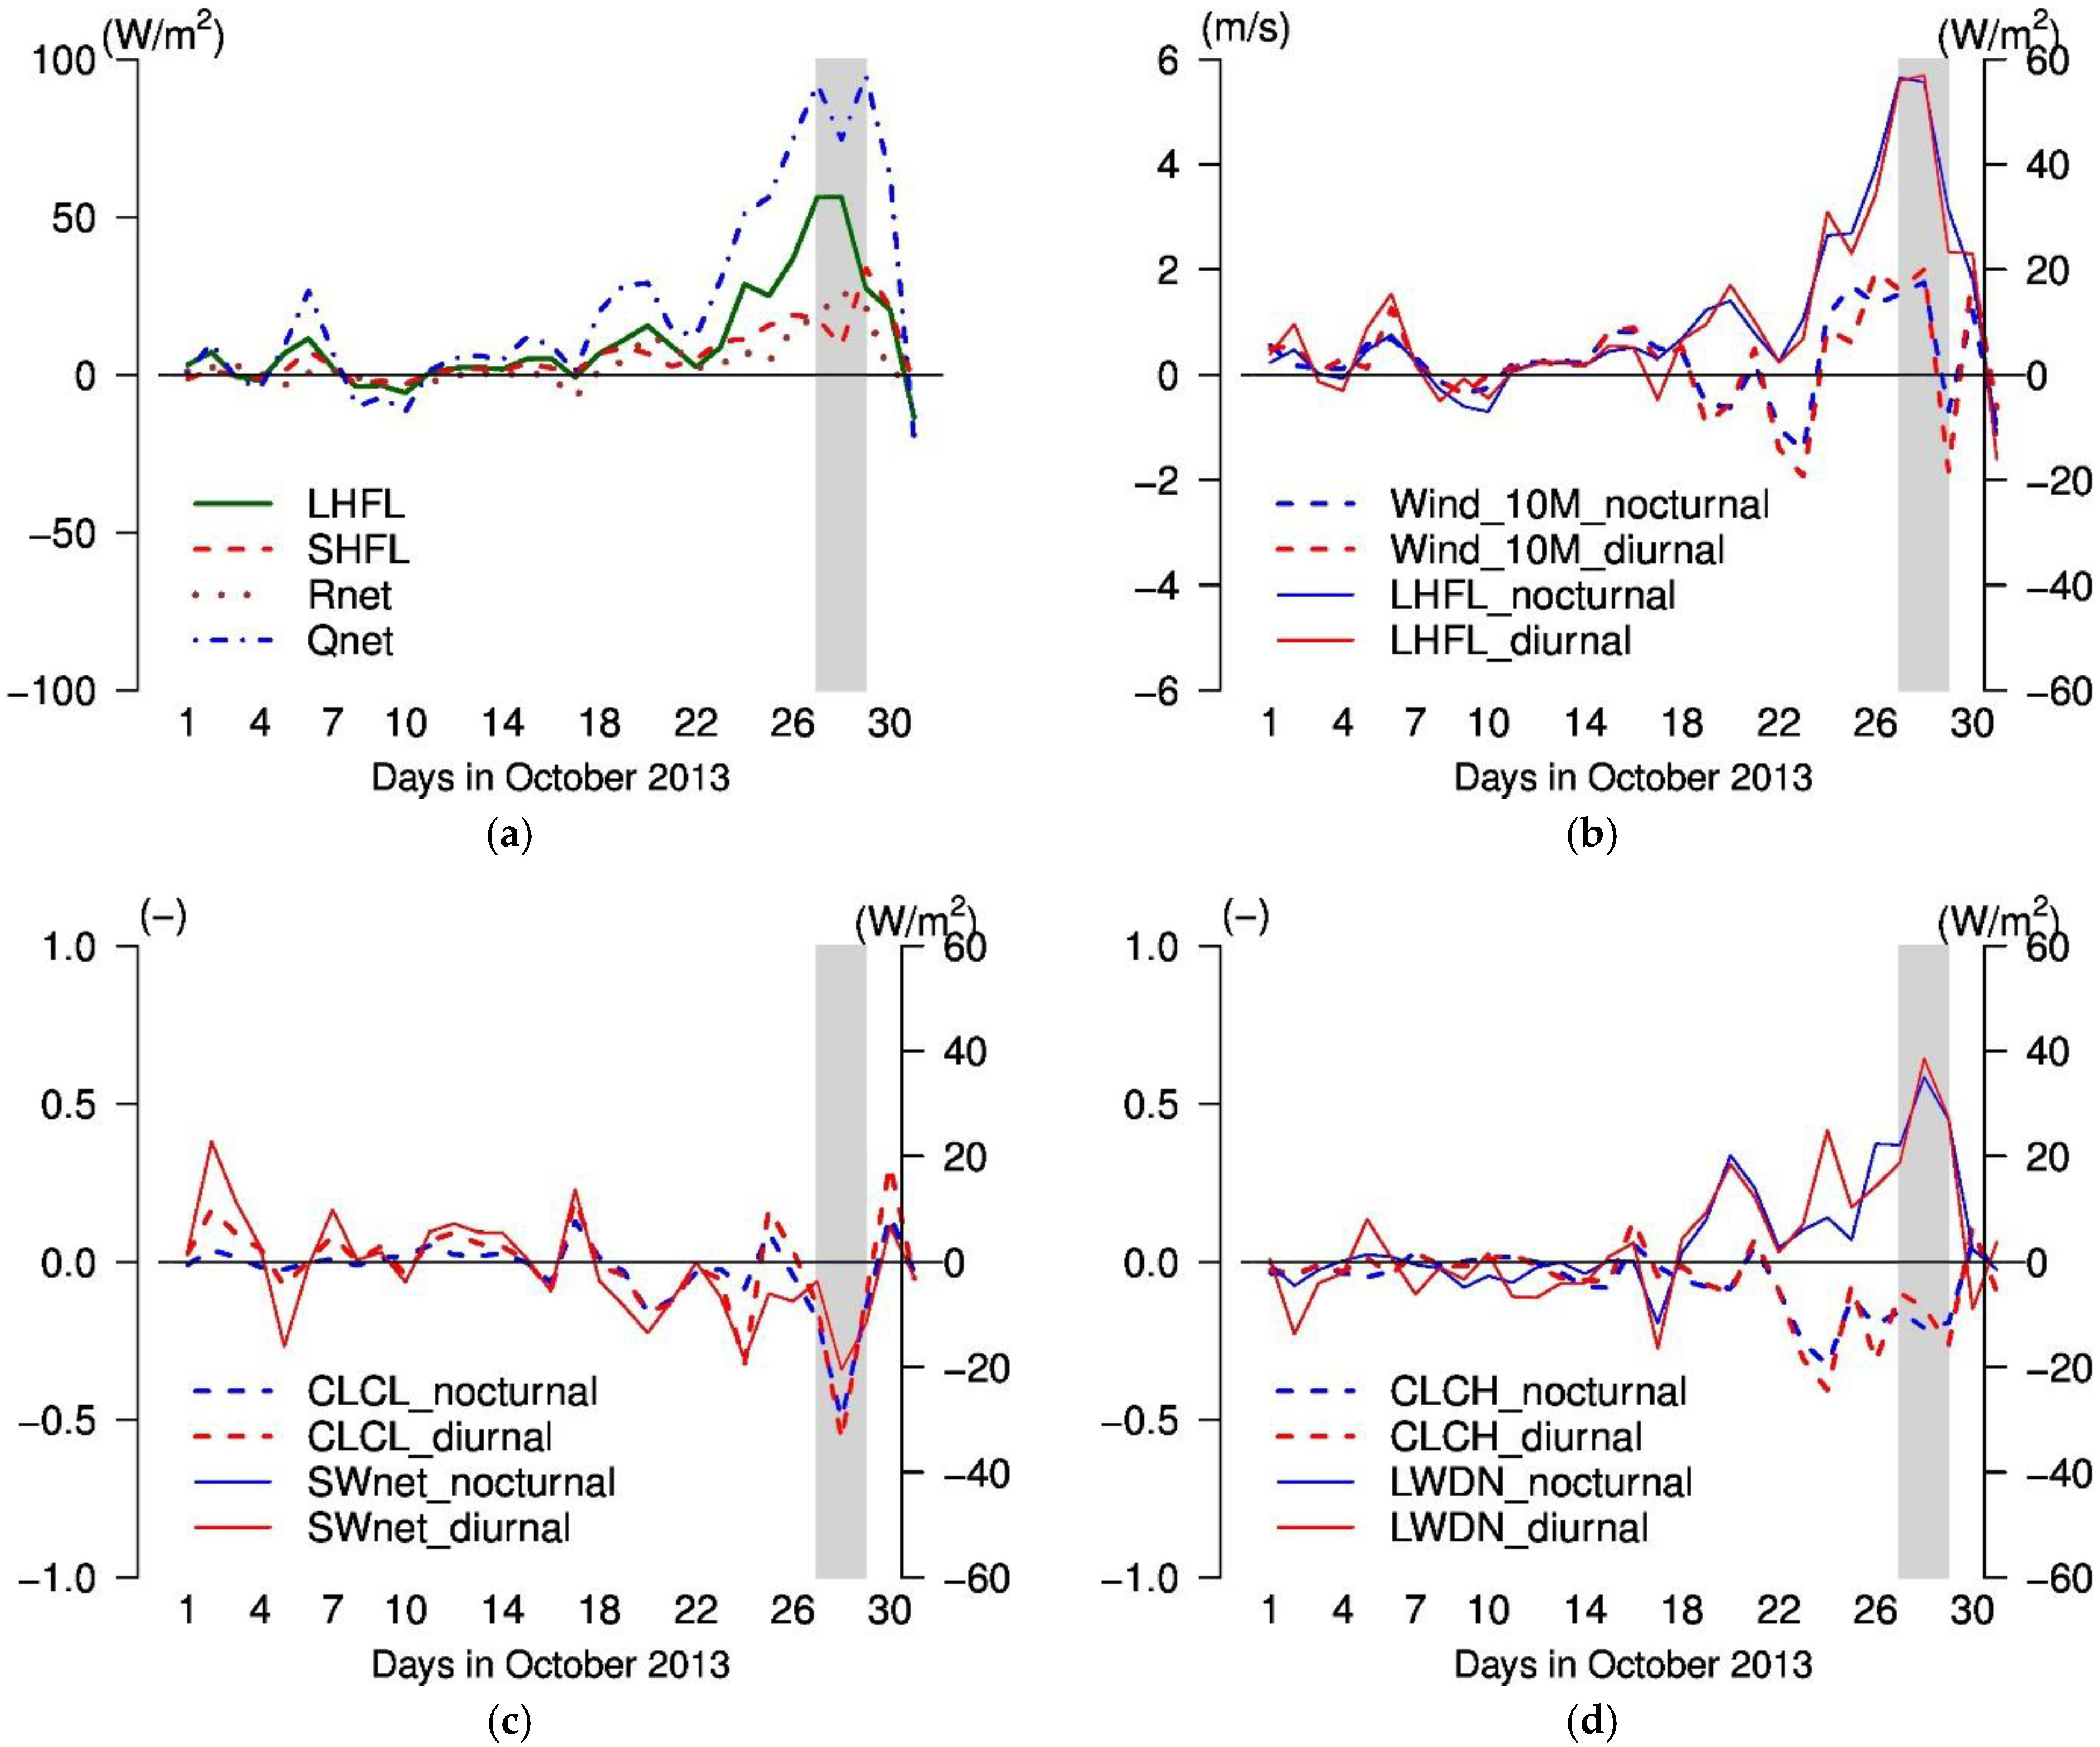
Figure 13a shows the daily differences of latent heat flux (LHFL), sensible heat flux (SHFL), net radiation flux (Rnet), and net energy flux (Qnet) between CCLM1 and CCLM4 averaged over NwgSea for October 2013. Rnet and Qnet are calculated in Equation (3) and Equation (4) as following
Rnet = ( SW SW ) + ( LW LW ) = SWnet + LWnet
and
Qnet = Rnet + LHFL + SHFL
where SW↓ and SW↑ are downward and upward solar radiative fluxes, LW↓ and LW↑ are downward and upward long-wave radiative fluxes at the surface. In this case, the largest contribution to the net long-wave radiative fluxes (LWnet) is from the downward component (LW↓ or LWDN).
Positive differences in the energy fluxes indicate an energy loss from the ocean to the atmosphere. Figure 13a clearly illustrates that the large Qnet difference of about 100 W/m2 before and during the storm event is mainly due to the latent heat flux. This result can be explained by the overestimation of the wind speed of CCLM1 (Figure 13b and Figure 7). A smaller contribution of about 30 W/m2 to the large positive difference of Qnet is from Rnet which is mainly induced by the surface longwave downward radiation (LWDN, Figure 13d). This positive difference in LWDN is associated with the negative difference in high cloud cover CLCH (Figure 13d). Less high clouds in CCLM1 than in CCLM4 lead to less reflected long wave downward radiation at the surface. CCLM1 also tends to reduce the low cloud cover during the event, so that more shortwave radiation reaches the surface. However, in October, there is not much shortwave radiation coming to the mid-latitude region, thus, the contribution of this variable is smaller compared to the longwave downward radiation.
From Figure 13a, one could expect that with a larger loss of Qnet in CCLM1, the surface would get colder than in CCLM4 due to a changing ground heat flux G that balances the surface energy budget (see part 3 in the Supplementary Materials). However, NwgSea is an open ocean area, and CCLM1 and CCLM4 have the same prescribed ERA5 SST. Thus, SST in CCLM1 is fixed and it cannot be reduced. So, where is the residual energy going?
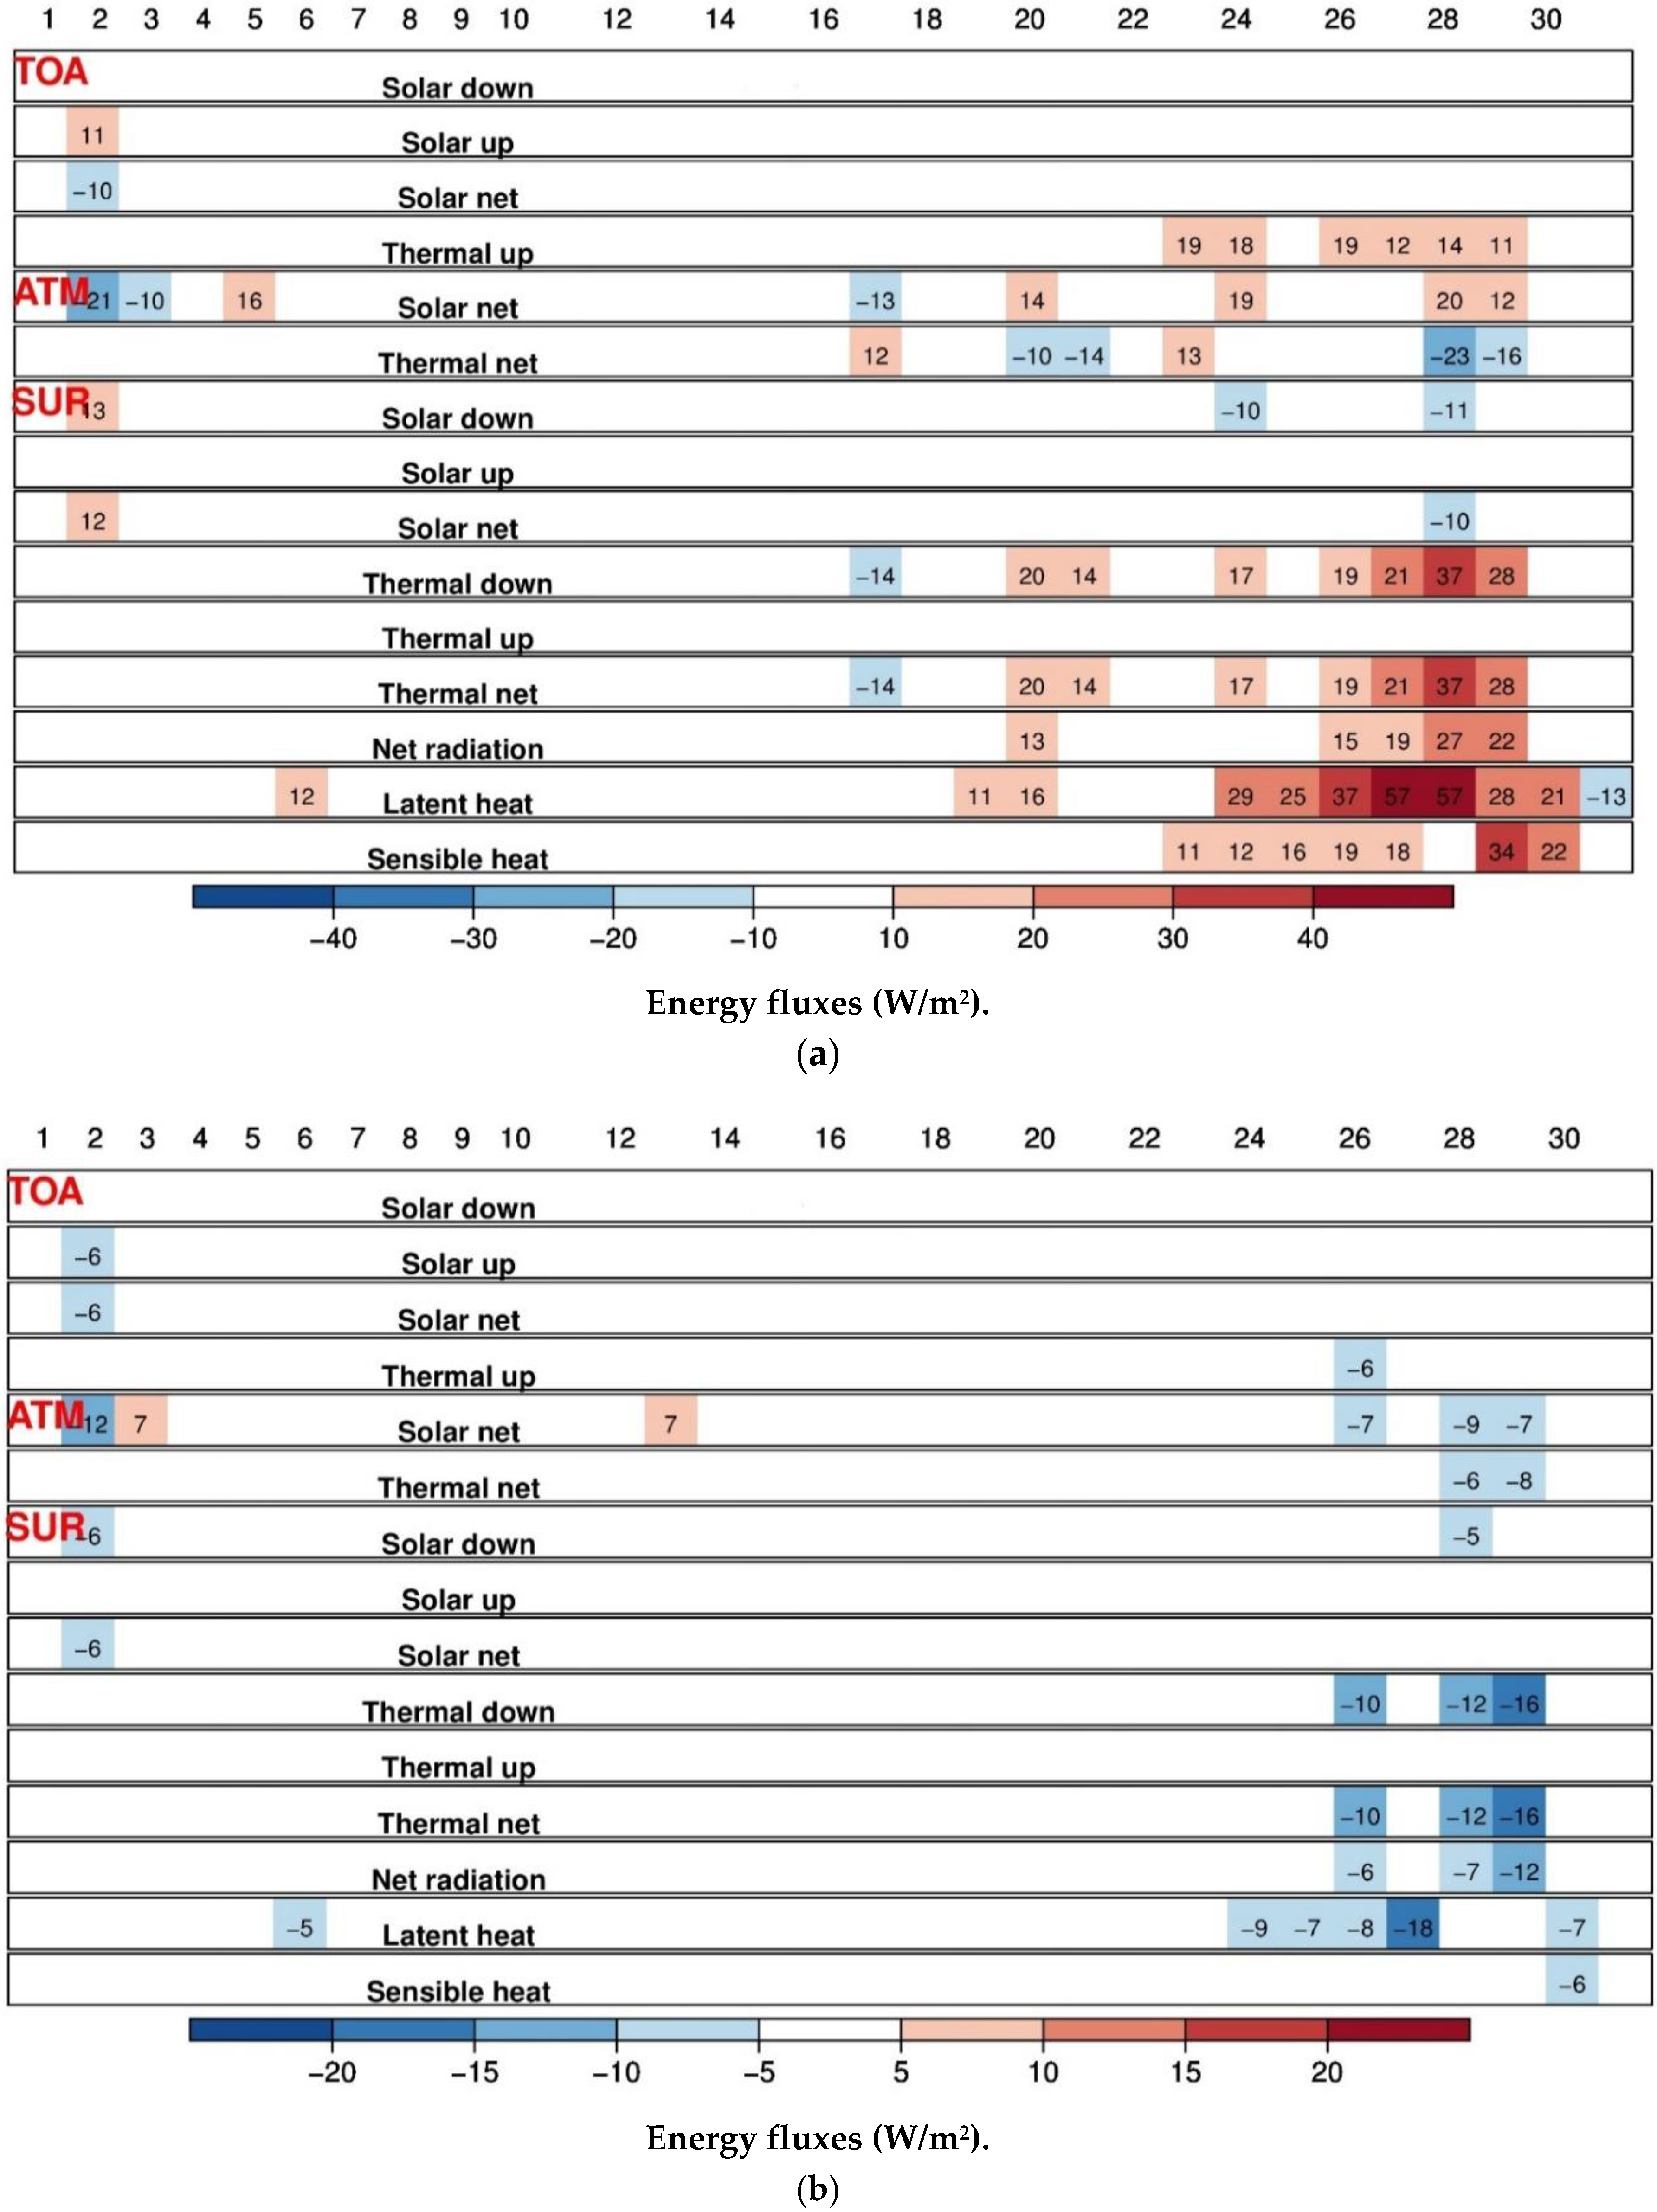
The answer can be found in Figure 14a where the daily differences between CCLM1 and CCLM4 of all energy fluxes from the surface (SUR), through the atmosphere (ATM) to the top of the atmosphere (TOA) are shown. Note that in Figure 14a, only days in October 2013 are displayed with absolute energy fluxes greater than 10 W/m2. In agreement with Figure 13, all surface energy fluxes (except for the net surface solar radiation that is mainly controlled by solar downward radiation) of CCLM1 are larger than CCLM4 during the storm event. Solar radiation differences at TOA are generally smaller than 10 W/m2.
In the atmosphere (ATM) the net fluxes of solar radiation (Solar net) and thermal energy (Thermal net) are calculated in Equation (5) and Equation (6) as following:
Solar   net = Solar   net   at   TOA Solar   net   at   SUR
Thermal   net = Thermal   up   at   TOA Thermal   net   at   SUR
On 28 October 2013, the Solar net and Thermal net differences in ATM are about 20 and −23 W/m2, respectively. The next day, they slightly decrease to 12 and −16 W/m2, respectively. Despite varying magnitudes, the sign of these differences in ATM is opposite to that of SUR, which implies a vertical energy transport from the surface to the atmosphere or vice versa. Once CCLM_ctr generates IV at the surface, for example, due to uncertainty in the parameterization of turbulent fluxes, energy will be transported upward to the atmosphere causing uncertainty in the atmospheric energy balance, and thereby in the air mass characteristics such as temperature and humidity. These, in turn, may result in uncertainty in cloud formation and decay, for instance, cloud initialization and scatter, or in cloud characteristics calculation, for example for cloud base height and cloud thickness, etc. These processes are conducted in the cloud parameterization which is one of the main sources of uncertainty in any model simulation of climate. Bony and Dufresne [81] have identified differences in the representation of low clouds over the subtropical oceans as a possible major source of uncertainty in climate model sensitivity. Uncertainty in the representation of clouds affects net shortwave and longwave radiation at the surface. This is the feedback loop to conserve total energy in the climate system.
One can imagine that the reduction of Thermal net in ATM of CCLM1 compared with CCLM4 may relate to a transformation from thermal energy into dynamical energy, therefore, the wind speed of CCLM1 continues to be larger than CCLM4 up to high levels, as shown in Figure 7. However, this explanation remains to be proven.
In an atmosphere-ocean coupled system such as AHOI, the feedback loop for energy conservation basically exists, but the situation is somewhat different. Here, the ocean surface temperature can be modified when the energy balance is disturbed by the parameterizations toward to conserve the surface energy balance. Therefore, there is much less variability in the entire air column. As an example, Figure 14b shows the difference in the spread of AHOI compared to CCLM_ctr. Here, colors and numbers are only shown for spread differences larger than 5 W/m2. Blue colors indicate that AHOI reduces the spread of CCLM_ctr in ATM and at SUR during the extreme event or that AHOI reproduces a more stable energy balance and, therefore, less uncertainty in the large-scale circulation than CCLM_ctr.
Table 2 provides details of the simulated energy balance components at TOA, ATM, SUR of CCLM and AHOI for 28 October 2013. The energy balance components in Table 2 were created based on the study of Wild et al. (2015). All numbers in the bold format are the larger values for a given variable in a comparison between CCLM_ctr and AHOI. Obviously, in both columns Range and SD (spread), the bold numbers mostly belong to CCLM_ctr indicating its larger IV. Range is calculated as the difference between the maximum and minimum of the six ensemble members for a given variable.
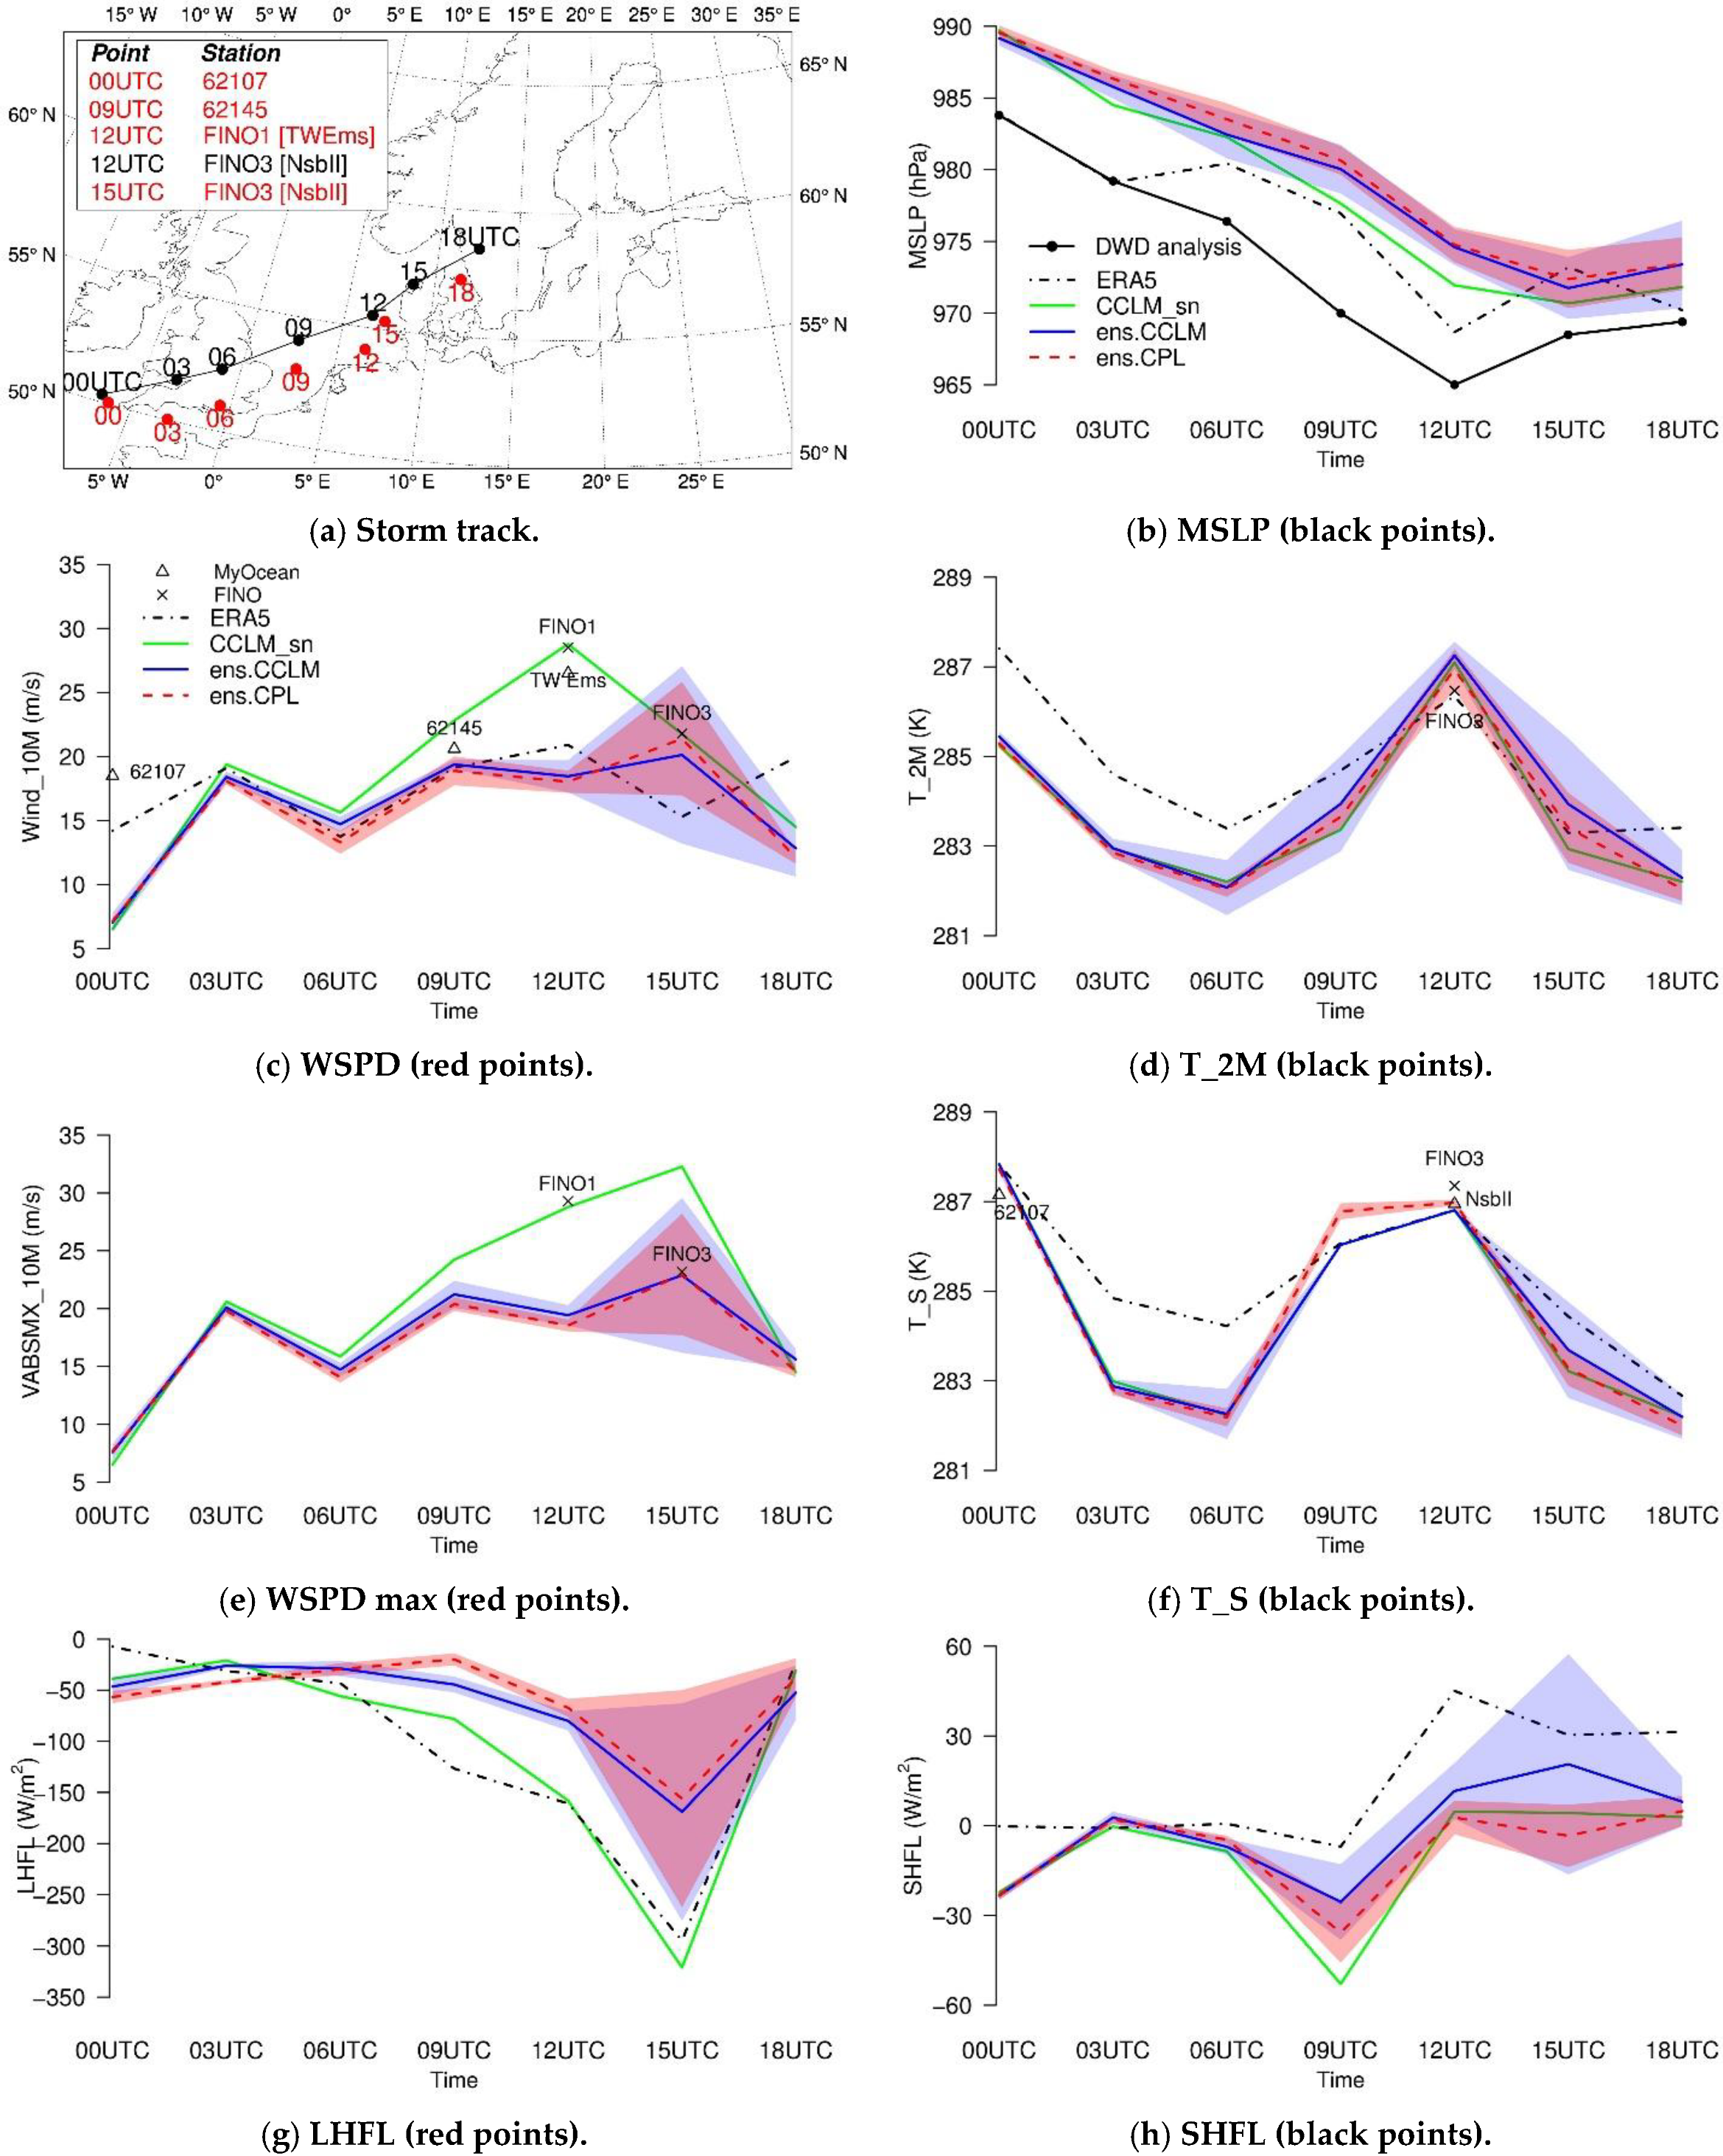
The smaller IV of the large-scale circulation in AHOI might contribute to a more robust simulation of the storm Christian. For example, Figure 15 shows the three-hourly evolution of observed and simulated MSLP, surface temperature and sensible heat fluxes along the storm track (Figure 15b,d,f,h) as well as wind speed at 10-m height and latent heat fluxes at the southwest of the storm center (Figure 15c,e,g).
Figure 15a displays the track of the Christian storm (black line) according to an analysis by DWD and locations at the southwest of the storm center where the maximum wind speed might appear (red points). Some red points such as at “00UTC”, “09UTC”, “12UTC” and “15UTC” are selected at the observation stations belonging to two data sets GTS (e.g., 62,107, 62,145, TW Ems, NsbII) and FONA3 (FINO1, FINO3). The storm tracks are simulated rather well by CCLM, CCLM_sn and AHOI (Figure S4). This result is similar to the findings of von Storch et al. [82] who analyzed a simulation of an older version of CCLM obtained by downscaling NCEP/NCAR Reanalysis 1 and using the SN technique.
In Figure 15b, CCLM has a larger spread than AHOI although ens.CPL is similar to ens.CCLM. MSLP in the storm center of CCLM_sn is closer to ERA5 and DWD analysis than ens.CCLM and ens.CPL. However, MSLP of CCLM_sn is still overestimated by about 3–8 hPa compared with the DWD analysis. The MSLP overestimation of uncoupled CCLM and AHOI is about 4–11 hPa. In this figure, MSLP of ERA5 is larger than the DWD analysis and all CCLM experiments are close to the ERA5 forcing after 03 UTC.
Figure 15c shows the three-hourly evolution (along the path of the red points) of the hourly mean 10-m wind speed simulated by CCLM together with the ERA5 data and measurement at several platforms. TW Ems, FINO1 and FINO3 platforms are located very near the eyewall of the storm when it passed over the North Sea at 12 and 15 UTC. Overall, wind speed at 10-m height of AHOI is similar to CCLM_ctr before 12 UTC but has less spread from 12 to 18 UTC when the storm reached its strongest intensity. Meanwhile, the ensemble mean of AHOI (ens.CPL) is almost the same as ens.CCLM. They are both close to CCLM_sn until 09 UTC when they capture well the observation at the station 62145. Then they underestimate the wind speed of CCLM_sn and the measurements at FINO1 and TW Ems by about 10 m/s at 12 UTC when the storm got mature. At 15 UTC, ens.CCLM, ens.CPL and CCLM_sn reproduce well the observation at FINO3 while ERA5 underestimates by about 7 m/s compared to FINO3. ERA5 wind speed reaches the peak at 12 UTC and reduces quickly at 15 UTC, then increases at 18 UTC to be larger than all the CCLM simulations. CCLM_sn has a peak at 12 UTC and reduces after that. AHOI and CCLM_ctr missed the peak at 12 UTC but have the maxima at 15 UTC, then the wind got weaker from that on. The differences in the behavior of ERA5 and CCLM simulations are associated with the different propagation speed of the storm in each data, which can be seen partly in Figure 9. The different behaviors of ERA5 and CCLM originate from different resolutions and from the data assimilation utilized in ERA5. ERA5 comprises the most elaborated 4D-VAR system but has a coarser resolution than CCLM, therefore, ERA5 can capture rather well the timing of the wind speed peaks but underestimates the peak magnitudes. CCLM_sn nudged toward ERA5 and has a finer resolution, therefore, can capture well both the timing and the magnitude of the wind speed peaks. However, without SN, CCLM cannot reproduce well the peak at 12 UTC as the propagation speed is slower than ERA5. A higher resolution, e.g., 2 or 3 km, is necessary for CCLM to be able to simulate such a fast-moving storm.
For maximum wind speed (Figure 15e), unfortunately, data from DWD and ERA5 are unavailable for the comparison. Instead, hourly maxima of the 10-min sustained wind speed from FINO1 and FINO3 are plotted. Again, CCLM_sn captures well the strong wind at 12 UTC at FINO1, but at 15 UTC it overestimates the maximum wind speed by about 8 m/s at FINO3. This overestimation makes the peak of CCLM_sn appear at 15 UTC instead of at 12 UTC, as in Figure 15c. Similar to Figure 15c, the spread of the maximum wind speed of AHOI is similar or smaller than that of CCLM_ctr while ens.CPL is almost the same as ens.CCLM. AHOI and CCLM_ctr are both often smaller than CCLM_sn but also reach the peak at 15 UTC as CCLM_sn. This strong wind speed induces a larger latent heat flux at 12–15 UTC in all experiments (Figure 15g). Albeit CCLM_sn uses the same ERA5 SST as CCLM_ctr, due to the stronger wind speed CCLM_sn produces large latent heat fluxes (of about −150 W/m2 and −320 W/m2 at 12 UTC and 15 UTC, respectively) which is rather close to ERA5. Whereas, for AHOI and the CCLM_ctr ensemble means these amounts are about −60 W/m2 and -160 W/m2, respectively. At 15 UTC, AHOI has a similar spread as CCLM_ctr and the spread can reach −270 W/m2 to be close to CCLM_sn and ERA5 although the ensemble means are about 100 W/m2 smaller. Surprisingly, the wind speed of ERA5 at 15 UTC is smaller than at 12 UTC and 18 UTC, but the maximum latent heat flux is at 15 UTC as for all CCLM experiments.
Along the storm track, or at the black points in Figure 15a, although the T_2M ensemble means of AHOI and CCLM_ctr are similar, AHOI has a smaller spread (Figure 15d). All experiments are about 2 °C lower than ERA5 before 12 UTC and at 18 UTC while larger by about 0.5–1 °C during 12–15 UTC. AT 12 UTC, CCLM simulations are about 0.5–1 °C larger than FINO3 while ERA5 agrees with the measurement. A similar result can be seen while looking at T_S in Figure 15f. However, at 09 UTC when the storm started to get matured quickly and the storm center is located over the southwest North Sea, AHOI SST ensemble mean is about 0.5–0.7 °C larger than the ERA5 SST used by CCLM_ctr. Here, AHOI SST spread is almost zero. At 12 UTC, AHOI and CCLM (or ERA5) are very close to observations at station NsbII and FINO3.
The sensible heat flux spread of AHOI is similar to the uncoupled CCLM at 09 and 12 UTC (over sea points) but much smaller at 15 and 18 UTC over land points in Denmark and Sweden (Figure 15h). For example, CCLM_ctr has a large spread of about 70 W/m2 at 15 UTC while AHOI spread is about 20 W/m2. Ensemble mean of sensible heat flux of AHOI is closer to CCLM_sn and both are more negative of about 20–30 W/m2 compared to the CCLM_ctr ensemble mean. Meanwhile, ERA5 sensible heat flux varies in a range of 0–45 W/m2 from 00 to 18 UTC showing a shift of about 40–50 W/m2 higher than CCLM_sn and the AHOI ensemble mean. Unfortunately, no measurement of sensible heat fluxes and only a few data of T_2M and T_S are available on this day over these points to enable us to validate the experiments and also ERA5.
The analysis for Figure 15 allows us to say that during the storm event, CCLM_ctr is more uncertain than AHOI over land, while over sea, the uncertainty of AHOI is often smaller or similar to CCLM_ctr with the ensemble mean of AHOI being often closer to ERA5 and/or observation.
Section 3.1 and Section 3.2 have provided evidence that during the time of the storm Christian, the coupled system AHOI could reduce the IV of CCLM_ctr in air pressure, wind speed, and energy balance over the entire NS_BS domain. The IV in the energy balance over NwgSea is associated with uncertainty in the simulation of clouds. In addition, the reduction of the IV of AHOI over NwgSea was found to be linked with the reduction of the IV of skin temperature over the NoEU area, which is partly attributed to less uncertainty in cloud cover of AHOI. In the next section, the IV of simulated clouds, precipitation, runoff, and salinity will be analyzed.

3.3. Clouds, Precipitation, Runoff and Salinity

3.3.1. Clouds

Clouds comprise some of the most complicated natural processes in the climate system. Clouds have non-linear interactions with other processes, such as radiation and precipitation. For example, clouds have both positive and negative feedbacks to temperature via interactions with longwave and short-wave radiation. Therefore, the parameterization of clouds is a big challenge for any climate modeler. To parameterize cloud physics in climate models, many empirical parameters have to be used that make cloud parameterizations a major source of uncertainty in the climate models.
The previous sections showed that the reduction of IV of AHOI in air pressure, wind, and energy balance is partly due to the reduction of uncertainty in the simulated cloud cover during the extreme event of the storm Christian. Nevertheless, on other days of the considered time period, uncertainty in the cloud simulations of AHOI can be as large as in CCLM_ctr. Considering the NS_BS sub-domain (such as in Figure 5), the IV of clouds in AHOI is sometimes smaller, sometimes larger than that of the stand-alone CCLM (not shown). It is hard to say which model (CCLM_ctr or AHOI) has better cloud simulations.
One more thing that makes the evaluation of simulated clouds difficult is a lack of precise cloud observation. Before the existence of satellite products, cloud cover was estimated by eyes. Nowadays, satellite products could be a good “observation” of clouds which can be used to assess model simulations. However, one should keep in mind that measurements of satellites also include uncertainty (e.g., [83]).
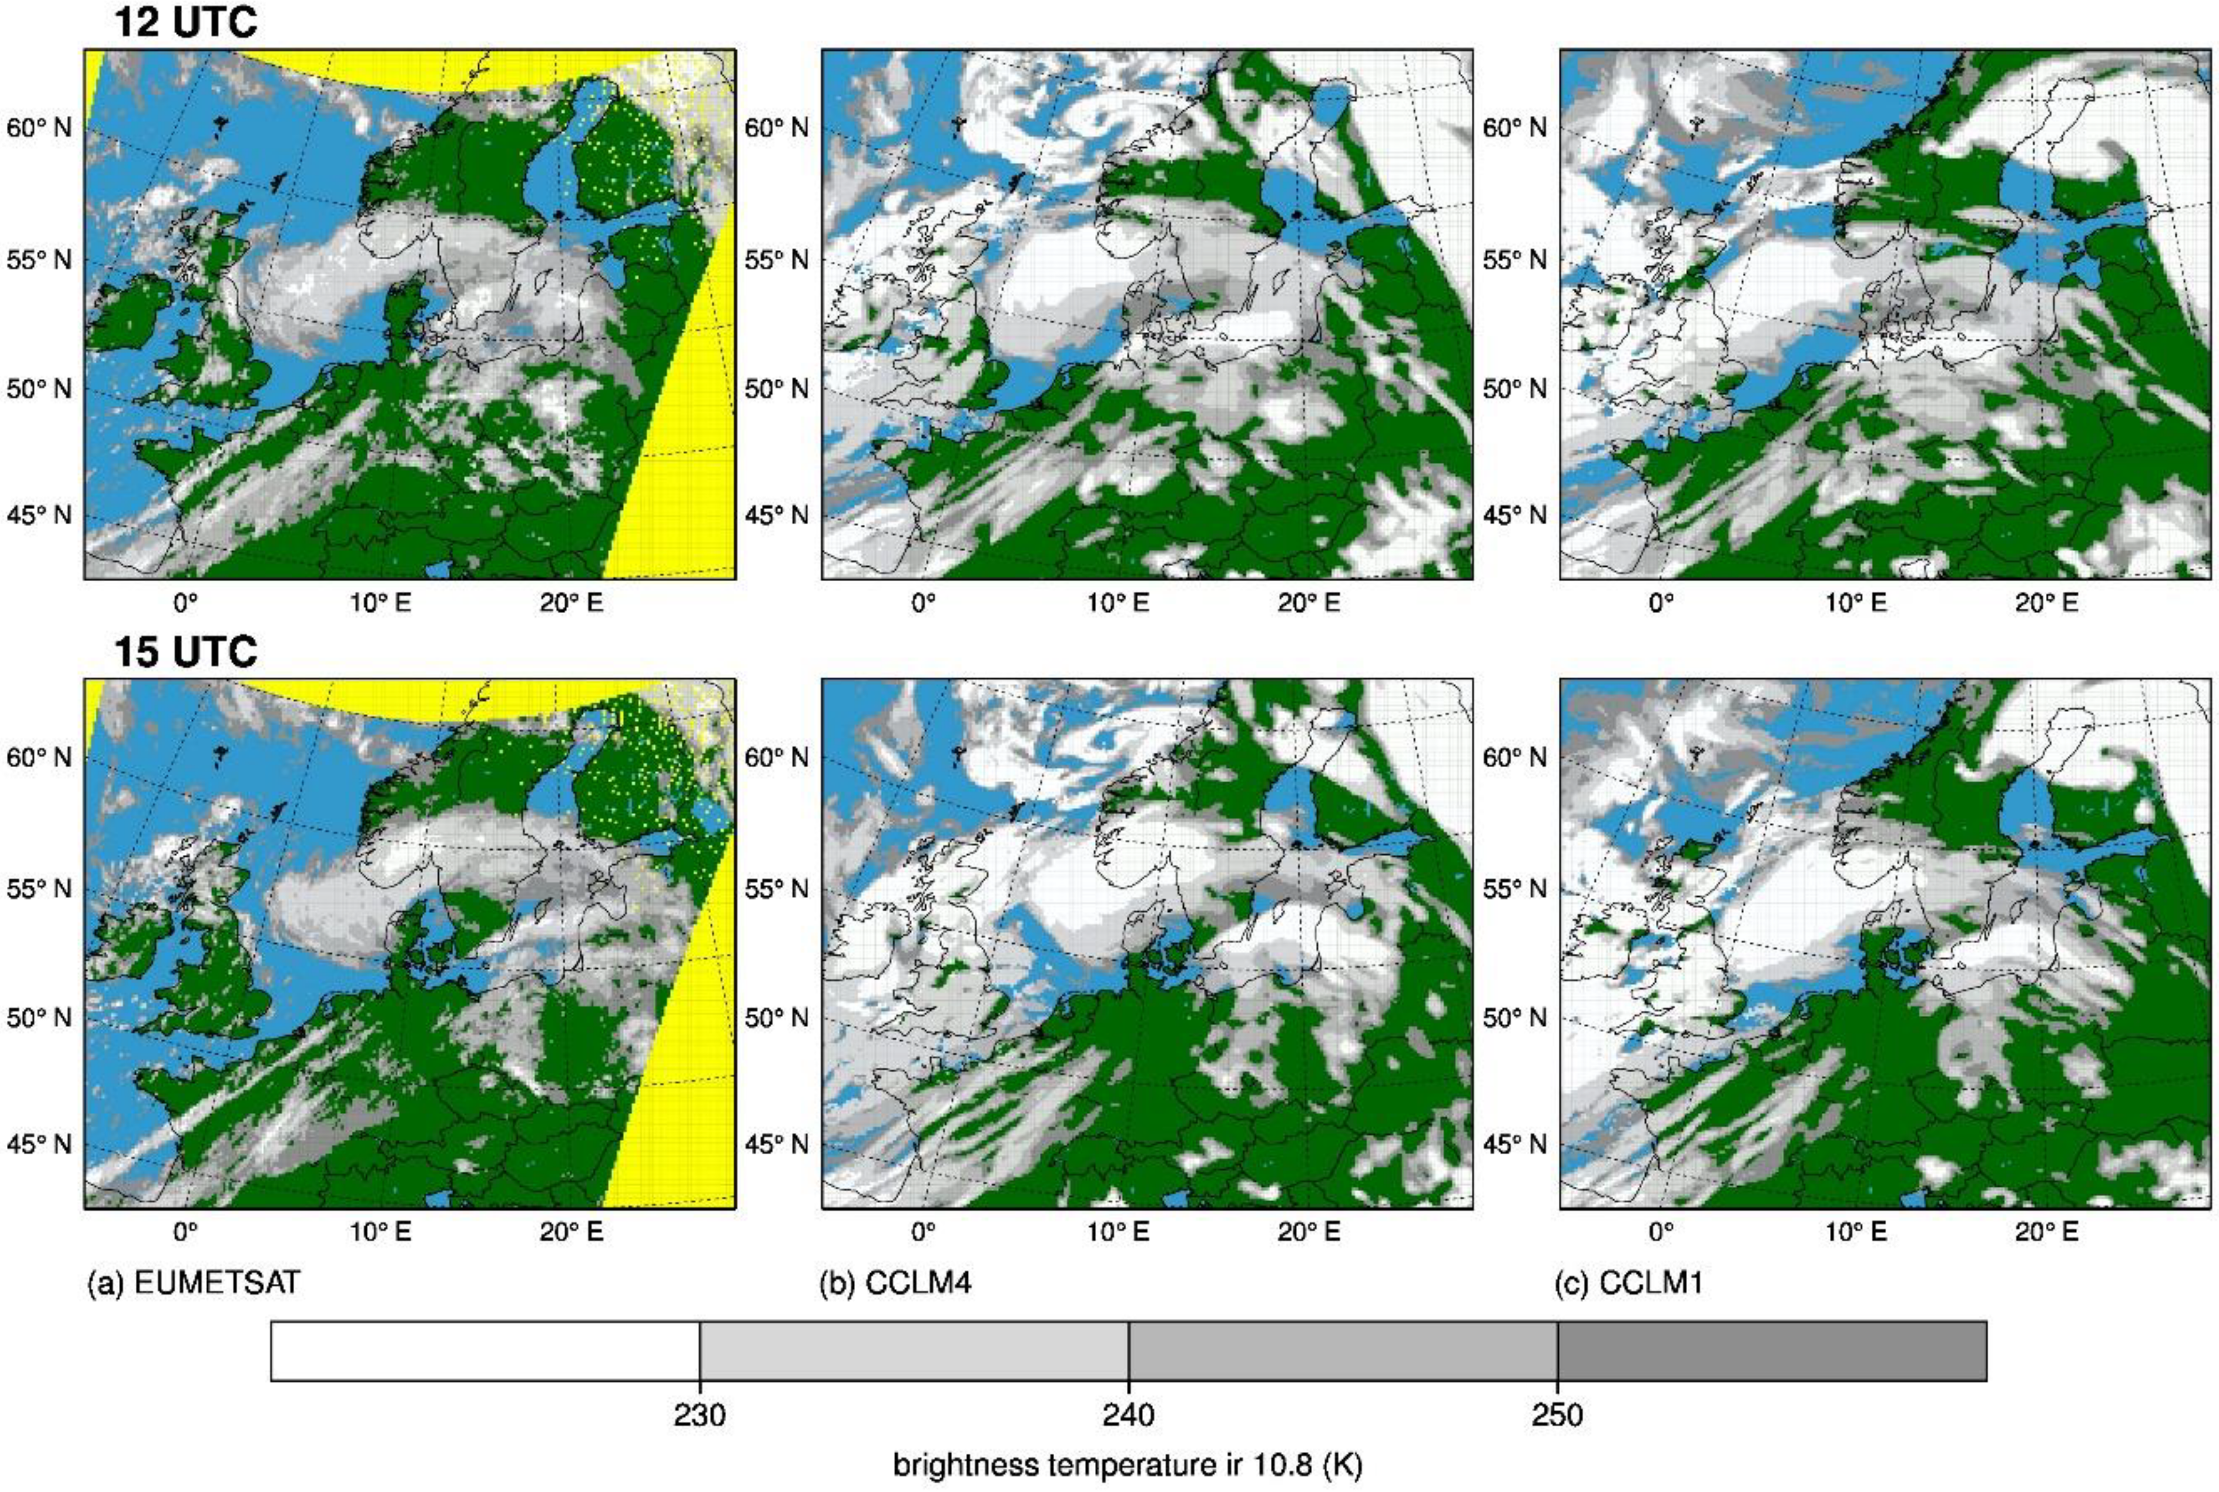
For the storm Christian, cloud structures of CCLM_sn, CCLM1, CCLM4, and CPL0 are compared with the EUMETSAT data which are able to remotely measure cloud characteristics (Figure 16). The 10.8 µm window channel is known to sufficiently investigate the brightness temperatures of clouds in the mid-latitudes [84] and allows estimating the cloud-top temperatures. To compare with model data, a radiative transfer algorithm (RTTOV-library) [85] was applied during the simulations to “emulate” the satellite retrieval within the model’s atmosphere. The brightness temperature from EUMETSAT satellite retrievals is used to compare with the synthetic product derived from the CCLM model output. As the simulated brightness temperatures of CCLM_sn, CCLM4, and CPL0 are relatively similar, Figure 16 only displays the simulation of CCLM4 against CCLM1 in comparison with EUMETSAT data.
The major stage of storm Christian on 28 October 2013 at 12 and 15 UTC is shown in Figure 16 top and bottom panels, respectively. A warm-front is wrapped around the center of Christian, which can be seen in the observations by the arc-shaped cloudiness extending from the North Sea over southern Scandinavia to northern Poland (Figure 16a). At 12 UTC, the cloud spiral passage of the storm Christian is on the eastern coast of England and moves eastward to the middle of the North Sea at 15 UTC. To the south of the sub-domain, a cloud-band oriented from South-West Europe to Central Europe is associated with a wavy frontal system ahead of a longwave trough. Some cloud structures appear to the northeast of the sub-domain due to activity at an already occluded front.
At first glance, CCLM tends to overestimate the brightness temperatures and thus the cloud-top temperatures, also for the frontal cloudiness at Christian (Figure 16b,c). The reason is very likely the systematic overestimation of high-level cloud-ice content in the CCLM model as analyzed by Böhme et al. (2011). Furthermore, the convective cloud structures west of England, formed by instability in the very unstable sub-polar air mass approaching at the rear side, are heavily overestimated in spatial size. This may be caused by the coarse grid resolution of the experiments.
Despite the brightness temperature overestimation, the location of the warm front is rather well reproduced by CCLM4 (Figure 16b) as well as by CCLM_sn and CPL0 (not shown) at both time slices. This warm front was not clearly seen in CCLM1 due to an overestimation of the brightness temperatures over Great Britain and the North Sea (Figure 16c). The misplaced cloud spiral passage of CCLM1 is due to the slower propagation speed of the storm Christian, as analyzed in Figure 9. Besides, CCLM1 produces almost no clouds over the NwgSea (as shown in Figure 13c,d).
The relative topography 500/900 hPa (a precursor for the location of fronts, not shown) indicates a shift of the warm-conveyor belt to the west by 50 km and more in CCLM1 than CCLM4, which also can be seen in the synthetic satellite product by comparing lower brightness temperatures in Figure 16b with Figure 16c. Moreover, the jet appearing at the southern flank of the warm-conveyor belt is slightly broader for CCLM1 compared to the others. As a consequence, the strong wind speeds transported from the upper troposphere downwards into the near-surface levels are not only shifted to the west in CCLM1 compared to the other experiments (Figure 10), but also the peak wind region is slightly broader in CCLM1.
This example provides evidence that simulated cloud structures can vary quite a lot from one experiment to another, showing the high sensitivity of the climate model to the cloud parameterization.

3.3.2. Precipitation, Runoff, and Salinity

The monthly ensemble mean precipitation of CCLM_ctr and AHOI are compared with the EOBSv18.0 data for September–December 2013 over the NS_BS sub-domain. In general, CCLM and AHOI both underestimate rainfall by about 1–4 mm/d over British Isles, Central Europe, Poland, and the Norwegian coastal zone but overestimate by a similar amount over Scandinavia and East Europe. Differences between AHOI and CCLM_ctr are about 0.5–1 mm/d. A slight bias reduction of about 0.3–0.5 mm/d of AHOI is found over Scandinavia and the Norwegian coastal zone.
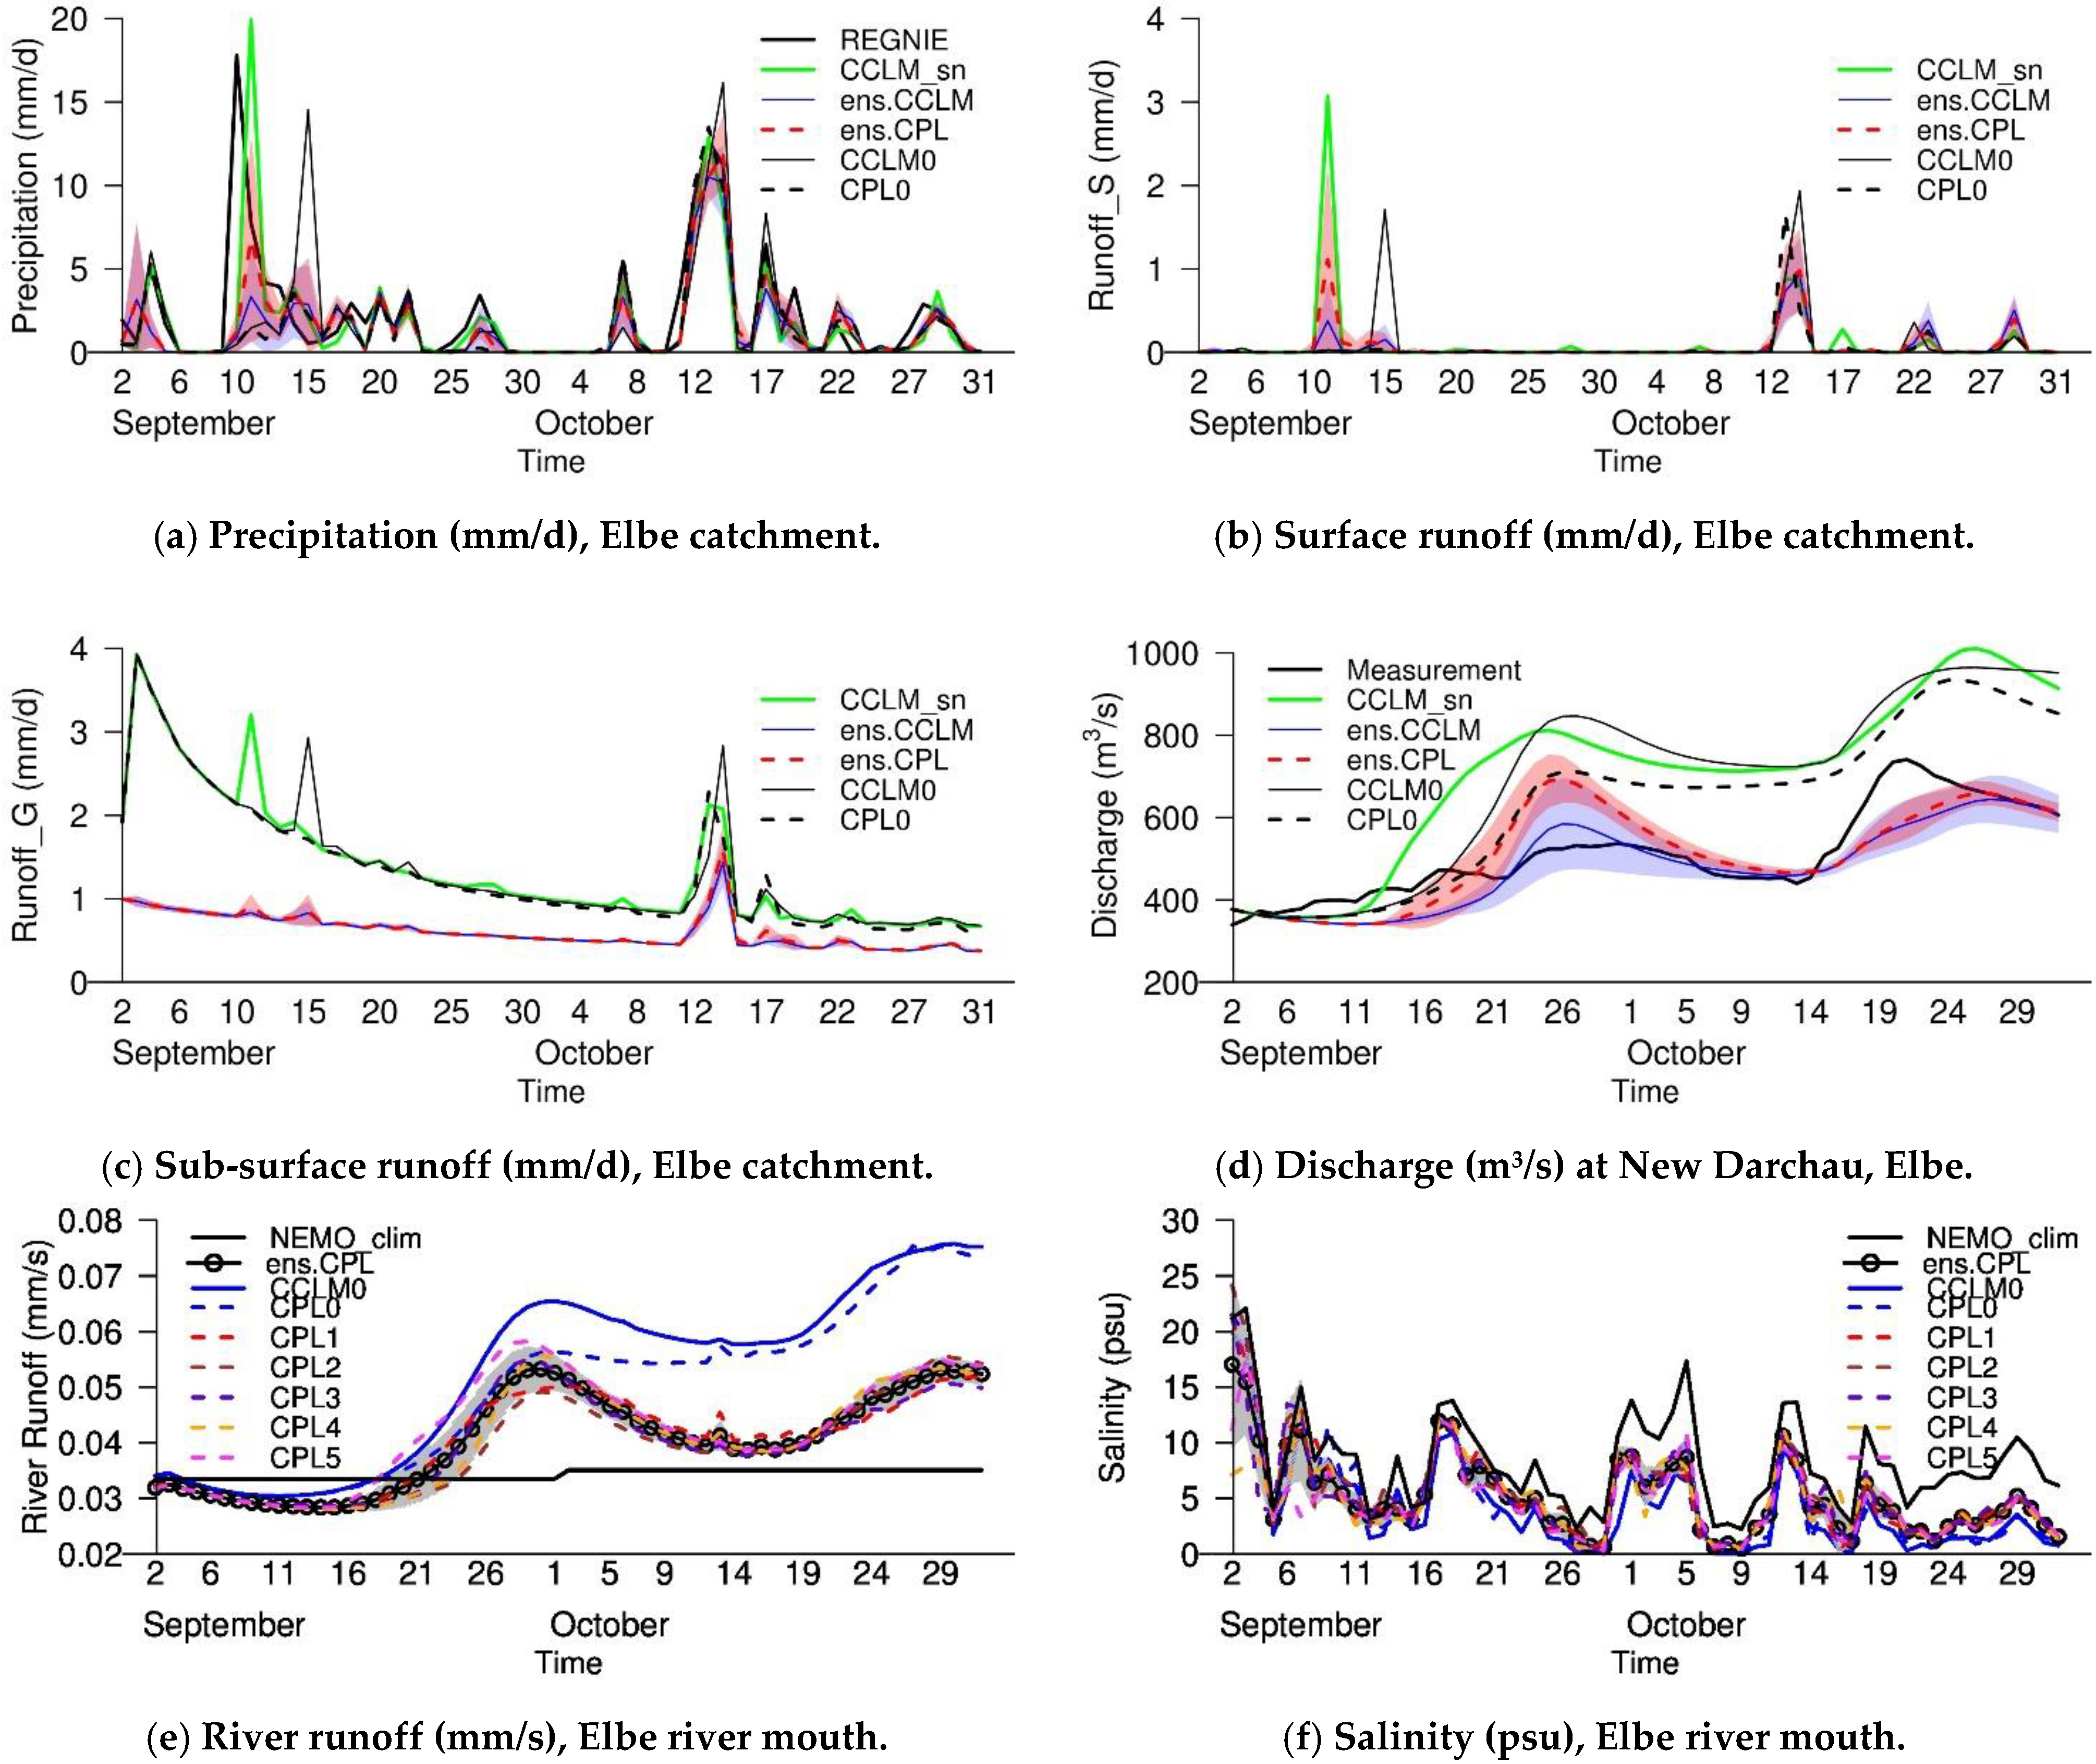
In this section we focus on an analysis of IV of precipitation simulated over the Elbe catchment for September and October 2013 together with surface and sub-surface runoff from CCLM, Elbe river discharge at the location of most downstream measurement stations (from HD) and the river mouth (on NEMO grid), and salinity near the river mouth from NEMO. Conducting the analysis for the Elbe catchment was done to give an example of how the uncertainty in precipitation from the atmosphere may affect the uncertainty in the runoff on land and the salinity in the ocean in a large river basin. A more thorough analysis of other catchments is planned for future studies.
As CCLM_sn, CCLM0, and CPL0 start on 1 September while CCLM1-5 and CPL1-5 start on 1 August, Figure 17 shows the spreads of five members (i.e., CCLM1-5 and CPL1-5) together with CCLM_sn, CCLM0 and CPL0 in order to separate the effect of spin-up on these considered variables. Note that for other variables such as MSLP, temperature, etc. analyzed in previous sections, the spreads of the five members are similar to those of the six members.
Figure 17a shows the daily precipitation averaged over the Elbe catchment on the HD model grid. The time series comprises two major rainfall periods around 9 and 10 September and 11–13 October. Note that the storm Christian (27–29 October) led to relatively low precipitation amounts over the Elbe catchment. For the first major period, the rainfall peak of 18 mm/d in REGNIE data on 9 September is delayed one day in all experiments, and the spread of ens.CPL is almost twice as large as for ens.CCLM. By ignoring this one-day delay, simulated rainfall of experiments on 10 September are compared with the observed peak on 9 September. CCLM_sn provides the rainfall amounts of 20 mm/d, overestimating 2 mm/d compared to the REGNIE data. CCLM_ctr has an ensemble mean of 3 mm/d and the upper range of the spread is 6 mm/d. Meanwhile, AHOI ensemble mean is 7 mm/d and the upper range of the spread is 13 mm/d. It seems that the timing and location of this rainfall event over the Elbe catchment comprise a large stochastic component so that only some members may capture the event. Thus, on the one hand, the larger variability of AHOI could be an indication of a better capturing of the event by AHOI than by CCLM_ctr. On the other hand, the event is just about ten days after the starting/restarting point of 1 September, thus, the spread of CCLM could be affected by the spin-up.
An opposite behavior is seen around 15 September, a few days after the first event, where the much larger variability in ens.CCLM (mainly due to the CCLM0) is an expression of the erroneous overestimation of rainfall. Moreover, during the second period (11–13 October), ens.CPL has a lower variability than ens.CCLM and is closer to the observed rainfall. In addition, several smaller rainfall events can be identified where the IV is almost as large as the total precipitation amount during these events (3 September, 27 September, 7 October, 19 October), but where the spreads are similar for both ensembles.
The variability of surface runoff (Figure 17b) is primarily induced by the variability of precipitation. In principle, the more saturated the soil is the more surface runoff is generated during a rainfall event and, hence, the more variability is transferred from precipitation to the surface runoff. For drier soils, more rainfall water is infiltrated into the soil and, hence, surface runoff is lower and less variable. As rainfall spread in the first rainfall period is larger in ens.CPL than in ens.CCLM, the spread of ens.CPL surface runoff is more pronounced than ens.CCLM. On 15 September, the surface runoff of CCLM0 is much larger than the other experiments due to its precipitation overestimation. For the second major period, the spreads in surface runoff are similar for both ensembles with a bit larger spread in CCLM_ctr due to CCLM0. Figure 17b also shows that in the CCLM soil scheme, only the largest rainfall events lead to surface runoff, which might indicate an underestimation of surface runoff for medium rainfall events.
Sub-surface runoff (Figure 17c) is mainly controlled by soil moisture content. As the variability of soil moisture is relatively low compared to the variability of precipitation, the variability of sub-surface runoff is also rather low. Figure 17c also shows that for sub-surface runoff, the initial soil moisture state is much more important than the IV of precipitation. The soil moisture contents of CCLM0, CPL0, and CCLM_sn are differently initialized than for the two ensembles and, therefore, their sub-surface runoff strongly deviates from the two ensembles. The stronger decline shows that these experiments are in a spin-up phase where the soil adjusts itself to the equilibrium state that characterizes the climate conditions of the considered year and month. To avoid this spin-up effect, longer simulations prior to the considered time period would be required with the coupled system.
The discharge (Figure 17d,e) comprises signals from both surface and sub-surface runoff with shorter and longer response times, respectively. The average travel time of water in the Elbe river network is about two weeks until the measurement gauge at New Darchau (www.elbe-datenportal.de). This means that the response time of discharge at the river mouth to events/peaks in surface runoff is about two weeks, while the response to sub-surface runoff happens on longer time scales. The spreads in AHOI and CCLM both start to grow around 13 and 17 September, respectively, several days after the first major rainfall period happened, continue for about two weeks until 25 and 27 September, respectively (Figure 17d). Then they reduce from that on until 14 October after the second major rainfall event happened, then increase again for another two weeks and then decrease afterward. Similar to surface runoff, the spread of discharge in AHOI is larger than in ens.CCLM during 14–20 September due to the larger spread of surface runoff in the first rainfall event. Otherwise, the spread of AHOI discharge is smaller than ens.CCLM. Compared to the measurement, most of the experiments overestimate the first discharge peak around 26 September, except some of CCLM_ctr which underestimate the first peak. During the time between two peaks, the observed discharge is captured rather well by ens.CPL and ens.CCLM, meanwhile CCLM_sn, CCLM0, and CPL0 overestimate about 200–300 m3/s due to short spin-up time. The second discharge peak around 20 October is still overestimated by CCLM_sn, CCLM0, and CPL0 but underestimated by ens.CCLM and ens.CPL which may be related to the second major rainfall period being underestimated in the ensembles. This different behavior of the ensembles in the two events is likely related to the different length of precipitation events and may indicate weaknesses of the surface runoff/infiltration calculation in CCLM. In the first period, the rainfall is mainly occurring within one day, probably creating too much surface runoff that results in the overestimation of the discharge peak. For the second period, rainfall is distributed over several days. The underestimation and the delayed occurrence of the related discharge peak, as well as a noticeable sub-surface runoff peak, indicate that too much rainfall is infiltrated into the soil, and, hence, too little surface runoff is generated. A deeper analysis of this potential weakness of CCLM’s soil scheme is beyond the scope of the present study.
In addition, the spin-up trend in sub-surface runoff is noticeably affecting the discharge for CCLM_sn, CCLM0, and CPL0, especially after the first discharge peak. Here, their simulated discharges reach overestimations of more than 50%, while the two ensembles come close to the observed discharge in between the two discharge peaks.
The discharge at the river mouth (Figure 17e) is lagged several days compared to the discharge at New Darchau (Figure 17d) but has similar behavior. In Figure 17e,f, NEMO_clim refers to the stand-alone ocean NEMO model forced by CCLM0 with climatological runoff forcing and CCLM0 refers to the stand-alone NEMO forced by CCLM0 with discharge from HD. Obviously, the climatological runoff cannot capture the peaks shown in the experiments and is always smaller than the experiments after the first event (Figure 17e). As a consequence, salinity at the river mouth of NEMO_clim is often larger than CCLM0 and AHOI (Figure 17f). Salinity (AHOI only) has a large variability at the beginning of the simulation period, which is likely related to model-spin-up, but then it reduces with time. CCLM0 and CPL0 have smaller salinity than CPL1-5 because of the larger runoff (Figure 17e). For both discharge and salinity, all coupled experiments converge towards the end of October 2013 (Figure 17d–f).
An overview of the IV links in CCLM_ctr and AHOI ensembles is provided in Table 3. Here, the correlation of daily spreads between two variables is calculated over the NS_BS domain for the period of 1 September–31 December 2013. It can be seen clearly that the considered correlations of AHOI are often similar or larger than those of CCLM_ctr. Thus, it can be said that the reduction of uncertainty in large-scale circulation (air pressure, wind) in the coupled system model leads to a more robust simulation of temperature and precipitation over the European continent compared with the uncoupled atmospheric model CCLM.

4. Discussions and Conclusions

In the present study, we introduce a new AORCM, the GCOAST system, for climate simulations over the EURO-CORDEX domain with a focus on the North Sea and Baltic Sea regions. We analyze the IV of a sub-set of GCOAST, the AHOI coupled model, in a comparison with the stand-alone atmospheric model CCLM which is the atmospheric compartment of AHOI to find out if there is a potential benefit of air-sea coupling.
Overall, common results between AHOI and CCLM_ctr are: (1) Mean states of most of the variables of AHOI and CCLM_ctr are similar with a slight improvement in AHOI, an example is the monthly mean MSLP shown in Figure 4, and (2) AHOI and CCLM_ctr have a common spin-up time of about 5–10 days for all variables such as MSLP, wind velocities as well as land surface and near surface air temperatures. After the spin-up time, CCLM often has a larger spread than AHOI, in particular during the storm Christian that occurred on 27–29 October 2013. SST of AHOI is higher by about 0.5 °C compared with ERA5 SST for the whole simulation period, showing a warmer or more active ocean in AHOI than in CCLM_ctr.
In order to understand the different behaviors of AHOI and CCLM_ctr, we first determine potential sources of uncertainty in CCLM_ctr and investigate the air-sea coupling effect on these uncertainty sources. Note that we use the term uncertainty as a synonym for the ensemble spread. As a summary, the results of the present study lead to the following conclusions.
(1) Internal variability of the stand-alone CCLM:
CCLM_ctr has a relatively large spread between its six ensemble members (CCLM0-5) during extreme events, which can be seen for many variables. The disturbance introduced to the RCM in the ensemble generation procedure, the lacking dampening of fluctuations at the air-sea interface of the uncoupled RCM and the energy-cloud feedback lead to the relatively high sensitivity of CCLM_ctr. Consequently, parameterizations of surface turbulence and clouds are major sources of uncertainty. Our study highlights the role of cloud parameterization as the related uncertainty of CCLM_ctr. The uncertainty in cloud parameterization could cause uncertainty in simulations of cloud cover and radiative transfer processes that result in an uncertainty in the energy budget, temperature, and humidity of an air mass. As a consequence, an uncertainty in air pressure and wind speed on the regional scale is caused which in turn could modify the large-scale circulation. When the large-scale circulation is modified, locations of low and high-pressure centers are shifted and might have an effect on storm path as well as propagation speed and intensity.
While the large thermal radiation uncertainty in CCLM can be attributed to the uncertainty in cloud parameterization, the latent heat flux uncertainty is strongly associated with uncertainty in wind speed and direction, which depend on the temperature gradient. For the temperature gradient, the land-sea interaction plays an important role. The larger spread of land surface temperature in the uncoupled CCLM caused a stronger land-sea temperature contrast.
We also found that the dynamics over the ocean surface of the Norwegian Sea (NwgSea area) are linked with those over land of northern Europe (NoEU area) during the storm Christian. This link is indicated by relatively high correlations (about 0.6 and 0.7) between the spread of air pressure over the NwgSea area and the spread of surface temperature, cloud cover, and long-wave downward radiation over NoEU land.
(2) Internal variability of the coupled model GCOAST-AHOI:
The six members of the coupled model AHOI show a smaller spread than those of CCLM_ctr in air pressure, wind speed, temperature, energy budget and cloud cover in general and more pronounced during the storm Christian. The major effects of air-sea coupling can be pointed out from the results of the current study. First, the reduction of IV can be seen clearly over the ocean where the coupling has been conducted to enable the interaction of the atmosphere with the underlying ocean. Averaged over the considered time period, the ocean in AHOI is warmer than ERA5 by about 0.5 °C, mainly over the North Atlantic, NwgSea and the northwest North Sea. The warmer ocean, or in other words a more active ocean, in AHOI keeps the energy budget of the climate system in balance. The air-sea interaction allows the SST to adapt by changes in the surface energy balance, which could help to reduce the uncertainty in the atmosphere.
The second effect of air-sea coupling is to reduce uncertainty over land. The reduced uncertainty over land in AHOI is due to the overall stabilization effect of the coupling on large-scale circulation. Less uncertain simulations of the atmospheric large-scale circulation trigger less uncertain simulations of precipitation and, therefore, surface temperature over land, which, in turn, reduces the land-sea temperature contrast. The correlation coefficients between the daily spreads of MSLP, wind speed, cloud cover, land surface temperature, and precipitation are equal or higher than for CCLM_ctr.
Moreover, AHOI, in general, reproduces better characteristics of the storm Christian, such as propagation speed and intensity, than the uncoupled CCLM. Along the storm track, spreads in MSLP, 10-m wind speed, sensible heat flux, 2-m air temperature, and surface temperature of AHOI are smaller than for CCLM_ctr. The ensemble means of these variables of AHOI tend to be closer to the reference experiment CCLM_sn than those of CCLM_ctr.
Besides, we found two tele-connections where the NwgSea is influencing the climate over other areas during the storm Christian event: (1) Interaction between the low Burkhard over the NwgSea and the low Christian over the North Sea and (2) links between the dynamics over the NwgSea ocean surface with those over land of northern Europe. These tele-connections provide evidence for the necessity of including the NwgSea as well as a marine region further to the west in the North Atlantic into the ocean model domain in a coupled RCM setup for Europe, such as done in the present study. Our findings support the related recommendation of Ho-Hagemann et al. [29,30], who already stated that considering only the North Sea and Baltic Sea (such as in NEMO_Nordic [67]) is not sufficient to reproduce relevant tele-connections.
Many studies showed that SN could reduce IV of RCMs and usually lead to good simulations of variables that are strongly influenced by the large-scale circulation (e.g., air pressure, wind speed, temperature, and humidity), which is also the case for our reference experiment CCLM_sn. However, SN also has the disadvantage: The performance of RCMs using SN strongly depends on the forcing so that climatic features, which are impacted by local-scale processes and characteristics, may be suppressed. It is an open question whether these effects of air-sea coupling would vary if SN is applied in AHOI. Currently, a direct answer cannot be provided as we have not used SN for AHOI up to now. To our best knowledge, none of the AORCMs has been operated with SN, either. Moreover, in our experiments, we found that air-sea coupling has similar effects like SN in reducing IV of RCMs. Thus, to reduce IV in hindcast simulations, it is recommended to run either a stand-alone RCM with SN or an AORCM without SN, but it is not necessary to run an AORCM with SN. The reason is that both the stand-alone atmospheric run with spectral nudging technique and the air-sea coupling run cost twice as much computing time than a run of the uncoupled atmospheric model. A run of the coupled model with SN may consume three to four times of this cost. In addition, AHOI has been designed not only to simulate past climate events using reanalysis data as a “perfect” forcing but also to provide future scenario simulations when the forcing is GCM output. For future scenario simulations, it has not been shown that SN is adding value in reducing the IV of RCMs. Therefore, we plan to use GCOAST-AHOI without SN for climate downscaling of future climate projections.
In summary, our current study shows that air-sea coupling is adding values in reducing IV to CCLM, which can be seen most pronouncedly during the storm Christian. On the one hand, our results confirm the conclusion of Schrum et al. [27] regarding the stabilizing effect of the coupling over the Baltic and North Seas. On the other hand, our results provide one more evidence that coupled models typically outperform uncoupled models under extreme events (see Schrum [86] and references therein). Schrum [86] indicated that for highly energetic phenomena, such as tropical cyclones, which are strongly controlled by air-sea interactions, the use of coupled atmosphere-ocean models appears mandatory. For seasonally or regionally weaker air-sea coupling and less energetic weather conditions, the added value of coupled regional downscaling is, however, not very clear [86].
In the next study, simulations using similar settings and strategy but for a longer time period will be conducted to investigate the coupling effects on IV for other extreme events in other seasons. Cloud parameterizations are a major source of uncertainty of climate models. In the future, machine learning may be a better alternative solution to replace these parameterization schemes [87]. It remains open how IV in the ocean model NEMO influences the stability of the coupled system GCOAST-AHOI so that this question may be the subject of future studies.

Supplementary Materials

Supplementary material is available online at https://www.mdpi.com/2073-4433/11/3/227/s1, Part 1: “Turbulent Kinetic Energy Scheme in CCLM”, Part 2: “Parameterizations in NEMO”, Part 3: “Surface energy balance”, Table S1: “Variables exchanged between compartment models in GCOAST-AHOI. S: information is sent; R: information is received”, Figure S1: “Difference of hourly surface temperature T_S (K, red line) and precipitation TOT_PREC (mm/d, blue line) averaged over land points of the NoEU area between CCLM1 and CCLM4. Time period: 1 September–31 October 2013”, Figure S2: “Difference of daily mean geopotential height (gpm, contour) and wind speed (m/s, shaded) at 500mb between CCLM1 and CCLM4. Time period: 22–29 October 2013”, Figure S3: “Difference of daily mean geopotential height at 500mb (gpm, contour) and T_S (K, shaded) between CCLM1 and CPL0. Time period: 22–29 October 2013”, Figure S4: “Storm tracks from DWD (Deutscher Wetterdienst, German National Meteorological Service), ERA5 reanalysis data, CCLM_sn, ens.CCLM and ens.CPL. Time: 3-hourly from 00 UTC 28 October 2013 to 06 UTC 29 October 2013”. Data and software used for the analyses in this study are available from the authors upon request.

Author Contributions

Conceptualization, H.T.M.H.-H. and S.H.; data curation, H.T.M.H.-H., S.H., S.G., R.P. and F.F.; formal analysis, H.T.M.H.-H.; funding acquisition, H.T.M.H.-H.; investigation, H.T.M.H.-H. and S.H.; methodology, H.T.M.H.-H.; project administration, B.R. and J.S.; resources, H.T.M.H.-H. and S.G.; software, H.T.M.H.-H. and S.G.; supervision, B.R. and C.S.; validation, H.T.M.H.-H., S.H. and R.P.; visualization, H.T.M.H.-H.; writing—original draft, H.T.M.H.-H.; writing—review & editing, H.T.M.H.-H., S.H., R.P., B.R., J.S., F.F. and C.S. All authors have read and agreed to the published version of the manuscript.

Funding

This study has been supported by funding from the German project REKLIM. The work described in this article has received funding from the Initiative and Networking Fund of the Helmholtz Association through the project “Advanced Earth System Modelling Capacity (ESM)”. The content of the article is the sole responsibility of the author(s) and it does not represent the opinion of the Helmholtz Association, and the Helmholtz Association is not responsible for any use that might be made of the information contained.

Acknowledgments

The authors are grateful to the following entities: The German Climate Computing Center (DKRZ) provided the computer hardware for the Limited Area Modelling simulations in the project “Regional Atmospheric Modelling”; BMWi (Bundesministerium fuer Wirtschaft und Energie, Federal Ministry for Economic Affairs and Energy) and the PTJ (Projekttraeger Juelich, project executing organization) for providing the FINO data, and A. Ganske and A. Andersson (DWD) for introducing the data; WMO for the GTS data; Copernicus Marine Environment Monitoring Service (CMEMS) for the MyOcean data. We acknowledge the E-OBS dataset from the EU-FP6 project UERRA (http://www.uerra.eu) and the Copernicus Climate Change Service, and the data providers in the ECA&D project (https://www.ecad.eu). We appreciate the use of the ERA5 reanalysis product that was provided by the European Centre for Medium-Range Weather Forecasts (ECMWF). We thank the EUMETSAT for providing Meteosat SEVIRI data. We express our thanks to M. Schröder (DWD) for introducing and providing the HOAPS data from CMSAF (https://www.cmsaf.eu/), and to CERFACS (France) and E. Maisonnave for their valuable support of the coupling technique.

Conflicts of Interest

The authors declare no conflict of interest. The funders had no role in the design of the study; in the collection, analyses, or interpretation of data; in the writing of the manuscript, or in the decision to publish the results.

Abbreviations

AHOIAtmosphere, Hydrology, Ocean and Sea Ice
ATMAtmosphere
CCLMCOSMO-CLM (see below)
CMEMS Copernicus Marine Environment Monitoring Service
CLCHHigh cloud cover
CLCMMedium cloud cover
CLCLLow cloud cover
CLCTTotal cloud cover
CORDEXCOordinated Regional climate Downscaling EXperiment
COSMO-CLMConsortium for Small-Scale Modelling – Climate version of Local Model
CPLCoupling
ECHAM5ECMWF Hamburg model vs. 5
ECMWFEuropean Centre for Medium-Range Weather Forecasts
EOBSv18.0 European OBServations vs. 18.0
ERA5ECMWF Re-Analysis
ESMEarth System Model
EUMETSATEuropean Organisation for the Exploitation of Meteorological Satellites
EURO-CORDEXCORDEX (see above) for Europe
FOAM-AMM7Forecasting Ocean Assimilation Model 7km Atlantic Margin model
FRSFlather Radiation Scheme
GCMGlobal Climate Model
GCOASTGeesthacht Coupled cOAstal model SysTem
HD modelHydrological Discharge model
LHFLLatent heat flux
LIM3Louvain-la-neuve sea-Ice Model vs. 3
LWDNSurface longwave downward radiation (LWDN)
MCTModel Coupling Toolkit
MPI-ESMMax-Planck-Institute Earth System Model
MPIOMMax-Planck-Institute Ocean Model
MSLPMean sea level pressure
NCEP/NCARNational Centers for Environmental Prediction/National Center for Atmospheric Research
NEMONucleus for European Modelling of the Ocean
NEMO_NordicNEMO version set up for Northern Europe
NoEUNorth Europe
NwgSeaNorwegian Sea
OASISOcean Atmosphere Sea Ice Soil
OASIS3OASIS coupler vs. 3
RCAO4The coupled Rossby Centre Atmosphere-Ocean model vs. 4
RCMRegional Climate Model
RegCM-ESRegional Climate Model – Earth System
REGNIERegionalisierte Niederschlagshöhen (Regionalized precipitation)
REMOREgional MOdel
ROMREMO-OASIS-MPIOM
ROMSRegional Ocean Modeling System
RTTOVRadiative Transfer for the Tiros Operational Vertical Sounder
SDStandard Deviation (Spread)
SHFLSensible heat flux
SNSpectral Nudging
SoEUSouth Europe
SURSurface
T_2M2-m height air temperature
TERRASoil model of CCLM
TOATop Of the Atmosphere
TOT_PRECTotal precipitation
TPXOv8A version of global ocean tide models of Oregon State University Tidal Inversion
T_SSurface temperature
TRIMNPTidal Residual and Intertidal Mudflat – Nested and Parallel
U_10M10-m height u-wind component
V_10M10-m height v-wind component
WAMWave Model

References

  1. Giorgi, F. Regionalization of climate change information for impact assessment and adaptation. WMO Bull. 2008, 57, 86–92. [Google Scholar]
  2. Tebaldi, C.; Knutti, R. The use of the multi-model ensemble in probabilistic climate projections. Philos. T. Roy. Soc. A 2007, 365, 2053–2075. [Google Scholar] [CrossRef] [PubMed]
  3. Deser, C.; Phillips, A.; Bourdette, V.; Teng, H. Uncertainty in climate change projections: The role of internal variability. Climate Dyn. 2012, 38, 527–546. [Google Scholar] [CrossRef] [Green Version]
  4. IPCC. Global Warming of 1.5°C. an Ipcc Special Report on the Impacts of Global Warming of 1.5°C Above Pre-Industrial Levels and Related Global Greenhouse Gas Emission Pathways, in the Context of Strengthening the Global Response to the Threat of Climate Change, Sustainable Development, and Efforts to Eradicate Poverty. in press. 2018. Available online: https://www.ipcc.ch/sr15/ (accessed on 22 February 2020).
  5. Hasselmann, K. Stochastic climate models part I. Theory. Tellus 1976, 28, 473–485. [Google Scholar] [CrossRef] [Green Version]
  6. Libardoni, A.G.; Forest, C.E.; Sokolov, A.P.; Monier, E. Underestimating Internal Variability Leads to Narrow Estimates of Climate System Properties. Geophys. Res. Lett. 2019, 46, 10000–10007. [Google Scholar] [CrossRef] [Green Version]
  7. Sieck, K. Internal Variability in the Regional Climate Model REMO. Ph.D. Thesis, Hamburg University, Hamburg, Germany, 2013. [Google Scholar]
  8. Feser, F.; Barcikowska, M. The influence of spectral nudging on typhoon formation in regional climate models. Environ. Res. Lett. 2012, 7, 014024. [Google Scholar] [CrossRef]
  9. Sieck, K.; Jacob, D. Influence of the boundary forcing on the internal variability of a regional climate model. Amer. J. Clim. Chang. 2016, 5, 373–382. [Google Scholar] [CrossRef] [Green Version]
  10. Weisse, R.; Feser, F. Evaluation of a method to reduce uncertainty in wind hindcasts performed with regional atmosphere models. Coastal Eng. 2003, 48, 211–225. [Google Scholar] [CrossRef]
  11. Laprise, R.; Kornic, D.; Rapaic, M.; Šeparovic, L.; Leduc, M.; Nikiema, O.; Luca, A.D.; Diaconescu, E.; Alexandru, A.; Lucas-Picher, P.; et al. Considerations of domain size and large-scale driving for nested regional climate models: Impact on internal variability and ability at developing small-scale details. Clim. Chang. 2012, 181–199. [Google Scholar] [CrossRef]
  12. Giorgi, F.; Bi, X. A study of internal variability of a regional climate model. J. Geophys. Res. Atmos. 2000, 105, 29503–29521. [Google Scholar] [CrossRef]
  13. Sanchez-Gomez, E.; Somot, S. Impact of the internal variability on the cyclone tracks simulated by a regional climate model over the Med-CORDEX domain. Climate Dynamics 2018, 51, 1005–1021. [Google Scholar] [CrossRef] [Green Version]
  14. Déqué, M.; Rowell, D.P.; Luthi, D.; Giorgi, F.; Christensen, J.H.; Rockel, B.; Jacob, D.; Kjellstrom, E.; de Castro, M.; van den Hurk, B. An intercomparison of regional climate simulations for Europe: Assessing uncertainties in model projections. Clim. Chang. 2007, 81, 53–70. [Google Scholar] [CrossRef]
  15. Braun, M.; Caya, D.; Frigon, A.; Slivitzky, M. Internal variability of the Canadian RCM’s hydrological variables at the basin scale in Quebec and Labrador. J. Hydrometeorol. 2012, 13, 443–462. [Google Scholar] [CrossRef]
  16. Giorgi, F. Thirty Years of Regional Climate Modeling: Where Are We and Where Are We Going next? J. Geophys. Res. Atmos. 2019. [Google Scholar] [CrossRef] [Green Version]
  17. Christensen, O.B.; Gaertner, M.A.; Prego, J.A.; Polcher, J. Internal variability of regional climate models. Climate Dyn. 2001, 17, 875–887. [Google Scholar] [CrossRef]
  18. Caya, D.; Biner, S. Internal variability of RCM simulations over an annual cycle. Climate Dyn. 2004, 22, 33–46. [Google Scholar] [CrossRef]
  19. Rinke, A.; Dethloff, K. On the sensitivity of a regional Arctic climate model to initial and boundary conditions. Climate Res. 2000, 14, 101–113. [Google Scholar] [CrossRef] [Green Version]
  20. Lucas-Picher, P.; Caya, D.; de Elía, R.; Laprise, R. Investigation of regional climate models’ internal variability with a ten-member ensemble of 10-year simulations over a large domain. Climate Dyn. 2008, 31, 927–940. [Google Scholar] [CrossRef]
  21. Alexandru, A.; de Elía, R.; Laprise, R. Internal variability in regional climate downscaling at the seasonal scale. Mon. Weather Rev. 2007, 135, 3221–3238. [Google Scholar] [CrossRef] [Green Version]
  22. Meier, H.; Döscher, R. Simulated water and heat cycles of the Baltic Sea using a 3D coupled atmosphere-ice-ocean model. Boreal Environ. Res. 2002, 50, 2637–2659. [Google Scholar] [CrossRef] [Green Version]
  23. Dubois, C.; Somot, S.; Calmanti, S.; Carillo, A.; Déqué, M.; Dell’Aquilla, A.; Elizalde, A.; Gualdi, S.; Jacob, D.; L’Hévéder, B.; et al. Future projections of the surface heat and water budgets of the Mediterranean Sea in an ensemble of coupled atmosphere-ocean regional climate models. Climate Dyn. 2012, 39, 1859–1884. [Google Scholar] [CrossRef]
  24. Mathis, M.; Elizalde, A.; Mikolajewicz, U. Which complexity of regional climate system models is essential for downscaling anthropogenic climate change in the Northwest European shelf? Climate Dyn. 2017, 7, 327–334. [Google Scholar] [CrossRef] [Green Version]
  25. Bülow, K.; Dietrich, C.; Elizalde, A.; Gröger, M.; Heinrich, H.; Hüttl-Kabos, S.; Klein, B.; Mayer, B.; Meier, H.; Mikolajewicz, U.; et al. Comparison of Three Regional Coupled Ocean Atmosphere Models for the North Sea under Today’s and Future Climate Conditions; KLIWAS Schriftenreihe KLIWAS-27/2014; Bundesanstalt für Gewasserkunde: Koblenz, Germany, 2014. [Google Scholar]
  26. Dieterich, C.; Wang, S.; Schimanke, S.; Gröger, M.; Klein, B.; Hordoir, R.; Samuelsson, P.; Liu, Y.; Axell, L.; Höglund, A.; et al. Surface heat budget over the North Sea in climate change simulations. Atmosphere 2019, 10, 272. [Google Scholar] [CrossRef] [Green Version]
  27. Schrum, C.; Hübner, U.; Jacob, D.; Podzun, R. A coupled atmosphere/ice/ocean model for the North Sea and the Baltic Sea. Climate Dyn. 2003, 21, 131–151. [Google Scholar] [CrossRef]
  28. Van Pham, T.; Brauch, J.; Früh, B.; Ahrens, B. Simulation of snowbands in the Baltic Sea area with the coupled atmosphere-ocean-ice model COSMO-CLM/NEMO. Meteorol. Z. 2017, 26, 71–82. [Google Scholar] [CrossRef]
  29. Ho-Hagemann, H.T.M.; Hagemann, S.; Rockel, B. On the role of soil moisture in the generation of heavy rainfall during the Oder flood event in July 1997. Tellus A 2015, 67, 28661. [Google Scholar] [CrossRef] [Green Version]
  30. Ho-Hagemann, H.T.M.; Gröger, M.; Rockel, B.; Zahn, M.; Geyer, B.; Meier, H.E.M. Effects of air-sea coupling over the North Sea and the Baltic Sea on simulated summer precipitation over Central Europe. Climate Dyn. 2017, 1–26. [Google Scholar] [CrossRef]
  31. Jeworrek, J.; Wu, L.; Dieterich, C.; Rutgersson, A. Characteristics of convective snow bands along the Swedish east coast. Earth Syst. Dyn. 2017, 8, 163–175. [Google Scholar] [CrossRef] [Green Version]
  32. Staneva, J.; Schrum, C.; Behrens, A.; Grayek, S.; Ho-Hagemann, H.; Alari, V.; Breivik, Ø.; Bidlot, J.R. A North Sea - Baltic Sea regional coupled models: Atmosphere, wind, waves and ocean. In Proceedings of the Operational Oceanography Serving Sustainable Marine Development, Eight EuroGOOS International Conference, Bergen, Norway, 3–5 October 2017; Buch, E., Fernández, V., Eparkhina, D., Gorringe, P., Nolan, G., Eds.; p. 516, ISBN 978-2-9601883-3-2. [Google Scholar]
  33. Pein, J.; Eisele, A.; Hofmeister, R.; Sanders, T.; Daewel, U.; Stanev, E.V.; van Beusekom, J.; Staneva, J.; Schrum, C. Nitrogen cycling in the Elbe estuary from a joint 3D-modelling and observational perspective. Biogeosciences Discuss. 2019. [Google Scholar] [CrossRef]
  34. Valcke, S.; Craig, T.; Coquart, L. OASIS3-MCT User Guide; OASIS3-MCT 3.0. Technical Report TR/CMGC/15/38; CERFACS/CNRS SUC URA No 1875; CERFACS: Toulouse, France, 2015. [Google Scholar]
  35. Rockel, B.; Will, A.; Hense, A. The regional climate model COSMO-CLM (CCLM). Meteorol. Z. 2008, 17, 347–348. [Google Scholar] [CrossRef]
  36. Tiedtke, M. A comprehensive mass flux scheme for cumulus parameterization in large-scale models. Mon. Weather Rev. 1989, 117, 1779–1800. [Google Scholar] [CrossRef] [Green Version]
  37. Schrodin, R.; Heise, E. The multi-layer-version of the DWD soil model TERRA/LM. Consort. Small-Scale Model. (COSMO) Tech. Rep. 2001, 2, 16. [Google Scholar]
  38. Ritter, B.; Geleyn, J.F. A comprehensive radiation scheme for numerical weather prediction models with potential applications in climate simulations. Mon. Wea. Rev. 1992, 120, 303–325. [Google Scholar] [CrossRef] [Green Version]
  39. Schultze, M.; Rockel, B. Direct and semi-direct effects of aerosol climatologies on long-term climate simulations over Europe. Climate Dyn. 2017, 50, 3331–3354. [Google Scholar] [CrossRef]
  40. Tanre, D.; Geleyn, J.F.; Slingo, J. First Results of the Introduction of An Advanced Aerosol-Radiation Interaction in the ECMWF Low Resolution Global Model; Meetings of Experts on Aerosols and their Climatic Effects, WMO and IAMAP: Williamsburg, VA, USA, 1984; pp. 133–177. [Google Scholar]
  41. Tegen, I.; Hollrig, P.; Chin, M.; Fung, I.; Jacob, D.; Penner, J. Contribution of different aerosol species to the global aerosol extinction optical thickness: Estimates from model results. J. Geophys. Res. Atmos. 1997, 102, 23895–23915. [Google Scholar] [CrossRef]
  42. Kinne, S.; O’Donnel, D.; Stier, P.; Kloster, S.; Zhang, K.; Schmidt, H.; Rast, S.; Giorgetta, M.; Eck, T.F.; Stevens, B. MAC-v1: A new global aerosol climatology for climate studies. J. Adv. Model. Earth Syst. 2013, 5, 704–740. [Google Scholar] [CrossRef]
  43. Doms, G.; Forstner, J.; Heise, E.; Herzog, H.J.; Mrionow, D.; Raschendorfer, M.; Reinhart, T.; Ritter, B.; Schrodin, R.; Schulz, J.P.; et al. A description of the Nonhydrostatic Regional COSMO Model. Part II: Physical Parameterization. Technical Report, Deutscher Wetterdienst. 2011. Available online: http://www.cosmo-model.org/content/model/documentation/core/cosmoPhysParamtr.pdf (accessed on 9 April 2014).
  44. Von Storch, H.; Langenberg, H.; Feser, F. A spectral nudging technique for dynamical downscaling purposes. Mon. Weather Rev. 2000, 128, 3664–3673. [Google Scholar] [CrossRef]
  45. Biner, S.; Caya, D.; Laprise, R.; Spacek, L. Nesting of RCMs by Imposing Large Scales. Research Activities in Atmospheric and Oceanic Modelling; Technical report, WMO/TD-987 30, 7.3–7.4; World Meteorological Organization: Geneva, Switzerland, 2000. [Google Scholar]
  46. Von Storch, H.; Cavicchia, L.; Feser, F.; Li, D. The concept of large-scale conditioning of climate model simulations of atmospheric coastal dynamics: Current state and perspectives. Atmosphere 2018, 9, 337. [Google Scholar] [CrossRef] [Green Version]
  47. Will, A.; Akhtar, N.; Brauch, J.; Breil, M.; Davin, E.; Ho-Hagemann, H.T.M.; Maisonnave, E.; Thürkow, M.; Weiher, S. The COSMO-CLM 4.8 regional climate model coupled to regional ocean, land surface and global earth system models using OASIS3-MCT: Description and performance. Geosci. Model Dev. 2017, 10, 1549–1586. [Google Scholar] [CrossRef] [Green Version]
  48. Ho-Hagemann, H.T.M.; Rockel, B. Einfluss von Atmosphäre-Ozean Wechselwirkungen auf Starkniederschläge über Europa; Warnsignal Klima: Hamburg, Germany, 2018; Chapter 4; pp. 161–168. [Google Scholar] [CrossRef]
  49. Wahle, K.; Staneva, J.; Koch, W.; Fenoglio-Marc, L.; Ho-Hagemann, H.T.M.; Stanev, E.V. An atmosphere-wave regional coupled model: Improving predictions of wave heights and surface winds in the southern North Sea. Ocean Sci. 2017, 13, 289–301. [Google Scholar] [CrossRef] [Green Version]
  50. Staneva, J.; Wahle, K.; Günther, H.; Stanev, E. Coupling of wave and circulation models in coastal-ocean predicting systems: A case study for the German Bight. Ocean Sci. 2016, 12, 797–806. [Google Scholar] [CrossRef] [Green Version]
  51. Staneva, J.; Alari, V.; Breivik, Ø.; Bidlot, J.R.; Mogensen, K. Effects of wave-induced forcing on a circulation model of the North Sea. Ocean Dyn. 2017, 67, 81–101. [Google Scholar] [CrossRef]
  52. Hagemann, S.; Dümenil, L. A parametrization of the lateral waterflow for the global scale. Climate Dyn. 1998, 14, 17–31. [Google Scholar] [CrossRef]
  53. Giorgetta, M.A.; Jungclaus, J.; Reick, C.H.; Legutke, S.; Bader, J.; Böttinger, M.; Brovkin, V.; Crueger, T.; Esch, M.; Fieg, K.; et al. Climate and carbon cycle changes from 1850 to 2100 in MPI-ESM simulations for the Coupled Model Intercomparison Project phase 5. J. Adv. Model. Earth Syst. 2013, 5, 572–597. [Google Scholar] [CrossRef]
  54. Roeckner, E.; Bäuml, G.; Bonaventura, L.; Brokopf, R.; Esch, M.; Giorgetta, M.; Hagemann, S.; Kirchner, I.; Kornblueh, L.; Manzini, E.; et al. The Atmospheric General Circulation Model ECHAM 5. Part I: Model Description; Technical report, Max Planck Institute for Meteor. Rep. 349; MPI for Meteorology: Hamburg, Germany, 2003. [Google Scholar]
  55. Jungclaus, J.H.; Keenlyside, N.; Botzet, M.; Haak, H.; Luo, J.J.; Latif, M.; Marotzke, J.; Mikolajewicz, U.; Roeckner, E. Ocean circulation and tropical variability in the coupled model ECHAM5/MPI-OM. J. Climate 2006, 19, 3952. [Google Scholar] [CrossRef] [Green Version]
  56. Sein, D.V.; Mikolajewicz, U.; Gröger, M.; Fast, I.; Cabos, W.; Pinto, J.G.; Hagemann, S.; Semmler, T.; Izquierdo, A.; Jacob, D. Regionally coupled atmosphere-ocean-sea ice-marine biogeochemistry model ROM: 1. Description and validation. J. Adv. Model. Earth Syst. 2015, 7, 268–304. [Google Scholar] [CrossRef]
  57. Sitz, L.E.; Sante, F.D.; Farneti, R.; Fuentes-Franco, R.; Coppola, E.; Mariotti, L.; Reale, M.; Sannino, G.; Barreiro, M.; Nogherotto, R.; et al. Description and evaluation of the Earth system regional climate model (Reg CM-ES). J. Adv. Model. Earth Syst. 2017, 9, 1863–1886. [Google Scholar] [CrossRef]
  58. Elizalde, A. The Water Cycle in the Mediterranean Region and the Impacts of Climate Change. Ph.D. Thesis, Max Planck Institute for Meteorology, Hamburg, Germany, 2011. [Google Scholar] [CrossRef]
  59. Hagemann, S.; Stacke, T.; Ho-Hagemann, H.T.M. High resolution discharge simulations over Europe and the Baltic Sea catchment. Front. Earth Sci. 2020, 8. [Google Scholar] [CrossRef]
  60. Madec, G. NEMO Ocean Engine. Available online: https://www.nemo-ocean.eu/wp-content/uploads/NEMO_book.pdf (accessed on 10 January 2020).
  61. Umlauf, L.; Burchard, H. A generic length-scale equation for geophysical turbulence models. J. Mar. Res. 2003, 61, 235–265. [Google Scholar] [CrossRef]
  62. Canuto, V.M.; Howard, A.; Cheng, Y.; Dubovikov, M. Ocean turbulence. Part I: One-point closure model-Momentum and heat vertical diffusivities. J. Phys. Oceanogr. 2001, 31, 1413–1426. [Google Scholar] [CrossRef]
  63. Large, W.G.; Yeager, S. Diurnal to Decadal Global Forcing for Ocean and Sea-Ice Models: The Data Sets and Flux Climatologies. Available online: https://opensky.ucar.edu/islandora/object/technotes:434 (accessed on 10 January 2020).
  64. Alari, V.; Staneva, J.; Breivik, Ø.; Bidlot, J.R.; Mogensen, K.; Janssen, P. Surface wave effects on water temperature in the Baltic Sea: Simulations with the coupled NEMO-WAM model. Ocean Dyn. 2016, 66, 917. [Google Scholar] [CrossRef]
  65. Pätsch, J.; Burchard, H.; Dieterich, C.; Gräwe, U.; Gröger, M.; Mathis, M.; Kapitza, H.; Bersch, M.; Moll, A.; Pohlmann, T.; et al. An evaluation of the North Sea circulation in global and regional models relevant for ecosystem simulations. Ocean Modell. 2017, 116, 70–95. [Google Scholar] [CrossRef]
  66. Gröger, M.; Dieterich, C.; Meier, M.H.E.; Schimanke, S. Thermal air-sea coupling in hindcast simulations for the North Sea and Baltic Sea on the NW European shelf. Tellus A 2015, 67, 26911. [Google Scholar] [CrossRef] [Green Version]
  67. Wang, S.; Dieterich, C.; Döscher, R.; Höglund, A.; Hordoir, R.; Meier, H.E.M.; Samuelsson, P.; Schimanke, S. Development and evaluation of a new regional coupled atmosphere-ocean model in the North Sea and Baltic Sea. Tellus A 2015, 67, 24284. [Google Scholar] [CrossRef]
  68. Van Pham, T.; Brauch, J.; Dieterich, C.; Früh, B.; Ahrens, B. New coupled atmosphere-ocean-ice system COSMO-CLM/NEMO: Assessing air temperature sensitivity over the North and Baltic Seas. Oceanologia 2014, 56, 167–189. [Google Scholar] [CrossRef] [Green Version]
  69. Mikolajewicz, U.; Sein, D.V.; Jacob, D.; Königk, T.; Podzun, R.; Semmler, T. Simulating Arctic sea ice variability with a coupled regional atmosphere-ocean-sea ice model. Meteorol. Z. 2005, 14, 793–800. [Google Scholar] [CrossRef] [Green Version]
  70. Sein, D.V.; Koldunov, N.V.; Pinto, J.G.; Cabos, W. Sensitivity of simulated regional Arctic climate to the choice of coupled model domain. Tellus A 2014, 66, 23966. [Google Scholar] [CrossRef] [Green Version]
  71. Šeparovic, L.; de Elía, R.; Laprise, R. Impact of spectral nudging and domain size in studies of RCM response to parameter modification. Climate Dyn. 2012, 38, 1325–1343. [Google Scholar] [CrossRef] [Green Version]
  72. Alexandru, A.; de Elía, R.; Laprise, R.; Separovic, L.; Biner, S. Sensitivity study of regional climate model simulations to large-scale nudging parameters. Mon. Weather Rev. 2009, 137, 1666–1686. [Google Scholar] [CrossRef] [Green Version]
  73. Hersbach, H.; Dee, D. ERA5 reanalysis is in production. ECMWF Newsl. 2016, 147. [Google Scholar]
  74. O’Dea, E.J.; Arnold, A.K.; Edwards, K.P.; Furner, R.; Hyder, P.; Martin, M.J.; Siddorn, J.R.; Storkey, D.; While, J.; Holt, J.T.; et al. An operational ocean forecast system incorporating NEMO and SST data assimilation for the tidally driven European North-West shelf. J. Oper. Oceanogr. 2012, 5, 3–17. [Google Scholar] [CrossRef] [Green Version]
  75. Flather, R.A. A storm surge prediction model for the northern Bay of Bengal with application to the cyclone disaster in April 1991. J. Phys. Oceanogr. 1994, 24, 172–190. [Google Scholar] [CrossRef] [Green Version]
  76. Andersson, A.; Graw, K.; Schröder, M.; Fennig, K.; Liman, J.; Bakan, S.; Hollmann, R.; Klepp, C. Hamburg Ocean Atmosphere Parameters and Fluxes from Satellite Data - HOAPS 4.0. 2017. Available online: https://icdc.cen.uni-hamburg.de/1/daten/atmosphere/hoaps/ (accessed on 10 January 2020).
  77. Rauthe, M.; Steiner, H.; Riediger, U.; Mazurkiewicz, A.; Gratzki, A. A central European precipitation climatology - Part I: Generation and validation of a high-resolution gridded daily data set (HYRAS). Meteorol. Z. 2013, 22, 235–256. [Google Scholar] [CrossRef]
  78. Cornes, R.C.; van der Schrier, G.; van den Besselaar, E.J.M.; Jones, P.D. An ensemble version of the E-OBS temperature and precipitation data sets. J. Geophys. Res. Atmos. 2018, 123, 9391–9409. [Google Scholar] [CrossRef] [Green Version]
  79. Haeseler, S.; Lefebvre, C. Heavy Storm Christian on 28 October 2013; Technical report; Deutscher Wetterdienst: Offenbach, Germany, 2013.
  80. Petoukhov, V.; Rahmstorf, S.; Petri, S.; Schellnhuber, H.J. Quasiresonant amplification of planetary waves and recent Northern Hemisphere weather extremes. Proc. Natl. Acad. Sci. USA 2013, 110, 5336–5341. [Google Scholar] [CrossRef] [Green Version]
  81. Bony, S.; Dufresne, J.L. Marine boundary layer clouds at the heart of tropical cloud feedback uncertainties in climate models. Geophys. Res. Lett. 2005, 32. [Google Scholar] [CrossRef] [Green Version]
  82. Von Storch, H.; Feser, F.; Haeseler, S.; Lefebvre, C.; Stendel, M. A violent mid-latitude storm in Northern Germany and Denmark, 28 October 2013. In Explaining Extremes of 2013 from a Climate Perspective; Herring, S.C., Hoerling, M.P., Peterson, T.C., Stott, P.A., Eds.; Bulletin of the American Meteorological Society: Boston, MA, USA, 2014; Volume 95, pp. S76–S78. [Google Scholar]
  83. Greenwald, T.J.; Bennartz, R.; Lebsock, M.; Teixeira, J. An uncertainty data set for passive microwave satellite observations of warm cloud liquid water path. J. Geophys. Res. Atmos. 2018, 123, 3668–3687. [Google Scholar] [CrossRef]
  84. Böhme, T.; Stapelberg, S.; Akkermans, T.; Crewell, S.; Fischer, J.; Reinhardt, T.; Seifert, A.; Selbach, C.; Van Lipzig, N. Long-term evaluation of COSMO forecasting using combined observational data of the GOP period. Meteorol. Z. 2011, 20, 119–132. [Google Scholar] [CrossRef]
  85. Saunders, R.; Hocking, J.; Turner, E.; Rayer, P.; Rundle, D.; Brunel, P.; Vidot, J.; Roquet, P.; Matricardi, M.; Geer, A.; et al. An update on the RTTOV fast radiative transfer model (currently at version 12). Geosci. Model Dev. 2018, 11, 2717–2737. [Google Scholar] [CrossRef] [Green Version]
  86. Schrum, C. Regional climate modeling and air-sea coupling. In Climate Science: Oxford Research Encyclopedias; Oxford University Press: Oxford, UK, 2017. [Google Scholar] [CrossRef]
  87. O’Gorman, P.A.; Dwyer, J.G. Using machine learning to parameterize moist convection: Potential for modeling of climate, climate change, and extreme events. J. Adv. Model. Earth Syst. 2018, 10, 2548–2563. [Google Scholar] [CrossRef] [Green Version]
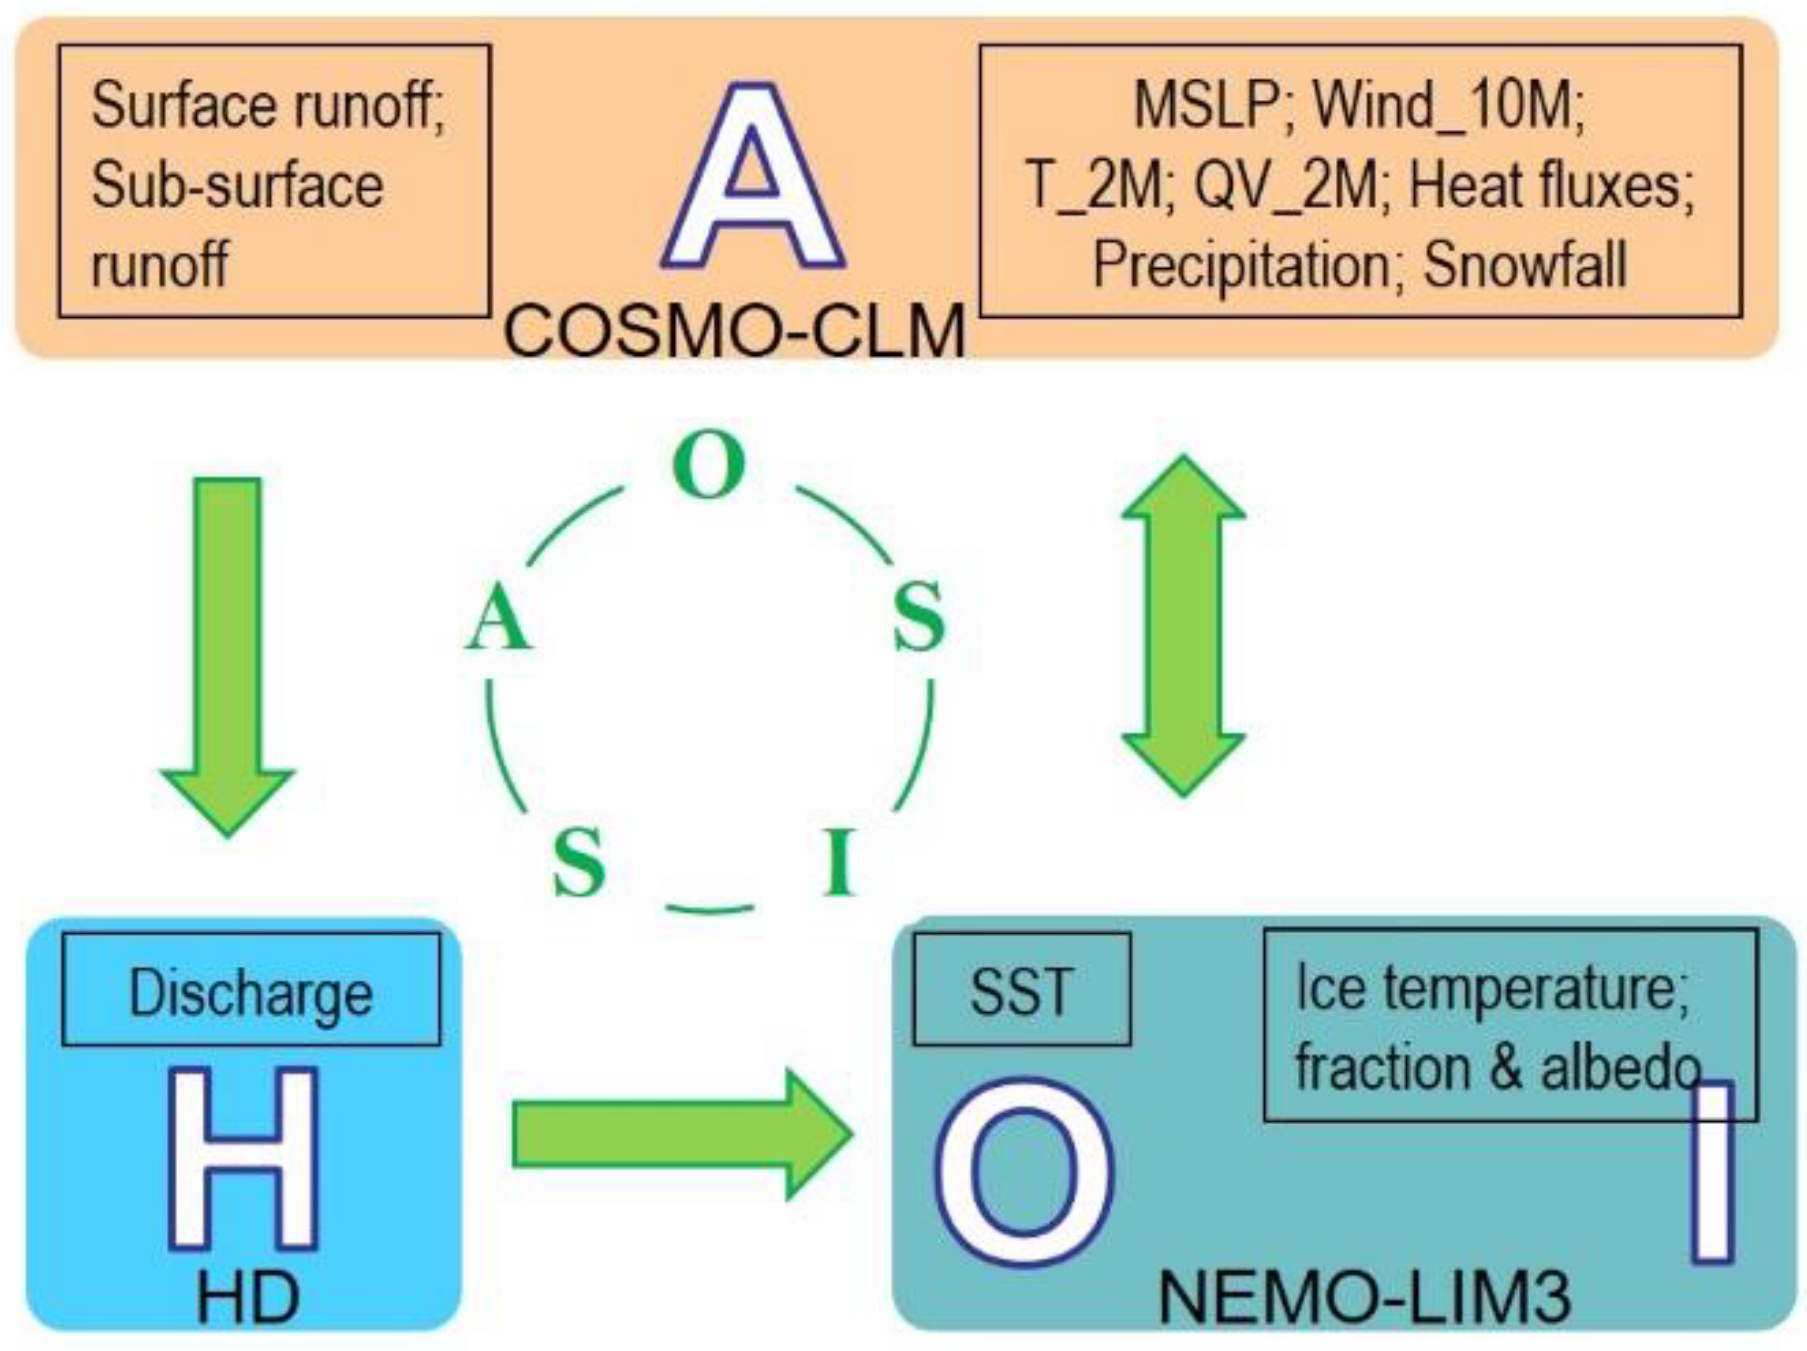
Figure 1. Schematic of GCOAST-AHOI: The Atmospheric model COSMO-CLM (CCLM) vs.5.0, the Hydrological discharge model HD vs.4.0, the ocean model NEMO vs.3.6 with sea ice model LIM3 coupled via the coupler OASIS3-MCT vs.3.
Atmosphere 11 00227 g001
Figure 2. Model domains (CCLM and HD: Grey, NEMO: Color). Four rectangles show four sub-domains used in analysis NwgSea (Norwegian Sea), NS_BS (the North and Baltic Sea), NoEU (north Europe), SoEU (south Europe).
Atmosphere 11 00227 g002
Figure 3. Schematic of spin up and an ensemble generation procedure. The restart strategy is only applied for CCLM in all stand-alone and coupled experiments.
Atmosphere 11 00227 g003
Figure 4. Mean sea level pressure MSLP mean (Pa) of (a) ERA5, (b) CCLM_sn, (c) ens.CPL and (d) ens.CCLM. Time period: 1 September–31 October 2013. Focus is on the NS_BS area of Figure 2.
Atmosphere 11 00227 g004
Figure 5. Hourly IV of (a) mean sea level pressure MSLP (Pa) and (b) 10-m height u-wind component U_10M spread (m/s) averaged over the NS_BS area. Time period: 1 September–31 October 2013. Grey bars mark the two periods 1–5 September 2013 and 27–29 October 2013.
Atmosphere 11 00227 g005
Figure 6. (a) Difference between IV of AHOI ensemble and the stand-alone CCLM ensemble for mean sea level pressure MSLP (Pa) at 09 UTC (left), 12 UTC (middle) and 15 UTC (right) on 28 October 2013. (b) Daily MSLP (Pa) averaged over the NwgSea area for 1–31 October 2013.
Atmosphere 11 00227 g006
Figure 7. Simulated profiles of daily mean (a) geopotential height FI (gpm), (b) U (m/s), (c) V (m/s) wind components and (d) wind speed WSPD (m/s) averaged over the NwgSea area on 28 October 2013.
Atmosphere 11 00227 g007
Figure 8. Profiles of daily mean (a) air temperature T (K) and (b) specific humidity QV (kg/kg) averaged over the NwgSea area on 28 October 2013.
Atmosphere 11 00227 g008
Figure 9. Evolution of three-hourly mean sea level pressure MSLP (Pa) of CCLM1 (top), CCLM4 (middle), and ERA5 (bottom). Time period: 06–15 UTC on 28 October 2013. Green contour is the line of 980 hPa. Red contour is the line of 975 hPa.
Atmosphere 11 00227 g009
Figure 10. Mean sea level pressure MSLP ((Pa), contours) and 10-m wind ((m/s), shaded and vector) of (a) CCLM_sn, (b) CPL0, (c) CCLM1 and (d) CCLM4 at 14 UTC on 28 October 2013. The numbers show observations of GTS, MyOcean and FONA3 data.
Atmosphere 11 00227 g010
Figure 11. Difference of daily mean geopotential height at 500 hPa ((gpm), contour) and surface temperature ((K), shaded) between CCLM1 and CCLM4. Time period: 22–29 October 2013.
Atmosphere 11 00227 g011
Figure 12. Daily mean standard deviation of (a) surface temperature T_S (K), (b) surface longwave downward radiation LWDN (W/m2) and (c) low-level cloud cover CLCL (–) averaged for NoEU (left) and SoEU (right) during night time (nocturnal, bluish color) and day time (diurnal, reddish color) of stand-alone CCLM (solid line) and AHOI (dashed line) Time period: 1 October–31 December 2013.
Atmosphere 11 00227 g012
Figure 13. Difference between CCLM1 and CCLM4 of daily mean of (a) Surface latent heat flux LHFL, surface sensible heat flux SHFL, net radiation flux Rnet, net energy flux Qnet, (b) nocturnal and diurnal Wind_10M and LHFL, (c) nocturnal and diurnal low-level cloud cover CLCL and net surface short-wave radiation SWnet, and (d) nocturnal and diurnal high-level cloud cover CLCH and surface longwave downward radiation LWDN. Values are averaged over the NwgSea area. Energy fluxes are positive upward. Time period: 1–31 October 2013. The grey bar marks the time of the storm Christian (27–29 October 2013).
Atmosphere 11 00227 g013
Figure 14. Difference of daily mean energy (W/m2) fluxes (positive upward) at top of atmosphere (TOA), in the atmosphere (ATM) and at the surface (SUR) averaged over the NwgSea area between (a) CCLM1 and CCLM4 and (b) IV of AHOI ensemble and the stand-alone CCLM ensemble. Time period: 1–31 October 2013 (date shown on top of each figure).
Atmosphere 11 00227 g014
Figure 15. (a) The storm track of the storm Christian from DWD analysis (black line and points) and locations of maximum wind speed (red points). The three-hourly evolution of (b) mean sea level pressure MSLP (hPa), (c) 10-m height wind speed Wind_10M(m/s), (d) 2-m height air temperature T_2M (K), (e) 10-m height maximum wind speed VABSMX_10M (m/s), (f) surface temperature T_S (K), (g) surface latent heat flux LHFL (W/m2) and (h) surface sensible heat flux SHFL (W/m2). Figure 15b,d,f,h shows values at the black points in Figure 15a while Figure 15c,e,g shows values at the red points. Blue and red shades indicate the ensemble spreads of ens.CCLM and ens.CPL, respectively. Time period: 00UTC-18UTC, 28 October 2013.
Atmosphere 11 00227 g015
Figure 16. Synthetic satellite image at the wavelength of 10.8 µm of (a) EUMETSAT, (b) CCLM4, and (c) CCLM1. Brightness temperature over 260 K is transparently plotted. Blue and dark green colors indicate ocean and land areas, respectively. Yellow color indicates missing values. Time: 12 UTC (top panel) and 15 UTC (bottom panel) on 28 October 2013.
Atmosphere 11 00227 g016
Figure 17. Daily (a) precipitation (mm/d), (b) surface runoff (mm/d), and (c) sub-surface runoff (mm/d) averaged over the Elbe catchment from CCLM, (d) Elbe river discharge (m3/s) at New Darchau from HD, (e) river runoff (mm/s) at the Elbe river mouth on the NEMO grid, and (f) salinity (psu) near the Elbe river mouth from NEMO. Shaded areas indicate the spreads of stand-alone CCLM and coupled AHOI experiments, respectively. REGNIE precipitation and observed discharge are shown in (a) and (d). NEMO_clim in (e,f) is the stand-alone NEMO run using climatological runoff data. Time period: 1 September–31 October 2013.
Atmosphere 11 00227 g017
Table 1. Experimental design.
ExperimentsFeaturesStart/RestartAt 01 SepStop
CCLM_res (RES)Stand-alone CCLM, no SNS: 01 Aug 01; 02; 03; 04; 05 Sep
CCLM_sn (REF)Stand-alone CCLM, with SNS: 01 SepCold start31 Dec
CCLM0Stand-alone CCLM (CCLM_ctr), no SNS: 01 SepCold start31 Dec
CCLM1-R: 01 Sep01 Sep of RES31 Dec
CCLM2-R: 01 Sep02 Sep of RES31 Dec
CCLM3-R: 01 Sep03 Sep of RES31 Dec
CCLM4-R: 01 Sep04 Sep of RES31 Dec
CCLM5-R: 01 Sep05 Sep of RES31 Dec
ens.CCLMEnsemble mean of six stand-alone CCLM_ctr experiments
CPL0AHOI Coupled CPL, no SNS: 01 SepCold start31 Dec
CPL1-R: 01 Sep01 Sep of RES31 Dec
CPL2-R: 01 Sep02 Sep of RES31 Dec
CPL3-R: 01 Sep03 Sep of RES31 Dec
CPL4-R: 01 Sep04 Sep of RES31 Dec
CPL5-R: 01 Sep05 Sep of RES31 Dec
ens.CPLEnsemble mean of six AHOI coupled experiments
Table 2. Simulated energy balance components ((W/m2), negative downward) averaged over NwgSea from stand-alone CCLM (CCLM_ctr) and coupled CPL ensembles at the top of atmosphere TOA, atmosphere and surface on 28 October 2013.
LocationsCCLM_ctrAHOI
ComponentsMeanRangeSDMeanRangeSD
TOA
Solar down70.80.00.070.80.00.0
Solar up32.912.45.329.92.50.9
Solar net38.012.45.341.02.50.9
Thermal up−199.621.97.9−193.516.16.4
Atmosphere
Solar net21.024.810.826.84.81.7
Thermal net−155.926.011.0−158.811.94.4
Surface
Solar down19.014.86.515.62.61.0
Solar up2.02.41.01.40.30.1
Solar net17.012.45.514.22.30.8
Thermal down308.944.317.9319.714.65.7
Thermal up352.70.20.1354.40.40.1
Thermal net−43.844.117.8−34.714.35.6
Net radiation−26.731.712.4−20.612.44.8
Latent heat−72.356.320.0−73.755.121.5
Sensible heat−23.524.79.6−31.837.713.9
Table 3. Correlation coefficient (rCor) of daily spread between two variables over the NS_BS domain of a) the stand-alone CCLM (CCLM_ctr) and b) AHOI for 1 September 2013–31 December 2013. (A) refers to “all points” and (L) to “land points only”. Grey boxes show the larger values of rCor for a given pair of variables when comparing the stand-alone CCLM and AHOI if the difference between them is greater or equal to 0.1.
Correlation PairCCLM_ctrAHOI
Variable 1Variable 2rCorLag (Days)rCorLag (Days)
MSLP (A)U_10M (A)0.800.80
MSLP (A)V_10M (A)0.600.70
MSLP (A)T_S (L)0.600.60
MSLP (A)CLCT (A)0.700.70
MSLP (A)CLCL (A)0.700.80
MSLP (A)CLCM (A)0.700.70
MSLP (A)CLCH (A)0.600.70
MSLP (A)TOT_PREC (L)0.600.61
T_S (L)U_10M (A)0.500.54
T_S (L)V_10M (A)0.500.61
T_S (L)CLCT (A)0.700.70
T_S (L)CLCL (A)0.600.64
T_S (L)CLCM (A)0.700.70
T_S (L)CLCH (A)0.700.70
T_S (L)TOT_PREC (L)0.540.54