Article

The Rise of Climate-Driven Sediment Discharge in the Amazonian River Basin

1
Met European Research Observatory—International Affiliates Program of the University Corporation for Atmospheric Research, 82100 Benevento, Italy
2
Departamento de Geociências, Universidade Federal do Amazonas, Campus UFAM, Manaus 1200 s/ C-28, Brazil
3
Environmental Geosciences, University of Basel, 4056 Basel, Switzerland
4
European Commission, Joint Research Centre, 21027 Ispra, Italy
5
UCA, INRAE, VetAgro Sup, UREP, 63000 Clermont-Ferrand, France
*
Author to whom correspondence should be addressed.
Atmosphere 2020, 11(2), 208; https://doi.org/10.3390/atmos11020208
Submission received: 22 December 2019 / Revised: 11 February 2020 / Accepted: 14 February 2020 / Published: 18 February 2020
(This article belongs to the Special Issue 10th Anniversary of Atmosphere: Climatology and Meteorology)

Abstract

:
The occurrence of hydrological extremes in the Amazon region and the associated sediment loss during rainfall events are key features in the global climate system. Climate extremes alter the sediment and carbon balance but the ecological consequences of such changes are poorly understood in this region. With the aim of examining the interactions between precipitation and landscape-scale controls of sediment export from the Amazon basin, we developed a parsimonious hydro-climatological model on a multi-year series (1997–2014) of sediment discharge data taken at the outlet of Óbidos (Brazil) watershed (the narrowest and swiftest part of the Amazon River). The calibrated model (correlation coefficient equal to 0.84) captured the sediment load variability of an independent dataset from a different watershed (the Magdalena River basin), and performed better than three alternative approaches. Our model captured the interdecadal variability and the long-term patterns of sediment export. In our reconstruction of yearly sediment discharge over 1859–2014, we observed that landscape erosion changes are mostly induced by single storm events, and result from coupled effects of droughts and storms over long time scales. By quantifying temporal variations in the sediment produced by weathering, this analysis enables a new understanding of the linkage between climate forcing and river response, which drives sediment dynamics in the Amazon basin.

1. Introduction

The transfer of sediment and organic carbon from the terrestrial biosphere to the oceans via erosion and riverine transport constitutes an important component of the global carbon sequestration [1,2,3] and nutrient cycling [4,5], resulting in flow transfer among Earth’s reservoirs [6]. The South American continent is a region with particular climate-biosphere interactions [7,8]. It also presents high vulnerability to water erosion [9], with average soil loss rates that are significantly higher than the world average [10]. In fact, with south-eastern Asia, the Amazon basin is a land area under the greatest effect of erosive precipitation [11]. However, especially for historical times, surface processes and soil erosion related to the hydrological cycle are still not sufficiently well understood [12,13]. As the spatial and temporal resolutions of multi-proxy records have increased in recent years, some hydro-climatic shifts have been recognized as important aspects of environmental applications [14]. These hydrological changes have a multi-scale nature, operating over annual-to-multidecadal time scales that is where water can be viewed as both a resource and a land disturbing force [15].
The Amazon River Basin (ARB) presents several exceptional challenges [16,17] because of the generally undeveloped nature of its fluvial environments, and soil erosion is one of the most serious threats [18]. Though research into grassland management options to mitigate nutrient losses from pasturelands has been an active field [19], a significant change in agricultural practices is still required to try to decouple productivity from processes of soil erosion and nutrient loss [20,21].
Gaining a deeper understanding of soil erosion control in the humid tropics is an essential issue [22]. In forestry environments of developing countries, soil erosion regularly constrains rural development and exacerbates poverty by undermining the productive capacity of land agriculture and livestock raising [23,24]. However, in the Amazon, as elsewhere, natural oscillations in the hydrological cycle and the land surface processes influenced by those fluctuations must be distinguished before possible anthropogenic impacts can be truly attributed. For instance, the El Niño-Southern Oscillation (ENSO) signal of sea surface temperatures variability in the tropical-equatorial southern Pacific brings climate anomalies and river flows worldwide and is a potential source of natural climate variability in the Amazon basin [25,26,27]. In this humid tropical region, soil erosion can potentially reach dramatic levels because precipitations are often strong and concentrated [28].
With the progress in large-scale hydrological modelling, scientists have developed physically-based models to explain patterns of sediment yield worldwide and help reducing vulnerabilities to natural hazards [29,30,31,32,33,34]. In the ARB, several extreme hydrological events have occurred during the last decades, with abundant precipitations in various sectors of the basin, which have determined river floods in 1953, 1989, 1999, 2009, and 2012–2015 (with an associated increasing sediment transport), while droughts occurred in 1996, 2005 and 2010 [35,36,37]. Given its large size, the ARB experiences significant variability in landscape-climate interactions [38]. Complementary to observational studies [39], simulation models support the understanding and quantification of different Amazonia hydrological processes such as evapotranspiration, soil and groundwater storages, and river-floodplain hydrodynamics [40]. These models, however, need several environmental inputs and a detailed parameterization to run over long temporal scales. This means that they cannot always be applied, especially in poor-gauged basins or for long temporal scales (e.g., decades to centuries). Additionally, the accuracy of predictions is seriously hampered by the difficulty to monitor natural complexity and temporally and spatially multiscale processes. For instance, point sedimentation may depend more on external factors than local erosion [41], accompanied by the limited availability of detailed datasets in ungauged catchments [42]. Calibration, validation and uncertainty analysis for such complex models is much more challenging than for parsimonious models, the latter being less data demanding and more ideally applicable to historical times when data availability and resolution are limited [43,44]. On the other hand, historical reconstructions are lacking, and represent a challenge for hydrology, climatology and geomorphology, for which a qualitative hazard ranking methodology is considered where an expert judgement is made [45]. This is, in part, due to the multi-scale nature of the processes involved [46] and the inadequacy of gauging monitoring systems in river basins [47,48]. The Amazon basin offers a long-term hydrological monitoring record, initiated in 1903 and continuing until today [49,50]. However, both in-situ and satellite River Sediment Discharge (RSD) data for Amazonia are available for recent decades only [51].
Parsimonious models are particularly useful to reconstruct the interdecadal variability of landscape responses in time over periods spanning decades in which only monthly precipitation rates are available. The present study describes a parsimonious model for estimating historical sediment discharge through the ARB, as driven by hydro-climatic forcing conditions. We have identified a suite of precipitation-driven components that are effective indicators of RSD and its relationship with hydro-climatic variations. The model was parameterized and evaluated using an independent sediment load database, compiled from outside the area used for model calibration. In this way, we have used the model (RSDA: River Sediment Discharge for Amazonia) to explore the linkage between regional climate and RSD, identifying the mechanisms that influence sediment discharge, and discuss how the RSD is likely to change in response to variations in precipitation regime associated with climate change. For instance, at regional and sub-regional scales, climatic factors such as precipitation and rainstorms represent a notable kinetic energy causing erosive splash and runoff [52] as a function of its amount and intensity, while vegetation represents an opposite force to this release of kinetic energy at the soil surface.

2. Materials and Methods

2.1. Environmental Setting

Amazonia is a continental area ranging from about 10° N to 20° S latitude and from 50° W to 80° W longitude, with an altitudinal gradient from 0 to >6000 m a.s.l. (Figure 1a). Garstang et al. [53] showed that some of the largest squall lines in the world occur over the Amazon region. Precipitation distribution for this region is characterized by a large amount of rain concentrated within six months (December–May), reflecting a typical monsoon climate (tropical climate). This region receives an important contribution from the South Atlantic Convergence Zone, which consists in a moisture strip extending from North to Southeastern Brazil, and adds to the influence of frontal systems and convective activity [54]. The occurrence of rainfalls of high magnitude constitutes a primary natural cause of erosion hazard for this part of the world (Figure 1b).
The largest and greatest rainfall erosivity values were found across Colombia and northwest Brazil regions, where erosivity may exceeds 15,000–20,000 MJ mm (ha h)−1 year−1 (megajoules millimeter per hectare per hour per year), corresponding to high rainfall erosivity potential for sediment production. High volumes of rain can explain these values, the mean annual rainfall being greater than 3000 mm in the Amazon Forest. Because of this pluvial regime, convective storm events are frequent throughout the year producing high values of rainfall aggressiveness. Climatic events such as droughts and storms are sometimes clustered into short-term groups [56,57], with some stormy years nested in dry periods. The implication is that recently observed rainfall changes may be an indicator of changes that occur in hydrological processes across Amazonia. This implies that river sediment rates are sensitive to the hydro-climatic forcing, which facilitates the application of a parsimonious framework for sediment yield time-series prediction.

2.2. Data Sources

Eighteen years of continuous annual values of river suspended-sediment loads for the Amazonia basin are available for the period 1997–2014. Yearly sediment data were derived from HYBAM Program [50], which are based on a 10-day sampling at Óbidos hydrological station [58]. At Óbidos, the Amazon watershed covers 4.8 × 10⁶ km2 and the river mouth is located 900 km downstream (Figure 1a). The study period shows a relatively stable river discharge. The observed sediment load for the Magdalena River basin over the period 1972–1998 was used for an independent assessment.
For monthly climate dataset, we used the CRU-ST3 via Climate Explorer [59] to obtain monthly values of precipitation both for the period of calibration (1997–2014) and partial reconstruction (1901–2014). The dataset of monthly rainfall derived from National Oceanic and Atmospheric Administration’s (NOAA) reanalysis data [60] was used to go back in time until 1851 (data from previous years are less reliable and were not used).

2.3. Modelling Approach

Espinoza Villar [61] showed for the Amazonia basin that changes in discharge extremes are related to the regional plurennial rainfall variability and the associated atmospheric circulation as well as to tropical large-scale climatic indicators. Based on river suspended sediment loads from Amazonia, the period with more erosivity was assigned from December to April [62], although large amounts of rainfall fall each month. In this way, the RSDA model offers a suite of major monthly-based hydro-geomorphological events that jointly contribute to the annual sediment storage at both basin and catchment (sub-basin) scales (Figure 2) from sub-decadal time scales. Based on this understanding, rainfall power was captured by monthly rainfall amounts and variability in different years as follows:
RSDA Y = 0 = α · ( CGE   +   BGE ) · ( 1 + σ P ( ( J D ) ) μ P ( ( J D ) ) ) Y   =   1 8 +   Δ
The model drives a number of soil loss and transport events along the river sub-basins to estimate yearly RSD (Mg km−2 yr−1), where: Y = 0 is the current year, σ and μ are the standard deviation and the mean of monthly precipitation (P, mm), respectively, CGE is the catchment gross erosion, and BGE is the basin gross erosion. These last two factors are multiplied by a function of σ/μ ratio, calculated each year on the monthly precipitation amounts in the period June–December (J–D). The higher the ratio the more aggressive is rainfall, and vice versa, after Aronica and Ferro [63], and Diodato et al. [64]. In addition, Δ represents the sediment amount trapped in the basin; α is a conversion factor.
CGE   =   prc 85 · ( P J D ) Y = 1 4
BGE   =   prc 90 · ( P ( J D ) ) Y = 5 8
In Equations (1)–(3), variable subscripts and superscripts take the negative values set to bound any time window of years (Y) antecedent to the year for which the estimate is made (Y = 0), and over which the 85th and 90th percentiles (prc85 and prc90, respectively) of cumulative monthly precipitation (P(J–D), mm) are calculated.
In particular, the CGE component of Equation (2) was designed to represent a simplified catchment-scale process, where antecedent precipitation events are assumed important for the transport of soil through the catchment. Equation (2), which uses the 85th percentile of precipitation, is intended to capture cumulative rainfall and the associated effects on soil erosion at sub-basin scale transport within the precedent years (Y = −1 to Y = −4).
In Equation (3), the BGE component of the model was designed to capture the long-term memory interaction between precipitation and basin, according to the 90th percentile at plurennial regime. The precipitation percentiles have been successfully used elsewhere to yield relationships between precipitation and erosivity factor [65], and between precipitation and soil erosion [66].
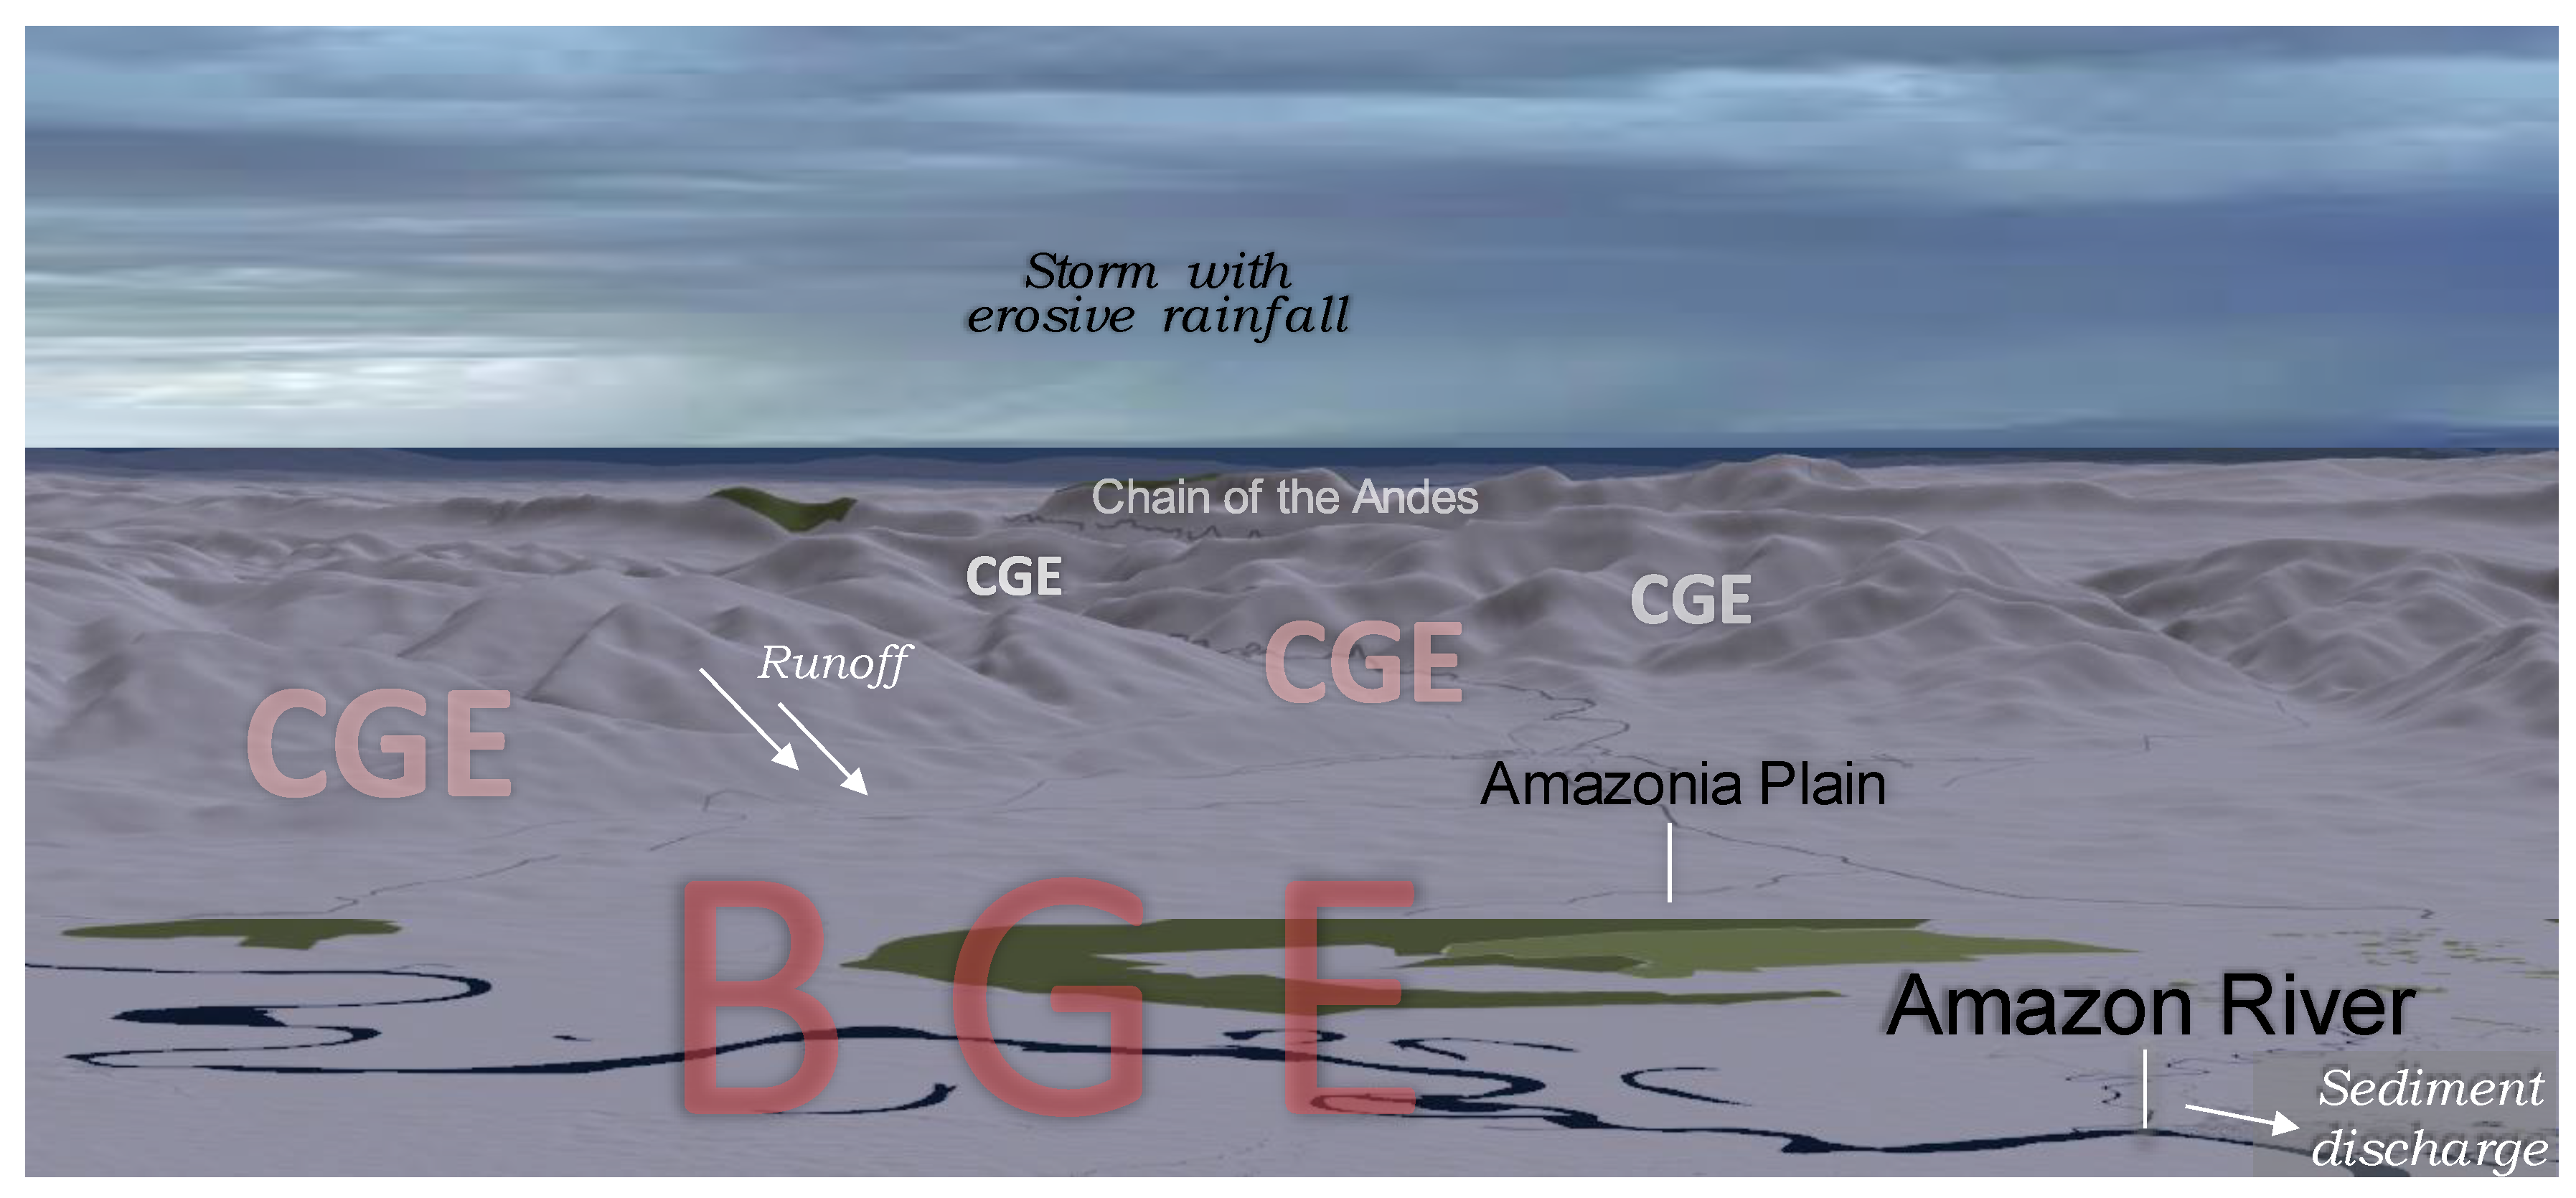
In the conceptual 2-D scheme (Figure 2), the role played by mesoscale rainstorms (extending over contiguous areas) in initiating sediment transport is accounted for the basin scale (BGE, Basin Gross Erosion). This scheme also assumes the importance of local precipitation events for driving surface and sub-surface flows, and soil losses within the individual catchments ad the web of streams (CGE, Catchment Gross Erosion) that comprise the basin. Thus, storm events are grouped based on their scale and then hierarchized according to communication delays between each component of the spatio-temporal hydrological integration. This dynamic is in agreement with the large variability in amplitude and temporal dynamics from one year to another, which is linked to the interannual variation of climatic controls (after [67]).

2.4. Model Assumptions

Following Callède et al. [69] and Espinoza Villar et al. [70], the RSDA model takes into account both long- and short-term rainfall variability that leads to a better understanding of soil movement by the storm and transport to the main stream of the Amazonia River, particularly with respect to extreme storms that occur in remote areas of the basin. A third component (inter-monthly variability) also appears to be significant when we consider a function of the inter-monthly coefficient of variation, computed as (1 + √σ/μ), based on a concept translated by Aronica and Ferro [63]. This would reflect the erosion activity associated with changes in storm-drought cycles at intra-decadal scale (from Y = −1 to Y = −8).
The CGE factor operates in any catchment of the basin as soil detachment from raindrop splash erosive forces, driven by seasonal rain showers. At the annual scale, the fluvial transportation process cannot always take the necessary pathways or links to convey the sediment to the outlet of basin. In this way, the plurennial rainfall accounted for in the RSDA model acts to redistribute sediment across the drainage basins (Equation (2)). Afterward, the percentile of the antecedent rainfall within Y = −5 to Y = −8, as in Equation (3), includes the streamflow and water level long-memory processes associated with the massive storage capacity of the Amazon basin [67]. The last component of the model (Δ, Mg year−1) in Equation (1) is a sink term. It represents the amount of sediment involved in the re-sedimentation process, which is a fraction of the gross erosion (GE, Mg year−1).
Based on Diodato and Grauso [71], the term Δ can be expressed as:
| Δ |   =   ( 1     SDR )   ×   GE
where SDR (sediment delivery ratio) is the ratio of sediment yield at the catchment outlet to the total (gross) erosion in the catchment. The concept is an analogue to the connectivity ratio (the amount of sediment reaching a stream over the amount of sediment eroded), which refers to slope-channel transfers (e.g., [72]).

2.5. Model Calibration

For the time series of available annual River Sediment Discharge (RSD) data, a recursive procedure was performed to obtain the best fit of a regression equation y = a + b·x, where y = observed RSD and x = predicted RSD data, according to the following criteria:
{ MAE   =   min R 2   =   max | b 1 |   =   min
The first condition is to minimize the distance between modelled and observed data, by minimizing the mean absolute error (0 ≤ MAE < ∞, Mg year−1, [73]). The second condition is to maximize the goodness-of-fit (0 ≤ R2 ≤ 1) that is the variance explained by the model (also supported by an ANOVA test of the relationship between observed and predicted data). The third condition approximates the unit slope (b) of the straight line that would minimize the bias of the linear function estimates versus observations. Poor models have high MAE, low R2 and b far from unity. The calibration work was performed through a trial-and-error process comparing the model predictions with observational data. We iteratively added in predictors, one-at-a-time until modelling solutions with small mean absolute error and large R2 value were obtained. Then, for the final selection, the third criterion—|b−1| = min—was additionally involved. Each predictor was repositioned over >50 iterations until convergence was achieved. The analysis of variance (ANOVA) was subsequently applied to find out if all predictors were necessary (and not redundant) for the modelling purpose. The Durbin-Watson statistic [74] was also performed to test for autocorrelated residuals because strong temporal dependence may induce spurious correlations [75]. Spreadsheet-based statistical analyses were performed with the graphical support of STATGRAPHICS [76] and WESSA routines [77].

3. Results and Discussion

3.1. Model Parameterization and Evaluation

Equation (1) was parameterized with α = 0.469, ∆ =−132.660 Mg km−2 year−1. At the same time, we derived the parameters of Equation (2) with the percentile equal to 85 and the time window equal to four years, and that of Equation (3) with the percentile equal to 90. The solutions obtained constitute a satisfactory performance for the output variable according to the criteria of Equation (5). Since one-way ANOVA computed a p-value < 0.05, there is a statistically significant relationship between observed and predicted RSD. The R2 statistic indicates that the fitted model explains 70% of the variability in y (Figure 3a).
The standard deviation of the residuals was equal to 7.4 Mg km−2 year−1. The mean absolute error (MAE) of the parametrized model was 5.8 Mg km−2 year−1, compared with an annual mean value of 131±13 Mg km−2 year−1 over the study period (1997–2014). Except for two records that are aligned over the 90% prediction limits, negligible differences of the data-points from the theoretical 1:1 line are observed (Figure 3a).
The quasi-Gaussian pattern of model residuals (Figure 3b) indicates that these data are bias-free. The Durbin–Watson (DW) statistic (1.83671) provided no indication of serial autocorrelation in the residuals (p = 0.2736).
The Figure 3c presents an independent validation of the RSDA model, obtained by comparing the predicted sediment discharge with the observed sediment load for the Magdalena River basin over the period 1972–1998. Except for the absolute values of sediment, which are logically different because the model needs to be recalibrated for Magdalena River, the relative coevolution is satisfactory (both blue curve and brown bars in Figure 3c follow the same trend). In fact, the correlation coefficient equals 0.52, indicating a moderately strong relationship between the variables. The ANOVA p-value is less than 0.05, and the Durbin–Watson statistic is equal to 1.94596 (p-value = 0.3997).
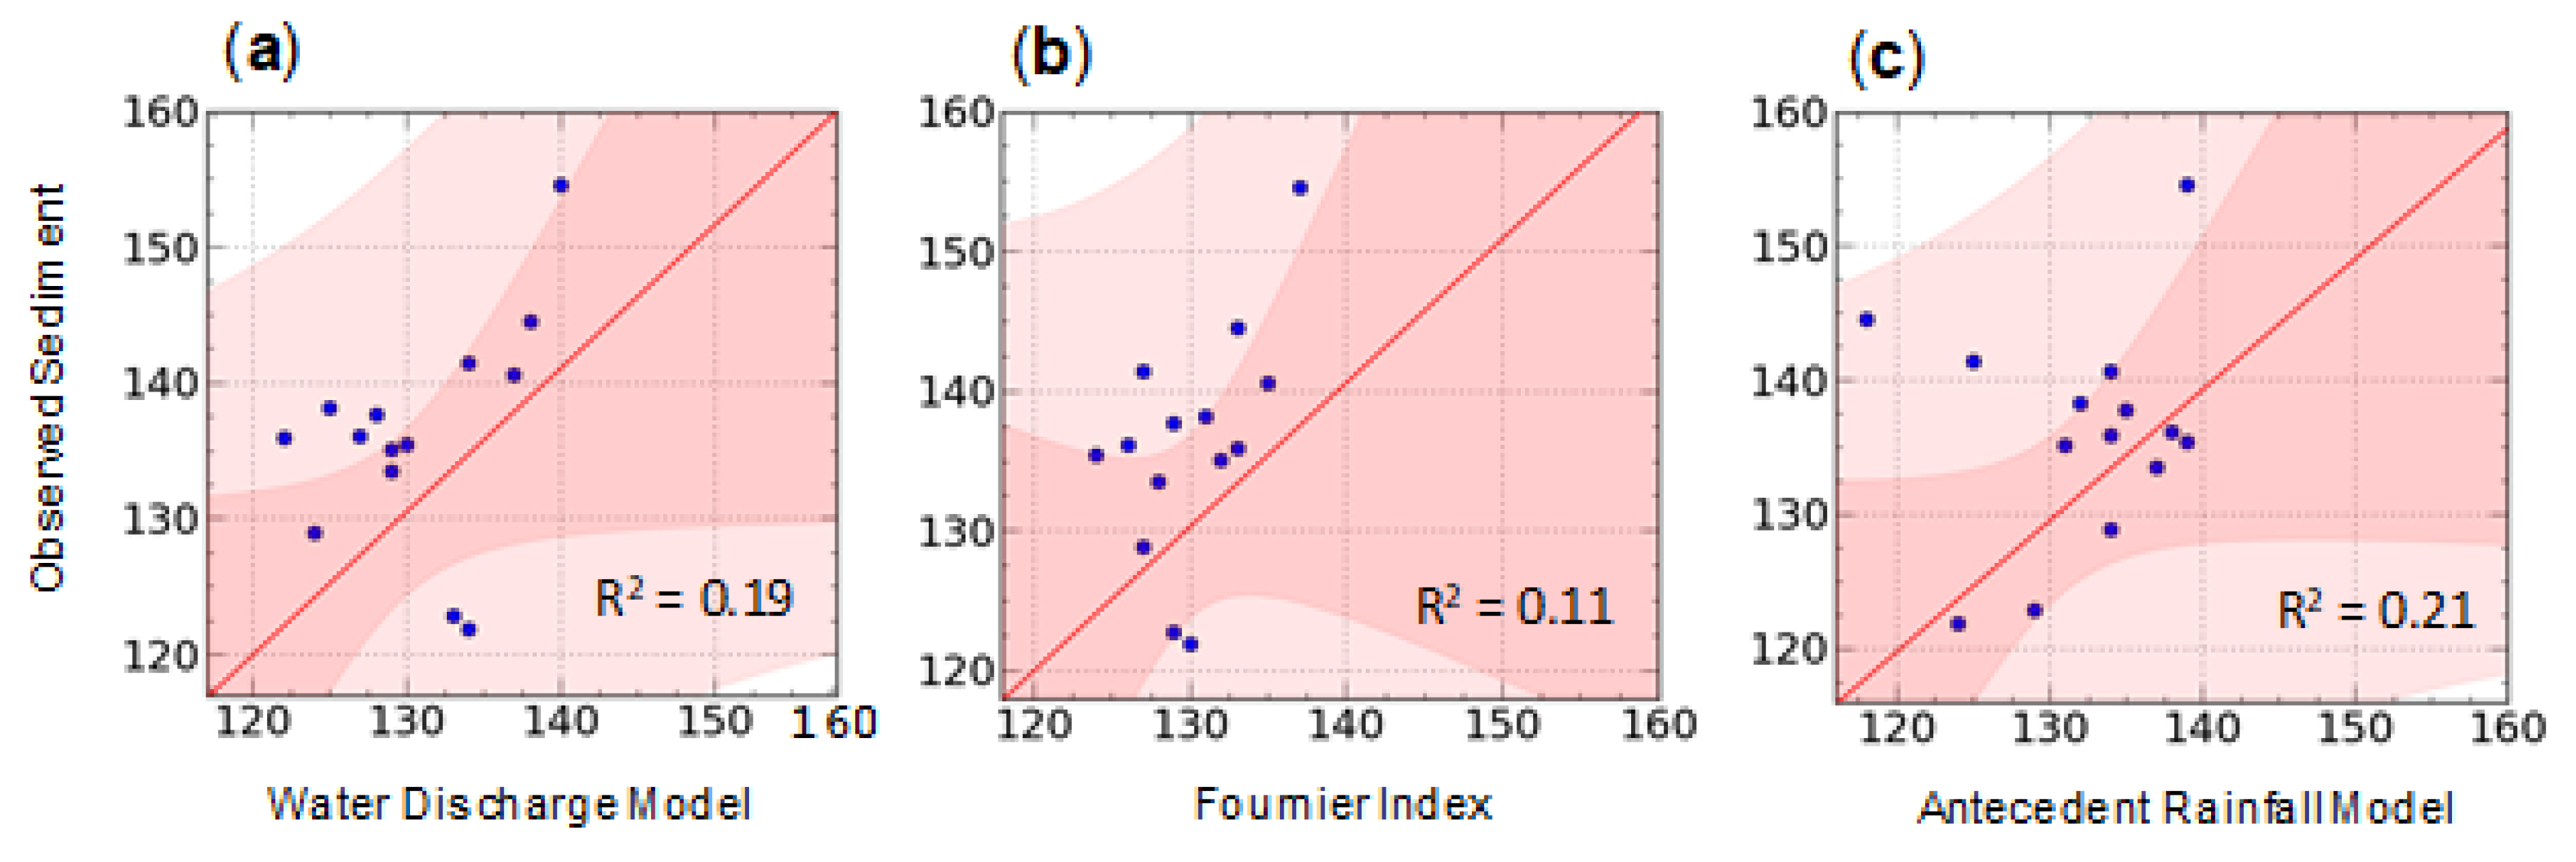
To further evaluate the RSDA model based on hierarchic monthly rainfall data, we compared its performance with three well-known approaches developed for sediment rate (SR) estimation that use water discharge (WS), SRWD(Y) [79], the Fournier Index (FI), SRFI(Y) [30], and precipitation characteristics (SAR: soil antecedent rainfall), SRSAR(Y) [80], as main explanatory drivers of basin-wide sediment yield:
SRWD ( Y )   =   a   ×   WD b
SR FI ( Y )   =   a FI   ×   p 2 P   +   b FI
SR SAR ( Y )   =   a SAR   ×   i =   1 3 P i   +   b SAR
where WD is the annual water discharge (m3 s−1), P is the total precipitation (mm) of the year Y, p is the maximum monthly precipitation (mm) in each year Y, a (scale coefficient) and b (shift coefficient estimating sediment rate when the precipitation input is equal to zero in Equations (7) and (8)) are empirical parameters used for model calibration in the Amazonian basin.
The comparison to the prediction equations of water discharge, Fournier Index and antecedent rainfall-based models, revealed that RSDA performed better, as the residuals of each alternative model were larger and the explained variability considerably lower than with RSDA (Figure 4). The mean absolute errors were 2.10 Mg km−2 year−1 for RSDA, and 10.37, 10.62 and 9.27 Mg km−2 year−1 for water discharge, Fournier index and antecedent rainfall-based models, respectively. The better performance of RSDA model compared to the water discharge-based model of Equation (5) is important because the latter is frequently used for basin-wide estimates of sediment yield (e.g., [81]) but its use in scenario studies is often hindered by the unavailability of long-term water discharge data [82,83].

3.2. Discussion on the RSDA Model

An increase in sediment discharge occurred in the Amazon basin may be attributed to stronger erosion processes caused by either a regional change (rainfall) or changes in land cover (e.g., resulting from deforestation) or both. Borrelli et al. [10] estimated a notable increase of soil erosion in the study area due to deforestation and increased conversion to agricultural land. Callède et al. [49] observed a rather stable river discharge at Óbidos in the period 1997–2007. This indicates that hydrological discharge cannot be a suitable proxy for estimating the RSD, since river sediment seems to increase in the same period. Stronger rainfall variability upstream may support a more efficient production and transport of sediments downstream. Thus, a change in rainfall pattern may account for sediment discharge variations [51].
In this respect, the interacting factors σ, μ, CGE, BGE and Δ in Equation (1) involved in the temporal response of RSD, reflect the magnitude and frequency of events nested within longer-term patterns of climate change at different timescales [84]. In particular, given the occurrence of multiple processes, the long-term constant Δ cannot be easily calculated. The Δ value estimated for the ARB with Equation (1), −132.660 Mg km−2 year−1, is intermediate in the range of estimates (−44 to −235 Mg km−2 year−1), reported in previous studies [85,86,87], which is typical for moderate to high elevation ranges and slope gradients. The ARB has widely varying climatic and topographic features, with precipitations patterns ranging from about 1500 (in the lower basin near the outlet) to 6000 mm year−1 (in the south-western part of the basin near the Andes), and elevations ranging from sea level (the river’s mouth) to ~6500 m a.s.l. in the Andes [88]. However, only the extreme western part has steep gradients. Crossing the low interior basin of Brazil, the Amazon River flows along gentle gradients of about 5–20 cm per km [89]. The estimated average gross erosion for the simulated period is about 245 Mg km−2 year−1, which gives sediment delivery ratio (Equation (4)) equal to 0.46, indicating that high amounts of soil are mobilized by erosion (gross erosion) but a relatively high fraction is retained in the basin area. This result matches the lookup values given by Pelletier [46] for the Amazonian region.

3.3. River Sediment Discharge Historical Reconstruction

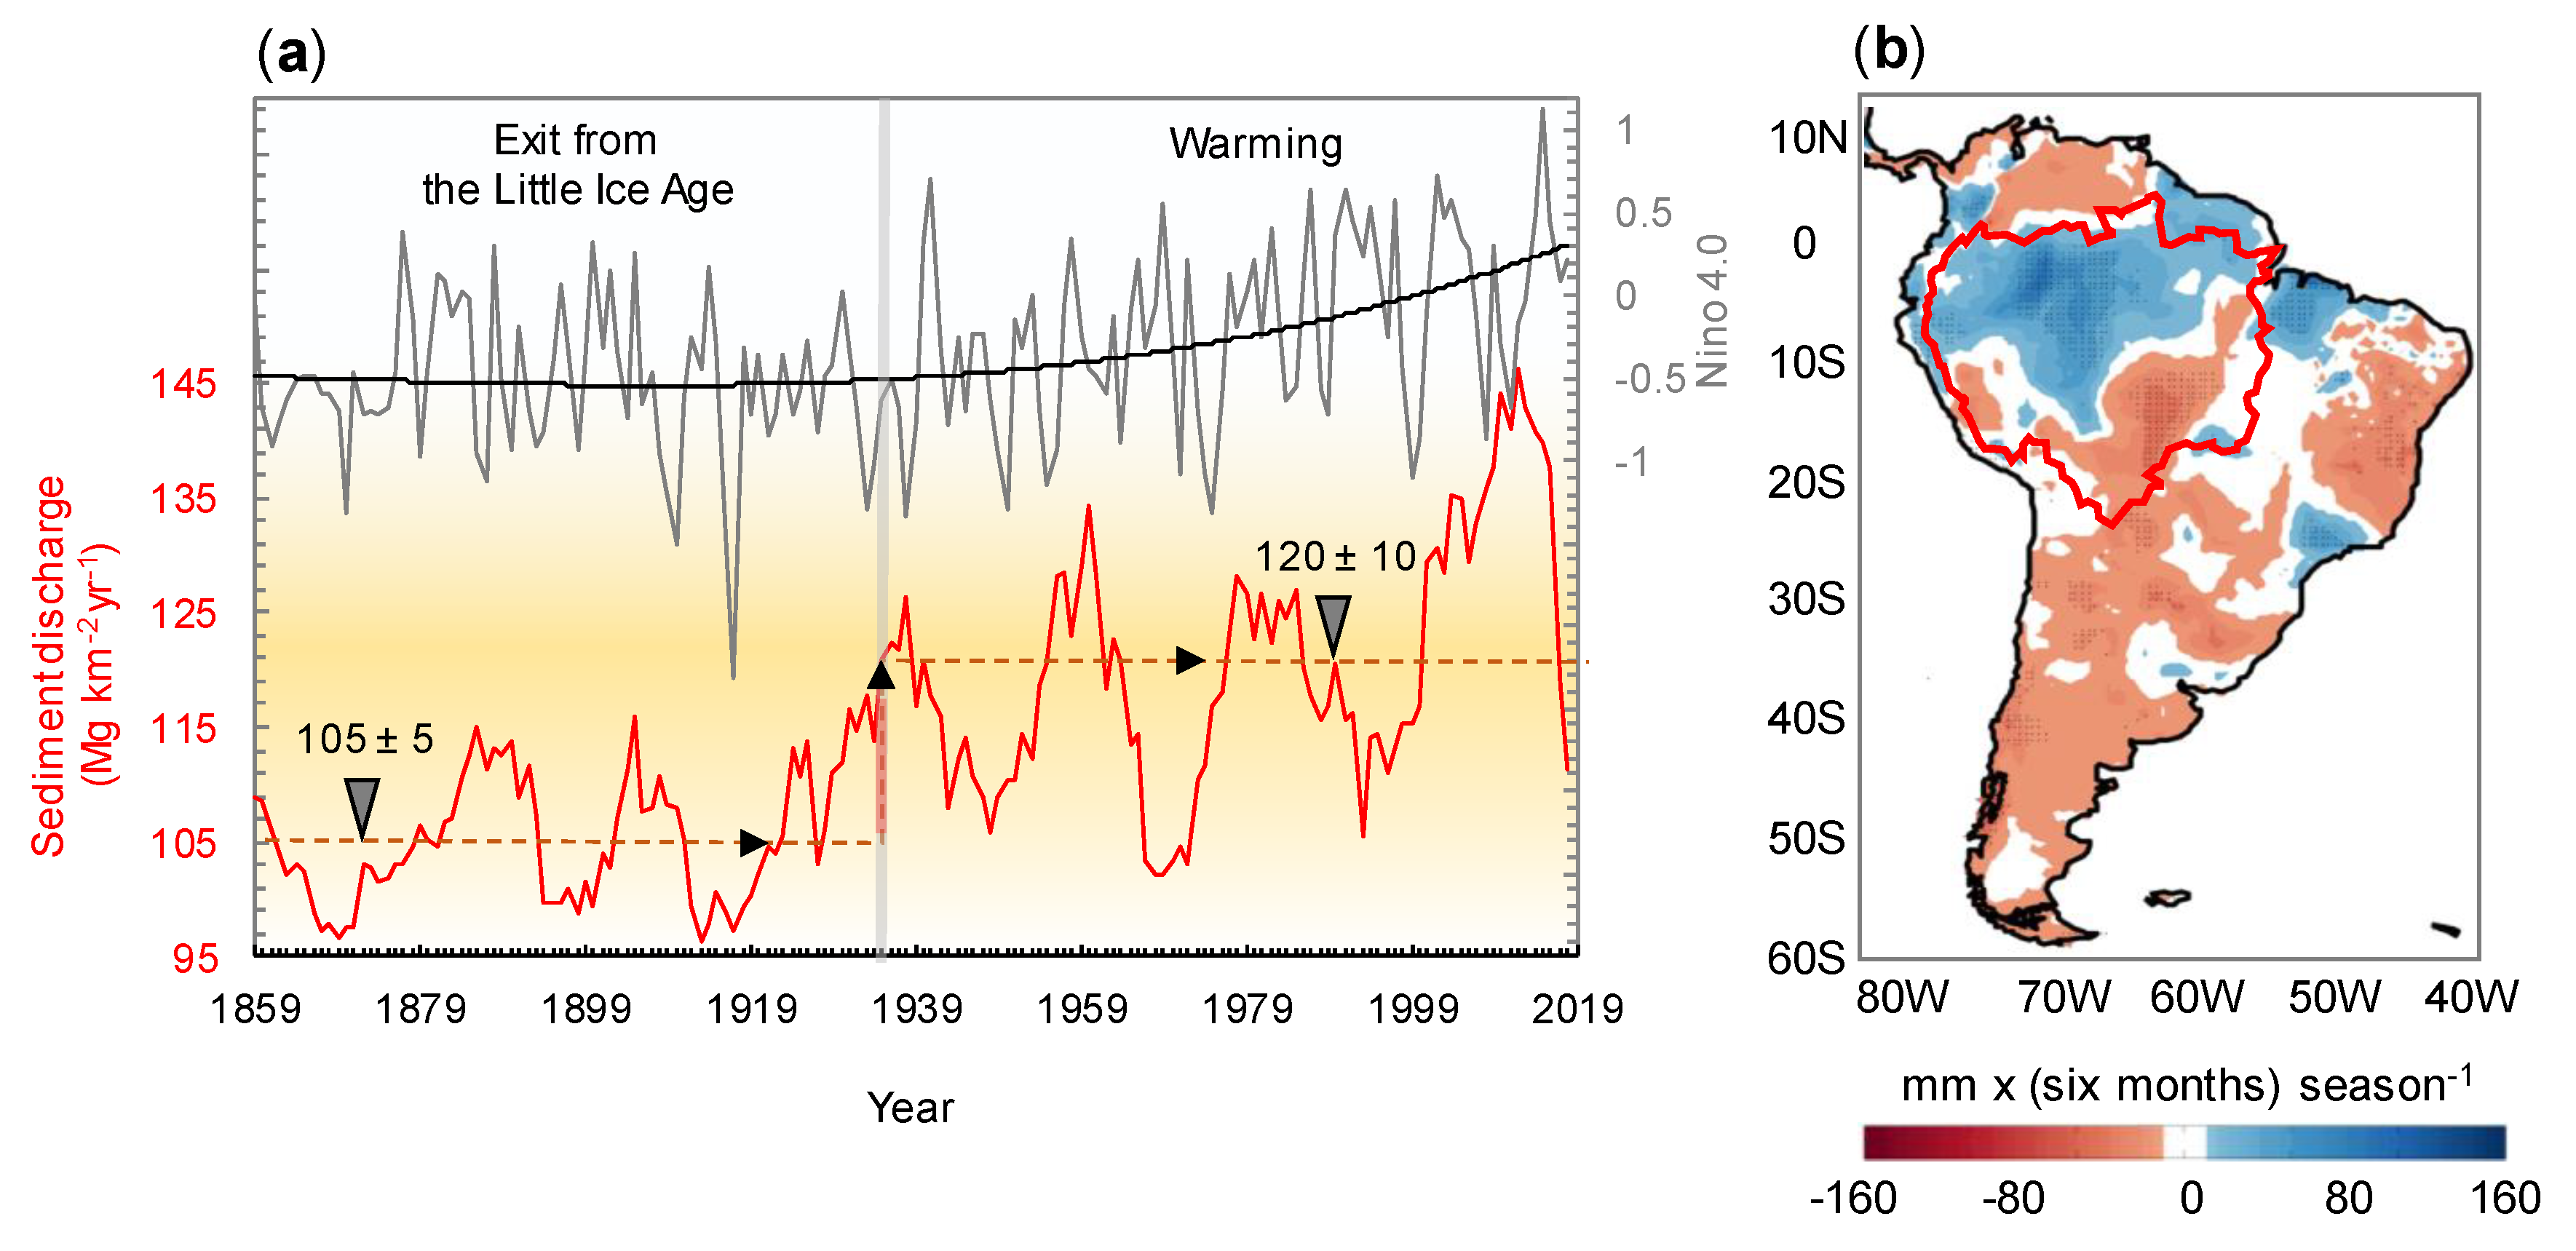
We applied the RSDA model to reconstruct the sediment discharge from 1859 to 2014. In this time span, the mean value of sediment discharge is 113 ± 11 Mg km−2 year−1. The overall trend of the long-term reconstructed hydro-climatic forcing for sediment discharge series is increasing within sudden shifts, featured by decadal-to-multidecadal patterns of variability (Figure 5a).
In particular, the break point that occurred around 1931 (bold grey vertical line in Figure 3a), implies a discharge increase after that date. Until 1931, the average sediment discharge was about 105 ± 5 Mg km−2 year−1, followed by an increase between 1932 and 2014, with a mean value around 120 ± 10 Mg km−2 year−1. The last decade also reveals a stronger inter-annual variability in the sediment rate as compared to previous decades, with outliers in 2010 (144 Mg km−2 year−1), 2012 (146 Mg km−2 year−1) and 2013 (143 Mg km−2 year−1).
The change point in 1931 corresponds to the beginning of the increasing phase of the Niño-4 index (black curve), which is related to the variability of sea surface temperatures occurring in the central region of the Southern Pacific Ocean [92]. A change in circulation as part of a tropical-wide climate reorganization was observed during recent decades, most likely triggered by rapid tropical Atlantic warming [93]. A physical link may exist between the overturning Walker circulation [94] connecting the tropical ocean basins and having an ascending branch right over Amazonia, and intensified deep convection and flooding in the region [37]. During the positive phase of ENSO (El Niño years) in the central equatorial Pacific, in particular, above-normal precipitation can be observed over the Amazonia in autumn, winter and spring [95], resulting in significantly higher water erosion rates and an undesirable lengthening of the sedimentation period [96]. This is in agreement with the results reported by Aalto et al. [97], who found transient processes driven by the ENSO cycle to control and modulate downstream delivery of sediments to the Amazonian food-plains. With ENSO, also the Atlantic Multidecadal Oscillation (AMO) affects the decadal and multi-decadal fluctuations of precipitation in the Amazon basin [98]. This in turn affects the sediment mobilization associated with erosive rainfall events. In particular, Mello et al. [99] found a correlation between erosive events in Brazil and sea surface temperature of the Equatorial Pacific region (El Niño-3.4). This means that in years with significant ENSO events, rainfall regime tends to increase in this region, which implies increased rainfall erosivity and, so, sediment rates.
Accordingly, Figure 5b shows the positive change in amount rate of the precipitation during the six different months (DJFMAM) from 1979–2015 on most of the Amazon basin, and with spatial range from 30 to 100 mm per season [91]. Marengo and Espinoza Villar [36] also found that hydrological data show trends towards more extreme events across the Amazonia region during the 20th century.
However, it is remarked as during these recent decades a significant positive trend in river discharge was not observed (e.g., [100]). This agrees with the mechanism proposed by Cohen et al. [101], who found that regions with high reliefs and soft lithology amplify the effect of higher than average precipitation by producing an increase in sediment yield that greatly exceeds increases in water discharge. These results are also in agreement with the increased sediment found by Martinez et al. [51]. In addition, the changes in precipitation and discharge associated with the Amazonian deforestation demonstrate a potential for significant vegetation shifts and further feedbacks to climate and discharge [102].

4. Conclusions

This paper documents recent progresses in the study and understanding of extreme seasonal events in the Amazon region, focusing on the effects of pulsed floods on soil erosion. In fact, fluvial responses may be dominated by the climatic shift in such circumstances, and climate change may also induce land-use changes, by making for instance agriculture either possible or impossible. This is why an explicit separation of the effects of climate and land-use changes on river sediments is complicated. Change in land use likely plays more important roles at the centennial time-scale while climate change may have had a strong impact and exerted important feedbacks on erosional processes and sediment transport in the last decades [103]. When only rainfall data are available on monthly basis, the use of models based on percentiles of the monthly precipitation distribution is desirable for long-term reconstructions [104]. The newly developed parsimonious model RSDA provides satisfactory estimates of sediment discharge as the only function of hierarchic antecedent rainfall data for the Amazon basin. It invokes a combination of monthly-based precipitation factors associated with rainfall amount and variability to explain the sustained sediment rates of the Amazon basin in the recent decades. Our model better estimates sediment discharge, as generated by hydrological and climatic forcing, than other competing parsimonious models of large use worldwide (e.g., [105,106]). Without the claim of providing information about the hydrology of the region, this study demonstrates the importance of the antecedent rainfall distribution and memory precipitation-runoff interaction for the prediction of the hydrological forcing of basin-wide sediment discharge. This suggests several hydrological implications, which must be taken into account when, for instance, the consequences of hydropower dams, mining, plantation expansion, and deforestation are monitored. Though lack of long-term records of sediment yields has hampered a complete evaluation of the RSDA model, the rationale of the model is that erosive events are reflected by year timespan memory of precipitation events and their antecedent monthly variability. We add that the seasonal windows and percentile values, over which erosion processes dominate and are relevant for sediment export rates, remain critical and may require review in the future (as the sample data size increases) to ensure the reliability of RSDA estimates at sites where detailed pluviometric series are missing. Then, our approach does not distinguish between channel and floodplain erosion, which would require a mechanistic approach. Even with these limitations, our results provide useful insights. First, they demonstrate the appropriateness of a semi-empirical (parsimonious) hydro-climatic model as a way to represent long-term erosive dynamics in an environmentally sensitive target area such as the Amazon basin. Second, they suggest that extreme hydrological events have been more frequent in the last decades in the study area. Third, the methodology used (which links variations in sediment discharge to changes in ocean circulation) generates climatologically interpretable sediment series. In fact, our results are consistent with changes in the variability of the hydrometeorology of the basin and add to a complementary body of literature that elucidates the mechanisms by which large-scale (ocean) phenomena drive soil erosion in Amazonia. In particular, some recent intense rainfalls and subsequent floods were associated (though not exclusively) with El Niño events occurring in the central equatorial Pacific Ocean. The latter point is promising for novel studies aimed to enhance research capabilities on hydrologic modelling and forecasting in the Amazon basin.

Supplementary Materials

The following are available online at https://www.mdpi.com/2073-4433/11/2/208/s1, Table S1: Precipitation and Niño-4 index data, and RSDA model estimates.

Author Contributions

N.D. conceived the study, performed the analysis and drafted the manuscript under the supervision of G.B., who wrote the final manuscript; N.F., P.B. and P.P. prepared and organized the sediment data used in the study, and contributed to scientific discussion of the article. All authors have read and agreed to the published version of the manuscript.

Funding

This study was mostly driven without grant support. N.F. received the support of the CAPES-PROCAD Amazonia Program.

Conflicts of Interest

The authors declare no conflict of interest.

References

  1. Lal, R. Soil carbon sequestration impacts on global climate change and food security. Science 2004, 304, 1623–1627. [Google Scholar] [CrossRef] [PubMed] [Green Version]
  2. Galy, V.; Peucker-Ehrenbrink, B.; Eglinton, T. Global carbon export from the terrestrial biosphere controlled by erosion. Nature 2015, 521, 204–207. [Google Scholar] [CrossRef] [PubMed]
  3. Borrelli, P.; Panagos, P.; Lugato, E.; Alewell, C.; Ballabio, C.; Montanarella, L.; Robinson, D.A. Lateral carbon transfer from erosion in noncroplands matters. Glob. Chang. Biol. 2018, 24, 3283–3284. [Google Scholar] [CrossRef] [PubMed] [Green Version]
  4. Hilton, R.G.; Galy, A.; Hovius, N.; Chen, M.C.; Horng, M.-J.; Chen, H. Tropical-cyclone-driven erosion of the terrestrial biosphere from mountains. Nat. Geosci. 2008, 1, 759–762. [Google Scholar] [CrossRef] [Green Version]
  5. Ferrier, K.L.; Huppert, K.L.; Perron, J.T. Climatic control of bedrock river incision. Nature 2013, 496, 206–209. [Google Scholar] [CrossRef]
  6. Paytan, A. Mountains, weathering, and climate. Science 2012, 335, 810–811. [Google Scholar] [CrossRef]
  7. Cheng, H.; Sinha, A.; Cruz, F.W.; Wang, X.; Lawrence Edwards, R.; d’Horta, F.M.; Ribas, C.C.; Vuille, M.; Stott, L.D.; Auler, A.S. Climate change patterns in Amazonia and biodiversity. Nat. Commun. 2013, 4, 1411. [Google Scholar] [CrossRef]
  8. Zemp, D.C.; Schleussner, C.-F.; Barbosa, H.M.J.; Hirota, M.; Montade, V.; Sampaio, G.; Staal, A.; Wang-Erlandsson, L.; Rammig, A. Self-amplified Amazon forest loss due to vegetation-atmosphere feedbacks. Nat. Commun. 2017, 8, 14681. [Google Scholar] [CrossRef]
  9. Panagos, P.; Borrelli, P.; Meusburger, K.; Bofu, Y.; Klik, A.; Jae Lim, K.; Yang, J.E.; Ni, J.; Miao, C.; Chattopadhyay, N.; et al. Global rainfall erosivity assessment based on high-temporal resolution rainfall records. Sci. Rep. 2017, 7, 4175. [Google Scholar] [CrossRef] [Green Version]
  10. Borrelli, P.; Robinson, D.A.; Fleischer, L.R.; Lugato, E.; Ballabiao, C.; Alewell, C.; Meusburger, K.; Modugno, S.; Schütt, B.; Ferro, V.; et al. An assessment of the global impact of 21st century land use change on soil erosion. Nat. Commun. 2017, 8, 2013. [Google Scholar] [CrossRef] [Green Version]
  11. Nam, P.T.; Yang, D.; Kanae, S.; Oki, T.; Musiake, K. Global soil loss estimate using Rusle model: The use of global spatial datasets on estimating erosive parameters. Geoinformatics 2003, 14, 49–53. [Google Scholar] [CrossRef] [Green Version]
  12. Frank, D.; Reichstein, M.; Bahn, M.; Thonicke, K.; Frank, D.; Mahecha, M.D.; Smith, P.; van der Welde, M.; Vicca, S.; Babst, F.; et al. Effects of climate extremes on the terrestrial carbon cycle: Concepts, processes and potential future impacts. Glob. Chang. Biol. 2015, 21, 2861–2880. [Google Scholar] [CrossRef] [PubMed] [Green Version]
  13. Higgins, A.; Restropo, J.C.; Ortiz, J.C.; Pierini, J.; Otero, L. Suspended sediment transport in the Magdalena River (Colombia, South America): Hydrologic regime, rating parameters and effective discharge variability. Int. J. Sediment Res. 2016, 31, 25–35. [Google Scholar] [CrossRef]
  14. Marchant, R.; Hooghiemstra, H. Rapid environmental change in African and South American tropics around 4000 years before present: A review. Earth-Sci. Rev. 2004, 66, 217–260. [Google Scholar] [CrossRef]
  15. Diodato, N.; Bellocchi, G. Introduction. In Storminess and Environmental Change: Climate Forcing and Response in the Mediterranean Region; Diodato, N., Bellocchi, G., Eds.; Springer: Dordrecht, The Netherlands, 2014; pp. 1–14. [Google Scholar]
  16. Dudgeon, D.; Arthington, A.H.; Gessner, M.O. Freshwater biodiversity: Importance, threats, status and conservation challenges. Biol. Rev. 2006, 81, 163–182. [Google Scholar] [CrossRef]
  17. Alho, C.J.R.; Reis, R.E.; Aquino, P.P.U. Amazonian freshwater habitats experiencing environmental and socioeconomic threats affecting subsistence fisheries. AMBIO 2015, 44, 412–425. [Google Scholar] [CrossRef] [Green Version]
  18. Constantine, J.A.; Dunne, T.; Ahmed, J.; Legleiter, C.; Lazarus, E.D. Sediment supply as a driver of river meandering and floodplain evolution in the Amazon Basin. Nat. Geosci. 2014, 7, 1–5. [Google Scholar] [CrossRef] [Green Version]
  19. Cherry, K.A.; Shepherd, M.; Withers, P.J.A.; Mooney, S.J. Assessing the effectiveness of actions to mitigate nutrient loss from agriculture: A review of methods. Sci. Total Environ. 2008, 406, 1–23. [Google Scholar] [CrossRef]
  20. Saavedra, C.P. Estimating Spatial Patterns of Soil Erosion and Deposition in the Andean Region Using Geo-Information Techniques: A Case Study in Cochabamba, Bolivia; ITC Dissertation; International Institute for Geo-Information Science and Earth Observation: Enschede, The Netherlands, 2005; p. 244. [Google Scholar]
  21. Merten, G.H.; Minella, P.G. The expansion of Brazilian agriculture: Soil erosion scenarios. Int. Soil Water Conserv. Res. 2013, 1, 37–48. [Google Scholar] [CrossRef] [Green Version]
  22. Locatelli, B.; Imbach, P.; Wunder, S. Synergies and trade-offs between ecosystem services in Costa Rica. Environ. Conserv. 2014, 41, 27–36. [Google Scholar] [CrossRef] [Green Version]
  23. Zimmerer, K.S. Soil erosion and labour shortages in the Andes with special reference to Bolivia, 1953–1991: Implications for Conservation with Development. World Dev. 1993, 21, 1659–1675. [Google Scholar] [CrossRef]
  24. Lal, R. Soil degradation by erosion. Land Degrad. Dev. 2011, 12, 519–539. [Google Scholar] [CrossRef]
  25. Kiladis, G.N.; Diaz, H.F. Global climatic anomalies associated with extremes in the Southern Oscillation. J. Clim. 1989, 2, 1069–1090. [Google Scholar] [CrossRef] [Green Version]
  26. Aalto, R.; Nittrouer, C.A. 210Pb geochronology of flood events in large tropical river systems. Philos. Trans. R. Soc. A 2012, 370, 2040–2074. [Google Scholar] [CrossRef] [PubMed]
  27. Jiménez-Muñoz, J.C.; Mattar, C.; Barichivich, J.; Santamaría-Artigas, A.; Takahashi, K.; Malhi, Y.; Sobrino, J.A.; van der Schrier, G. Record-breaking warming and extreme drought in the Amazon rainforest during the course of El Niño 2015–2016. Sci. Rep. 2016, 6, 33130. [Google Scholar] [CrossRef] [PubMed] [Green Version]
  28. Labrière, N.; Locatelli, B.; Laumonier, Y.; Freycon, V.; Bernoux, M. Soil erosion in the humid tropics: A systematic quantitative review. Agric. Ecosyst. Environ. 2015, 203, 127–139. [Google Scholar] [CrossRef]
  29. Langbein, W.B.; Schumm, S.A. Yield of sediment in relation to mean annual precipitation. Eos 1958, 39, 1076–1084. [Google Scholar] [CrossRef] [Green Version]
  30. Fournier, F. Climat et érosion; la relation entre l’érosion du sol par l’eau et les précipitations atmosphériques; Presses Universitaires de France: Paris, France, 1960; p. 203. (In French) [Google Scholar]
  31. Douglas, I. Man, vegetation and the sediment yield of rivers. Nature 1967, 215, 925–928. [Google Scholar] [CrossRef]
  32. Wilson, L. Variations in mean annual sediment yield as a function of mean annual precipitation. Am. J. Sci. 1973, 273, 335–349. [Google Scholar] [CrossRef]
  33. Walling, D.E.; Webb, B.W. Patterns of Sediment Yield. In Background to Paleohydrology; Gregory, K.J., Ed.; Wiley & Sons: Hoboken, NJ, USA, 1983; pp. 69–100. [Google Scholar]
  34. Paiva, R.C.D.; Buarque, D.C.; Collischonn, W.; Bonnet, M.-P.; Frappart, F.; Calmant, S. Large-scale hydrologic and hydrodynamic modeling of the Amazon River basin. Water Resour. Res. 2013, 49, 1226–1243. [Google Scholar] [CrossRef] [Green Version]
  35. Lewis, S.L.; Brando, P.M.; Phillips, O.L.; van der Heijden, G.M.F.; Nepstad, D. The 2010 Amazon drought. Science 2011, 331, 554. [Google Scholar] [CrossRef] [PubMed]
  36. Marengo, J.A.; Espinoza Villar, J.C. Extreme seasonal droughts and floods in Amazonia: Causes, trends and impacts. Int. J. Climatol. 2016, 36, 1033–1050. [Google Scholar] [CrossRef]
  37. Barichivich, J.; Gloor, E.; Peylin, P.; Brienen, R.J.W.; Schöngart, J.; Espinoza, J.C.; Pattnayak, K.C. Recent intensification of Amazon flooding extremes driven by strengthened Walker circulation. Sci. Adv. 2018, 4, eaat8785. [Google Scholar] [CrossRef] [PubMed] [Green Version]
  38. Marengo, J.A.; Souza, C.M., Jr.; Thonicke, K.; Burton, C.; Halladay, K.; Betts, R.A.; Alves, L.M.; Soares, W.R. Changes in climate and land use over the Amazon region: Current and future variability and trends. Front. Earth Sci. 2018, 6, 228. [Google Scholar] [CrossRef]
  39. Frappart, F.; Papa, F.; Guntner, A.; Werth, S.; Santos da Silva, J.; Tomasella, J.; Seyler, F.; Prigent, C.; Rossow, W.B.; Calmant, S.; et al. Satellite-based estimates of groundwater storage variations in large drainage basins with extensive floodplains. Remote Sens. Environ. 2011, 115, 1588–1594. [Google Scholar] [CrossRef] [Green Version]
  40. Costa, M.H.; Foley, J.A. The water balance of the Amazon basin: Dependence on vegetation cover and canopy conductance. J. Geophys. Res. 1997, 102, 973–990. [Google Scholar] [CrossRef]
  41. Gautier, E.; Brunstein, D.; Vauchel, P.; Jouanneau, J.-M.; Roulet, M.; Garcia, C.; Guyot, J.-L.; Castro, M. Channel and floodplain sediment dynamics in a reach of the tropical meandering Rio Beni (Bolivian Amazonia). Earth Surf. Process. Landf. 2010, 35, 1838–1853. [Google Scholar] [CrossRef]
  42. Tao, W.; Wu, J.; Wang, Q. Mathematical model of sediment and solute transport along slope land in different rainfall pattern conditions. Sci. Rep. 2017, 7, 44082. [Google Scholar] [CrossRef]
  43. Sebestyen, S.D.; Boyer, E.W.; Shanley, J.B. Responses of stream nitrate and dissolved organic carbon loadings to hydrological forcing and climate change in an upland forest of the northeast USA. J. Geophys. Res. 2009, 114, G02002. [Google Scholar] [CrossRef]
  44. Mahmoodabadi, M. Sediment yield estimation using a semi-quantitative model and GIS-remote sensing data. Int. Agrophys. 2011, 25, 241–247. [Google Scholar]
  45. Van der Fels-Klerx, H.J.; Van Asselt, E.D.; Raley, M.; Poulsen, M.; Korsgaard, H.; Bredsdorff, L.; Nauta, M.; D’agostino, M.; Coles, D.; Marvin, H.J.; et al. Critical review of methods for risk ranking of food-related hazards, based on risks for human health. Crit. Rev. Food Sci. 2018, 58, 178–193. [Google Scholar] [CrossRef] [PubMed] [Green Version]
  46. Pelletier, J.D. A spatially distributed model for the long-term suspended sediment discharge and delivery ratio of drainage basins. J. Geophys. Res. 2012, 117, F02028. [Google Scholar] [CrossRef] [Green Version]
  47. Fekete, B.M.; Vörösmarty, C.J. The current status of global river discharge monitoring and potential new technologies complementing traditional discharge measurements. Predictions in ungauged basins. IAHS Publication 2007, 309, 129–136. [Google Scholar]
  48. Sichangi, A.W.; Wang, L.; Yang, K.; Chen, D.; Wang, Z.; Li, X.; Zhou, J.; Liu, W.; Kuria, D. Estimating continental river basin discharges using multiple remote sensing data sets. Remote Sens. Environ. 2016, 179, 36–53. [Google Scholar] [CrossRef] [Green Version]
  49. Callède, J.; Guyot, J.L.; Ronchail, J.; L’hote, Y.; Niel, H.; De Oliveira, E. Evolution du débit de l’Amazone á Óbidos de 1903 á 1999. Hydrol. Sci. J. 2004, 49, 85–97. (In French) [Google Scholar] [CrossRef] [Green Version]
  50. Available online: http://www.ore-hybam.org (accessed on 15 February 2020).
  51. Martinez, J.M.; Guyot, J.L.; Filizola, N.; Sondag, F. Increase in suspended sediment discharge of the Amazon River assessed by monitoring network and satellite data. Catena 2009, 79, 257–264. [Google Scholar] [CrossRef] [Green Version]
  52. Toy, T.J.; Foster, G.R.; Renard, K.J. Soil Erosion: Processes, Prediction, Measurement, and Contro; John Wiley & Sons: New York, NY, USA, 2002; p. 352. [Google Scholar]
  53. Garstang, M.; Massie, L., Jr.; Halverson, J.; Greco, S.; Scala, J. Amazon coastal squall lines, Part I, Structure and kinematics. Mon. Weather Rev. 1994, 122, 608–622. [Google Scholar] [CrossRef] [Green Version]
  54. Melo, D.d.C.D.; Wendland, E. Hydrological system time lag responses to meteorological shifts. Braz. J. Water Resour. 2016, 21, 766–776. [Google Scholar] [CrossRef] [Green Version]
  55. Available online: https://www.esri.com (accessed on 15 February 2020).
  56. Espinoza Villar, J.C.; Ronchail, J.; Guyot, J.L.; Junquas, C.; Vauchel, P.; Lavado, W.; Drapeau, G.; Pombosa, R. Climate variability and extreme drought in the upper Solimões River (western Amazon Basin): Understanding the exceptional 2010 drought. Geophys. Res. Lett. 2011, 38, L13406. [Google Scholar] [CrossRef]
  57. Marengo, J.A.; Tomasella, J.; Alves, L.M.; Soares, W.R.; Rodriguez, D.A. The drought of 2010 in the context of historical droughts in the Amazon region. Geophys. Res. Lett. 2011, 38, 1–5. [Google Scholar] [CrossRef] [Green Version]
  58. Guyot, J.L.; Bazan, H.; Fraizy, P.; Ordonez, J.J.; Armijos, E.; Crave, A. Suspended sediment yields in the Amazon basin of Peru: A first estimation. Int. Assoc. Hydrol. Sci. Publ. 2007, 314, 1–8. [Google Scholar]
  59. Available online: http://climexp.knmi.nl/start.cgi (accessed on 15 February 2020).
  60. Compo, G.P.; Whitaker, J.S.; Sardeshmukh, P.D.; Matsui, N.; Allan, R.J.; Yin, X.; Gleason, B.E.; Vose, R.S.; Rutledge, G.; Bessemoulin, P.; et al. The twentieth century reanalysis project. Quart. J. R. Meteorol. Soc. 2011, 137, 1–28. [Google Scholar] [CrossRef]
  61. Espinoza Villar, J.C. Impact de la variabilitè climatique sur l’hydrologie du bassin amazonien; Diplôme, Université de Paris 6: Paris, France, 2009; p. 202. (In French) [Google Scholar]
  62. Da Silva, A.M. Rainfall erosivity map for Brazil. Catena 2004, 57, 251–259. [Google Scholar] [CrossRef]
  63. Aronica, G.; Ferro, V. Rainfall erosivity over the Calabria region. Hydrol. Sci. J. 1997, 42, 35–48. [Google Scholar] [CrossRef]
  64. Diodato, N.; Borrelli, P.; Fiener, P.; Bellocchi, G.; Romano, N. Discovering historical rainfall erosivity with a parsimonious approach: A case study in Western Germany. J. Hydrol. 2017, 544, 1–9. [Google Scholar] [CrossRef]
  65. Pelacani, S.; Märker, M.; Rodolfi, G. Simulation of soil erosion and deposition in a changing land use: A modelling approach to implement the support practice factor. Geomorphology 2008, 99, 329–340. [Google Scholar] [CrossRef]
  66. Diodato, N.; Higgins, S.; Bellocchi, G.; Fiorillo, F.; Romano, N.; Guadagno, F.M. Hydro-climatic forcing of dissolved organic carbon in two boreal lakes of Canada. Sci. Total Environ. 2016, 571, 50–58. [Google Scholar] [CrossRef]
  67. Marengo, J.A.; Tomasella, J.; Uvo, C. Trends in streamflow and rainfall in tropical South America: Amazonia, eastern Brazil, and northwestern Peru. J. Geophys. Res. 1998, 103, 1775–1783. [Google Scholar] [CrossRef]
  68. Available online: https://demo.f4map.com/#camera.theta=0.9 (accessed on 15 February 2020).
  69. Callède, J.; Ronchail, J.; Guyot, J.-L.; De Oliveiraet, E. Deboisement Amazonien: Son influence sur le débit de l’Amazone à Óbidos (Bresil). Revue des Sciences de l’Eau 2008, 21, 59–72. (In French) [Google Scholar] [CrossRef] [Green Version]
  70. Espinoza Villar, J.C.; Ronchail, J.; Guyot, J.-L.; Cochonneau, G.; Naziano, F.; Lavado, W.; De Oliveira, E.; Pombosa, R.; Vauchel, P. Spatio-temporal rainfall variability in the Amazon basin countries (Brazil, Peru, Bolivia, Colombia, and Ecuador). Int. J. Climatol. 2009, 29, 1574–1594. [Google Scholar] [CrossRef] [Green Version]
  71. Diodato, N.; Grauso, S. An improved correlation model for sediment delivery ratio assessment. Environ. Earth Sci. 2009, 59, 223–231. [Google Scholar] [CrossRef]
  72. Quinton, J.N.; Catt, J.A.; Wood, G.A.; Steer, J. Soil carbon losses by water erosion: Experimentation and modeling at field and national scales in the UK. Agric. Ecosyst. Environ. 2006, 112, 87–102. [Google Scholar] [CrossRef] [Green Version]
  73. Willmott, C.J.; Matsuura, K. Advantages of the mean absolute error (MAE) over the root mean square error (RMSE) in assessing average model performance. Clim. Res. 2005, 30, 79–82. [Google Scholar] [CrossRef]
  74. Durbin, J.; Watson, G.S. Testing for serial correlation in least squares regression. II. Biometrika 1951, 38, 159–177. [Google Scholar] [CrossRef]
  75. Granger, C.W.J.; Hyung, N.; Jeon, Y. Spurious regressions with stationary series. Appl. Econ. 2001, 33, 899–904. [Google Scholar] [CrossRef]
  76. Nau, R. STATGRAPHICS V.5: Overview & Tutorial Guide. 2005. Available online: http://www.duke.edu/~rnau/sgwin5.pdf (accessed on 15 February 2020).
  77. Wessa, P. A framework for statistical software development, maintenance, and publishing within an open-access business model. Comput. Stat. 2009, 24, 183–193. [Google Scholar] [CrossRef]
  78. Walling, D.E. The Impact of Global Change on Erosion and Sediment transport by Rivers: Current Progress and Future Challenges; United Nations Educational, Scientific and Cultural Organization: Paris, France, 2009; p. 26. [Google Scholar]
  79. Syvitski, J.P.; Morehead, M.D.; Bahr, D.B.; Mulder, T. Estimating fluvial sediment transport: The rating parameters. Water Resour. Res. 2000, 36, 2747–2760. [Google Scholar] [CrossRef] [Green Version]
  80. Castillo, V.M.; Gómez-Plata, A.; Martínez-Mena, M. The role of antecedent soil water content in the runoff response of semiarid catchments: A simulation approach. J. Hydrol. 2003, 284, 114–130. [Google Scholar] [CrossRef]
  81. Lohani, A.K.; Goel, N.K.; Bhatia, K.K.S. Deriving stage–discharge–sediment concentration relationships using fuzzy logic. Hydrol. Sci. J. 2007, 52, 793–807. [Google Scholar] [CrossRef]
  82. Mattikalli, N.M.; Devereux, B.J.; Rchards, K.S. Prediction of river discharge and surface water quality using an integrated geographical information system approach. Int. J. Remote Sens. 1996, 17, 683–701. [Google Scholar] [CrossRef]
  83. Tauro, F.; Porfiri, M.; Grimaldi, S. Surface flow measurements from drones. J. Hydrol. 2016, 540, 240–245. [Google Scholar] [CrossRef] [Green Version]
  84. Thomas, M.F. Landscape sensitivity in time and space—An introduction. Catena 2001, 42, 83–98. [Google Scholar] [CrossRef]
  85. Diodato, N.; Gericke, A.; Bellocchi, G. Modelling the inter-annual variability of sediment yields: A case study for the upper Lech River. Catena 2012, 97, 12–19. [Google Scholar] [CrossRef]
  86. Diodato, N.; de Vente, J.; Bellocchi, G.; Guerriero, L.; Soriano, M.; Fiorillo, F.; Revellino, P.; Guadagno, F.M. Estimating long-term sediment export using a seasonal rainfall-dependent hydrological model in the Glonn River basin, Germany. Geomorphology 2015, 228, 628–636. [Google Scholar] [CrossRef]
  87. Diodato, N.; Mao, L.; Borrelli, P.; Panagos, P.; Fiorillo, F.; Bellocchi, G. Climate-scale modelling of suspended sediment load in an Alpine catchment debris flow (Rio Cordon-northeastern Italy). Geomorphology 2018, 309, 20–28. [Google Scholar] [CrossRef]
  88. Braga, B.; Varella, P.; Gonçalves, H. Transboundary water management of the Amazon Basin. Int. J. Water Resour. Dev. 2011, 27, 477–496. [Google Scholar] [CrossRef]
  89. Keen, C. Greatest Places Physical Geography, Amazon Basin. 1997. Available online: http://www.greatestplaces.org/notes/amazon.htm (accessed on 15 February 2020).
  90. Liu, W.; Huang, B.; Thorne, P.W.; Banzon, V.F.; Zhang, H.-M.; Freeman, E.; Lawrimore, J.; Peterson, T.C.; Smith, T.M.; Woodruff, S.D. Extended reconstructed sea surface temperature version 4 (ERSST.v4): Part II. Parametric and structural uncertainty estimations. J. Clim. 2014, 28, 931–951. [Google Scholar] [CrossRef]
  91. Wang, X.-Y.; Li, X.; Zhu, J.; Tanajura, C.A.S. The strengthening of Amazonian precipitation during the wet season driven by tropical sea surface temperature forcing. Environ. Res. Lett. 2018, 13, 094015. [Google Scholar] [CrossRef] [Green Version]
  92. Jadhav, J.; Panickal, S.; Marathe, S.; Ashok, K. On the possible cause of distinct El Niño types in the recent decades. Sci. Rep. 2015, 5, 17009. [Google Scholar] [CrossRef] [Green Version]
  93. Li, X.; Xie, S.-P.; Gille, S.T.; Yoo, C. Atlantic-induced pan-tropical climate change over the past three decades. Nat. Clim. Chang. 2016, 6, 275–279. [Google Scholar] [CrossRef]
  94. Bjerknes, J. Atmospheric teleconnections from the equatorial Pacific. Mon. Weather Rev. 1968, 97, 163–172. [Google Scholar] [CrossRef]
  95. Li, W.; Zhang, P.; Ye, J.; Li, L.; Baker, P.A. Impact of two different types of El Niño events on the Amazon climate and ecosystem productivity. J. Plant Ecol. 2011, 4, 91–99. [Google Scholar] [CrossRef]
  96. Foley, J.A.; Botta, A.; Coe, M.T. El Niño–Southern oscillation and the climate, ecosystems and rivers of Amazonia. Glob. Biogeochem. Cycles 2002, 16, 1132. [Google Scholar] [CrossRef]
  97. Aalto, R.; Maurice-Bourgoin, L.; Dunne, T.; Montgomery, D.R.; Nittrouer, C.A.; Guyot, J.L. Episodic sediment accumulation on Amazonian flood plains influenced by El Niño/Southern Oscillation. Nature 2003, 425, 493–497. [Google Scholar] [CrossRef] [PubMed]
  98. Apaéstegui, J.; Cruz, F.W.; Sifeddine, A.; Espinoza Villar, J.C.; Guyot, J.-L.; Khodri, M.; Strikis, N.; Santos, R.V.; Cheng, H.; Edwards, L.; et al. Hydroclimate variability of the South American Monsoon System during the last 1600 year inferred from speleothem isotope records of the north-eastern Andes foothills in Peru. Clim Past Discuss. 2014, 10, 533–561. [Google Scholar] [CrossRef] [Green Version]
  99. Mello, C.R.; Norton, L.D.; Curi, N.; Yanagi, S.N.M.; Silva, A.M. El-Niño southern oscillation and rainfall erosivity in the headwater region of the Grande River Basin, Southeast Brazil. Hydrol. Earth Syst. Sci. Discuss. 2011, 8, 10707–10738. [Google Scholar] [CrossRef]
  100. Jahfer, S.; Vinayachandran, P.N.; Nanjundiah, R.S. Long-term impact of Amazon river runoff on northern hemispheric climate. Sci. Rep. 2017, 7, 10989. [Google Scholar] [CrossRef] [Green Version]
  101. Cohen, S.; Kettner, A.J.; James, J.; Syvitski, P.M. Global suspended sediment and water discharge dynamics between 1960 and 2010: Continental trends and intra-basin sensitivity. Glob. Planet. Chang. 2014, 115, 44–58. [Google Scholar] [CrossRef]
  102. Davidson, E.A.; de Araújo, A.C.; Artaxo, P.; Balch, J.K.; Brown, I.F.; Bustamante, M.M.C.; Coe, M.T.; DeFries, R.S.; Keller, M.; Longo, M.; et al. The Amazon basin in transition. Nature 2012, 481, 321. [Google Scholar] [CrossRef]
  103. Diodato, N.; Esposito, L.; Bellocchi, G. A first regional-scale estimate of climate-driven terrestrial carbon export in boreal catchments. Climate 2018, 6, 22. [Google Scholar] [CrossRef] [Green Version]
  104. Diodato, N.; Verstraeten, G.; Bellocchi, G. Decadal modelling of rainfall erosivity in Belgium. Land Degrad. Dev. 2014, 25, 511–519. [Google Scholar] [CrossRef]
  105. Lal, R. Soil erosion and sediment transport research in tropical Africa. Hydrol. Sci. J. 1985, 30, 239–256. [Google Scholar] [CrossRef] [Green Version]
  106. Verstraeten, G.; Poesen, J. Factors controlling sediment yield from small intensively cultivated catchments in a temperate humid climate. Geomorphology 2001, 40, 123–144. [Google Scholar] [CrossRef]
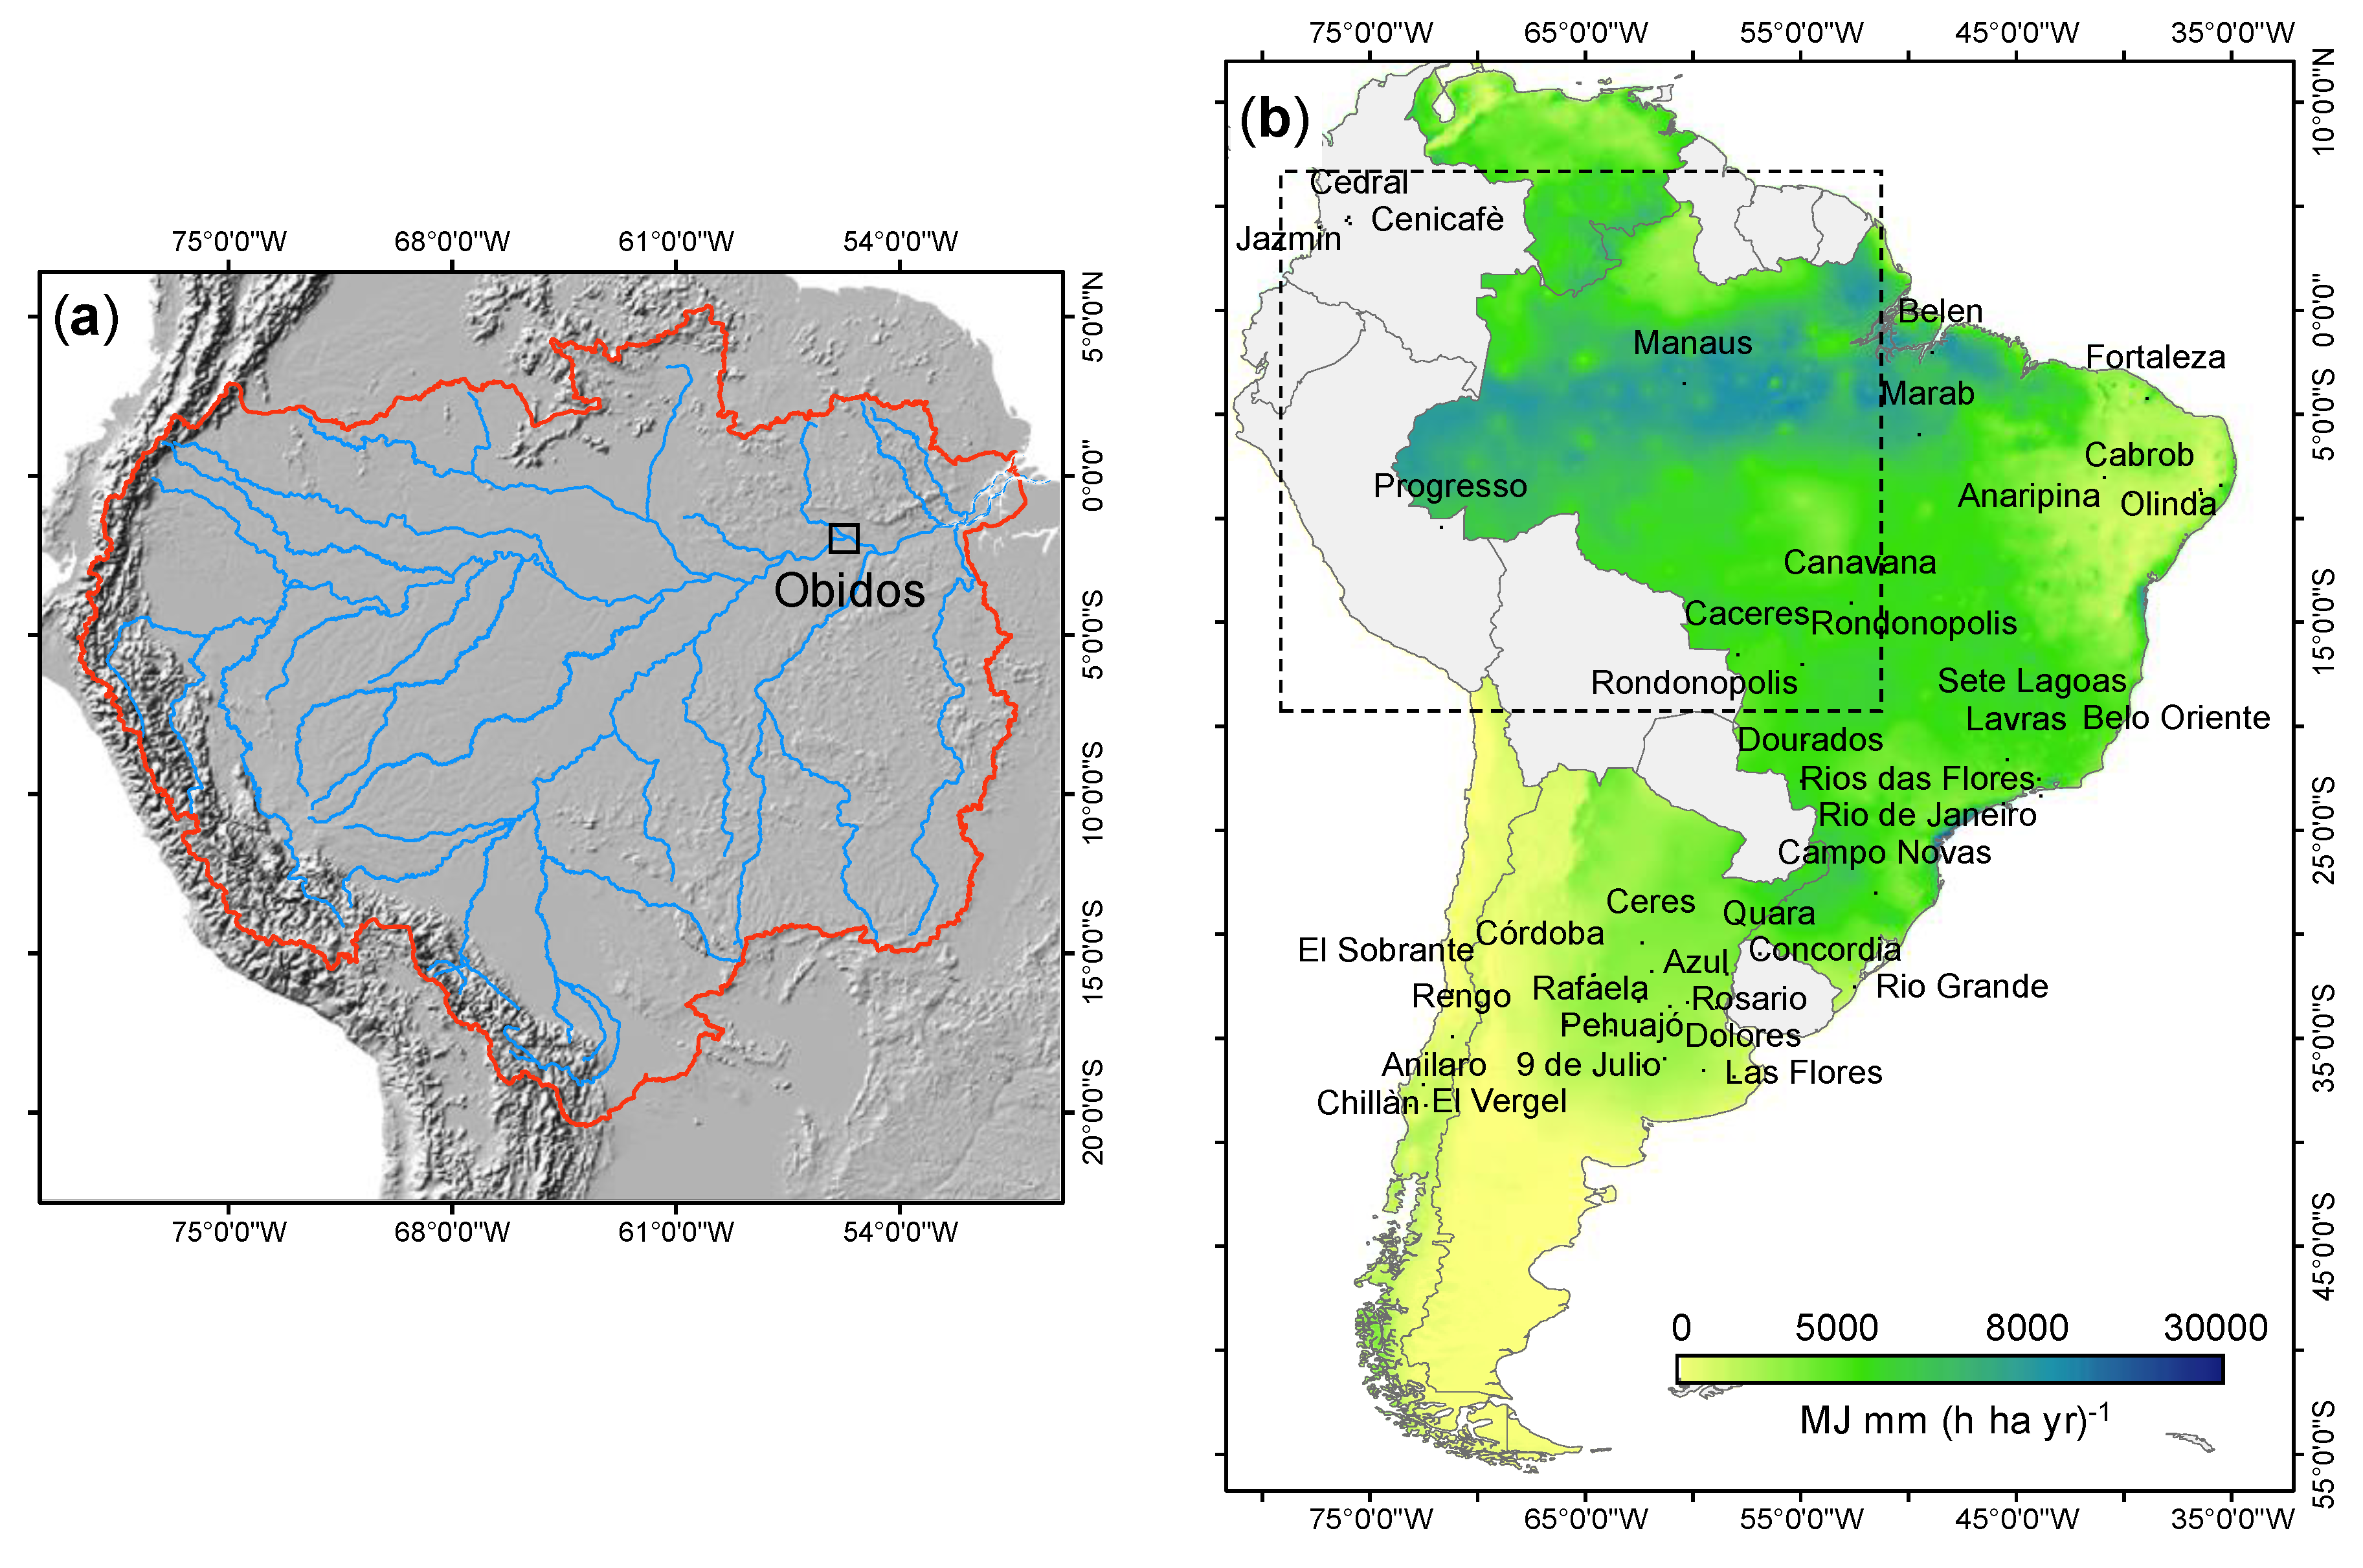
Figure 1. (a) Amazon River Basin with the drainage network and station of Óbidos where river sediment discharge is measured. (b) Erosivity map of South America (annual mean of the period 2002–2011), based on the Revised Universal Soil Loss Equation as arranged from Panagos et al. [9] (map view created from a basic Environmental Systems Research Institute (ESRI) ArcGIS configuration [55]).
Atmosphere 11 00208 g001
Figure 2. Perspective view of a nested scheme of hydrological processes modelling for Amazonia drainage basin (arranged from OpenStreet Map [68]). BGE, Basin Gross Erosion; CGE, Catchment Gross Erosion.
Atmosphere 11 00208 g002
Figure 3. Performance of the RSD model for the Amazonia River basin (Equation (1)) in the period 1997–2014. (a) Scatterplot of observed and predicted river sediment discharge (Mg km−2 year−1), with their respective 1:1 line, the inner bounds showing 90% confidence limits for the mean y of many observations at given values of x, and the outer bounds showing 95% prediction limits for new observations. (b) Histogram of residuals. (c) Coevolution of RSDA model estimates (blue curve) and observed sediment load (brown histogram) for the validation stage at the Magdalena River basin (Colombia, from Walling [78]), both expressed in Mg km−2 year−1.
Atmosphere 11 00208 g003
Figure 4. Scatterplots between observed and predicted sediment rates (Mg km−2 year−1). (a) Water discharge model, Equation (6). (b) Fournier Index-based model, Equation (7). (c) Antecedent rainfall-based model, Equation (8), with their respective 1:1 line, the inner bounds showing 90% confidence limits for the mean y of many observations at given values of x, and the outer bounds showing 95% prediction limits for new observations.
Atmosphere 11 00208 g004
Figure 5. (a) Reconstructed river sediment discharge rate (orange curve) in the Amazonia River basin over 1858–2014 by means of the RSDA model (Equation (1); Table S1) with over-imposed mean values (orange dotted lines) before and after the first change point of series in 1931 (bold red vertical line) as found by cumulative deviation-Buishand test, and the annual evolution of Niño-4 (grey curve, from [90] with its smoothed long-term trend (black curve). (b) the rainfall rate change occurred during the wet season (1979–2015) across Southern America as derived from CRU dataset (arranged from [91]).
Atmosphere 11 00208 g005