Abstract
During intense heat episodes, the human population suffers from an increased morbidity and mortality. In order to minimize such negative health impacts, the general public and the public health authorities are informed and warned by means of an advanced procedure known as a “heat health warning system” (HHWS). It is aimed at triggering interventions and at taking preventive measures. The HHWS in Germany has been in operation since 2005. The present work is aimed at showing the updated structure of an advanced HHWS that has been developed further several times during its 15 years of operation. This is to impart knowledge to practitioners about the concept of the system. In Germany, dangerous heat episodes are predicted on the basis of the numerical weather forecast. The perceived temperature as an appropriate thermal index is calculated and used to assess the levels of heat stress. The thermo-physiologically based procedure contains variable thresholds taking into account the short time acclimatization of the people. The forecast system further comprises the nocturnal indoor conditions, the specific characteristics of the elderly population, and the elevation of a region. The heat warnings are automatically generated, but they are published with possible adjustments and a compulsory confirmation by the biometeorology forecaster. Preliminary studies indicate a reduction in the heat related outcomes. In addition, the extensive duration of the strongest heat wave in summer 2018, which lasted three weeks, highlights the necessity of the HHWS to protect human health and life.
1. Introduction
During intense heat episodes, the human population suffers from an increased morbidity and mortality. As seen with the 2003 heat waves, this has been drastically experienced [1,2,3,4]. Due to climate change, heat waves are expected to occur more often, more intensely, and with increasing length in the future. Heat-related mortality is expected to increase [2,5]. In particular, the chronically ill, the elderly, the very young children, and the socially isolated people are at risk [6].
In Europe, a climatically heterogeneous area, a number of very different definitions of heat waves are used, which makes comparison a challenge. In order to make reliable assessments of the occurrence of such events, a uniform representation of their properties (duration, intensity, spatial extend) is important and can be done climatologically in the first instance. The Regional Climate Centre on Climate Monitoring for Europe of the World Meteorological Organization (dwd.de/rcc-cm) creates and continuously updates such evaluation of long term records of heat waves (Figure 1). Criteria for the detection of extreme heat waves are the 98th percentile and a threshold of 28 °C and a duration of at least three days [7]. The position of the bubble is determined by the number of days with heat wave (x-axis) and the mean temperature deviation (y-axis). The radius results from the area where the criteria for a heat wave are fulfilled. According to this climatological study, the number and the duration of heat waves in Europe have increased in the long range. Considering the last 70 years, the top 13 heat waves (out of the top 23) occurred during the last 12 years, while there were only seven heat waves during the 50 years before the year 2000. In Europe, several heat waves with very large average anomalies in the range of 12 Kelvin occurred in 2019, but due to their short duration and limited area affected, they are not among the top 23 of the last 70 years.
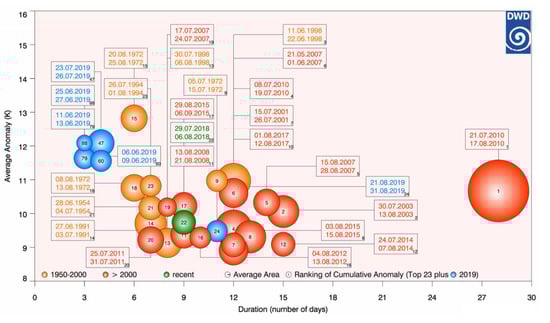
Figure 1.
Heat waves over Europe 1950–2019.
In order to minimize negative health impacts of heat waves, the general public and the public health authorities are informed and warned by means of an advanced procedure known as a “heat health warning system (HHWS)”. It is aimed at triggering interventions and at taking preventive measures. Weather services in many European countries have implemented heat health warning systems as a consequence of the 2003 heat waves. Specific periods of heat are predicted by the numerical weather forecast as part of the HHWS, which are epidemiologically known to have negative implications on human health [6]. Sixteen European HHWSs have currently been reviewed [8]. With respect to the criteria for issuing a heat warning, the HHWSs in Europe show heterogeneity, while the implemented intervention strategies are similar. Many countries such as the Netherlands, Hungary, Portugal, Slovenia, North Macedonia, Romania, Sweden, and Greece use maximum temperature or mean temperature [8]. In some countries such as France, England, Spain, and Belgium, the warnings are based on maximum and minimum temperature. Only a few countries take into account other relevant meteorological variables such as humidity (Switzerland), air masses (Italy), humidity, wind speed, and solar and thermal radiation (Austria, Germany) [8]. Epidemiological studies of mortality data are used in most countries to determine the threshold above which a warning is issued. Usually only one threshold is applied for the whole country; however, in some countries, regionally specific thresholds are common. Research on the effectiveness of the HHWSs is very limited [9].
The basic concept of the German HHWS is the calculation of the perceived temperature. This thermal index allows for an assessment of the atmospheric environment in terms of human thermal stress. Based on epidemiological studies of mortality data from various regions in Europe, the impact of the different thermal stress categories on human health is known, and heat warnings reflect the results of these analyses [10,11,12]. Unfortunately, morbidity data do rarely result in significant findings. “Strong” and “extreme” heat load result in a distinct deviation of actual mortality from the expectation values [10]. In all regions, days with a strong heat load are characterized by a 13% increase in mortality rate above the expected values [6,10]. A significant increase in mortality is even found for days with a moderate heat load [13].
In addition to the sound issue of heat warnings, the HHWS needs to include an appropriate communication strategy. In order to protect health and life of the population, intervention measures have to be established based on well-structured and comprehensive preparedness plans [6,12,13,14].
The HHWS in Germany has been in operation since 2005. The present work is aimed at showing the updated structure of an advanced HHWS that has been developed further several times during its 15 years of operation. This is to impart knowledge to practitioners about the concept of the system.
2. Methodology
Several modules form the HHWS of the Deutscher Wetterdienst (DWD). The heat warnings are automatically generated based on the numerical weather forecasts, but they are published with possible adjustments and a compulsory confirmation by the biometeorology forecaster. The HHWS includes a communication strategy and recommendations of intervention measures to be taken. The modules are explained in the following.
2.1. Perceived Temperature
Heat health warnings require an assessment of the atmospheric environment in terms of human thermal stress. Hence, there is a need for a physical description of the human thermal environment, which has to be completed by a reproduction of the human thermoregulatory system and its interaction with the atmospheric environment [15]. The energy exchange occurs mainly via the turbulent flux of latent heat, the turbulent flux of sensible heat, the long- and the shortwave radiant fluxes, and the respiratory heat flux. This pathway of energy exchange can be described by the following meteorological variables: air temperature, wind speed at the height of the human body, air humidity, and mean radiant temperature [16,17], together with the non-meteorological factors affecting thermo-physiology—the clothing and the metabolic rate [15,16,18].
The DWD calculates the thermal index perceived temperature (PT) in order to assess heat with respect to human thermal stress (Table 1). PT is an equivalent temperature (dimension °C) referring to a reference environment. The basis of the procedure is a complete energy budget model of the human body. All relevant mechanisms of energy exchange between the human body and the atmospheric environment are included [19,20]. The physical and the metabolic characteristics of the individuals in the population are standardized in the form of a male named “Klima-Michel” (35 years, 1.75 m, 75 kg), who performs an activity equivalent to walking with 4 km/h. If possible, the reference person adapts to remain in thermal comfort. In the heat, this is realized by changing to light summer clothes (shorts, T-Shirt) [20].

Table 1.
Perceived temperature, thermal perception, and physiological stress [18,20].
The DWD numerical weather forecast in hourly time steps is used to calculate PT. Dangerous heat episodes are identified by means of the criteria “strong heat stress” and “extreme heat stress” (Table 1) according to the 12 Coordinated Universal Time (UTC) prediction of PT. Predictions of “moderate heat load” do not cause warnings in order to prevent “warning fatigue”, as these conditions are usually fulfilled 30 to 40 times a year in Germany.
2.2. Short-Term Heat Acclimatization
Physiological changes (e.g., an increasing sweat production and blood volume, a reduced increase in core temperature and heart rate) occur if humans are consecutively exposed to heat [10]. This short-term heat acclimatization is gained after several days to two weeks and will be lost in the course of approximately one month in case heat exposure ended [10]. To include the short-term heat acclimatization in the German HHWS, the thermal conditions of the last 30 days are used for adjusting the upper threshold of the category “comfortable” (Table 1) and the thresholds of the heat stress categories accordingly [10]. Hence, these are variable thresholds. The 6 K-range of the thermo-physiological stress categories (Table 1) remains unchanged. In case of long lasting heat episodes, the lower threshold of the category “strong heat load” is continuously rising. In order to ensure the sound issue of heat warnings, this is limited to 34 °C PT (Figure 2).
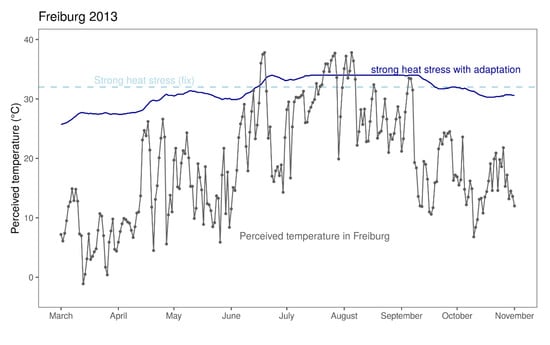
Figure 2.
Perceived temperature in Freiburg (gray) in 2013 in comparison to the fixed (dashed blue, 32 °C) and the variable (solid blue) thresholds for strong heat stress.
In addition, climatological reasons account for regional differences in the thresholds of the thermo-physiological stress categories. This is reflected by generally lower values in northern Germany compared to the southern parts of the country [6].
2.3. Special Characteristics of the Elderly Population
Elderly people experience greater thermal stress during exposure to hot environments [21,22]. This greater level of thermal stress may be related to age-dependent physiological changes, which reduce the capacity of the human body to dissipate heat [23,24,25].
Aimed at the extension of the reference person “Klima-Michel” to the elderly, an additional elderly reference person, “Klima-Michel Senior”, with changed age, weight, and activity was introduced. The elderly reference person is 75 years old, 1.75 m tall, weighs 70 kg, and performs an activity equivalent to walking with 1 km/h. The age-dependent reduction in the body’s physiological capacity to dissipate heat is realized by changed physiological parameters of thermoregulation in the Gagge two-node-model underlying the calculation of predicted mean vote (PMV) and PT [20,26]. The changes in thermoregulation comprise a reduction of sweat rate, a lower elasticity of the blood vessels, and a lower skin blood flow [24]. In accordance with this, in case of thermal neutrality, the control values of the skin temperature are lower and of the core temperature are slightly higher in the “Klima-Michel Senior” thermoregulation model compared to the “Klima-Michel” thermoregulation model.
In the case of a warm environment, the elderly person stays longer in the comfort range, i.e., up to higher values of PT. This is in accordance with their lower internal heat production (metabolic rate) due to a lower physical activity. When the elderly person leaves the comfort range and stays in the range of heat stress, the intensity of their thermal stress is increasing more rapidly compared to the usual reference person. The “Klima-Michel Senior” shows an increased sensitivity to heat. Both the usual and the elderly reference person reach the heat warning threshold of “strong heat stress” at the same value of PT. There are strong demands on the thermoregulatory system, but it is still able to cope with the requirements. The heat warning threshold of “extreme heat stress” is reached by the “Klima-Michel Senior” at a lower value of PT compared to the “Klima-Michel”. There are much stronger demands on the thermoregulatory system of the elderly.
In order to better represent the increased thermal sensitivity of the elderly in the HHWS, the warning of “strong heat stress” is extended by a flexible text module. This module indicates the stronger sensitivity of the elderly and gives behavioral advice. It is used in case the “Klima-Michel Senior” reaches the threshold of “extreme heat stress”, but this is not yet true for the “Klima-Michel”.
2.4. Nocturnal Conditions
Human health also crucially depends on adequate and restful sleep. Normally, people spend the night indoors, and the sleep can be disturbed by ambient heat. Hence, for the issue of heat warnings, there is an additional need to estimate the indoor thermal conditions, which can be done by the use of a building simulation model [27].
The basis of the model is ESP-r (Environmental System Performance; r for “research”) [28], and the thermal conditions inside building depend on a large number of different factors, such as building age, size, and type, the materials of the building, the exposition, and the user behavior [29]. As it is not possible to consider all possible combinations of these parameters in a HHWS, a standard building was defined. It represents a nursing facility according to the typical construction in the 1990s or later with little cross-ventilation and air-proof facade. An air flow network with several nodes in the room is used to simulate the natural ventilation [30].
The building model resembles a good modern standard in Germany. The geometric model consists of two standard rooms (14.25 m2 base area, 2.8 m height) connected by a corridor. There are two large windows side by side (1.3 m2 opening section). The windows can be tilted or totally opened. The windows have external shading and double heat protection glass. The window of one room is oriented to the east, while the other room is oriented to the west. An in-depth evaluation of the building simulation model is given in [27].
In the HHWS, the indoor temperature is simulated for each room, using the current weather forecast for the next days for each of the more than 800 warning districts of Germany. For each warning district, the nocturnal indoor temperature used in the HHWS is defined by the maximum of the average nocturnal temperatures in the east- and the west-exposed rooms.
2.5. Special Characteristics of Urban Areas
For a more comprehensive implementation of the nocturnal conditions in urban areas, a specific approach was developed for cities with a population of more than 100,000 inhabitants. Following the work of [31], an urban heat island effect is added to the weather forecast as a function of the size of the city, the time and day of the year, and the wind speed and cloud cover of the previous 24 h. The nocturnal indoor conditions are then calculated as described before but using the modified weather forecast as input data. By this approach, the nocturnal indoor temperature including the urban heat island effect can be estimated in the HHWS.
During the day and the summer months, the effect of the urban heat island is small [31]. Therefore, no adjustments of the 12 UTC PT are needed.
2.6. Automated Warning Proposal and Human Based Check and Decision
The automated warning proposal considers the overall situation according to the description in the Section 2.1, Section 2.2, Section 2.3, Section 2.4 and Section 2.5, mainly indoors for the eight hours during the night and outdoors for the thermal stress conditions during midday (12 UTC).
The 48 h numerical weather prediction provides the input data to calculate PT for the actual and the next day (Figure 3). Previously stored values of PT of the last 30 days enable the adjustment of the thermal stress thresholds to account for short-term acclimatization. This is done for all counties across Germany. There is automatically proof of whether the threshold of the category “strong heat load” will be exceeded and up to which altitudes. In case of threshold achievement, a warning recommendation is automatically created, but the warnings are published only with human intervention, i.e., possible adjustments and a compulsory confirmation by the biometeorology forecaster. Additionally, if the forecasters expect a critical situation, they have the option to add warnings [6]. In case of specific conditions, such as extraordinary conditions of air humidity or specific weather situations such as fronts, they also partly consider the time during early and late hours of the day outdoors. The warning is issued on county level and is valid for distinct elevation ranges. It covers a two day period.
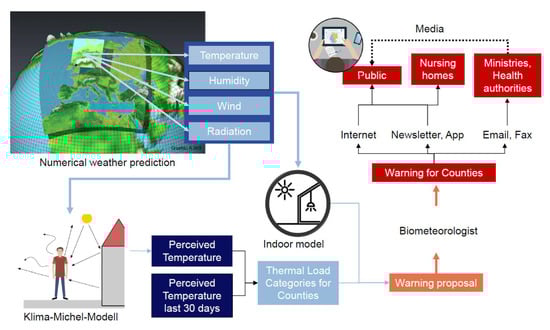
Figure 3.
Workflow of the German heat health warning system (HHWS) and the dissemination of warnings.
2.7. Dissemination of Warnings
The heat health warnings for German counties are targeted at governmental authorities and ministries of the federal states, the nursing homes, and the general public (Figure 3). The warnings are electronically disseminated via internet, newsletter, smartphone application, or e-mail.
On the DWD website (https://www.dwd.de), the warnings are displayed in maps linked with an explanatory text. The text provides information about the expected intensity of the heat stress, the affected altitude range, additional information for the elderly and cities if relevant, and recommendations for a health protective behavior. This textual information is also part and parcel of the daily newsletter for registered users as well as the other dissemination ways.
In order to protect health and life of the population, intervention measures have to be brought into action based on well-structured and comprehensive preparedness plans. After being notified by the DWD, the relevant health and supervisory authorities are responsible for the realization and the monitoring of the actions according to the heat preparedness plans. Heat load information for the next 2–7 days completes the heat warning for the two day period. The warning also informs about the duration (number of days) the heat warning has been active.
Additionally, the mass media (radio and television) can broadcast the warning and make it known more widely to the public. Usually, this also initiates conventional and electronic print media to issue further reports and give advice of how to protect the health of one’s own and others that are in need of care.
3. Results
3.1. Long Term Analysis
The HHWS has been in operation since 2005, which allows one to identify regional differences in Germany. Figure 4 shows the number of strong and extreme heat warnings per year for the four warning counties Hamburg, Berlin, Freiburg, and Munich. The figure resembles the climatic differences in Germany, with the lowest number of heat warnings in the north (Hamburg) and the highest number in the south-west (Freiburg). Moreover, the hot summers of 2006, 2015, and 2018 can be identified; 2015 was most pronounced in the south (Freiburg and Munich), while 2018 was the year with the highest number of heat warnings in the north (Hamburg, Berlin).
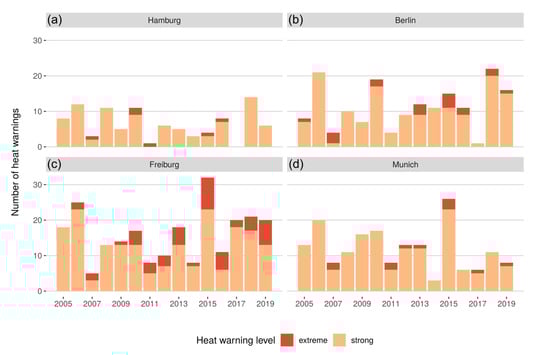
Figure 4.
Number of heat warning for the period 2005 to 2019 for (a) Hamburg in Northern Germany, (b) Berlin in Eastern Germany, (c) Freiburg in the South-West of Germany, and (d) Munich in the South-East.
Besides the year-to-year variability, no long-term trend can be found in the annual number of heat warnings thus far.
The seasonal distribution of the heat warnings for each year is shown in Figure 5. Heat warnings can be active from the end of June until September, with the maximum of the warnings taking place in the second half of July. The year-to-year variability, however, is large. Early warnings in June occurred only in a few years (2005, 2008, 2018). Warnings in September, furthermore, were issued only in summer 2016. Figure 5 also shows that many of warning periods lasted only for a few days (<5) and affected only a smaller part of the country.
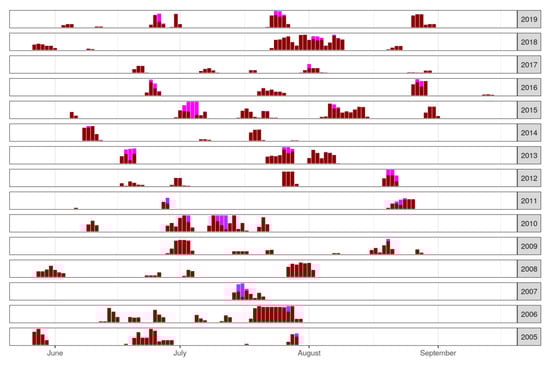
Figure 5.
Number of heat warnings per day and year for the period 2005 to 2019. The color of the bars indicate the warning level, with strong heat stress warnings in dark red and extreme heat stress warnings in magenta. The height of the bars corresponds to the number of counties in Germany with active heat warnings.
Extreme heat stress warnings covering large parts of Germany have occurred in a few summers since 2005. In July 2007, July 2010, June 2013, and July 2015, several days with extreme heat stress warnings affected most parts of Germany. Despite these events, the majority of the warnings are dominated by strong heat stress conditions.
3.2. Summer 2018
The summer of 2018 was the second warmest summer in Germany after the unusually hot summer of 2003. In 2018, 5678 heat warnings were released, only surpassed by the summers 2006 (6418 warnings) and 2015 (6128 warnings). The total number of warnings per county is shown in Figure 6b. In comparison to the average number of warnings between 2005 and 2019 (Figure 6a), the number of warnings increased in almost all counties, with the largest increases in Eastern Germany.
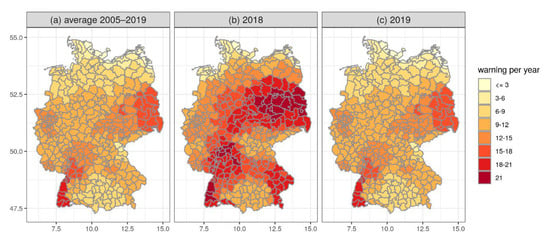
Figure 6.
(a) Average number of heat warnings during the years 2005–2019. (b) Number of warnings in 2018 and (c) number of warnings in 2019.
The 5678 heat warnings of 2018 were distributed throughout four distinct heat waves. The different regional extend and intensity of these heat waves are also visible in the time series for Hamburg, Berlin, Freiburg, and Munich (Figure 7a–d). The first unusually early heat wave began on 27 May in the west (North Rhine-Westphalia) and moved slowly to the east, with the last day of the heat wave taking place on the 1 June. The heat wave led to heat warnings in Hamburg and Berlin, with maximum values of the perceived temperature of 35.0 °C for Hamburg and 35.4 °C for Berlin. The highest minimum temperature observed during this heat wave was 19.0 °C for both cities.
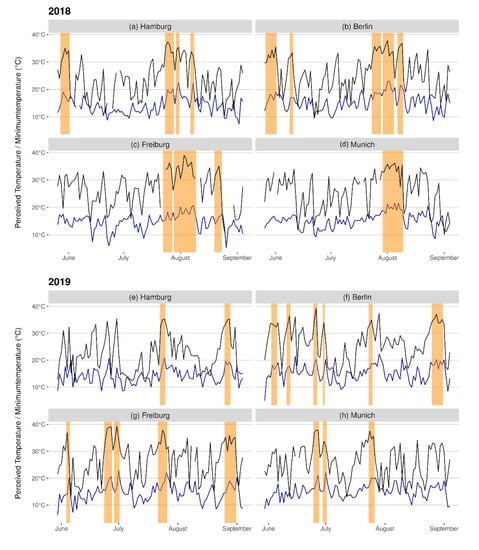
Figure 7.
Time series of the observed perceived temperature (black), the daily minimum temperature (blue), and the days with heat warnings (orange) for selected German cities in (a–d) 2018 and (e–h) 2019. Observations are based on the weather station Hamburg-Fulsbüttel (14 m a.s.l.), Berlin-Schönefeld (46 m a.s.l.), Freiburg (237 m a.s.l.), and Munich-Stadt (515 m a.s.l.).
Another short two-day heat wave occurred from 9–10 June, which affected mostly the eastern parts of Germany and is therefore visible only in the data for Berlin.
The strongest heat wave of 2018 lasted three weeks, from 23 July to 9 August. The heat wave developed in the south-west of Germany but affected all parts of Germany in the following days. Fortunately, the center of the heat wave moved several times; therefore, single cooler days interrupted the heat waves and allowed for a short regeneration from the heat, particularly in the north. In the south, however, the interruptions were less intense, and heat warnings were issued for at least 12 days in a row. The strongest heat wave of the year 2018 is visible in all four cities, although several cooler days led to an interruption of the heat wave in some of the cities (Figure 7a–d). With a total of 17 days with heat warnings, the maximum duration of the heat wave is found in Freiburg (Berlin: 14, Munich: 11, Hamburg: 9 days). In Freiburg, the maximum perceived temperature was 38.9 °C, while for Berlin, Hamburg, and Munich, maximum values of 37.8 °C, 37.3 °C, and 36.2 °C, respectively, were observed. In all cities, several tropical nights (Tmin > 20 °C) were observed (Berlin: five, Munich: four, Hamburg: four, Freiburg: three). The last heat wave of 2018 took place from 20 August to 23 August, again in large parts of South Germany.
3.3. Summer 2019
The summer of 2019 was another very warm summer in Germany. With an average temperature anomaly of 2.1 K in comparison to the reference period 1981–2010, the summer of 2019 was the third warmest summer since the year 1981. The number of heat warnings, however, was not that unusual. The spatial distribution of the heat warnings in 2019 is comparable to the average between 2005–2019, with an exception in Eastern Germany, where a slightly higher number of heat warnings was issued (Figure 6c). In total, 4101 heat warnings were released in summer 2019. Moreover, no pronounced long heat waves occurred during this summer.
The heat waves of the summer of 2019, particularly the early heat waves in June, were special in terms of the intensity of the heat waves. Several new temperature records were established in 2019 (e.g., a daily maximum temperature of 42.6 °C observed was on 25 June in Lingen). These extreme levels of heat stress are also visible in the observations of the perceived temperatures (Figure 7e–h). During this early heat wave end of June, maximum perceived temperatures of 39.3 °C were observed in Berlin and Freiburg, respectively.
4. Discussion and Conclusions
Intense heat episodes that have negative impact on human health can be forecasted based on an assessment of the atmospheric environment in terms of human thermal stress. The thermal index PT, applied by the DWD, is an appropriate method for assessing the short term impacts of hot weather [15]. The example of the German HHWS shows the feasibility of taking into account in a routine application not only air temperature but all relevant meteorological and important non-meteorological parameters influencing the thermal state of the human body [6,16]. As humans acclimatize while they are consecutively exposed to heat, the thresholds for issuing the heat warnings can be adjusted to local weather conditions. In the German HHWS, a time range of the previous 30 days is included to represent human short term acclimatization. Having been in operation since 2005, the human-biometeorological component of the German HHWS has been continuously improved to form an advanced procedure that includes additional aspects such as nocturnal indoor conditions and special characteristics of the elderly population and of urban areas. Estimating long-term trends from the HWS data is therefore not possible.
There have been evaluations of the German HHWS in the Federal State of Hessen and by the Federal Environmental Agency. In Hessen, the system has proven to work effectively. The evaluation covered the domain of residential elderly care and indicates a significantly lower number of hospital admissions [6]. A reduction in the number of heat-related health complaints reflects the successful implementation of intervention measures in response to the DWD heat warnings. With respect to climate change, the Federal Environmental Agency of Germany carried out an evaluation of the existing national information systems from a public health perspective. This project confirmed the acceptance and a high awareness of the HHWS [32].
The perspective is widely accepted that heat waves will occur more often, more intensely, and with increasing length in the future. With respect to these expectations, both the human-biometeorological component of the HHWS and the other components such as preparedness plans and interventions are in need of further continuous assessment, improvement, and adaptation. Essentially, the vulnerable groups suffering from heat exposure are known. Until now, the HHWS mainly focused on elderly residential care. Clearly, there is a need to extend the system to other vulnerable groups such as babies and young children, isolated living persons, persons in need of care, and persons with overweight, chronic, aguish diseases, or dementia.
Author Contributions
Conceptualization, S.M., G.L. and A.M.; Methodology, A.M., S.M. and G.L.; Validation, Formal Analysis, S.M. and G.L.; Resources, A.M., S.M. and G.L.; Data Curation, S.M.; Writing-Original Draft Preparation, A.M., G.L. and S.M.; Writing-Review & Editing, S.M. and G.L.; Visualization, S.M.; Supervision, A.M. and S.M. All authors have read and agreed to the published version of the manuscript.
Funding
This research received no external funding.
Conflicts of Interest
The authors declare no conflict of interest.
Abbreviations
| DWD | Deutscher Wetterdienst (German Meteorological Service) |
| HHWS | Heat Health Warning System |
| PMV | Predicted Mean Vote |
| PT | Perceived Temperature |
| UTC | Universal Time Coordinated |
References
- Parry, M.L.; Canziani, O.F.; Palutikof, J.P.; van der Linden, P.J.; Hanson, C.E. IPCC Intergovernmental Panel on Climate Change. Climate Change Impacts, Adaptation and Vulnerability. Contribution of Working Group II to the Fourth Assessment Report of the Intergovernmental Panel on Climate Change; Cambridge University Press: Cambridge, UK, 2007. [Google Scholar]
- Matzarakis, A.; Muthers, S.; Koch, E. Human-biometeorological evaluation of summer mortality in Vienna. Theor. Appl. Climatol. 2011, 105, 1–10. [Google Scholar] [CrossRef]
- Larsen, J. Setting the Record Straight: More than 52,000 Europeans Died from Heat in Summer 2003. Earth Policy Institute, 2006. Available online: http://www.earth-policy.org/plan_b_updates/2006/update56 (accessed on 1 October 2014).
- An der Heiden, M.; Muthers, S.; Niemann, H.; Buchholz, U.; Grabenhenrich, L.; Matzarakis, A. Schätzung hitzebedingter Todesfälle in Deutschland zwischen 2001 und 2015. Available online: https://link.springer.com/article/10.1007%2Fs00103-019-02932-y (accessed on 3 February 2020).
- Muthers, S.; Laschewski, G.; Matzarakis, A. The Summers 2003 and 2015 in South-West Germany: Heat Waves and Heat-Related Mortality in the Context of Climate Change. Atmosphere 2017, 8, 224. [Google Scholar] [CrossRef]
- Koppe, C. The Heat Health Warning System of the German Meteorological Service. UMID Spec. Issue Clim. Chang. Health 2009, 3, 39–43. [Google Scholar]
- RCC-CM Product Description Sheet—Long-Term Records Heat and Cold Waves. 2019. Available online: https://rcccm.dwd.de/DWD-RCCCM/EN/products/productdesc/productdesc_node.html (accessed on 23 January 2020).
- Casanueva, A.; Burgstall, A.; Kotlarski, S.; Messeri, A.; Morabito, M.; Flouris, A.; Nybo, L.; Spirig, C.; Schwierz, C. Overview of existing heat-health warning systems in Europe. Int. J. Environ. Sci. Public Health 2019, 16, 2657. [Google Scholar] [CrossRef] [PubMed]
- Toloo, G.; Fitzgerald, G.; Aitken, P.; Verrall, K.; Tong, S. Evaluating the effectiveness of heat warning systems: Systematic review of epidemiological evidence. Int. J. Public Health 2013, 58, 667–681. [Google Scholar] [CrossRef]
- Koppe, C. Gesundheitsrelevante Bewertung von thermischer Belastung unter Berücksichtigung der kurzfristigen Anpassung der Bevölkerung an die lokalen Witterungsverhältnisse. Ber. Dtsch. Wetterd. 2005, 226, 1–214. [Google Scholar]
- Matzarakis, A.; Koppe, C. Hitzewellen–eine zunehmende Gesundheitsgefahr. Internist. Prax. 2016, 56, 585–592. [Google Scholar]
- Matzarakis, A.; Zielo, B. Maßnahmen zur Reduzierung von Hitzebelastungen für Menschen-Bedeutung von Hitzeaktionsplänen. Gefahrst. –Reinhalt. Luft 2017, 77, 316–320. [Google Scholar]
- Koppe, C.; Jendritzky, G. Inclusion of short-term adaptation to thermal stresses in a heat load warning procedure. Meteorol. Z. 2015, 14, 271–278. [Google Scholar] [CrossRef]
- Zielo, B.; Matzarakis, A. Bedeutung von Hitzeaktionsplänen für den präventiven Gesundheitsschutz in Deutschland. Gesundheitswesen 2017, 79, 1–10. [Google Scholar] [CrossRef]
- Staiger, H.; Laschewski, G.; Matzarakis, A. Selection of Appropriate Thermal Indices for Applications in Human Biometeorological Studies. Atmosphere 2019, 10, 18. [Google Scholar] [CrossRef]
- Matzarakis, A. Climate, Thermal Comfort and Tourism. Climate Change and Tourism: Assessment and Coping Strategies; Amelung, B., Blazejczyk, K., Matzarakis, A., Eds.; Polish Academy of Sciences: Warsaw, Poland, 2007; pp. 139–154. [Google Scholar]
- Parsons, K.C. Human Thermal Environments: The Effects of Hot, Moderate, and cold Environments on Human Health, Comfort and Performance, 2nd ed.; Taylor & Francis: London, UK, 2003. [Google Scholar]
- VDI Methods for the Human Biometeorological Evaluation for Climate and Air Quality for the Urban and Regional Planning; Part I: Climate. VDI guideline 3787. Part 2; Beuth: Berlin, Germany, 2008.
- Jendritzky, G. Methodik zur räumlichen Bewertung der thermischen Komponente im Bioklima des Menschen—Fortgeschriebenes Klima-Michel-Modell. Beitr. Akademie Raumforsch. Landesplan. 1990, 114, 7–69. [Google Scholar]
- Staiger, H.; Laschewski, G.; Grätz, A. The perceived temperature—A versatile index for the assessment of the human thermal environment. Part A: Scientific basics. Int. J. Biometeorol. 2012, 56, 165–176. [Google Scholar] [CrossRef]
- Dufour, A.; Candas, V. Ageing and thermal responses during passive heat exposure: Sweating and sensory aspects. Eur. J. Appl. Physiol. 2007, 100, 19–26. [Google Scholar] [CrossRef]
- Stapleton, J.M.; Larose, J.; Simpson, C.; Flouris, A.D.; Sigal, R.J.; Kenny, G.P. Do older adults experience greater thermal strain during heat waves? Appl. Physiol. Nutr. Metab. 2014, 39, 292–298. [Google Scholar] [CrossRef]
- Donaldson, G.C.; Keatinge, W.R.; Saunders, R.D. Cardiovascular responses to heat stress and their adverse consequences in healthy and vulnerable human populations. Int. J. Hyperth. 2003, 19, 225–235. [Google Scholar] [CrossRef]
- Rida, M.; Ghaddar, N.; Ghali, K.; Hoballah, J. Elderly bioheat modeling: Changes in physiology, thermoregulation, and blood flow circulation. Int. J. Biometeorol. 2014, 58, 1825–1843. [Google Scholar] [CrossRef]
- McGinn, R.; Poirier, M.P.; Louie, J.C.; Sigal, R.J.; Boulay, P.; Flouris, A.D.; Kenny, G.P. Increasing age is a major risk factor for susceptibility to heat stress during physical activity. Appl. Physiol. Nutr. Metab. 2017, 42, 1232–1235. [Google Scholar] [CrossRef]
- Gagge, A.P.; Fobelets, A.P.; Berglund, P.E. A Standard Predictive Index of Human Response to the Thermal Environment. ASHRAE Trans. 1986, 92, 709–731. [Google Scholar]
- Pfafferott, J.; Becker, P. Erweiterung des Hitzewarnsystems um die Vorhersage der Wärmebelastung in Innenräumen. Bauphysik 2008, 30, 237–243. [Google Scholar] [CrossRef]
- Clarke, J.A. Energy Simulation in Building Design, 2nd ed.; Butterworth-Heinemann: Oxford, UK, 2001. [Google Scholar]
- Rosenfelder, M.; Koppe, C.; Pfafferoth, J.; Matzarakis, A. Effects of ventilation behavior on indoor heat load based on test reference years. Int. J. Biometeorol. 2016, 60, 277–287. [Google Scholar] [CrossRef]
- Clarke, J.A.; Hensen, J.L.M. An approach to the simulation of coupled heat and mass flows in buildings. Indoor Air 1991, 3, 283–296. [Google Scholar] [CrossRef]
- Wienert, U.; Kreienkamp, F.; Spekat, A.; Enke, W. A simple method to estimate the urban heat island intensity in data sets used for the simulation of the thermal behavior of buildings. Meteorol. Z. 2013, 22, 179–185. [Google Scholar] [CrossRef]
- Capellaro, M.; Sturm, D. Evaluation of Information Systems Relevant to Climate Change and Health. Volume 1: Adaption to Climate Change: Evaluation of Existing National Information Systems (UV-Index, Heat Warning System, Airborne Pollen, Ozone Forecasts) from a Public Health Perspective—How to Reach Vulnerable Populations. Umw. Gesundh. 2015, 3, 1–144. [Google Scholar]


© 2020 by the authors. Licensee MDPI, Basel, Switzerland. This article is an open access article distributed under the terms and conditions of the Creative Commons Attribution (CC BY) license (http://creativecommons.org/licenses/by/4.0/).