Study on Riparian Shading Envelope for Wetlands to Create Desirable Urban Bioclimates
Abstract
1. Introduction
Objectives of the Research
- i.
- To investigate the factors of urban wetland that contribute to urban cooling islands (UCIs) in Dhaka.
- ii.
- To evaluate the impacts of wetland area, shape complexity, location, and riparian shading potential on UCIs intensity in Dhaka.
2. Methodology
2.1. Field Measurement of the Urban Cooling Island
2.1.1. Location of the Study Area and Urban Station
- These two wetlands are accessible up to their inner periphery without any hindrance.
- Both the wetlands have radiating roads leading into the surrounding urban fabric having the potentials for studying the impact of wetlands on the surrounding area.
- To enable the analysis of the effect of riparian shade, Dhanmondi Lake was selected for its significantly visible riparian shade, and Hatirjheel Lake was chosen for the absence of visible riparian shade.
- The watershed characteristics of both the lakes are comparable in terms of area.
- Both the lakes are located on the same physiographic condition [40]; details are given in Appendix A). Agroecological zone for both the lakes are also the same [41].
- Both the lakes are located in the same overall geothermal gradient zone [42].
2.1.2. Date and Time of Data Logging
2.1.3. Observation Period
2.1.4. Climatic Variables Measured
2.2. Simulation and Modeling
- Computational Fluid Dynamics (CFD) module: fluid flow-single phase flow.
- Heat transfer module: heat transfer in fluids and heat transfer with surface to surface radiation (ht).
- Chemical species transport: transport of diluted species (tds).
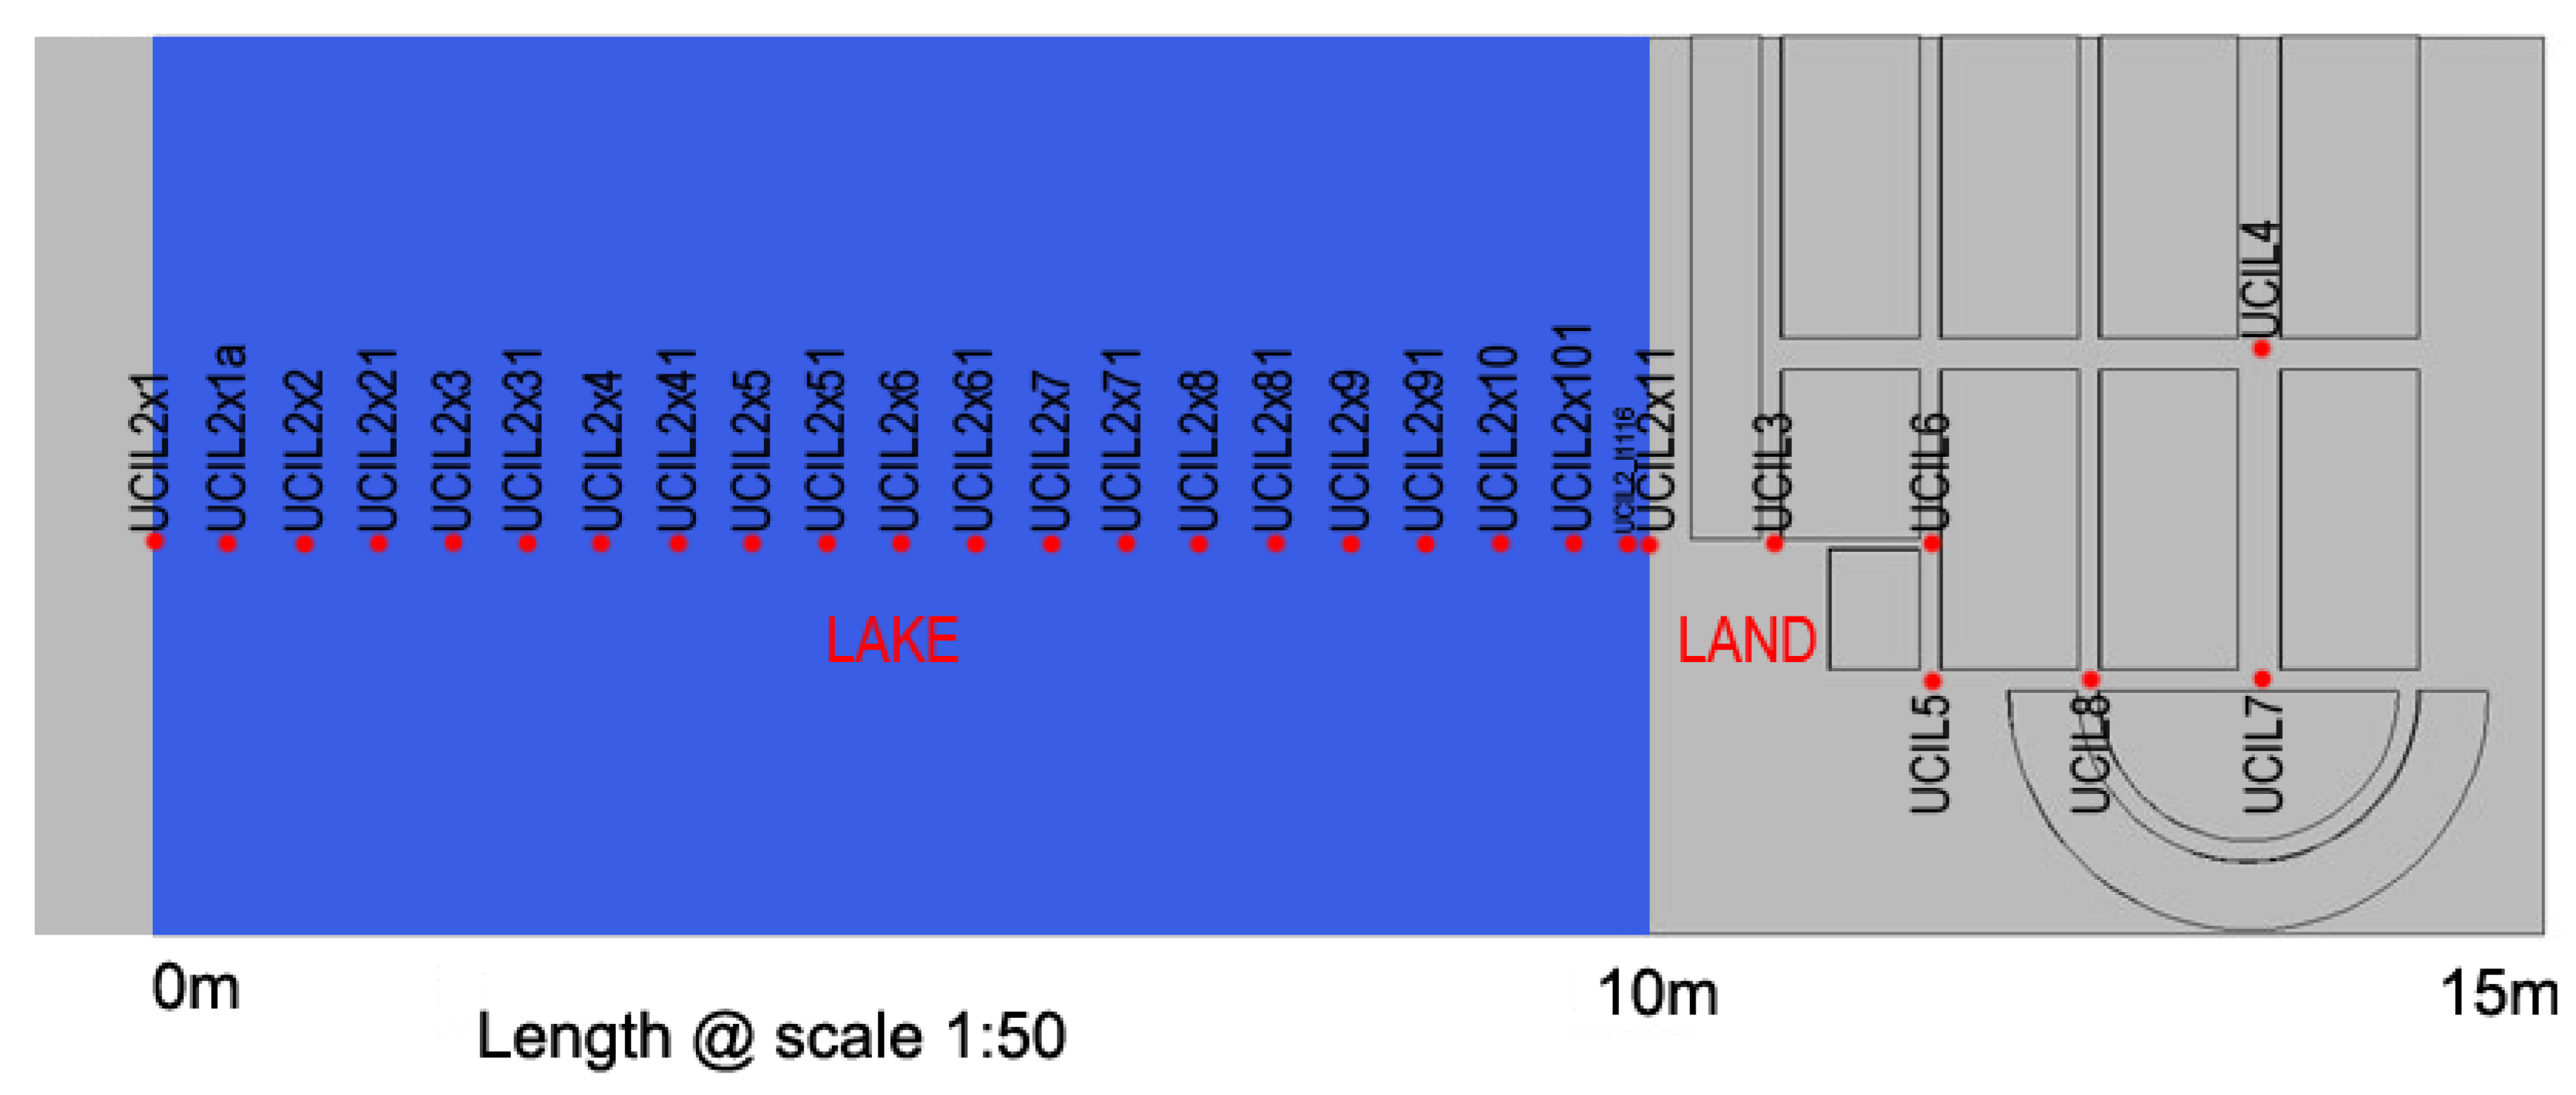
2.2.1. Location and Morphology of the Modeling Area
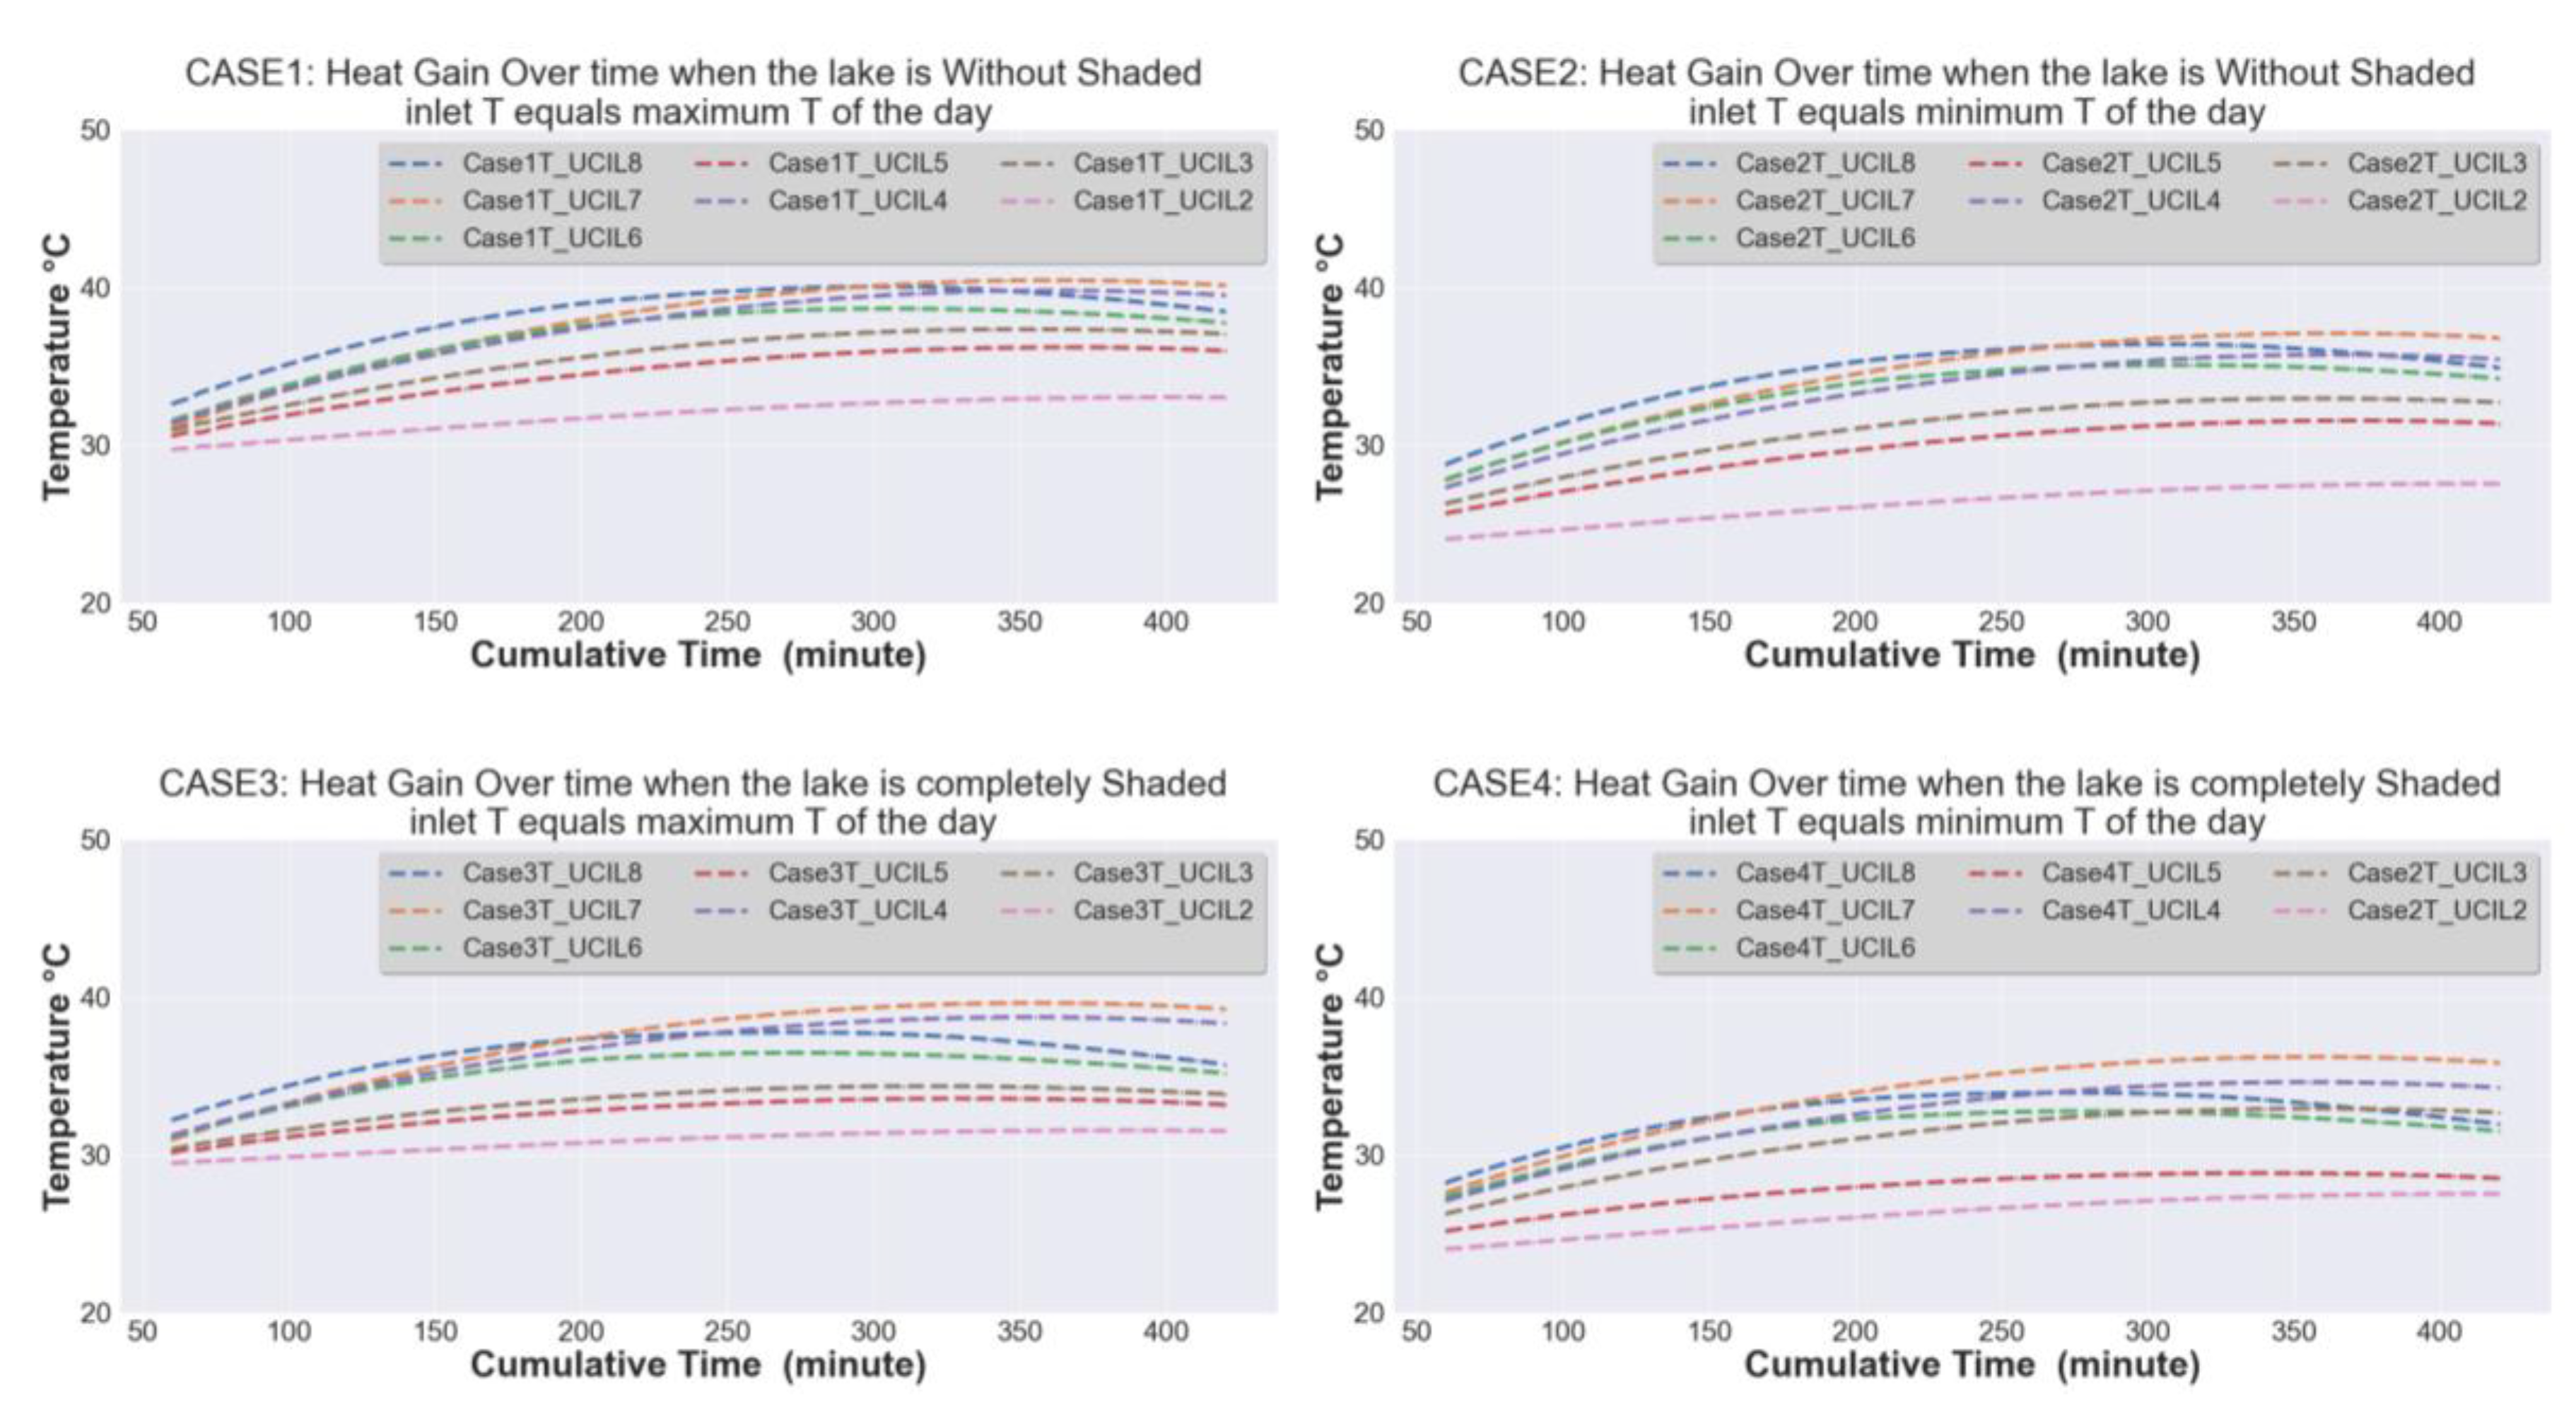
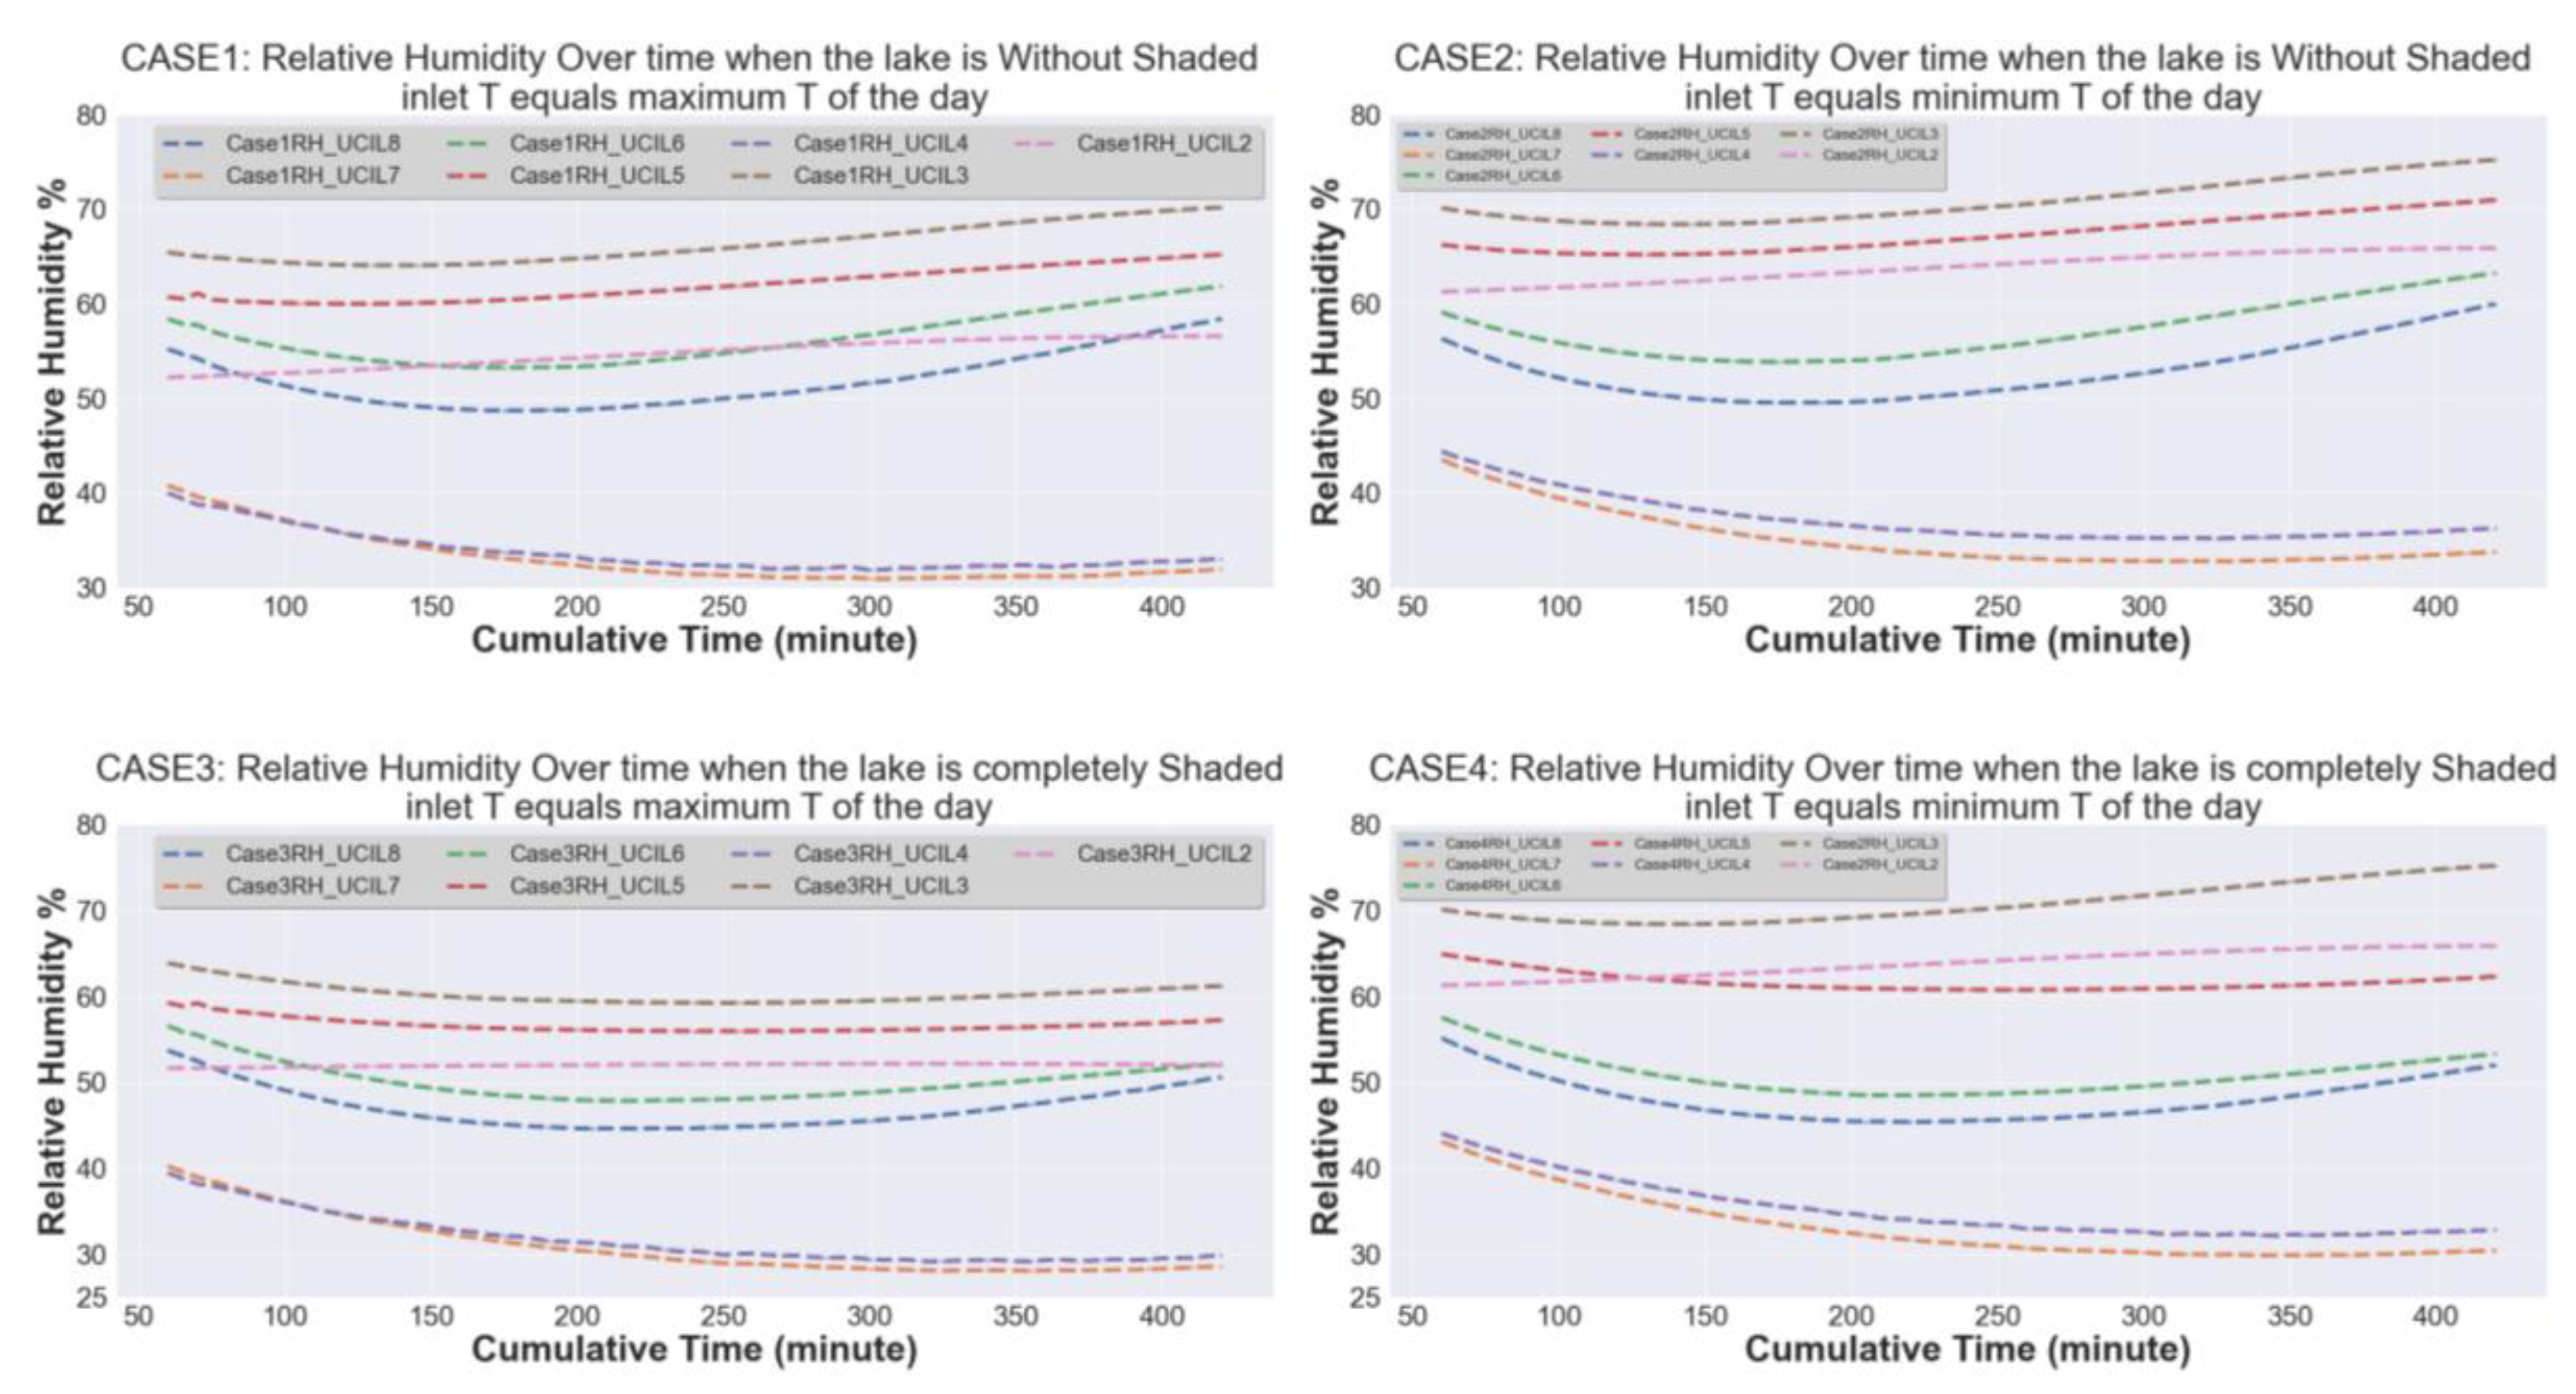
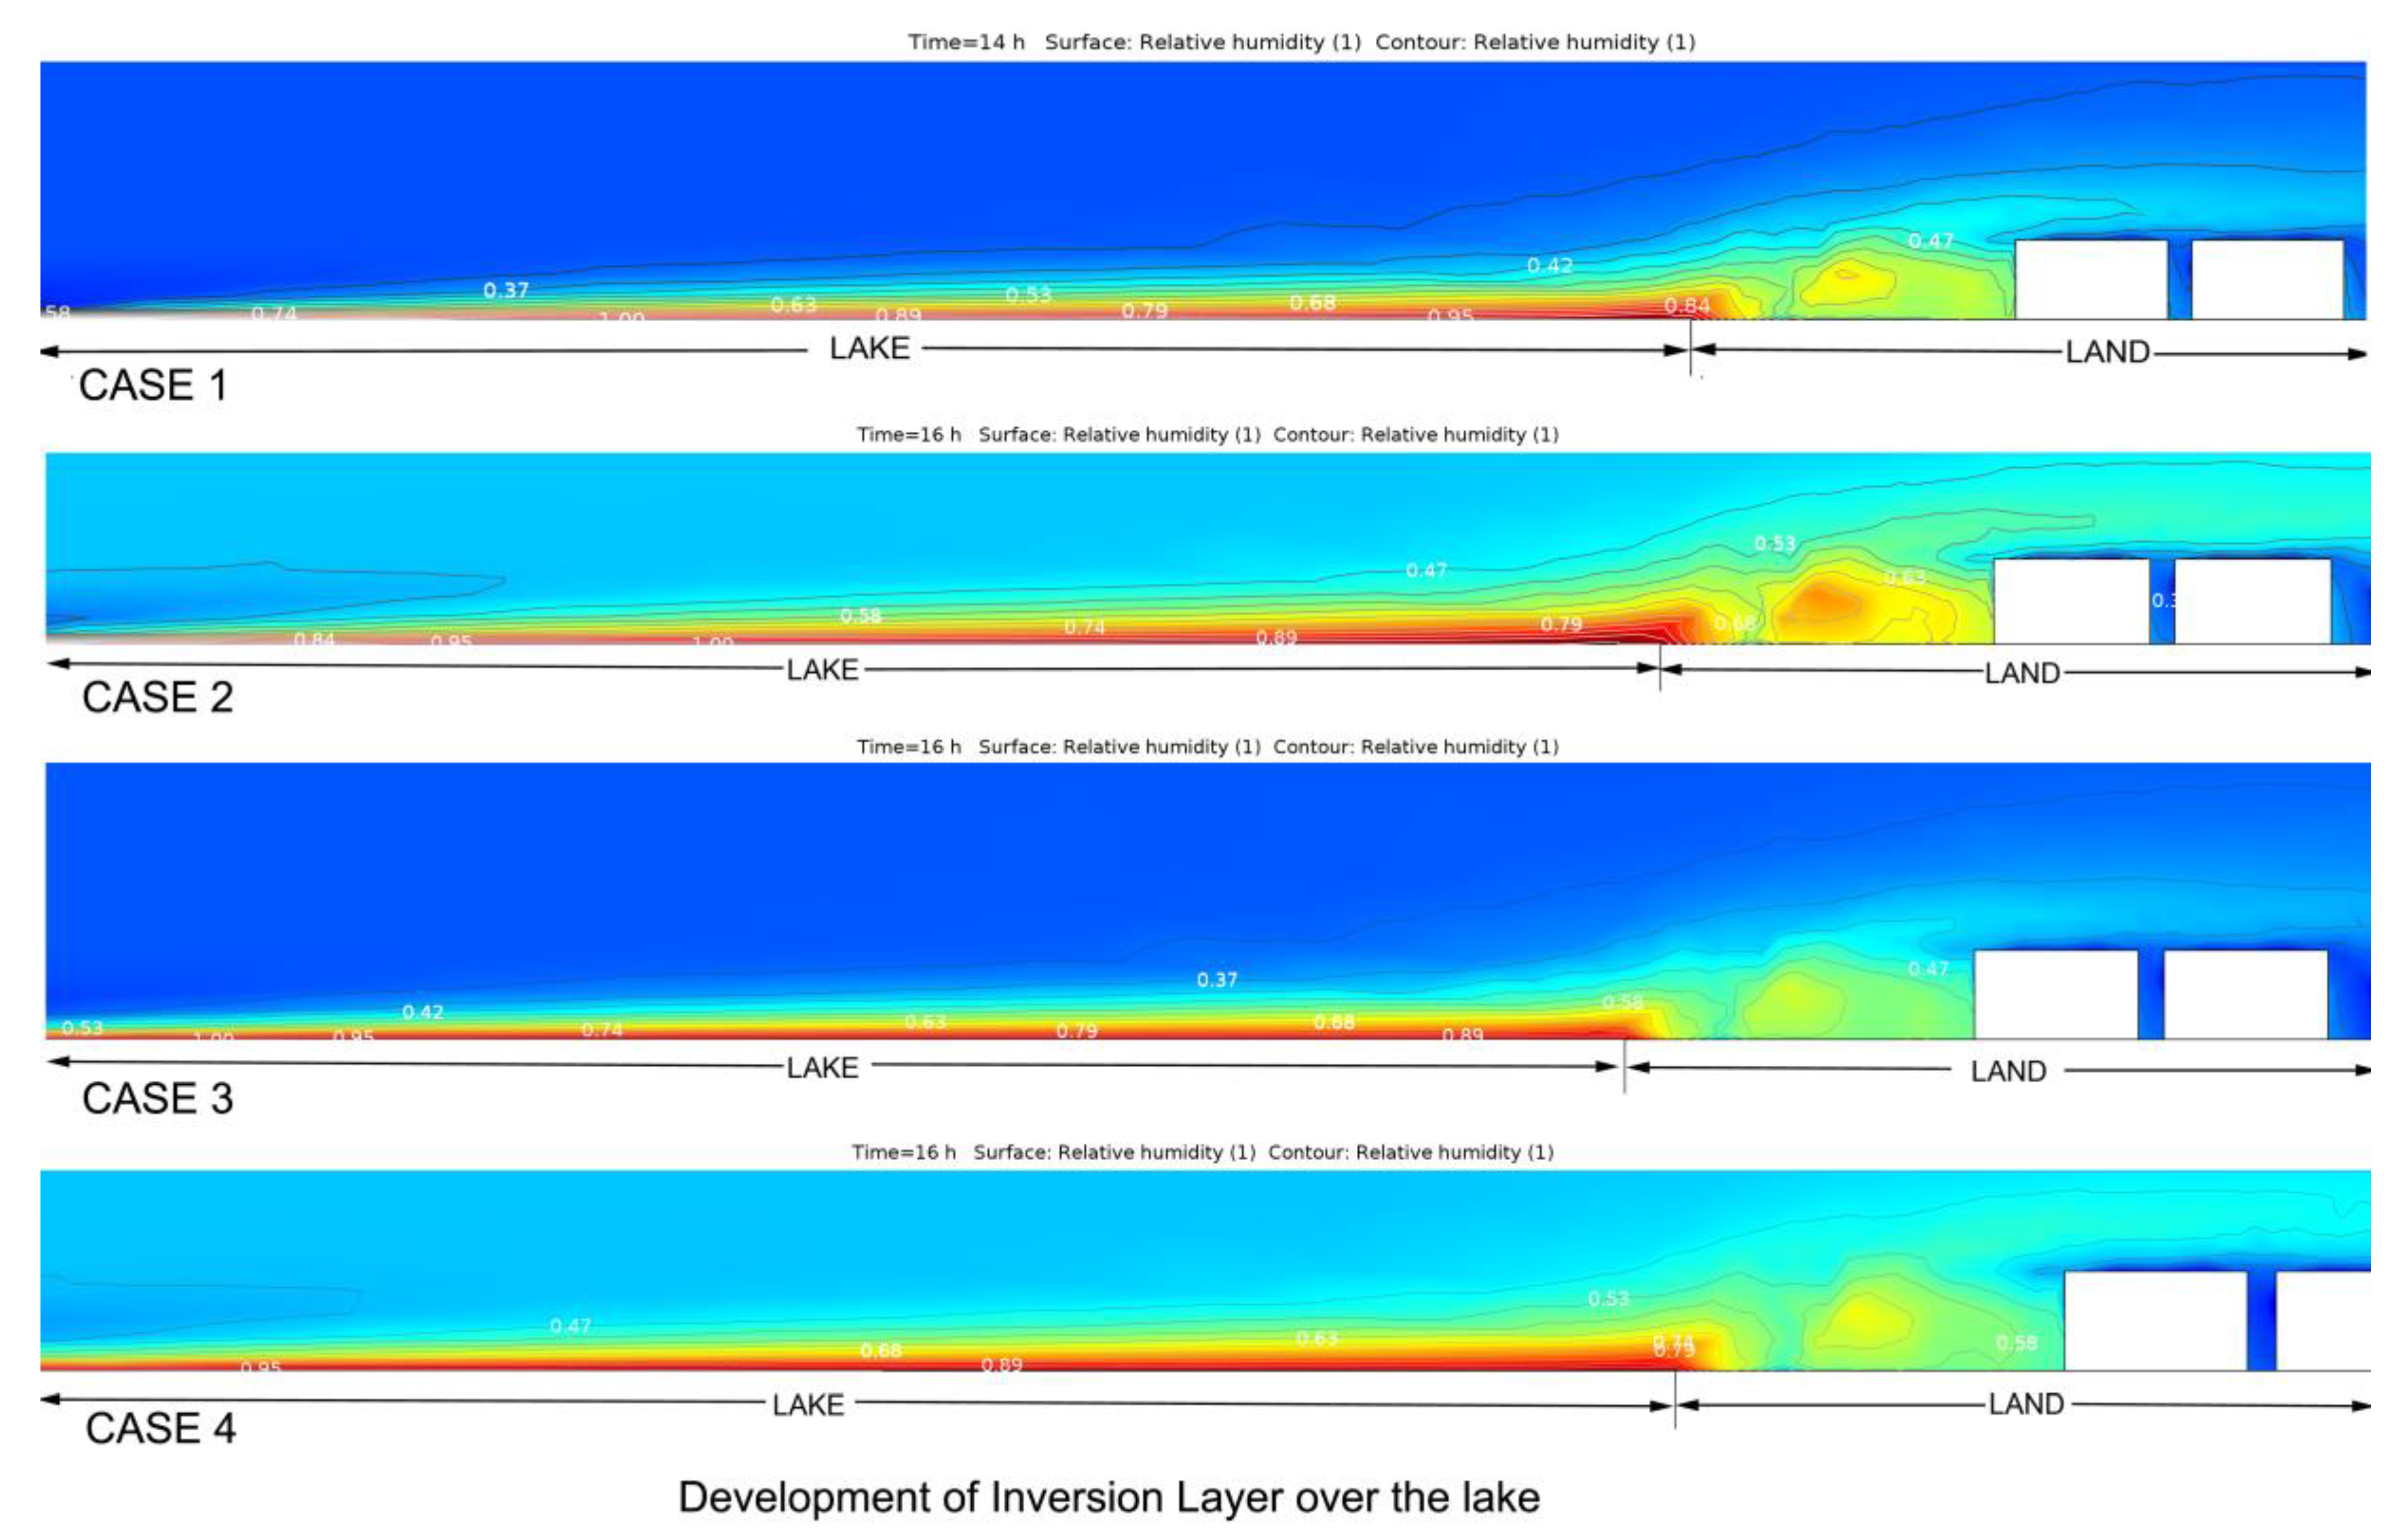
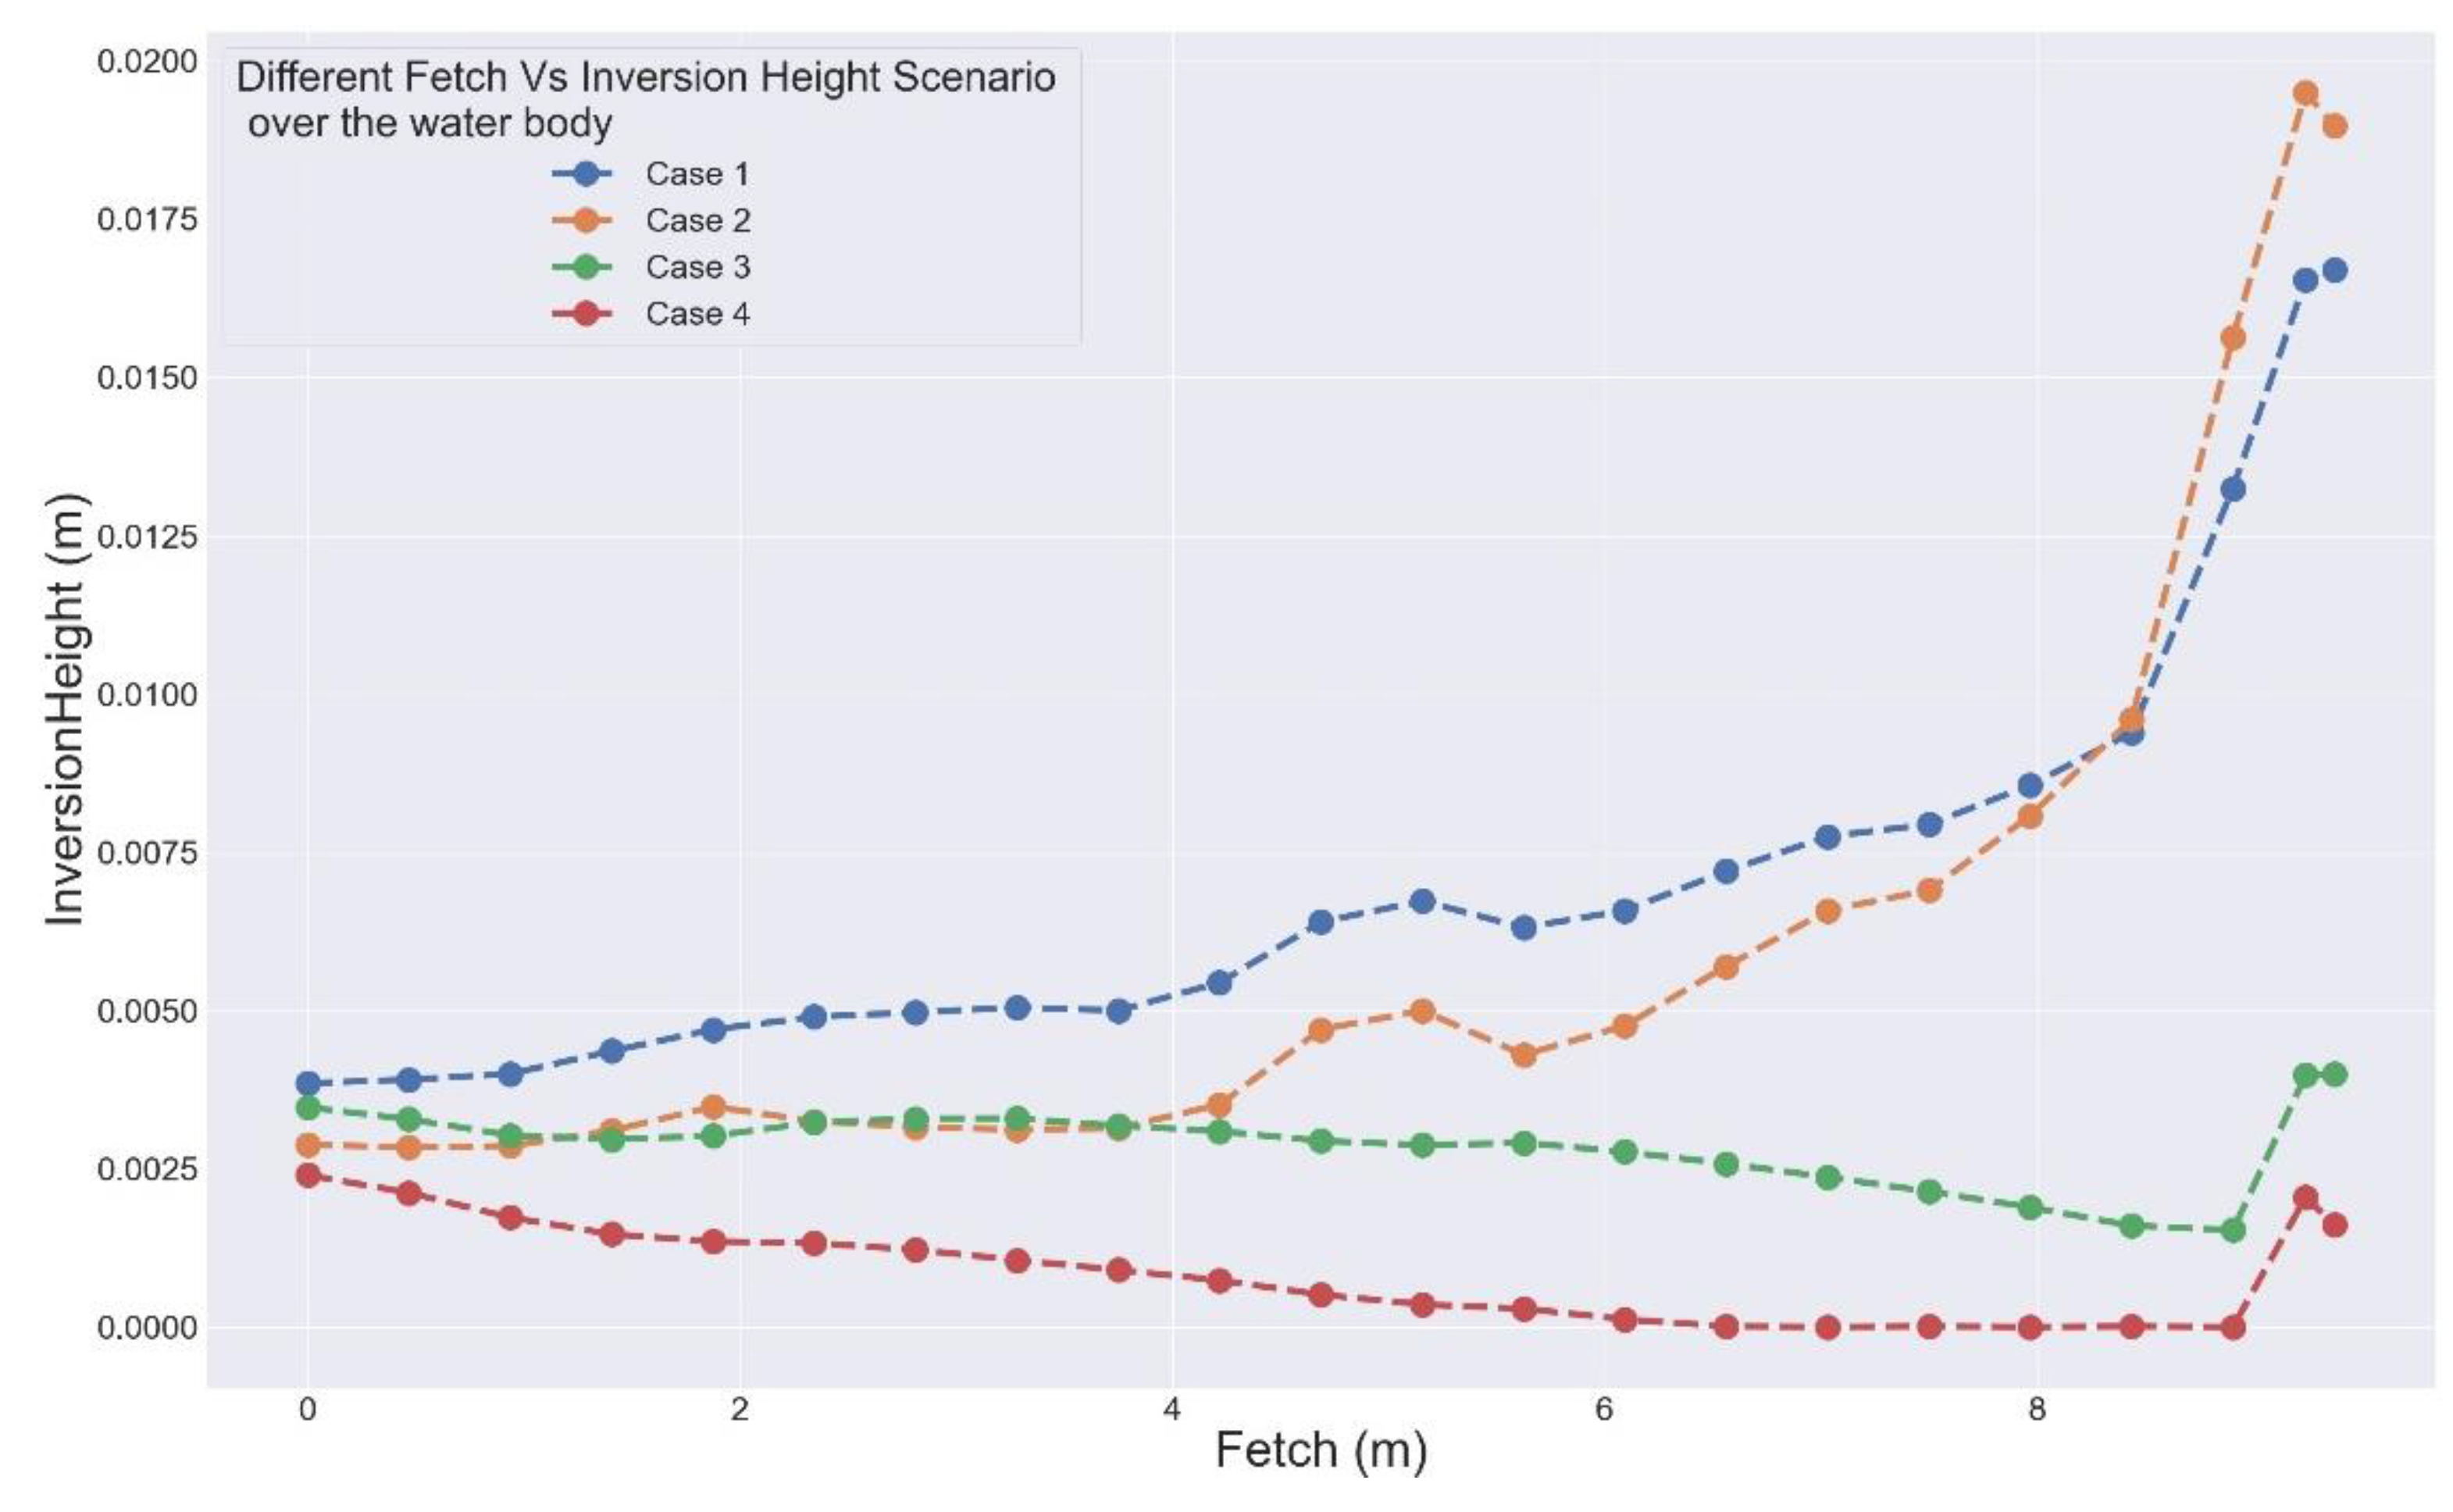
- Case 1: The first simulation study was done with the water of the lake entirely under solar radiation and inlet temperature equal to the maximum temperature of the day obtained from the field measurement.
- Case 2: The second simulation study was conducted with the water of the lake entirely under solar radiation and inlet temperature equal to the minimum temperature of the day obtained from the field measurement.
- Case 3: The third simulation study was conducted with the water body completely shaded from solar radiation and inlet temperature equal to the maximum temperature of the day obtained from the field measurement.
- Case 4: The fourth simulation study was conducted with the water body completely shaded from solar radiation and inlet temperature equal to the minimum temperature of the day obtained from the field measurement.
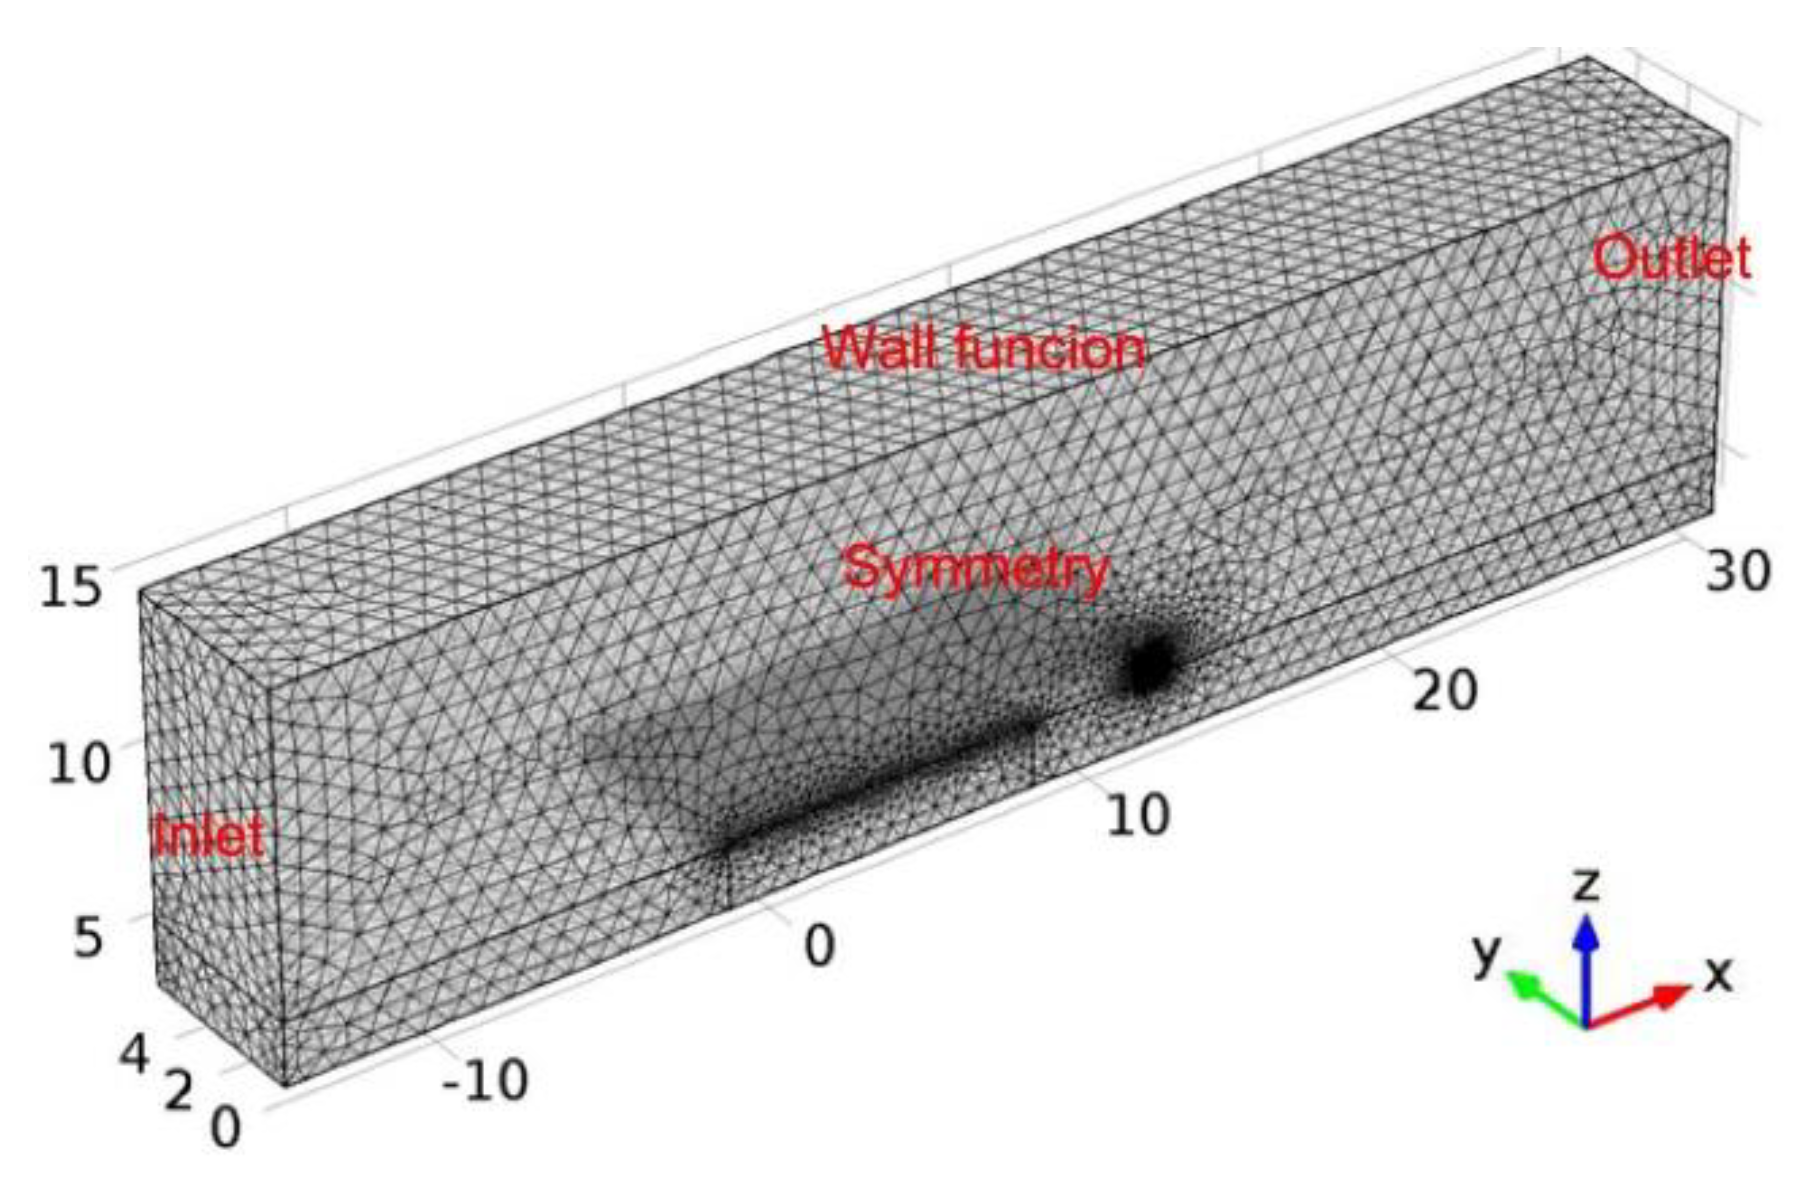
2.2.2. Computational Grid (Mesh)
2.2.3. Boundary Conditions
Inlet Boundary Condition
Outlet Boundary Condition
Wall Condition
Symmetry Condition
Temperature
2.2.4. Measurement Points in the Model
3. Results and Analysis of the Field Measurement
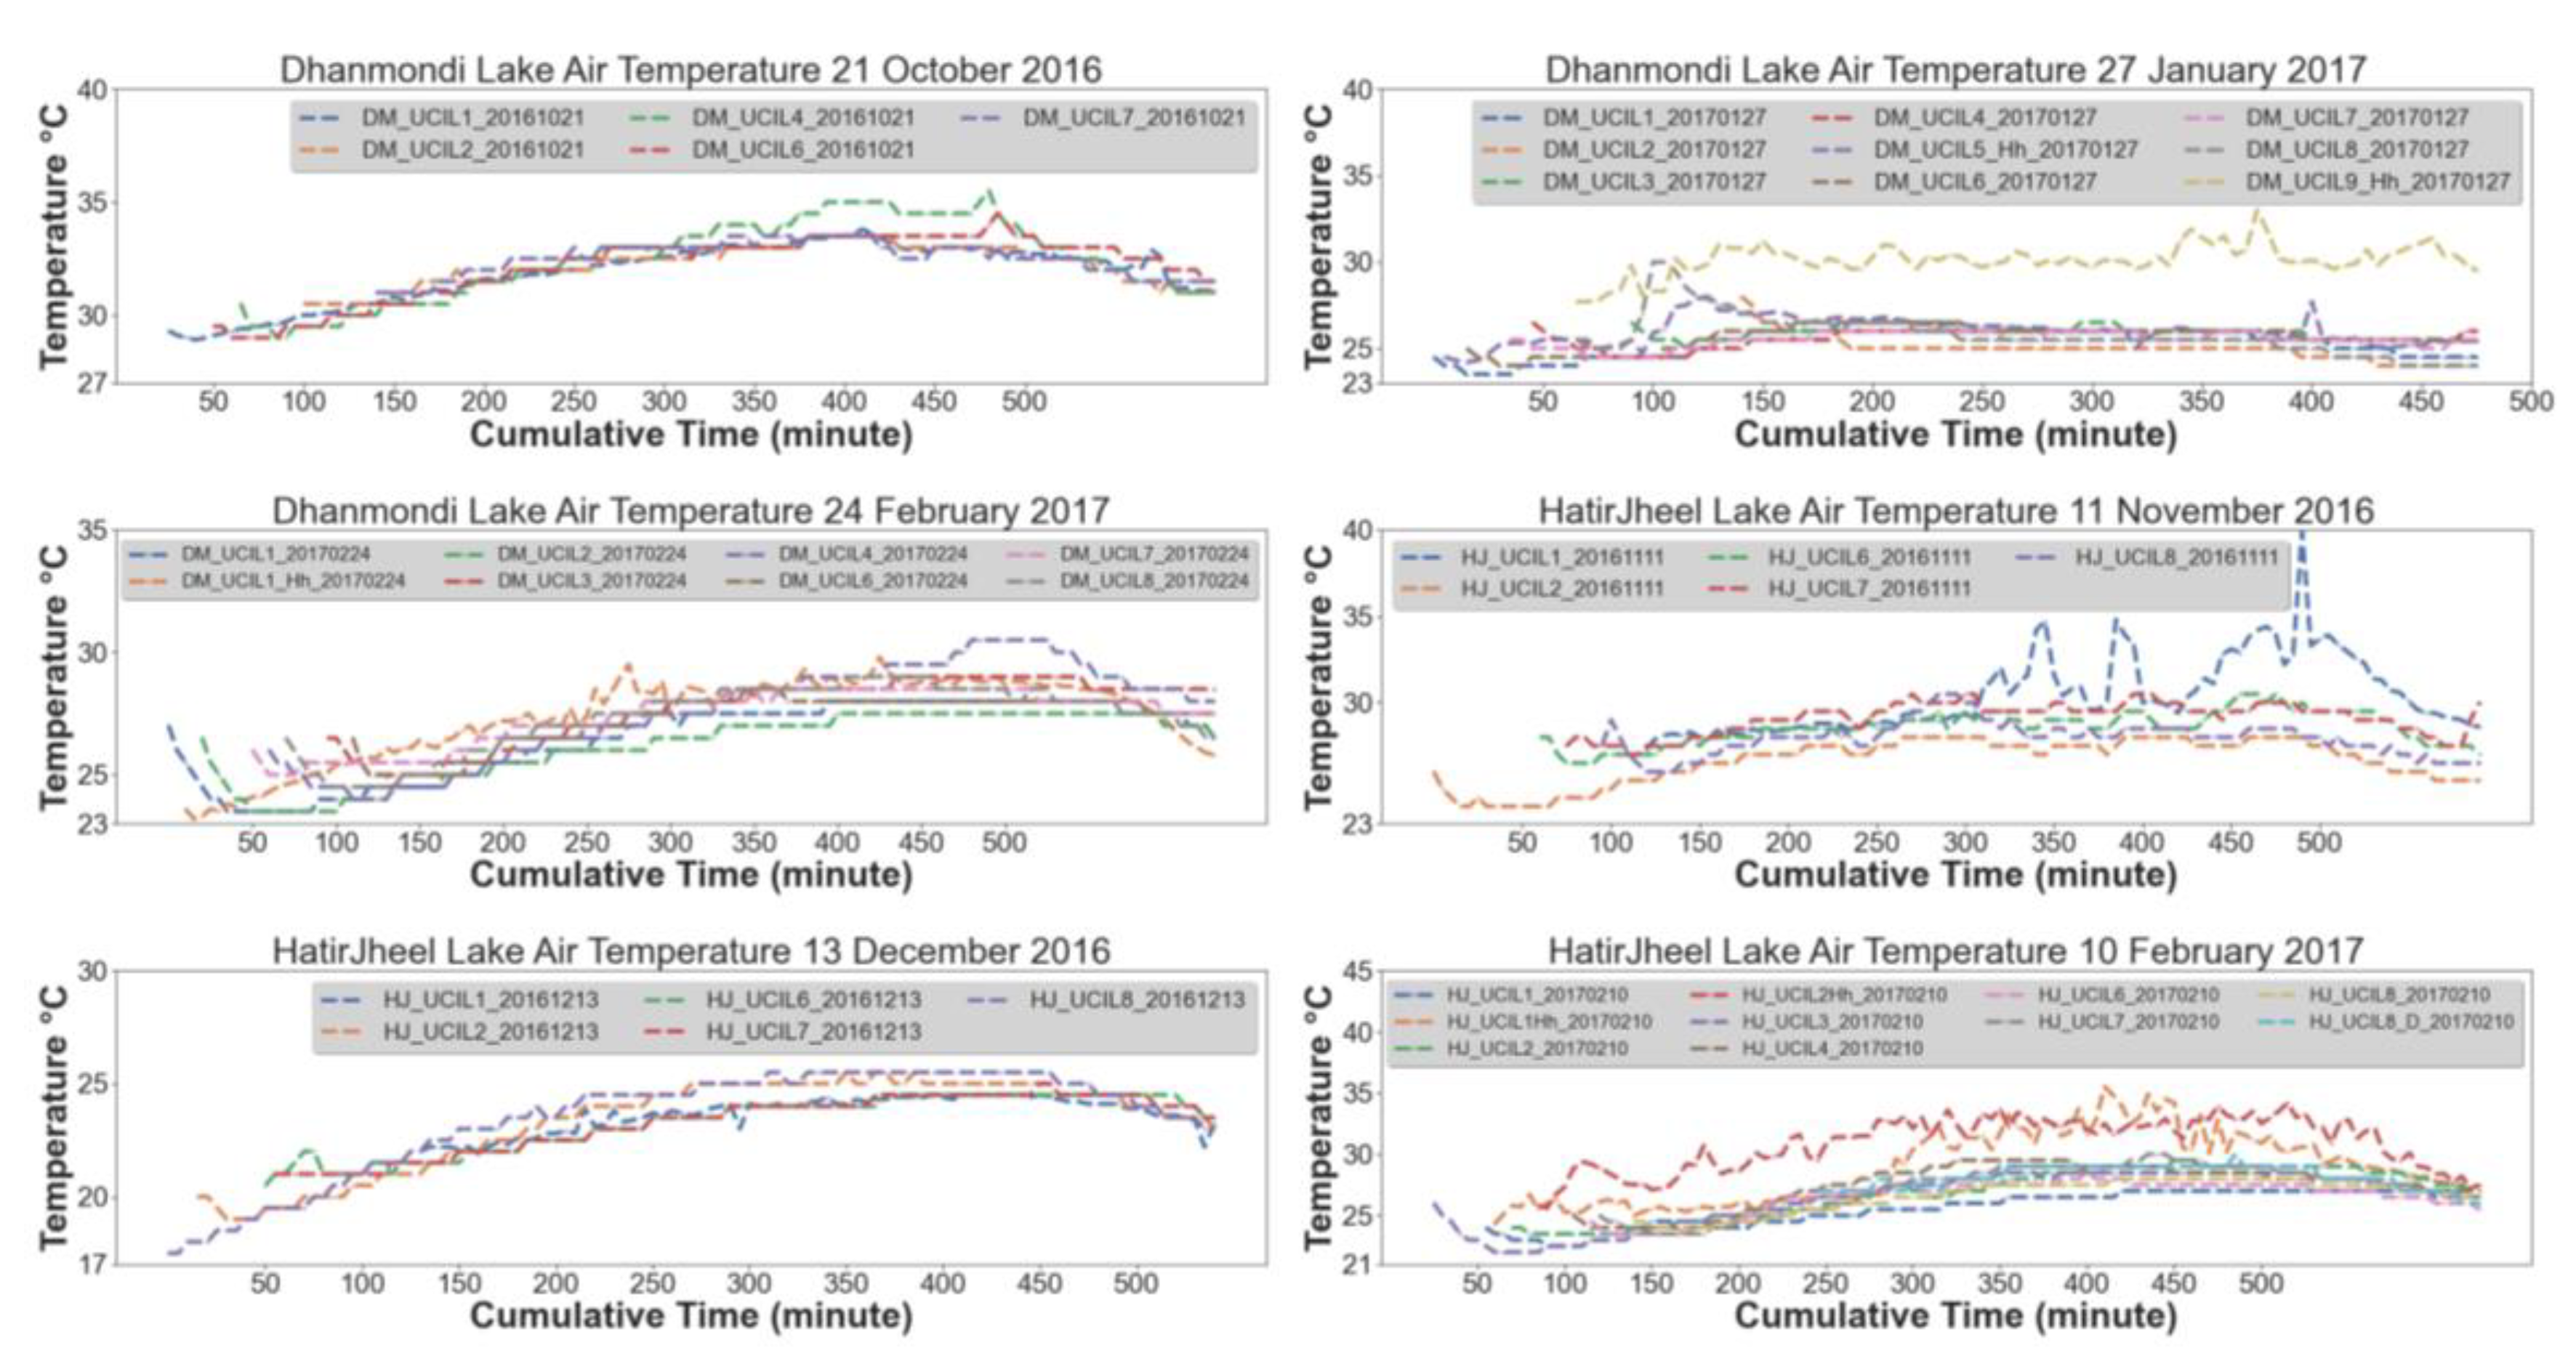
3.1. Lake Temperature
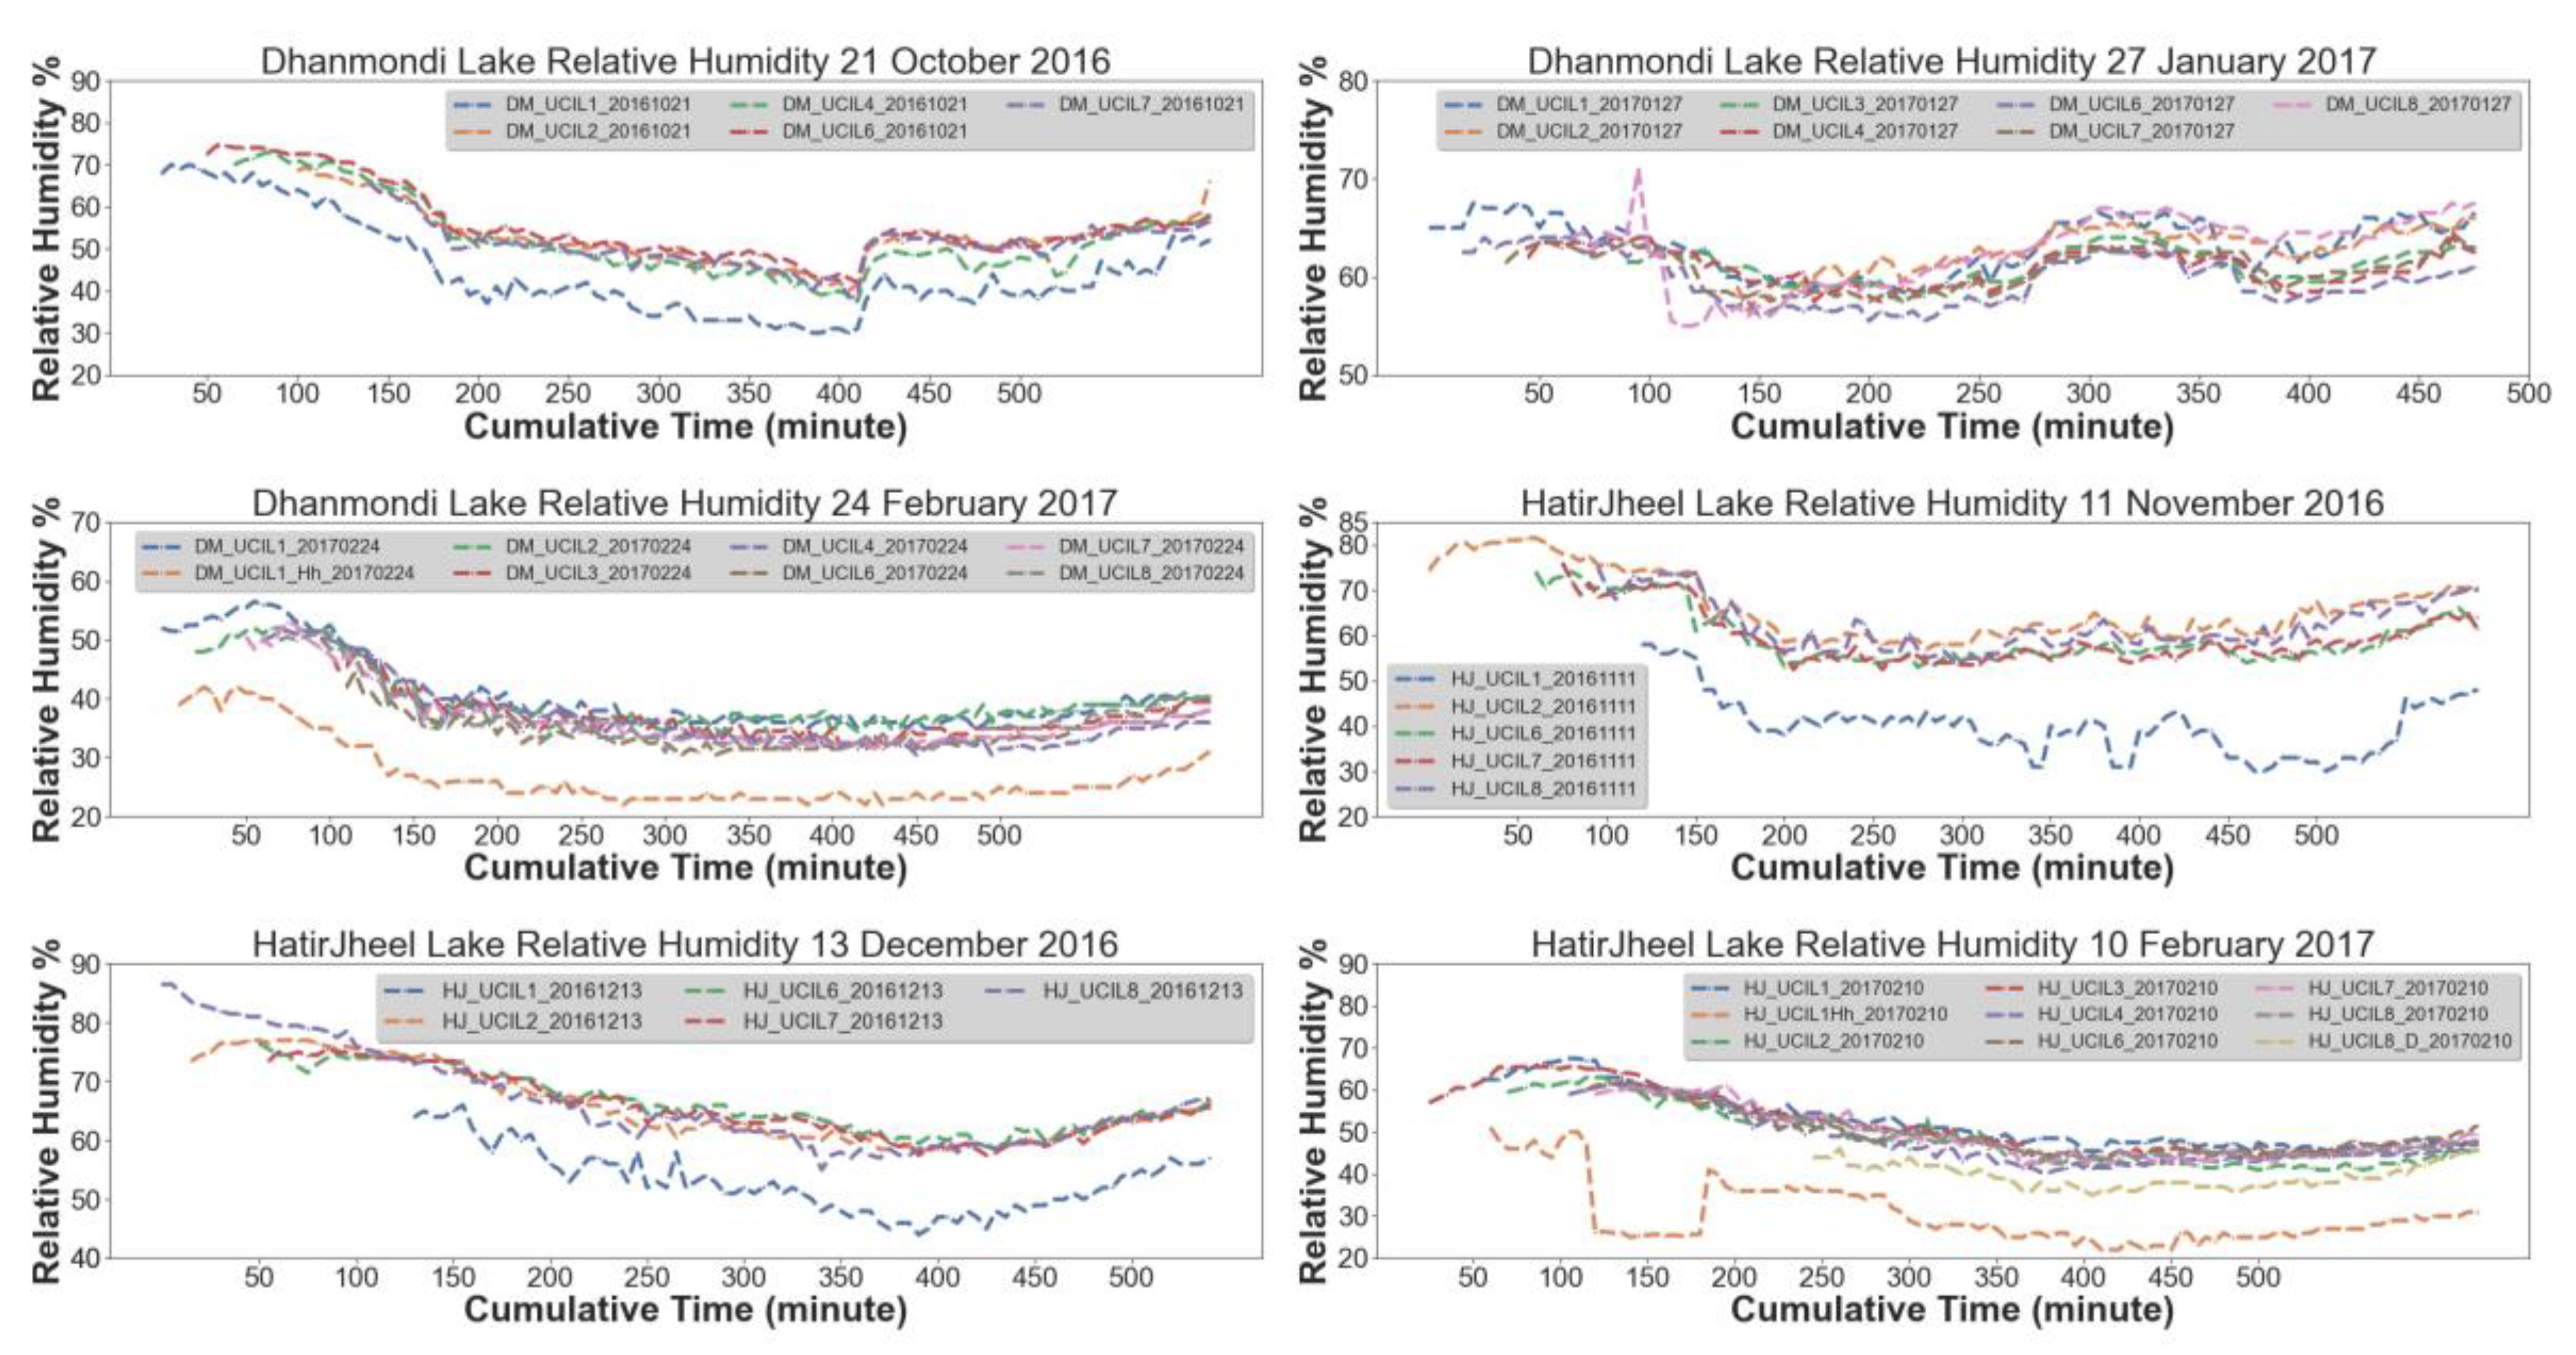
3.2. Lake Relative Humidity
3.3. Key Observations from Field Measurement
- i.
- Effect of cumulative time on the rate of change of air temperature and relative humidity:
- ii.
- Effect of riparian shading on the cumulative time effect:
- iii.
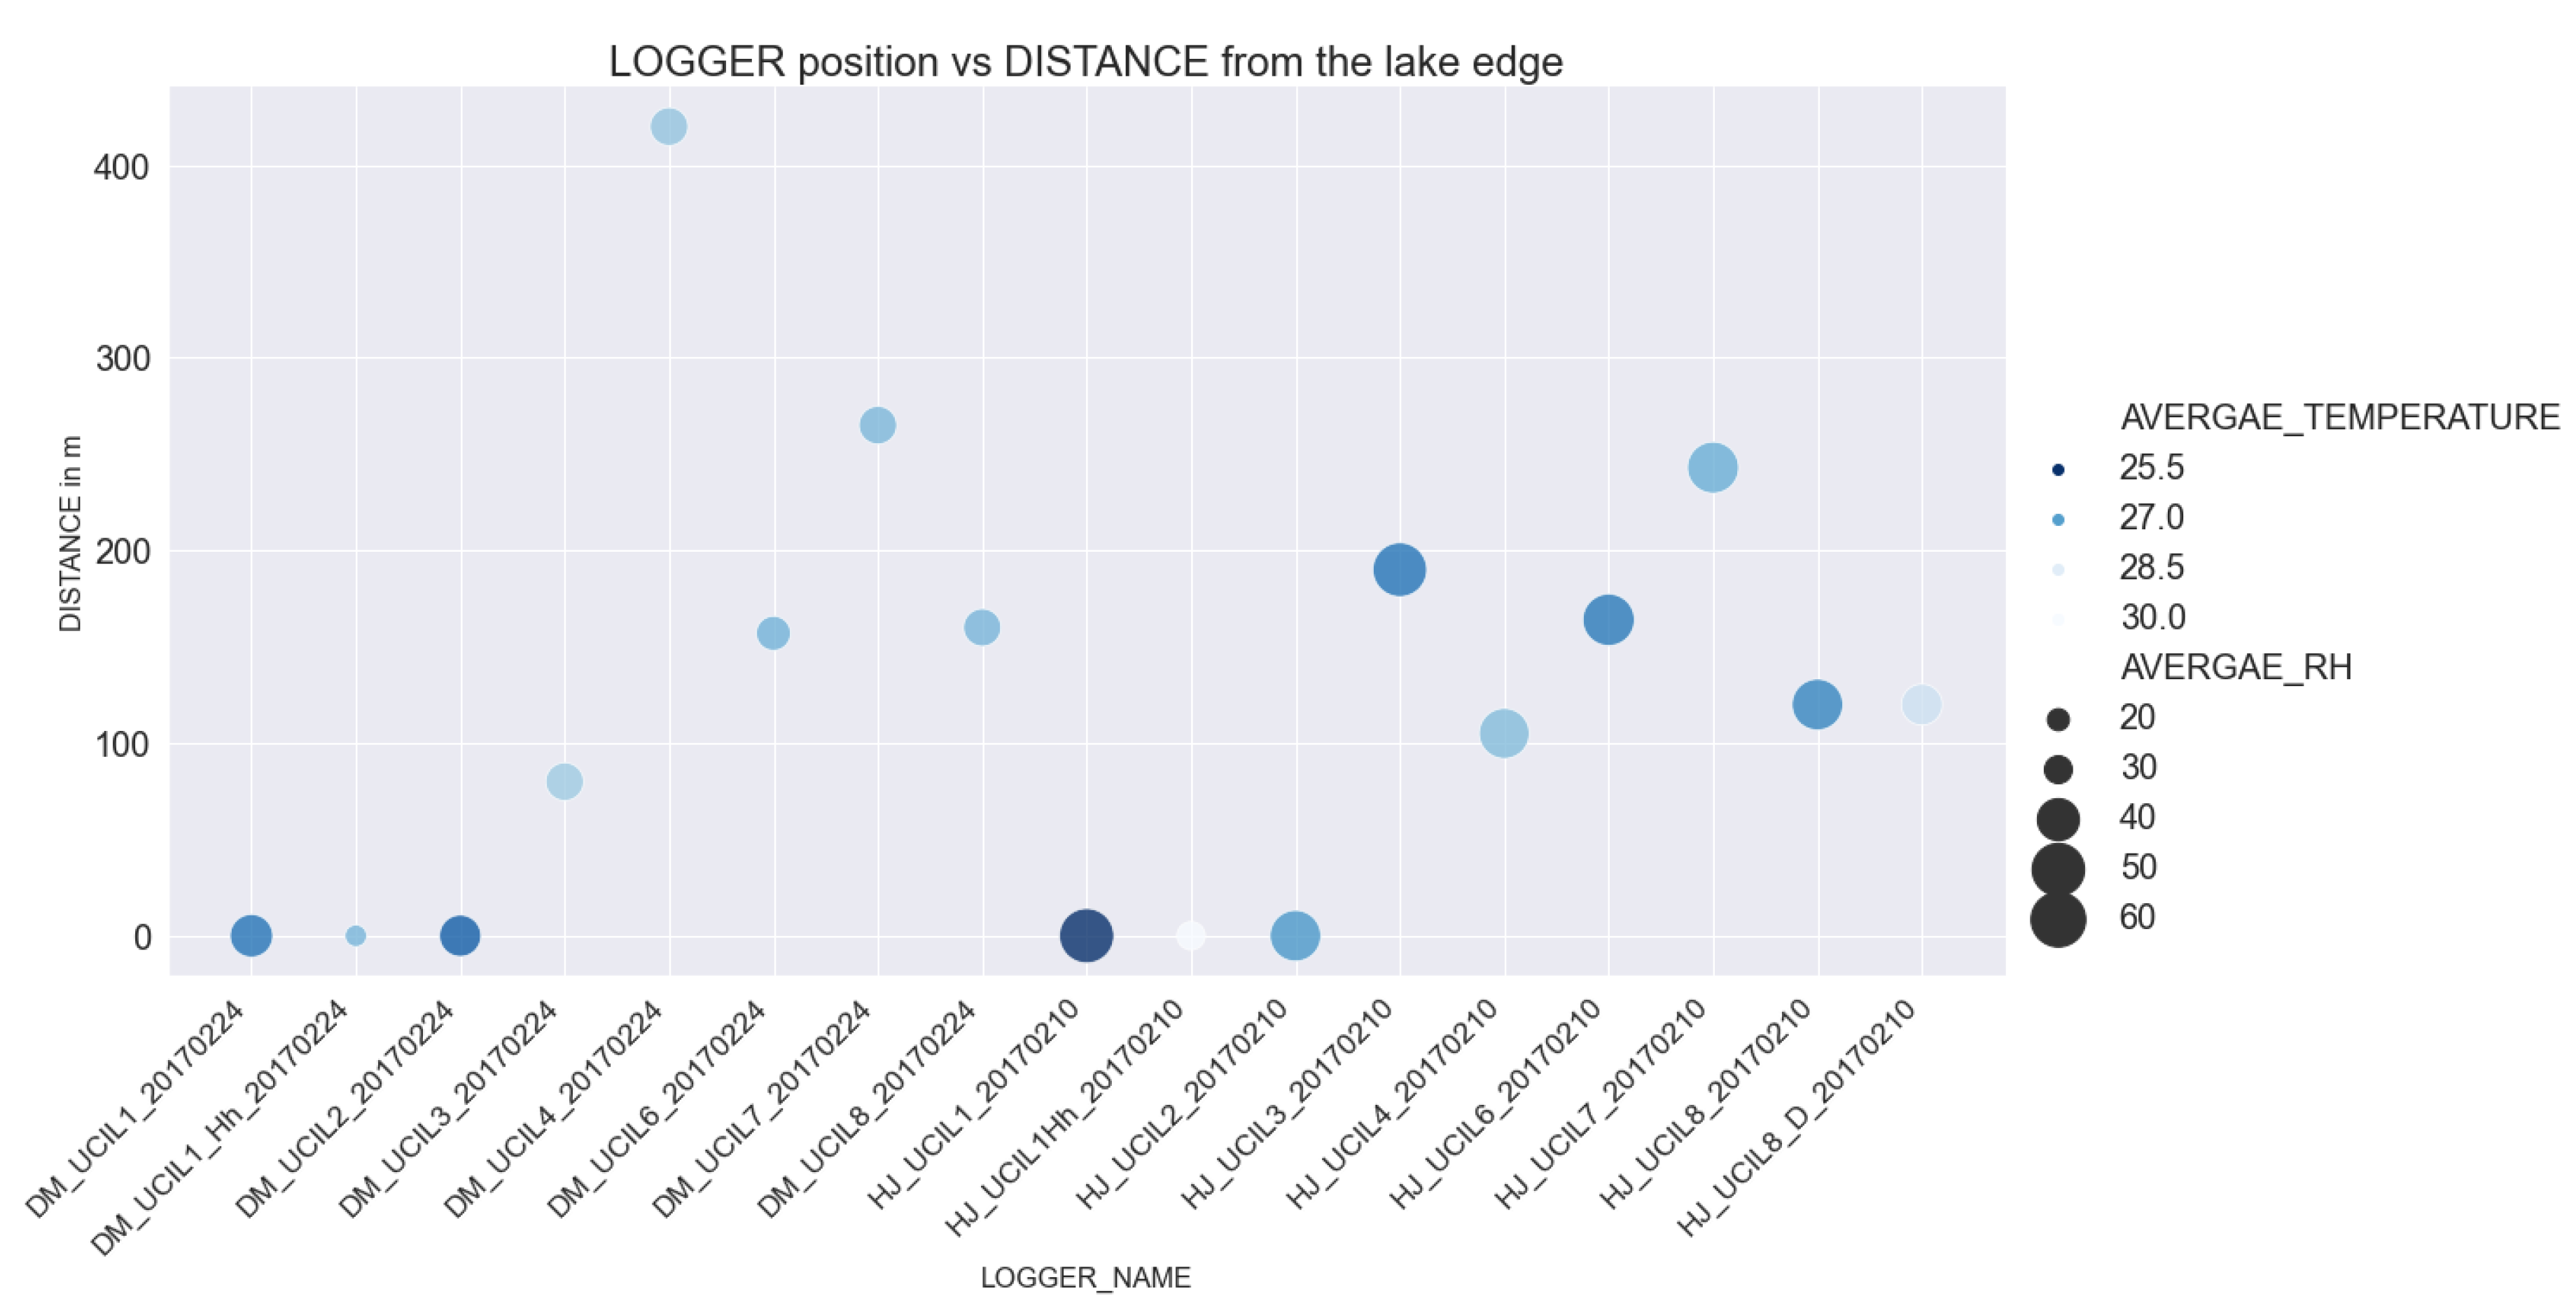
- Influence of the distance from the edge of the wetland on temperature:
- iv.
- Effect of the location of the park on temperature:
- v.
- Effect of shading in the urban canyon:
- vi.
- Humidity and distance from the lake edge:
- vii.
- Evaporative cooling potential:
4. Results and Analysis of Simulation Study
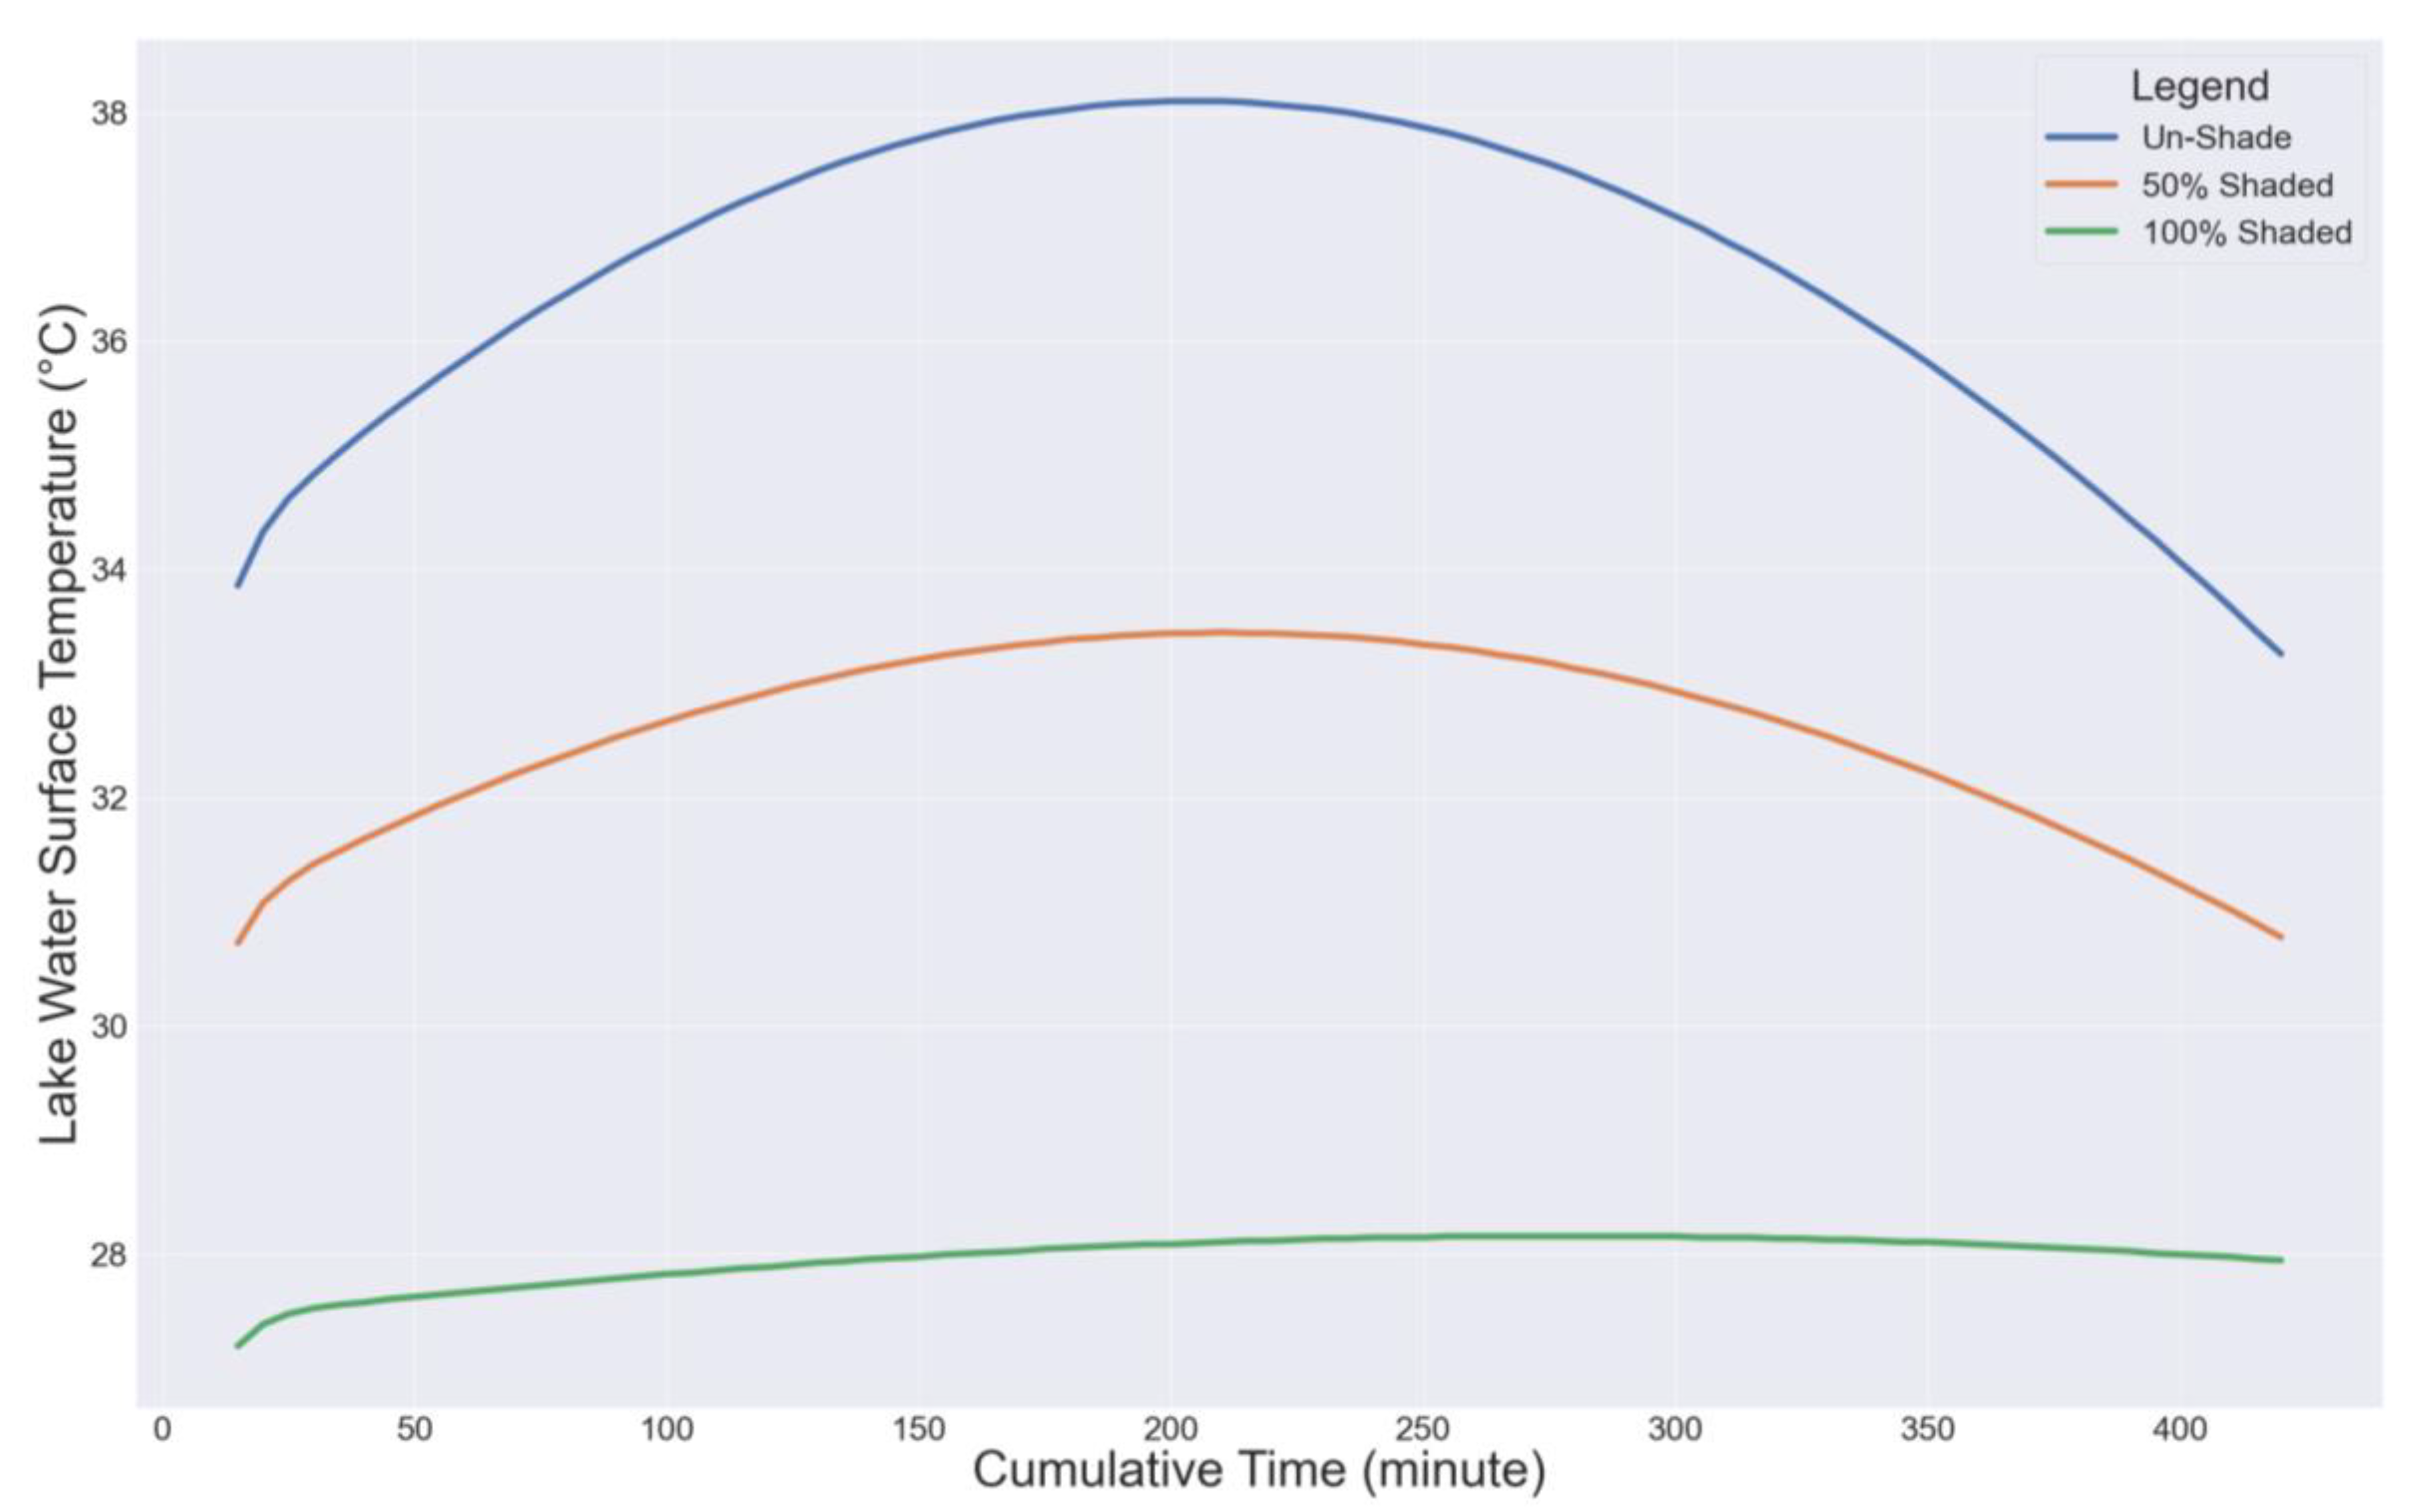
4.1. Effect of Shading on Water Temperature
- Case 1: First simulation study conducted with the water of the lake entirely under solar radiation.
- Case 2: Second simulation study conducted with fifty percent (50%) water of the lake under solar radiation.
- Case 3: Third simulation study conducted with the water body completely shaded from solar radiation.
4.2. Effect of Cumulative Time on the Rate of Change of Air Temperature and Relative Humidity
4.3. Development of Inversion Layer
4.4. Effect of the Fetch on the Inversion Height
4.5. Correlation between the Inversion Height and Fetch
4.6. Inversion Model
- Independent variable: fetch (x);
- Dependent variables: inversion height (z), air temperature (T), relative humidity (RH), and the horizontal component of the total energy flux (f).
- Case 1: For Case 1, the regression model is:
- Case 2: For Case 2, the regression model is:
- Case 3: For Case 3, the regression model is:
- Case 4: For Case 4, the regression model is:
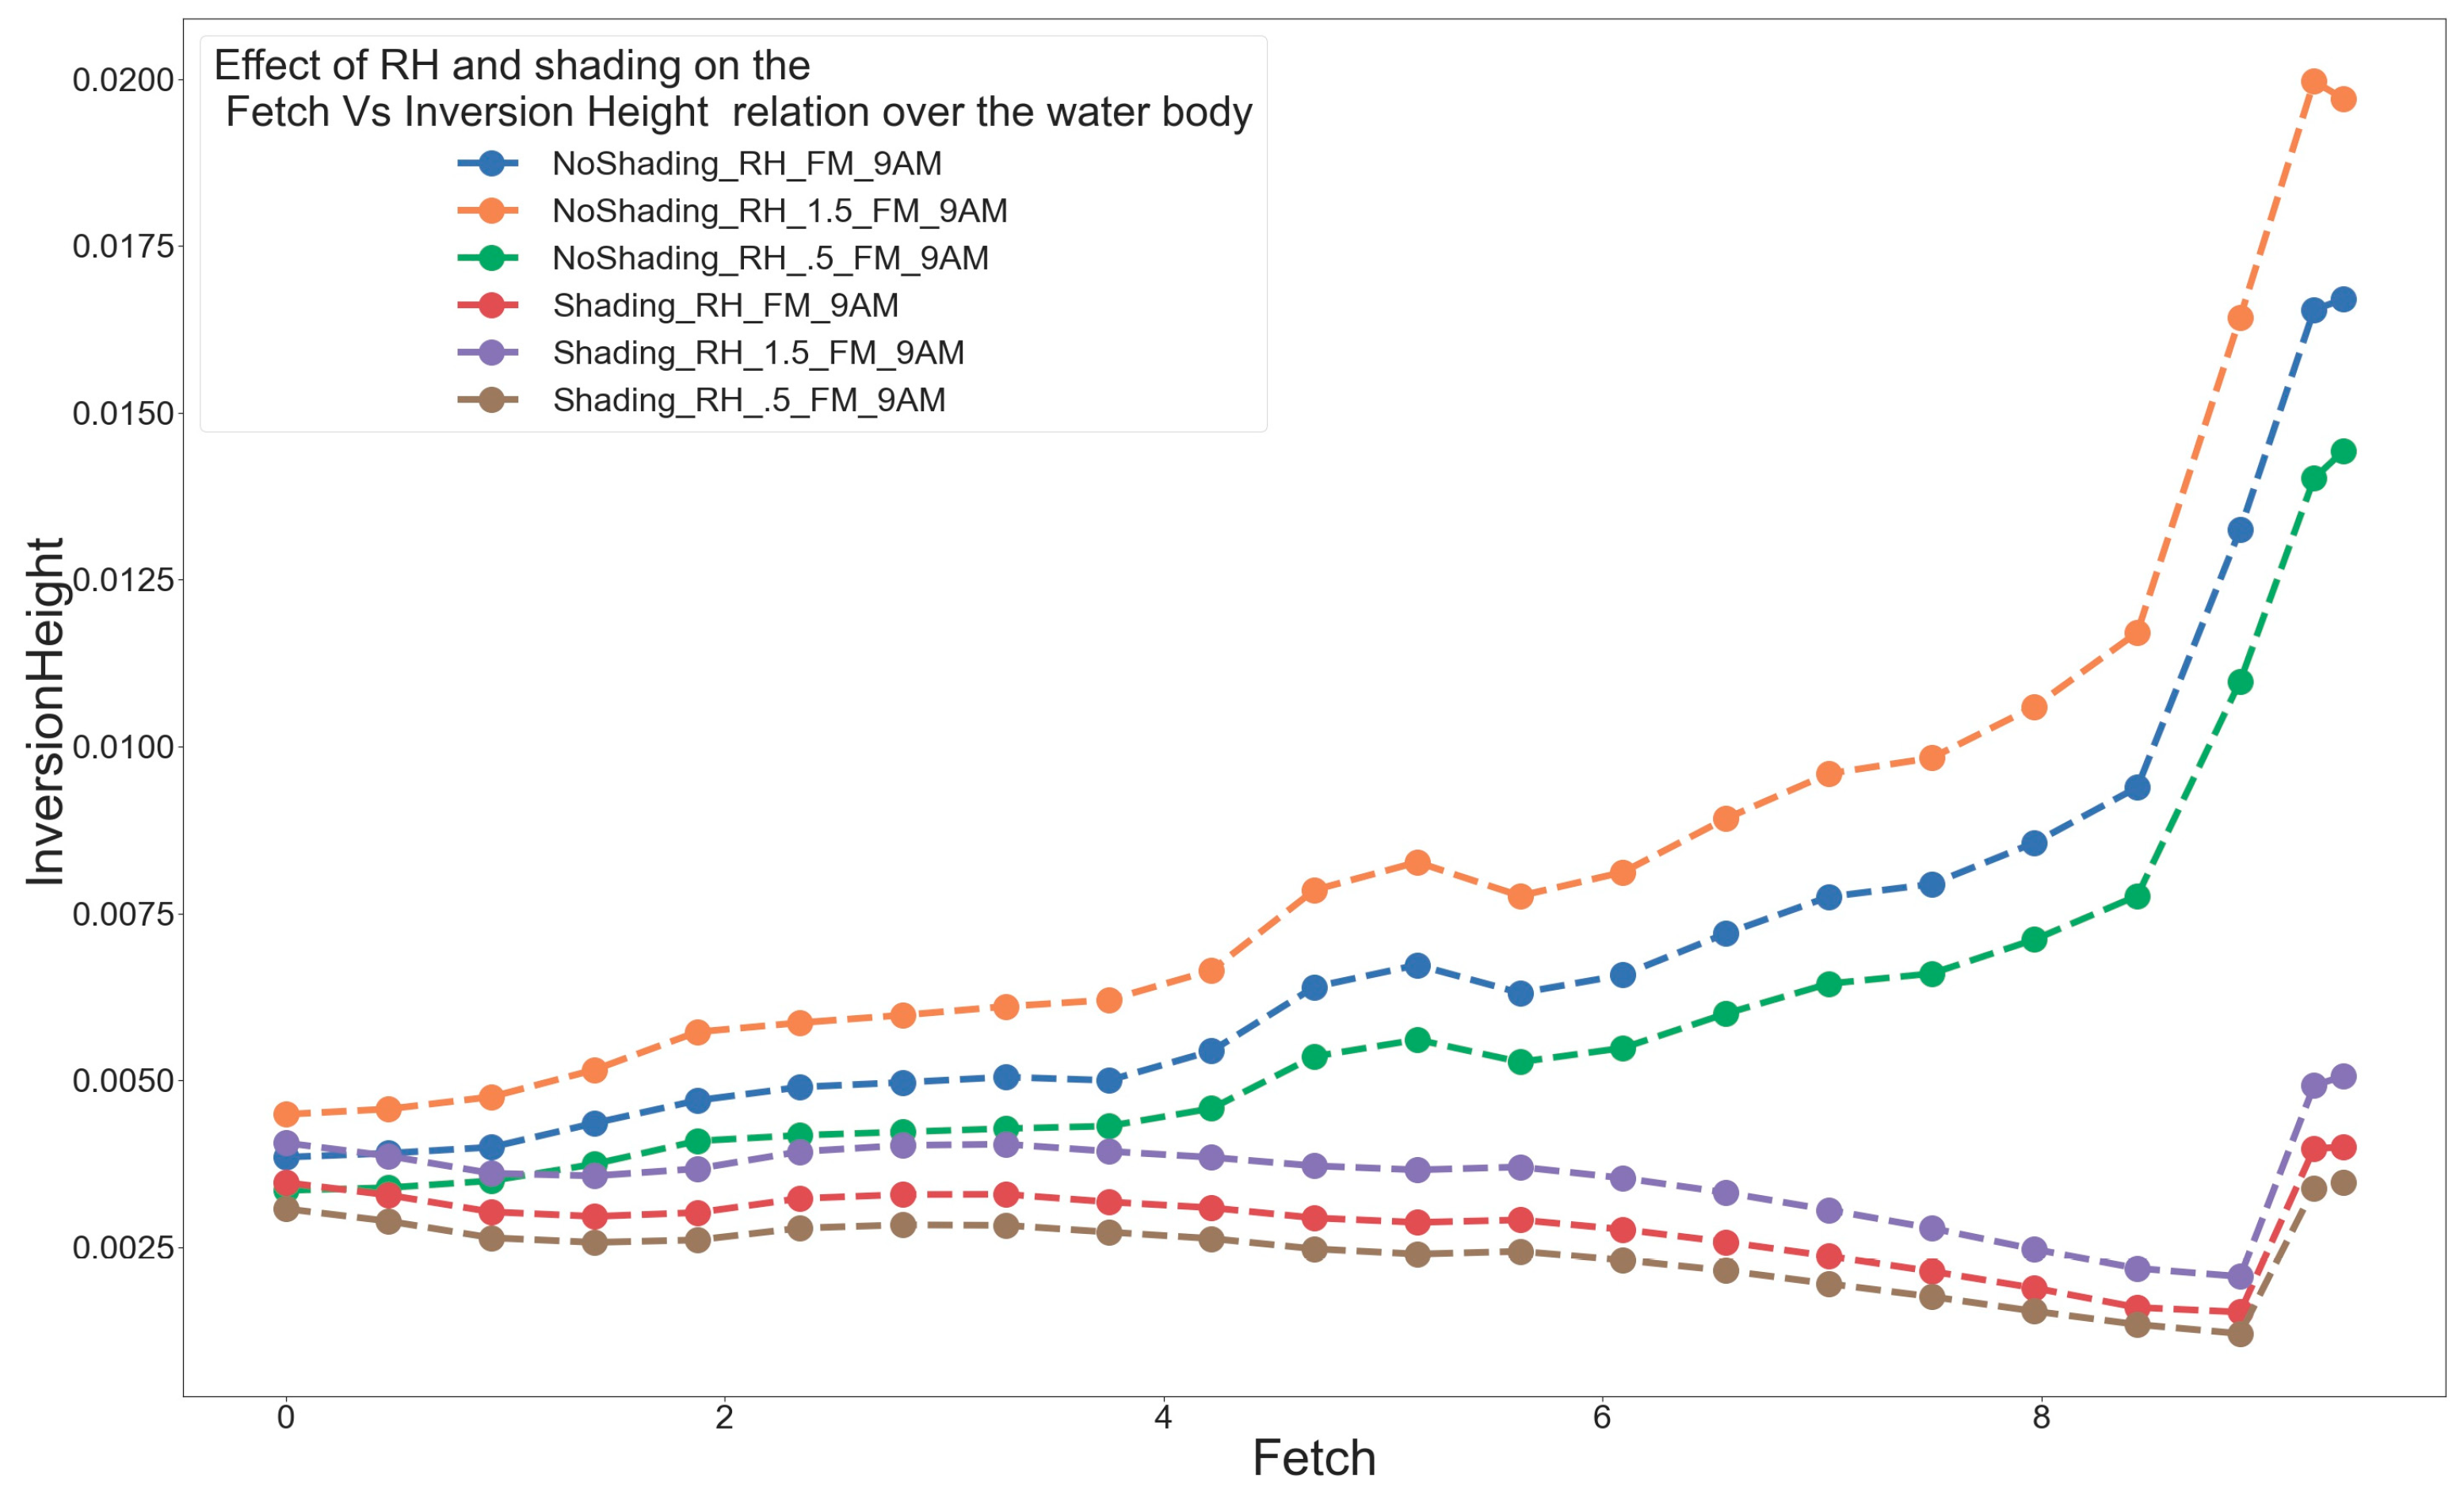
4.7. Effect of the Relative Humidity on the Inversion Layer Thickness
4.8. Effect of the Orientation and Riparian Shading Height of the Wetland on the Water Temperature
5. Conclusions
6. Suggestions for Further Work
- i.
- Field measurement:
- ii.
- Simulation work:
Author Contributions
Funding
Acknowledgments
Conflicts of Interest
Appendix A
Appendix A.1. Characteristics of the Urban Stations
Appendix A.1.1. Dhanmondi Lake Urban Stations
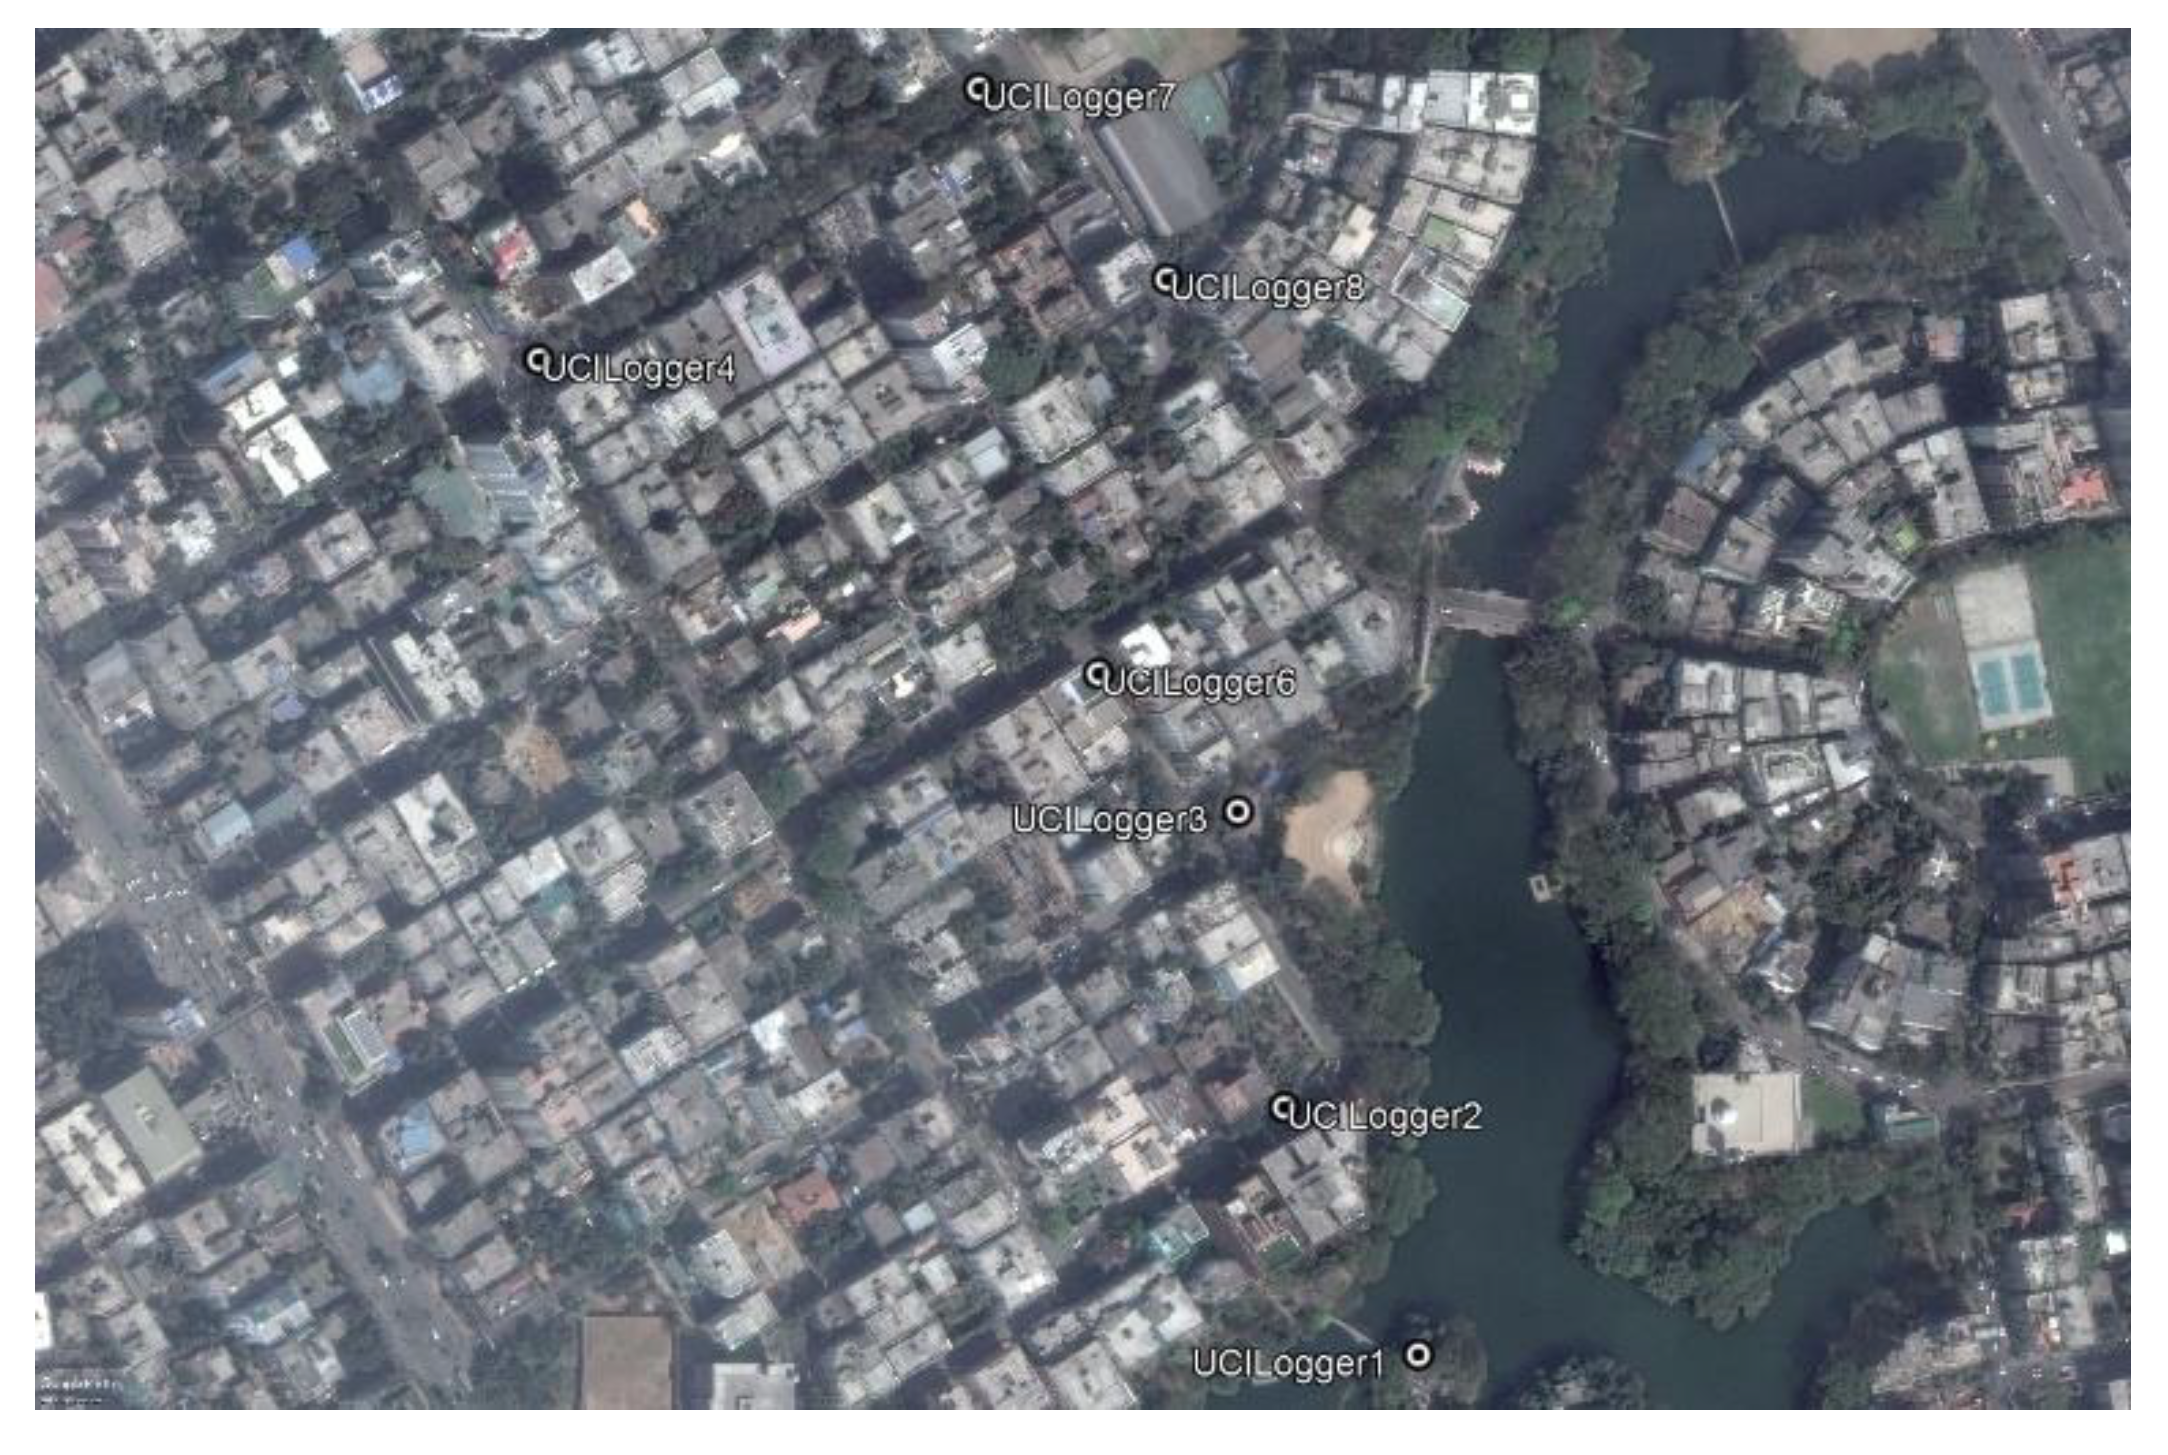
| Sl | Logger Name | Location and Physical Characteristics of Location | Location Photo | Geographical Coordinates | Duration of the Data Logging |
|---|---|---|---|---|---|
| 1 | UCILogger1 | Island in between road 6A and Sudha Sadan. Ventilated Box mounted. On the edge of a small island, in the middle of the lake under tree shade. 1 m from the ground surface, tied with a branch of shrubs |  | Latitude 23.743302 Longitude 90.377449 | Start 7:35 a.m. Finish 6:00 p.m. |
| 2 | UCILogger1-Extech Dual Sensor | Island in between road 6A and Sudha Sadan. Handheld. On the edge of a small island, in the middle of the lake under tree shade. 1 m from the ground surface, tied with a branch of shrubs | Latitude 90.377449 Longitude 23.743302 | Start 7:45 a.m. Finish 6:00 p.m. | |
| 3 | UCILogger2 | Rabindra Sorobor; water edge; tied to the branch of a banyan tree. Ventilated box mounted. 0.8 m from the top of the water surface. | 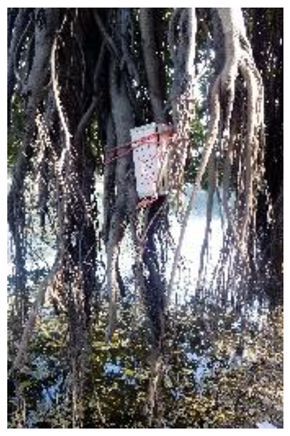 | Latitude 23.744261 Longitude 90.376882 | Start 7:55 a.m. Finish 6:00 p.m. |
| 4 | UCILogger2-Extech Thermo-anemometer | Rabindra Sorobor water. Handheld. 1.5 m from the top of the ground surface. | Latitude 23.744261 Longitude 90.376882 | Start 11:50 a.m. Finish 6:00 p.m. | |
| 5 | UCILogger3 | Rabindra Sorobar restaurant, Junction of road 7A. Ventilated Box mounted (at 1.8 m height) under the shade of a tree, exposed to direct air from the lake; 80 m from the edge of the water in the north-western direction. | 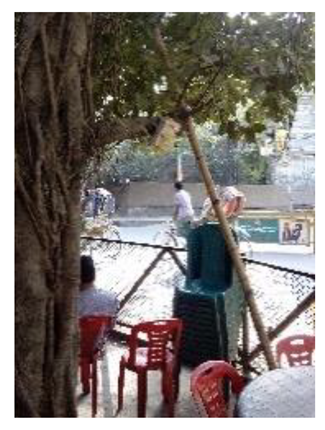 | Latitude 23.745408 Longitude90.376686 | Start 9:10 a.m. Finish 6:00 p.m. |
| 6 | UCILogger4 | The crossing of Road 8A and 10A. Ventilated Box mounted (at 1.8 m height) in a partly grass-covered ground surface under the shade of a tree, deep in the urban fabric with no direct air corridor from the lake to the point. Approximately at a distance of 420 m directly from the edge of the lake water in the north-eastern direction (heading 112 degrees). | 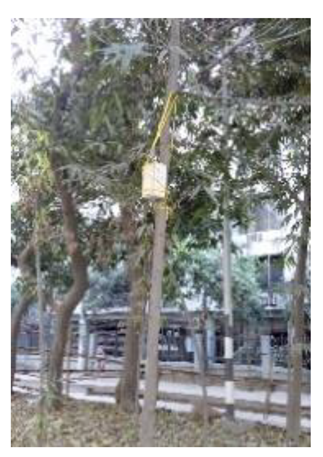 | Latitude 23.747157 Longitude 90.373729 | Start 8:32 a.m. Finish 6:00 p.m. |
| 7 | UCILogger6 | Road 8A near Rabindra Sorobor. Ventilated box mounted (at 1.8 m height) on paved footpath under the shade of a tree; two air corridors from the lake: 120 m from the edge of the water in the north-eastern direction. 120 m in the south-eastern direction.157 m directly from the edge. |  | Latitude 23.745942 Longitude 90.376096 | Start 9:25 a.m. Finish 6:00 p.m. |
| 8 | UCILogger7 | Junction Road 10A and Sultana Kamal Mohila Complex. Ventilated Box mounted (at 1.6 m height) in a partly grass-covered ground surface under the shade of a tree, with a direct air corridor from the lake to the point. Approximately 265 m distance from the edge of the lake water along the air corridor in the north-eastern direction. |  | Latitude 23.748209 Longitude 90.375590 | Start 8:25a.m. Finish 6:00 p.m. |
| 9 | UCILogger8 | At the junction between road 9A and 11A, south-west corner of Sultana Kamal Mohila complex. Height 1.6 m from the footpath. 160 m from the edge of the water in the north-western direction. | 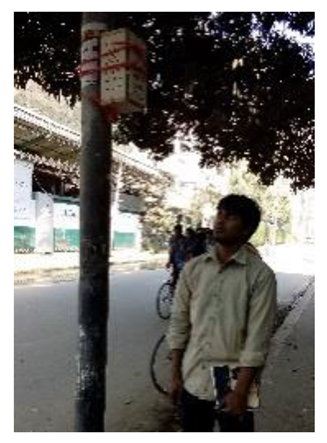 | Latitude 23.747469 Longitude 90.376386 | Start 8:45 a.m. Finish 6:00 p.m. |
Appendix A.1.2. Hatirjheel Lake Urban Stations
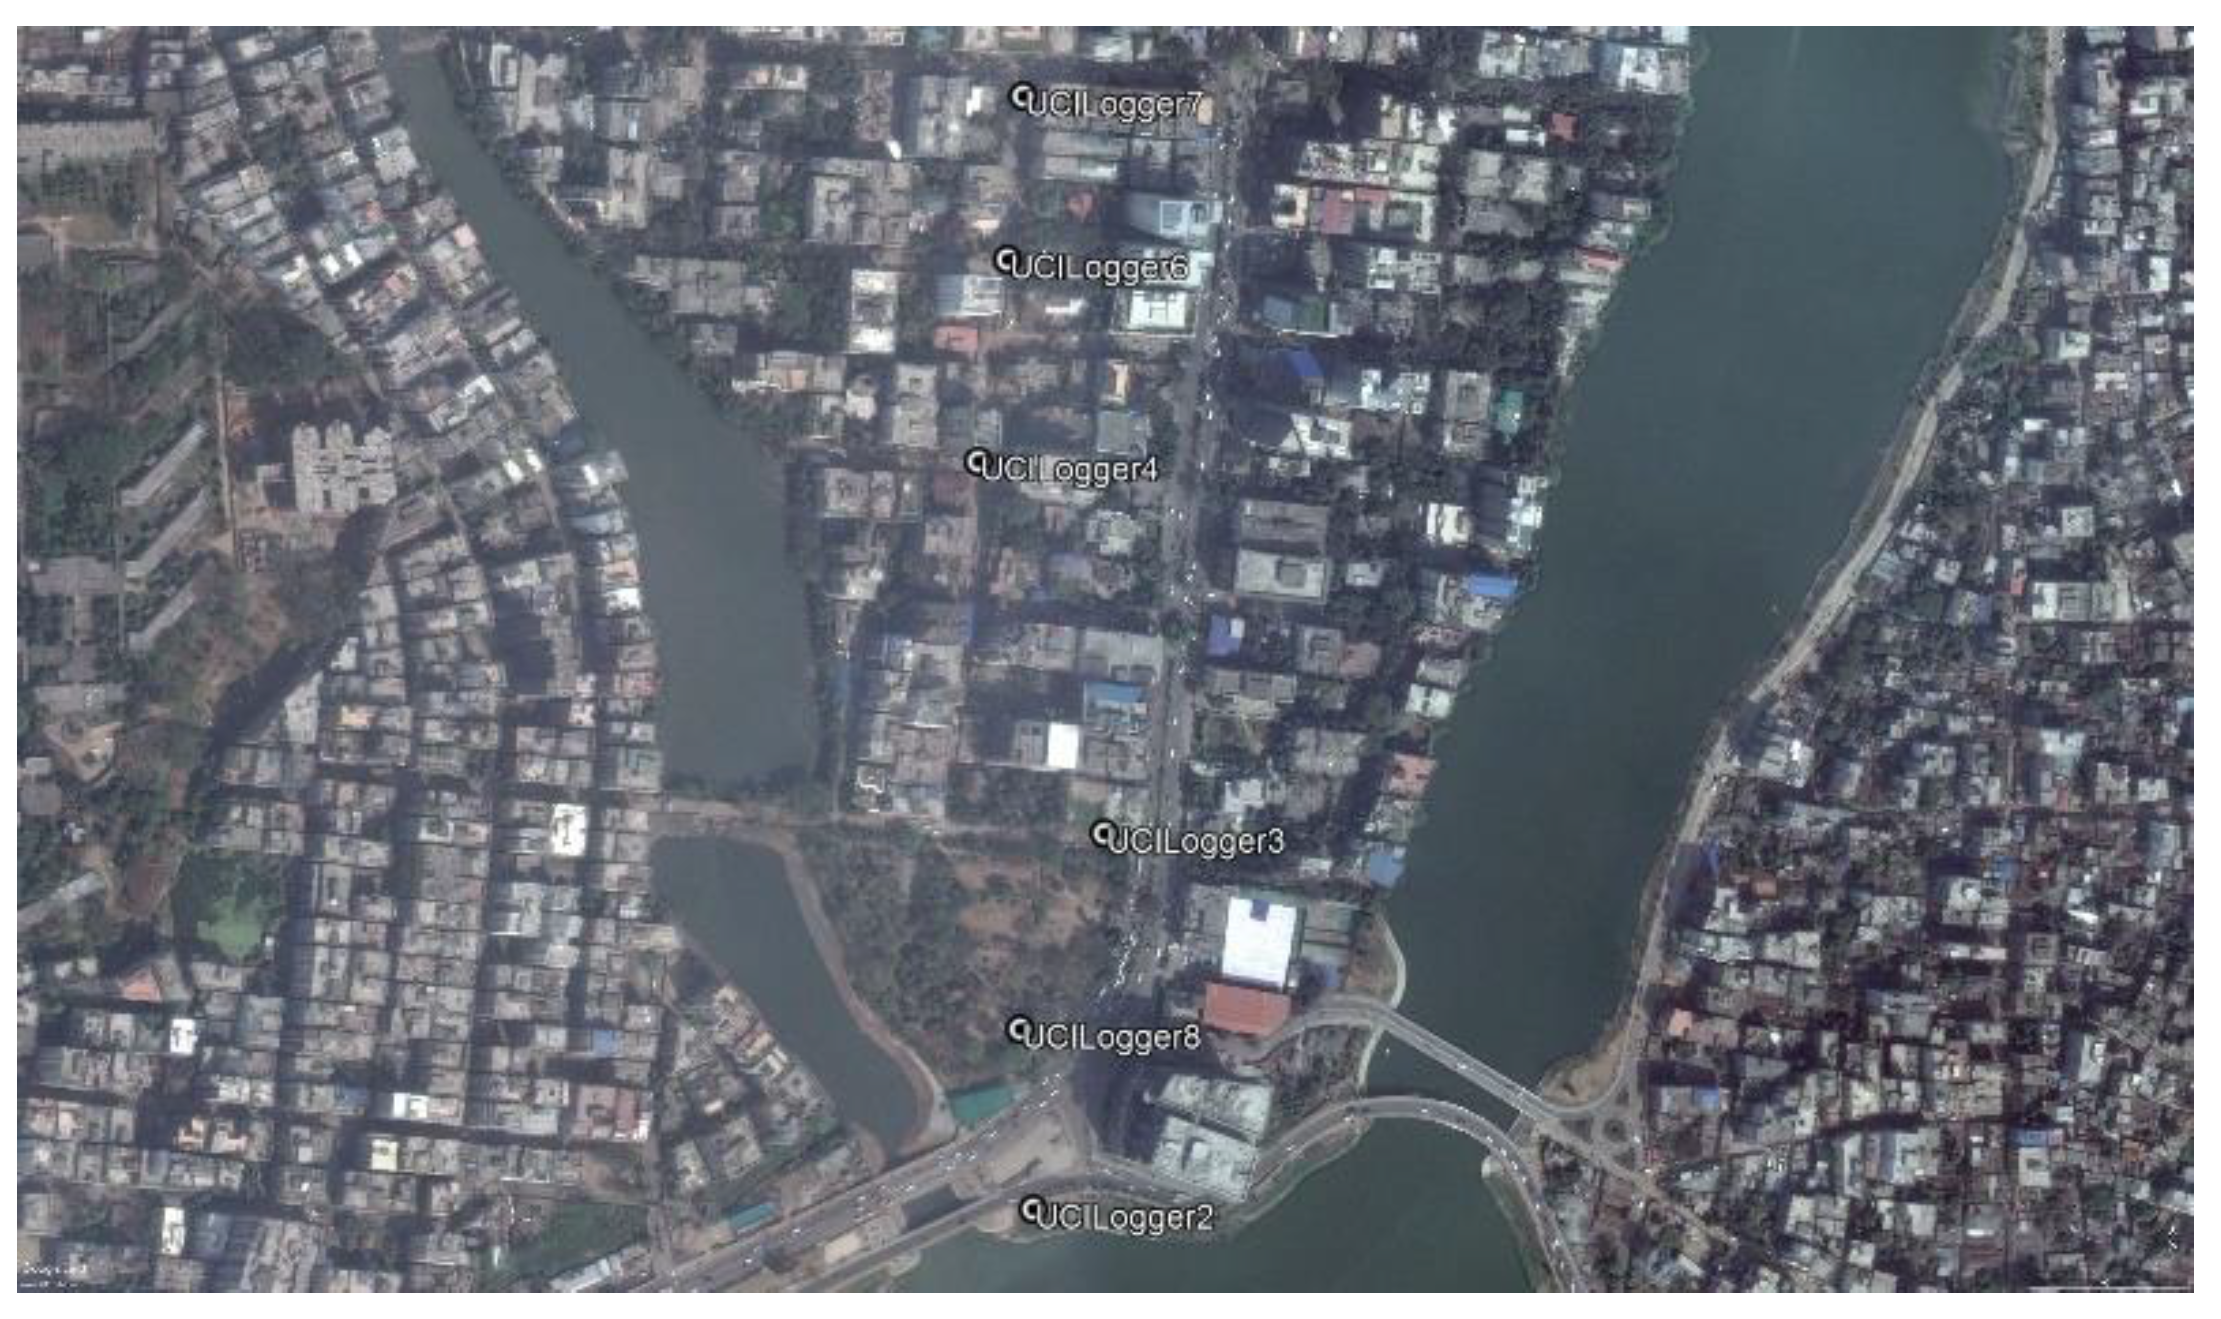
| Sl | Logger Name | Location and Physical Characteristics of Location | Location Photo | Geographical Coordinate | Duration of the Data Logging |
|---|---|---|---|---|---|
| 1 | UCILogger1 | Mahanagar Bridge (Bridge 2). Suspended from the middle of the bridge at 6 m above the top of the water surface | 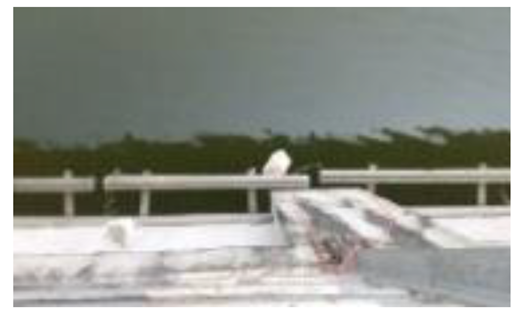 | Latitude 23.768043 Longitude 90.413047 | Start 8:19 a.m. Finish 5:50 p.m. |
| 2 | UCILogger1-Extech Dual Sensor | Mahanagar Bridge (Bridge 2). Suspended from the middle of the bridge at 6 m above the top of the water surface | 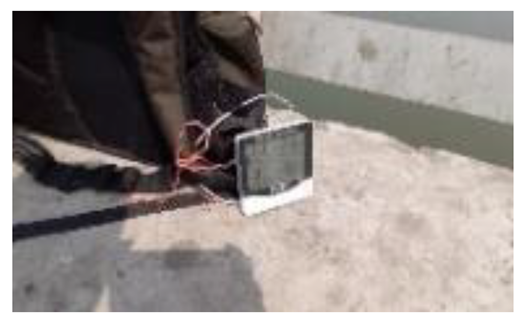 | Latitude 23.768043 Longitude 90.413047 | Start 8:25 a.m. Finish 5:50 p.m. |
| 3 | UCILogger2 | Opposite of Police Plaza Concord. Cased inside ventilated Particle board box and tied to the branch of a shrub, 1.8 m above a grass-covered ground surface under the shade of a tree, at the edge of the water of Hatirjheel Lake. | 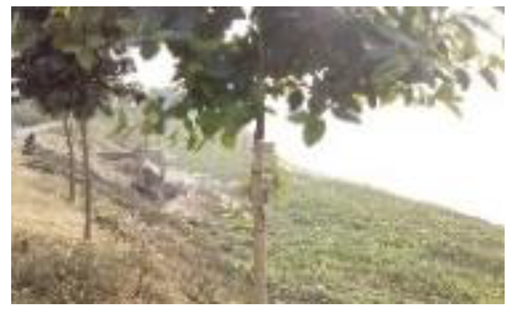 | Latitude 23.772448 Longitude 90.415489 | Start 8:35 a.m. Finish 5:50 p.m. |
| 4 | UCILogger2-Extech Thermo anemometer | Opposite of Police Plaza Concord. Handheld—1.2 m above a grass-covered ground surface under the shade of a tree, at the edge of the water of Hatirjheel Lake. | Latitude 23.772448 Longitude 90.415489 | Start 8:50 a.m. Finish 5:50 p.m. | |
| 5 | UCILogger3 | Gulshan 1 park, opposite of shooting club. Cased inside a ventilated particle board box and tied to the branch of a shrub, 1.5 m above a partly grass-covered ground surface under the shade of a tree, 190 m (155 m towards east) away from the edge of the water on the southern direction |  | Latitude 23.774313 Longitude 90.415876 | Start 7:50 a.m. Finish 5:50 p.m. |
| 6 | UCILogger4 | The junction between road 2 and 4. Cased inside a ventilated particle board box and tied to the trunk of a tree, 1.5 m above the paved surface, approximately 425 m (105 m towards NW) away from the edge of the water in the southern direction and 110 m from the lake edge in the western direction. |  | Latitude 23.776312 Longitude 90.414983 | Start 9:06 a.m. Finish 5:50 p.m. |
| 7 | UCILogger6 | The junction between road 2 and 6. Cased inside a ventilated particle board box and tied to the trunk of the tree, 1.5 m above the paved surface, approximately 550 m (164 m towards NW) away from the edge of the water in the southern direction | 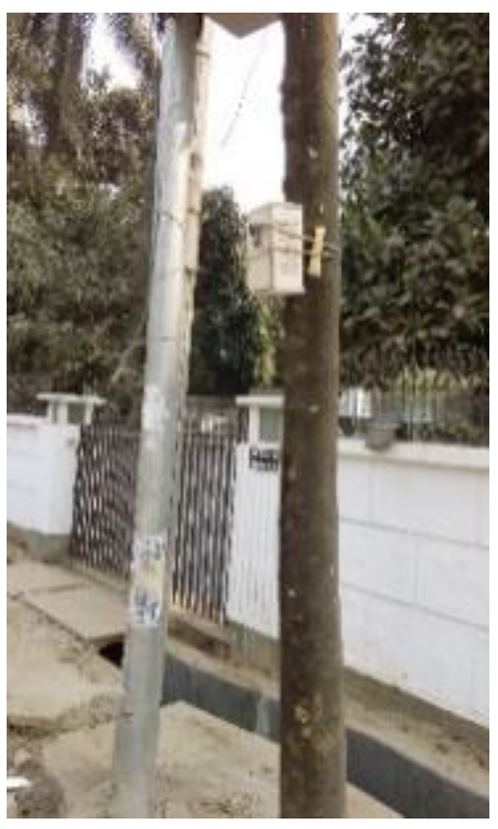 | Latitude 23.777164 Longitude 90.415349 | Start 9:17 a.m. Finish 5:50 p.m. |
| 8 | UCILogger7 | The junction between road 8 and 2. Cased inside a ventilated particle board box and tied to the trunk of a tree, 1.5 m above the paved surface, approximately 660 m (243 m towards NW) away from the edge of the water in the southern direction | 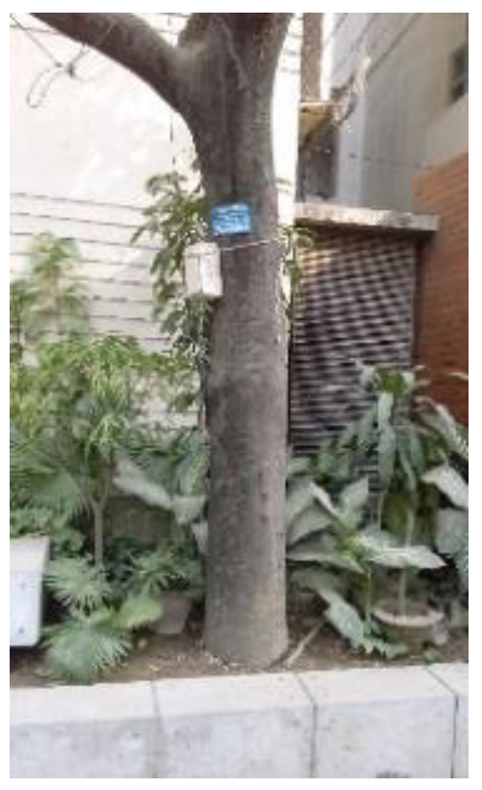 | Latitude 23.777975 Longitude 90.415434 | Start 9:25 a.m. Finish 5:50 p.m. |
| 9 | UCILogger8 | Gulshan-1 park, Police Plaza complex corner. Cased inside a ventilated particle board box and tied to the branch of a shrub, 1.5 m above a partly grass-covered ground surface under the shade of a tree, approximately 120 m away from the edge of the water in the southern direction | 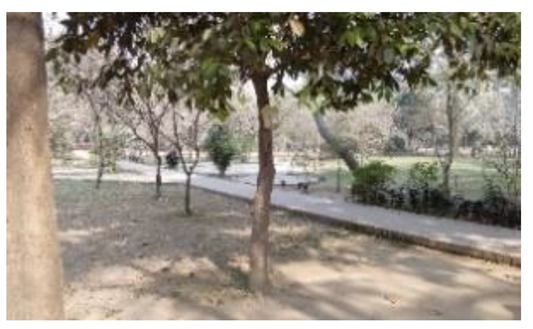 | Latitude 23.773342 Longitude 90.415418 | Start 9:45 a.m. Finish 5:50 p.m. |
| 10 | UCILogger8-Davis | Gulshan-1 park, Police Plaza complex corner. 2 m above a partly grass-covered ground surface under the shade of a tree, approximately 120 m away from the edge of the water in the southern direction | 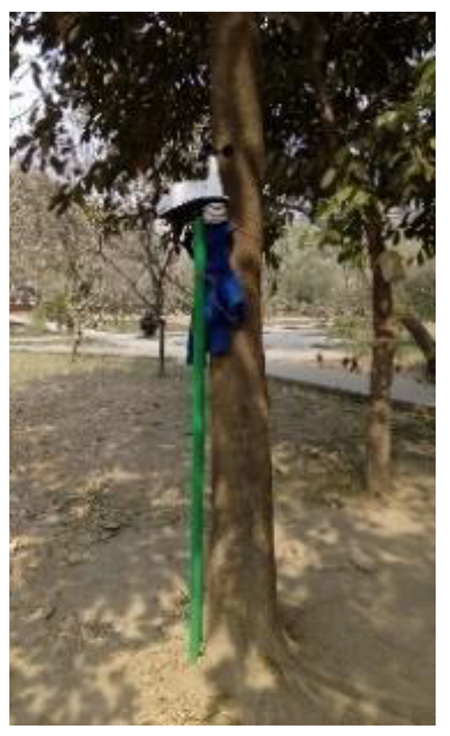 | Latitude 23.773342 Longitude 90.415418 | Start 11:30 a.m. Finish 5:50 p.m. |
Appendix A.2. Instruments
Appendix A.3. Physiography of the Study Area
Appendix B
Appendix B.1. Turbulent Flow
Appendix B.2. Heat Transfer
Appendix B.3. Transport of Water Vapor
Appendix B.4. Roughness Parameters
- Aerodynamic roughness length z0: used for area one, two, three, and five;
- Equivalent sand-grain roughness length ks: used in area four.
Appendix C
Appendix C.1. Reference Measurement at the Bangladesh Meteorological Department
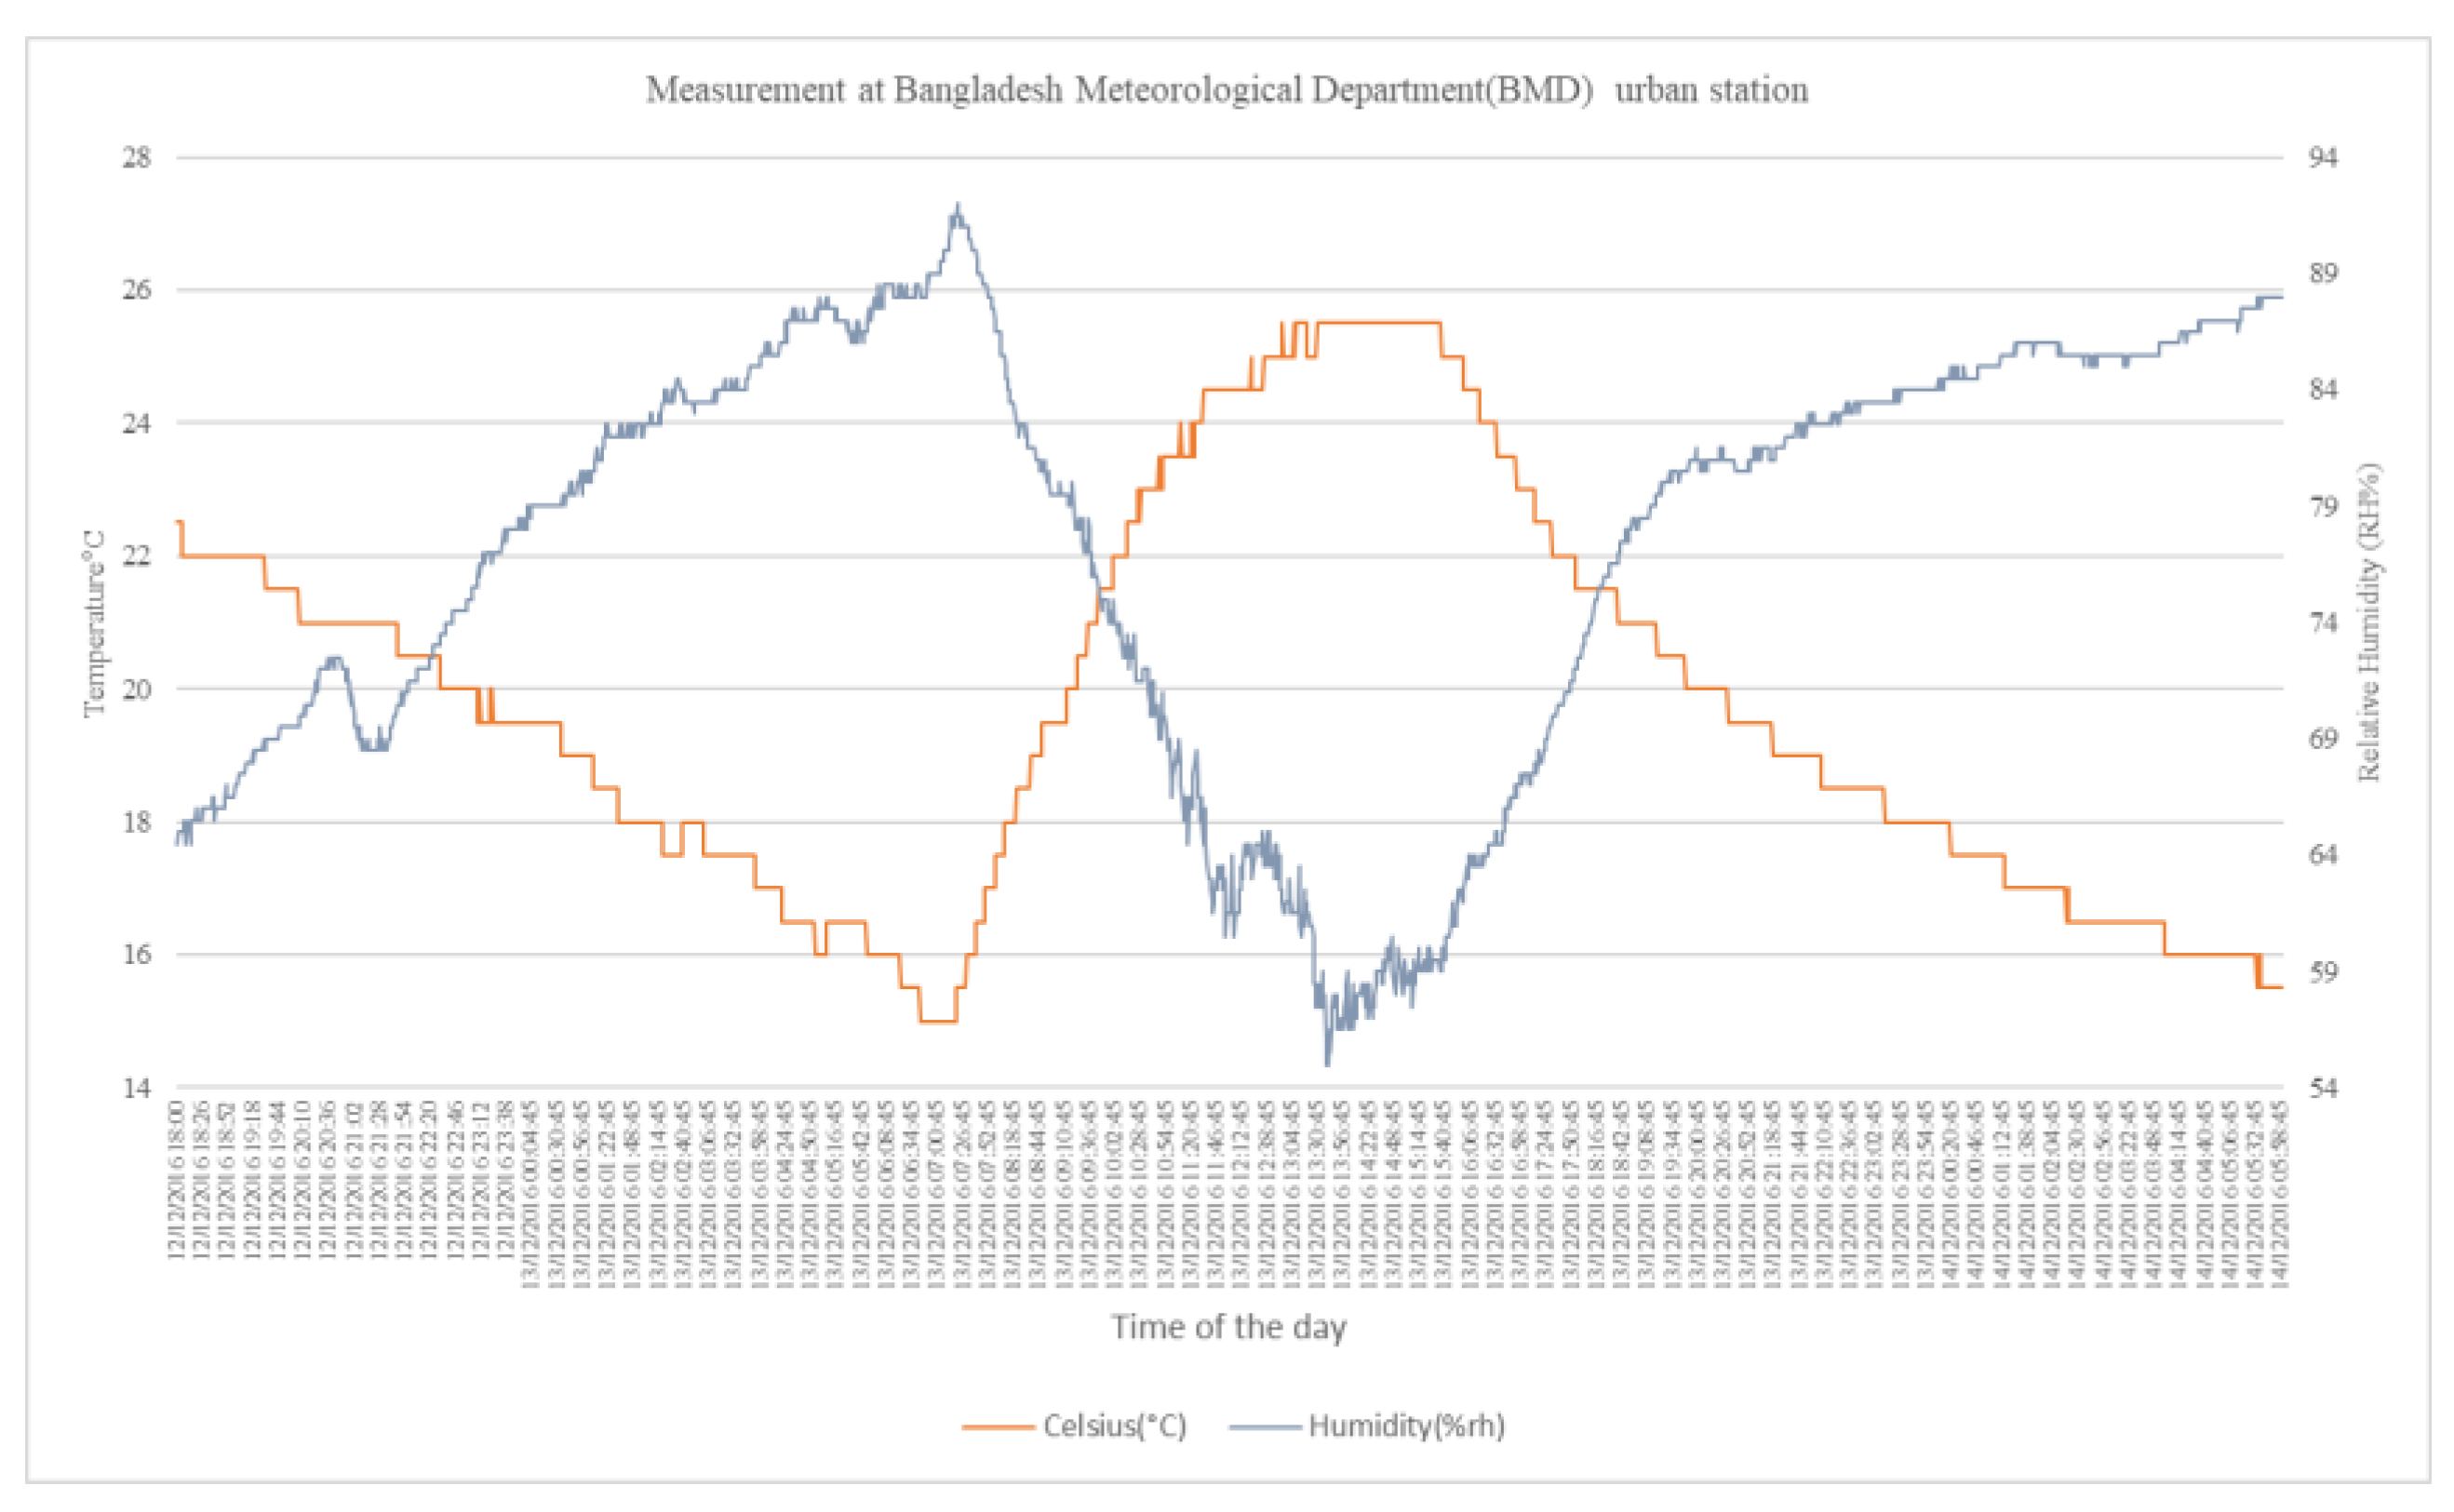
| Variables | 6:00 p.m. 12 December to 6:00 a.m. (Night) | 6:00 a.m. 13 December to 6:00 p.m. 13 December 2016 (Day) | 6:00 p.m. 13 December to 6:00 a.m. 14 December 2016 (Night) |
|---|---|---|---|
| Air Temperature (Ta) | −0.99 | 0.79 | −0.98 |
| Relative Humidity (RH) | 0.98 | −0.81 | 0.93 |
Appendix C.2. Correlation Coefficient between Air Temperature, Relative Humidity and Cumulative Time of the Urban Stations at the Measurement Day
| Urban Stations | Correlation Coefficient |
|---|---|
| UCIL1 (°C) | 0.73 |
| UCIL2 (°C) | 0.39 |
| UCIL4 (°C) | 0.57 |
| UCIL6 (°C) | 0.76 |
| UCIL7 (°C) | 0.06 |
| Urban Stations | Correlation Coefficient |
|---|---|
| UCIL1 (°C) | 0.36 |
| UCIL2 (°C) | −0.78 |
| UCIL3 (°C) | −0.26 |
| UCIL4 (°C) | 0.45 |
| UCIL5_Hh (°C) | −0.02 |
| UCIL6 (°C) | 0.44 |
| UCIL7 (°C) | 0.37 |
| UCIL8 (°C) | −0.73 |
| UCIL9_Hh (°C) | 0.47 |
| Urban Stations | Distance from the Water Edge | Correlation Coefficient |
|---|---|---|
| UCIL1 (°C) | 0, middle | 0.86 |
| UCIL2 (°C) | 0, edge | 0.89 |
| UCIL3 (°C) | 80 m | 0.88 |
| UCIL4 (°C) | 420 m | 0.87 |
| UCIL6 (°C) | 157 m | 0.75 |
| UCIL7 (°C) | 230 m | 0.81 |
| UCIL8 (°C) | 206 m | 0.70 |
| Urban Stations | Correlation Coefficient |
|---|---|
| UCIL1 (%rh) | −0.58 |
| UCIL2 (%rh) | −0.33 |
| UCIL4 (%rh) | −0.58 |
| UCIL6 (%rh) | −0.64 |
| UCIL7 (%rh) | −0.09 |
| Urban Stations | Correlation Coefficient |
|---|---|
| UCIL1 (%rh) | 0.06 |
| UCIL2 (%rh) | 0.78 |
| UCIL3 (%rh) | 0.28 |
| UCIL4 (%rh) | −0.17 |
| UCIL6 (%rh) | −0.25 |
| UCIL7 (%rh) | 0.12 |
| UCIL8 (%rh) | 0.63 |
| Urban Stations | Distance from the Water Edge | Correlation Coefficient |
|---|---|---|
| UCIL1 (%rh) | 0, middle | −0.71 |
| UCIL2 (%rh) | 0, edge | −0.59 |
| UCIL3 (%rh) | 80 m | −0.52 |
| UCIL4 (%rh) | 420 m | −0.79 |
| UCIL6 (%rh) | 157 m | −0.23 |
| UCIL7 (%rh) | 230 m | −0.66 |
| UCIL8 (%rh) | 206 m | −0.43 |
| Urban Statins | Distance from the Water Edge | Correlation Coefficient |
|---|---|---|
| UCIL1 (°C) | 0 m, middle | 0.56 |
| UCIL2 (°C) | 190 m, park | 0.55 |
| UCIL6 (°C) | 0 m, edge | 0.53 |
| UCIL7 (°C) | 100 m | 0.39 |
| UCIL8 (°C) | 425 m | −0.04 |
| Urban Stations | Correlation Coefficient |
|---|---|
| UCIL1 (°C) | 0.65 |
| UCIL2 (°C) | 0.80 |
| UCIL6 (°C) | 0.92 |
| UCIL7 (°C) | 0.91 |
| UCIL8 (°C) | 0.79 |
| Urban Stations | Distance from the Water Edge | Correlation Coefficient |
|---|---|---|
| UCIL1 (°C) | 0 m | 0.92 |
| UCIL2 (°C) | 0 m water Edge | 0.88 |
| UCIL8 (°C) | 120 m, middle of the park | 0.77 |
| UCIL3 (°C) | 190 m, edge of the park | 0.82 |
| UCIL4 (°C) | 425 m | 0.58 |
| UCIL6 (°C) | 550 m | 0.59 |
| UCIL7 (°C) | 660 m | 0.68 |
| Urban Stations | Correlation Coefficient |
|---|---|
| UCIL1 (%rh) | −0.49 |
| UCIL2 (%rh) | −0.52 |
| UCIL6 (%rh) | −0.46 |
| UCIL7 (%rh) | −0.40 |
| UCIL8 (%rh) | −0.11 |
| Urban Stations | Correlation Coefficient |
|---|---|
| UCIL1 (%rh) | −0.59 |
| UCIL2 (%rh) | −0.84 |
| UCIL6 (%rh) | −0.86 |
| UCIL7 (%rh) | −0.85 |
| UCIL8 (%rh) | −0.82 |
| Urban Stations | Distance from the Water Edge | Correlation Coefficient |
|---|---|---|
| UCIL1 (%rh) | 0 m | −0.90 |
| UCIL2 (%rh) | 0 m water Edge | −0.90 |
| UCIL8 (%rh) | 120 m, middle of the park | −0.83 |
| UCIL3 (%rh) | 190 m, edge of the park | −0.89 |
| UCIL4 (%rh) | 425 m | −0.78 |
| UCIL6 (%rh) | 550 m | −0.74 |
| UCIL7 (%rh) | 660 m | −0.79 |
Appendix C.3. Correlation Coefficient between Simulated Air Temperature, Relative Humidity, and Cumulative Time of the Urban Stations at the Measurement Day
| Measurement Point | Pearson’s Product-Moment Correlation Coefficient for Air Temperature | Pearson’s Product-Moment Correlation Coefficient for Relative Humidity |
|---|---|---|
| UCIL2 | 0.90 | 0.89 |
| UCIL3 | 0.91 | 0.52 |
| UCIL4 | 0.92 | −0.84 |
| UCIL5 | 0.92 | 0.61 |
| UCIL6 | 0.85 | 0.13 |
| UCIL7 | 0.92 | −0.85 |
| UCIL8 | 0.82 | −0.06 |
| Measurement Point | Pearson’s Product-Moment Correlation Coefficient for Air Temperature | Pearson’s Product-Moment Correlation Coefficient for Relative Humidity |
|---|---|---|
| UCIL2 | 0.98 | 0.73 |
| UCIL3 | 0.94 | 0.47 |
| UCIL4 | 0.94 | −0.84 |
| UCIL5 | 0.95 | 0.53 |
| UCIL6 | 0.87 | 0.15 |
| UCIL7 | 0.93 | −0.85 |
| UCIL8 | 0.84 | −0.05 |
| Measurement Point | Pearson’s Product-Moment Correlation Coefficient for Air Temperature | Pearson’s Product-Moment Correlation Coefficient for Relative Humidity |
|---|---|---|
| UCIL2 | 0.82 | 0.35 |
| UCIL3 | 0.84 | −0.38 |
| UCIL4 | 0.91 | −0.89 |
| UCIL5 | 0.84 | −0.37 |
| UCIL6 | 0.78 | −0.55 |
| UCIL7 | 0.91 | −0.89 |
| UCIL8 | 0.73 | −0.52 |
| Measurement Point | Pearson’s Product-Moment Correlation Coefficient for Air Temperature | Pearson’s Product-Moment Correlation Coefficient for Relative Humidity |
|---|---|---|
| UCIL2 | 0.97 | 0.14 |
| UCIL3 | 0.90 | −0.37 |
| UCIL4 | 0.93 | −0.89 |
| UCIL5 | 0.91 | −0.36 |
| UCIL6 | 0.81 | −0.53 |
| UCIL7 | 0.93 | −0.89 |
| UCIL8 | 0.76 | −0.50 |
| Pearson’s Product-Moment Correlation between Inversion Height z and Fetch x | |
|---|---|
| Case 1 | 0.85 |
| Case 2 | 0.80 |
| Case 3 | −0.38 |
| Case 4 | −0.59 |
Appendix D
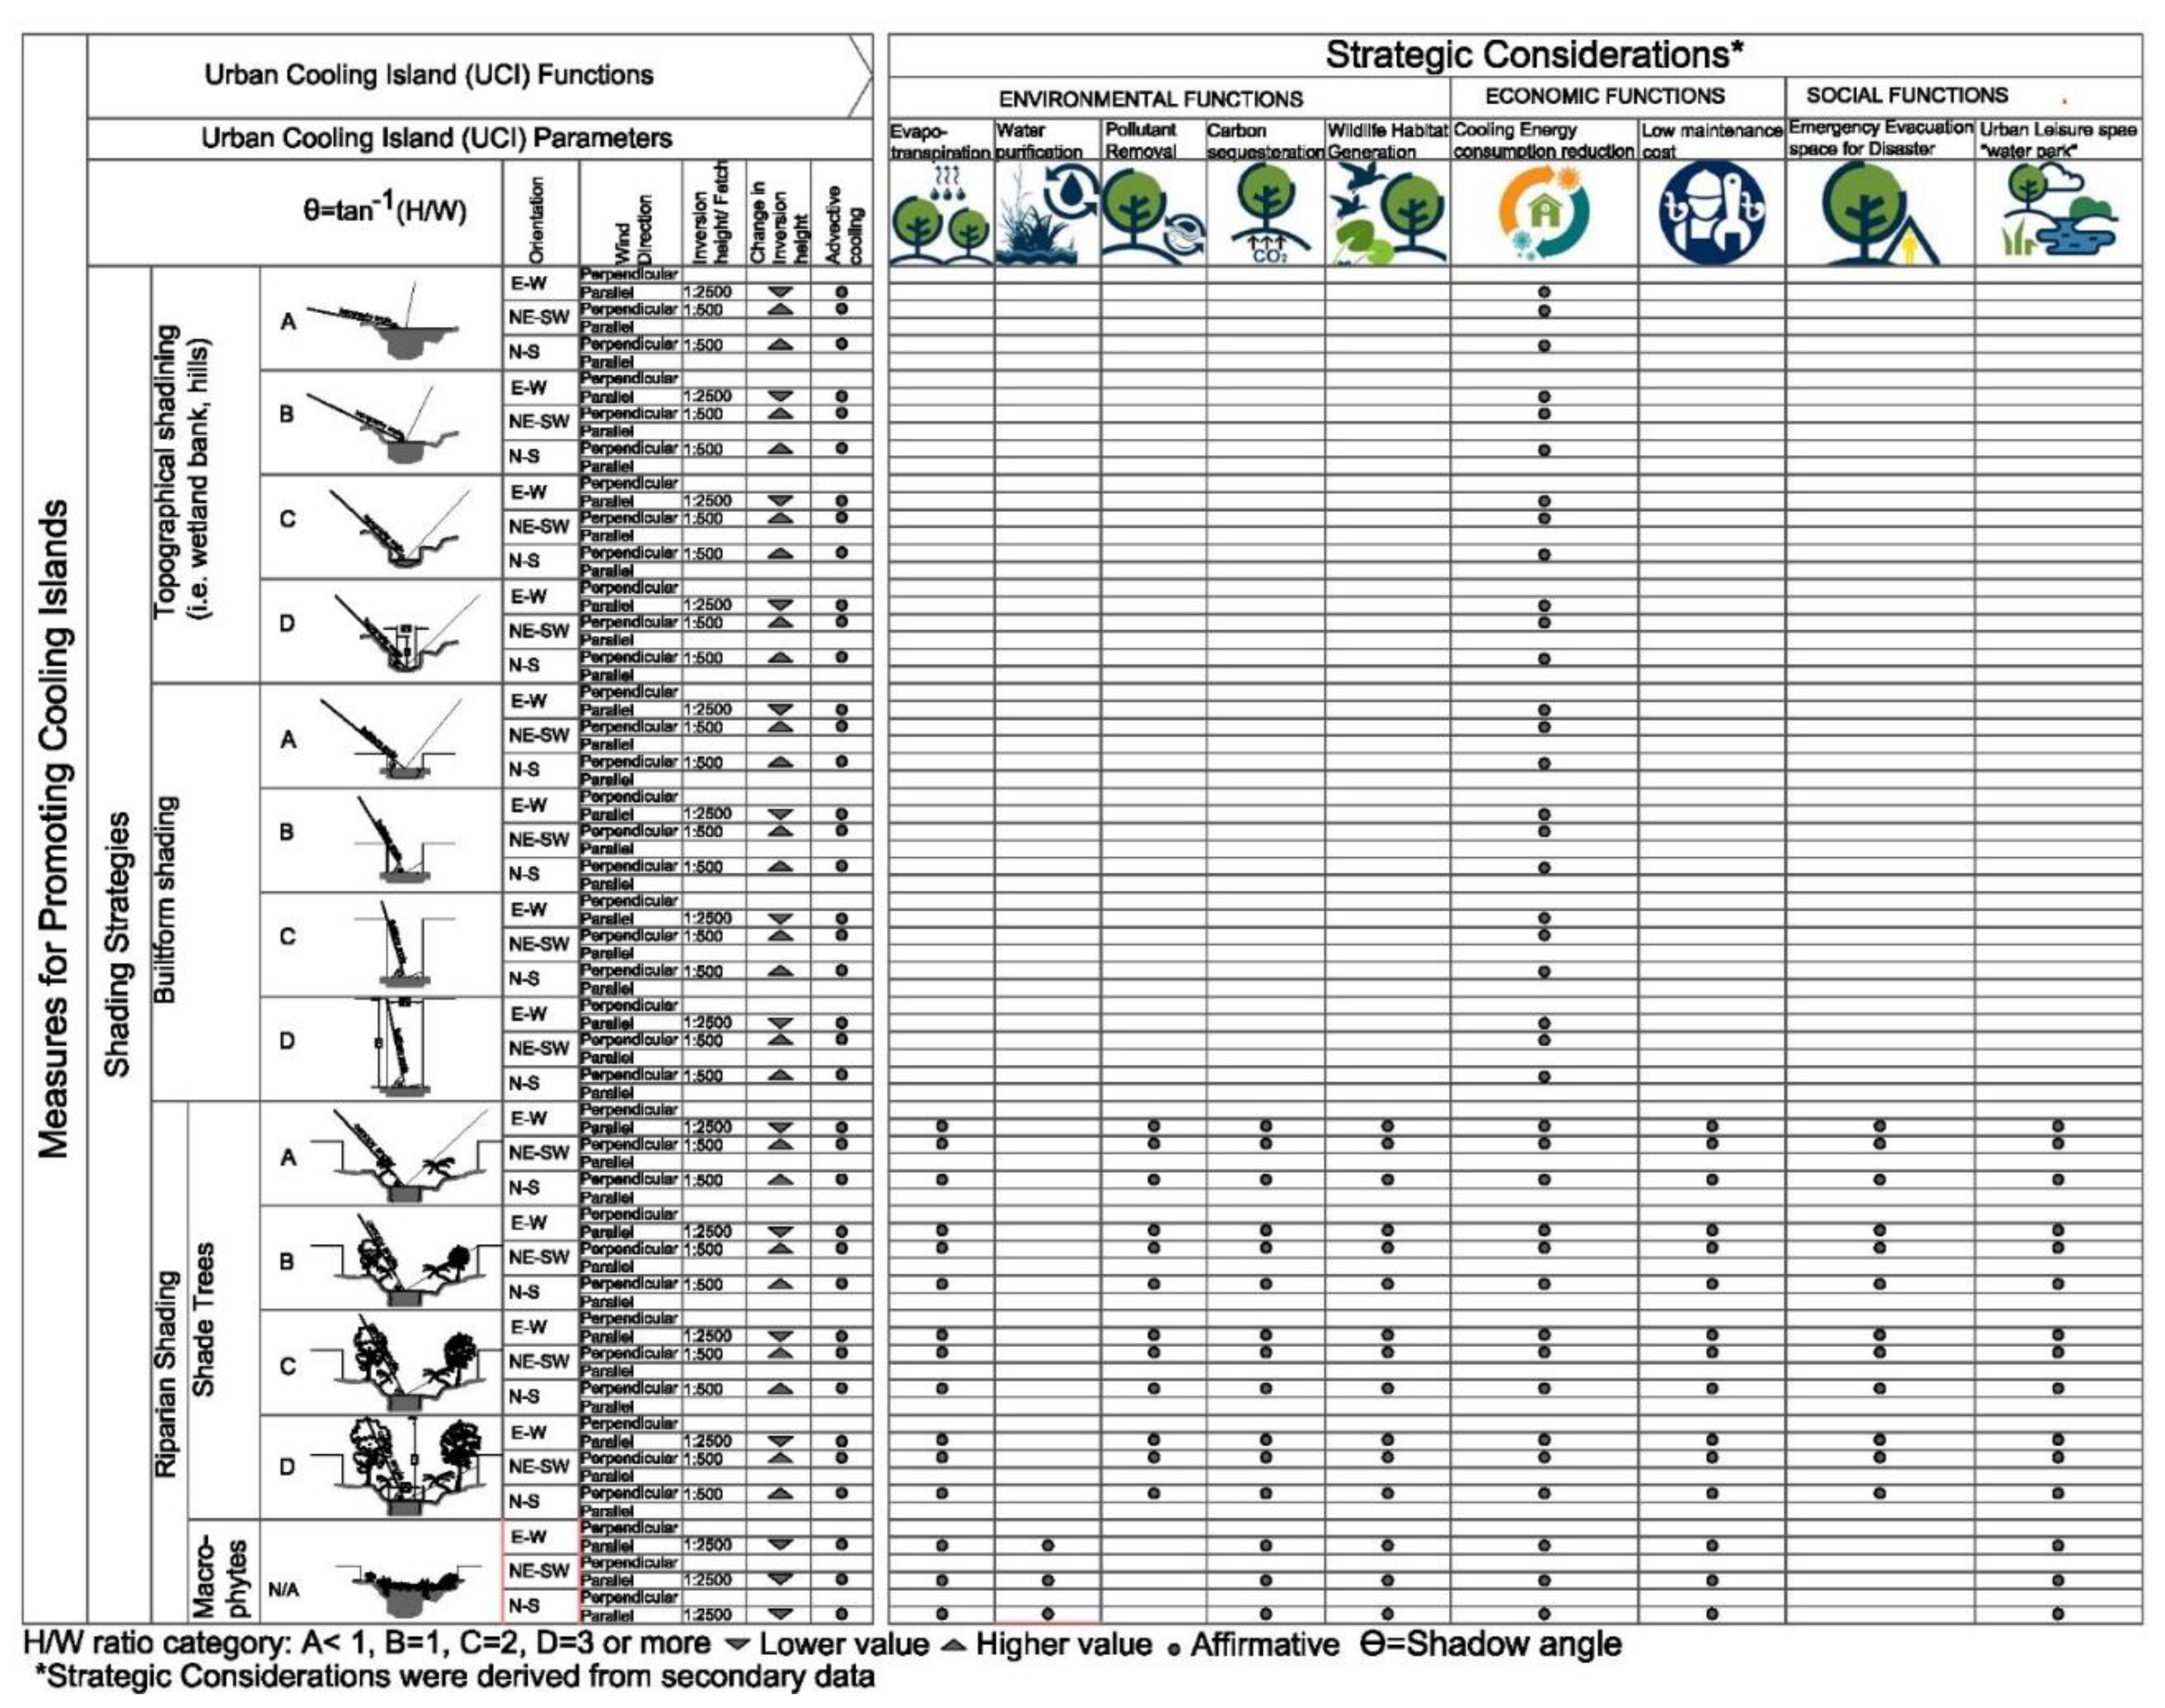
Urban Design Matrix
References
- IPCC. Climate Change 2014: Synthesis Report. Contribution of Working Groups I, II, and III to the Fifth Assessment Report of the Intergovernmental Panel on Climate Change; Core Writing Team, Pachauri, R.K., Meyer, L.A., Eds.; IPCC: Geneva, Switzerland, 2014; 151p. [Google Scholar]
- Ahmed, R. In search of the impact of urbanization on the thermal environment of the city of Dhaka, Bangladesh, during the pre-monsoon hot season from 1948 through 1987. In Proceedings of the Report of the Technical Conference on Tropical Urban Climates, Dhaka, Bangladesh, 28 March–2 April 1993; World Meteorological Organization (WMO): Geneva, Switzerland, 1993. [Google Scholar]
- Bangladesh Bureau of Statistics; Statistics and Informatics Division; Ministry of Planning. Population and Housing Census 2011, Statistics and Informatics Division, Ministry of Planning; Community Report; Bangladesh Bureau of Statistics: Dhaka Zila, Bangladesh, 2012. Available online: http://bbs.dhaka.gov.bd/sites/default/files/files/bbs.dhaka.gov.bd/law_policy/6ed6b42c_2015_11e7_8f57_286ed488c766/Socio-Economic%20and%20demographic%20Report%202012.pdf (accessed on 29 March 2016).
- Ahmed, B.; Kamruzzaman, M.; Zhu, X.; Rahman, S.M.; Choi, K. Simulating Land Cover Changes and Their Impacts on Land Surface Temperature in Dhaka, Bangladesh. Remote Sens. 2013, 5, 5969–5998. [Google Scholar] [CrossRef]
- Sun, R.; Chen, L. How can urban water bodies be designed for climate adaptation? Landsc. Urban. Plan. 2012, 105, 27–33. [Google Scholar] [CrossRef]
- Steeneveld, G.J.; Koopmans, S.; Heusinkveld, B.G.; Theeuwes, N.E. Refreshing the role of open water surfaces on mitigating the maximum urban heat island effect. Landsc. Urban. Plan. 2014, 121, 92–96. [Google Scholar] [CrossRef]
- Taleghani, M.; Tenpierik, M.; Dobbelsteen, A.V.D.; Sailor, D.J. Heat in courtyards: A validated and calibrated parametric study of heat mitigation strategies for urban courtyards in the Netherlands. Sol. Energy 2014, 103, 108–124. [Google Scholar] [CrossRef]
- Saaroni, H.; Ziv, B. The impact of a small lake on heat stress in a Mediterranean urban park: The case of Tel Aviv, Israel. Int. J. Biometeorol. 2003, 47, 156–165. [Google Scholar] [CrossRef]
- Cheng, L.; Guan, D.; Zhou, L.; Zhao, Z.; Zhou, J. Urban cooling island effect of main river on a landscape scale in Chongqing, China. Sustain. Cities Soc. 2019, 47, 101501. [Google Scholar] [CrossRef]
- Frey, C.M.; Rigo, G.; Parlow, E. Investigation of the Daily Urban. Cooling Island (UCI) in Two Coastal Cities in an Arid Environment: Dubai and Abu Dhabi (UAE); Institute of Meteorology, Climatology and Remote Sensing, Department of Geosciences, University of Basel: Basel, Switzerland, 2009. [Google Scholar]
- Gupta, N.; Mathew, A.; Khandelwal, S. Analysis of cooling effect of water bodies on land surface temperature in nearby region: A case study of Ahmedabad and Chandigarh cities in India. Egypt. J. Remote Sens. Space Sci. 2019, 22, 81–93. [Google Scholar] [CrossRef]
- Han, G.; Chen, H.; Yuan, L.; Cai, Y.; Han, M. Field measurements on micro-climate and cooling effect of river wind on urban blocks in Wuhan city. In Proceedings of the International Conference on Multimedia Technology (ICMT), Hangzhou, China, 26–28 July 2011. [Google Scholar] [CrossRef]
- Kim, Y.H.; Ryoo, S.B.; Baik, J.J.; Park, I.S.; Koo, H.J.; Nam, J.C. Does the restoration of an inner-city stream in Seoul affect local thermal environment? Theor. Appl. Climatol. 2008, 92, 239–248. [Google Scholar] [CrossRef]
- Manteghi, G.; Lamit, H.B.; Ossen, D.R. Influence of Street Orientation and Distance to Water Body on Microclimate Temperature Distribution in Tropical Coastal City of Malacca. Int. J. Appl. Environ. Sci. 2015, 10, 749–766. [Google Scholar]
- Mitchell, V.G.; Cleugh, H.A.; Grimmond, C.S.B.; Xu, J. Linking urban water balance and energy balance models to analyze urban design options. Hydrol. Process. 2008, 22, 2891–2900. [Google Scholar] [CrossRef]
- Nishimura, N.; Nomura, T.; Iyota, H.; Kimoto, S. Novel water facilities for creation of comfortable urban micrometeorology. Sol. Energy 1998, 64, 197–207. [Google Scholar] [CrossRef]
- Park, C.Y.; Lee, D.K.; Asawa, T.; Murakami, A.; Kim, H.G.; Lee, M.K.; Lee, H.S. Influence of urban form on the cooling effect of a small urban river. Landsc. Urban. Plan. 2019, 183, 26–35. [Google Scholar] [CrossRef]
- Robitu, M.; Musy, M.; Inard, C.; Groleau, D. Modeling the influence of vegetation and water pond on urban microclimate. Sol. Energy 2006, 80, 435–447. [Google Scholar] [CrossRef]
- Rutherford, J.C.; Blackett, S.; Blackett, C.; Saito, L.; Colley, R.J.D. Predicting the effects of shade on water temperature in small streams. N. Z. J. Mar. Freshw. Res. 1997, 31, 707–721. [Google Scholar] [CrossRef]
- Rutherford, J.C.; Marsh, N.A.; Davies, P.M.; Bunn, S.E. Effect of patchy shade on stream water temperature: How quickly do small streams heat and cool. Mar. Freshw. Res. 2004, 55, 737–748. [Google Scholar] [CrossRef]
- Sun, R.; Chen, A.; Chen, L.; Lü, Y. Cooling effects of wetlands in an urban region: The case of Beijing. Ecol. Indic. 2012, 20, 57–64. [Google Scholar] [CrossRef]
- Theeuwes, N.E.; Solcerová, A.; Steeneveld, G.J. Modeling the influence of open water surfaces on the summertime temperature and thermal comfort in the city. J. Geophys. Res. Atmos. 2013, 118, 8881–8896. [Google Scholar] [CrossRef]
- Tominaga, Y.; Sato, Y.; Sadohara, S. CFD simulations of the effect of evaporative cooling from water bodies in a micro-scale urban environment: Validation and application studies. Sustain. Cities Soc. 2015, 19, 259–270. [Google Scholar] [CrossRef]
- Xiyan, X.; Shuming, L.; Shibo, S.; Wenwei, Z.; Ying, L.; Zhaoming, L.; Guancheng, G.; Smith, K.; Yong, C.; Wei, L.; et al. Evaluation of energy saving potential of an urban green space and its water bodies. Energy Build. 2019, 188–189, 58–70. [Google Scholar]
- Fraedrich, K. On the evaporation of a lake in warm and dry environment. Tellus 1972, 24, 116–121. [Google Scholar] [CrossRef][Green Version]
- Bowler, D.E.; Mant, R.; Orr, H.; Hannah, D.M.; Pullin, A.S. What are the effects of wooded riparian zones on stream temperature? Environ. Evid. 2012, 1, 3. [Google Scholar] [CrossRef]
- Johnson, M.F.; Wilby, R.L. Seeing the landscape for the trees: Metrics to guide riparian shade management in river catchments. Water Resour. Res. 2015, 51, 3754–3769. [Google Scholar] [CrossRef]
- Larson, L.L.; Larson, S.L. Riparian Shade and Stream Temperature: A Perspective. Rangelands 1996, 18, 149–152. [Google Scholar]
- Somers, K.A.; Bernhardt, E.S.; Grace, J.B.; Hassett, B.A.; Sudduth, E.B.; Wang, S.; Urban, D.L. Streams in the urban heat island: Spatial and temporal variability in temperature. Freshw. Sci. 2013, 32, 309–326. [Google Scholar] [CrossRef]
- Sweeney, B.W.; Newbold, J.D. Streamside forest buffer width needed to protect stream water quality, habitat, and organisms: A literature review. J. Am. Water Resour. Assoc. 2014, 50, 560–584. [Google Scholar] [CrossRef]
- Rosenb, N.J.; Blad, B.L.; Verma, S.B. Microclimate—The Biological Environment; John Wiley and Sons: New York, NY, USA, 1983. [Google Scholar]
- Dyer, A.J.; Crawford, T.V. Observations of the microclimate at a leading-edge. Q. J. R. Meteorol. Soc. 1965, 91, 345–348. [Google Scholar] [CrossRef]
- Goltz, S.M.; Pruitt, W.O. Spatial and Temporal Variations of Evapotranspiration Downwind from the Leading Edge of a Dry Fallow Field; Div. Technical Report ECOM68-G10-1; Department of Water Science and Engineering, University of California at Davis: Davis, CA, USA, 1970. [Google Scholar]
- Lang, A.R.G.; Evans, G.N.; Ho, P.Y. The influence of local advection on evapotranspiration from irrigated rice in a semi-arid region. Agric. Meteorol. 1974, 13, 5–13. [Google Scholar] [CrossRef]
- Rider, N.E.; Philip, J.R.; Bradley, E.F. The horizontal transport of heat and moisture-a micrometeorological study. Q. J. R. Meteorol. Soc. 1963, 89, 507–531. [Google Scholar] [CrossRef]
- Rijks, D.A. Water use by irrigated cotton in Sudan: III. Bowen ratios and advective energy. J. Appl. Ecol. 1971, 8, 643–663. [Google Scholar] [CrossRef]
- Oke, T.R. Advectively-assisted evapotranspiration from irrigated urban vegetation. Bound. Layer Meteorol. 1979, 17, 167–173. [Google Scholar] [CrossRef]
- Ahmed, K.S. Approaches to Bioclimatic Urban Design for the tropics with special reference to Dhaka, Bangladesh. Ph.D. Thesis, Environment and Energy Studies Programme, Architectural Association School of Architecture, London, UK, 1995. [Google Scholar]
- Shahjahan, A.T.M.; Ahmed, K.S. Study of urban water bodies in view of potential for micro-climatic cooling and natural purification of waste water. In Balanced Urban Development: Options and Strategies for Liveable Cities; Basant, M., Vijay, P.S., Bhadranie, T., Eds.; Springer International Publishing: Cham, Germany, 2016. [Google Scholar]
- Brammer, H. The Physical Geography of Bangladesh, 1st ed.; The University Press Limited: Dhaka, Bangladesh, 2012. [Google Scholar]
- FAO/UNDP. Land Resources Appraisal of Bangladesh for Agricultural Development Report 2: Agro-Ecological Regions of Bangladesh; FAO: Rome, Italy, 1988; Rep. No. 2. [Google Scholar]
- Akbar, M.A. An Assessment of the Geothermal Potential of Bangladesh; United Nations University: Reykjavik, Iceland, 2011; pp. 1–33, Rep. No. 5. [Google Scholar]
- Oke, T.R. Initial Guidance to Obtain Representative Meteorological Observations at Urban Site. In World Meteorological Organization, Instruments, and Observing Methods; WMO: Geneva, Switzerland, 2006; IOM Report No. 81, WMO/TD-No. 1250. [Google Scholar]
- Huang, L.; Li, J.; Zhao, D.; Zhu, J. A fieldwork study on the diurnal changes of urban microclimate in four types of ground cover and urban heat island of Nanjing, China. Build. Environ. 2008, 43, 7–17. [Google Scholar] [CrossRef]
- Wilcox, D.C. Turbulence Modeling for CFD; DCW industries Inc.: La Canada, CA, USA, 1998. [Google Scholar]
- COMSOL Documentation. Available online: https://www.comsol.com/documentation (accessed on 1 February 2018).
- Incropera, F.P.; DeWitt, D.P.; Bergman, T.L.; Lavine, A.S. Fundamentals of Heat and Mass Transfer, 6th ed.; John Wiley & Sons: Hoboken, NJ, USA, 2006. [Google Scholar]
- Monteith, J.L.; Unsworth, M.H. Principles of Environmental Physics, 4th ed.; Academic Press: Cambridge, MA, USA, 2013. [Google Scholar]
- Blocken, B. Computational Fluid Dynamics for urban physics: Importance, scales, possibilities, limitations and ten tips and tricks towards accurate and reliable simulations. Build. Environ. 2015, 91, 219–245. [Google Scholar] [CrossRef]



Publisher’s Note: MDPI stays neutral with regard to jurisdictional claims in published maps and institutional affiliations. |
© 2020 by the authors. Licensee MDPI, Basel, Switzerland. This article is an open access article distributed under the terms and conditions of the Creative Commons Attribution (CC BY) license (http://creativecommons.org/licenses/by/4.0/).
Share and Cite
Shahjahan, A.T.M.; Ahmed, K.S.; Said, I.B. Study on Riparian Shading Envelope for Wetlands to Create Desirable Urban Bioclimates. Atmosphere 2020, 11, 1348. https://doi.org/10.3390/atmos11121348
Shahjahan ATM, Ahmed KS, Said IB. Study on Riparian Shading Envelope for Wetlands to Create Desirable Urban Bioclimates. Atmosphere. 2020; 11(12):1348. https://doi.org/10.3390/atmos11121348
Chicago/Turabian StyleShahjahan, Abu Taib Mohammed, Khandaker Shabbir Ahmed, and Ismail Bin Said. 2020. "Study on Riparian Shading Envelope for Wetlands to Create Desirable Urban Bioclimates" Atmosphere 11, no. 12: 1348. https://doi.org/10.3390/atmos11121348
APA StyleShahjahan, A. T. M., Ahmed, K. S., & Said, I. B. (2020). Study on Riparian Shading Envelope for Wetlands to Create Desirable Urban Bioclimates. Atmosphere, 11(12), 1348. https://doi.org/10.3390/atmos11121348


