Indoor Air Pollution from Residential Stoves: Examining the Flooding of Particulate Matter into Homes during Real-World Use


Abstract
1. Introduction
- It presents a framework in order to determine real-world indoor PM exposure from the use of residential heating stoves.
- It can detect and identify the existence of peak indoor , , and PNC levels as a result of stove use.
- It analyses the results in relation to the DEFRA regulations and determines the extent of these emissions from a specific category of stoves; those that are certified as a ‘Smoke Exempt Appliance’ by DEFRA.

| Study | Year-Study Site | No. of Sampled Stoves | Lab-Conditions or Real-World? | Heating Unit Type and Fuel Acceptance | No. of Uses Analysis Based on |
|---|---|---|---|---|---|
| Traynor et al. [15] | 1987-USA | 4 | Lab/Real-world hybrid | Wood stoves (3 ‘airtight’, 1 ‘non-airtight Franklin model’) | 11 |
| Allen et al. [21] | 2009-Canada | 15 | Real-world (stove upgrade halfway through) | Wood stove (non-EPA-certified and EPA-certified) | Not provided (2 three-day samples taken over 6 days) |
| Noonan et al. [22] | 2012-USA | 21 | Real-world (stove upgrade halfway through) | Wood stove (non-EPA-certified and EPA-certified) | Approx. 60 (1-4 samples taken from each home across 3 winters) |
| McNamara et al. [31] | 2013-USA | 50 | Real-world | Wood stove (Non-EPA certified ‘older model’) | Not provided (4 separate 48h sampling visits over 2 winters) |
| Canha et al. [16] | 2014 -Portugal | 1 | Real-world | Wood stove (‘slow combustion stove’) | 1 |
| Salthammer et al. [35] | 2014-Germany | 7 | Real-world Wood stove (‘closed’) | 6 Wood stove (‘open’)1 | 3 days for each stove |
| Piccardo et al. [18] | 2014-Italy | 9 | Real-world | Wood stoves | 183 |
| Semmens et al. [17] | 2015-USA | 96 | Real-world | Wood stoves (‘older models’ without ‘modern control features focused on emission reduction’) | 192 (each stove used twice) |
| Vicente et al. [30] | 2015-Portugal | 1 | Lab-conditions | Wood stove (‘stainless steel with a cast iron grate’) | Not provided |
| Mitchell et al. [29] | 2016-UK and Ireland | 1 | Lab-conditions | Multi-fuel stove (‘fixed grate stove with a single combustion chamber’) | 8 |
| Wang et al. [19] | 2020-China | 5 | Lab-conditions(1) Real-world(4) | Coal stoves (Real world—‘steel stoves, cylindrical burning chamber, connected to a chimney’) | Not provided |
| Vicente et al. [20] | 2020-Portugal | 2 | Lab-conditions | Open fireplace and wood stove | 7 (4 open fire, 3 wood stove) |
| Chakraborty et al. | 2020-UK | 20 | Real-world | DEFRA-certified wood (14)- DEFRA-certified multi-fuel (5)- Defra-compliant open fire (1) | 260 |
2. Materials and Methods
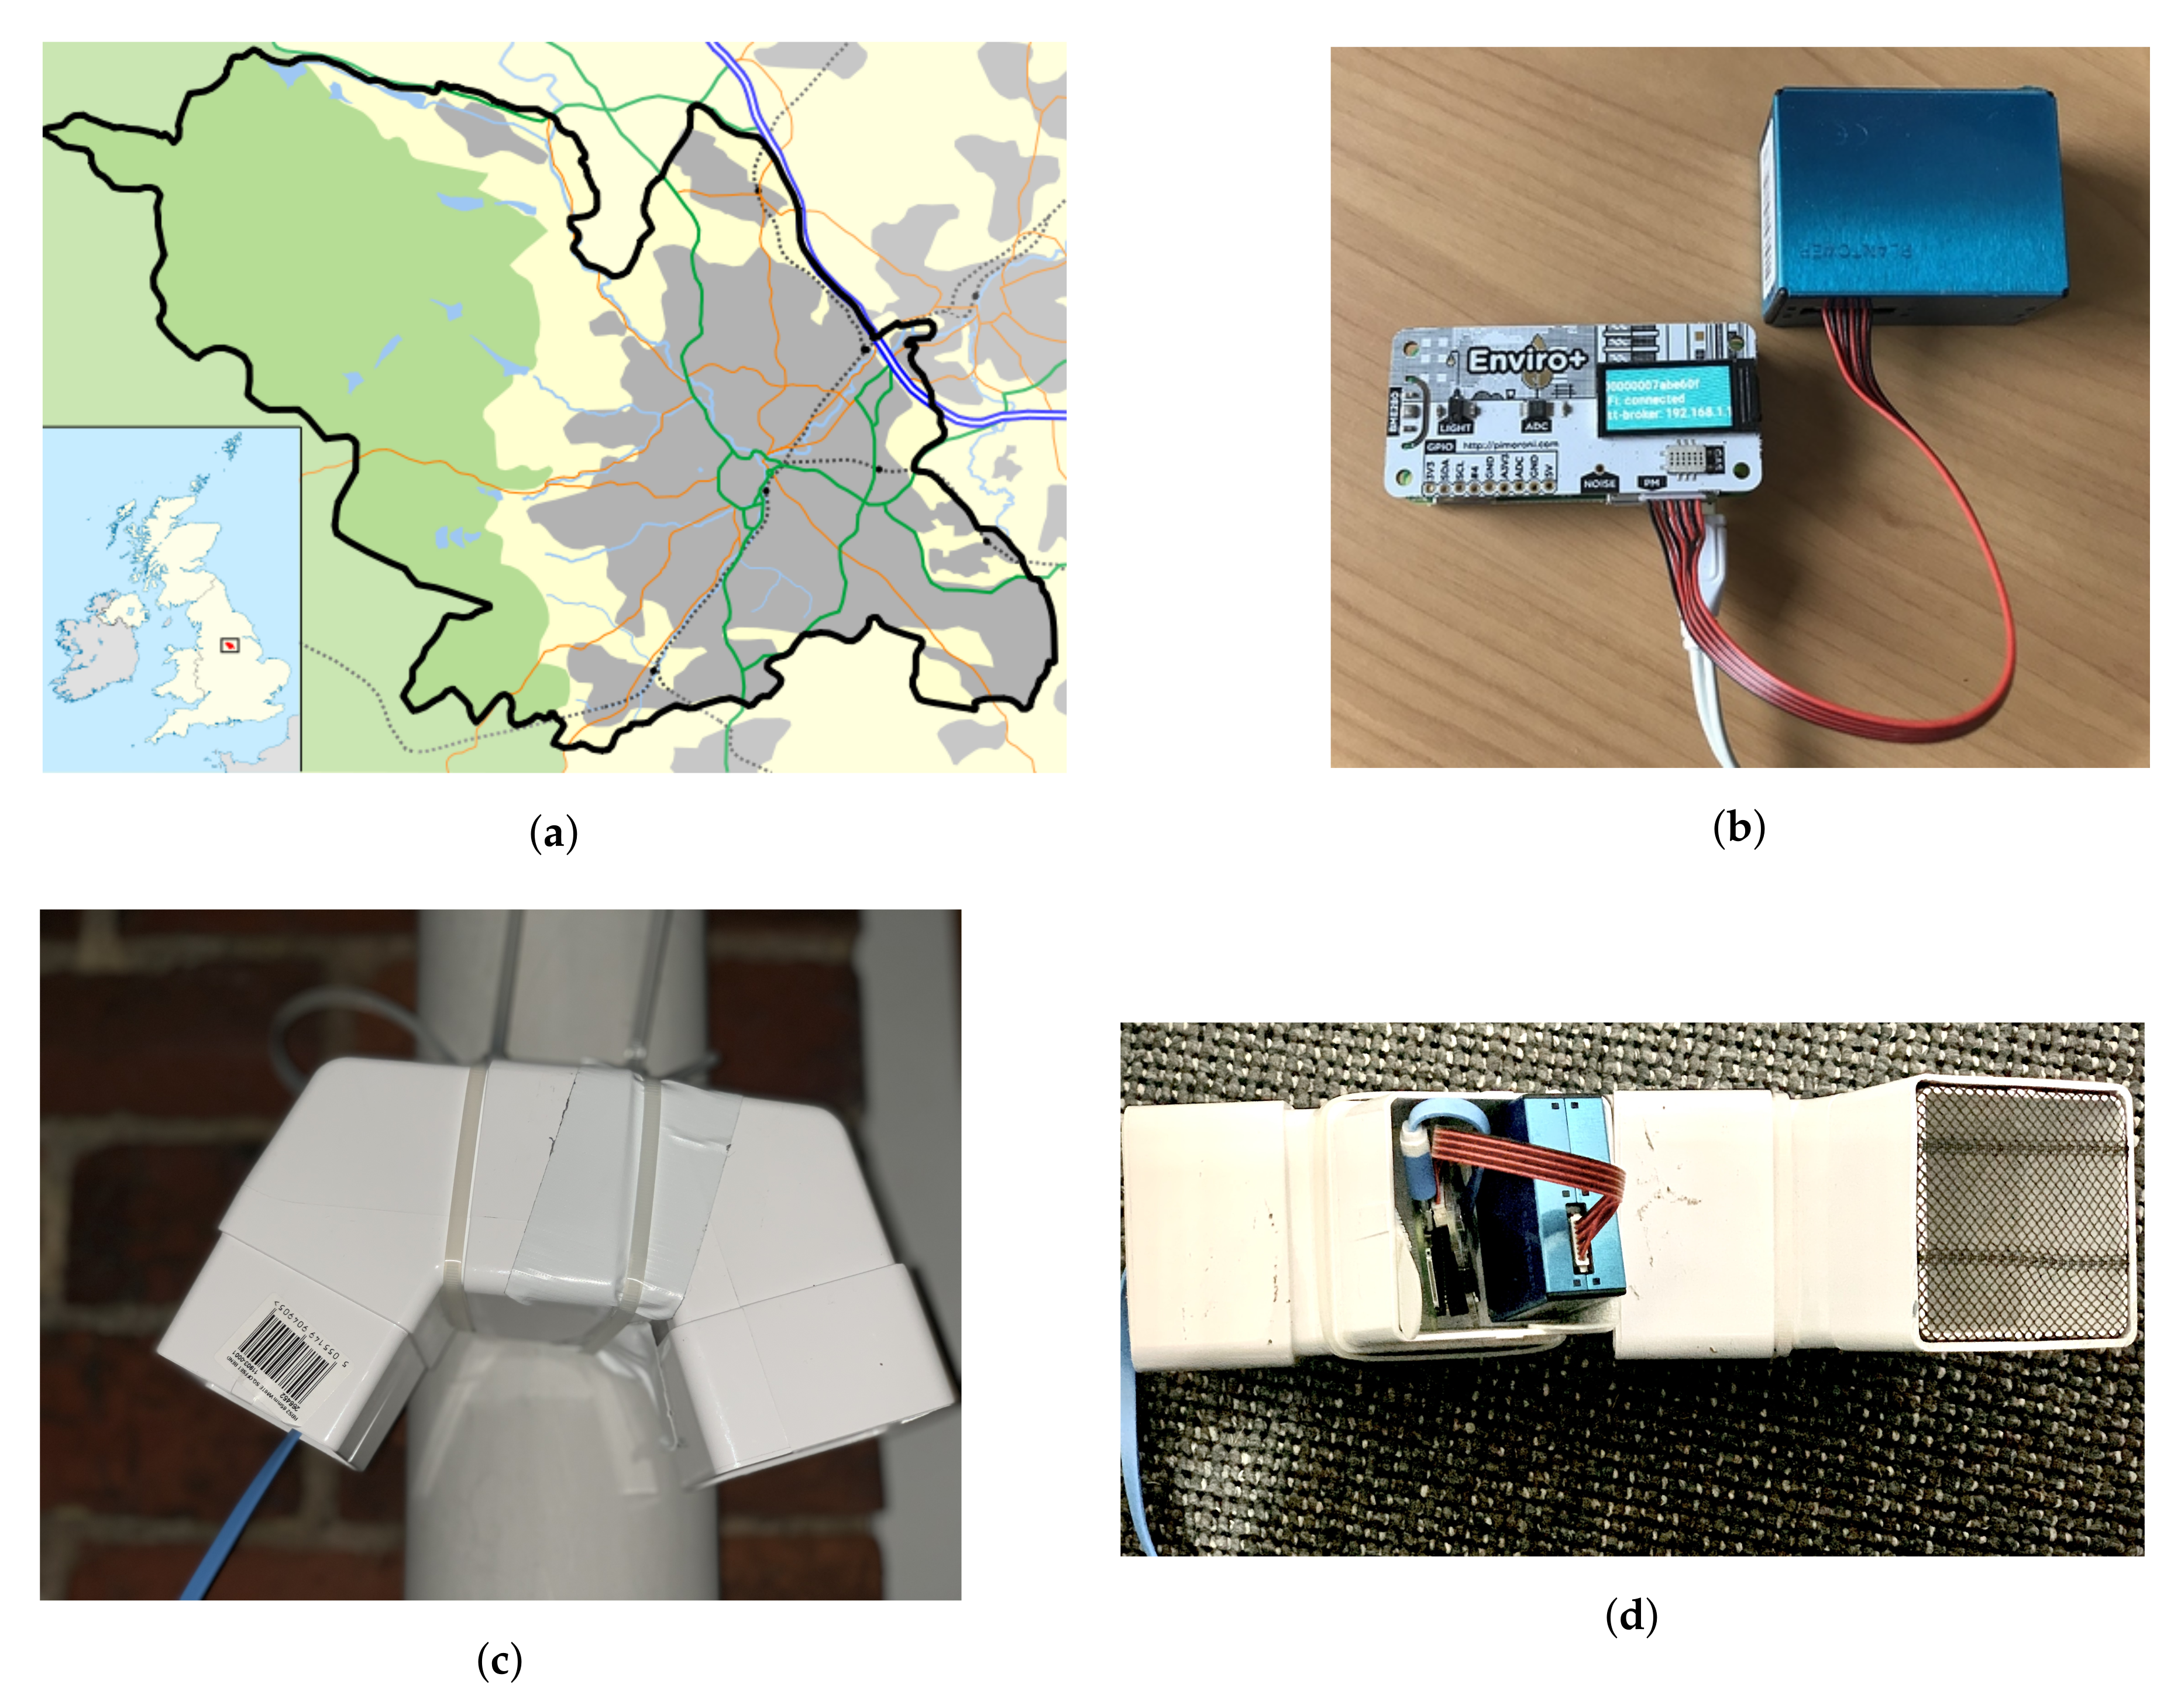
2.1. Sampling Area and Study Design
2.2. Sensor Validation and Correction: Accuracy, Evaluation and Limitations
- Raw data, including , , Temperature (T), and Relative Humidity (RH), were received every 160 s. This was converted to hourly averages in order to match the reference station data, because only hourly reference data are publicly available.
- The hour average was excluded if less than 90% of the measurements were available in that hour average.
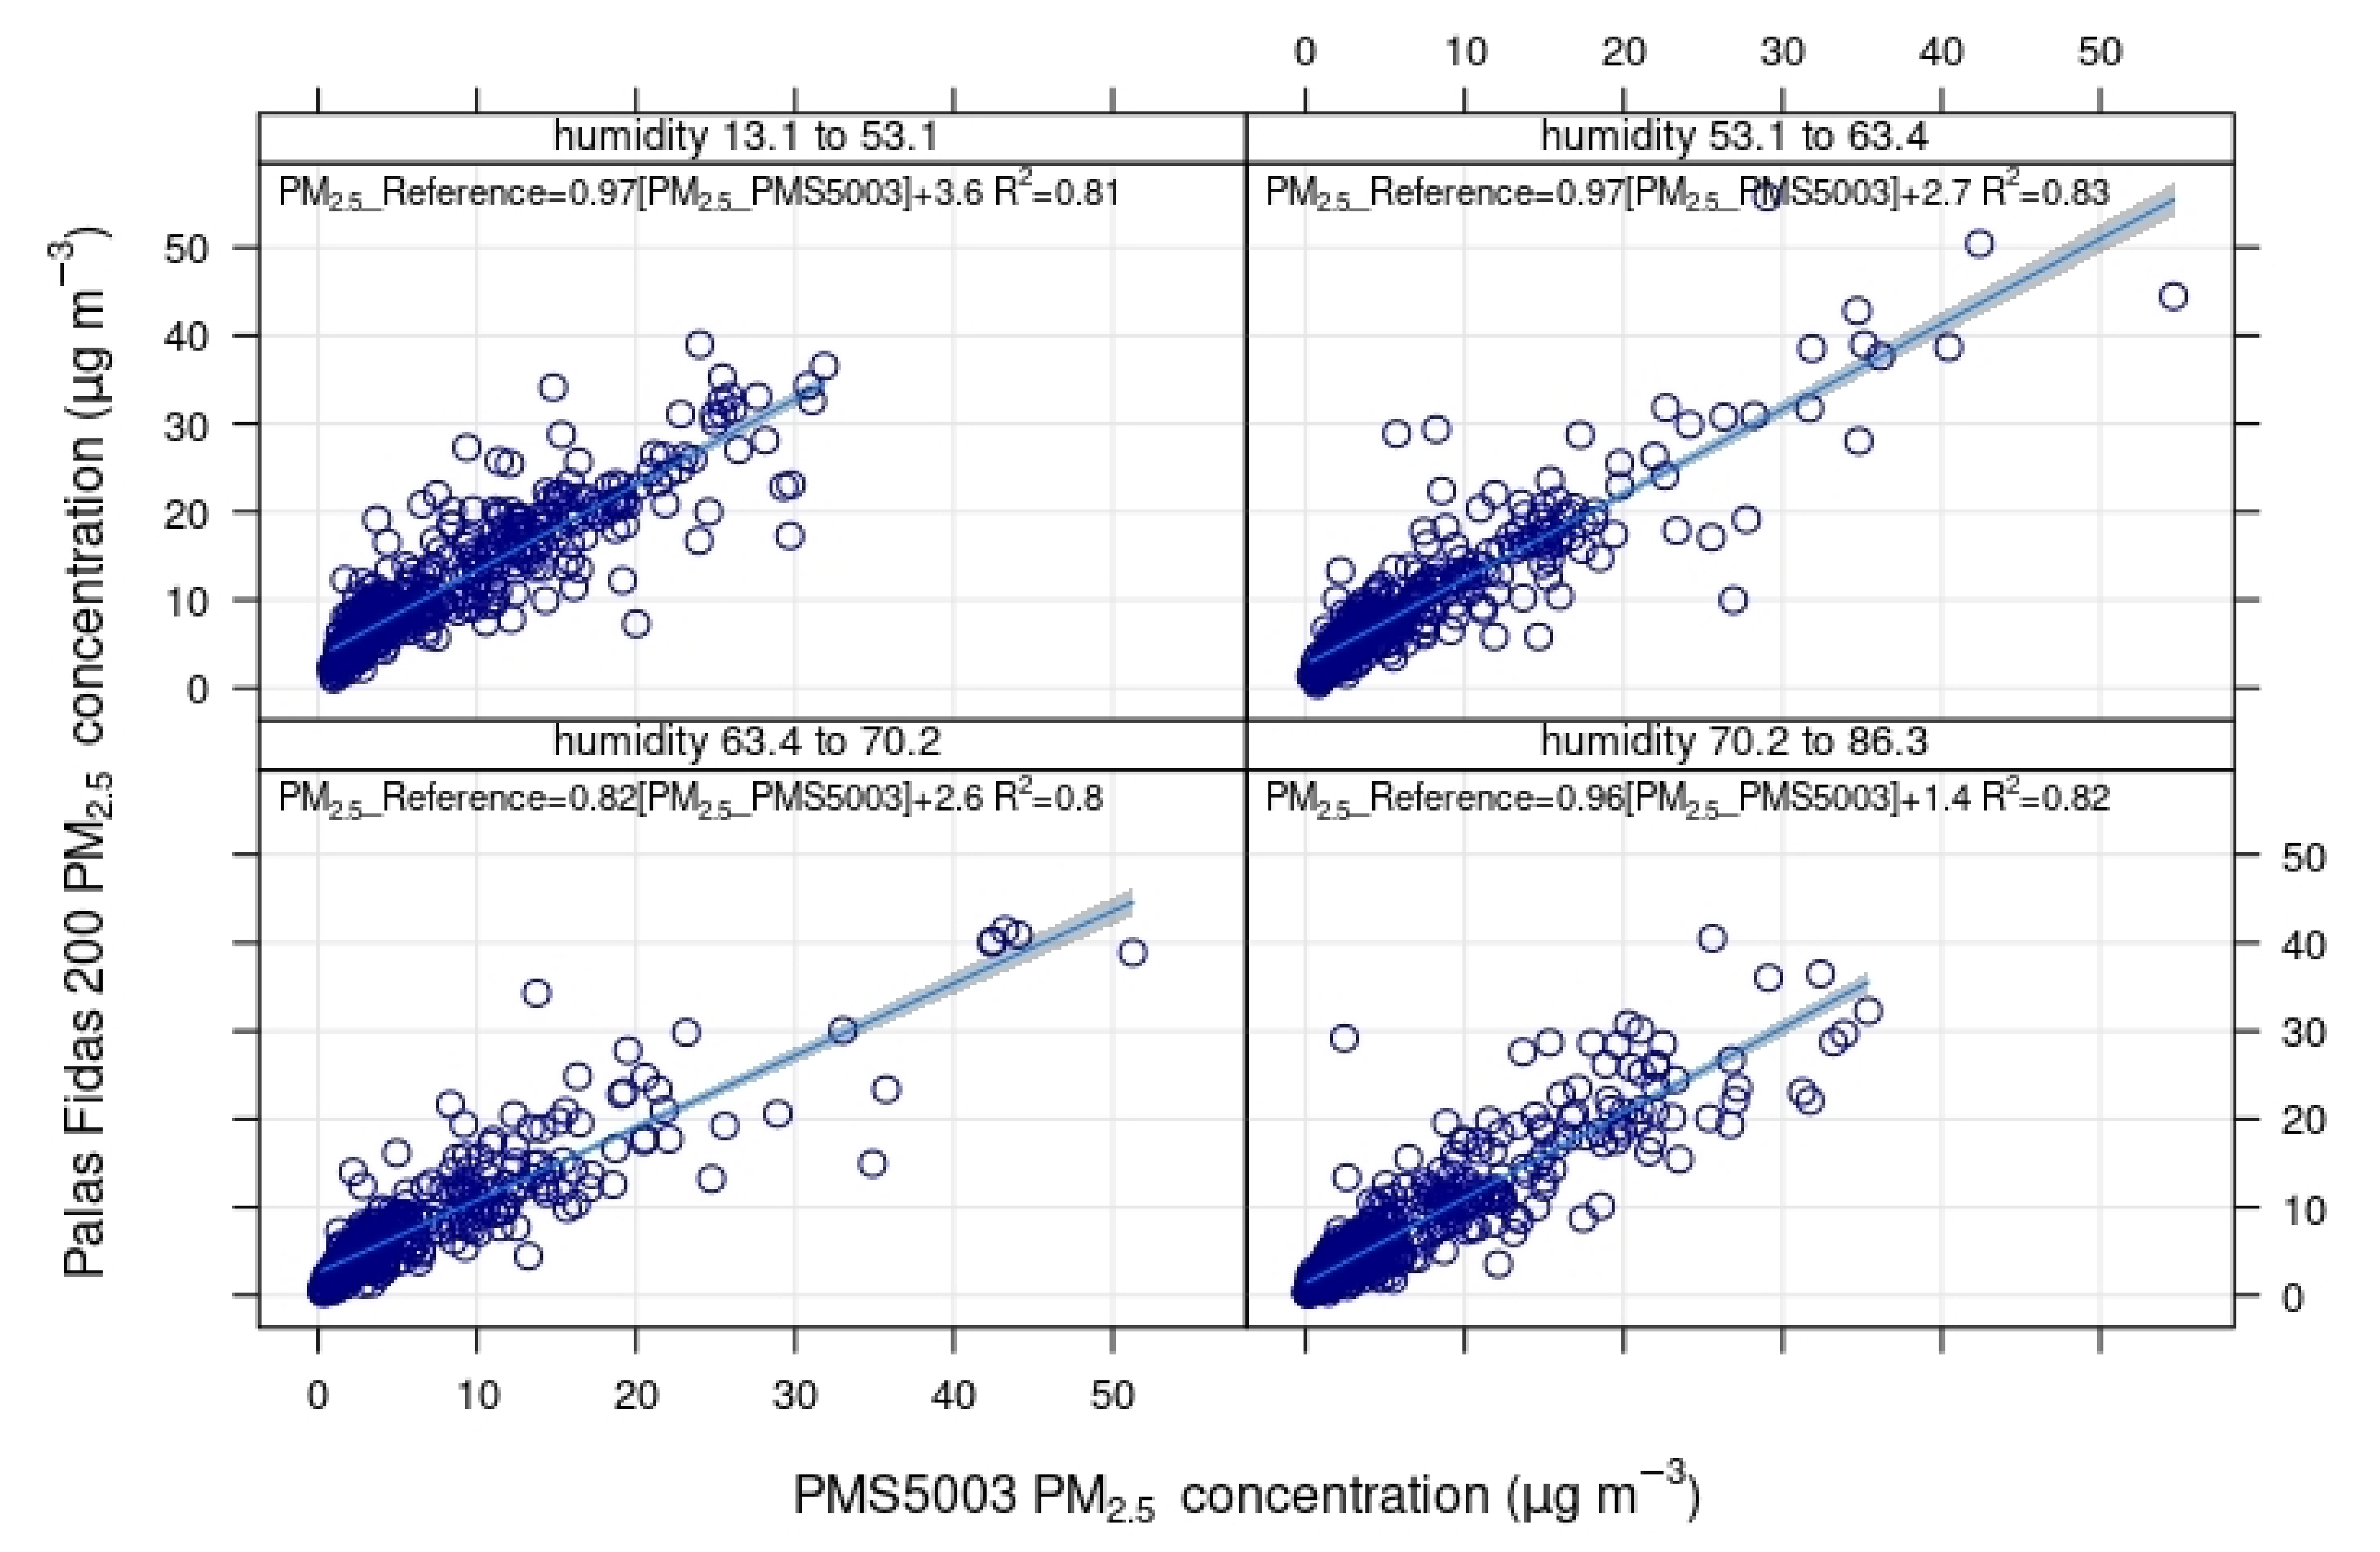
- Humidity Correction: concentrations can be relatively high from low-cost PM sensors at high RH levels. The hygroscopic growth of particles at high humidity, along with mist and fog particles, makes it detectable as particulates, as previously reported [39,40]. A Nephelometer, such as PMS5003, measures particulates based on light scattering principle. The particulates’ refractive indices are dependent on relative humidity [41] and, thus, affects the sensor readings. While ambient temperature directly has a very limited role in sensors performance [40] (apart from extreme temperature), it affects the measurements indirectly. Jayaratne et al. [39] reports that, when the ambient temperature reaches the dew point temperature, the conditions become suitable for the formation of fog droplets in the air and fall within the detection size of such sensors. Figure 3 presents an example of the relationship between RH values and PM2.5 data from PMS5003 collocated. A Humidity-based bias correction approach was taken, as described here [42], while using the -Köhler theory [43]. The hygroscopic growth factor g (RH), as defined in Equation (1), where is the diameter of the dry particle and is the diameter of the particle at a given RH value.RH dependence [44] was established while using Equation (2), as follows:where is a parameter that describes the degree of hygroscopicity of a particle and taken as 0.62, which is suitable for Sheffield [45]. Therefore, using Equations (1) and (2), hygroscopic growth factor g (RH) was calculated in order to obtain the humidity correction factor.Two additional PMS5003 have also been collocated at the same station permanently since 23rd April 2019 have been used to ensure correction factor accuracy. A conditional Quartile plot in Figure 4 below uses the corresponding values for both reference and low cost sensors, splitting the values into evenly spaced bins. For each low cost sensor value bin, the corresponding reference sensor values are identified and the median, 25/75t,h and 10/90 percentile (quantile) are calculated for that bin. The data are plotted in order to show how these values vary across all bins. The blue line shows the results for a perfect model i.e., zero error between low cost PMS5003 sensor and the reference Palas FIDAS 200 sensor. In the plot in Figure 4, the red line shows that the LCS tends to slightly over-report for (NMB ≈ 0.2–0.3).
- Concentration Range Correction: a correction was applied based on the relationship between pollutant concentration range and sensor performance. Multivariate Linear regression model were used in order to establish the relationship. Palas Fidas 200: is used as the dependent variable and PMS5003 sensor data: , T, and RH as predictors, as shown in Equation (3)., and are calculated by training with the model generated. To note, is not used here, as it is obtained from the previous step.
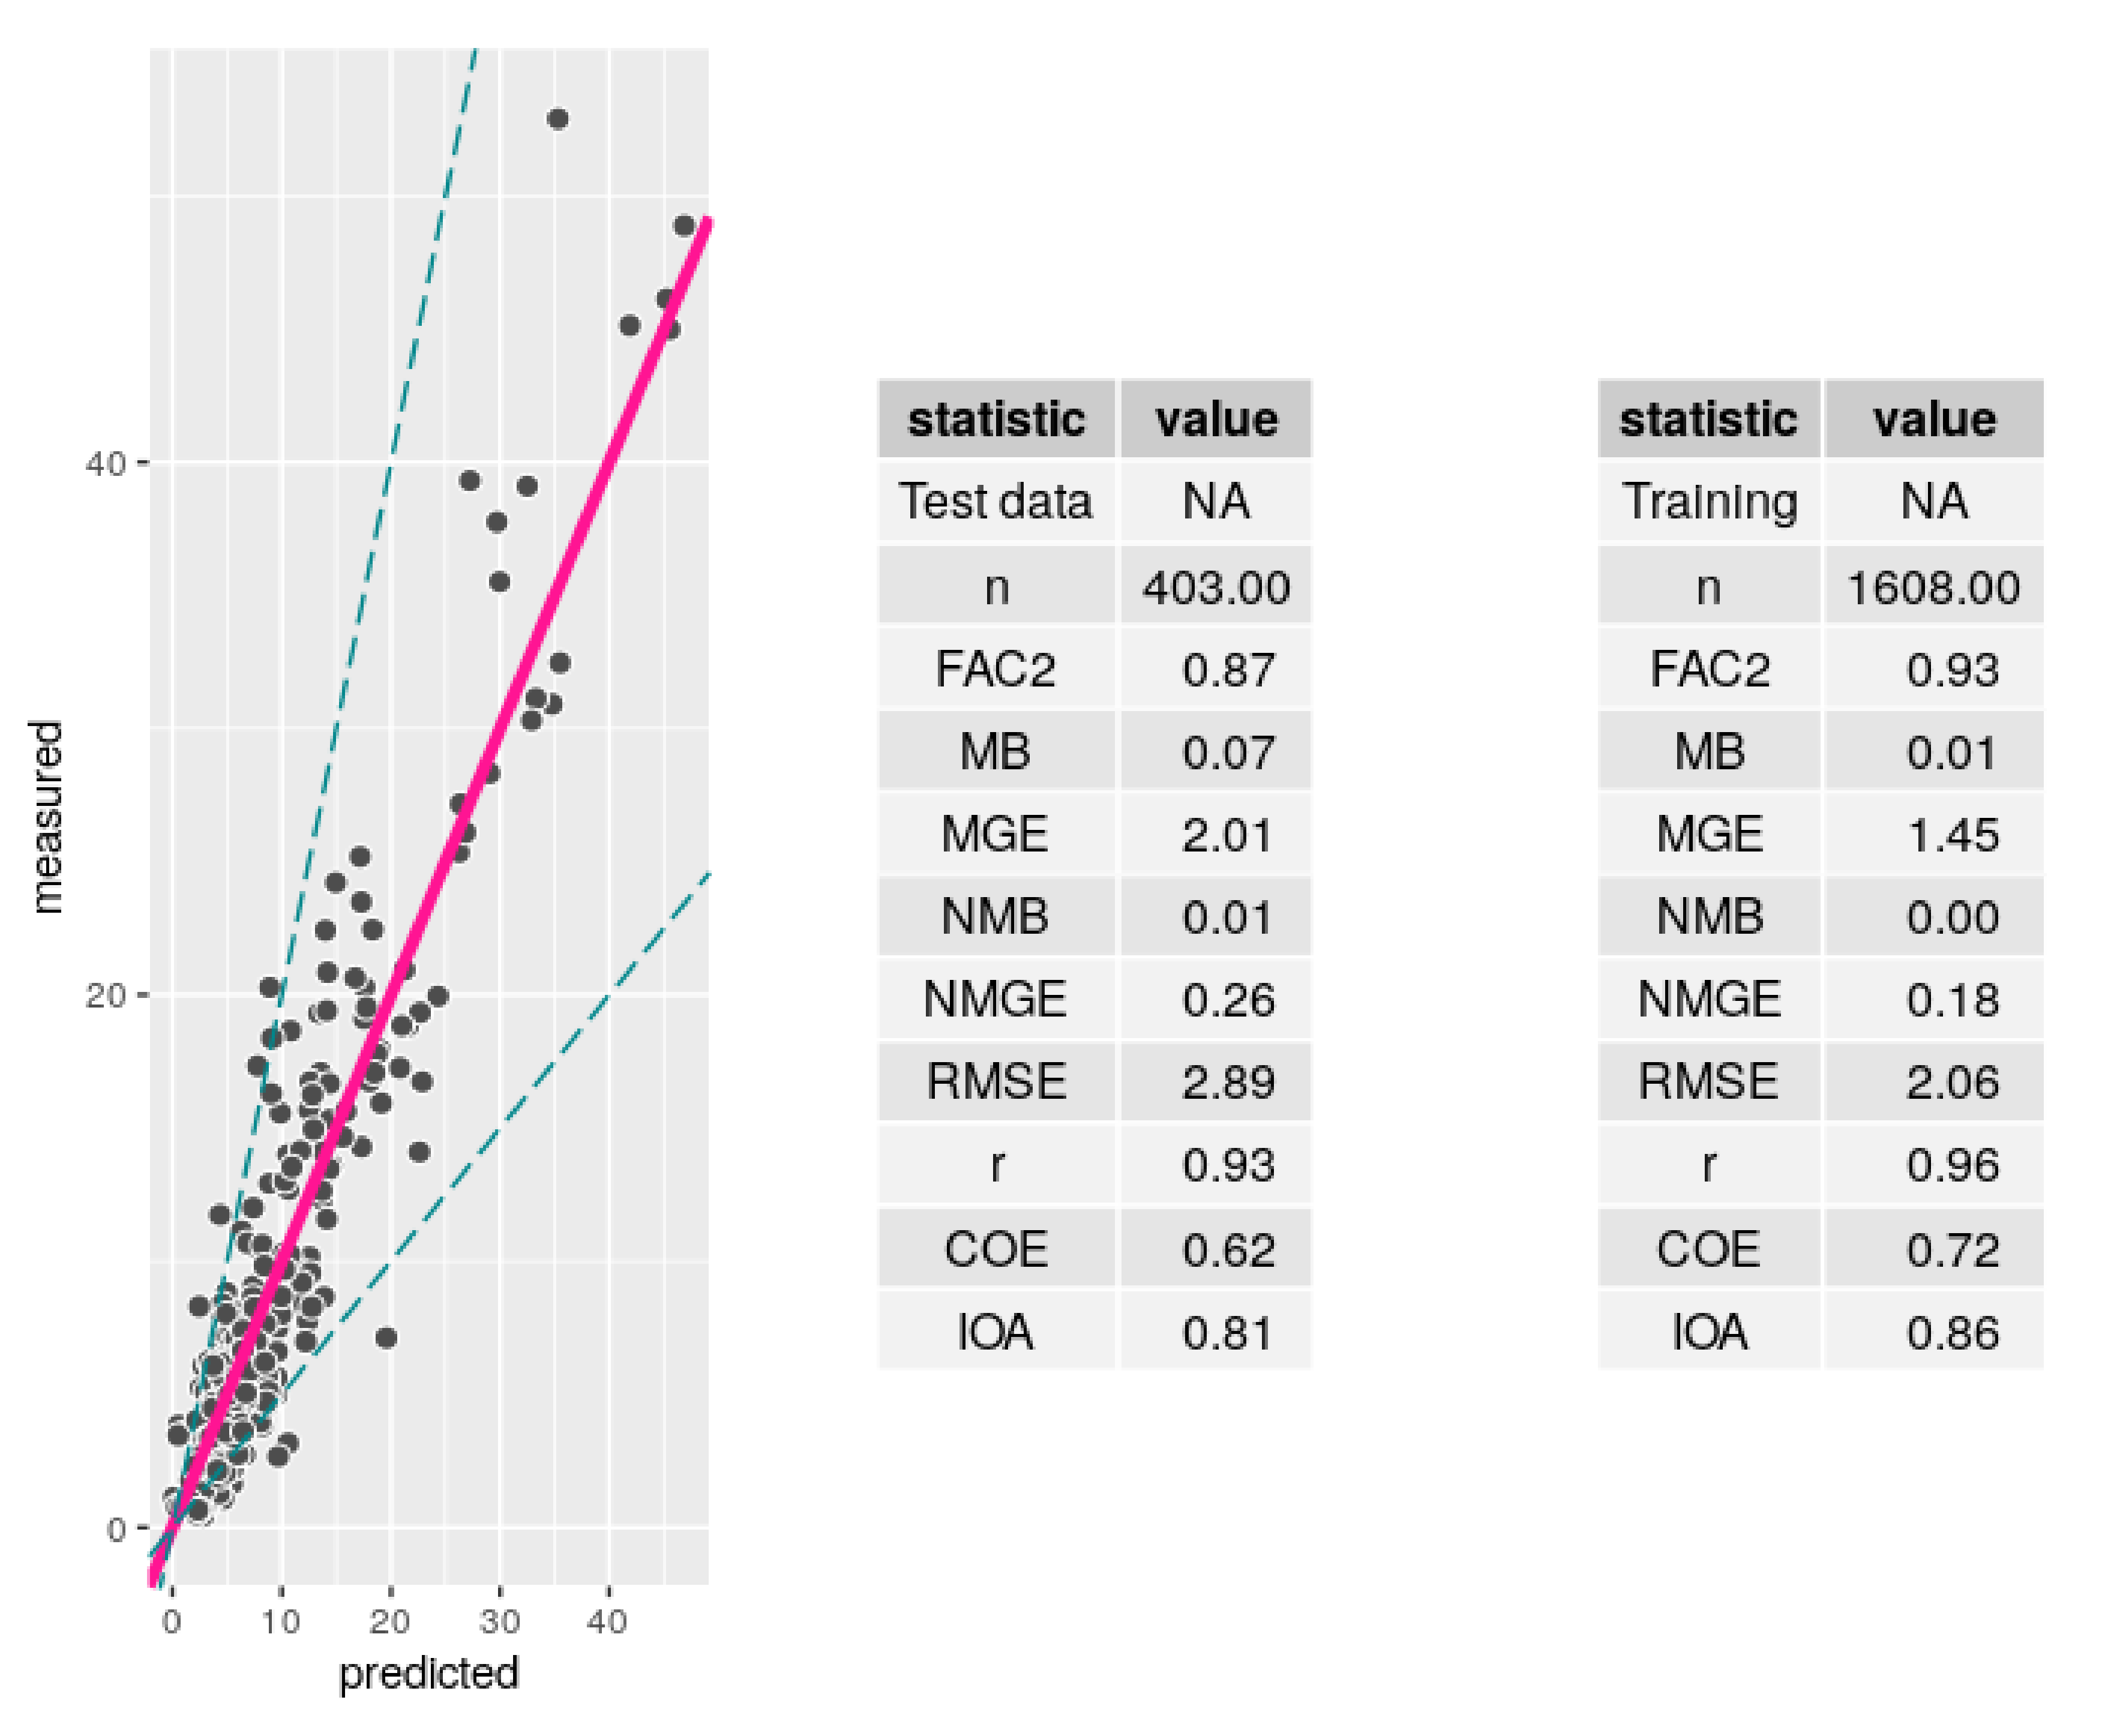
- Evaluation of LCS: PMS5003 corrected data are evaluated by comparing to the Palas Fidas 200 values in the holdout data set. From the field evaluation through collocation between January–April 2020, PMS5003 showed high linear correlation with reference instrument with value 0.81 for the hourly averaged data. This is an improvement in accuracy when compared to the findings from previous studies on evaluating Plantower sensors [10,46] with values lying between 0.71–0.77 for PMS5003 without applying any correction factors. The inter-sensor comparison showed a high correlation, with an value between 0.98–0.99. Figure 5, below, shows the scatter plot between the reference and corrected PMS5003 sensor.
Sensor Limitations
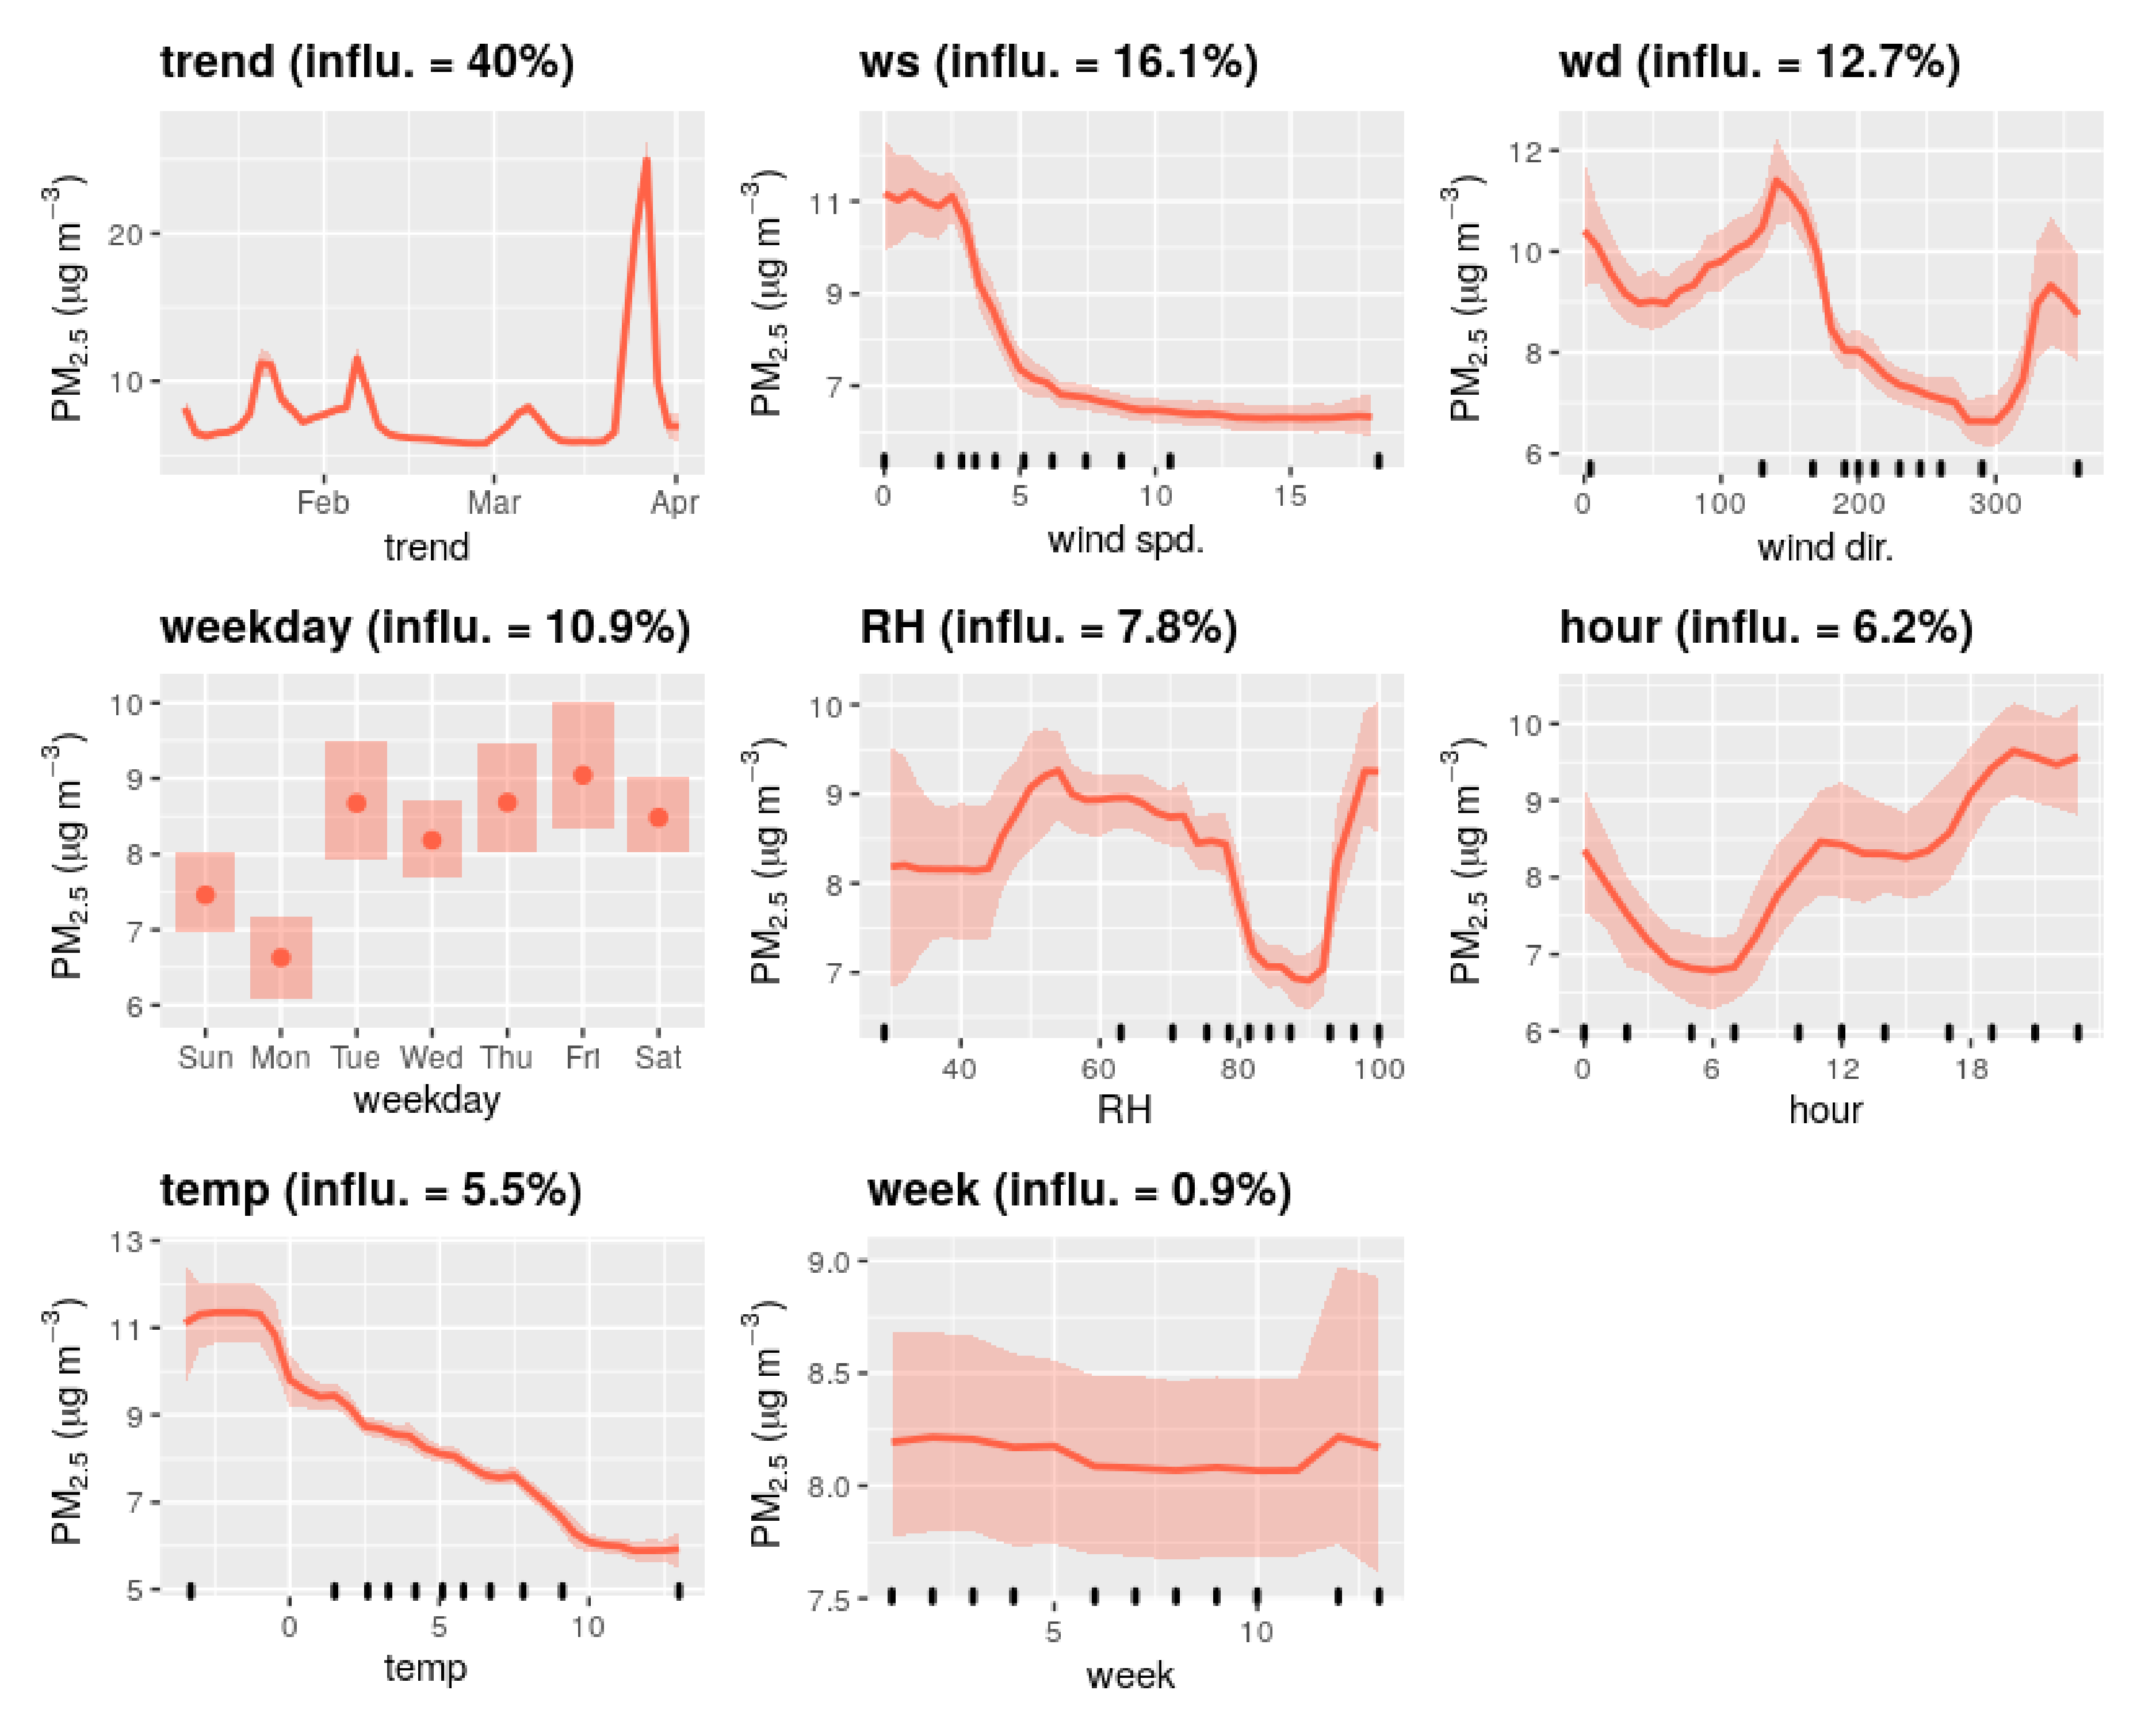
2.3. Monitoring Outdoor Air Quality and Adjusting for Weather: A Generalized Boosted Regression Model
2.4. Data Processing and Storage
- The ability to ingest a high volume of time series data with dynamic data from the sensors.
- The ability to return this time series data with basic querying parameters such as sensor ID and timestamps.
2.5. Data Analysis
- A and B represent the Control and Experimental group.
- and represent the means of groups of samples A and B, respectively.
- and represent the sizes of group A and B, respectively.
- and are the standard deviation of the two groups A and B, respectively.
2.6. Study Limitations
3. Results and Discussion
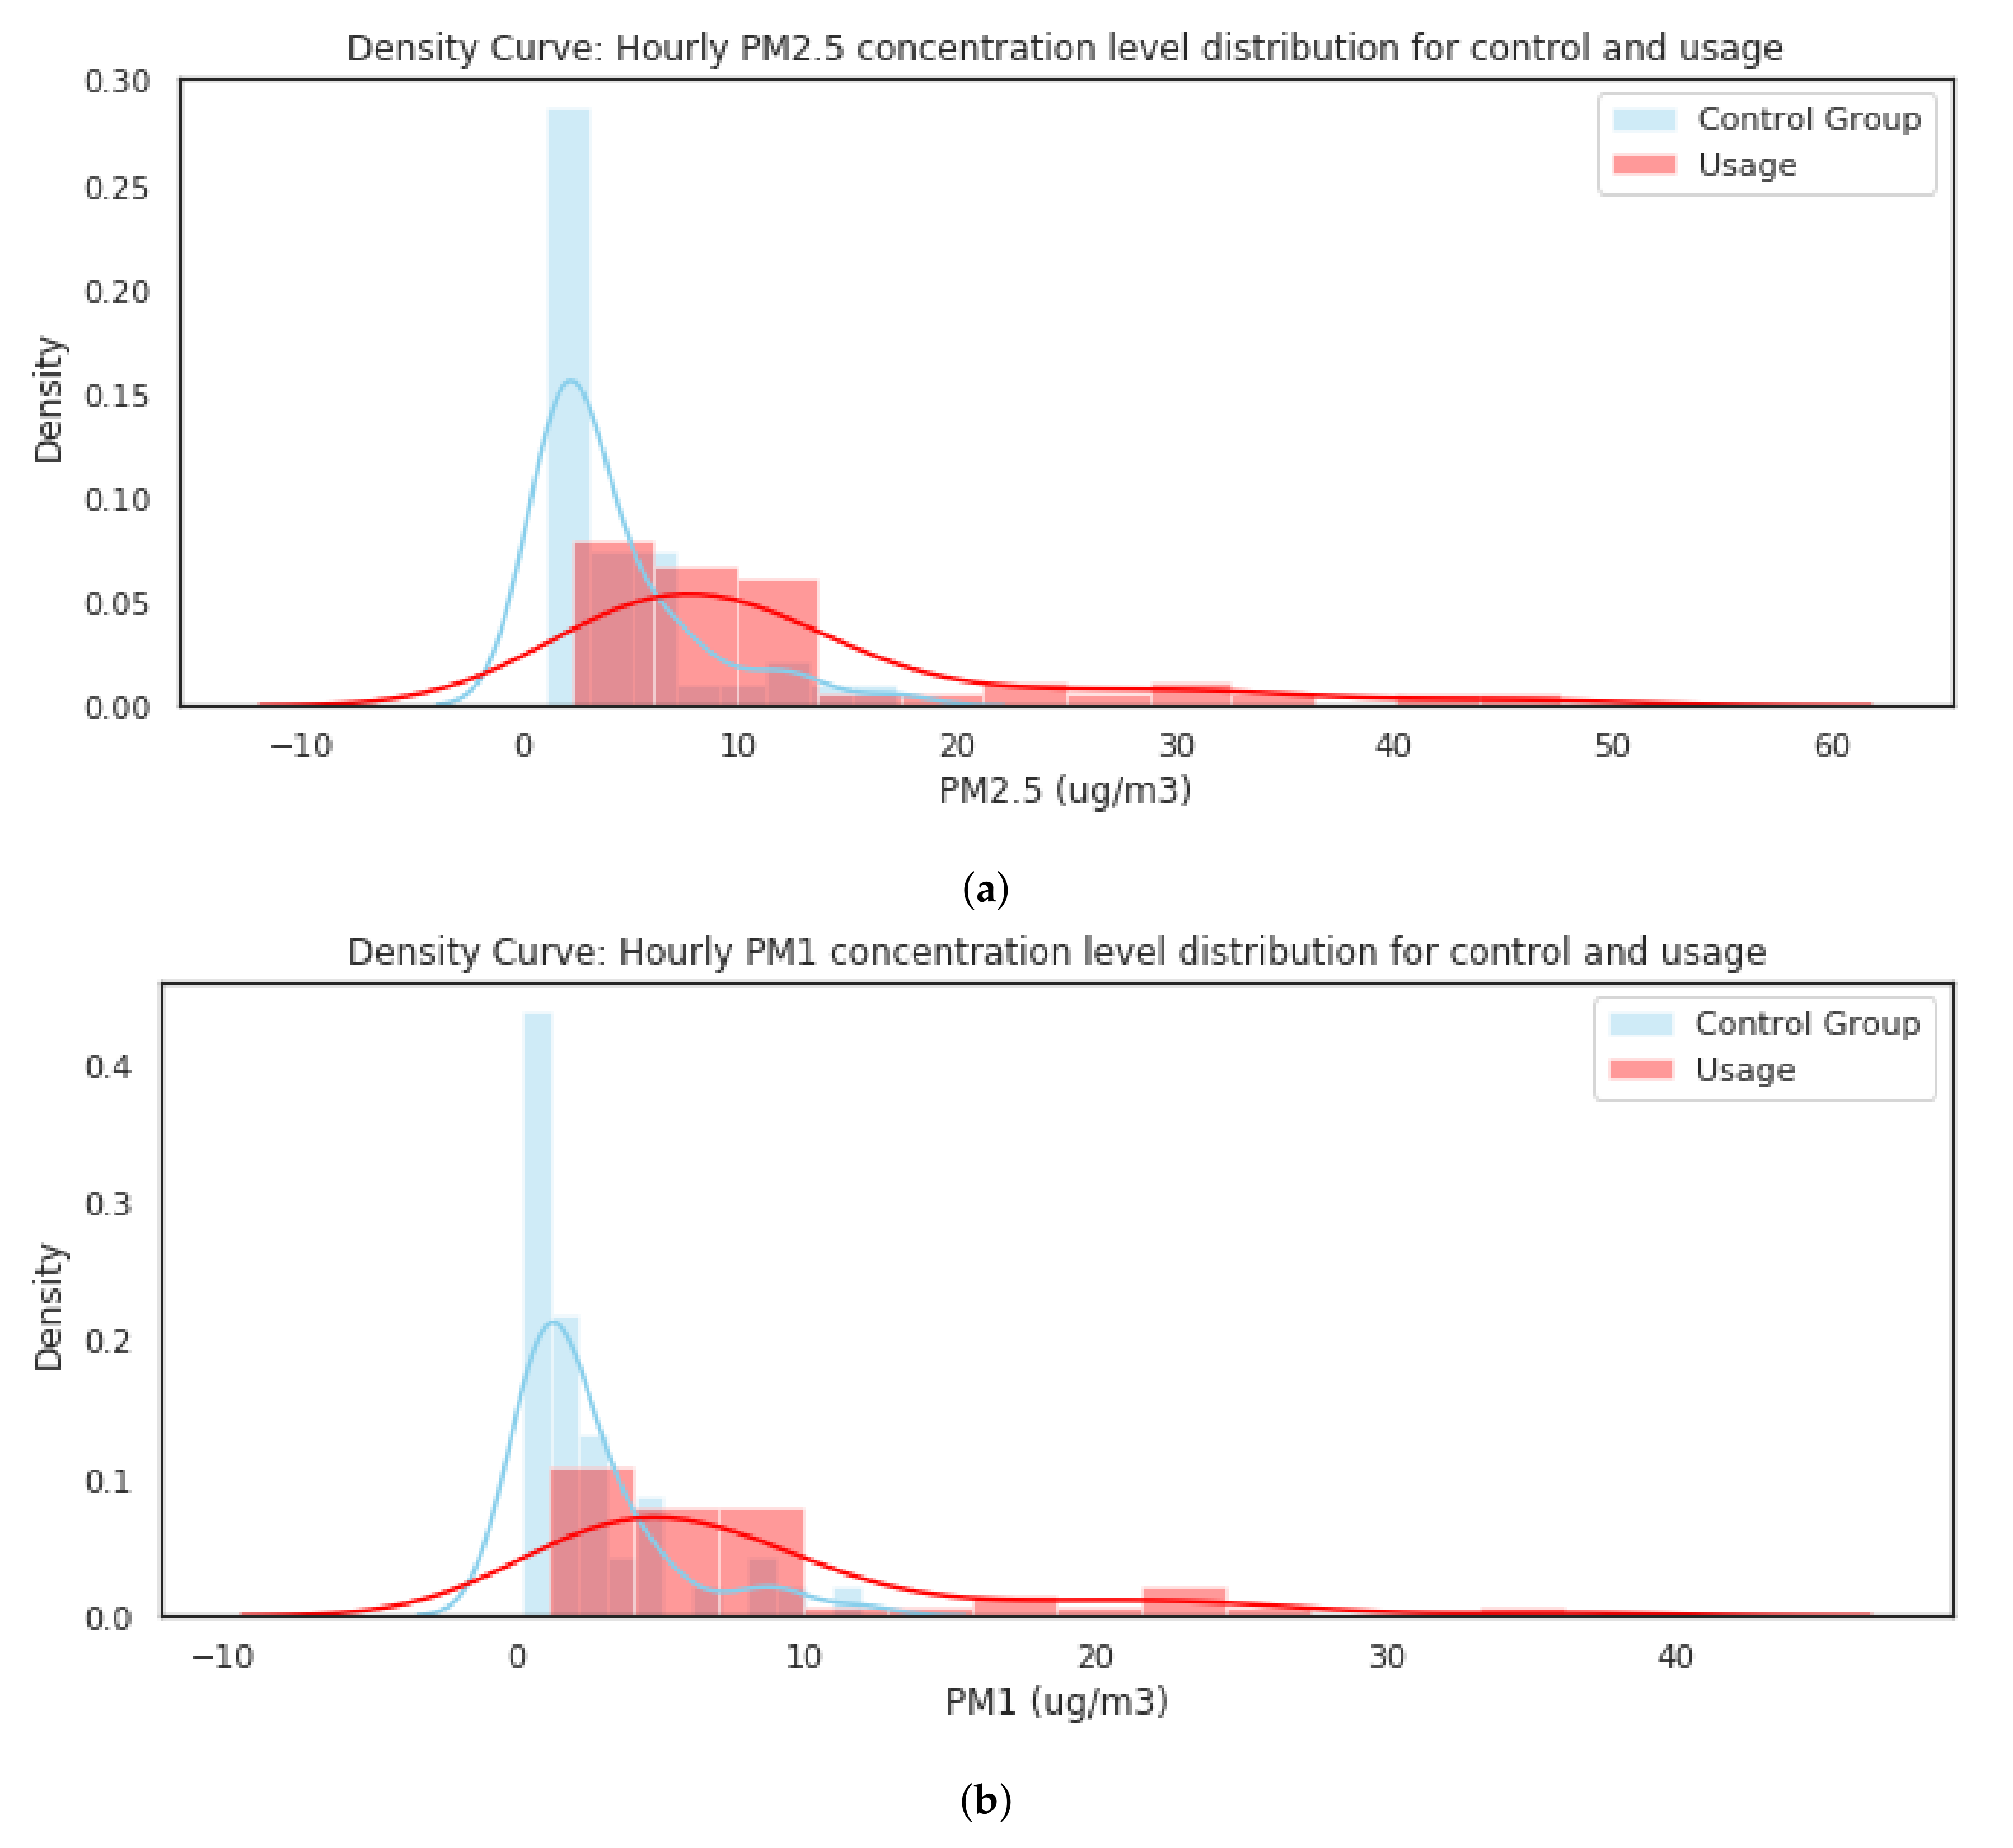
3.1. Increase in Indoor Pollution Levels during Stove Use
3.2. Indoor Outdoor Interface: Average Indoor Levels Are Higher and Weakly Correlated with Outdoor Average PM Levels
3.3. Hourly Peak PM Average Higher than Daily PM Average
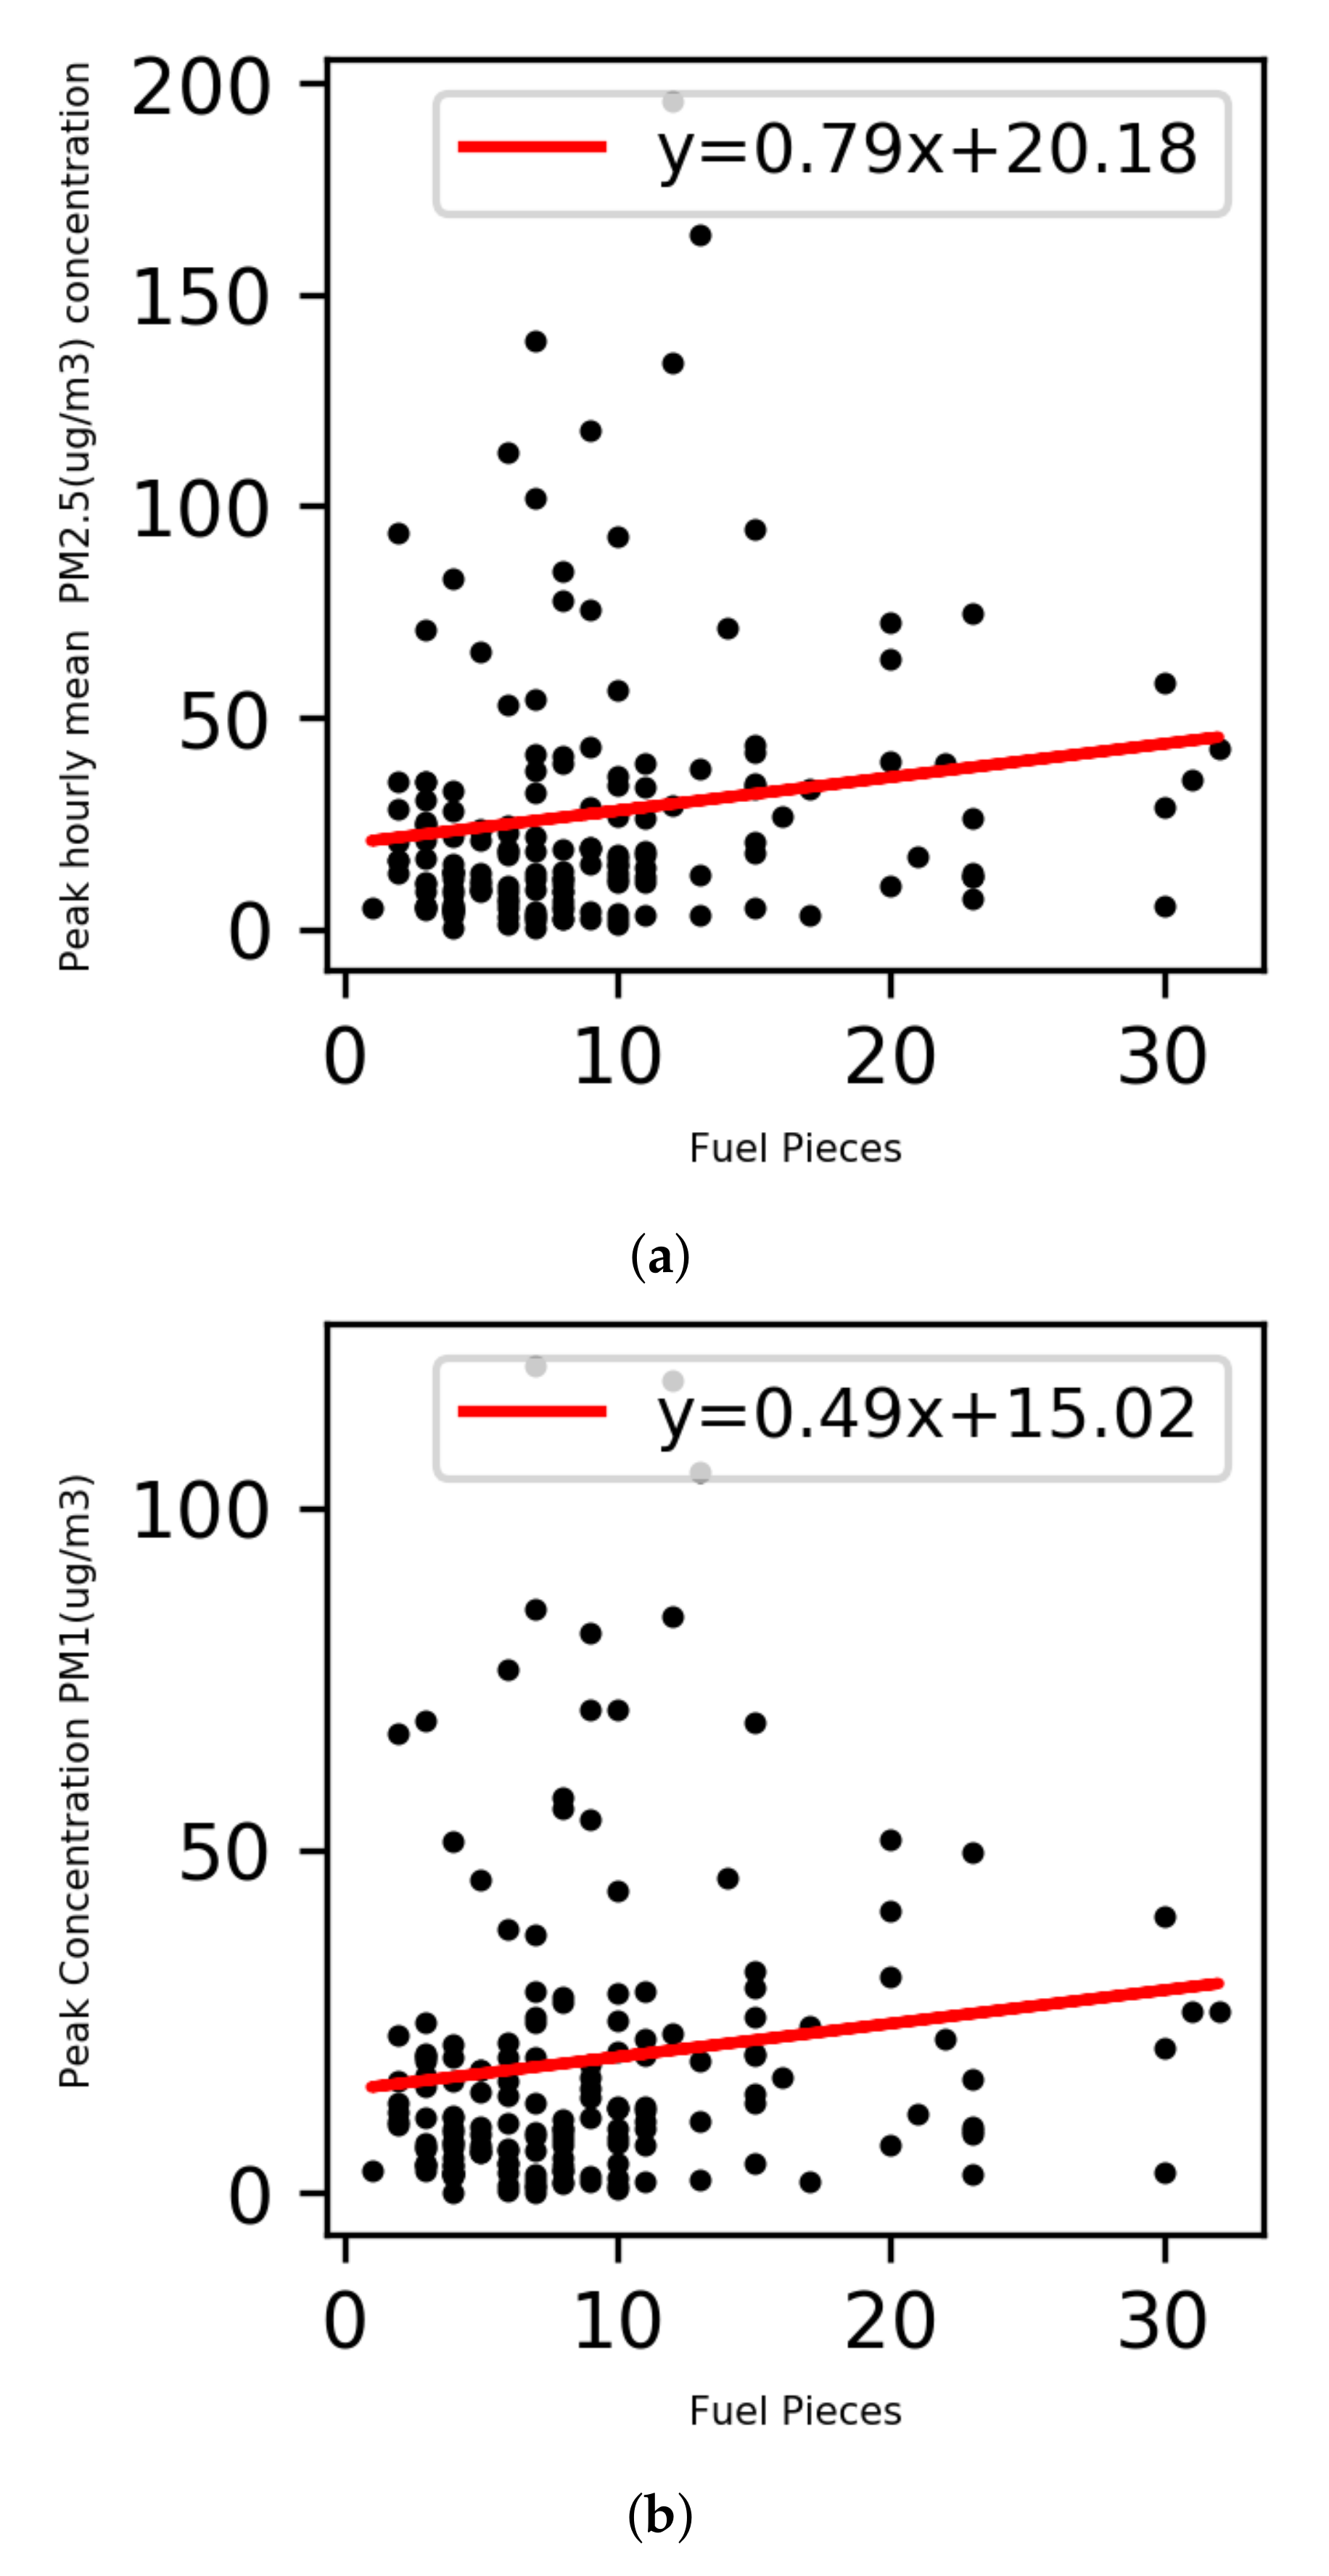
3.3.1. Hourly Peak Average PM Has a Moderate Correlation to the Pieces of Fuel Used
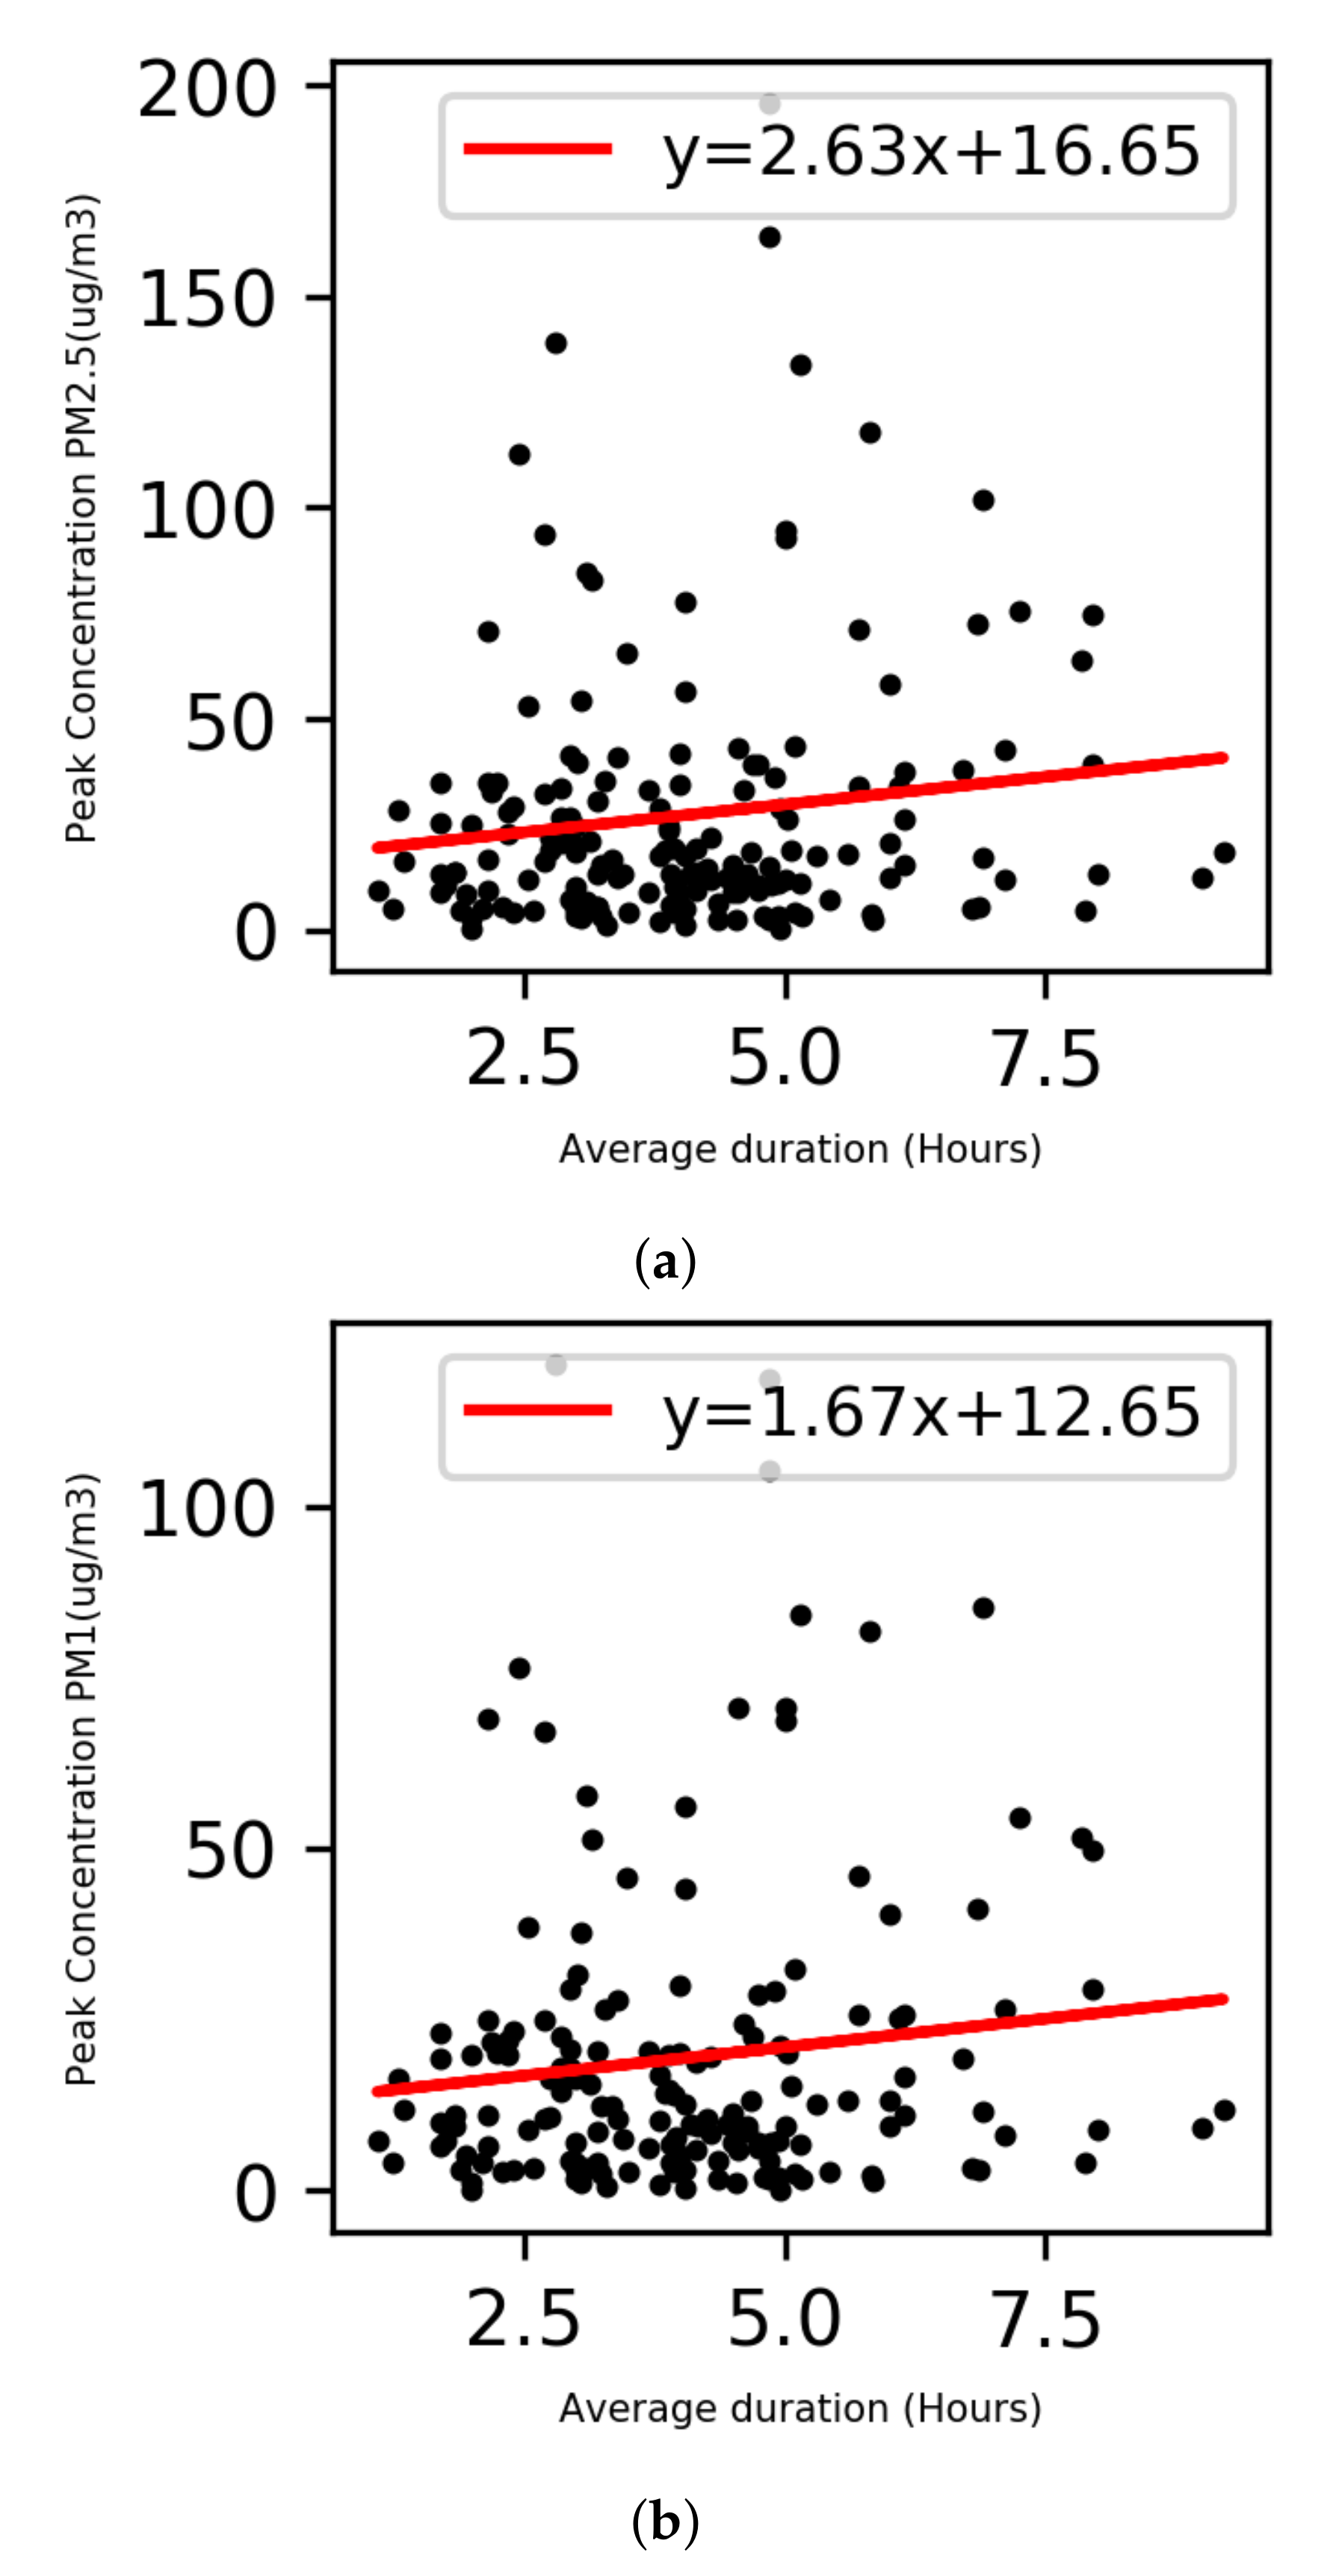
3.3.2. Hourly Peak Averages Illustrate a Moderate Correlation with Duration of Use
4. Conclusions
Author Contributions
Funding
Acknowledgments
Conflicts of Interest
Abbreviations
| n | the number of complete pairs of data. |
| FAC2 | fraction of predictions within a factor of two |
| MB | mean bias. |
| MGE | mean gross error. |
| NMB | normalised mean bias. |
| NMGE | normalised mean gross error. |
| RMSE | root mean square error. |
| r | Pearson correlation coefficient. |
| COE | the Coefficient of Efficiency |
| IOA | the Index of Agreement |
References
- World Health Organisation. 2014. Available online: https://www.who.int/mediacentre/news/releases/2014/air-pollution/en// (accessed on 14 June 2020).
- Martins, N.R.; da Graça, C.G. Impact of PM2.5 in indoor urban environments: A review. Sustain. Cities Soc. 2018, 42, 259–275. [Google Scholar] [CrossRef]
- Fu, P.; Guo, X.; Cheung, F.M.H.; Yung, K.K.L. The association between PM 2.5 exposure and neurological disorders: A systematic review and meta-analysis. Sci. Total Environ. 2019, 655, 1240–1248. [Google Scholar] [CrossRef] [PubMed]
- Schraufnagel, D.E.; Balmes, J.R.; Cowl, C.T.; De Matteis, S.; Jung, S.H.; Mortimer, K.; Perez-Padilla, R.; Rice, M.B.; Riojas-Rodriguez, H.; Sood, A.; et al. Air Pollution and Noncommunicable Diseases: A Review by the Forum of International Respiratory Societies’ Environmental Committee, Part 2: Air Pollution and Organ Systems. Chest 2019, 155, 417–426. [Google Scholar] [CrossRef]
- DEFRA. Clean Air Strategy 2019, 1, 9. Available online: https://assets.publishing.service.gov.uk/government/uploads/system/uploads/attachment_data/file/770715/clean-air-strategy-2019.pdf (accessed on 9 July 2020).
- Department for Business, Energy & Industrial Strategy. Summary Results of the Domestic Wood Use Survey; Department for Energy and Climate Change: London, UK, 2016; pp. 67–80. Available online: https://assets.publishing.service.gov.uk/government/uploads/system/uploads/attachment_data/file/833061/Summary_results_of_the_domestic_wood_use_survey_.pdf (accessed on 9 July 2020).
- Font, A.; Fuller, G. Report: Airborne Particles from Wood Burning in UK Cities; Environmental Research Group -King’s College: London, UK, 2017; pp. 1–52. Available online: https://uk-air.defra.gov.uk/library/reports?report_id=953 (accessed on 14 July 2020).
- Air Quality Expert Group. The Potential Air Quality Impacts from Biomass Combustion; Air Quality Expert Group: Defra, UK, 2017; p. 80. Available online: https://uk-air.defra.gov.uk/assets/documents/reports/cat11/1708081027_170807_AQEG_Biomass_report.pdf (accessed on 14 July 2020).
- Eisentraut, A.; Adam, B.; International Energy Agency, Paris. Heating without global warming. Featured Insight. 2014. Available online: https://www.iea.org/reports/heating-without-global-warming (accessed on 15 July 2020).
- Bertrand, A.; Stefenelli, G.; Bruns, E.A.; Pieber, S.M.; Temime-Roussel, B.; Slowik, J.G.; Prévôt, A.S.; Wortham, H.; El Haddad, I.; Marchand, N. Primary emissions and secondary aerosol production potential from woodstoves for residential heating: Influence of the stove technology and combustion efficiency. Atmos. Environ. 2017, 169, 65–79. [Google Scholar] [CrossRef]
- Winijkul, E.; Bond, T.C. Emissions from residential combustion considering end-uses and spatial constraints: Part II, emission reduction scenarios. Atmos. Environ. 2016, 124, 1–11. [Google Scholar] [CrossRef]
- Nyström, R.; Lindgren, R.; Avagyan, R.; Westerholm, R.; Lundstedt, S.; Boman, C. Influence of Wood Species and Burning Conditions on Particle Emission Characteristics in a Residential Wood Stove. Energy Fuels 2017, 31, 5514–5524. [Google Scholar] [CrossRef]
- Avagyan, R.; Nyström, R.; Lindgren, R.; Boman, C.; Westerholm, R. Particulate hydroxy-PAH emissions from a residential wood log stove using different fuels and burning conditions. Atmos. Environ. 2016, 140, 1–9. [Google Scholar] [CrossRef]
- Win, K.M.; Persson, T. Emissions from residential wood pellet boilers and stove characterized into start-up, steady operation, and stop emissions. Energy Fuels 2014, 28, 2496–2505. [Google Scholar] [CrossRef]
- Traynor, G.W.; Apte, M.G.; Carruthers, A.R.; Dillworth, J.F.; Grimsrud, D.T.; Gundel, L.A. Indoor air pollution due to emissions from wood-burning stoves. Environ. Sci. Technol. 1987, 21, 691–697. [Google Scholar] [CrossRef]
- Canha, N.; Almeida, S.M.; Freitas, M.d.C.; Wolterbeek, H.T.; Cardoso, J.; Pio, C.; Caseiro, A. Impact of wood burning on indoor PM2.5 in a primary school in rural Portugal. Atmos. Environ. 2014, 94, 663–670. [Google Scholar] [CrossRef]
- Semmens, E.O.; Noonan, C.W.; Allen, R.W.; Weiler, E.C.; Ward, T.J. Indoor particulate matter in rural, wood stove heated homes. Environ. Res. 2015, 138, 93–100. [Google Scholar] [CrossRef] [PubMed]
- Piccardo, M.T.; Cipolla, M.; Stella, A.; Ceppi, M.; Bruzzone, M.; Izzotti, A.; Valerio, F. Indoor pollution and burning practices in wood stove management. J. Air Waste Manag. Assoc. 2014, 64, 1309–1316. [Google Scholar] [CrossRef] [PubMed]
- Wang, D.; Li, Q.; Shen, G.; Deng, J.; Zhou, W.; Hao, J.; Jiang, J. Significant ultrafine particle emissions from residential solid fuel combustion. Sci. Total Environ. 2020, 715, 1–7. [Google Scholar] [CrossRef] [PubMed]
- Vicente, E.D.; Vicente, A.M.; Evtyugina, M.; Oduber, F.I.; Amato, F.; Querol, X.; Alves, C. Impact of wood combustion on indoor air quality. Sci. Total Environ. 2020, 705, 135769. [Google Scholar] [CrossRef] [PubMed]
- Allen, R.W.; Leckie, S.; Millar, G.; Brauer, M. The impact of wood stove technology upgrades on indoor residential air quality. Atmos. Environ. 2009, 43, 5908–5915. [Google Scholar] [CrossRef]
- Noonan, C.W.; Navidi, W.; Sheppard, L.; Palmer, C.P.; Bergauff, M.; Hooper, K.; Ward, T.J. Residential indoor PM 2.5 in wood stove homes: Follow-up of the Libby changeout program. Indoor Air 2012, 22, 492–500. [Google Scholar] [CrossRef]
- Chen, C.; Li, H.; Niu, Y.; Liu, C.; Lin, Z.; Cai, J.; Li, W.; Ge, W.; Chen, R.; Kan, H. Impact of short-term exposure to fine particulate matter air pollution on urinary metabolome: A randomized, double-blind, crossover trial. Environ. Int. 2019, 130, 104878. [Google Scholar] [CrossRef]
- Madsen, C.; Rosland, P.; Hoff, D.A.; Nystad, W.; Nafstad, P.; Næss, Ø.E. The short-term effect of 24-h average and peak air pollution on mortality in Oslo Norway. Eur. J. Epidemiol. 2012, 27, 717–727. [Google Scholar] [CrossRef]
- Darrow, L.A.; Klein, M.; Sarnat, J.A.; Mulholland, J.A.; Strickland, M.J.; Sarnat, S.E.; Russell, A.G.; Tolbert, P.E. The use of alternative pollutant metrics in time-series studies of ambient air pollution and respiratory emergency department visits. J. Expo. Sci. Environ. Epidemiol. 2011, 21, 10–19. [Google Scholar] [CrossRef]
- Bhaskaran, K.; Hajat, S.; Armstrong, B.; Haines, A.; Herrett, E.; Wilkinson, P.; Smeeth, L. The effects of hourly differences in air pollution on the risk of myocardial infarction: Case crossover analysis of the MINAP database. BMJ 2011, 343, 1–11. [Google Scholar] [CrossRef]
- Lin, H.; Ratnapradipa, K.; Wang, X.; Zhang, Y.; Xu, Y.; Yao, Z.; Dong, G.; Liu, T.; Clark, J.; Dick, R.; et al. Hourly peak concentration measuring the PM2.5-mortality association: Results from six cities in the Pearl River Delta study. Atmos. Environ. 2017, 161, 27–33. [Google Scholar] [CrossRef]
- Orellano, P.; Reynoso, J.; Quaranta, N.; Bardach, A.; Ciapponi, A. Short-term exposure to particulate matter (PM10 and PM2.5), nitrogen dioxide (NO2), and ozone (O3) and all-cause and cause-specific mortality: Systematic review and meta-analysis. Environ. Int. 2020, 142, 105876. [Google Scholar] [CrossRef]
- Mitchell, E.J.; Lea-Langton, A.R.; Jones, J.M.; Williams, A.; Layden, P.; Johnson, R. The impact of fuel properties on the emissions from the combustion of biomass and other solid fuels in a fixed bed domestic stove. Fuel Process. Technol. 2016, 142, 115–123. [Google Scholar] [CrossRef]
- Vicente, E.D.; Duarte, M.A.; Calvo, A.I.; Nunes, T.F.; Tarelho, L.; Alves, C.A. Emission of carbon monoxide, total hydrocarbons and particulate matter during wood combustion in a stove operating under distinct conditions. Fuel Process. Technol. 2015, 131, 182–192. [Google Scholar] [CrossRef]
- Mcnamara, M.; Thornburg, J.; Semmens, E.; Ward, T.; Noonan, C. Coarse particulate matter and airborne endotoxin within wood stove homes. Indoor Air 2013, 23, 498–505. [Google Scholar] [CrossRef] [PubMed]
- de Jesus, A.L.; Rahman, M.M.; Mazaheri, M.; Thompson, H.; Knibbs, L.D.; Jeong, C.; Evans, G.; Nei, W.; Ding, A.; Qiao, L.; et al. Ultrafine particles and PM2.5 in the air of cities around the world: Are they representative of each other? Environ. Int. 2019, 129, 118–135. [Google Scholar] [CrossRef]
- Penttinen, P.; Timonen, K.L.; Tiittanen, P.; Mirme, A.; Ruuskanen, J.; Pekkanen, J. Ultrafine particles in urban air and respiratory health among adult asthmatics. Eur. Respir. J. 2001, 17, 428–435. [Google Scholar] [CrossRef]
- Testing of Solid Fuel Stoves. 2013. Available online: https://www.bsria.com/uk/news/article/testing-of-solid-fuel-stoves (accessed on 15 July 2020).
- Salthammer, T.; Schripp, T.; Wientzek, S.; Wensing, M. Impact of operating wood-burning fireplace ovens on indoor air quality. Chemosphere 2014, 103, 205–211. [Google Scholar] [CrossRef]
- Sheffield City Council. 2011 Census First Results: Population Estimates; Sheffield City Council: Sheffield, UK, 2011; pp. 1–6. Available online: https://www.sheffield.gov.uk/content/dam/sheffield/docs/your-city-council/facts-figures/2011%20Census%20July%20Release%20-%20Population%20Estimates.pdf (accessed on 15 July 2020).
- Sheffield City Council. Air Quality: Action Plan; Sheffield City Council: Sheffield, UK, 2015; p. 76. Available online: https://www.sheffield.gov.uk/content/dam/sheffield/docs/pollution-and-nuisance/air-pollution/air-quality-management/Air%20Quality%20Action%20Plan%202015.pdf (accessed on 15 July 2020).
- Urban Flows Observatory. 2018. Available online: https://urbanflows.ac.uk/ (accessed on 17 July 2020).
- Jayaratne, R.; Liu, X.; Thai, P.; Dunbabin, M.; Morawska, L. The influence of humidity on the performance of a low-cost air particle mass sensor and the effect of atmospheric fog. Atmos. Meas. Tech. 2018, 11, 4883–4890. [Google Scholar] [CrossRef]
- Bulot, F.M.; Johnston, S.J.; Basford, P.J.; Easton, N.H.; Apetroaie-Cristea, M.; Foster, G.L.; Morris, A.K.; Cox, S.J.; Loxham, M. Long-term field comparison of multiple low-cost particulate matter sensors in an outdoor urban environment. Sci. Rep. 2019, 9, 1–13. [Google Scholar] [CrossRef] [PubMed]
- Hänel, G. The properties of atmospheric aerosol particles as functions of the relative humidity at thermodynamic equilibrium with the surrounding moist air. Adv. Geophys. 1976, 19, 73–188. [Google Scholar] [CrossRef]
- Streibl, N. Influence of Humidity on the Accuracy of Low-Cost Particulate Matter Sensors. Technical Report. 2017. Available online: https://www.researchgate.net/profile/Norbert_Streibl/publication/320474792_Influence_of_Humidity_on_the_Accuracy_of_Low-Cost_Particulate_Matter_Sensors/links/59e7ad15aca272bc423d0b97/Influence-of-Humidity-on-the-Accuracy-of-Low-Cost-Particulate-Matter-Sensors.pdf (accessed on 17 July 2020).
- Köhler, H. The nucleus in and the growth of hygroscopic droplets. Trans. Faraday Soc. 1936, 32, 1152–1161. [Google Scholar] [CrossRef]
- Petters, M.D.; Kreidenweis, S.M. A single parameter representation of hygroscopic growth and cloud condensation nucleus activity-Part 3: Including surfactant partitioning. Atmos. Chem. Phys. 2013, 13, 1081–1091. [Google Scholar] [CrossRef]
- Svenningsson, B.; Rissler, J.; Swietlicki, E.; Mircea, M.; Bilde, M.; Facchini, M.C.; Decesari, S.; Fuzzi, S.; Zhou, J.; Mønster, J.; et al. Hygroscopic growth and critical supersaturations for mixed aerosol particles of inorganic and organic compounds of atmospheric relevance. Atmos. Chem. Phys. 2006, 6, 1937–1952. [Google Scholar] [CrossRef]
- South Coast Air Quality Management District (SCAQMD). Field Evaluation of SainSmart. 2017. Available online: http://www.aqmd.gov/docs/default-source/aq-spec/field-evaluations/sainsmart—field-evaluation.pdf (accessed on 20 August 2020).
- Air Quality Expert Group. Fine Particulate Matter (PM 2.5) in the United Kingdom. 2012. Available online: https://uk-air.defra.gov.uk/assets/documents/reports/cat11/1212141150_AQEG_Fine_Particulate_Matter_in_the_UK.pdf (accessed on 20 August 2020).
- Ridgeway, G. Generalized Boosted Models: A guide to the gbm package. Compute 2007, 1, 1–12. [Google Scholar] [CrossRef]
- Carslaw, D.C.; Taylor, P.J. Analysis of air pollution data at a mixed source location using boosted regression trees. Atmos. Environ. 2009, 43, 3563–3570. [Google Scholar] [CrossRef]
- Tong, J.C. Cross-Validation. Encycl. Syst. Biol. 2013, 508. [Google Scholar] [CrossRef]
- The Natural Environment Research Council. 2020. Available online: https://bit.ly/3kjWfn8 (accessed on 19 September 2020).
- Ezzati, M.; Kammen, D.M. The health impacts of exposure to indoor air pollution from solid fuels in developing countries: Knowledge, gaps, and data needs. Environ. Health Perspect. 2002, 110, 1057–1068. [Google Scholar] [CrossRef]
- Delfino, R.J.; Zeiger, R.S.; Seltzer, J.M.; Street, D.H.; McLaren, C.E. Association of asthma symptoms with peak particulate air pollution and effect modification by anti-inflammatory medication use. Environ. Health Perspect. 2002, 110, 607–617. [Google Scholar] [CrossRef]
- Castro, A.; Calvo, A.I.; Blanco-Alegre, C.; Oduber, F.; Alves, C.; Coz, E.; Amato, F.; Querol, X.; Fraile, R. Impact of the wood combustion in an open fireplace on the air quality of a living room: Estimation of the respirable fraction. Sci. Total Environ. 2018, 628–629, 169–176. [Google Scholar] [CrossRef]


| DAQI | 1 | 2 | 3 | 4 | 5 | 6 | 7 | 8 | 9 | 10 |
|---|---|---|---|---|---|---|---|---|---|---|
| Band | Low | Low | Low | Moderate | Moderate | Moderate | High | High | High | Very High |
| gm | 0–11 | 12–23 | 24–34 | 5–41 | 42–46 | 47–52 | 53–58 | 59–64 | 65–69 | 70 or more |
| 0.82 | 0.79 | 0.81 | 0.83 | 0.81 | 0.82 | 0.79 | N/A | N/A | N/A |
| Duration (Hours) | FP | Peak | Mean | Peak | Mean | KP | ||
|---|---|---|---|---|---|---|---|---|
| mean | 4.06 | 9.07 | 27.34 | 12.21 | 19.44 | 8.34 | 10.37 | |
| std | 1.63 | 6.32 | 31.26 | 10.36 | 22.37 | 7.64 | 7.04 | |
| min | 1.1 | 1 | 0.23 | 2.27 | 0 | 1.11 | 0 | |
| 25% | 2.95 | 4 | 9 | 5.66 | 5.79 | 3.51 | 6 | |
| 50% | 3.95 | 8 | 16.87 | 9.26 | 11.375 | 5.5 | 9 | |
| 75% | 4.94 | 11 | 34 | 12.50 | 22.77 | 8.87 | 15 | |
| max | 9.2 | 32 | 195.83 | 47.60 | 121 | 36.15 | 39 | |
| Coefficient of Variation | 0.39 | 0.69 | 1.14 | 0.90 | 1.14 | 0.94 | 0.67 | |
| Pearson’s r | ||||||||
| Duration (hours) | 1 | |||||||
| FP | 0.55 | 1 | ||||||
| Peak | 0.4 | 0.44 | 1 | |||||
| Mean | 0.017 | 0.17 | 0.75 | 1 | ||||
| Peak | 0.38 | 0.43 | 0.97 | 0.75 | 1 | |||
| Mean | 0.021 | 0.15 | 0.73 | 0.98 | 0.76 | 1 | ||
| KP | 0.019 | 0.039 | 1 |
Publisher’s Note: MDPI stays neutral with regard to jurisdictional claims in published maps and institutional affiliations. |
© 2020 by the authors. Licensee MDPI, Basel, Switzerland. This article is an open access article distributed under the terms and conditions of the Creative Commons Attribution (CC BY) license (http://creativecommons.org/licenses/by/4.0/).
Share and Cite
Chakraborty, R.; Heydon, J.; Mayfield, M.; Mihaylova, L. Indoor Air Pollution from Residential Stoves: Examining the Flooding of Particulate Matter into Homes during Real-World Use. Atmosphere 2020, 11, 1326. https://doi.org/10.3390/atmos11121326
Chakraborty R, Heydon J, Mayfield M, Mihaylova L. Indoor Air Pollution from Residential Stoves: Examining the Flooding of Particulate Matter into Homes during Real-World Use. Atmosphere. 2020; 11(12):1326. https://doi.org/10.3390/atmos11121326
Chicago/Turabian StyleChakraborty, Rohit, James Heydon, Martin Mayfield, and Lyudmila Mihaylova. 2020. "Indoor Air Pollution from Residential Stoves: Examining the Flooding of Particulate Matter into Homes during Real-World Use" Atmosphere 11, no. 12: 1326. https://doi.org/10.3390/atmos11121326
APA StyleChakraborty, R., Heydon, J., Mayfield, M., & Mihaylova, L. (2020). Indoor Air Pollution from Residential Stoves: Examining the Flooding of Particulate Matter into Homes during Real-World Use. Atmosphere, 11(12), 1326. https://doi.org/10.3390/atmos11121326