Abstract
This study concerns the levels of particulate matter ( and ) released by residential stoves inside the home during ‘real world’ use. Focusing on stoves that were certified by the UK’s Department of Environment, Food, and Rural Affairs (DEFRA), PM sensors were placed in the vicinity of 20 different stoves over four weeks, recording 260 uses. The participants completed a research diary in order to provide information on time lit, amount and type of fuel used, and duration of use, among other details. Multivariate statistical tools were used in order to analyse indoor PM concentrations, averages, intensities, and their relationship to aspects of stove management. The study has four core findings. First, the daily average indoor PM concentrations when a stove was used were higher for by 196.23% and by 227.80% than those of the non-use control group. Second, hourly peak averages are higher for by 123.91% and for by 133.09% than daily averages, showing that PM is ‘flooding’ into indoor areas through normal use. Third, the peaks that are derived from these ’flooding’ incidents are associated with the number of fuel pieces used and length of the burn period. This points to the opening of the stove door as a primary mechanism for introducing PM into the home. Finally, it demonstrates that the indoor air pollution being witnessed is not originating from outside the home. Taken together, the study demonstrates that people inside homes with a residential stove are at risk of exposure to high intensities of and within a short period of time through normal use. It is recommended that this risk be reflected in the testing and regulation of residential stoves.
1. Introduction
As a component of air pollution, particulate matter with an aerodynamic diameter that is equal to 2.5 μm or less () has long been linked to adverse health effects. In terms of mortality, it causes seven-million deaths per year [1]. In terms of health effects, it causes inflammation and oxidative stress, which compromises pulmonary immunity and increases the susceptibility to infection [2]. As these particulates can move into every organ in the body, the illnesses that are associated with their presence range from lung cancer, bronchitis, and other respiratory infections, through to strokes, dementia, and Parkinson’s disease [3]. Effects such as these are particularly pronounced for children, pregnancies, and the elderly [4]. While much research focuses on particulate emissions that are generated by industry and vehicles, in the United Kingdom (UK) the primary source for is the domestic burning of wood and coal for heating [5]. Government estimates suggest that one in twelve UK homes is using residential stoves [6] and, in doing so, causing 38% of the nation’s emissions [5]. Growing in popularity, UK industry data suggest that stove sales are running between 150,000 and 200,000 units per year, with over one million being sold between 2010 and 2015 [7]. Several reasons have been posited for this, including perceived lower fuel costs where wood or biomass is recovered locally, particularly where this intersects with fuel poverty, with residential stoves becoming a lifestyle choice for those who already have a primary source of heating in their home [8], and the perception that wood burning stoves are low-carbon, because they can use renewable fuels [9]. Much of the existing literature on these residential stoves focuses on their efficiency [10,11] and outdoor emissions [12,13,14], with many also deploying monitoring equipment in order to establish the indoor PM emissions that originate from their use. Early work by Traynor et al. [15] measured indoor emissions from four wood burning stoves, finding that all of the stoves emitted particles indoor at some point during use. Canha et al. [16] found that wood burning used to heat one school classroom in rural Portugal contributed high levels of to the indoor environment. Semmens et al. [17] examined 98 stoves over 48 h, finding average indoor concentrations to exceed World Health Organisation ambient air quality guidelines and approach the United States Environment Protection Agency (U.S. EPA) 24-h standard equivalent. Piccardo et al. [18] tested indoor air emissions from nine stoves, finding indoor air pollution to be consistent with errors in self-installation and mismanagement. Wang et al. [19] tested one stove under lab conditions and four stoves in real-world settings. The number of tests conducted, or the real-world measurements taken, are unclear, but the study concludes that different emissions occur at different points during the burn cycle. Vicente et al. [20] tested one open fire and one wood stove under lab conditions, finding that the levels increased 12-fold for the former and 2-fold for the latter during operation. Allen et al. [21] upgraded stoves in 15 houses in order to understand the extent to which stove design can improve indoor air quality, finding that no consistent improvement occurs. Table 1 summarises this literature. While adding to understandings of indoor stove emissions, this body of scholarship also exhibits several limitations.
First, existing studies tend to judge indoor stove emissions against official average exposure guidelines [22]. This is a dominant approach in air quality research, but it serves to obfuscate emission ‘peaks’ by averaging them out of the results. For instance, while Semmens et al. [17] found that the ‘reported number of times the wood stove was opened was not associated with or any particle size fraction’, this judgement was made in the context of a 48h average. This is problematic because epidemiologists are increasingly recognising that exposure to high intensities of PM over much shorter periods of time—hours rather than days—is linked to a range of health issues [23,24,25,26]. Indeed, Lin et al. [27] found a significant association between hourly peak and mortality rates across six Chinese cities. Similarly, a systematic review of 196 articles found a positive relationship between short term PM exposure and cardiovascular, respiratory, and cerebrovascular mortality [28]. Several existing studies report stoves emitting peaks indoors, but these are either observed under controlled conditions [15,20,29,30] or have few real-world users or uses from which to derive data [19,21,22].
Second, the number of stove uses upon which conclusions are drawn is highly variable (see Table 1). This is less of an issue with lab-based testing, as the circumstances of use can be tightly controlled. However, low frequencies of use pose a challenge for studies into real-world emissions because one instance of stove management may not be identical to another. Relatedly, participants may actively change their behaviour if aware they are being observed. Known as ‘participant reactivity’, this can be produced by researchers through obvious and repeated intervention into a social setting. In order to minimise this influence and more accurately ascertain what indoor emissions are occurring through normal use, the sampling of a greater number of stove uses over a longer period of time, and without obvious researcher intervention in the social setting, is required.
Third, existing studies are not clear about the standard of stove being tested. The fuel accepted is outlined and the stove described, albeit inconsistently so (see Table 1), but the design regulations to which the stoves adhere, if at all, tend not to be detailed. This makes it difficult to generalise findings to categories of stove that share fundamental design features. Where stove standards are described, those chosen tend to have been approved by regulators outside the UK. For instance, [17,21,22,31] have focused on stoves that are approved by environmental regulators, but these are limited to the USA and Canadian contexts. Taken together, this relationship between indoor emissions and UK-specific regulations that govern stove design and testing requires investigation.
Fourth, few of the existing studies examine Ultra Fine Particles (UFP), which are defined as particles with a diameter of less than 100 nm, or Particle Number Concentration (PNC), which is defined as the total number of particles measured per cubic centimeter in a given sample. Measuring PNC along with the regular mass concentration measurements of is important because PNC and are not representative of each other [32], with Pearson’s r lying between 0.09–0.64 and high levels of not necessarily causing high levels of PNC or vice versa. Therefore, measures that are taken to reduce or regulate may be different to those that are needed to tackle the problem of increasing PNC. Indeed, Penttinen et al. [33] found a stronger negative association between PNC and peak expiratory flow (PEF) than amongst asthmatic children. Therefore, UFP may pose a substantial health risk since PNC exposure increases remarkably in the smallest size fractions.
When considering these limitations, this study has four aims. First, it seeks to determine real-world indoor PM exposure from the use of residential heating stoves over 30 days. This period was chosen to increase the number of uses from which data could be derived without instructing participants to use their stoves, minimise intrusion into the research setting, and more accurately capture ‘real-world’ use. Second, it detects and identifies the existence of peak indoor and levels as a result of stove use. Third, it seeks to clarify whether the level of indoor air pollution is originating from indoor or outdoor sources. Finally, it seeks to determine the extent to which these emissions are coming from a specific category of stoves; those that are certified as a ‘Smoke Exempt Appliance’ by the UK’s Department for Environment, Farming, and Rural Affairs (DEFRA). These stoves are modified in order to restrict incoming air and limit smoke produced from combustion, differentiating them from the older equipment of focus in Semmens et al. [17]. If a stove passes the official testing process [34], they are certified to be exempt from the Smoke Control Area regulations covering most of the UK’s towns and cities. However, this testing is limited to measuring outdoor air pollution via flue emissions and heat output; none of the applicable standards that are required by DEFRA are concerned with indoor PM emissions from stoves (see PD 6434: 1969; BS 3841: Part 1: 1994; BS 3841: Part 2: 1994). Even the latest ‘EcoDesign’ standards, which call up EN 16510:2018, do not introduce testing for indoor emissions. Indeed, when taken together, the DEFRA testing regime rests on a baseline assumption that stoves do not pollute indoors, or only do so when a fault is present. The results of this study test the validity of that foundational assumption. Taken together, this work makes three core contributions:
- It presents a framework in order to determine real-world indoor PM exposure from the use of residential heating stoves.
- It can detect and identify the existence of peak indoor , , and PNC levels as a result of stove use.
- It analyses the results in relation to the DEFRA regulations and determines the extent of these emissions from a specific category of stoves; those that are certified as a ‘Smoke Exempt Appliance’ by DEFRA.
In making these contributions, the study seeks to determine whether health risks are posed during normal operation and, in turn, whether DEFRA testing standards need modification in light of this reality.
The remainder of this paper is organised, as follows. Section 2 describes the experimental framework along with sensor calibration and evaluation in Section 2.2. Section 3 presents the findings and analysis, which is followed by the conclusion in Section 4.

Table 1.
Overview of Existing Literature that has Monitoring Indoor Pollution from Residential Heating Stoves.
Table 1.
Overview of Existing Literature that has Monitoring Indoor Pollution from Residential Heating Stoves.
| Study | Year-Study Site | No. of Sampled Stoves | Lab-Conditions or Real-World? | Heating Unit Type and Fuel Acceptance | No. of Uses Analysis Based on |
|---|---|---|---|---|---|
| Traynor et al. [15] | 1987-USA | 4 | Lab/Real-world hybrid | Wood stoves (3 ‘airtight’, 1 ‘non-airtight Franklin model’) | 11 |
| Allen et al. [21] | 2009-Canada | 15 | Real-world (stove upgrade halfway through) | Wood stove (non-EPA-certified and EPA-certified) | Not provided (2 three-day samples taken over 6 days) |
| Noonan et al. [22] | 2012-USA | 21 | Real-world (stove upgrade halfway through) | Wood stove (non-EPA-certified and EPA-certified) | Approx. 60 (1-4 samples taken from each home across 3 winters) |
| McNamara et al. [31] | 2013-USA | 50 | Real-world | Wood stove (Non-EPA certified ‘older model’) | Not provided (4 separate 48h sampling visits over 2 winters) |
| Canha et al. [16] | 2014 -Portugal | 1 | Real-world | Wood stove (‘slow combustion stove’) | 1 |
| Salthammer et al. [35] | 2014-Germany | 7 | Real-world Wood stove (‘closed’) | 6 Wood stove (‘open’)1 | 3 days for each stove |
| Piccardo et al. [18] | 2014-Italy | 9 | Real-world | Wood stoves | 183 |
| Semmens et al. [17] | 2015-USA | 96 | Real-world | Wood stoves (‘older models’ without ‘modern control features focused on emission reduction’) | 192 (each stove used twice) |
| Vicente et al. [30] | 2015-Portugal | 1 | Lab-conditions | Wood stove (‘stainless steel with a cast iron grate’) | Not provided |
| Mitchell et al. [29] | 2016-UK and Ireland | 1 | Lab-conditions | Multi-fuel stove (‘fixed grate stove with a single combustion chamber’) | 8 |
| Wang et al. [19] | 2020-China | 5 | Lab-conditions(1) Real-world(4) | Coal stoves (Real world—‘steel stoves, cylindrical burning chamber, connected to a chimney’) | Not provided |
| Vicente et al. [20] | 2020-Portugal | 2 | Lab-conditions | Open fireplace and wood stove | 7 (4 open fire, 3 wood stove) |
| Chakraborty et al. | 2020-UK | 20 | Real-world | DEFRA-certified wood (14)- DEFRA-certified multi-fuel (5)- Defra-compliant open fire (1) | 260 |
The stoves were installed in a house but used under controlled conditions; 280 uses in total but 20 removed due to incomplete data.
2. Materials and Methods
2.1. Sampling Area and Study Design
Sheffield ( N W), the chosen study site that is shown in Figure 1a, is a geographically diverse city that is located in the county of South Yorkshire, England. Built on several hills, it is situated at an elevation of 29 m–500 m above sea level, covers a total area of 367.9 km, and it has a growing population of 582,506 [36]. Sheffield has a temperate climate; July is considered to be the hottest month, with an average maximum temperature of 20.8 °C and January–February to be the coldest months. Air pollution in the city is primarily from road transport and industrial emissions and, to a lesser extent, fossil fuels run processes, such as energy supply and commercial or domestic heating systems [37].
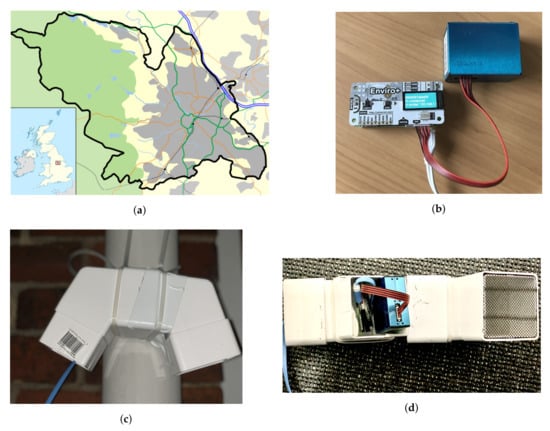
Figure 1.
Study region and the hardware setup. (a) Study Site: Sheffield Region, England; (b) Enviro+: A sample Indoor Air Quality Unit; (c) A sample Outdoor Air Quality Unit attached to a drainpipe outside a participant’s house; and, (d) Enviro+ inside the casing for Outdoor Air Quality monitoring.
Twenty households with solid fuel stoves were recruited between January and April 2020. An indoor and outdoor low-cost air quality monitor was installed in each of the houses. The indoor sensor was placed at a minimum of 3 m distance from the wood burner for safety, but in the same room. The outdoor unit was put in weatherproof casing and then attached to a window or drain pipe outside of the house (see Figure 1c). Data from each household were collected over a total period of four weeks. Data were recorded on days when stoves were used and left unused, thus providing two groups of data. The control group contained 10 users who had stoves and, over a 30 day period, used them around 30% of the time. Control group data were taken from 20 days of non-usage. In total, 10 out of the 20 participants were identified as the control users for the study.
Pollutants that were measured real-time for both indoors and outdoors were PM, PM, PM, PNC (0.3 m–1 m), Nitrogen Dioxide (NO), Carbon Monoxide (CO), and Ammonia (NH). The meteorological parameters include temperature, Relative Humidity, and Atmospheric Pressure. The data were sampled every 145 s. Data for NO, CO, and NH were omitted for research purposes and only visualised as trend levels due to the lack of calibration instruments. For indoor air pollution levels, the focus of our analysis was and .
One participant from each household completed a survey prior to the measurement period and maintained a research diary throughout the study. Among other data, the research diary recorded stove usage timings, indicating when the stove was lit and when the last piece of fuel was added, type and total amount of fuel, and type and total amount of kindling used each time the stove was active. Any other activities carried out during stove use, such as cooking or lighting of candles, was also recorded. The air pollution level indoors was calculated between the time that the stove was lit until one hour after the last piece of fuel was added. This was done to allow for the complete combustion of the fuel that was fed to the stove.
Each participant was provided with a tablet computer. This displayed a dashboard containing real-time information on indoor and outdoor pollution levels that were collated from their sensors. A state-of-the-art cloud-based dashboard was built for each participant, as shown in Figure 2. The data from the monitoring units were sent to the cloud based server that was hosted by the University of Sheffield, which was then displayed on the dashboard. The information refreshed by default every minute. The graph panels plotted over a period of 30 days displayed daily average, minimum, and maximum values of each pollutant. Real-time sensor readings were also made available in the form of dynamic gauges.
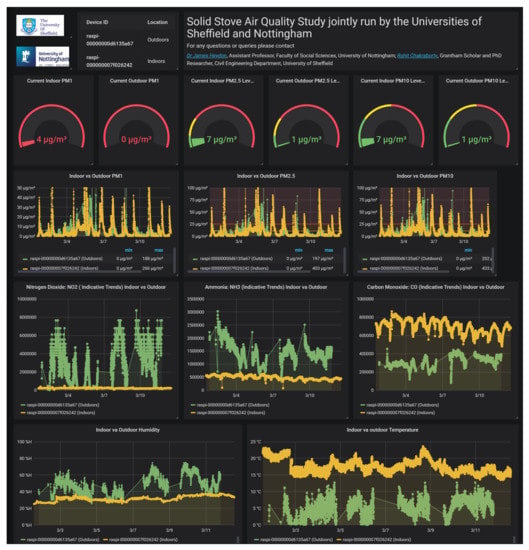
Figure 2.
A sample dashboard displayed on the tablet.
2.2. Sensor Validation and Correction: Accuracy, Evaluation and Limitations
The Urban Flows Observatory [38] at the University of Sheffield have developed Enviro+ (Figure 1b), an air quality measurement device, in collaboration with Pimoroni, which is a local electronics company. Enviro+ is a pHat, which is an add-on board that sits on top of raspberry pi Zero and is suitable for both indoor and outdoor air quality measurement. Sensors onboard this pHat include a BME280, which is a weather sensor monitoring temperature, pressure. and relative humidity, an LTR-559 light and proximity sensor, a MICS6814 analog gas sensor monitoring NO, CO and NH, ADS1015 analog to digital converter (ADC), a MEMS microphone for noise measurement, and a 0.96“ colour LCD (160 × 80) for display. A connector for a particulate matter (PM) sensor is also available onboard, to which was connected the low-cost optical sensor PMS5003 (Plantower) Enviro+ with the connected PMS5003, which was used to conduct the particulate level measurement. Enviro+ with the connected PMS5003 was housed in a casing and installed outside the house for outdoor air pollution measurements (Figure 1c).
All of the units were collocated with Sheffield City Council’s Reference Air Quality Monitoring station at Lowfield four weeks prior to the study. The high end Palas Fidas 200 instrument installed at Lowfield Station by Sheffield City Council was used as a reference in order to correct the PMS5003 sensors measurement.
The procedure for correction of the collocated sensors is discussed below:
- Raw data, including , , Temperature (T), and Relative Humidity (RH), were received every 160 s. This was converted to hourly averages in order to match the reference station data, because only hourly reference data are publicly available.
- The hour average was excluded if less than 90% of the measurements were available in that hour average.
- Humidity Correction: concentrations can be relatively high from low-cost PM sensors at high RH levels. The hygroscopic growth of particles at high humidity, along with mist and fog particles, makes it detectable as particulates, as previously reported [39,40]. A Nephelometer, such as PMS5003, measures particulates based on light scattering principle. The particulates’ refractive indices are dependent on relative humidity [41] and, thus, affects the sensor readings. While ambient temperature directly has a very limited role in sensors performance [40] (apart from extreme temperature), it affects the measurements indirectly. Jayaratne et al. [39] reports that, when the ambient temperature reaches the dew point temperature, the conditions become suitable for the formation of fog droplets in the air and fall within the detection size of such sensors. Figure 3 presents an example of the relationship between RH values and PM2.5 data from PMS5003 collocated. A Humidity-based bias correction approach was taken, as described here [42], while using the -Köhler theory [43]. The hygroscopic growth factor g (RH), as defined in Equation (1), where is the diameter of the dry particle and is the diameter of the particle at a given RH value.
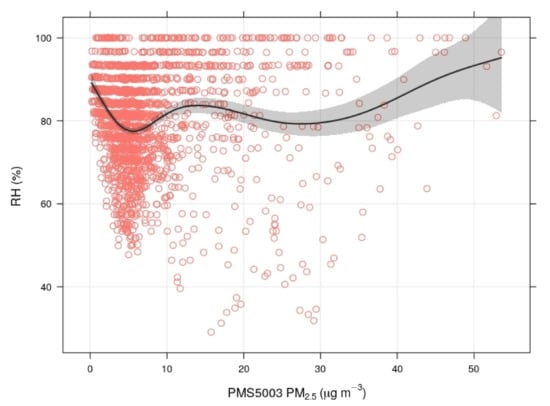 Figure 3. Distribution of outputs on relative humidity (RH): LCS PMS5003.RH dependence [44] was established while using Equation (2), as follows:where is a parameter that describes the degree of hygroscopicity of a particle and taken as 0.62, which is suitable for Sheffield [45]. Therefore, using Equations (1) and (2), hygroscopic growth factor g (RH) was calculated in order to obtain the humidity correction factor.Two additional PMS5003 have also been collocated at the same station permanently since 23rd April 2019 have been used to ensure correction factor accuracy. A conditional Quartile plot in Figure 4 below uses the corresponding values for both reference and low cost sensors, splitting the values into evenly spaced bins. For each low cost sensor value bin, the corresponding reference sensor values are identified and the median, 25/75t,h and 10/90 percentile (quantile) are calculated for that bin. The data are plotted in order to show how these values vary across all bins. The blue line shows the results for a perfect model i.e., zero error between low cost PMS5003 sensor and the reference Palas FIDAS 200 sensor. In the plot in Figure 4, the red line shows that the LCS tends to slightly over-report for (NMB ≈ 0.2–0.3).
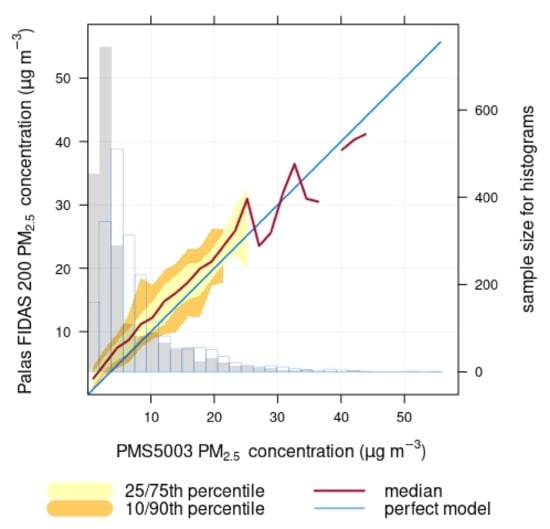 Figure 4. Conditional Quartile plot evaluating performance of low cost PMS5003 sensor/reference PALAS FIDAS sensor by showing how the corresponding sensor values vary together.
 - Concentration Range Correction: a correction was applied based on the relationship between pollutant concentration range and sensor performance. Multivariate Linear regression model were used in order to establish the relationship. Palas Fidas 200: is used as the dependent variable and PMS5003 sensor data: , T, and RH as predictors, as shown in Equation (3)., and are calculated by training with the model generated. To note, is not used here, as it is obtained from the previous step.
- Evaluation of LCS: PMS5003 corrected data are evaluated by comparing to the Palas Fidas 200 values in the holdout data set. From the field evaluation through collocation between January–April 2020, PMS5003 showed high linear correlation with reference instrument with value 0.81 for the hourly averaged data. This is an improvement in accuracy when compared to the findings from previous studies on evaluating Plantower sensors [10,46] with values lying between 0.71–0.77 for PMS5003 without applying any correction factors. The inter-sensor comparison showed a high correlation, with an value between 0.98–0.99. Figure 5, below, shows the scatter plot between the reference and corrected PMS5003 sensor.
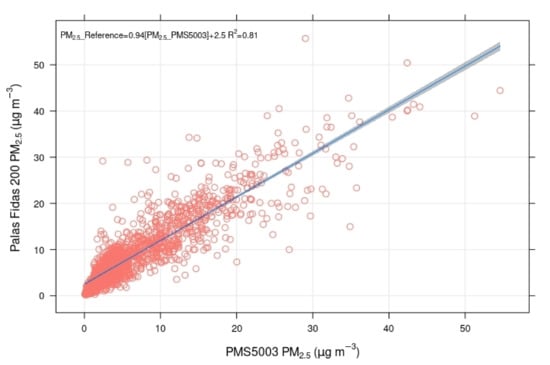 Figure 5. Scatter plot between PMS5003 (LCS) versus (vs.) Palas Fidas 200 (Reference Sensor) output: hourly averaged .
Figure 6, below, also shows a consistently high linear correlation factor with an average value of 0.81 when analysed and split with relative humidity as the third variable.
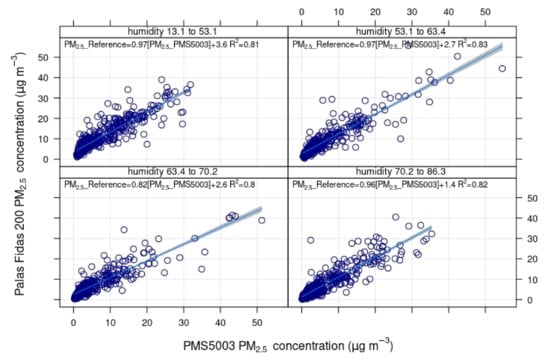
Figure 6.
Scatter plot between PMS5003 (LCS) versus (vs.) Palas Fidas 200 (Reference Sensor) output: hourly averaged with type humidity.
Table 2, below also shows the value for different concentrations of and compared to the Daily Air Quality Index (DAQI) bands and breakpoints for , as set by DEFRA’S Air Quality Expert Group [47]. During the field evaluation, there was not enough data to evaluate the sensor for high and very high conditions (DAQI = 8–10).

Table 2.
Concentration band analysis showing averaged coefficients of determination ( ) for hourly averages of from PMS5003 sensors against Reference Sensor Palas FIDAS 200 and compared to the Daily Air Quality Index (DAQI) bands.
Sensor Limitations
The reference station does not provide and PNC data and, therefore, this data cannot be subjected to this correction. Further research is underway in order to evaluate sensor performance and evaluation in this specific regard. Finally, the study has not been able to account for UFP due to these sensors being unable to detect or measure particles below 300 nm. As such, the measured PNC has been limited to a size of 0.3 m–1 m.
2.3. Monitoring Outdoor Air Quality and Adjusting for Weather: A Generalized Boosted Regression Model
While the data that were collected from the indoor unit (Figure 1b) were used to analyse the pollution emissions from the stoves, the first purpose of the outdoor unit (Figure 1c) was twofold. First, it was used for the general monitoring of outdoor PM levels. This allowed for the detection of any unusual levels of outdoor pollution that could impact the air quality indoors. Second, the sensors could indicate whether the outdoor air quality was also being influenced during stove use. While the outdoor sensors served the first purpose, achieving the second was complicated by multiple covariates, such as meteorological factors, local garden waste burning, neighbours using wood stoves, and traffic.
Figure 7 plots the average weekly variation of outdoor and levels of the participants houses over the three-month period.
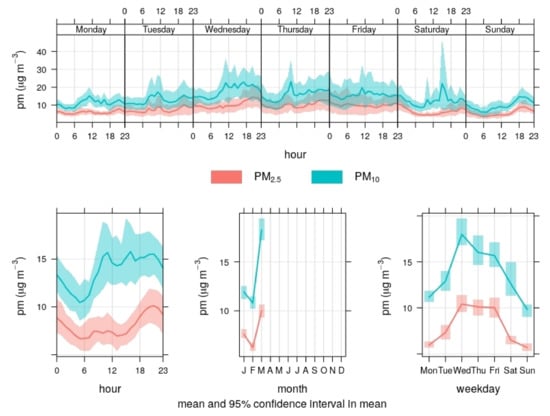
Figure 7.
Outdoor Particulate Matter Variation plot.
Meteorology plays a crucial role in the estimation of levels of particulate matter. Therefore, when trying to understand the trends of outdoor pollution levels, it can be very challenging to determine whether a pollution episode is caused by local emissions or meteorology. Therefore, a Machine Learning (ML) based algorithm based on Generalised Boosted Regression Model [48] was used in order to explore and adjust for the non-linear relationships between the meteorological covariates and particulate matter levels. The partial dependencies in Figure 8 show the relationship between and the covariates that were used in the model while holding the value of other covariates at their mean levels. As can be seen, wind speed (16.1%) and wind direction (12.7%) play a crucial role in determining levels; hence, its impact should be accounted for in order to better understand the air quality around the participating households.
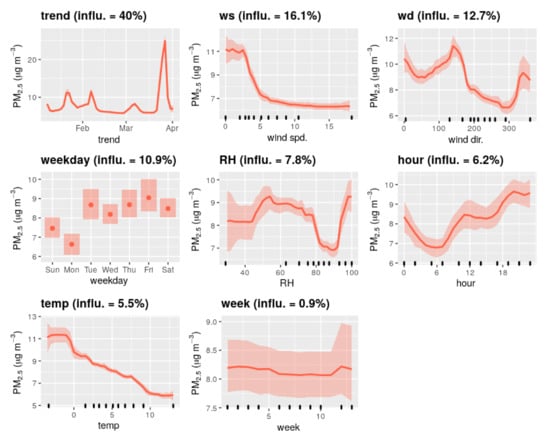
Figure 8.
Influence of different covariates on outdoor levels.
The popular R deweather and openair package [49] was used in creating the prediction model and plotting. The model is formed, as shown in Equation (4).
where is the mean hourly wind speed, is the mean hourly wind direction (degrees, clockwise from the north), and is the mean hourly temperature (C). Variables representing hour of the day, , day of the week, , and day of the year, were also considered for the model development.
From Figure 7 and Figure 8, it is evident that, during weekdays, the outdoor levels of and are higher than during the weekend. It can also be seen that the levels are considerably higher outside during the evening, which corresponds to the usage pattern of stoves by participants. This indicates that even DEFRA-certified solid fuel stoves could affect the local air quality outdoors. A more sophisticated source apportionment study is required in order to further investigate this. The high level of ( and gradually decreases throughout the night, with the lowest levels being attained at around 5:30 am–6:00 am GMT (see Figure 7 hourly plot). Ten-fold cross validation [50] was used for evaluating the model performance and the model fitting results are shown in Figure 9.
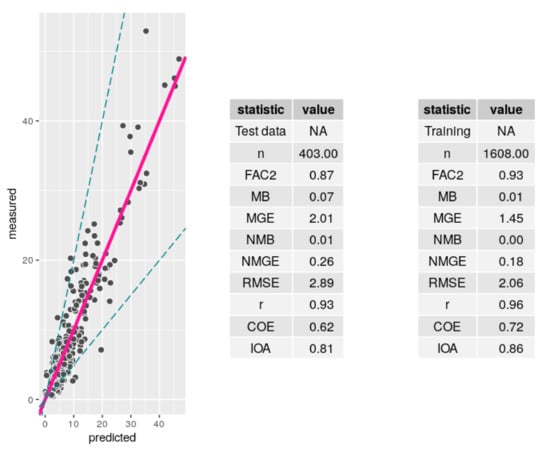
Figure 9.
Generalised Boosted Regression Model to explore and remove weather impact on outdoor pollution level: Model Evaluation.
2.4. Data Processing and Storage
The real-time sensor data are pushed to a cloud-based database over WiFi while using a Python script running on the Raspberry Pi Zero. The data are stored in a database designed and installed in a virtual server hosted by the University of Sheffield. These data are then made available to be accessed through an Application Programming Interface (API), called Enviro-API, developed for data retrieval and displayed on the dashboard. The API developed along with the database had two goals:
- The ability to ingest a high volume of time series data with dynamic data from the sensors.
- The ability to return this time series data with basic querying parameters such as sensor ID and timestamps.
This allowed for us to create an end-to-end secure infrastructure for real-time sensor data collection, storage, and retrieval system for our study.
2.5. Data Analysis
Missing data have been treated. The usage days were only included if 90% of the hourly data were available. Data analyses were performed while using Excel, R, and Python programming languages. The statistical significance of the results was calculated based on Welch’s t-test (Moser & Stevens, 1992) whlie using the standard equations:
and the degree of freedom of Welch t-test is calculated, as follows:
- A and B represent the Control and Experimental group.
- and represent the means of groups of samples A and B, respectively.
- and represent the sizes of group A and B, respectively.
- and are the standard deviation of the two groups A and B, respectively.
The strength of correlations was classified as weak (±0.1–0.3), moderate (±0.3–0.5), and strong (±0.5–1). Data were removed during such periods while stoves were lit in order to avoid data being influenced by emissions from cooking, burning candles, or incense sticks. The influence of outdoor air pollution on indoor emissions data was anticipated, but adjustment was unnecessary, due to the absence of notable outdoor pollution levels.
2.6. Study Limitations
The study exhibits several limitations that are associated with variability in the research setting due to its exploratory design and focus on real-world stove use. First, the study does not account for the impact of room size, seal, ventilation, and dwelling age on the duration of air pollution exposure witnessed. Nor does it relate the levels of air pollution to specific stages of the combustion cycle. Further study is needed in order to understand these aspects of indoor air pollution, requiring a sampling frame that is determined by more than the stove type and a research design that is appropriate for lab conditions. Second, despite using outdoor sensors to illustrate that the indoor air pollution is not coming from outside sources (see Section 3.2), further details on air pollution at the indoor-outdoor interface were beyond the design of this study. This is a characteristic of air pollution research more broadly, as reflected in the UK government’s recent multi-million-pound call for research that is able to develop solutions to air pollution problems at the indoor/outdoor interface [51]. Relatedly, windspeed could influence the infiltration rate of outdoor air indoors, but, again, this was beyond the remit here. As such, further research into this relationship is recommended. Finally, the influence of sensor data on participant stove management practice has not been explored in detail. This will be drawn out more fully in a separate paper.
3. Results and Discussion
Table 3 summarises the daily and mean, and hourly peak and mean from 20 households and 260 stove usages, along with the statistical analysis and distribution. Data on the average pieces of fuel per use (FP) and kindling per use (KP), along with the average duration of use, have also been presented. The hourly indoor mean and concentrations that were observed during stove usage ranged from 2.27 g/m and 1.11 g/m to 47.60 g/m and 36.15 g/m, respectively, with a high coefficient of variation 0.9 for and 0.94 for . The hourly PNC average that was observed indoors in the particle size range (0.3–1 m diameter) was 2607 particles/0.1 litre (L) of air when each stove was used, but the hourly peak PNC average observed was 4345 particles/0.1 L with an hourly maximum of 9978 particles/0.1 L. The average number of fuel pieces (9.58 wooden logs) and kindling (8.37 pieces) used varied significantly between the households, with a coefficient of variation 0.69 and 0.67, respectively. The average duration of use was approximately 4 h, with most households using their stove between 6 pm and 10 pm.

Table 3.
Statistical summary and distribution of hourly mean and peak particulate matter (PM) (g/m), daily usage fuel pieces and kindling pieces, and Pearson’s r value.
3.1. Increase in Indoor Pollution Levels during Stove Use
The findings indicate that average indoor (mean = 12.21 g/m SD = 10.36, 95%CL: 8.16, 12.68) and (mean = 8.34 g/m SD= 7.64, 95%CL: 5.29, 9.42) are higher when the stoves are lit when compared to the period in which they are not in use with levels (mean = 4.12 g/m SD= 3.61, 95% CL: 2.82, 4.82), and levels (mean = 2.54 g/m SD= 2.61, 95%CL: 1.59, 3.04). Statistical analysis estimates that the difference in concentrations between these two groups is significantly different for both (Welch’s t(57.0448) = , p < 0.0001) and (Welch’s t(56.6291) = , p < 0.0001).
The analysis in the three quartiles—(i) <25 percentile, (ii) >25 <75 percentile, and (iii) >75 percentile, representing low, medium, and peak concentrations, showed an increase for (223.92%, 241.23%, 127.84%) and (254.38%, 238.02%, 209.32%). The overall average concentrations were higher for by 196.23% and by 227.80% when used.
Figure 10 density rug plots show the distribution and levels of and for users. Figure 11 compare the control group’s indoor pollution levels with the experimental group. For reasons of visualisation, scaling the x-axis in the graph (see Figure 10) is limited to 60 g/m.
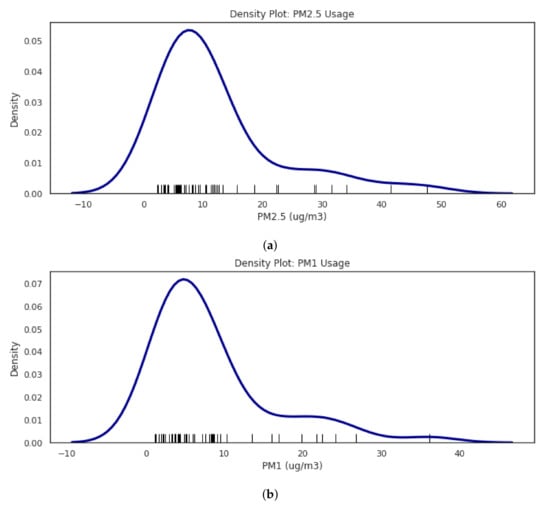
Figure 10.
Conditional distribution density plot shows the overall indoor concentration levels during the usage of wood burners. (a) distribution; (b) distribution. Note. While the analysis includes the full range of data, for display purposes only the x-axis is truncated to 60 g/m.
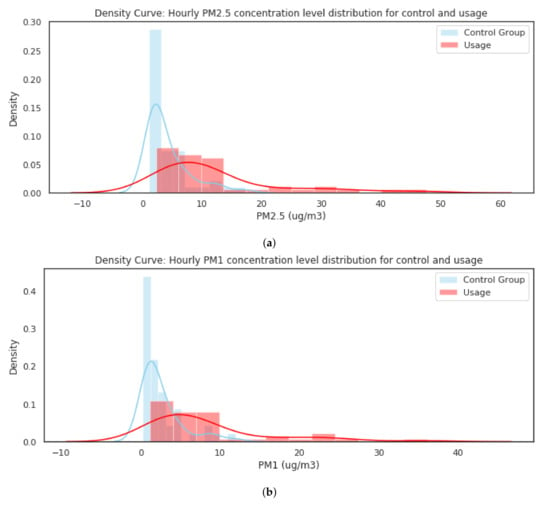
Figure 11.
Control group compared to usage shows higher indoor concentration levels during the usage of wood burners with larger variation. (a) distribution comparison; (b) distribution. Note. While the analysis includes the full range of data, for display purposes only the x-axis is truncated to 60 g/m.
Figure 10 reveals that the levels of PM that people are exposed to can vary, with a maximum peak average of 47.60 g/m for and 36.15 g/m for . While calculating the averages smooths the graph, these findings demonstrate that some users are exposed to maximum values of up to 160 g/m. Control users experience much lower indoor particulate levels when their stoves are not lit when compared to users that do, as indicated by Figure 11.
In Figure 10, comparing the concentration levels between usage and non-usage days for the control group also illustrates an increase for (139.52%, 327.48%, 320.66%) and (132.16%, 413.11%, 366.56%) when stoves are used. The overall average concentrations were higher for by 432.91% and by 281.22%.
3.2. Indoor Outdoor Interface: Average Indoor Levels Are Higher and Weakly Correlated with Outdoor Average PM Levels
The average indoor levels are higher (mean = 12.21 g/m SD = 10.36, 95%CL: 8.16, 12.68) than the outdoor levels (mean = 7.99 g/m SD= 5.51, 95%CL: 3.60, 8.93) during stove usage. From Figure 12, below, it is clear that indoor and outdoor values vary significantly between 10–45 g/m concentration levels. This variation is because the mean and hourly peak indoor PM lies within this range and, thus, the indoor levels are much higher than the corresponding outdoor levels. Further analysis of average indoor and outdoor levels indicated a weak correlation ( = 0.19) between them, which suggests that outdoor air quality is not a driving factor behind the high indoor pollution levels that were seen during stove usage.
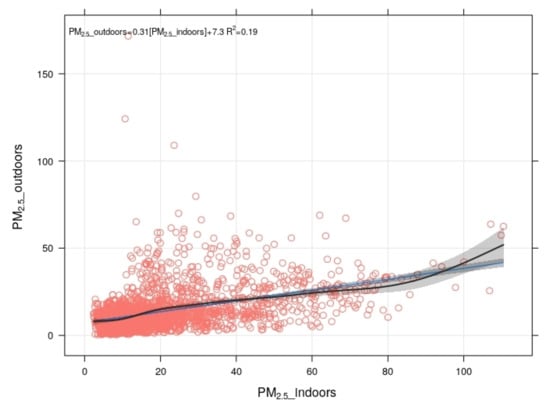
Figure 12.
Indoor vs. Outdoor .
While we acknowledge that indoor levels can impact outdoor air quality, no measurements were taken from the chimney/flue. The air quality sensor outside the house indicates immediate outdoor air pollution levels and, thus, it is difficult to measure any leakage at the interface. Future research studies should focus on indoor air pollution and its influence on outdoor air quality in order to address this limitation of our study.
3.3. Hourly Peak PM Average Higher than Daily PM Average
The analysis of Table 3 shows hourly peak and is strongly correlated with daily mean and (r = 0.75). Statistical analysis shows that the hourly peak mean (27.34 g/m, 95% CL:18.38, 37.77) and (19.44 g/m, 95% CL:12.04, 28.30) are significantly higher than the daily mean (12.21 g/m, 95% CL: 8.16, 13.68) and (8.34 g/m, 95% CL: 5.29, 9.43) by 123.91% and 133.09%, respectively. Hourly and peak mean and the daily mean concentrations varied between households with the minimum and maximum, being 19.2 g/m–86.83 g/m and 17.79 g/m–84.47 g/m, respectively.
There exists high variation in exposure concentrations, concerning both short peaks and daily levels. This characteristic is related to the "real-world" nature of the study. The research diary tool provided data on not only the amount of fuel and kindling pieces used, but also their type. On average, participants used 9.58 pieces of solid fuel and 8.32 pieces of kindling per use. The number of fuel pieces used varied between a minimum of seven to a maximum of 40, while kindling varied between a minimum of one and a maximum of 32. All participants used dried and seasoned logs, but the sizes varied. There was also a diversity of kindling used, taking the form of firelighters, newspapers, balls of paper, twigs, sawdust, packing cardboard, greeting cards, and even empty egg boxes. Echoing the findings of existing studies [20,35,52]. This means that the same wood burner may emit different levels of indoor air pollution depending on the quantity and type of fuel and kindling used. While suggesting a link between indoor air pollution and fuel quantity, and type of fuel and kindling, following other studies in the next section, demonstrates that this is actually linked with the stove door being opened.
Epidemiology studies and policymaking are focused around hourly average concentration monitoring by regulatory air quality stations. This leads to the omission of short-term high exposure through the “flooding” of indoor spaces with and . Very few studies have reflected on short term peak concentration exposure. Lin et al.’s study [27] associated increased risk factors with hourly peak concentrations of . Similarly, Delfino et al. [53] associated peak PM levels with Asthma attacks in children, but in outdoor environments. Therefore, the present study encourages future researchers to study the occurrences and effects of relatively short-term peak PM exposure on human health.
3.3.1. Hourly Peak Average PM Has a Moderate Correlation to the Pieces of Fuel Used
While Table 3 indicates a weak correlation between fuel pieces and mean (r = 0.17), and with (r = 0.15), comparing the hourly peak concentration of (r= 0.44) and (r = 0.43) exhibits a moderate correlation with fuel pieces. The scatter plots in Figure 13 and Figure 14 chart the relation between peak hourly levels to the possible co-factors of fuel amount and duration of usage. In Figure 13a,b, higher concentration peak levels are clustered towards the left of the x-axis. This indicates a non-linear relationship with fuel pieces.
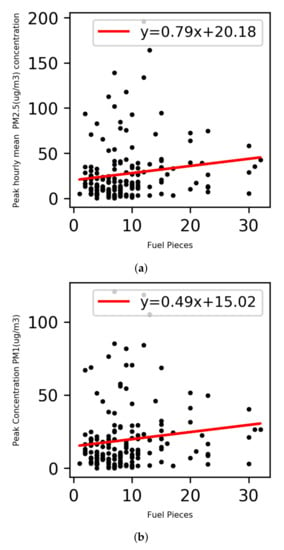
Figure 13.
Scatter plot between PM concentration and Fuel Pieces. (a) vs. fuel pieces; (b) vs. fuel pieces;
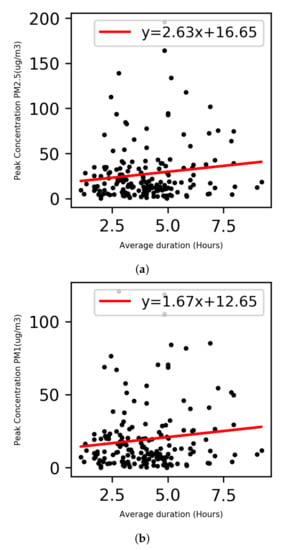
Figure 14.
Scatter plot between PM concentration and duration.(a) vs. duration; (b) vs. duration.
While correlation between fuel pieces and hourly mean concentration is weak, it is stronger when compared to the hourly peak concentration. Therefore, the findings suggest that the peak hourly concentrations are often higher by a minimum of 250% and a maximum of 400% when participants have refuelled their stove more than once during a usage compared to one refuel or none at all. As such, the findings indicate that the ‘flooding’ of indoor space occurs as a result of the stove door being opened for refuelling. This accords with several existing real-world [21,22,35], and lab-based [20] studies into stoves outside the UK. While the findings point to the opening of the stove door as the origin for indoor PM emissions, further lab-based research is required into how this might relate to duration, timings, and the point in the burn cycle at which the opening occurs.
The hourly peak concentrations explain the shape of the rug plots, as seen in Figure 10. The shape of the curves exhibit a distinct broad frequency distribution in the lower PM concentration. This indicates that most of the sensor readings are lower during stove use, but there are also smaller spikes towards the right of x-axis, indicating sensor readings that correspond to higher levels of PM pollution. A ’leakage’ would result in a more uniform shape, and, thus, the presence of the smaller spikes cannot be explained. This echoes Salthammer et al.’s findings [35] and provides further support for the theory of opening doors being the cause of the indoor air pollution seen rather than a leakage, which appears to be more common to open fires than ‘closed’ stoves (see [54]). The PM fraction gets dispersed quickly throughout the room due to its smaller size, reverting to lower hourly average concentrations.
3.3.2. Hourly Peak Averages Illustrate a Moderate Correlation with Duration of Use
Table 3 also illustrates a non-linear relationship between the duration of use and mean (r = 0.017). This is similar to (r = 0.021), although, again, comparing the hourly peak concentrations of (r= 0.4) and (r = 0.38), it exhibits a moderate correlation with the duration of use. The scatter plots in Figure 14a,b also reflect this, with higher levels of peak values being continuously registered during the stove use.
Longer usage is associated with greater numbers of fuel pieces used. This result supports the explanation for the ’flooding’ phenomenon observed, with higher short-term peak concentrations being seen during longer periods of use, because these periods are sustained by more refueling actions. This accords with [20], who also found the lighting and refueling aspects of stove management to form the main pollutant-generating phases of operation.
4. Conclusions
The present study aimed to understand the extent to which PM was emitted indoors and under real-world conditions by DEFRA-certified residential stoves. The findings indicate that real-world indoor PM exposure from these stoves is higher when lit as compared to the period in which they are not in use. When compared to periods of non-use, the overall average concentrations were higher for by 196.23% and by 227.80%. Peak hourly concentrations of PM were often found to be higher by 250–400% when the participants had refueled their stove more than once during a single usage. The findings also provide information on PNC, with an average hourly peak of 9978 particles/0.1 L emitted during a single usage. These ‘flooding’ events correlated with the opening of the stove door, which indicated that such incidents occurred as fuel was added. Data from outdoor sensors clarified that this was not originating from outdoors. On the basis of these results, it is recommended that DEFRA testing standards be modified in order to account for these normative health risks. The PM that is released into the home is not an aberration from normal use, but results directly from it. This is because real-world operation cannot occur without opening the stove door. It may be that with regulatory encouragement stove designs can be modified in a way that limits such instances. In the meantime, or in the event that appropriate modification cannot be achieved, it is also recommended that new residential stoves be accompanied by a health warning at the point of sale in order to indicate the normative health risks posed to users.
Author Contributions
Conceptualization, R.C. and J.H.; methodology, R.C. and J.H.; formal analysis, R.C.; investigation, R.C. and J.H.; data curation, R.C.; writing—original draft preparation, R.C.; writing—review and editing, R.C., J.H., L.M. and M.M.; visualization, R.C.; supervision, L.M. and M.M.; project administration, R.C. and J.H.; funding acquisition, R.C., L.M., M.M. and J.H. All authors have read and agreed to the published version of the manuscript.
Funding
This research received external funding from The Grantham Centre for Sustainable Futures, The University of Sheffield and The University of Nottingham. The APC was also funded by the Grantham Centre for Sustainable Futures.
Acknowledgments
We are grateful to Urban Flows Observatory, The University of Sheffield for funding the sensors and The University of Nottingham for funding tablet computers. We are grateful to The Grantham Centre for Sustainable Futures for funding the research and APC charges. We would like to thank the Associate Editor and Reviewers for constructive suggestions and valuable comments, helping us to improve this work.
Conflicts of Interest
The authors declare no conflict of interest.
Abbreviations
The following abbreviations are used in this manuscript:
| n | the number of complete pairs of data. |
| FAC2 | fraction of predictions within a factor of two |
| MB | mean bias. |
| MGE | mean gross error. |
| NMB | normalised mean bias. |
| NMGE | normalised mean gross error. |
| RMSE | root mean square error. |
| r | Pearson correlation coefficient. |
| COE | the Coefficient of Efficiency |
| IOA | the Index of Agreement |
References
- World Health Organisation. 2014. Available online: https://www.who.int/mediacentre/news/releases/2014/air-pollution/en// (accessed on 14 June 2020).
- Martins, N.R.; da Graça, C.G. Impact of PM2.5 in indoor urban environments: A review. Sustain. Cities Soc. 2018, 42, 259–275. [Google Scholar] [CrossRef]
- Fu, P.; Guo, X.; Cheung, F.M.H.; Yung, K.K.L. The association between PM 2.5 exposure and neurological disorders: A systematic review and meta-analysis. Sci. Total Environ. 2019, 655, 1240–1248. [Google Scholar] [CrossRef] [PubMed]
- Schraufnagel, D.E.; Balmes, J.R.; Cowl, C.T.; De Matteis, S.; Jung, S.H.; Mortimer, K.; Perez-Padilla, R.; Rice, M.B.; Riojas-Rodriguez, H.; Sood, A.; et al. Air Pollution and Noncommunicable Diseases: A Review by the Forum of International Respiratory Societies’ Environmental Committee, Part 2: Air Pollution and Organ Systems. Chest 2019, 155, 417–426. [Google Scholar] [CrossRef]
- DEFRA. Clean Air Strategy 2019, 1, 9. Available online: https://assets.publishing.service.gov.uk/government/uploads/system/uploads/attachment_data/file/770715/clean-air-strategy-2019.pdf (accessed on 9 July 2020).
- Department for Business, Energy & Industrial Strategy. Summary Results of the Domestic Wood Use Survey; Department for Energy and Climate Change: London, UK, 2016; pp. 67–80. Available online: https://assets.publishing.service.gov.uk/government/uploads/system/uploads/attachment_data/file/833061/Summary_results_of_the_domestic_wood_use_survey_.pdf (accessed on 9 July 2020).
- Font, A.; Fuller, G. Report: Airborne Particles from Wood Burning in UK Cities; Environmental Research Group -King’s College: London, UK, 2017; pp. 1–52. Available online: https://uk-air.defra.gov.uk/library/reports?report_id=953 (accessed on 14 July 2020).
- Air Quality Expert Group. The Potential Air Quality Impacts from Biomass Combustion; Air Quality Expert Group: Defra, UK, 2017; p. 80. Available online: https://uk-air.defra.gov.uk/assets/documents/reports/cat11/1708081027_170807_AQEG_Biomass_report.pdf (accessed on 14 July 2020).
- Eisentraut, A.; Adam, B.; International Energy Agency, Paris. Heating without global warming. Featured Insight. 2014. Available online: https://www.iea.org/reports/heating-without-global-warming (accessed on 15 July 2020).
- Bertrand, A.; Stefenelli, G.; Bruns, E.A.; Pieber, S.M.; Temime-Roussel, B.; Slowik, J.G.; Prévôt, A.S.; Wortham, H.; El Haddad, I.; Marchand, N. Primary emissions and secondary aerosol production potential from woodstoves for residential heating: Influence of the stove technology and combustion efficiency. Atmos. Environ. 2017, 169, 65–79. [Google Scholar] [CrossRef]
- Winijkul, E.; Bond, T.C. Emissions from residential combustion considering end-uses and spatial constraints: Part II, emission reduction scenarios. Atmos. Environ. 2016, 124, 1–11. [Google Scholar] [CrossRef]
- Nyström, R.; Lindgren, R.; Avagyan, R.; Westerholm, R.; Lundstedt, S.; Boman, C. Influence of Wood Species and Burning Conditions on Particle Emission Characteristics in a Residential Wood Stove. Energy Fuels 2017, 31, 5514–5524. [Google Scholar] [CrossRef]
- Avagyan, R.; Nyström, R.; Lindgren, R.; Boman, C.; Westerholm, R. Particulate hydroxy-PAH emissions from a residential wood log stove using different fuels and burning conditions. Atmos. Environ. 2016, 140, 1–9. [Google Scholar] [CrossRef]
- Win, K.M.; Persson, T. Emissions from residential wood pellet boilers and stove characterized into start-up, steady operation, and stop emissions. Energy Fuels 2014, 28, 2496–2505. [Google Scholar] [CrossRef]
- Traynor, G.W.; Apte, M.G.; Carruthers, A.R.; Dillworth, J.F.; Grimsrud, D.T.; Gundel, L.A. Indoor air pollution due to emissions from wood-burning stoves. Environ. Sci. Technol. 1987, 21, 691–697. [Google Scholar] [CrossRef]
- Canha, N.; Almeida, S.M.; Freitas, M.d.C.; Wolterbeek, H.T.; Cardoso, J.; Pio, C.; Caseiro, A. Impact of wood burning on indoor PM2.5 in a primary school in rural Portugal. Atmos. Environ. 2014, 94, 663–670. [Google Scholar] [CrossRef]
- Semmens, E.O.; Noonan, C.W.; Allen, R.W.; Weiler, E.C.; Ward, T.J. Indoor particulate matter in rural, wood stove heated homes. Environ. Res. 2015, 138, 93–100. [Google Scholar] [CrossRef] [PubMed]
- Piccardo, M.T.; Cipolla, M.; Stella, A.; Ceppi, M.; Bruzzone, M.; Izzotti, A.; Valerio, F. Indoor pollution and burning practices in wood stove management. J. Air Waste Manag. Assoc. 2014, 64, 1309–1316. [Google Scholar] [CrossRef] [PubMed]
- Wang, D.; Li, Q.; Shen, G.; Deng, J.; Zhou, W.; Hao, J.; Jiang, J. Significant ultrafine particle emissions from residential solid fuel combustion. Sci. Total Environ. 2020, 715, 1–7. [Google Scholar] [CrossRef] [PubMed]
- Vicente, E.D.; Vicente, A.M.; Evtyugina, M.; Oduber, F.I.; Amato, F.; Querol, X.; Alves, C. Impact of wood combustion on indoor air quality. Sci. Total Environ. 2020, 705, 135769. [Google Scholar] [CrossRef] [PubMed]
- Allen, R.W.; Leckie, S.; Millar, G.; Brauer, M. The impact of wood stove technology upgrades on indoor residential air quality. Atmos. Environ. 2009, 43, 5908–5915. [Google Scholar] [CrossRef]
- Noonan, C.W.; Navidi, W.; Sheppard, L.; Palmer, C.P.; Bergauff, M.; Hooper, K.; Ward, T.J. Residential indoor PM 2.5 in wood stove homes: Follow-up of the Libby changeout program. Indoor Air 2012, 22, 492–500. [Google Scholar] [CrossRef]
- Chen, C.; Li, H.; Niu, Y.; Liu, C.; Lin, Z.; Cai, J.; Li, W.; Ge, W.; Chen, R.; Kan, H. Impact of short-term exposure to fine particulate matter air pollution on urinary metabolome: A randomized, double-blind, crossover trial. Environ. Int. 2019, 130, 104878. [Google Scholar] [CrossRef]
- Madsen, C.; Rosland, P.; Hoff, D.A.; Nystad, W.; Nafstad, P.; Næss, Ø.E. The short-term effect of 24-h average and peak air pollution on mortality in Oslo Norway. Eur. J. Epidemiol. 2012, 27, 717–727. [Google Scholar] [CrossRef]
- Darrow, L.A.; Klein, M.; Sarnat, J.A.; Mulholland, J.A.; Strickland, M.J.; Sarnat, S.E.; Russell, A.G.; Tolbert, P.E. The use of alternative pollutant metrics in time-series studies of ambient air pollution and respiratory emergency department visits. J. Expo. Sci. Environ. Epidemiol. 2011, 21, 10–19. [Google Scholar] [CrossRef]
- Bhaskaran, K.; Hajat, S.; Armstrong, B.; Haines, A.; Herrett, E.; Wilkinson, P.; Smeeth, L. The effects of hourly differences in air pollution on the risk of myocardial infarction: Case crossover analysis of the MINAP database. BMJ 2011, 343, 1–11. [Google Scholar] [CrossRef]
- Lin, H.; Ratnapradipa, K.; Wang, X.; Zhang, Y.; Xu, Y.; Yao, Z.; Dong, G.; Liu, T.; Clark, J.; Dick, R.; et al. Hourly peak concentration measuring the PM2.5-mortality association: Results from six cities in the Pearl River Delta study. Atmos. Environ. 2017, 161, 27–33. [Google Scholar] [CrossRef]
- Orellano, P.; Reynoso, J.; Quaranta, N.; Bardach, A.; Ciapponi, A. Short-term exposure to particulate matter (PM10 and PM2.5), nitrogen dioxide (NO2), and ozone (O3) and all-cause and cause-specific mortality: Systematic review and meta-analysis. Environ. Int. 2020, 142, 105876. [Google Scholar] [CrossRef]
- Mitchell, E.J.; Lea-Langton, A.R.; Jones, J.M.; Williams, A.; Layden, P.; Johnson, R. The impact of fuel properties on the emissions from the combustion of biomass and other solid fuels in a fixed bed domestic stove. Fuel Process. Technol. 2016, 142, 115–123. [Google Scholar] [CrossRef]
- Vicente, E.D.; Duarte, M.A.; Calvo, A.I.; Nunes, T.F.; Tarelho, L.; Alves, C.A. Emission of carbon monoxide, total hydrocarbons and particulate matter during wood combustion in a stove operating under distinct conditions. Fuel Process. Technol. 2015, 131, 182–192. [Google Scholar] [CrossRef]
- Mcnamara, M.; Thornburg, J.; Semmens, E.; Ward, T.; Noonan, C. Coarse particulate matter and airborne endotoxin within wood stove homes. Indoor Air 2013, 23, 498–505. [Google Scholar] [CrossRef] [PubMed]
- de Jesus, A.L.; Rahman, M.M.; Mazaheri, M.; Thompson, H.; Knibbs, L.D.; Jeong, C.; Evans, G.; Nei, W.; Ding, A.; Qiao, L.; et al. Ultrafine particles and PM2.5 in the air of cities around the world: Are they representative of each other? Environ. Int. 2019, 129, 118–135. [Google Scholar] [CrossRef]
- Penttinen, P.; Timonen, K.L.; Tiittanen, P.; Mirme, A.; Ruuskanen, J.; Pekkanen, J. Ultrafine particles in urban air and respiratory health among adult asthmatics. Eur. Respir. J. 2001, 17, 428–435. [Google Scholar] [CrossRef]
- Testing of Solid Fuel Stoves. 2013. Available online: https://www.bsria.com/uk/news/article/testing-of-solid-fuel-stoves (accessed on 15 July 2020).
- Salthammer, T.; Schripp, T.; Wientzek, S.; Wensing, M. Impact of operating wood-burning fireplace ovens on indoor air quality. Chemosphere 2014, 103, 205–211. [Google Scholar] [CrossRef]
- Sheffield City Council. 2011 Census First Results: Population Estimates; Sheffield City Council: Sheffield, UK, 2011; pp. 1–6. Available online: https://www.sheffield.gov.uk/content/dam/sheffield/docs/your-city-council/facts-figures/2011%20Census%20July%20Release%20-%20Population%20Estimates.pdf (accessed on 15 July 2020).
- Sheffield City Council. Air Quality: Action Plan; Sheffield City Council: Sheffield, UK, 2015; p. 76. Available online: https://www.sheffield.gov.uk/content/dam/sheffield/docs/pollution-and-nuisance/air-pollution/air-quality-management/Air%20Quality%20Action%20Plan%202015.pdf (accessed on 15 July 2020).
- Urban Flows Observatory. 2018. Available online: https://urbanflows.ac.uk/ (accessed on 17 July 2020).
- Jayaratne, R.; Liu, X.; Thai, P.; Dunbabin, M.; Morawska, L. The influence of humidity on the performance of a low-cost air particle mass sensor and the effect of atmospheric fog. Atmos. Meas. Tech. 2018, 11, 4883–4890. [Google Scholar] [CrossRef]
- Bulot, F.M.; Johnston, S.J.; Basford, P.J.; Easton, N.H.; Apetroaie-Cristea, M.; Foster, G.L.; Morris, A.K.; Cox, S.J.; Loxham, M. Long-term field comparison of multiple low-cost particulate matter sensors in an outdoor urban environment. Sci. Rep. 2019, 9, 1–13. [Google Scholar] [CrossRef] [PubMed]
- Hänel, G. The properties of atmospheric aerosol particles as functions of the relative humidity at thermodynamic equilibrium with the surrounding moist air. Adv. Geophys. 1976, 19, 73–188. [Google Scholar] [CrossRef]
- Streibl, N. Influence of Humidity on the Accuracy of Low-Cost Particulate Matter Sensors. Technical Report. 2017. Available online: https://www.researchgate.net/profile/Norbert_Streibl/publication/320474792_Influence_of_Humidity_on_the_Accuracy_of_Low-Cost_Particulate_Matter_Sensors/links/59e7ad15aca272bc423d0b97/Influence-of-Humidity-on-the-Accuracy-of-Low-Cost-Particulate-Matter-Sensors.pdf (accessed on 17 July 2020).
- Köhler, H. The nucleus in and the growth of hygroscopic droplets. Trans. Faraday Soc. 1936, 32, 1152–1161. [Google Scholar] [CrossRef]
- Petters, M.D.; Kreidenweis, S.M. A single parameter representation of hygroscopic growth and cloud condensation nucleus activity-Part 3: Including surfactant partitioning. Atmos. Chem. Phys. 2013, 13, 1081–1091. [Google Scholar] [CrossRef]
- Svenningsson, B.; Rissler, J.; Swietlicki, E.; Mircea, M.; Bilde, M.; Facchini, M.C.; Decesari, S.; Fuzzi, S.; Zhou, J.; Mønster, J.; et al. Hygroscopic growth and critical supersaturations for mixed aerosol particles of inorganic and organic compounds of atmospheric relevance. Atmos. Chem. Phys. 2006, 6, 1937–1952. [Google Scholar] [CrossRef]
- South Coast Air Quality Management District (SCAQMD). Field Evaluation of SainSmart. 2017. Available online: http://www.aqmd.gov/docs/default-source/aq-spec/field-evaluations/sainsmart—field-evaluation.pdf (accessed on 20 August 2020).
- Air Quality Expert Group. Fine Particulate Matter (PM 2.5) in the United Kingdom. 2012. Available online: https://uk-air.defra.gov.uk/assets/documents/reports/cat11/1212141150_AQEG_Fine_Particulate_Matter_in_the_UK.pdf (accessed on 20 August 2020).
- Ridgeway, G. Generalized Boosted Models: A guide to the gbm package. Compute 2007, 1, 1–12. [Google Scholar] [CrossRef]
- Carslaw, D.C.; Taylor, P.J. Analysis of air pollution data at a mixed source location using boosted regression trees. Atmos. Environ. 2009, 43, 3563–3570. [Google Scholar] [CrossRef]
- Tong, J.C. Cross-Validation. Encycl. Syst. Biol. 2013, 508. [Google Scholar] [CrossRef]
- The Natural Environment Research Council. 2020. Available online: https://bit.ly/3kjWfn8 (accessed on 19 September 2020).
- Ezzati, M.; Kammen, D.M. The health impacts of exposure to indoor air pollution from solid fuels in developing countries: Knowledge, gaps, and data needs. Environ. Health Perspect. 2002, 110, 1057–1068. [Google Scholar] [CrossRef]
- Delfino, R.J.; Zeiger, R.S.; Seltzer, J.M.; Street, D.H.; McLaren, C.E. Association of asthma symptoms with peak particulate air pollution and effect modification by anti-inflammatory medication use. Environ. Health Perspect. 2002, 110, 607–617. [Google Scholar] [CrossRef]
- Castro, A.; Calvo, A.I.; Blanco-Alegre, C.; Oduber, F.; Alves, C.; Coz, E.; Amato, F.; Querol, X.; Fraile, R. Impact of the wood combustion in an open fireplace on the air quality of a living room: Estimation of the respirable fraction. Sci. Total Environ. 2018, 628–629, 169–176. [Google Scholar] [CrossRef]
Publisher’s Note: MDPI stays neutral with regard to jurisdictional claims in published maps and institutional affiliations. |
© 2020 by the authors. Licensee MDPI, Basel, Switzerland. This article is an open access article distributed under the terms and conditions of the Creative Commons Attribution (CC BY) license (http://creativecommons.org/licenses/by/4.0/).