Spatio-Temporal Variation of Ozone Concentrations and Ozone Uptake Conditions in Forests in Western Germany
Abstract
:1. Introduction
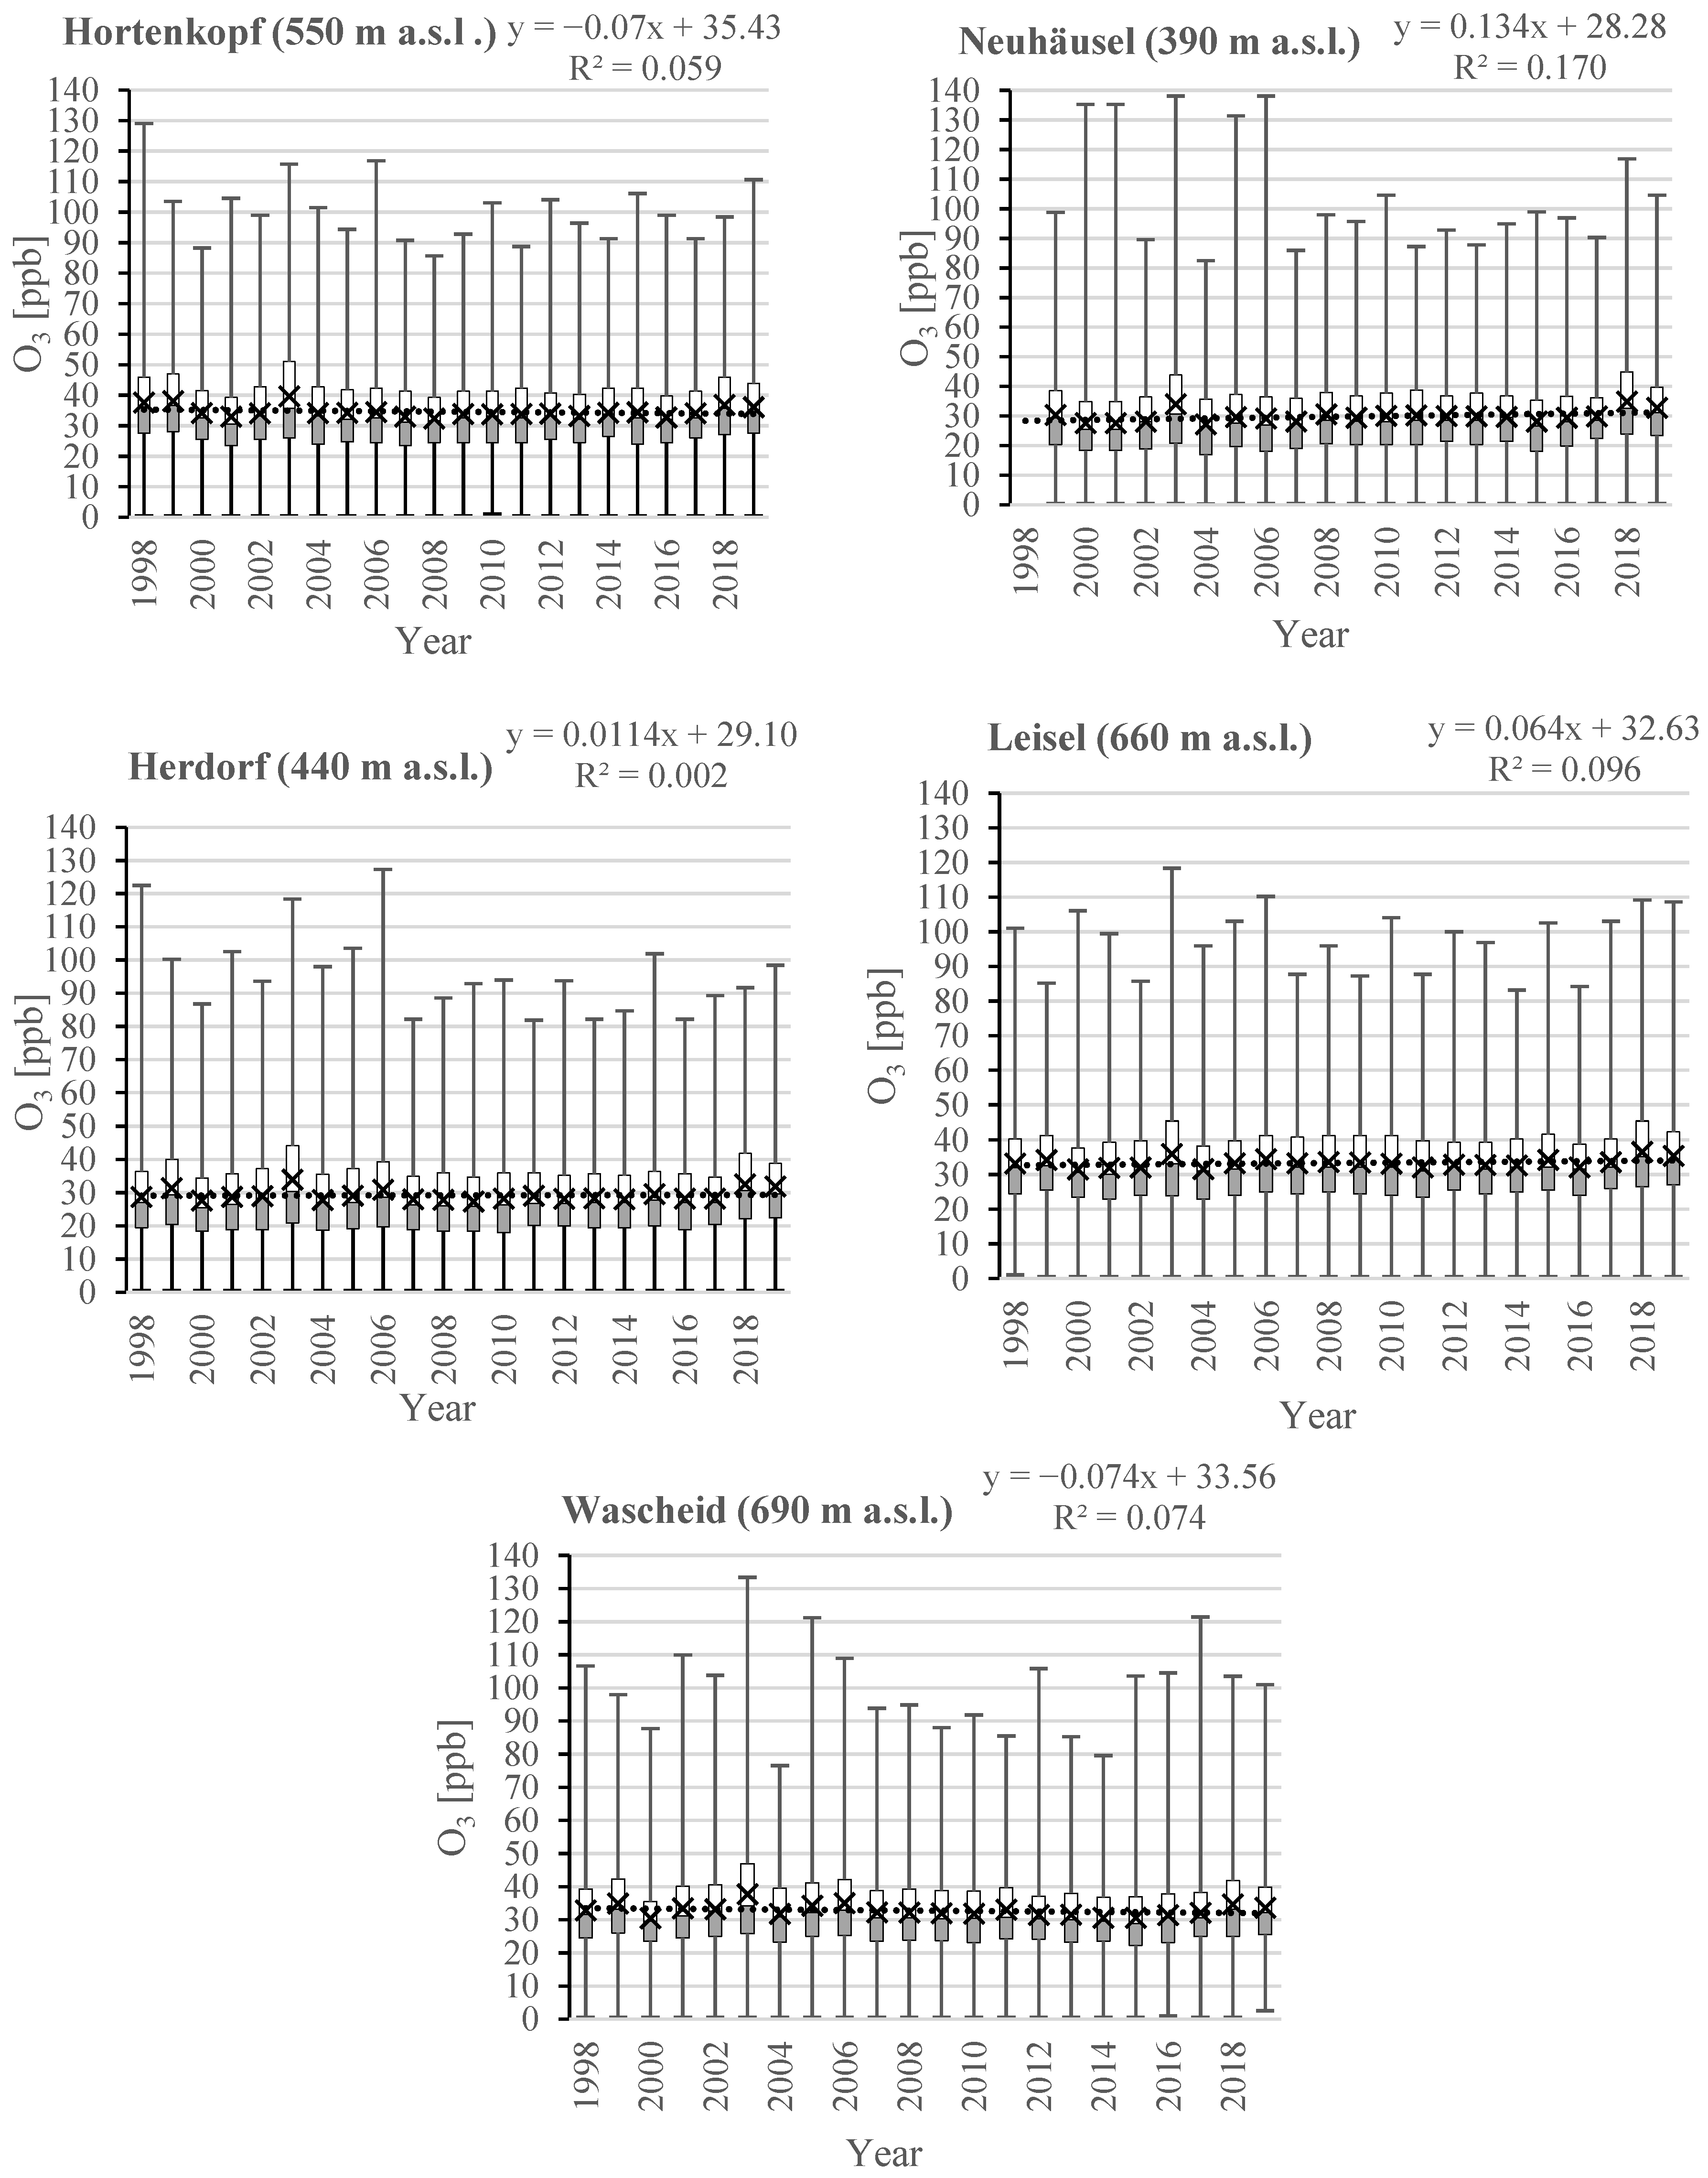
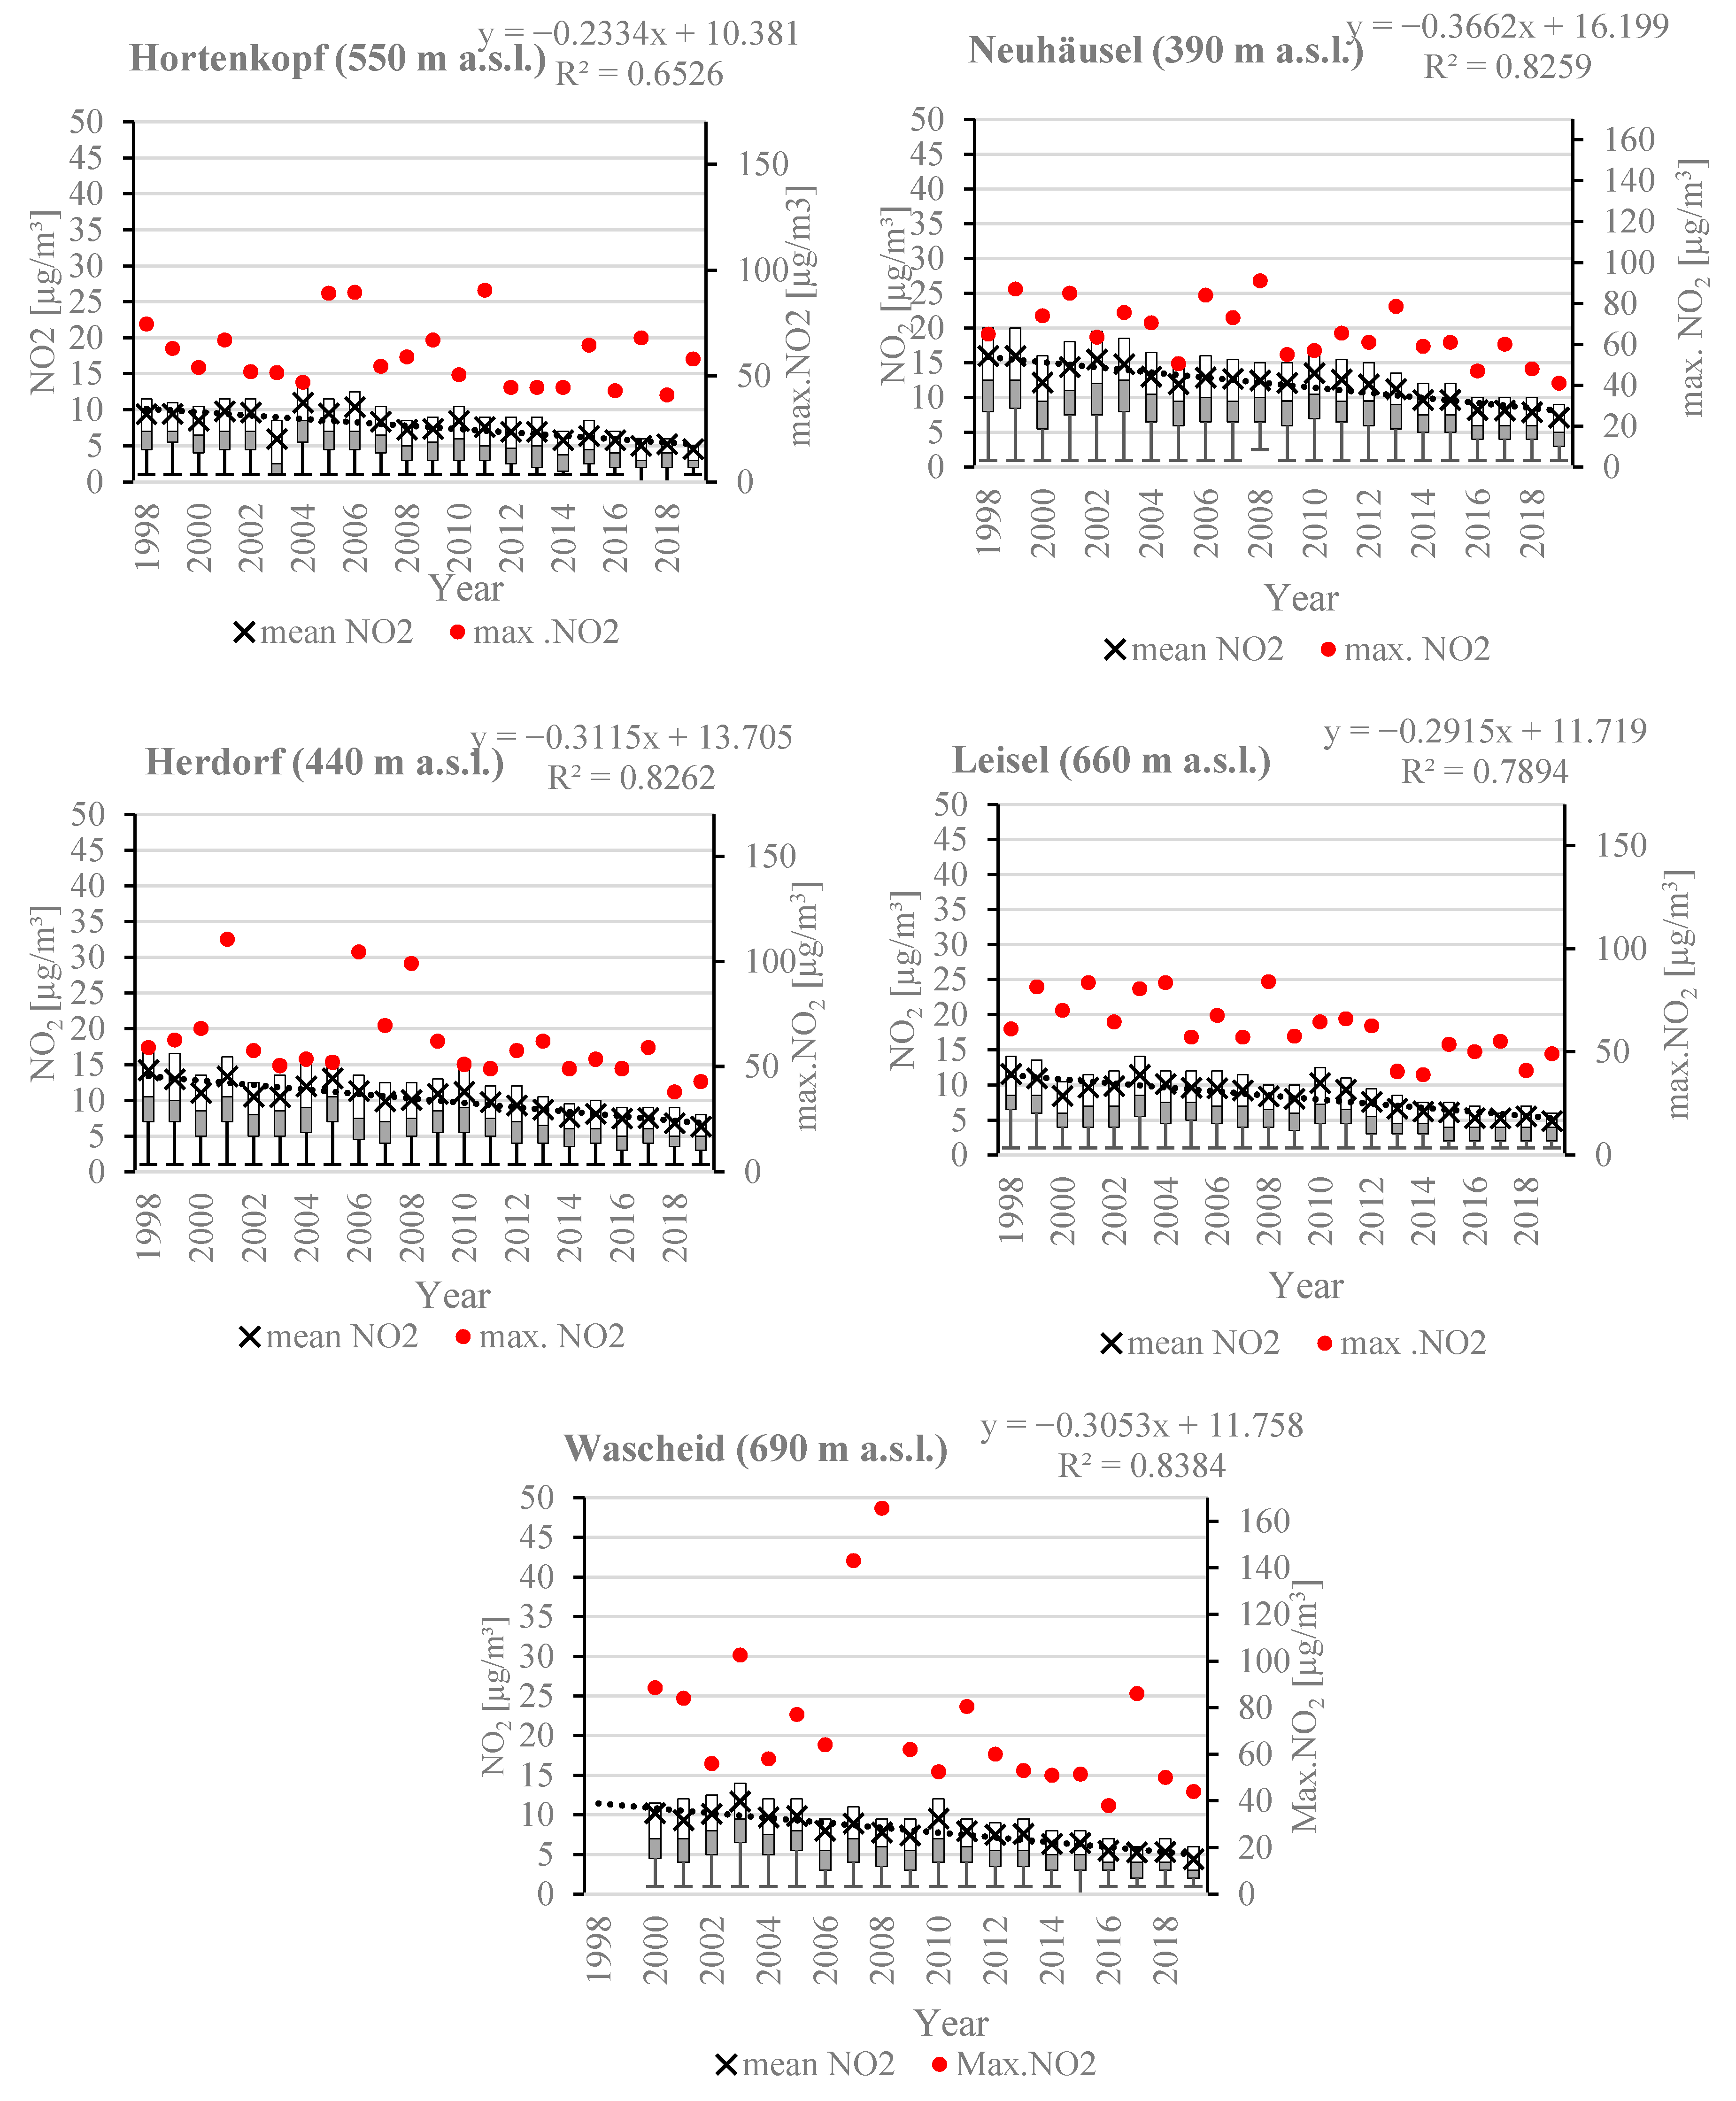
- The temporal variance of a time series of 22 years (1998 to 2019) of meteorological parameters and air pollutants at five German forest sites corresponds with the global climatic change and air pollution abatement measures implemented during that time frame.
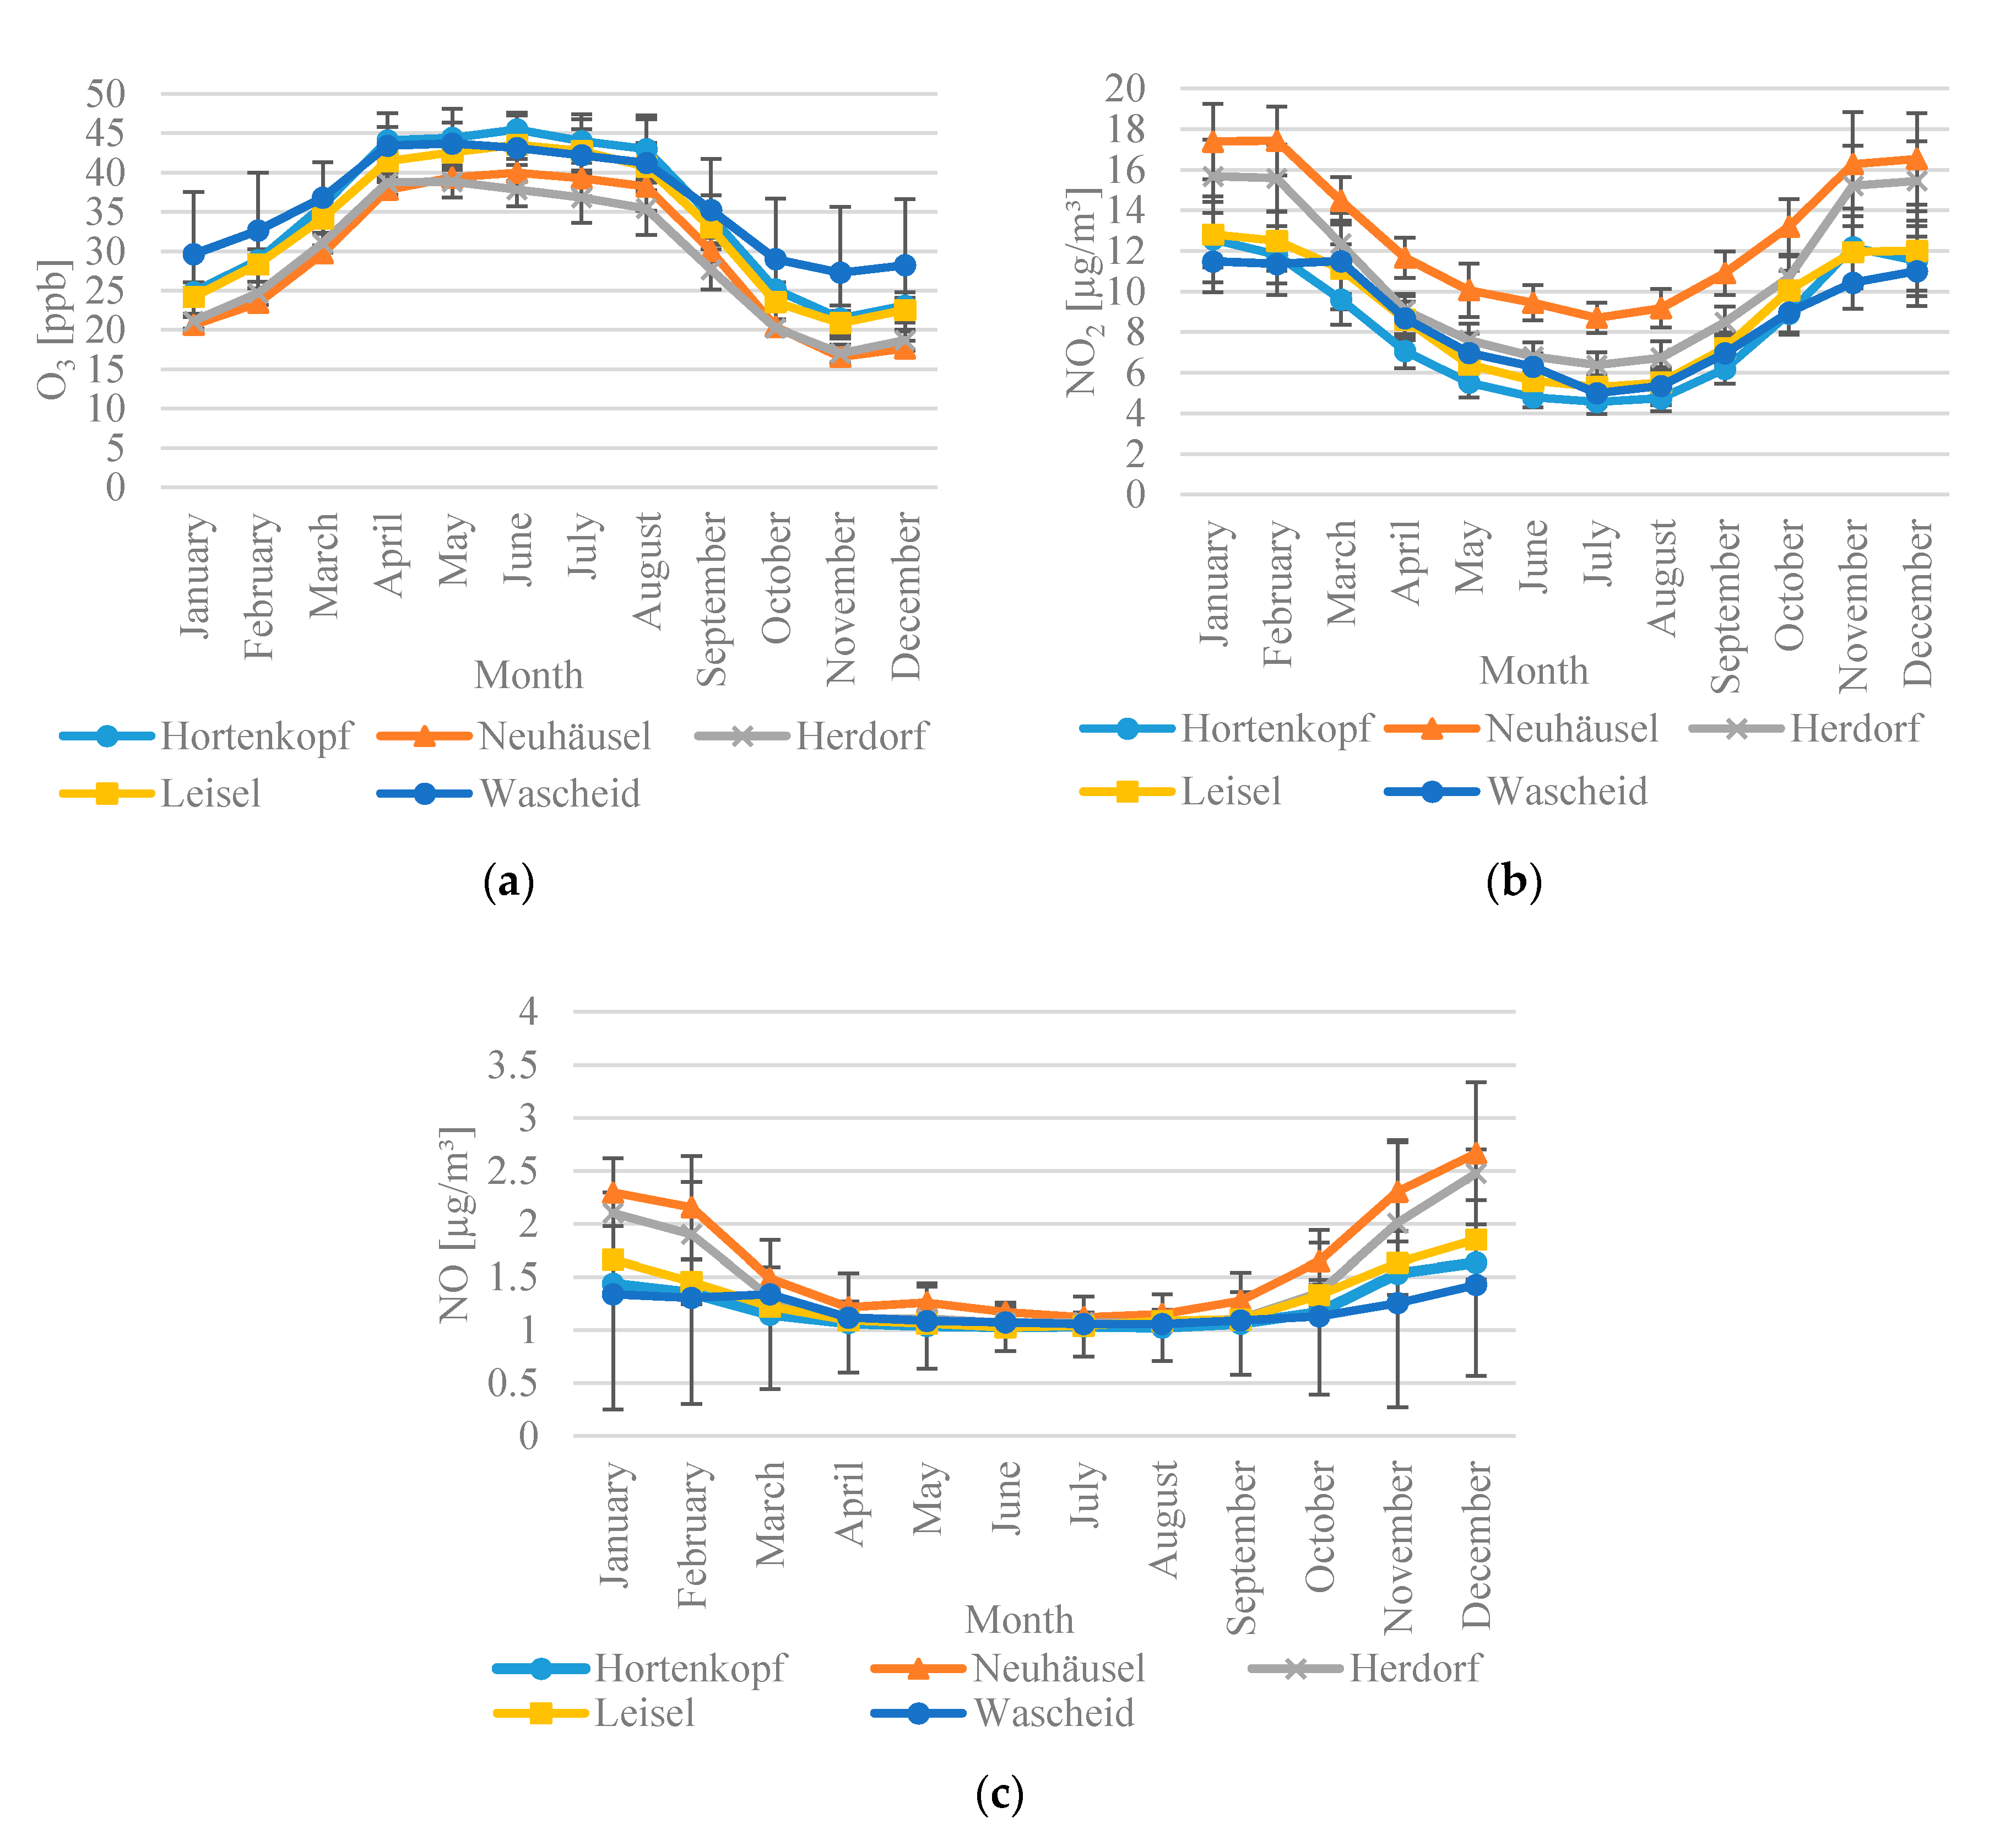
- The altitude of forest sites and their distance to urban agglomerations as well as the oncoming flow of pollutants (long-range transport of O3 and its precursor substances) and the existence of gaseous reducing agents determine the prevalent O3 concentrations.
- The duration, sequence, and intensity of droughts as well as its synchrony with elevated daytime O3 concentrations typical for Central Europe—especially in the montane belt—determine the exposure of forests to O3 and hence influence the trees’ toxicological defense.
2. Materials and Methods
2.1. Study Sites
2.2. Measurements
2.3. Methods of Data Analysis
2.3.1. Dataset Quality Assessment
2.3.2. Statistical Methods for Spatial and Temporal Data Analysis
3. Results
3.1. Temporal, Spatial Variance and Correlations of Pollution and Meteorological Data
3.1.1. Temporal Trends
3.1.2. Spatiotemporal Trends
3.1.3. Correlations between the Parameters
3.2. Characterization of Arid Periods as Conditions of Reduced Gas Exchange at the Forest Sites
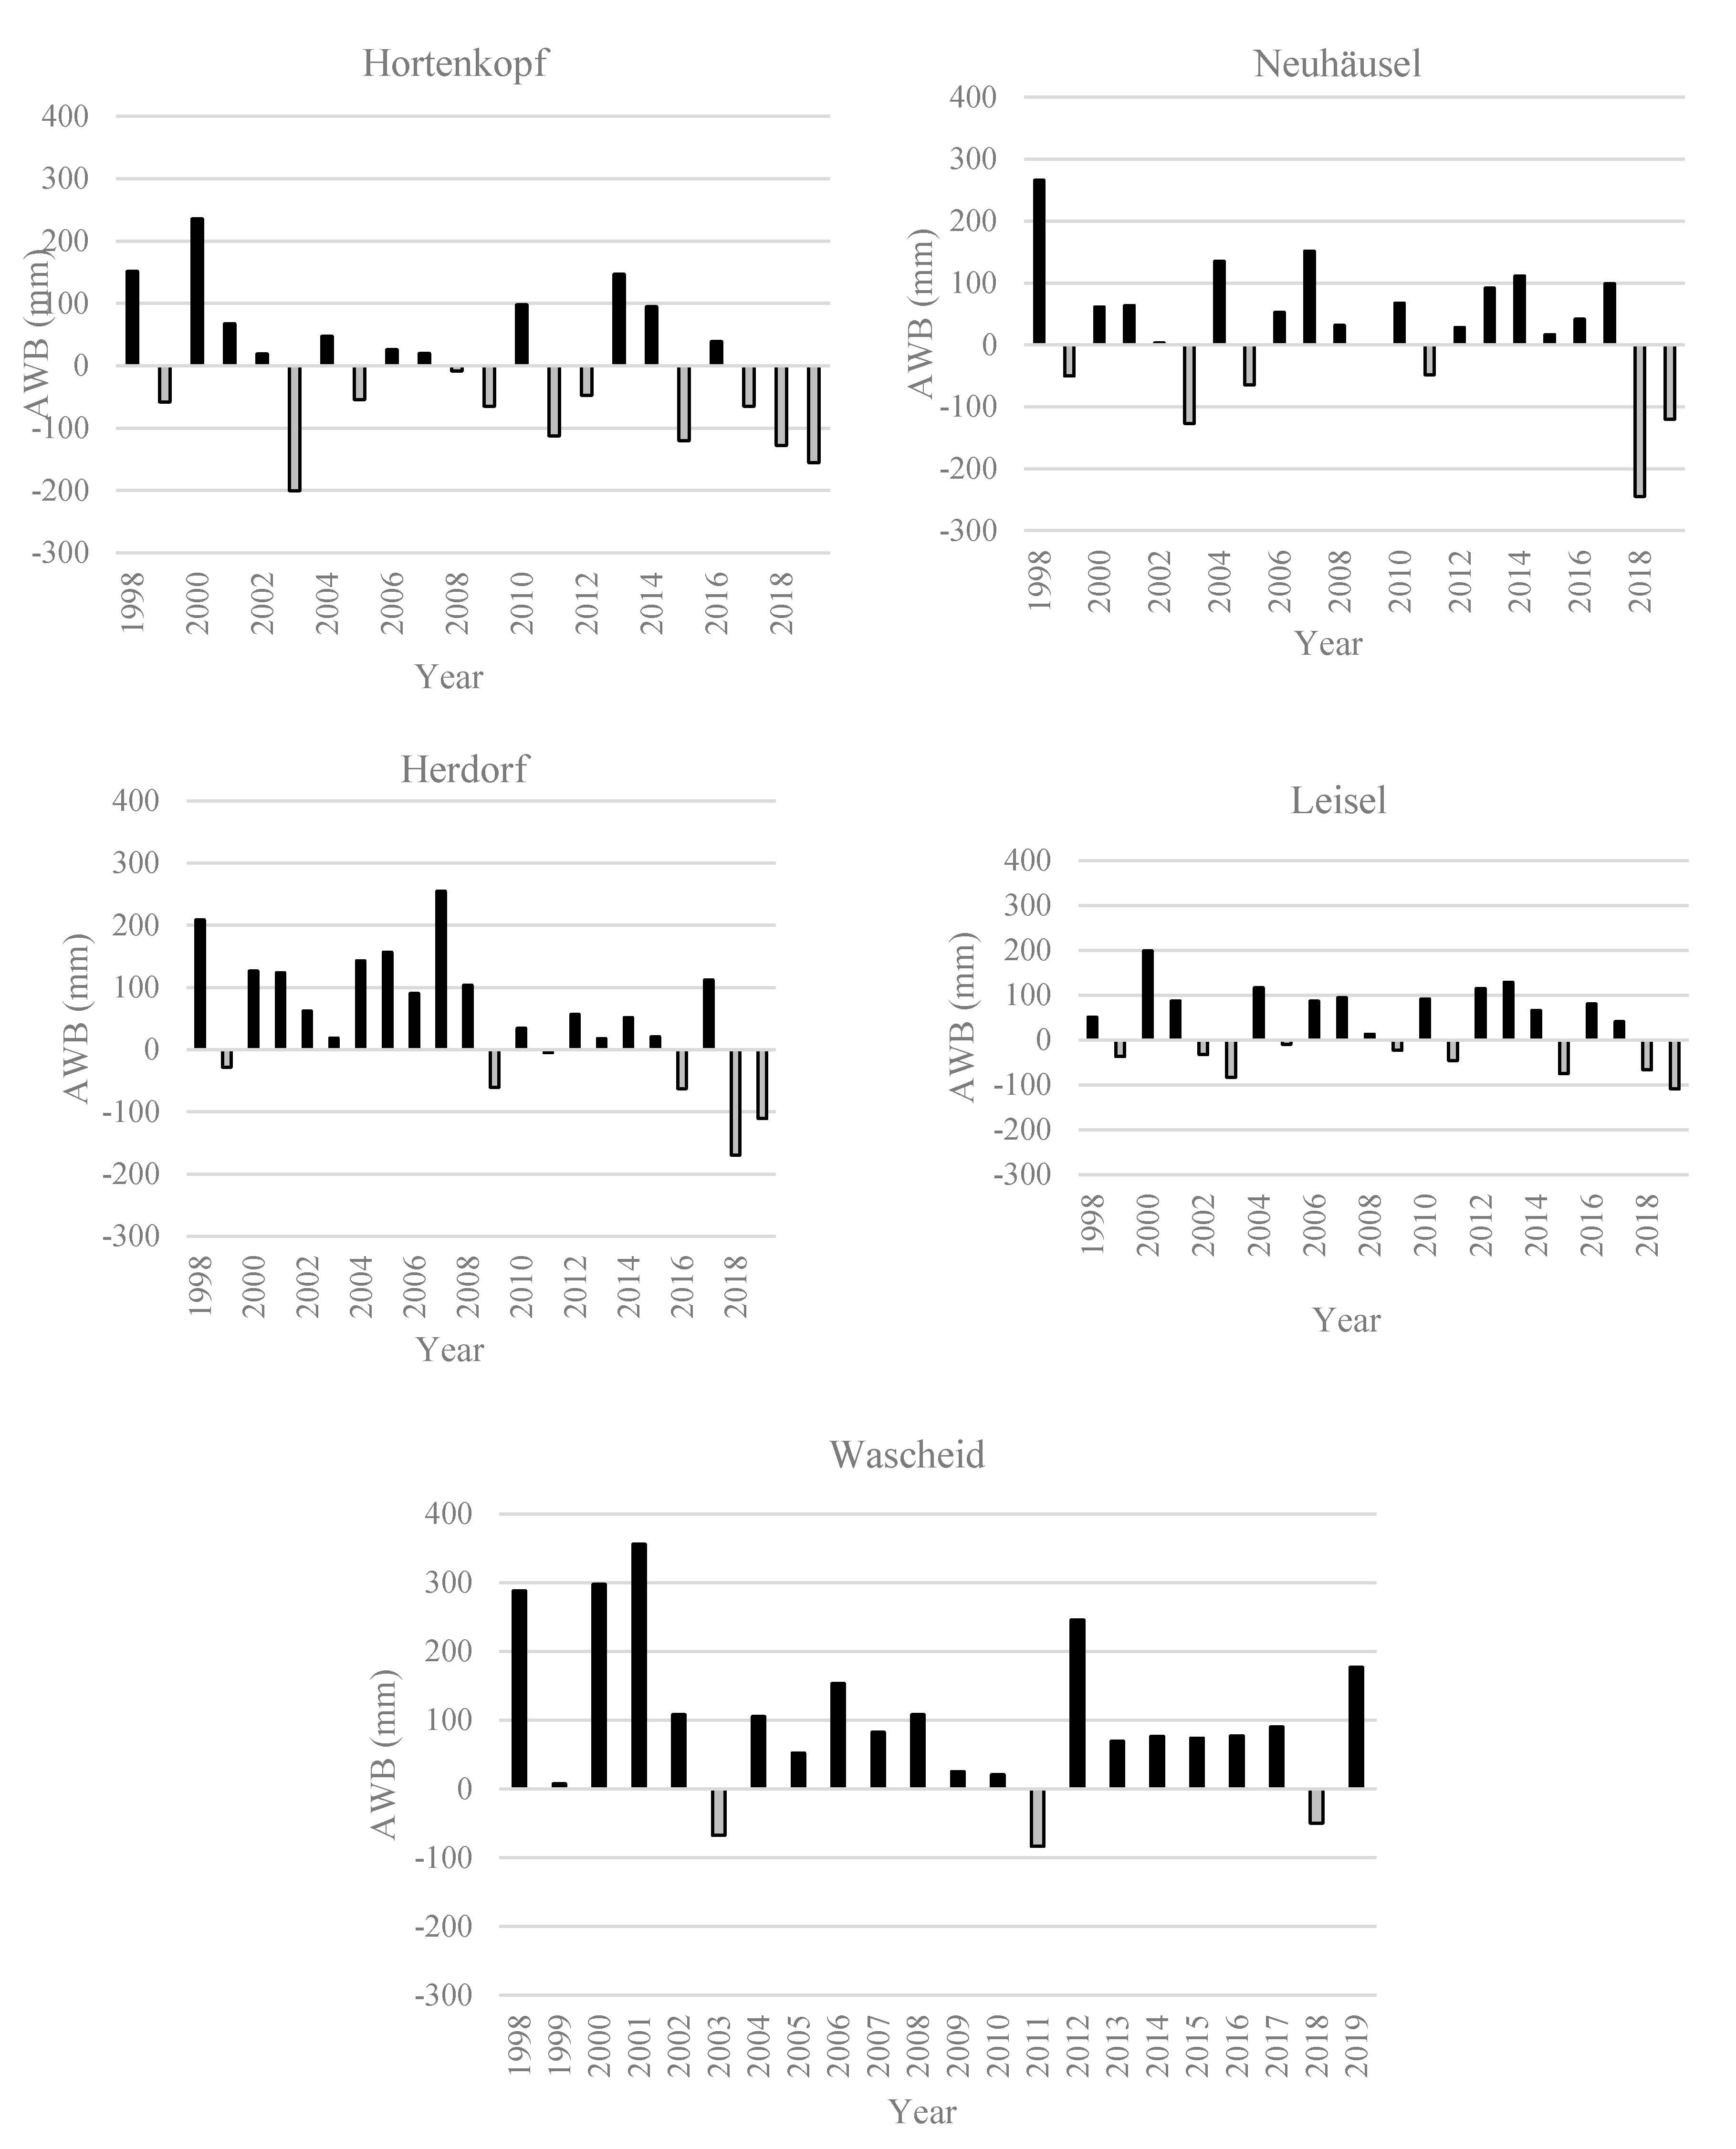
3.2.1. Atmospheric Water Balance
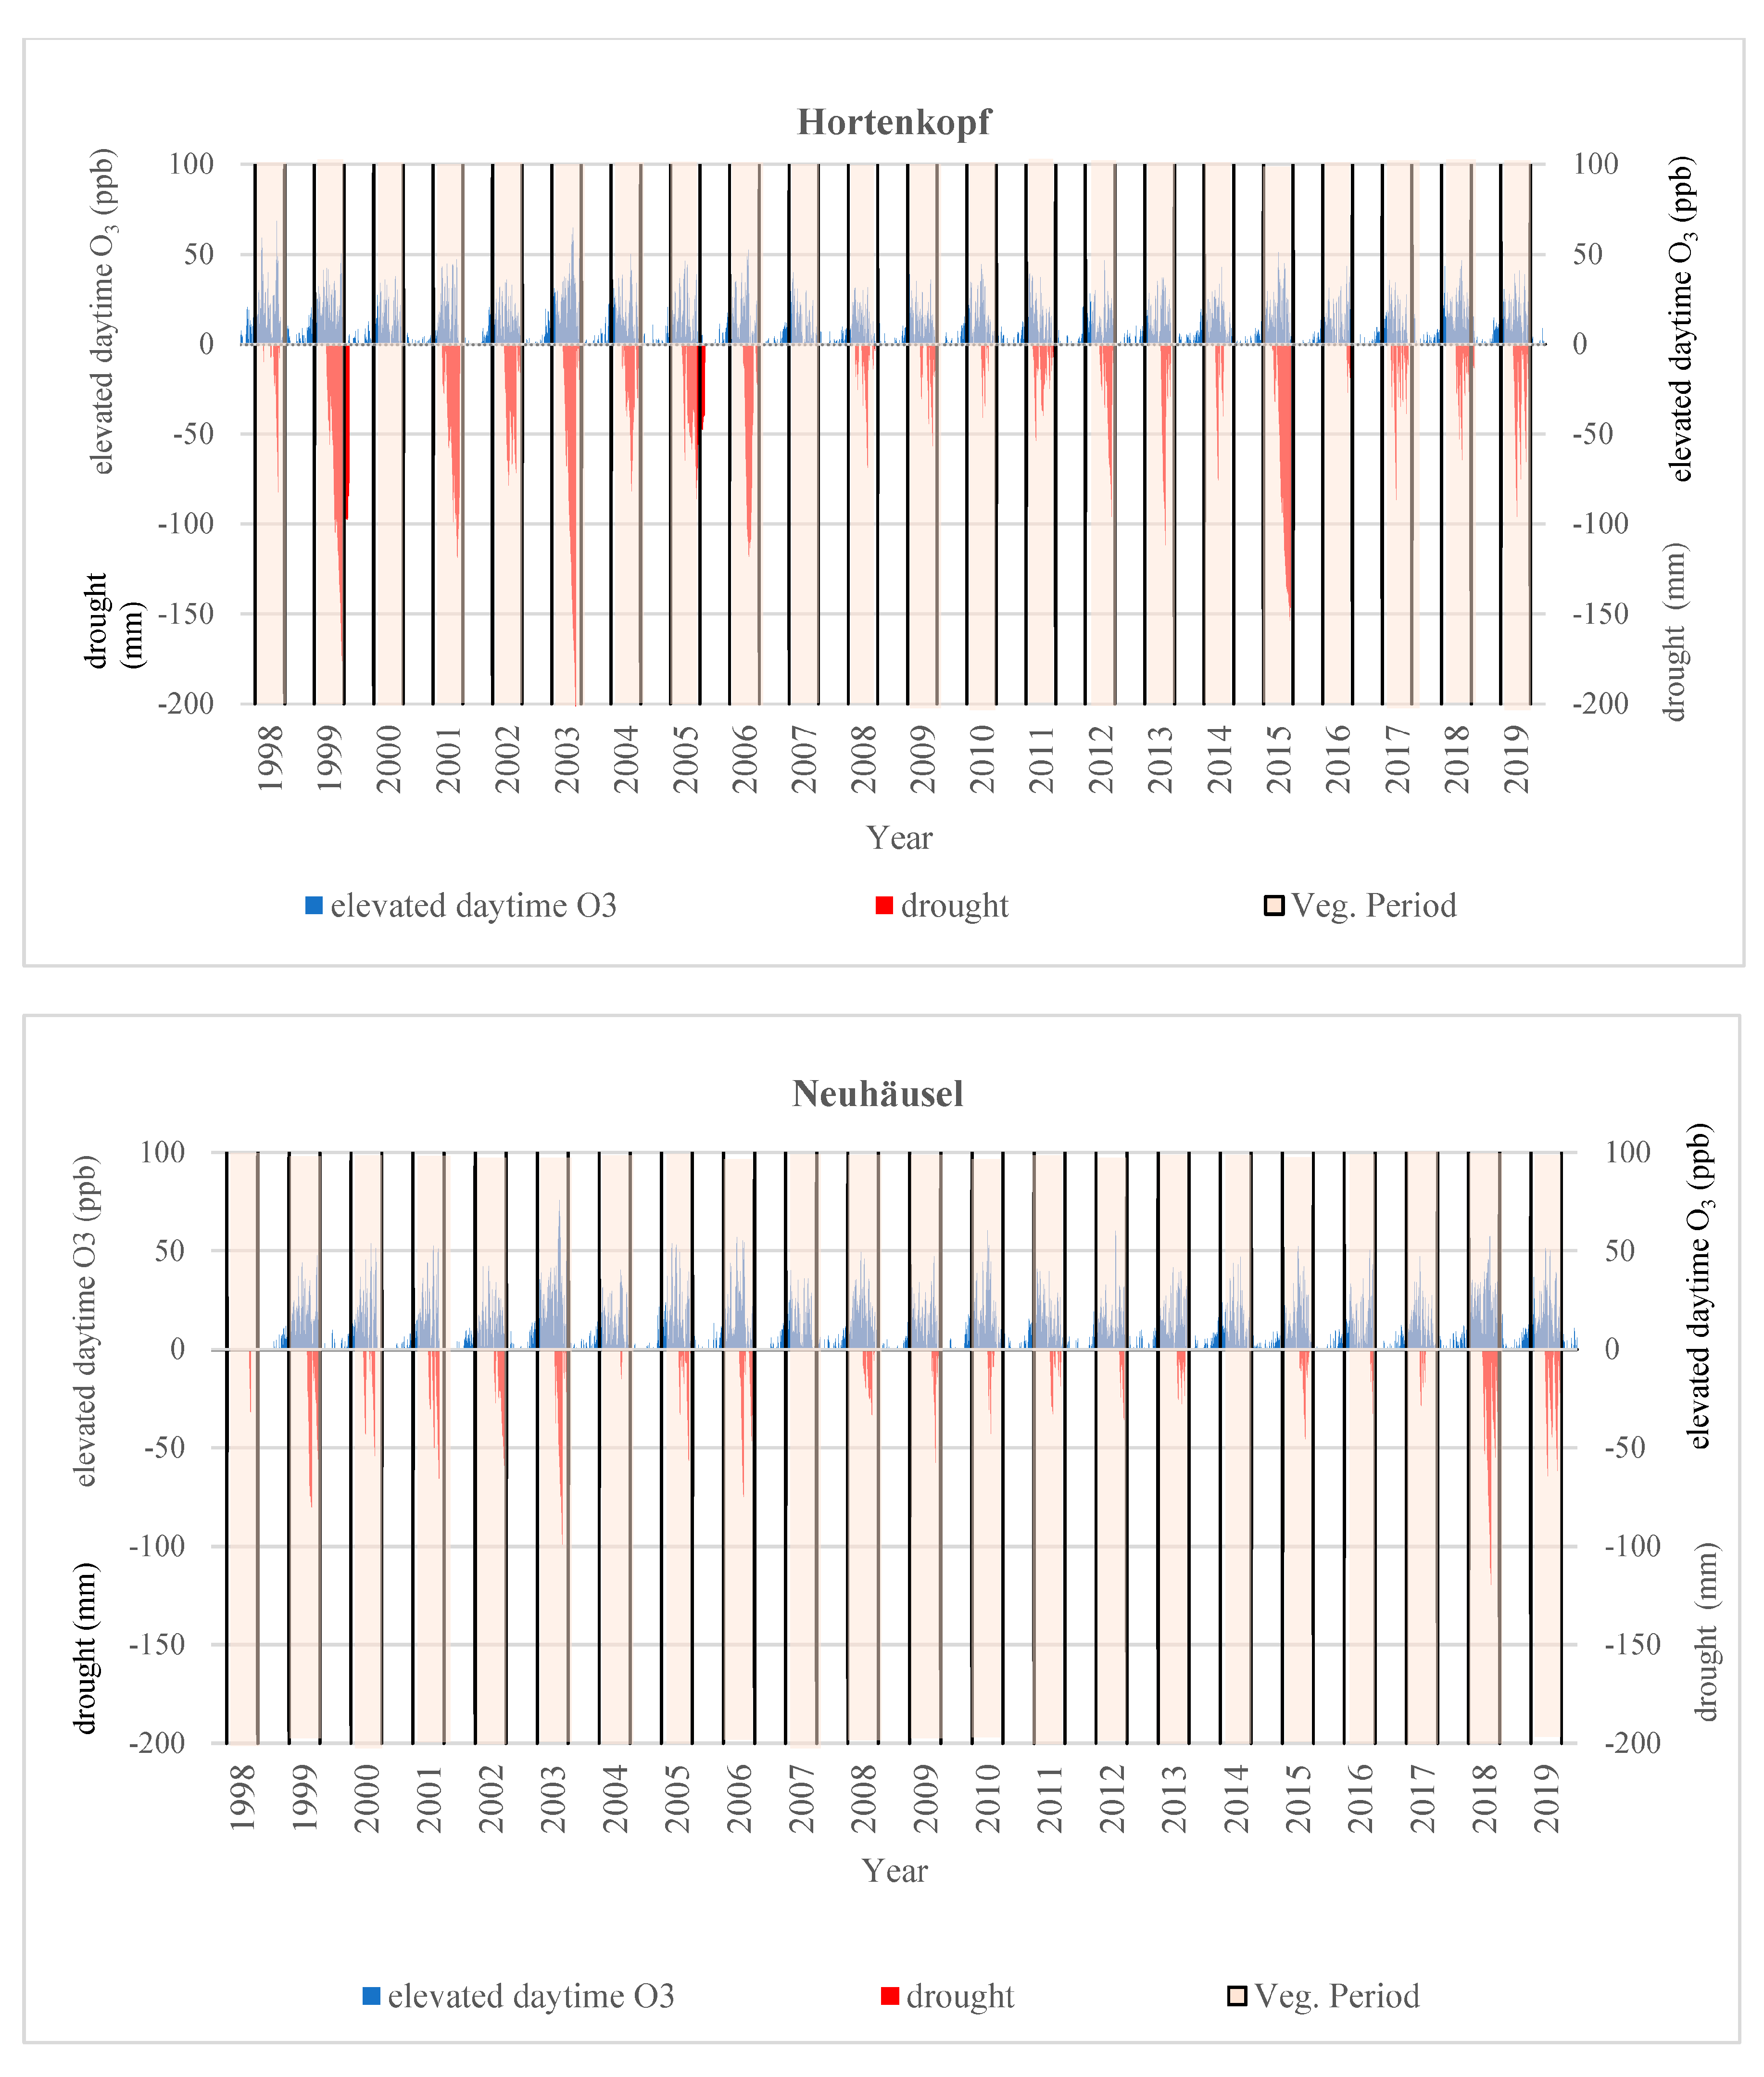
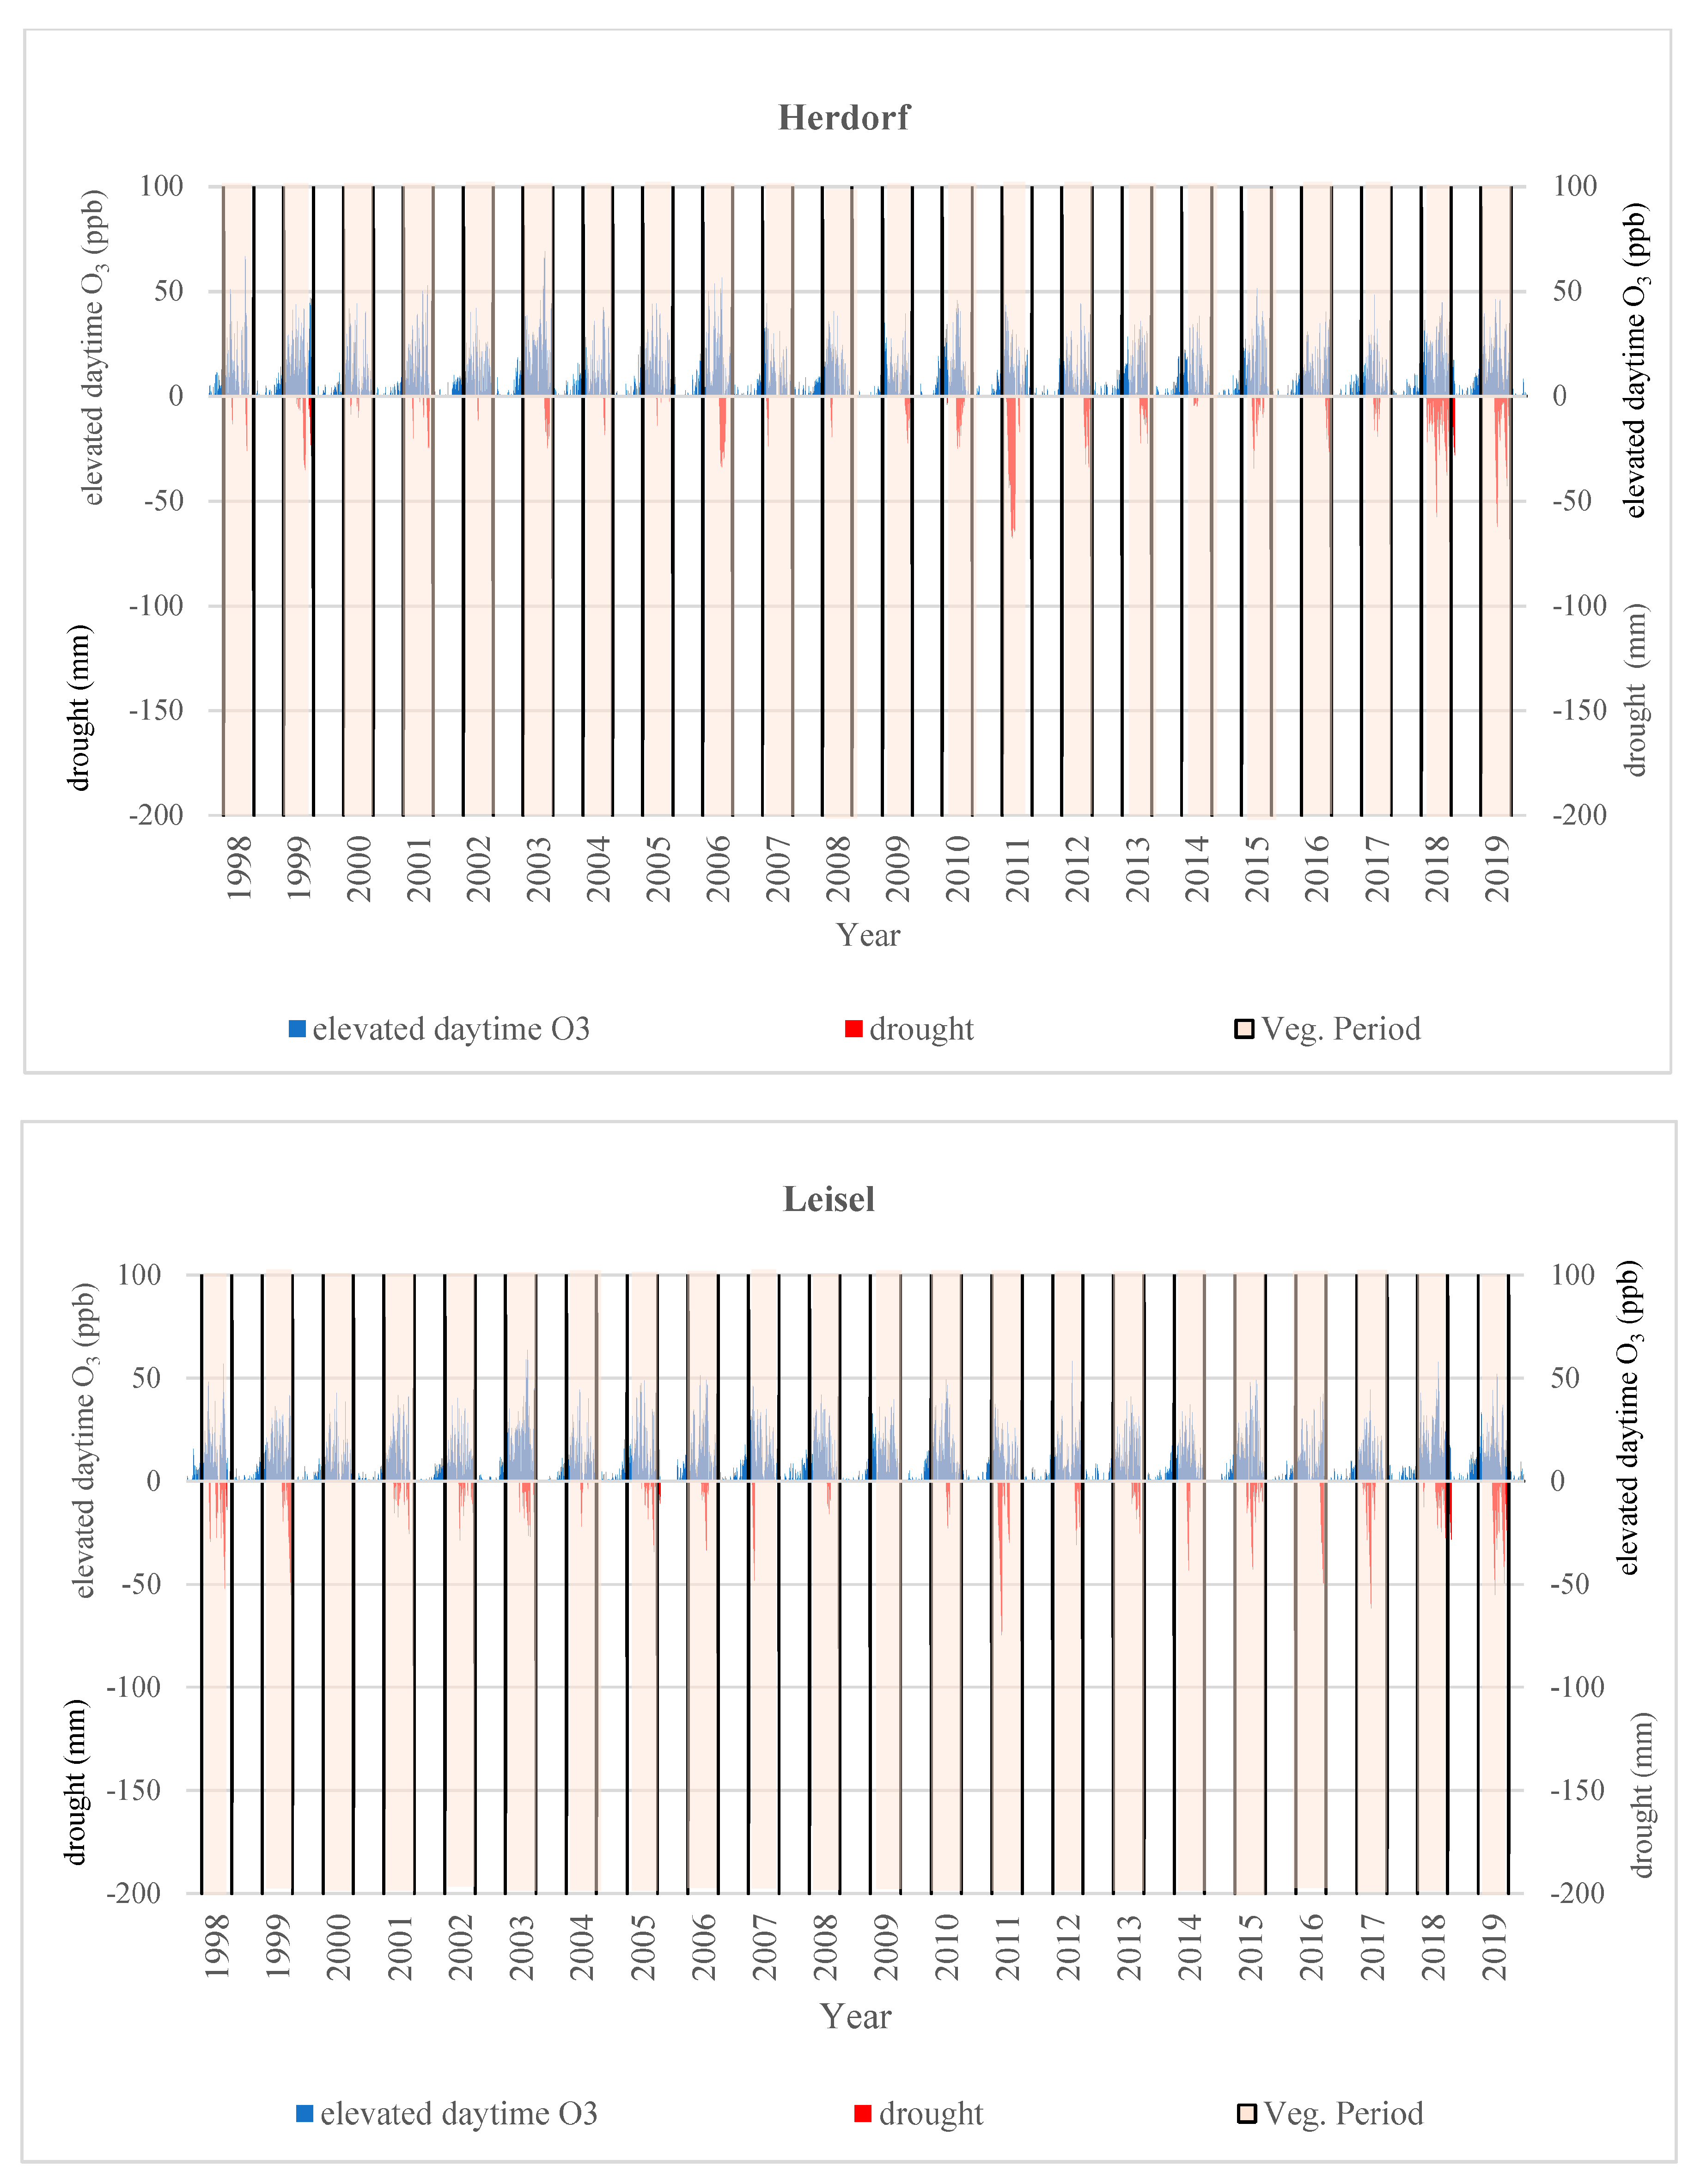
3.2.2. Drought Intensity and Elevated Daytime O3 Concentrations
4. Discussion
4.1. Spatial and Temporal Trends of Meteorological and Pollution Data (O3, NO2 and NO)
4.2. The Influence of Drought and Elevated Daytime O3 Concentrations on Forest Trees
4.2.1. Atmospheric Water Balance and Drought Extent
4.2.2. Synchrony of Drought Extent and Elevated Daytime O3
5. Conclusions
Supplementary Materials
Author Contributions
Funding
Acknowledgments
Conflicts of Interest
References
- Wittig, V.E.; Ainsworth, E.A.; Naidu, S.L.; Karnosky, D.F.; Long, S.P. Quantifying the impact of current and future tropospheric ozone on tree biomass, growth, physiology and biochemistry: A quantitative meta-analysis. Glob. Chang. Biol. 2009, 15, 396–424. [Google Scholar]
- Novak, K.; Schaub, M.; Fuhrer, J.; Skelly, J.; Hug, C.; Landolt, W.; Bleuler, P.; Kräuchi, N. Seasonal trends in reduced leaf gas exchange and ozone-induced foliar injury in three ozone sensitive woody plant species. Environ. Pollut. 2005, 136, 33–45. [Google Scholar] [PubMed]
- Novak, K.; Cherubini, P.; Saurer, M.; Fuhrer, J.; Skelly, J.M.; Kräuchi, N.; Schaub, M. Ozone air pollution effects on tree-ring growth, δ13C, visible foliar injury and leaf gas exchange in three ozone-sensitive woody plant species. Tree Physiol. 2007, 27, 941–949. [Google Scholar] [PubMed] [Green Version]
- Bussotti, F.; Desotgiu, R.; Cascio, C.; Pollastrini, M.; Gravano, E.; Gerosa, G.; Marzuoli, R.; Nali, C.; Lorenzini, G.; Salvatori, E.; et al. Ozone stress in woody plants assessed with chlorophyll a fluorescence. A critical reassessment of existing data. Environ. Exp. Bot. 2011, 73, 19–30. [Google Scholar]
- Matyssek, R.; Sandermann, H. Impact of ozone on trees: An ecophysiological perspective. In Progress in Botany; Springer: Berlin/Heidelberg, Germany, 2003; pp. 349–404. [Google Scholar]
- Karnosky, D.F.; Werner, H.; Holopainen, T.; Percy, K.; Oksanen, T.; Oksanen, E.; Heerdt, C.; Fabian, P.; Nagy, J.; Heilman, W.; et al. Free-air exposure systems to scale up ozone research to mature trees. Plant Biol. 2007, 9, 181–190. [Google Scholar] [PubMed] [Green Version]
- Matyssek, R.; Karnosky, D.F.; Wieser, G.; Percy, K.; Oksanen, E.; Grams, T.E.E.; Kubiske, M.; Hanke, D.; Pretzsch, H. Advances in understanding ozone impact on forest trees: Messages from novel phytotron and free-air fumigation studies. Environ. Pollut. 2010, 158, 1990–2006. [Google Scholar] [PubMed]
- Matyssek, R.; Wieser, G.; Ceulemans, R.; Rennenberg, H.; Pretzsch, H.; Haberer, K.; Löw, M.; Nunn, A.J.; Werner, H.; Wipfler, P.; et al. Enhanced ozone strongly reduces carbon sink strength of adult beech (Fagus sylvatica)–Resume from the free-air fumigation study at Kranzberg Forest. Environ. Pollut. 2010, 158, 2527–2532. [Google Scholar]
- Bytnerowicz, A.; Omasa, K.; Paoletti, E. Integrated effects of air pollution and climate change on forests: A northern hemisphere perspective. Environ. Pollut. 2007, 147, 438–445. [Google Scholar]
- Sitch, S.; Cox, P.M.; Collins, W.J.; Huntingford, C. Indirect radiative forcing of climate change through ozone effects on the land-carbon sink. Nature 2007, 448, 791–794. [Google Scholar]
- Gimeno, B.S.; Penuelas, J.; Porcuna, J.; Reinert, R.A. Biomonitoring ozone phytotoxicity in eastern Spain. Water. Air. Soil Pollut. 1995, 85, 1521–1526. [Google Scholar]
- Peñuelas, J.; Ribas, A.; Gimeno, B.S.; Filella, I. Dependence of ozone biomonitoring on meteorological conditions of different sites in Catalonia (NE Spain). Environ. Monit. Assess. 1999, 56, 221–224. [Google Scholar]
- Mills, G.; Wagg, S.; Harmens, H. Ozone Pollution: Impacts on Ecosystem Services and Biodiversity; NERC/Centre for Ecology & Hydrology: Lancaster, UK, 2013. [Google Scholar]
- Yadav, D.S.; Mishra, A.K.; Rai, R.; Chaudhary, N.; Mukherjee, A.; Agrawal, S.B.; Agrawal, M. Responses of an old and a modern Indian wheat cultivar to future O3 level: Physiological, yield and grain quality parameters. Environ. Pollut. 2020, 259, 113939. [Google Scholar] [PubMed]
- Singh, A.A.; Fatima, A.; Mishra, A.K.; Chaudhary, N.; Mukherjee, A.; Agrawal, M.; Agrawal, S.B. Assessment of ozone toxicity among 14 Indian wheat cultivars under field conditions: Growth and productivity. Environ. Monit. Assess. 2018, 190, 190. [Google Scholar] [PubMed]
- Treshow, M.; Stewart, D. Ozone sensitivity of plants in natural communities. Biol. Conserv. 1973, 5, 209–214. [Google Scholar]
- Braun, S.; Schindler, C.; Rihm, B. Growth losses in Swiss forests caused by ozone: Epidemiological data analysis of stem increment of Fagus sylvatica L. and Picea abies Karst. Environ. Pollut. 2014, 192, 129–138. [Google Scholar]
- Paoletti, E. Impact of ozone on Mediterranean forests: A review. Environ. Pollut. 2006, 144, 463–474. [Google Scholar]
- Findley, D.A.; Keever, G.J.; Chappelka, A.H.; Gilliam, C.H.; Eakes, D.J. Ozone sensitivity of selected southeastern landscape plants. J. Environ. Hortic. 1997, 15, 51–55. [Google Scholar]
- Kleanthous, S.; Vrekoussis, M.; Mihalopoulos, N.; Kalabokas, P.; Lelieveld, J. On the temporal and spatial variation of ozone in Cyprus. Sci. Total Environ. 2014, 476, 677–687. [Google Scholar]
- Sicard, P.; Dalstein-Richier, L.; Vas, N. Annual and seasonal trends of ambient ozone concentration and its impact on forest vegetation in Mercantour National Park (South-eastern France) over the 2000–2008 period. Environ. Pollut. 2011, 159, 351–362. [Google Scholar]
- Bergmann, E.; Bender, J.; Weigel, H.-J. Impact of tropospheric ozone on terrestrial biodiversity: A literature analysis to identify ozone sensitive taxa. J. Appl. Bot. Food Qual. 2017, 90, 83–105. [Google Scholar]
- Tiwari, S.; Rai, R.; Agrawal, M. Annual and seasonal variations in tropospheric ozone concentrations around Varanasi. Int. J. Remote Sens. 2008, 29, 4499–4514. [Google Scholar]
- Fowler, D.; Amann, M.; Anderson, R.; Ashmore, M.; Cox, P.; Depledge, M.; Derwent, D.; Grennfelt, P.; Hewitt, N.; Hov, O.; et al. Ground-Level Ozone in the 21st Century: Future Trends, Impacts and Policy Implications; 2008; Volume 15, Available online: https://royalsociety.org/topics-policy/publications/2008/ground-level-ozone/ (accessed on 23 November 2020).
- Volz, A.; Kley, D. Evaluation of the Montsouris series of ozone measurements made in the nineteenth century. Nature 1988, 332, 240. [Google Scholar]
- Zanis, P.; Schuepbach, E.; Scheel, H.E.; Baudenbacher, M.; Buchmann, B. Inhomogeneities and trends in the surface ozone record (1988–1996) at Jungfraujoch in the Swiss Alps. Atmos. Environ. 1999, 33, 3777–3786. [Google Scholar]
- Sicard, P.; Coddeville, P.; Galloo, J.-C. Near-surface ozone levels and trends at rural stations in France over the 1995–2003 period. Environ. Monit. Assess. 2009, 156, 141–157. [Google Scholar]
- Jonson, J.E.; Simpson, D.; Fagerli, H.; Solberg, S. Can We Explain the Trends in European Ozone Levels? Atmos. Chem. Phys. 2006, 6, 51–66. [Google Scholar]
- Melkonyan, A.; Kuttler, W. Long-term analysis of NO, NO2 and O3 concentrations in North Rhine-Westphalia, Germany. Atmos. Environ. 2012, 60, 316–326. [Google Scholar]
- Zvyagintsev, A.M.; Tarasova, O.A. Trends of surface ozone concentrations in germany and their connections with changes in meteorological variables. Russ. Meteorol. Hydrol. 2011, 36, 258–264. [Google Scholar]
- WHO. WHO Air Quality Guidelines for Particulate Matter, Ozone, Nitrogen Dioxide and Sulfur Dioxide: Global Update 2005: Summary of Risk Assessment; World Health Organization: Geneva, Switzerland, 2006. [Google Scholar]
- Coyle, M.; Smith, R.I.; Stedman, J.R.; Weston, K.J.; Fowler, D. Quantifying the spatial distribution of surface ozone concentration in the UK. Atmos. Environ. 2002, 36, 1013–1024. [Google Scholar]
- Vingarzan, R. A review of surface ozone background levels and trends. Atmos. Environ. 2004, 38, 3431–3442. [Google Scholar]
- Coyle, M.; Fowler, D.; Ashmore, M. New directions: Implications of increasing tropospheric background ozone concentrations for vegetation. Atmos. Environ. 2003, 37, 153–154. [Google Scholar]
- Emberson, L.D.; Ashmore, M.R.; Cambridge, H.M.; Simpson, D.; Tuovinen, J.P. Modelling stomatal ozone flux across Europe. Environ. Pollut. 2000, 109, 403–413. [Google Scholar] [PubMed]
- Skärby, L.; Ro-Poulsen, H.; Wellburn, F.A.M.; Sheppard, L.J. Impacts of ozone on forests: A European perspective. New Phytol. 1998, 139, 109–122. [Google Scholar]
- Ashmore, M.; Emberson, L.; Karlsson, P.E.; Pleijel, H. New directions: A new generation of ozone critical levels for the protection of vegetation in Europe. Atmos. Environ. 2004, 38, 2213–2214. [Google Scholar]
- Karlsson, P.E.; Braun, S.; Broadmeadow, M.; Elvira, S.; Emberson, L.; Gimeno, B.S.; Le Thiec, D.; Novak, K.; Oksanen, E.; Schaub, M.; et al. Risk assessments for forest trees: The performance of the ozone flux versus the AOT concepts. Environ. Pollut. 2007, 146, 608–616. [Google Scholar] [PubMed]
- Mills, G.; Pleijel, H.; Braun, S.; Büker, P.; Bermejo, V.; Calvo, E.; Danielsson, H.; Emberson, L.; Fernández, I.G.; Grünhage, L.; et al. New stomatal flux-based critical levels for ozone effects on vegetation. Atmos. Environ. 2011, 45, 5064–5068. [Google Scholar]
- Emberson, L.D.; Büker, P.; Ashmore, M.R. Assessing the risk caused by ground level ozone to European forest trees: A case study in pine, beech and oak across different climate regions. Environ. Pollut. 2007, 147, 454–466. [Google Scholar] [PubMed]
- Bergmann, E.; Bender, J.; Weigel, H.J. Assessment of the Impacts of Ozone on Biodiversity in Terrestrial Ecosystems: Literature Review and Analysis of Methods and Uncertainties in Current Risk Assessment Approaches. Part II: Literature Review of the Current State of Knowledge on the Impact of Ozone on Biodiversity in Terrestrial Ecosystems; German Environment Agency (UBA) Texte 71/2015; Umweltbundesamt: Dessau-Roßlau, Germany, 2015. [Google Scholar]
- Von Willert, D.J.; Matyssek, R.; Herppich, W. Experimentelle Pflanzenökologie: Grundlagen und Anwendungen; 33 Tabellen; Thieme: Stuttgart, Germany; New York, NY, USA, 1995. [Google Scholar]
- Anav, A.; Proietti, C.; Menut, L.; Carnicelli, S.; De Marco, A.; Paoletti, E. Sensitivity of stomatal conductance to soil moisture: Implications for tropospheric ozone. Atmos. Chem. Phys. 2018, 18, 5747–5763. [Google Scholar]
- Lin, M.; Horowitz, L.W.; Xie, Y.; Paulot, F.; Malyshev, S.; Shevliakova, E.; Finco, A.; Gerosa, G.; Kubistin, D.; Pilegaard, K. Vegetation feedbacks during drought exacerbate ozone air pollution extremes in Europe. Nat. Clim. Chang. 2020, 10, 444–451. [Google Scholar]
- Gao, F.; Catalayud, V.; Paoletti, E.; Hoshika, Y.; Feng, Z. Water stress mitigates the negative effects of ozone on photosynthesis and biomass in poplar plants. Environ. Pollut. 2017, 230, 268–279. [Google Scholar]
- Hoshika, Y.; Omasa, K.; Paoletti, E. Both ozone exposure and soil water stress are able to induce stomatal sluggishness. Environ. Exp. Bot. 2013, 88, 19–23. [Google Scholar]
- Emberson, L.D.; Kitwiroon, N.; Beevers, S.; Büker, P.; Cinderby, S. Scorched Earth: How will changes in the strength of the vegetation sink to ozone deposition affect human health and ecosystems? Atmos. Chem. Phys. 2013, 13, 6741–6755. [Google Scholar]
- Gerosa, G.; Finco, A.; Mereu, S.; Vitale, M.; Manes, F.; Denti, A.B. Comparison of seasonal variations of ozone exposure and fluxes in a Mediterranean Holm oak forest between the exceptionally dry 2003 and the following year. Environ. Pollut. 2009, 157, 1737–1744. [Google Scholar] [PubMed]
- Matyssek, R.; Le Thiec, D.; Löw, M.; Dizengremel, P.; Nunn, A.J.; Häberle, K.H. Interactions between drought and O3 stress in forest trees. Plant Biol. 2006, 8, 11–17. [Google Scholar] [PubMed]
- Tingey, D.T.; Hogsett, W.E. Water stress reduces ozone injury via a stomatal mechanism. Plant Physiol. 1985, 77, 944–947. [Google Scholar]
- Baumgarten, M.; Huber, C.; Büker, P.; Emberson, L.; Dietrich, H.P.; Nunn, A.J.; Heerdt, C.; Beudert, B.; Matyssek, R. Are Bavarian Forests (southern Germany) at risk from ground-level ozone? Assessment using exposure and flux based ozone indices. Environ. Pollut. 2009, 157, 2091–2107. [Google Scholar]
- Kasperska-Wołowicz, W.; Łabędzki, L. Climatic and agricultural water balance for grasslands in Poland using the Penman-Monteith method. Ann. Warsaw Agric. Univ. L. Reclam. 2006, 37, 93–100. [Google Scholar]
- Prăvălie, R.; Piticar, A.; Roșca, B.; Sfîcă, L.; Bandoc, G.; Tiscovschi, A.; Patriche, C. Spatio-temporal changes of the climatic water balance in Romania as a response to precipitation and reference evapotranspiration trends during 1961–2013. Catena 2019, 172, 295–312. [Google Scholar]
- Haferkorn, U. Größen des Wasserhaushaltes verschiedener Böden unter landwirtschaftlicher Nutzung im klimatischen Grenzraum des Mitteldeutschen Trockengebietes-Ergebnisse der Lysimeterstation Brandis. Ph.D. Thesis, Georg-August-Universität, Göttingen, Germany, 2000. [Google Scholar]
- Häckel, H. Meteorologie; Verlag Eugen Ulmer Stuttgart: Stuttgart, Germany, 2016. [Google Scholar]
- Vicente-Serrano, S.M.; Azorin-Molina, C.; Sanchez-Lorenzo, A.; Revuelto, J.; López-Moreno, J.I.; González-Hidalgo, J.C.; Moran-Tejeda, E.; Espejo, F. Reference evapotranspiration variability and trends in Spain, 1961–2011. Glob. Planet. Change 2014, 121, 26–40. [Google Scholar]
- Colantoni, A.; Ferrara, C.; Perini, L.; Salvati, L. Assessing trends in climate aridity and vulnerability to soil degradation in Italy. Ecol. Indic. 2015, 48, 599–604. [Google Scholar]
- Nastos, P.T.; Politi, N.; Kapsomenakis, J. Spatial and temporal variability of the Aridity Index in Greece. Atmos. Res. 2013, 119, 140–152. [Google Scholar]
- ICP Forests Manual 2016—Part I. 2016. Available online: https://www.icp-forests.org/pdf/manual/2016/Manual_Part_I.pdf (accessed on 17 November 2020).
- Rheinlandpfalz LANDESAMT FÜR UMWELT. Available online: www.luft-rlp.de (accessed on 17 November 2020).
- Raspe, S.; Beuker, E.; Preuhsler, T.; Bastrup-Birk, A. Part IX: Meteorological measurements. In Manual on Methods and Criteria for Harmonized Sampling, Assessment, Monitoring and Analysis of the Effects of Air Pollution on Forests; Thünen Institute of Forest Ecosystems: Eberswalde, Germany, 2016. [Google Scholar]
- Hörmann, G.; Scherzer, J.; Suckow, F.; Müller, J.; Wegehenkel, M.; Lukes, M.; Hammel, K.; Knieß, A.; Meesenburg, H. Wasserhaushalt von Waldökosystemen: Methodenleitfaden zur Bestimmung der Wasserhaushaltskomponenten auf Level II-Fläche; Bundesministerium für Verbraucherschutz, Ernährung und Landwirtschaft (BMVEL, Hrsg.); 2003; Available online: http://www.wasklim.de/download/Methodenband.pdf (accessed on 17 November 2020).
- Dobler, L.; Hinterding, A.; Gerlach, N. INTERMET—Interpolation stündlicher und tagesbasierter meteorologischer Parameter—Gesamtdokumentation; Unveröffentlichter Projektbericht; Institut für Geoinformatik der Universität Münster: Münster, Germany, 2004. [Google Scholar]
- Hui, D.; Wan, S.; Su, B.; Katul, G.; Monson, R.; Luo, Y. Gap-filling missing data in eddy covariance measurements using multiple imputation (MI) for annual estimations. Agric. For. Meteorol. 2004, 121, 93–111. [Google Scholar]
- Smith, M.; Allen, R.G.; Periera, L.S.; Raes, D. Crop evapotranspiration: Guidelines for computing crop requirements. Irrig. Drain. Pap. 1998, 56, 17–64. [Google Scholar]
- Schad, T.; Sanders, T.; Werner, W.; Eghdami, H. Erarbeitung von Vorschlägen für ein repräsentatives Messnetz zur Überwachung der Wirkungen bodennahen Ozons in Umsetzung der Richtlinie (EU) 2016/2284, Artikel 9 und Anhang V; 2018; Available online: https://www.umweltbundesamt.de/publikationen/erarbeitung-von-vorschlaegen-fuer-ein (accessed on 17 November 2020).
- Monteith, J.; Unsworth, M. Principles of Environmental Physics: Plants, Animals, and the Atmosphere; Academic Press: New York, NY, USA, 2013. [Google Scholar]
- Emberson, L.D.; Wieser, G.; Ashmore, M.R. Modelling of stomatal conductance and ozone flux of Norway spruce: Comparison with field data. Environ. Pollut. 2000, 109, 393–402. [Google Scholar]
- Buker, P.; Morrissey, T.; Briolat, A.; Falk, R.; Simpson, D.; Tuovinen, J.P.; Alonso, R.; Barth, S.; Baumgarten, M.; Grulke, N.; et al. DO 3 SE modelling of soil moisture to determine ozone flux to forest trees. Atmos. Chem. Phys. 2012, 12, 5537–5562. [Google Scholar]
- Bender, J.; Bergmann, E.; Weigel, H.J.; Grünhage, L.; Schröder, M.; Builtjes, P.; Schaap, M.K.; Wichink Kruit, R.; Stern, R.; Baumgarten, M.; et al. Anwendung und Überprüfung neuer Methoden zur flächenhaften Bewertung der Auswirkung von bodennahem Ozon auf die Biodiversität terrestrischer Ökosysteme; 2015; Available online: http://www.umweltbundesamt.de/publikationen/anwendung-ueberpruefung-neuer-methoden-zur (accessed on 17 November 2020).
- Landesforsten Rheinland-Pfalz. Available online: https://fawf.wald-rlp.de/?id=12304 (accessed on 17 November 2020).
- Ad-hoc-AG Boden. Bodenkundliche Kartieranleitung, 5th ed.; Hannover: Stuttgart, Germany, 2005. [Google Scholar]
- Statheropoulos, M.; Vassiliadis, N.; Pappa, A. Principal component and canonical correlation analysis for examining air pollution and meteorological data. Atmos. Environ. 1998, 32, 1087–1095. [Google Scholar]
- Paterson, K.G.; Sagady, J.L.; Hooper, D.L.; Bertman, S.B.; Carroll, M.A.; Shepson, P.B. Analysis of air quality data using positive matrix factorization. Environ. Sci. Technol. 1999, 33, 635–641. [Google Scholar]
- Alvarez, E.; De Pablo, F.; Tomas, C.; Rivas, L. Spatial and temporal variability of ground-level ozone in Castilla-Leon (Spain). Int. J. Biometeorol. 2000, 44, 44–51. [Google Scholar]
- Hargreaves, P.; Leidi, A.; Grubb, H.; Howe, M.; Mugglestone, M. Local and seasonal variations in atmospheric nitrogen dioxide levels at Rothamsted, UK, and relationships with meteorological conditions. Atmos. Environ. 2000, 34, 843–853. [Google Scholar]
- Pissimanis, D.K.; Notaridou, V.A.; Kaltsounidis, N.A.; Viglas, P.S. On the spatial distribution of the daily maximum hourly ozone concentrations in the Athens basin in summer. Theor. Appl. Climatol. 2000, 65, 49–62. [Google Scholar]
- Felipe-Sotelo, M.; Gustems, L.; Hernàndez, I.; Terrado, M.; Tauler, R. Investigation of geographical and temporal distribution of tropospheric ozone in Catalonia (North-East Spain) during the period 2000–2004 using multivariate data analysis methods. Atmos. Environ. 2006, 40, 7421–7436. [Google Scholar]
- Kovač-Andrić, E.; Brana, J.; Gvozdić, V. Impact of meteorological factors on ozone concentrations modelled by time series analysis and multivariate statistical methods. Ecol. Inform. 2009, 4, 117–122. [Google Scholar]
- Ocak, S.; Turalioglu, F.S. Effect of meteorology on the atmospheric concentrations of traffic-related pollutants in Erzurum, Turkey. J. Int. Environ. Appl. Sci. 2008, 3, 325–335. [Google Scholar]
- Eghdami, H.; Azhdari, G.; Lebailly, P.; Azadi, H. Impact of Land Use Changes on Soil and Vegetation Characteristics in Fereydan, Iran. Agriculture 2019, 9, 58. [Google Scholar]
- Vyas, S.; Kumaranayake, L. Constructing socio-economic status indices: How to use principal components analysis. Health Policy Plan. 2006, 21, 459–468. [Google Scholar]
- Wuttichaikitcharoen, P.; Babel, M. Principal component and multiple regression analyses for the estimation of suspended sediment yield in ungauged basins of Northern Thailand. Water 2014, 6, 2412–2435. [Google Scholar]
- Harrou, F.; Kadri, F.; Khadraoui, S.; Sun, Y. Ozone measurements monitoring using data-based approach. Process Saf. Environ. Prot. 2016, 100, 220–231. [Google Scholar]
- Héberger, K. Evaluation of polarity indicators and stationary phases by principal component analysis in gas–liquid chromatography. Chemom. Intell. Lab. Syst. 1999, 47, 41–49. [Google Scholar]
- Minkos, A.; Dauert, U.; Feigenspan, S.; Kessinger, S.; Mues, A. Air Quality 2019 Preliminary Evaluation; 2020; Available online: https://www.umweltbundesamt.de/publikationen/air-quality-2019 (accessed on 17 November 2020).
- Junk, J.; Helbig, A.; Lüers, J. Urban climate and air quality in Trier Germany. Int. J. Biometeorol. 2003, 47, 230–238. [Google Scholar]
- Georgoulias, A.K.; Stammes, P. Trends and trend reversal detection in 2 decades of tropospheric NO 2 satellite observations. Atmos. Chem. Phys. 2019, 19, 6269–6294. [Google Scholar]
- Kuebler, J.; Van den Bergh, H.; Russell, A.G. Long-term trends of primary and secondary pollutant concentrations in Switzerland and their response to emission controls and economic changes. Atmos. Environ. 2001, 35, 1351–1363. [Google Scholar]
- Minkos, A.; Dauert, U.; Feigenspan, S.; Kessinger, S. Luftqualität 2016; Umweltbundesamt, 2017; Available online: https://www.umweltbundesamt.de/publikationen/luftqualitaet-2016 (accessed on 17 November 2020).
- Zhang, J.; Wei, Y.; Fang, Z. Ozone Pollution: A Major Health Hazard Worldwide. Front. Immunol. 2019, 10, 2518. [Google Scholar]
- Klingberg, J.; Björkman, M.P.; Karlsson, G.P.; Pleijel, H. Observations of ground-level ozone and NO2 in northernmost Sweden, including the Scandian Mountain Range. AMBIO A J. Hum. Environ. 2009, 38, 448–451. [Google Scholar]
- Wehner, B.; Wiedensohler, A. Long term measurements of submicrometer urban aerosols: Statistical analysis for correlations with meteorological conditions and trace gases. Atmos. Chem. Phys. 2003, 3, 867–879. [Google Scholar]
- Baumgarten, M.; Werner, H.; Häberle, K.-H.; Emberson, L.D.; Fabian, P.; Matyssek, R. Seasonal ozone response of mature beech trees (Fagus sylvatica) at high altitude in the Bavarian forest (Germany) in comparison with young beech grown in the field and in phytotrons. Environ. Pollut. 2000, 109, 431–442. [Google Scholar]
- Treffeisen, R.; Halder, M. Spatial and temporal variation of ozone concentrations at high altitude monitoring sites in Germany. Environ. Monit. Assess. 2000, 65, 139–146. [Google Scholar]
- Oksanen, E.J. Environmental pollution and function of plant leaves. Med. Heal. Sci. 2010, V, 218–243. [Google Scholar]
- Meleux, F.; Solmon, F.; Giorgi, F. Increase in summer European ozone amounts due to climate change. Atmos. Environ. 2007, 41, 7577–7587. [Google Scholar]
- Mavroidis, I.; Ilia, M. Trends of NOx, NO2 and O3 concentrations at three different types of air quality monitoring stations in Athens, Greece. Atmos. Environ. 2012, 63, 135–147. [Google Scholar]
- Latif, M.T.; Dominick, D.; Ahamad, F.; Khan, M.F.; Juneng, L.; Hamzah, F.M.; Nadzir, M.S.M. Long term assessment of air quality from a background station on the Malaysian Peninsula. Sci. Total Environ. 2014, 482, 336–348. [Google Scholar]
- Tarasova, O.A.; Karpetchko, A.Y. Accounting for local meteorological effects in the ozone time-series of Lovozero (Kola Peninsula). Atmos. Chem. Phys. 2003, 3, 941–949. [Google Scholar]
- Dawson, J.P.; Adams, P.J.; Pandis, S.N. Sensitivity of ozone to summertime climate in the eastern USA: A modeling case study. Atmos. Environ. 2007, 41, 1494–1511. [Google Scholar]
- Singla, V.; Pachauri, T.; Satsangi, A.; Kumari, K.M.; Lakhani, A. Surface ozone concentrations in Agra: Links with the prevailing meteorological parameters. Theor. Appl. Climatol. 2012, 110, 409–421. [Google Scholar]
- Camalier, L.; Cox, W.; Dolwick, P. The effects of meteorology on ozone in urban areas and their use in assessing ozone trends. Atmos. Environ. 2007, 41, 7127–7137. [Google Scholar]
- Hänsel, S.; Ustrnul, Z.; Łupikasza, E.; Skalak, P. Assessing seasonal drought variations and trends over Central Europe. Adv. Water Resour. 2019, 127, 53–75. [Google Scholar]
- Hänsel, S. Changes in Saxon Precipitation Characteristics: Trends of Extreme Precipitation and Drought; Cuvillier Verlag: Nonnenstieg, Göttingen, Germany, 2009. [Google Scholar]
- Łupikasza, E.B.; Hänsel, S.; Matschullat, J. Regional and seasonal variability of extreme precipitation trends in southern Poland and central-eastern Germany 1951–2006. Int. J. Climatol. 2011, 31, 2249–2271. [Google Scholar]
- Schwarzak, S.; Hänsel, S.; Matschullat, J. Projected changes in extreme precipitation characteristics for Central Eastern Germany (21st century, model-based analysis). Int. J. Climatol. 2015, 35, 2724–2734. [Google Scholar]
- Spinoni, J.; Naumann, G.; Vogt, J.V.; Barbosa, P. The biggest drought events in Europe from 1950 to 2012. J. Hydrol. Reg. Stud. 2015, 3, 509–524. [Google Scholar]
- Trueba, S.; Pan, R.; Scoffoni, C.; John, G.P.; Davis, S.D.; Sack, L. Thresholds for leaf damage due to dehydration: Declines of hydraulic function, stomatal conductance and cellular integrity precede those for photochemistry. New Phytol. 2019, 223, 134–149. [Google Scholar]
- Panek, J.A. Ozone uptake, water loss and carbon exchange dynamics in annually drought-stressed Pinus ponderosa forests: Measured trends and parameters for uptake modeling. Tree Physiol. 2004, 24, 277–290. [Google Scholar]
- Jing, P.; O’Brien, T.; Streets, D.G.; Patel, M. Relationship of ground-level ozone with synoptic weather conditions in Chicago. Urban Clim. 2016, 17, 161–175. [Google Scholar]
- Wildt, J.; Rockel, P.; Lausch, E. Die Stresssignale der Pflanzen. Spektrum der Wiss. August 2001, pp. 50–55. Available online: https://www.spektrum.de/magazin/die-stresssignale-der-pflanzen/827864 (accessed on 17 November 2020).
- Fares, S.; Loreto, F.; Kleist, E.; Wildt, J. Stomatal uptake and stomatal deposition of ozone in isoprene and monoterpene emitting plants. Plant Biol. 2008, 10, 44–54. [Google Scholar] [PubMed]
- Matyssek, R.; Agerer, R.; Ernst, D.; Munch, J.C.; Osswald, W.; Pretzsch, H.; Priesack, E.; Schnyder, H.; Treutter, D. The plant’s capacity in regulating resource demand. Plant Biol. 2005, 7, 560–580. [Google Scholar] [PubMed]


| Region | Station Name | Latitude Longitude | Altitude (m a.s.l.) | Ozone and Meteorology Measurement Heights (m) | Wind Speed Measurement Height (m) | Main Tree Species | Age of Trees [Years in 2015] | Forest Canopy Height (m) | Distance between Forest Plot and ZIMEN Station (km) | |
|---|---|---|---|---|---|---|---|---|---|---|
| ZIMEN Station | Forest Plot | |||||||||
| Pfälzer Wald | Hortenkopf | 49°27ʹ N 07°82ʹ E | 606 | 550 | 3 | 10 | European Beech | 60 | 25 | 1.2 |
| Westerwald | Neuhäusel | 50°42ʹ N 07°73ʹ E | 540 | 390 | 3 | 10 | European Beech | 123 | 35 | 2.2 |
| Westerwald | Herdorf | 50°76ʹ N 07°90ʹ E | 480 | 440 | 3 | 10 | Norway spruce | 101 | 30 | 4.6 |
| Hunsrück | Leisel | 49°74ʹ N 07°19ʹ E | 650 | 660 | 3 | 10 | Norway spruce | 137 | 31 | 0.4 |
| Westeifel | Wascheid | 50°26ʹ N 06°37ʹ E | 680 | 690 | 3 | 10 | Norway spruce | 109 | 30 | 0.6 |
| Parameter/ Unit | Abbreviation | Instrument/Method (Abbreviation) | Origin of the Data as Used in the Present Study |
|---|---|---|---|
| Ozone (µg/m3) *,** | O3 | UV-Absorption (APOA360, APOA370) | ZIMEN Station |
| Nitrogen dioxide and nitrogen monoxide (μg/m3) ** | NO2 and NO | Chemiluminescence (APNA360, APNA370) | ZIMEN Station |
| Temperature (°C) | T | Platinum thermometer Pt 100 | Intermet Data **** |
| Relative air humidity * | rH | psychrometric difference (difference of wet and dry thermometer) | Intermet Data |
| Precipitation (mm) | P | Hellmann Totalisator | Intermet Data |
| Global radiation (W/cm2) | G | Pyranometer CM 11 Kipp & Zonen, Delft, NL | Intermet Data |
| Wind speed (m/s) | W | Cup anemometer in 10m above ground | ZIMEN Station |
| Air pressure (hPa) *** | Pair | Barometer | Hourly Data from German Weather Service station Trier-Petrisberg interpolated to the altitude of other stations with the aid of barometric height equation |
| Hortenkopf | Neuhäusel | Herdorf | Leisel | Wascheid | ||||||||||||
|---|---|---|---|---|---|---|---|---|---|---|---|---|---|---|---|---|
| Parameters | Regression Coefficient (Slope) | Sign. of Slope | r | Regression Coefficient (Slope) | Sign. of Slope | r | Regression Coefficient (Slope) | Sign. of Slope | r | Regression Coefficient (Slope) | Sign. of Slope | r | Regression Coefficient (Slope) | Sign. of Slope | r | |
| T (°C) | 95% Quantile | 0.079 | 0.408 | 0.016 | 0.084 | 0.090 | * | 0.518 | 0.048 | 0.257 | 0.038 | 0.207 | ||||
| Mean | 0.040 | 0.351 | 0.040 | 0.351 | 0.030 | 0.323 | 0.012 | 0.113 | 0.036 | 0.369 | ||||||
| 5% Quantile | 0.042 | 0.180 | 0.054 | 0.210 | 0.035 | 0.154 | 0.028 | 0.121 | 0.028 | 0.119 | ||||||
| P (mm) | 95% Quantile | −0.010 | * | −0.528 | −0.004 | −0.215 | −0.008 | * | −0.478 | −0.002 | −0.172 | −0.012 | * | −0.460 | ||
| Sum ↓ | −11.572 | * | −0.519 | −11.572 | * | −0.519 | −11.107 | ** | −0.555 | 1.001 | 0.059 | −15.468 | * | −0.456 | ||
| 5% Quantile | 0.000 | 0.000 | 0.000 | 0.000 | 0.000 | 0.000 | 0.000 | 0.000 | 0.000 | 0.000 | ||||||
| G (W/m2) | 95% Quantile | 3.947 | *** | 0.706 | 3.090 | ** | 0.579 | 2.006 | 0.376 | 2.267 | * | 0.496 | 2.078 | * | 0.430 | |
| Mean ↑ | 0.564 | * | 0.450 | 0.564 | * | 0.450 | 0.566 | * | 0.468 | 0.659 | * | 0.519 | 0.649 | ** | 0.540 | |
| 5% Quantile | 0.000 | 0.000 | 0.000 | 0.000 | 0.000 | 0.000 | 0.000 | 0.000 | 0.000 | 0.000 | ||||||
| VPD (kPa) | 95% Quantile | 0.014 | * | 0.474 | 0.007 | 0.237 | 0.019 | ** | 0.609 | 0.005 | 0.154 | 0.003 | 0.104 | |||
| Mean | 0.003 | 0.336 | 0.003 | 0.336 | 0.004 | * | 0.526 | 0.000 | −0.049 | 0.000 | 0.061 | |||||
| 5% Quantile | 0.000 | −0.162 | 0.000 | −0.100 | 0.000 | −0.221 | 0.000 | ** | −0.571 | −0.001 | * | −0.497 | ||||
| W (m/s) | 95% Quantile | −0.110 | * | −0.509 | −0.004 | −0.051 | −0.115 | *** | −0.894 | −0.001 | −0.012 | −0.070 | *** | −0.938 | ||
| Mean ↓ | −0.071 | *** | −0.658 | −0.071 | * | −0.658 | −0.047 | *** | −0.904 | −0.007 | −0.233 | −0.038 | *** | −0.931 | ||
| 5% Quantile | −0.062 | *** | −0.794 | −0.005 | −0.175 | −0.002 | −0.068 | −0.022 | −0.331 | −0.015 | *** | −0.780 | ||||
| O3 (ppb) | 95% Quantile | −0.399 | * | −0.510 | −0.064 | −0.087 | −0.242 | −0.372 | −0.010 | −0.017 | −0.195 | −0.262 | ||||
| Mean | −0.099 | −0.302 | −0.099 | −0.302 | 0.008 | 0.031 | 0.065 | 0.309 | −0.074 | −0.274 | ||||||
| 5% Quantile | 0.049 | 0.170 | 0.321 | *** | 0.775 | 0.220 | *** | 0.707 | 0.062 | 0.193 | 0.039 | 0.180 | ||||
| daytime O3 (ppb) | 95% Quantile | −0.499 | ** | −0.528 | 0.632 | 0.259 | −0.348 | −0.419 | −0.179 | −0.242 | −0.226 | −0.257 | ||||
| Mean | −0.175 | −0.336 | −0.175 | −0.336 | −0.071 | −0.154 | 0.037 | 0.098 | −0.128 | −0.283 | ||||||
| 5% Quantile | 0.456 | 0.309 | 0.880 | 0.483 | 0.030 | 0.088 | 0.095 | 0.286 | −0.075 | −0.239 | ||||||
| NO2 (µg/m3) | 95% Quantile | −0.489 | *** | −0.728 | −0.919 | *** | −0.915 | −0.839 | *** | −0.890 | −0.668 | *** | −0.831 | −0.773 | *** | −0.917 |
| Mean ↓ | −0.233 | *** | −0.808 | −0.233 | *** | −0.808 | −0.312 | *** | −0.909 | −0.291 | *** | −0.889 | −0.305 | *** | −0.916 | |
| 5% Quantile | −0.071 | *** | −0.725 | −0.123 | ** | −0.623 | −0.135 | *** | −0.814 | −0.117 | *** | −0.798 | −0.076 | ** | −0.618 | |
| NO (µg/m3) | 95% Quantile | −0.076 | *** | −0.790 | −0.195 | −0.798 | −0.135 | *** | −0.869 | −0.099 | *** | −0.785 | −0.060 | ** | −0.649 | |
| Mean ↓ | −0.014 | *** | −0.806 | −0.014 | *** | −0.806 | −0.032 | *** | −0.803 | −0.020 | *** | −0.754 | −0.013 | *** | −0.679 | |
| 5% Quantile | 0.000 | 0.00 | −0.005 | −0.155 | 0.000 | 0.000 | 0.000 | 0.000 | 0.000 | 0.000 | ||||||
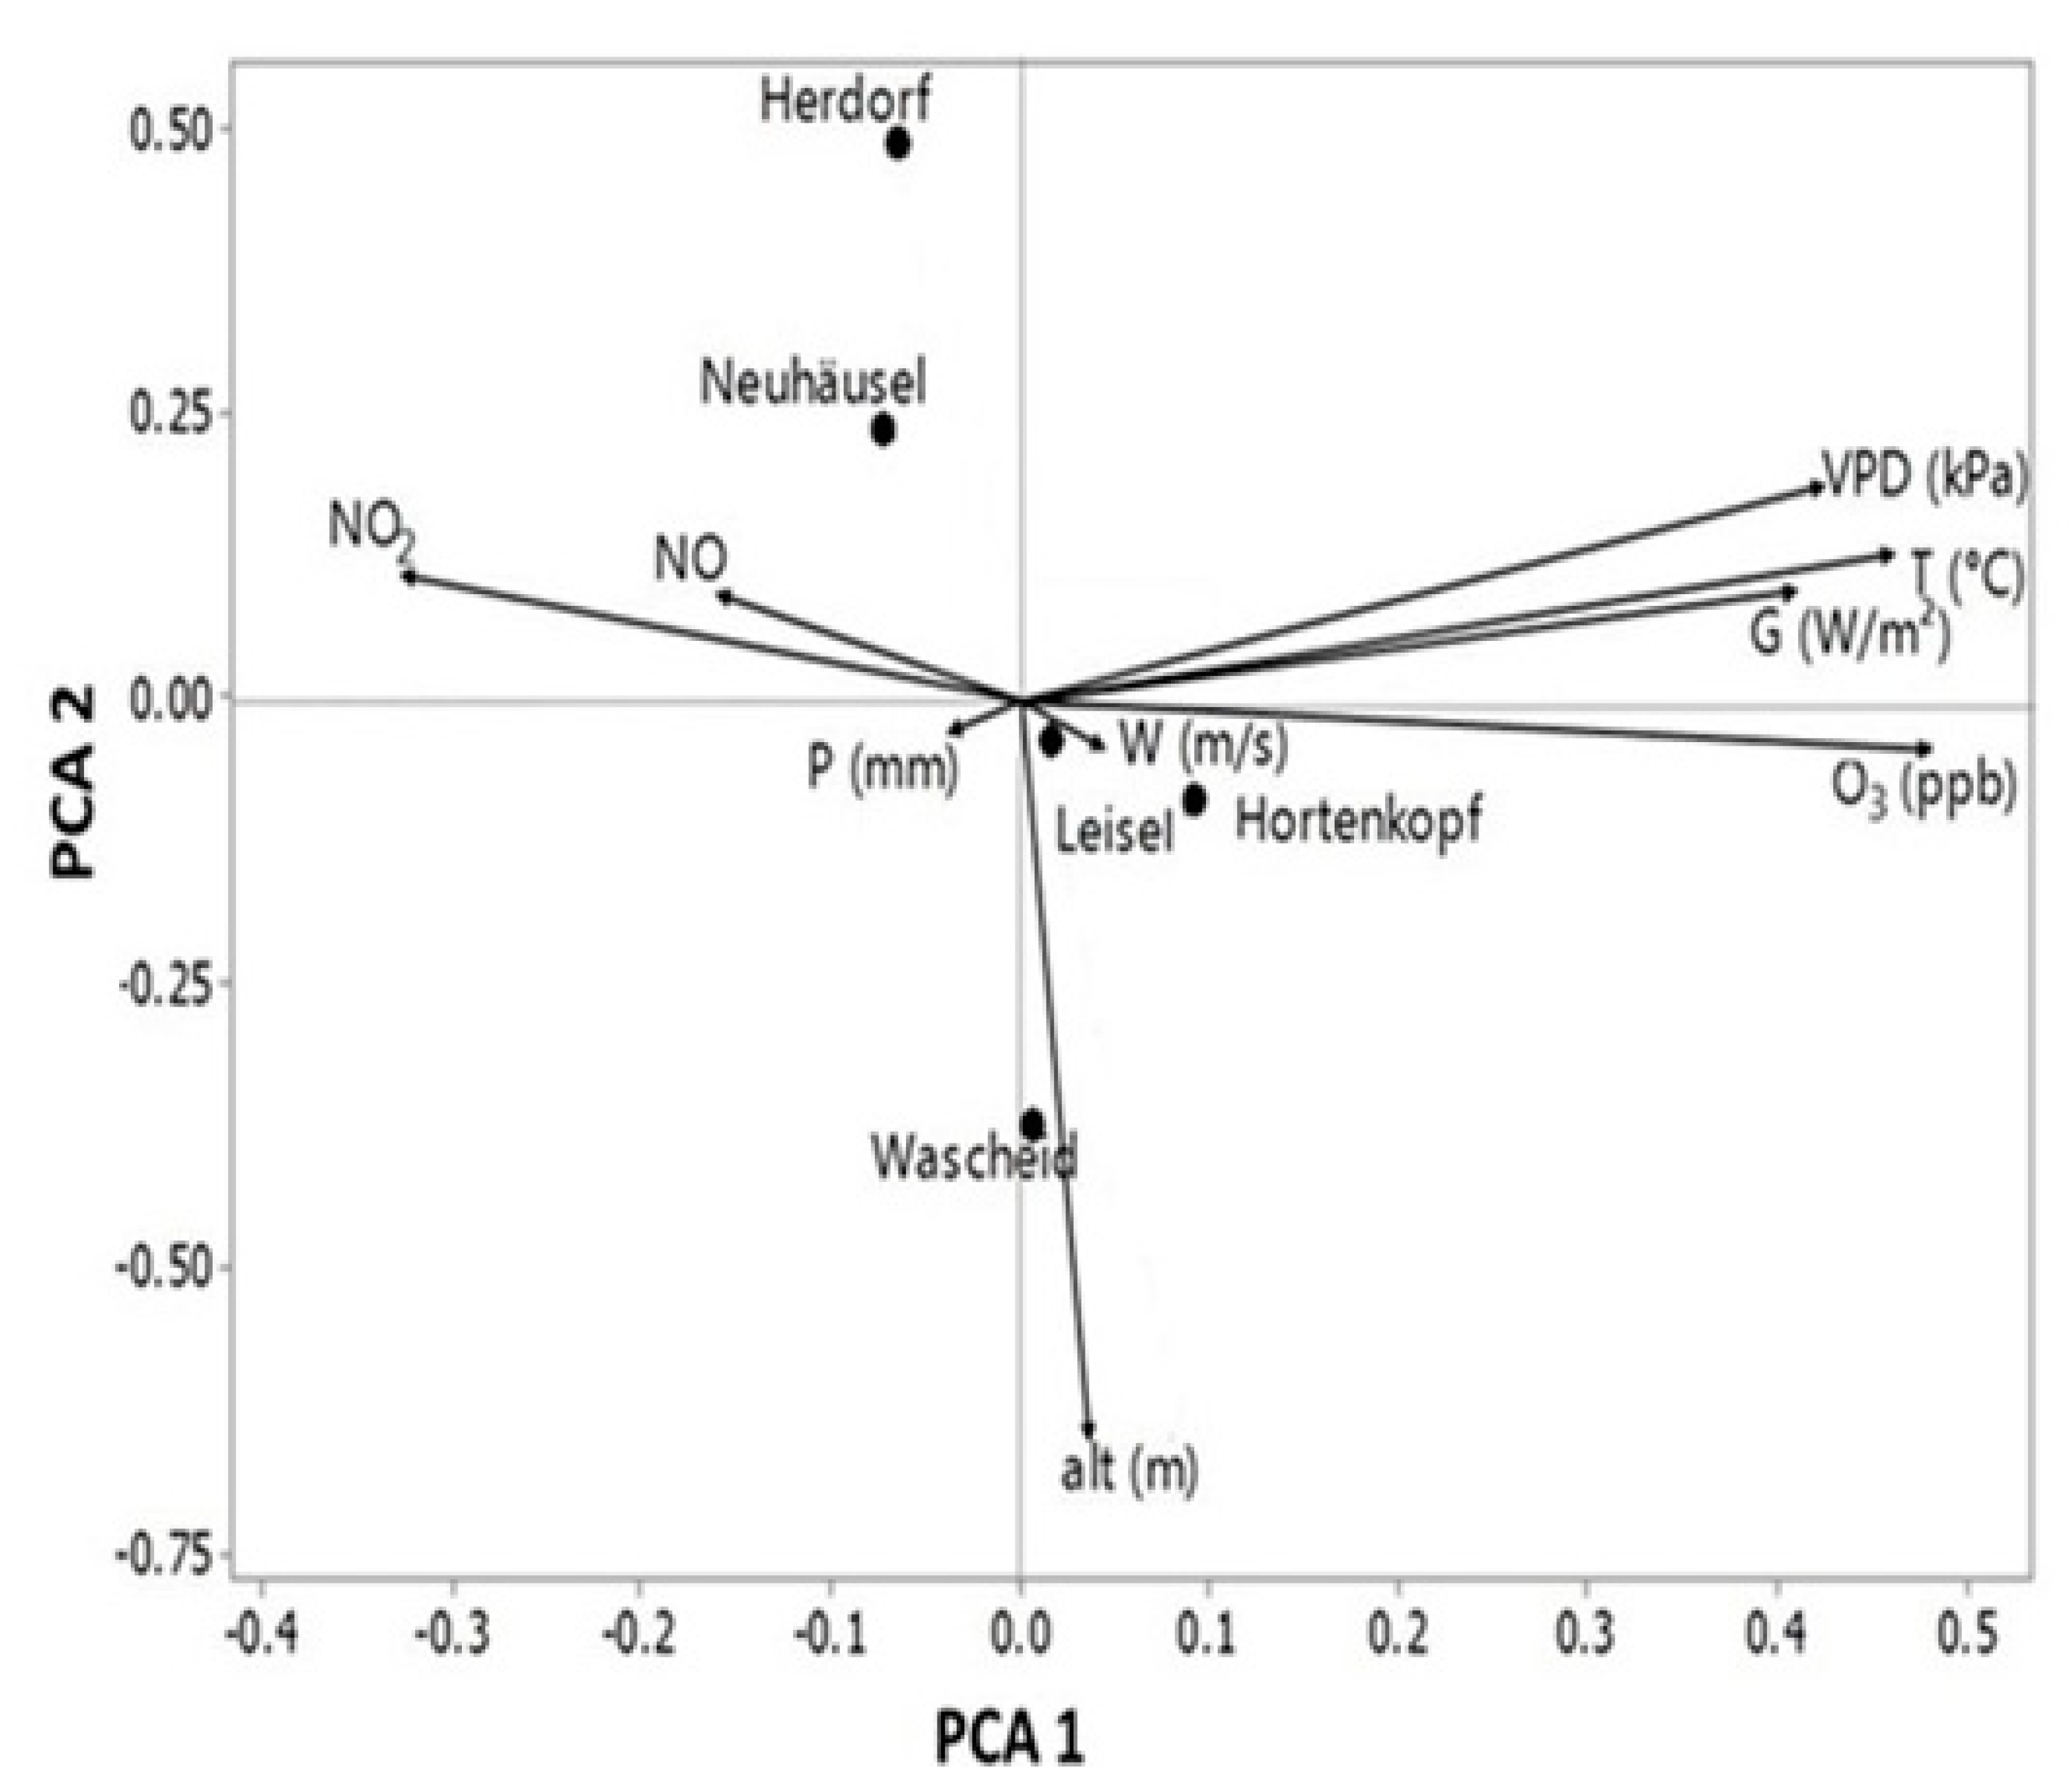
| Variable | PC1 | PC2 | PC3 | PC4 |
|---|---|---|---|---|
| alt (m) | 0.077 | −0.645 | 0.086 | −0.036 |
| T (°C) | 0.468 | 0.125 | 0.065 | −0.041 |
| P (mm) | −0.042 | −0.030 | −0.238 | 0.033 |
| G (W/m²) | 0.406 | 0.083 | 0.145 | −0.100 |
| W (m/s) | −0.008 | −0.011 | −0.473 | −0.136 |
| VPD (kPa) | 0.489 | 0.148 | 0.152 | −0.077 |
| O3 (ppb) | 0.480 | −0.012 | −0.019 | 0.004 |
| NO2 (µg/m³) | −0.321 | 0.112 | 0.335 | −0.154 |
| NO (µg/m³) | −0.147 | 0.074 | 0.328 | −0.198 |
| PC1 | PC2 | PC3 | PC4 | |
|---|---|---|---|---|
| Eigenvalue | 3.0482 | 2.3007 | 1.4908 | 1.2428 |
| Proportion (%) | 21.8 (%) | 16.4 (%) | 10.6 (%) | 9.1 (%) |
| Cumulative (%) | 21.8 (%) | 38.2 (%) | 48.8 (%) | 58 (%) |
| Site | uFC (Max PAW) from 0–100 cm | Soil Texture | Classification of the uFC |
|---|---|---|---|
| Soil Depth in (mm) | |||
| Hortenkopf | 104.1 | Sl2-Ss | medium |
| Neuhäusel | 173.4 | Lu-Ut4 | high |
| Herdorf | 56 | Lu-XGr | low |
| Leisel | 63.4 | Ls2 | low |
| Wascheid | 90.2 | Ls2 | low |
Publisher’s Note: MDPI stays neutral with regard to jurisdictional claims in published maps and institutional affiliations. |
© 2020 by the authors. Licensee MDPI, Basel, Switzerland. This article is an open access article distributed under the terms and conditions of the Creative Commons Attribution (CC BY) license (http://creativecommons.org/licenses/by/4.0/).
Share and Cite
Eghdami, H.; Werner, W.; Büker, P. Spatio-Temporal Variation of Ozone Concentrations and Ozone Uptake Conditions in Forests in Western Germany. Atmosphere 2020, 11, 1261. https://doi.org/10.3390/atmos11111261
Eghdami H, Werner W, Büker P. Spatio-Temporal Variation of Ozone Concentrations and Ozone Uptake Conditions in Forests in Western Germany. Atmosphere. 2020; 11(11):1261. https://doi.org/10.3390/atmos11111261
Chicago/Turabian StyleEghdami, Hanieh, Willy Werner, and Patrick Büker. 2020. "Spatio-Temporal Variation of Ozone Concentrations and Ozone Uptake Conditions in Forests in Western Germany" Atmosphere 11, no. 11: 1261. https://doi.org/10.3390/atmos11111261
APA StyleEghdami, H., Werner, W., & Büker, P. (2020). Spatio-Temporal Variation of Ozone Concentrations and Ozone Uptake Conditions in Forests in Western Germany. Atmosphere, 11(11), 1261. https://doi.org/10.3390/atmos11111261


