Abstract
This study carries out a quantitative analysis of the impact on microclimate (air temperature and thermal comfort) of a row of 165 historical Pinus pinea L. located in a central neighbourhood of Rome (Italy). The analysis starts from a qualitative general analysis on the stressful conditions leading to tree decline in the urban environment especially during extreme climate change phenomena. Subsequently, the effects of planting new types of trees are assessed using ENVI-met, a 3D prognostic non-hydrostatic model for the simulation of surface-plant-air interactions. Results, obtained by simulating three different scenarios in which the trees are first removed and then modified, show that a gradual renewal of the existing trees, based on priority criteria of maturity or senescence, vegetative and phytosanitary conditions, efficiency of ecosystem services and safety for citizens, has positive effects on thermal comfort. By integrating current results and scientific literature, the final aim of this work is to provide stakeholders with a strategic and systemic planning methodology, which, based on the innovative integrated use of tree management and modelling tools, may (i) enhance the benefits of greening in a scenario of climate change and (ii) lead to intervention strategies based on complementarity between conservation of existing trees and tree renewal.
1. Introduction
Climate change is a stress factor for most ecosystems as increasing temperatures and changing precipitation patterns lead to a wide variety of consequences such as sea level rise, melting of glaciers, reduction/loss of terrestrial and marine biodiversity, increased risk of coastal erosion and the occurrence and severity of weather-related disasters and many others [1]. Cities, which are the places where population is most concentrated, are highly vulnerable to climate change and, even though it is perceived as a global issue, the effects of changes are translated into local phenomena based on various environmental, social and economic factors [2].
Climate-related impacts generally refer to the effects on people, housing, health, ecosystems, economic, social and cultural goods and resources, services (including environmental services) and infrastructure. Risk of climate-related impacts is connected to the interaction of climate-related hazards with the vulnerability and exposure of human and natural systems. Vulnerability and exposure are largely the result of socio-economic pathways and societal conditions (Figure 1). Changes in both the climate system (left side of Figure 1) and socioeconomic processes (right side of Figure 1) are central drivers of the different core components (vulnerability, exposure, and hazards) that constitute risk [1].
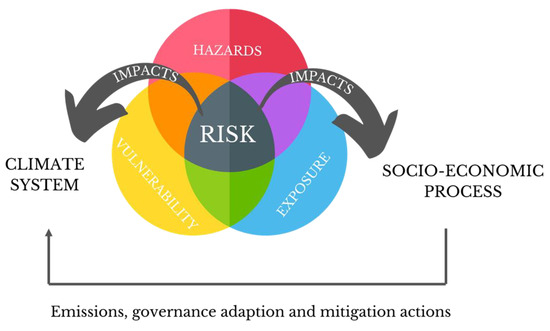
Figure 1.
Scheme of the interaction among the physical climate system, exposure, and vulnerability producing risk. Based on [1].
Currently, the challenge is to adapt to climate change that will exacerbate existing urban problems, thus worsening some problems and/or creating new ones [3] and to increase the resilience of cities through the adoption of synergistic strategies that link mitigation and adaptation with other societal objectives [4,5].
1.1. Climate Change and Urban Vegetation
Urban vegetation can make a significant contribution to climate change adaptation and mitigation strategies by cooling cities through shading and evapotranspiration, by mitigating the effects of wind speed and turbulence helping enhance pedestrian comfort, by slowing and filtering the runoff from rain events, contributing to improve water quality, and to reduce storm water runoff, flooding, and waterway pollutants and by filtering atmospheric pollutants include nitrogen dioxide and sulphur dioxide, and larger particulate matter [6,7,8,9,10,11]. However, the potential of these effects depends on the phytosanitary and biological status of the vegetation.
It is important to consider that vegetation in the urban environment is stressed by anthropic and natural factors exacerbated by climate change. Specifically, climate change influences plants at all stages of development: germination, growth, and reproduction [9]. Temperature and water availability affect the timing and success of seed germination and disrupt pollen development and fertilization [12] and reduce its viability [13], and directly affect photosynthesis and growth rates; in particular, drought reduces growth by inducing stomatal closure and decreasing photosynthetic capacity [14]. Moreover, there is evidence that elevated atmospheric carbon dioxide, increased temperature, changes to water availability and more frequent extreme weather events have direct and indirect effects on plant viruses through changes in hosts and vectors and on the virulence and pathogenicity of plant viruses [15]. In addition to severe drought in some areas, extreme rainfall events can lead to flooding. Complete submergence of the plant by flooding events may also lead to low oxygen availability in the above-ground organs, especially when water turbidity limits photosynthesis. Most plant species cannot survive prolonged submergence or soil waterlogging [16].
In many Italian cities, the current challenge is how to manage the extensive deterioration of senescent trees, which is partly natural and partly anthropogenically induced. They are often in an inappropriate condition with respect to their biological and physiological needs, which have changed since they were planted as a result of recent climate change. This also affects the safety and security of urban centres, and it is combined with a lack of knowledge and decision-making tools capable of responding effectively and efficiently to the demands of urban areas [17].
1.2. Management and Renewal of Urban Trees
In this perspective, to increase urban resilience and enhance the benefits that vegetation can provide if it is in good biological condition, it is essential to integrate the renewal of senescent trees into a larger regeneration plan that considers climate change issues. Specifically, the aim of this work is to provide stakeholders an integrated working strategy for the restoration and management of urban trees and to lead intervention strategies based on complementarity between conservation of existing trees and tree renewal.
The tree renewal must be defined based on priority criteria that can be identified as follows:
- tree senescence;
- citizen safety;
- improvement of the aesthetic quality of public green spaces;
- need to adapt the urban green spaces to climate change;
- adjustment of planting patterns;
- improvement of biodiversity;
- sustainability of tree management costs.
These criteria should be the basis for defining new planning interventions. In addition, the renewal of urban green spaces must be accompanied by studies on the species most suitable to the reference urban context and most able to provide ecosystem services, and it is also essential to activate participatory processes of the population [18].
1.3. Factors to Be Consider for a Successful Tree Establishment
Due to the critical equilibrium of today’s developing and increasingly densely populated cities, it is a priority that any intervention to improve their resilience is carefully assessed and follows scientific criteria. In urban green management and planning, it is necessary to understand the factors to consider for a successful tree establishment, especially considering the new challenges of climate change [19]. Therefore, it is important to do an appropriate species selection to minimize potential disservices and reduce future maintenance requirements [20]. This phase is based on:
- constraints: related to site (rooting environment; proximity of built structures; underground infrastructure; future space requirements and extant pollution), biological (pests’ vulnerability; invasive characteristics) and practical characteristics (plant availability; budget; management requirements);
- tree ecophysiology: i.e., adaptability to the site microclimate and environmental tolerance;
- ecosystem services;
- aesthetics.
After that, it is necessary to provide a good-quality rooting environment to secure high-quality plant material and it is important to ensure that tree establishment is not compromised by poor arboriculture practices. In fact, poor planting practices (e.g., planting too deep) or insufficient protection affect tree longevity and range of ecosystem services [19,20,21].
1.4. Scope of the Paper
Considering the above, the aim of this work is to help stakeholders in the management of trees through a technical and scientific approach that considers the critical climate change impacts that cities have to deal with, the health of vegetation and the loss/acquisition of ecosystem services as a result of renewal actions.
In the next section, the operational steps are reported, taking as a case study Corso Trieste located in Rome (Italy), with the description of the tools used for field data collection (e.g., SYSTUS web app) and for the fluid dynamic modelling analysis (ENVI-met); then, the results obtained from the microclimatic modelling analysis are reported and the effects of removing and adding trees in the investigated area are analysed; finally, discussing the obtained results and the reported criteria, we propose some species to be planted in a tree renewal project.
2. Methodology
Figure 2 summarises the methodological steps followed in this study. To characterise the study area, field measurements were performed allowing for the (i) geo-referenced census of the trees, (ii) collection of vegetation (leaf area index: LAI, height, crown depth, etc.) and (iii) morphological characteristics (aspect ratio: H/W, where H is the height of the buildings and W the width of the street). Collected data were then employed to perform ENVI-met simulations for different scenarios and evaluate the impact of current and renewed trees on air temperature and thermal comfort.
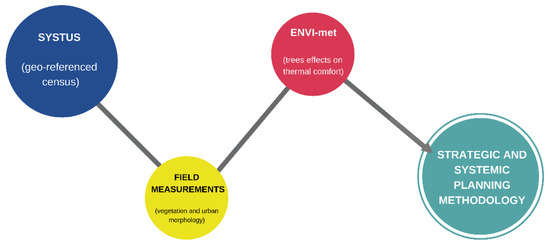
Figure 2.
Methodological steps.
2.1. Study Area
Corso Trieste is a 1.6 km long road that has given its name to the 17th district of Rome since 1946 (Figure 3). Urban morphology of this road was planned in the municipal master plan of 1909 and was carried out between 1924 and 1930 between Road Nomentana and Istria Square.
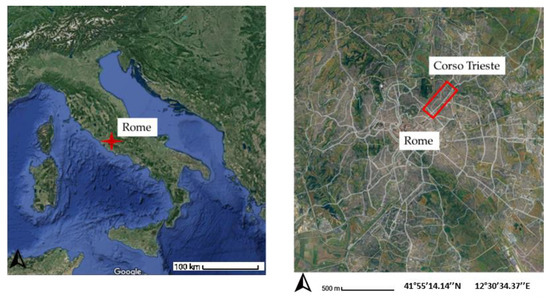
Figure 3.
(Left): Position of the city of Rome in central Italy. (Right): Focus on Rome with indication of the Corso Trieste (from Google Earth).
Corso Trieste is characterised by the presence of Pinus pinea L. that were planted in 1930 in the centre of the traffic barrier. The planting of Pinus pinea L. along the traffic island can also be seen by comparing satellite pictures from 1945 and 2020 (Figure 4).
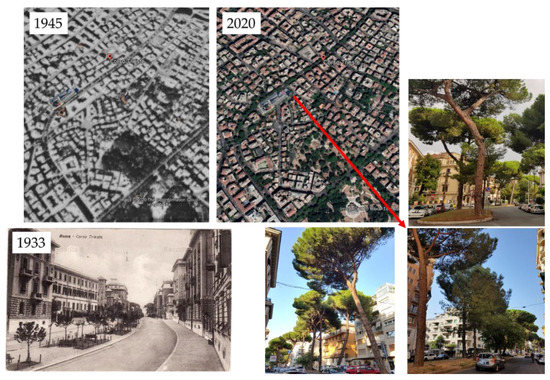
Figure 4.
Corso Trieste in Rome (Italy). Left: 1945 satellite image from Google Earth and a 1933 historical photo (https://www.romasparita.eu/foto-roma-sparita/70111/corso-trieste-2, accessed on 31 March 2021). Right: Current satellite images and pictures.
Attorre et al. [21] documented that in the 1955 census of Rome’s green areas, which reported about 47,000 trees divided into 29 species, Pinus pinea L. was the most widely used with about 28% of the total. Specifically, the extensive use of this species occurred during the Fascist period. In fact, Pinus pinea L., considered to be the most beautiful tree in Italy, was the symbol of the regime’s cultural links with the Roman Empire. After the “explosion” during this period, Pinus pinea L. was used more sparingly, with its percentage dropping to 7%. This was due to the various problems that Pinus pinea L. produces in the urban environment related to the branching of its superficial roots that causes considerable damage to pavements and road surfaces.
Currently, Corso Trieste is characterised by the presence of a central row of 165 Pinus pinea L. and 17 Cercis siliquastrum L., specifically, historical Pinus pinea L. specimens (referred to as “old”) alternate with younger specimens (referred to as “new”) (Figure 5).
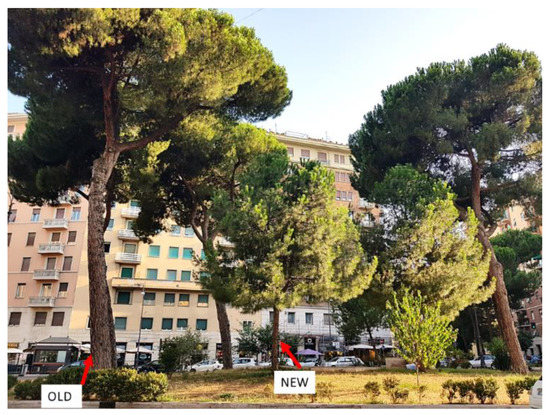
Figure 5.
A picture of Corso Trieste characterised by historical specimens (old) and young specimens (new) of Pinus pinea L.
2.2. Developing a Geo-Referenced Database of Corso Trieste
To characterise the area, the first step consisted in geo-referencing trees using the SYSTUS platform (www.systus.it, accessed on 1 March 2021) (Figure 6). SYSTUS is a web-based data collection and analysis programme designed and produced by Fagus Lab s.r.l. The programme permits integrated management of all analysed trees’ information and of visual and instrumental analyses; to take notes; prescriptions to fill in schedule interventions and priorities and to consult work history. In fact, in the context of the current Minimum Environmental Criteria (MEC) for the management of public green areas and the distribution of green maintenance products (Italian decree 10 March 2020), the programme allows for the tree census as a fundamental tool for the correct planning of new green areas and the green maintenance service, for the requalification of the existing infrastructure and for estimating the economic investments needed to maintain the functionality of the green infrastructure; and it must necessarily be supported by the constitution of a database (geo-referenced).
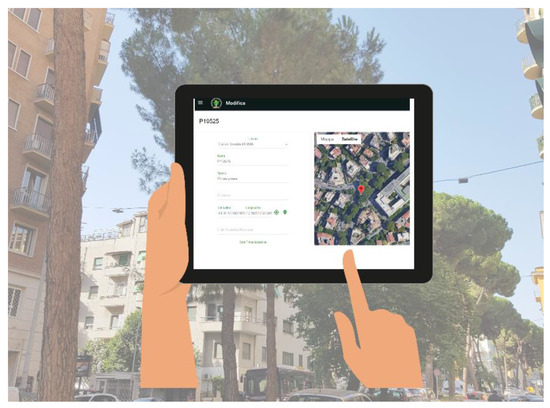
Figure 6.
SYSTUS interface (www.systus.it, accessed on 31 March 2021) used to geo-reference Pinus pinea L. along Corso Trieste.
2.3. Field Measurements
2.3.1. Vegetation Characterisation
The second step was to measure the LAI (m2m−2), i.e., the leaf area per unit soil surface, which is essential for the study of forest and agricultural cover. The measurement was carried out through the ceptometer AccuPar LP-80 (Figure 7). The LP-80 has been validated for plants of various sizes, from the smallest to the largest [22,23,24].
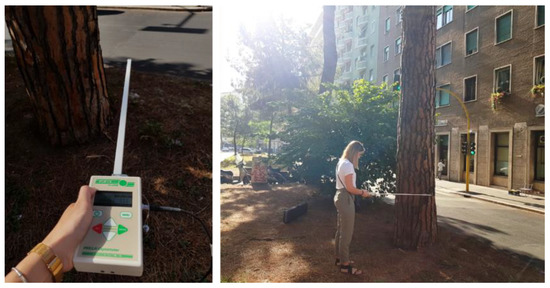
Figure 7.
(Left): AccuPar LP-80 ceptometer. (Right): LAI measurements performed during the campaign.
Eight LAI measurements were taken at 45° intervals following a circular pattern [25]. The measurements were carried out under optimal light conditions and at the same time, i.e., 12:00 a.m., to minimise the shading effect of the buildings. Finally, after LAI measurements, the height and the crown width of each Pinus pinea L. in the investigated area were measured. This data is essential for a more accurate representation of the properties of each single vegetation element within ENVI-met (see Section 2.4).
The vegetation was modelled using ENVI-met Albero tool. This tool made it possible to accurately reconstruct the crowns’ geometry and characterise them with the correct height, width and leaf area density (LAD, m2m−3), given by the ratio between LAI and crown width (Figure 8).
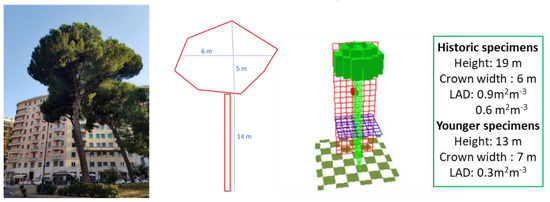
Figure 8.
Example of steps followed for the creation of a 3D model of Pinus pinea L. with the ENVI-met Albero tool. Left: Photographic survey; middle: Measurement and plant geometry simplification; right: Three-dimensional model of Pinus pinea L. In the green box the characteristics of historical and younger specimens are reported.
The LAD calculated for younger specimens of Pinus pinea L. is 0.3 m2m−3. Two different LADs were obtained for the historical specimens: 0.9m2m−3 (historical specimens with more extensive canopy) and 0.6 m2m−3 (historical specimens with less extensive canopies) (the other geometric characteristics are shown in Figure 8). The canopies’ complex geometries were simplified into geometries that could be more easily modelled in 3D for subsequent reconstruction in ENVI-met, making minimal approximations to the real measurements.
2.3.2. Urban Morphological Characterisation
In urban planning and regeneration processes, the study of urban geometry is of crucial importance to avoid the pollutants and heat accumulation. In fact, reduced ventilation in street canyons can affect heat dispersion and lead to high temperatures and thermal discomfort. In such urban geometries, the presence of aerodynamic obstacles, such as vegetation itself, can indeed lead to pollutant trapping [26,27]. For this reason, in order to deeply investigate the role of Pinus pinea L. along Corso Trieste, the morphological characterisation was carried out by acquiring measurements of the buildings’ height and the street width using a telelaser LEICA DISTO D810 (Swiss Technology by Leica Geosystems, St. Gallen, Switzerland; www.leicadisto.it, accessed on 1 March 2021).
From the measurements, Corso Trieste can be defined as a regular canyon with an average buildings’ height of 20 m and a street width of 24 m.
2.4. Model Description and Modelling Set-Up
ENVI-met is a microclimate prognostic non-hydrostatic model that well investigates the surface-plant-air interactions. It is composed of a 3D main model and a one-dimensional (1D) atmospheric boundary layer (ABL) model which extends from the ground surface up to 2500 m. ENVI-met has a typical horizontal resolution from 0.5 m to 5 m and a typical time frame of 24 h to 48 h with a time step of 1 s to 5 s, which meet the criteria for the accurate simulation of physical processes, suitable for microclimate studies at the neighbourhood scale. The atmospheric system solves Reynolds-averaged Navier–Stokes equations using a 1.5 order turbulence closure k-ε model. See the ENVI-met official website (www.envi-met.com, accessed on 1 March 2021) for complete documentation.
The set-up employed in this paper is similar in terms of turbulence model, initial and boundary conditions, and grid size to that used by some of the authors in Gatto et al. [28]. Specifically, here, the 3D simulation area (computational domain) of the investigated neighbourhood had a dimension of 590 m (x direction) × 1040 m (y direction) with a vertical height (z direction) of 60 m. The studied area was meshed with a grid resolution of 2 m × 2 m × 2 m, except for the lowest five cells (close to the ground) whose vertical resolution was 0.4 m. This grid resolution permits to well capture physical phenomena like shear layers and vortices and consequently, the simulation results are close to real condition [29]. To improve model accuracy and stability, 10 nesting grids were also employed. In this way, it has been widely observed that when distancing the boundaries of the model from the area under examination, it is possible to minimize the undesired effects caused by the boundary (see www.envi-met.info, accessed on 31 March 2021 and [29]). Hourly air temperature and relative humidity were forced at the model boundary to drive the simulation with meteorological input obtained from a 10-m-high ARPA-Lazio (the Regional Agency for Environmental Protection of the Lazio region) meteorological station located a few kilometres from the interested area (http://dati.lazio.it/catalog/it/dataset/rete-micrometeorologica, accessed on 1 February 2021). The hottest summer day (June, July, August) of the year 2019, the average wind speed and the median wind direction were chosen. Soil was characterised using: Asphalt Road for roads and Default Soil for the representation of the traffic island soil.
It should be underlined that we were using the Multi Core mode, during which no other applications on the workstation were run, with an Intel(R) Core(TM) i7-8700 CPU 3.20 GHZ with a RAM of 16 GB; the simulation, being the studied area, was very large and detailed, and ran for about 10 days. Details about initial and boundary conditions used in ENVI-met simulations are collected in Table 1.

Table 1.
Initial and boundary conditions used in ENVI-met simulations.
2.5. Investigated Scenarios
To analyse the effect of Pinus pinea L. along Corso Trieste, several scenarios were simulated (Figure 9):
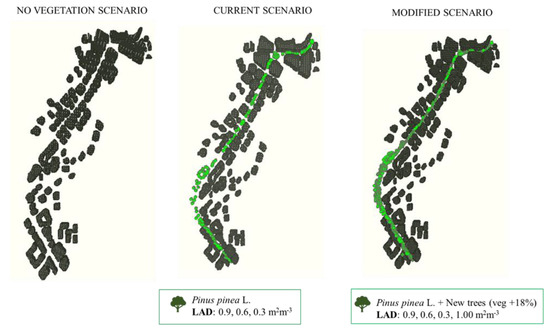
Figure 9.
Modelling of the 3D study area in ENVI-met. (Left): No vegetation scenario; (middle): Current vegetation scenario; (right): Modified scenario.
- a scenario without vegetation (no vegetation scenario);
- the current one in which the 3D-reproduced Pinus pinea L. were introduced;
A modified scenario where a partial renewal of the existing Pinus pinea L. was assumed.
Specifically, 40 old Pinus pinea L. were removed (20 with a LAD of 0.6 m2m−3 and 20 with a LAD of 0.9 m2m−3) and 70 trees were added with a LAD of 1.00 m2m−3 (which is equivalent to an addition of 2040 m2 of vegetation) built ad hoc in the ENVI-met Albero tool and whose geometry is shown in Figure 10.
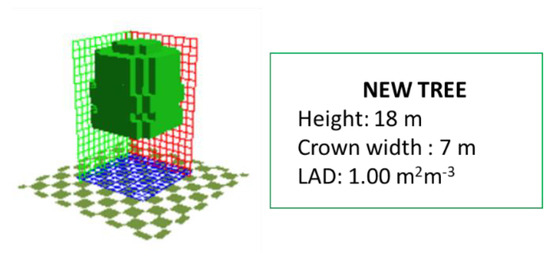
Figure 10.
3D geometry of the new tree model in the modified scenario.
In the modified scenario, considering the canyon’s morphological characteristics and since trees are located along the centre line, in order to avoid ecosystem disservices (see Section 2.3.2), the choice of the species to be planted has to consider the shape and horizontal development of the crown. In this perspective, an 18-m-high tree with a crown width of 7 m and height of 6 m was chosen, in order to allow ventilation below it. In the current scenario, the height of the old Pinus pinea L. allows a wide ventilation within the canyon [30,31,32,33,34]—a prerogative that must be considered in the planning and renovation phase.
2.6. Investigated Indices
This study investigates the microclimatic effect of Pinus pinea L. and of potential replanting along Corso Trieste, specifically evaluated in terms of thermal comfort through the predicted mean vote (PMV) and mean radiant temperature (MRT) calculated by ENVI-met at pedestrian level (1.4 m a.g.l.). Specifically, MRT is defined as [35]:
where Tg = globe temperature (°C), v = wind velocity (m s−1), Tair = air temperature (°C), D = globe diameter = 40 mm and ε = globe emissivity = 0.97. MRT strongly depends on shortwave and longwave radiation, therefore, given the contribution of building shading on shortwave radiation, the parameter was extracted at 12.00 a.m. to better understand the effect of vegetation shading.
The model, once simulated Tair, Rh, wind velocity (v) and MRT, is able to calculate the outdoor PMV that is an evaluation of the thermal sensation based on the heat balance of the human body [36]. Outdoor PMV ranges from −4 (very cold) to 4 (very hot), with 0 being neutral. Nevertheless, summer outdoor heat stress conditions can easily produce PMV values above +4 (+8 and more) and below −4 (−8 and less) [37].
To evaluate the microclimate effect of Pinus pinea L. along Corso Trieste, three points along the street canyon were selected and the time evolution of PMV and MRT parameters were obtained (at a height of 1.4 m) (Figure 11). These points, randomly chosen because they are located close to the street ends and in the middle of the street, were selected to evaluate the effect of vegetation cover and the impact of building shading on pedestrian thermal comfort.
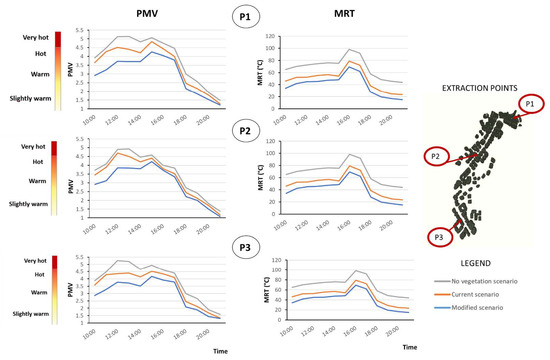
Figure 11.
Time evolution of PMV and MRT at different points (P1, P2, P3) in the street canyon shown in the top at right.
3. Results
3.1. Time Evolution of Microclimatic Variables at Different Points
Looking at the PMV, it can be observed that the best thermal comfort is experienced by the modified scenario during the whole day. The biggest difference in comparison with the no vegetation scenario both for the current and the modified scenario are between 12:00 and 13:00. At P1, the maximum difference is 0.61 for the current scenario and 1.41 for the modified scenario at 12:00 and 0.73 and 1.42 respectively at 13:00. At P2, the maximum difference is 0.23 for the current scenario and 1.05 for the modified scenario at 12:00 and 0.42 and 1.08 respectively at 13:00. At P3, the maximum difference is 0.91 for the current scenario and 1.49 for the modified scenario at 12:00 and 0.80 and 1.49 respectively at 13:00.
Based on the MRT results, there is no significant difference in MRT temporal trends at the three points. This is mainly due to the uniformity of the distribution of trees along the street canyon, a uniformity that also concerns shading at all other hours investigated. MRT peaks are at 16:00, after which the trend tends to decrease. In all the three points, the maximum difference compared to the no vegetation scenario is at 15.00 for the current scenario and at 18.00 for the modified scenario. At P1, the maximum difference is 21 °C for the current scenario and 30 °C for the modified scenario. At P2, the maximum difference is 20.78 °C for the current scenario and 29.78 °C for the modified scenario. At P3, the maximum difference is 20.91 °C for the current scenario and 29.91 °C for the modified scenario.
3.2. Spatial Distribution of Microclimate Variables
The spatial distribution of air temperature (Tair), PMV and MRT at 12.00 is investigated. At this hour, the effect of vegetation was found to be significant. Further, this hour allows for a better estimation of the effect of shading from the vegetation and excludes shading from buildings. Values of microclimate variables at pedestrian height (1.4 m) are shown in Figure 12. In addition, the averages over the area are also computed.
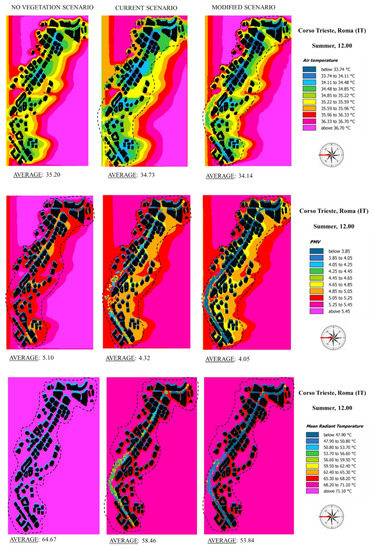
Figure 12.
Spatial distribution maps of the Air Temperature, Predicted Mean Vote (PMV) and Mean Radiant Temperature (MRT) values at 12.00 a.m. at a pedestrian height of 1.4 m. The dotted line indicates the area where the average of the indices was calculated.
The comparison of the three scenarios shows that the presence of vegetation leads to an average decrease in Tair and an improvement in thermal comfort. Specifically, it is observed:
- the average Tair decreases in the current scenario by 0.47 °C compared to the scenario without vegetation. This decrease is more pronounced in the modified scenario with a difference of 1.64 °C;
- the average PMV decreases in the current scenario by 0.78 points. Additionally, in this case, but less clearly than in the Tair scenario, the decrease is more pronounced in the modified scenario with an observed difference of 1.05 points;
- the average MRT decreases clearly in the presence of vegetation with a difference of 6.21 °C in the current scenario and 10.83 °C in the modified scenario;
- the spatial distribution maps of the investigated indices show that the microclimatic effect of vegetation is not localised, but also influences the areas immediately nearby.
4. Discussion
Analysing the results, it is possible to observe that, in line with the scientific literature, due to their shading effect, energy balance and transpiration cooling, vegetation results to be the most effective strategy to mitigate daytime urban human heat stress and so it is an important climate change mitigation strategy [37,38,39,40,41]. Specifically, here, the presence of Pinus pinea L. has a positive effect on the mitigation of air temperature and the improvement of thermal comfort along Corso Trieste. By specifically observing the results of the analysed thermal comfort indices, it is also possible to assume that:
- the increase of non-asphalted and cemented surfaces and the increase of green covers modulate the radiant heat leading to an improvement of thermal comfort during summer days. In fact, the marked decrease of MRT in the scenarios with vegetation is due to both the increase of shaded area and the presence of soil (Default Soil) in the traffic island, as already observed in the literature [28,42,43]; moreover, the difference of 4.62 °C for MRT between the current and the modified scenario is due to the removal of 40 Pinus pinea L. and the introduction of 70 new trees with higher leaf density and crown width. As already observed in the literature [34], Pines do not change the MRT index considerably compared to other species due to their height development;
- the extent, continuity and compactness of the vegetation cover along Corso Trieste are certainly a factor that influences the overall positive effect of the vegetation. Increasing the compactness of the vegetation, in fact, in the modified scenario, there is a further improvement of the microclimatic conditions and a more efficient mitigation action;
- it is possible to observe that the differences found between the current scenario with Pinus pinea L. and the modified scenario are due to the increase in vegetation, equal to 2040 m2, with LAD greater than 1.00 m2m−3, so it is possible to conclude that the magnitude of the reductions of Tair, MRT and PMV is dependent on the crown coverage [28,44,45,46]. However, since the model considers the microclimate effect of trees that are already well developed, it should be pointed out that this effect cannot be considered immediate with new plantings;
- MRT is drastically reduced by building shadow because it strongly affects shortwave radiation [44].
Current results confirm that different factors influence the vegetation mitigation effect: (i) urban settings, (ii) tree characteristics, e.g., species, size, arrangement and leaf area density, (iii) prevailing micrometeorological conditions.
Considering the geometric characteristics of the area and analysing the positive results obtained by adding trees with the chosen characteristics, the species that could meet the needs and be most suitable, according to the criteria reported in Table 2 are (www.vivaistiitaliani.it/qualiviva/; www.citree.de, accessed on 31 March 2021; [47]): Tilia platyphillos Scop., Tilia tomentosa Moench, Tilia cordata Mill., Acer campestre L., Platanus acerifolia (Aiton) Willd. and Quercus ilex L. These species are suitable for urban conditions and for planting in street canyon. However, the planting of Platanus acerifolia (Aiton) Willd. and Quercus ilex L. should be carefully considered. Indeed, they are listed among the recommended species for their excellent adaptability in urban environments, their resistance to pollution and their high CO2 storage potential. However, both emit high levels of biogenic volatile organic compounds (bVOC) and Quercus ilex L. is currently severely affected by the wide spread of Nidularia pulvinate (Planchon, 1864) (HEMIPTERA KERMESIDAE), a mealybug of Asian origin.
Table 2.
Recommended species and selection criteria considered.
A Planning Methodology to Enhance the Benefits of Urban Vegetation
Managing senescent trees, subjected to multiple stresses and worn out by incorrect maintenance practices, and planting new trees is a priority of most environmental and urban regeneration programmes in the present scenario of global changes, not only climate change. Currently, the COVID-19 pandemic has also demonstrated how a sustainable and resilient environment at both urban and natural levels is necessary to deal with unexpected emergencies [48]. Moreover, in the context of the European financial recovery plan #Nextgeneration, Italy has drafted a National Recovery and Resilience Plan that includes funds for the green revolution [49]. It will be important that policymakers have scientific and rigorous tools to exploit this financial economic opportunity.
This study, in line with the already existing guidelines for the management of urban tree planting and the legislation in force in Italy (Law 10/2013), contributes to setting up a methodological process that can support policy-makers in the planning and then, management, of new urban tree planting. This process, based on literature studies and the authors’ experiences, can be outlined as follows:
Screening (the first phase based on field and remote data collection) consisting in:
- geo-referenced census of vegetation;
- visual tree assessment: each tree is carefully observed, taking into account its morphology, physiological aspect and biomechanical characteristics;
- geometric characterisation: acquisition of data on the urban geometry investigated (i.e., H/W for a street canyon);
- meteorological characterisation: acquisition of meteorological data of the study area;
- anthropic pressures characterisation: acquisition of data on traffic (i.e., estimation of PM2.5, nitrogen oxides (NOX) emissions) and identification of any other relevant sources of atmospheric pollution;
- area characterisation: identification of sensitive points, main users of the area, site limitations such as soil type or light;
Extensive analysis (this phase is highly dependent on the screening results. A co-ordinated team of experts in different fields is needed to co-operate and make decisions) consisting in:
- instrumental analysis of trees: if visual tree assessment requires a more detailed inspection of any anomalies found, specific instrumental analysis is required;
- analysis with computational models: these tools are able to quantify and predict, with scientific accuracy, several environmental parameters (air temperature, relative humidity, wind speed and direction, concentration and dispersion of pollutants, etc.);
- redevelopment and/or planning project;
- indication of the species to be removed: the trees to be removed will be those that show symptoms or serious defects, detected by visual tree assessment and instrumental analysis;
- choice of new species: physiological tolerance, biological interactions, environmental performance (better trapping rate of air pollutants, better mitigation effects on temperature, bVOC emissions, pollen emissions, summer branch drop, etc.) will be taken into account;
Planting, management and monitoring:
- for planting, consider new planting techniques and employ specialised workers;
- management and monitoring must be constant and long-lasting.
Communication with stakeholders (this phase may be simultaneous with all previous phases and may not only be limited to the communication of results) consisting in:
- technical reports;
- scientific publications;
- presentations at public conferences.
5. Conclusions
This work is focused on the quantitative analysis of the impact on microclimate (air temperature and thermal comfort) of a row of 165 historical Pinus pinea L. located in a central neighbourhood of Rome (Italy). To guide the choices of policymakers in a project of gradual renewal of trees with a view to climate change, vegetative health, safety and ecosystem services for the population, an innovative approach based on the integrated use of a web-based tree management platform (SYSTUS) and a modelling tool (ENVI-met) was proposed. The results show that the gradual replacement of Pinus pinea L. has no negative effects on thermal comfort and that adding trees with higher leaf density can lead to a reduction of Tair, MRT and PMV.
According to this study, urban greenery planners are advised to:
- follow a technical-scientific protocol for regeneration of urban space characterised by historic trees aimed at protecting the historical identity and also the environmental and economic value of the area and at improving urban resilience to climate change;
- prefer the gradual renewal of trees, starting with those that have been shown to be suffering from environmental and urban conditions or to be dangerous to the safety of citizens;
- choose replacement trees carefully to avoid ecosystem disservices and to enhance beneficial effects.
Future studies will quantify the effect of introducing new species on air quality and ventilation and the social perception of historical trees in order to quantify the impact of their replacement.
Author Contributions
Conceptualization, E.G. and L.P.; formal analysis, E.G. and R.B.; investigation, E.G., R.B. and L.P.; methodology, R.B., L.P. and J.L.S.; supervision, R.B.; visualization, E.G.; writing—original draft, E.G.; writing—review and editing, R.B. and J.L.S. All authors have read and agreed to the published version of the manuscript.
Funding
The first author (Elisa Gatto) acknowledges the PhD financial support of the Italian Ministry of University and Research (MIUR) by the PON project “Dottorati Innovativi con caratterizzazione Industriale, project code DOT1412034, Borsa n. 2”, PhD course in “Scienze e Tecnologie Biologiche ed Ambientali”, XXXIII cycle, University of Salento.
Institutional Review Board Statement
Not applicable.
Informed Consent Statement
Not applicable.
Data Availability Statement
Data sharing: Not applicable.
Conflicts of Interest
The authors declare no conflict of interest.
References
- Field, C.B.; Barros, D.J.; Dokken, K.J.; Mach, M.D.; Mastrandrea, T.E.; Bilir, M.; Chatterjee, K.L.; Ebi, Y.O.; Estrada, R.C.; Genova, B.; et al. Climate Change 2014: Impacts, Adaptation, and Vulnerability. Part A: Global and Sectoral Aspects. Contribution of Working Group II to the Fifth Assessment Report of the Intergovernmental Panel on Climate Change; Cambridge University Press: Cambridge, UK; New York, NY, USA, 2014. [Google Scholar]
- Snover, A.K.; Whitely, B.L.; Lopez, J.; Willmott, E.; Kay, J.; Howell, D.; Simmonds, J. Preparing for Climate Change: A Guidebook for Local, Regional, and State Governments; ICLEI—Local Governments for Sustainability: Oakland, CA, USA, 2007. [Google Scholar]
- Ecologic Institute; AEA; ICLEI; European Secretariat and the Regional Environmental Center for Central and Eastern Europe (REC). Adaptation to Climate Change—Policy Instruments for Adaptation to Climate Change in Big European Cities and Metropolitan Areas; European Union, Committee of the Regions (CoR): Berlin/Wien, Germany, 2010. [Google Scholar]
- Alves Carvalho Nascimento, L.; Shandas, V. Integrating Diverse Perspectives for Managing Neighborhood Trees and Urban Ecosystem Services in Portland, OR (US). Land 2021, 10, 48. [Google Scholar] [CrossRef]
- Khalaim, O.; Zabarna, O.; Kazantsev, T.; Panas, I.; Polishchuk, O. Urban green infrastructure inventory as a key prerequisite to sustainable cities in ukraine under extreme heat events. Sustainability 2021, 13, 2470. [Google Scholar] [CrossRef]
- Bowler, D.E.; Buyung-Ali, L.; Knight, T.M.; Pullin, A.S. Urban greening to cool towns and cities: A systematic review of the empirical evidence. Landsc. Urban. Plan. 2010, 97, 147–155. [Google Scholar] [CrossRef]
- Davern, M.; Farrar, A.; Kendal, D.; Giles-Corti, B. Quality green public open space supporting health, wellbeing and biodiversity: A literature review. In Report prepared for the Heart Foundation, SA Health, Department of Environment, Water and Natural Resources, Office for Recreation and Sport, and Local Government Association (SA); University of Melbourne: Parkville, Australia, 2016. [Google Scholar]
- Santamouris, M.; Osmond, P. Increasing green infrastructure in cities: Impact on ambient temperature, air quality and heat-related mortality and morbidity. Buildings 2020, 10, 233. [Google Scholar] [CrossRef]
- Nasrollahi, N.; Ghosouri, A.; Khodakarami, J.; Taleghani, M. Heat-mitigation strategies to improve pedestrian thermal comfort in urban environments: A review. Sustainability 2020, 12, 10000. [Google Scholar] [CrossRef]
- Song, P.; Kim, G.; Mayer, A.; He, R.; Tian, G. Assessing the ecosystem services of various types of urban green spaces based on i-Tree Eco. Sustainability 2020, 12, 1630. [Google Scholar] [CrossRef]
- Hamann, E.; Denney, D.; Day, S.; Lombardi, E.; Jameel, M.I.; MacTavish, R.; Anderson, J.T. Review: Plant eco-evolutionary responses to climate change: Emerging directions. Plant Sci. 2020, 304, 110737. [Google Scholar] [CrossRef]
- Zinn, K.E.; Tunc-Ozdemir, M.; Harper, J.F. Temperature stress and plant sexual reproduction: Uncovering the weakest links. J. Exp. Bot. 2010, 61, 1959–1968. [Google Scholar] [CrossRef]
- Hatfield, J.L.; Prueger, J.H. Temperature extremes: Effect on plant growth and development. Weather. Clim. Extrem. 2015, 10, 4–10. [Google Scholar] [CrossRef]
- Driesen, E.; Van den Ende, W.; De Proft, M.; Saeys, W. Influence of environmental factors light, CO2, temperature, and relative humidity on stomatal opening and development: A review. Agronomy 2020, 10, 1975. [Google Scholar] [CrossRef]
- Moreno-Delafuente, A.; Viñuela, E.; Fereres, A.; Medina, P.; Trębicki, P. Simultaneous increase in CO2 and temperature alters wheat growth and aphid performance differently depending on virus infection. Insects 2020, 11, 459. [Google Scholar] [CrossRef] [PubMed]
- Loreti, E.; Van Veen, H.; Perata, P. Plant responses to flooding stress. Curr. Opin. Plant Biol. 2016, 33, 64–71. [Google Scholar] [CrossRef]
- MATTM. Linee Guida per il Governo Sostenibile del Verde Urbano; Comitato per lo Sviluppo del Verde Pubblico: Minambiente, Italy, 2017. [Google Scholar]
- Linee Guida per la Gestione dei Patrimoni Arborei Pubblici (Nell’ottica del Risk Management); Associazione Italiana Direttori e Tecnici Pubblici Giardini, Editoriale Sometti: Mantova, Italy, 2015.
- Hirons, A.D.; Thomas, P. Environmental challenges for trees. In Applied Tree Biology; John Wiley & Sons Ltd.: Hoboken, NJ, USA; University Centre Myerscough: Preston, UK, 2017. [Google Scholar]
- Roman, L.A.; Conway, T.M.; Eisenman, T.S.; Koeser, A.K.; Barona, C.O.; Locke, H.D.; Jenerette, G.D.; Ostberg, J.; Vogt, J. Beyond ‘trees are good’: Disservices, management costs, and tradeoffs in urban forestry. Ambio 2021, 50, 615–630. [Google Scholar] [CrossRef] [PubMed]
- Attorre, F.; Bruno, M.; Francesconi, F.; Valenti, R.; Bruno, F. Landscape changes of Rome through tree-lined roads. Landsc. Urban Plan 2000, 49, 115–128. [Google Scholar] [CrossRef]
- Hirons, A.D.; Percival, G.C. Fundamentals of Tree Establishment: A Review. In Proceedings of the Urban Trees Research Conference, “Trees, People and the Built Environment”, Birmingham, UK, 13–14 April 2011; Johnston, M., Percival, G., Eds.; Forestry Commission: Birmingham, UK, 2012. [Google Scholar]
- Rendina, C.; Paradisi, D. Le Strade di Roma; Newton Compton Editori: Roma, Italy, 2004; 3, P-Z. [Google Scholar]
- Wilhelm, W.W.; Ruwe, K.; Schlemmer, M.R. Comparison of three leaf area index meters in a corn canopy. Crop Sci. 2000, 40, 1179–1183. [Google Scholar] [CrossRef]
- Facchi, A.; Baroni, G.; Boschetti, M.; Gandolfi, C. Comparing opticaland direct methods for leafarea index determination in a maize crop. J. Agric. Eng. 2010, 1, 33–40. [Google Scholar] [CrossRef]
- Yao, W.; Kelbe, D.; Leeuwen, V.M.; Romanczyk, P.; Aardt, V.J. Towards an improved LAI collection protocol via simulated and field-based PAR sensing. Sensors 2016, 16, 1092. [Google Scholar] [CrossRef] [PubMed]
- Rahman, M.A.; Armson, D.; Ennos, A.R. Effect of urbanization and climate change in the rooting zone on the growth and physiology of Pyrus calleryana. Urban Urban Green 2014, 13, 325–335. [Google Scholar] [CrossRef]
- Gatto, E.; Buccolieri, R.; Aarrevaara, E.; Ippolito, F.; Emmanuel, R.; Perronace, L.; Santiago, J.L. Impact of urban vegetation on outdoor thermal comfort: Comparison between a Mediterranean city (Lecce, Italy) and a Northern European city (Lathi, Finland). Forests 2020, 11, 228. [Google Scholar] [CrossRef]
- Forouzandeh, A. Numerical modeling validation for the microclimate thermal condition of semi-closed courtyard spaces between buildings. Sustain. Cities Soc. 2018, 36, 327–345. [Google Scholar] [CrossRef]
- Abhijith, K.V.; Kumar, P.; Gallagher, J.; McNabola, A.; Baldauf, R.; Pilla, F.; Broderick, B.; Di Sabatino, S.; Pulvirenti, B. Air pollution abatement performances of green infrastructure in open road and built-up street canyon environments—A review. Atmos. Environ. 2017, 162, 71–86. [Google Scholar] [CrossRef]
- Buccolieri, R.; Santiago, J.L.; Rivas, E.; Sanchez, B. Review on urban tree modelling in CFD simulations: Aerodynamic, deposition and thermal effects. Urban Urban Green 2018, 31, 212–220. [Google Scholar] [CrossRef]
- Gong, F.; Zeng, Z.; Ng, E.; Norford, L.K. Spatiotemporal patterns of street-level solar radiation estimated using google street view in a high-density urban environment. Build Environ. 2019, 148, 547–566. [Google Scholar] [CrossRef]
- Carrasco-hernandez, R.; Smedley, A.R.D.; Webb, A.R. Using urban canyon geometries obtained from Google Street View for atmospheric studies: Potential applications in the calculation of street level total shortwave irradiances. Energy Build. 2015, 86, 340–348. [Google Scholar] [CrossRef]
- Karimi, A.; Sanaieian, H.; Farhadi, H.; Norouzian-Maleki, S. Evaluation of the thermal indices and thermal comfort improvement by different vegetation species and materials in a medium-sized urban park. Energy Rep. 2020, 6, 1670–1684. [Google Scholar] [CrossRef]
- Thorsson, S.; Lindberg, F.; Eliasson, I.; Holmer, B. Different methods for estimating the mean radiant temperature in an outdoor urban setting. Int. J. Clim. 2007, 27, 1983–1993. [Google Scholar] [CrossRef]
- Jendritzky, G.; Nübler, W. A model analysing the urban thermal environment in physiologically significant terms. Arch. Meteorol. Geophys. Bioclimatol. Ser. B 1981, 29, 313–326. [Google Scholar] [CrossRef]
- Simon, H.; Linden, J.; Hoffmann, D.; Braun, P.; Bruse, M.; Esper, J. Modeling transpiration and leaf temperature of urban trees—A case study evaluating the microclimate model ENVI-met against measurement data. Landsc. Urban Plan 2018, 174, 33–40. [Google Scholar] [CrossRef]
- Cheung, P.K.; Fung, C.K.W.; Jim, C.Y. Seasonal and meteorological effects on the cooling magnitude of trees in subtropical climate. Build. Environ. 2020, 177, 106911. [Google Scholar] [CrossRef]
- Ma, Y.; Zhao, M.; Li, J.; Wang, J.; Hu, L. Cooling effect of different land cover types: A case study in Xi’an and Xianyang, China. Sustainability 2021, 13, 1099. [Google Scholar] [CrossRef]
- Sabrin, S.; Karimi, M.; Nazari, R.; Pratt, J.; Bryk, J. Effects of different urban-vegetation morphology on the canopy-level thermal comfort and the cooling benefits of shade trees: Case-study in Philadelphia. Sustain. Cities Soc. 2021, 66, 102684. [Google Scholar] [CrossRef]
- Jiang, Y.; Jiang, S.; Shi, T. Comparative study on the cooling effects of green space patterns in waterfront build-up blocks: An experience from Shanghai. Int. J. Environ. Res. Public Health 2020, 17, 8684. [Google Scholar] [CrossRef] [PubMed]
- Rui, L.; Buccolieri, R.; Gao, Z.; Ding, W.; Shen, J. The impact of green space layouts on microclimate and air quality in residential districts of Nanjing, China. Forests 2018, 9, 224. [Google Scholar] [CrossRef]
- Davtalab, J.; Deyhimi, S.P.; Dessi, V.; Hafezi, M.R.; Adib, M. The impact of green space structure on physiological equivalent temperature index in open space. Urban Clim. 2020, 31, 100–574. [Google Scholar] [CrossRef]
- Park, C.Y.; Lee, D.K.; Krayenhoff, E.S.; Heo, H.K.; Ahn, S.; Asawa, T.; Murakami, A.; Kimf, H.O. A multilayer mean radiant temperature model for pedestrians in a street canyon with trees. Build. Environ. 2018, 141, 298–309. [Google Scholar] [CrossRef]
- Lee, H.; Mayer, H.; Kuttler, W. Impact of the spacing between tree crowns on the mitigation of daytime heat stress for pedestrians inside E-W urban street canyons under Central European conditions. Urban Urban Green 2020, 48, 126558. [Google Scholar] [CrossRef]
- Takebayashi, H.; Okubo, M.; Danno, H. Thermal environment map in street canyon for implementing extreme high temperature measures. Atmosphere 2020, 11, 550. [Google Scholar] [CrossRef]
- Hirons, A.D.; Sjöman, H. Tree Species Selection for Green infrastructure: A Guide for Specifiers; Issue 1.3; Trees & Design Action Group: Exeter, UK, 2019. [Google Scholar]
- Cotella, G.; Brovarone, E.V. Questioning urbanisation models in the face of Covid-19. TeMA J. Land Use Mobil. Environ. 2020, 18, 105–118. [Google Scholar]
- Available online: https://www.consilium.europa.eu/it/infographics/ngeu-covid-19-recovery-package/ (accessed on 1 March 2021).
Publisher’s Note: MDPI stays neutral with regard to jurisdictional claims in published maps and institutional affiliations. |
© 2021 by the authors. Licensee MDPI, Basel, Switzerland. This article is an open access article distributed under the terms and conditions of the Creative Commons Attribution (CC BY) license (https://creativecommons.org/licenses/by/4.0/).