Article

Short-Term Associations of Nitrogen Dioxide (NO2) on Mortality in 18 French Cities, 2010–2014

French National Public Health Agency, 94415 Saint-Maurice, France
*
Author to whom correspondence should be addressed.
Atmosphere 2020, 11(11), 1198; https://doi.org/10.3390/atmos11111198
Submission received: 11 September 2020 / Revised: 2 November 2020 / Accepted: 2 November 2020 / Published: 4 November 2020
(This article belongs to the Special Issue Air Pollution and Environment in France)

Abstract

:
We present an analysis of short-term associations between ambient NO2 and mortality according to cause, age-group, and period (cold and warm) in 18 areas in metropolitan France for the 2010–2014 period. Associations were estimated in each area using a generalized additive Poisson regression model, and effects were summarized in a meta-analysis. The percentage increase in mortality rate was estimated for a 10 µg m−3 increase in the NO2 level in each area for each complete calendar year and for cold (November to April) and warm periods (May to October) in each year. We found that the NO2 increase (lag of 0–1 days) was associated with a 0.75% increase of non-accidental mortality for all age-groups (95% confidence interval (CI): (0.4; 1.10)). During the warm period, this NO2 increase was associated with a 3.07% increase in non-accidental mortality in the ≥75 years old group (95% CI: 1.97; 4.18). This study supports the short-term effects of NO2 as a proxy of urban traffic pollution on mortality, even for concentrations below the maximum guideline of 40 µg m−3 set down by the European Air Quality Standards and the World Health Organization (WHO).

1. Introduction

Nitrogen dioxide (NO2) is an air pollutant resulting from combustion processes and is mainly emitted by road traffic. In France, annual urban background and near-road traffic concentrations of NO2 in ambient air have decreased since 2000. However, the maximum concentration set down by European air quality standards for the protection of human health (40 µg m−3) is exceeded every year in several urban areas (near-traffic), and near-traffic levels are twice as high as urban background levels. In 2016, the annual average urban background NO2 concentration was 19 µg m−3, compared with 39 µg m−3 for near-road traffic. Furthermore, numerous episodes of NO2 pollution are observed every year during the cold period (November to April) because anticyclonic conditions with cold temperatures limit the dispersion of pollutants [1].
Several epidemiological studies have shown short-term associations between exposure to NO2 and various health outcomes, in particular respiratory and cardiovascular diseases and mortality [2,3,4]. More specifically, in 2008, associations were found between ambient NO2 concentrations and mortality in nine areas in France [5]. Moreover, in 2013, epidemiological and toxicological evidence in the Review of evidence on health aspects of air pollution (REVIHAAP) report [3] suggested a short-term causal relationship, particularly for respiratory effects, which prompted the World Health Organization (WHO) to conclude that it was reasonable to consider that NO2 had direct effects on health. The WHO also considered that there was sufficient evidence to warrant an estimation of the short-term health impact of NO2 on all-cause mortality and hospitalizations for respiratory diseases. In 2016, the United States Environmental Protection Agency (US-EPA) considered that there was robust evidence for an association between short-term NO2 exposure and exacerbation of asthma, and that the findings from recent studies also suggested an effect on cardiovascular health and mortality [6].
In order to estimate the short-term health impact of NO2, concentration–response functions (CRFs) are necessary. However, available CRFs for NO2 in Europe have primarily been derived from data from studies conducted outside the continent. The handful of European-based studies providing CRFs include the APHEA [7] and EpiAir [8] projects in Italy and studies in Switzerland [9] and Austria [10]. Moreover, due to having a higher proportion of diesel-fueled vehicles than elsewhere in the world, the specificity of vehicle emissions in France (and indeed Europe) most probably influences the relationship between NO2 and health effects. This was supported by the meta-analysis by Mills et al. in 2015 [2], which identified strong geographical heterogeneity between the effects estimated for different regions of the world.
All the above elements highlight the relevance of studying the short-term links between exposure to ambient NO2 and mortality in France in order to update existing CRFs with a view to using them in future health impact assessments (HIA).
Accordingly, in the present study, we conducted a retrospective time series analysis to evaluate the association between NO2 as one proxy of urban traffic pollution and the risk of daily non-accidental and cardiovascular mortality in 18 cities in metropolitan France over the period 2010–2014.

2. Materials and Methods

2.1. Study Period and Study Area

We conducted a daily time-series study of the relationship between NO2 exposure and cause-specific mortality in 18 French areas (Figure 1) (accounting for 499 municipalities) from 2010 to 2014 based on the availability of mortality data.

2.2. Data Sources

2.2.1. Mortality Data

For each area, daily mortality data were obtained from the French National Institute of Health and Medical Research (CépiDc) for the study period. Causes of death were coded according to the International Classification of Diseases, 10th Revision (ICD-10). More specifically, data collected included daily counts of total non-accidental (ICD-10: A00-R99), cardiovascular (ICD-10: I00-I99), and respiratory (ICD-10: J00-J99) mortality for all ages. We dichotomized data by age group (≥75 years) to compare with similar studies.

2.2.2. Pollution Data

In each study area, pollution data were obtained from local air quality monitoring networks. NO2 was measured using the chemiluminescence method, a tapered element oscillating monitor filter dynamic measurement system (TEOM-FDMS) was used for PM10, while ozone (O3) was measured using the standard reference ultraviolet absorption method. Urban background monitors were used to create daily indicators of NO2 and PM10 exposure, while urban and suburban background monitors were used to create daily indicators of O3. Depending on the area, between 1 and 15 monitors were available for NO2, one to seven for PM10, and 1 to 13 for O3 (Table 1). All study areas were constructed in such a way that the average exposure level of the population could be accurately estimated from the monitoring stations [11]. We built homogeneous study areas because, in time-series studies, the principle of analysis assumes that, on average, all individuals in the population are exposed to the same levels of air pollution each day.

2.2.3. Meteorological Data

We obtained daily minimum, mean, and maximum temperature data from the French national meteorological service (Météo-France), with one reference monitoring station per area studied. Airport stations were used for 15 areas and city center stations were used for the other 3 areas.

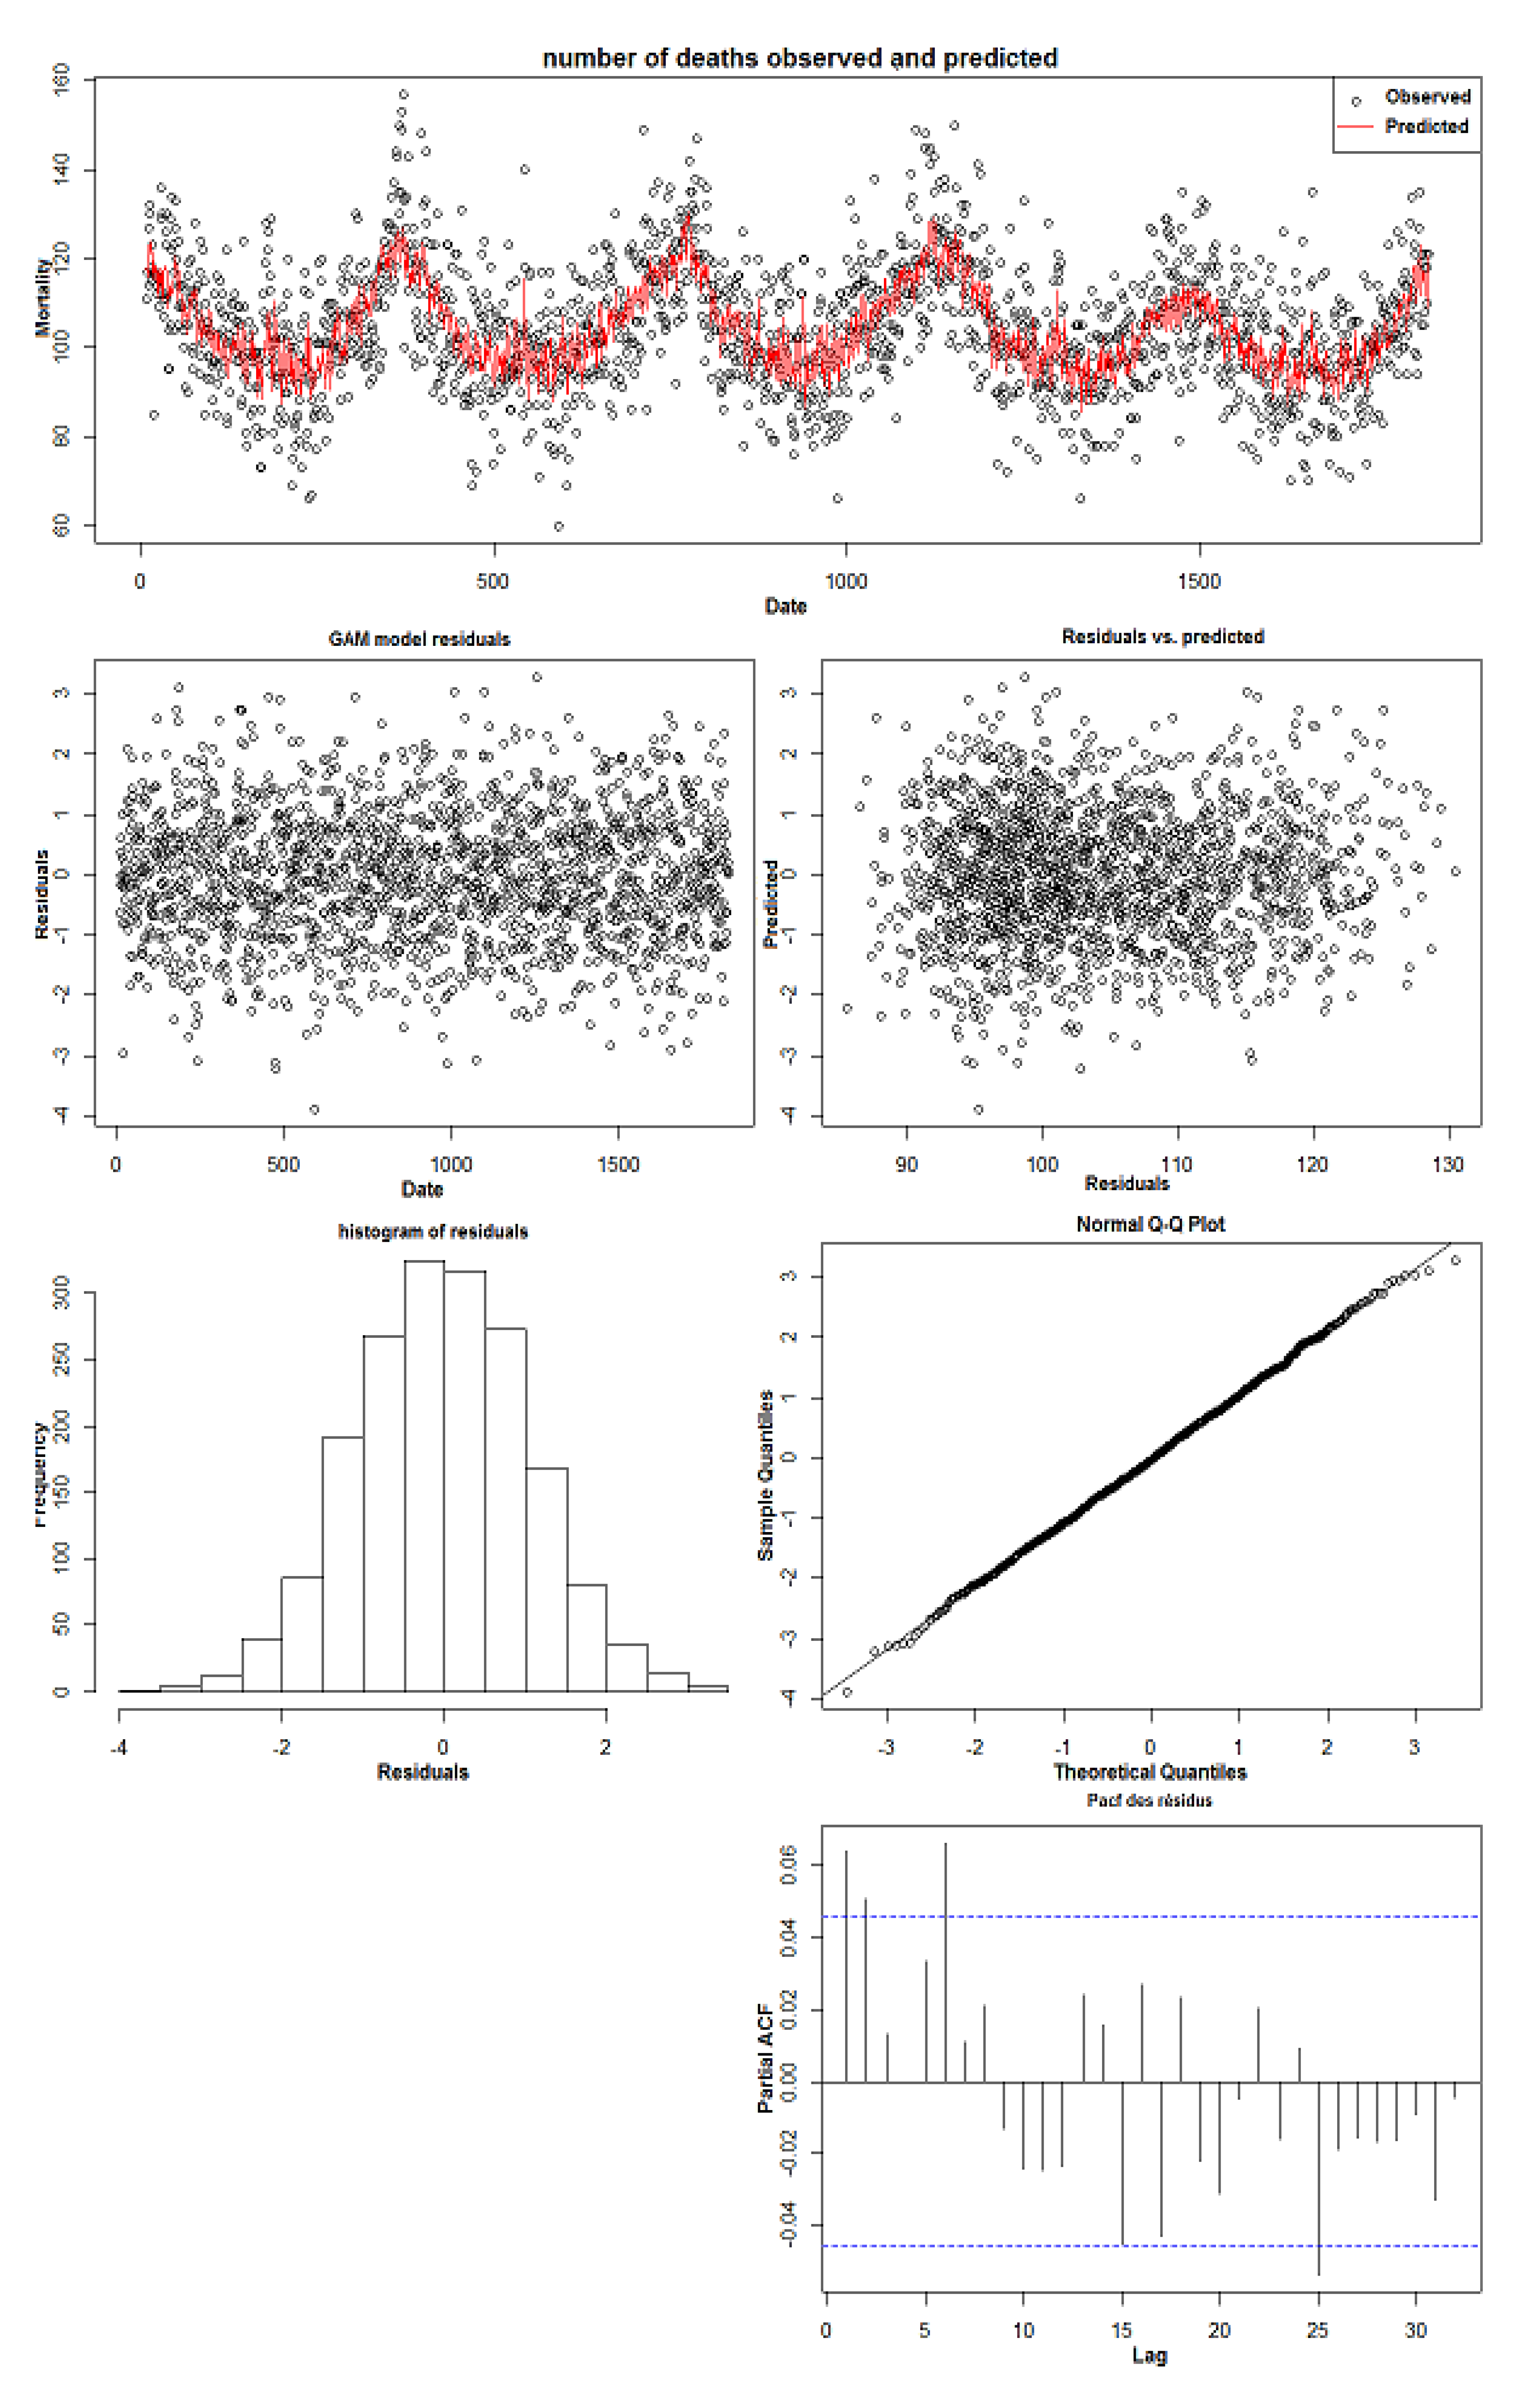
2.2.4. Statistical Analyses

The association between NO2 and daily mortality was investigated using a time-series analysis with generalized additive Poisson regression models (GAM) allowing for overdispersion [12].
In each area, the daily death count was regressed on NO2 levels, while the following possible confounders were controlled: temperature, long-term trends, seasonal trends, day of the week, and bank holiday effects. Seasonality was taken into account using a penalized spline function. The smoothing parameter of the spline was selected in order to minimize the absolute value of the partial autocorrelations of the residuals over 30 days by imposing a minimum of 3-degrees of freedom per year [13]. The mean levels of NO2 observed during the current and previous days (i.e., lag 0–1 days) were introduced as a linear term.
Minimum and maximum temperatures were introduced into the model as a natural spline with 3-degrees of freedom. Daily minimum temperatures at lag 0 and daily maximum temperature at lags 1–7 were also introduced as natural splines with 3-degrees of freedom. We assumed that minimum temperatures at lag 0 would represent a possible short-term heat effect, while maximum temperatures at lags 1–7 would represent a possible delayed cold effect [14,15].
The regression equation is formulated below:
Y t ~ q u a s i P o i s s o n ( µ t ) log [ µ t ] = i n t e r c e p t + δ 1 d o w + δ 2 h o l + δ 3 p o l + s ( t i m e ) + n s ( t m i n ) + n s ( t m a x )
where Yt denotes the daily mortality counts on day t, dow is the day of the week, hol is a bank holiday, pol is the mean level of NO2 observed during the current and previous days, and δ1, δ2, and δ3 are the corresponding regression coefficients. s(time) is a penalized spline function of calendar time designed to control for trend and seasonality, ns(tmin) and ns(tmax) are natural splines of temperature designed to control weather, tmin is the daily minimum temperatures at lag 0, and tmax is the daily maximum temperature at lags 1–7.
For each area, we tested the assumptions of the model using the following set of graphical and statistical tools: (1) The observation of the residual plot helped verify that, after modeling, no particular structure (trend, seasonality) persisted; (2) The residuals were assimilated to white Gaussian noise. Residual autocorrelation was particularly influenced by the choice of smoothing parameter of the spline function modeling seasonality; (3) The normality of the residuals was checked graphically (histogram, QQPLOT); (4) The statistical significance of the partial autocorrelations was verified graphically on the partial correlogram; (5) The comparison of the graphs of the observed and predicted values allowed the quality of the model to be assessed; (6) The partial effect of each factor on the health variable was shown graphically. The graphs helped check the coherence of the effects (Appendix AFigure A1 and Figure A2: example for Paris and Montpellier).
Air pollution effects were estimated for each year and each season (warm period: May to October; cold period: November to April) for each cause of mortality. An interaction between the pollution indicator and the season was added to the models to study seasonal effects on pollution.
To investigate the confounding of NO2 measurement by PM10 and O3, we fitted two-pollutant models. We also fitted polynomial distributed lag models over a period of 6 days (0–5 days) to investigate the shape of each lagged association [16].
In the second stage, we pooled area-specific estimates to perform a meta-analysis using random-effect models [17]. We tested for heterogeneity and reported it using the I2 statistic [18]. Association estimates were expressed as excess relative risk (ERR) of mortality for a 10 µg m−3 increase in air pollutant concentrations.
The time-series analysis was conducted using the R package mgcv (which provided generalized additive modeling functions), dlnm (which contained functions to specify and interpret distributed lag linear and non-linear models), and mvmeta (this function performed fixed and random-effects multivariate and univariate meta-analysis and meat regressions) (version 3.2.3, http://cran.r-project.org/).

3. Results

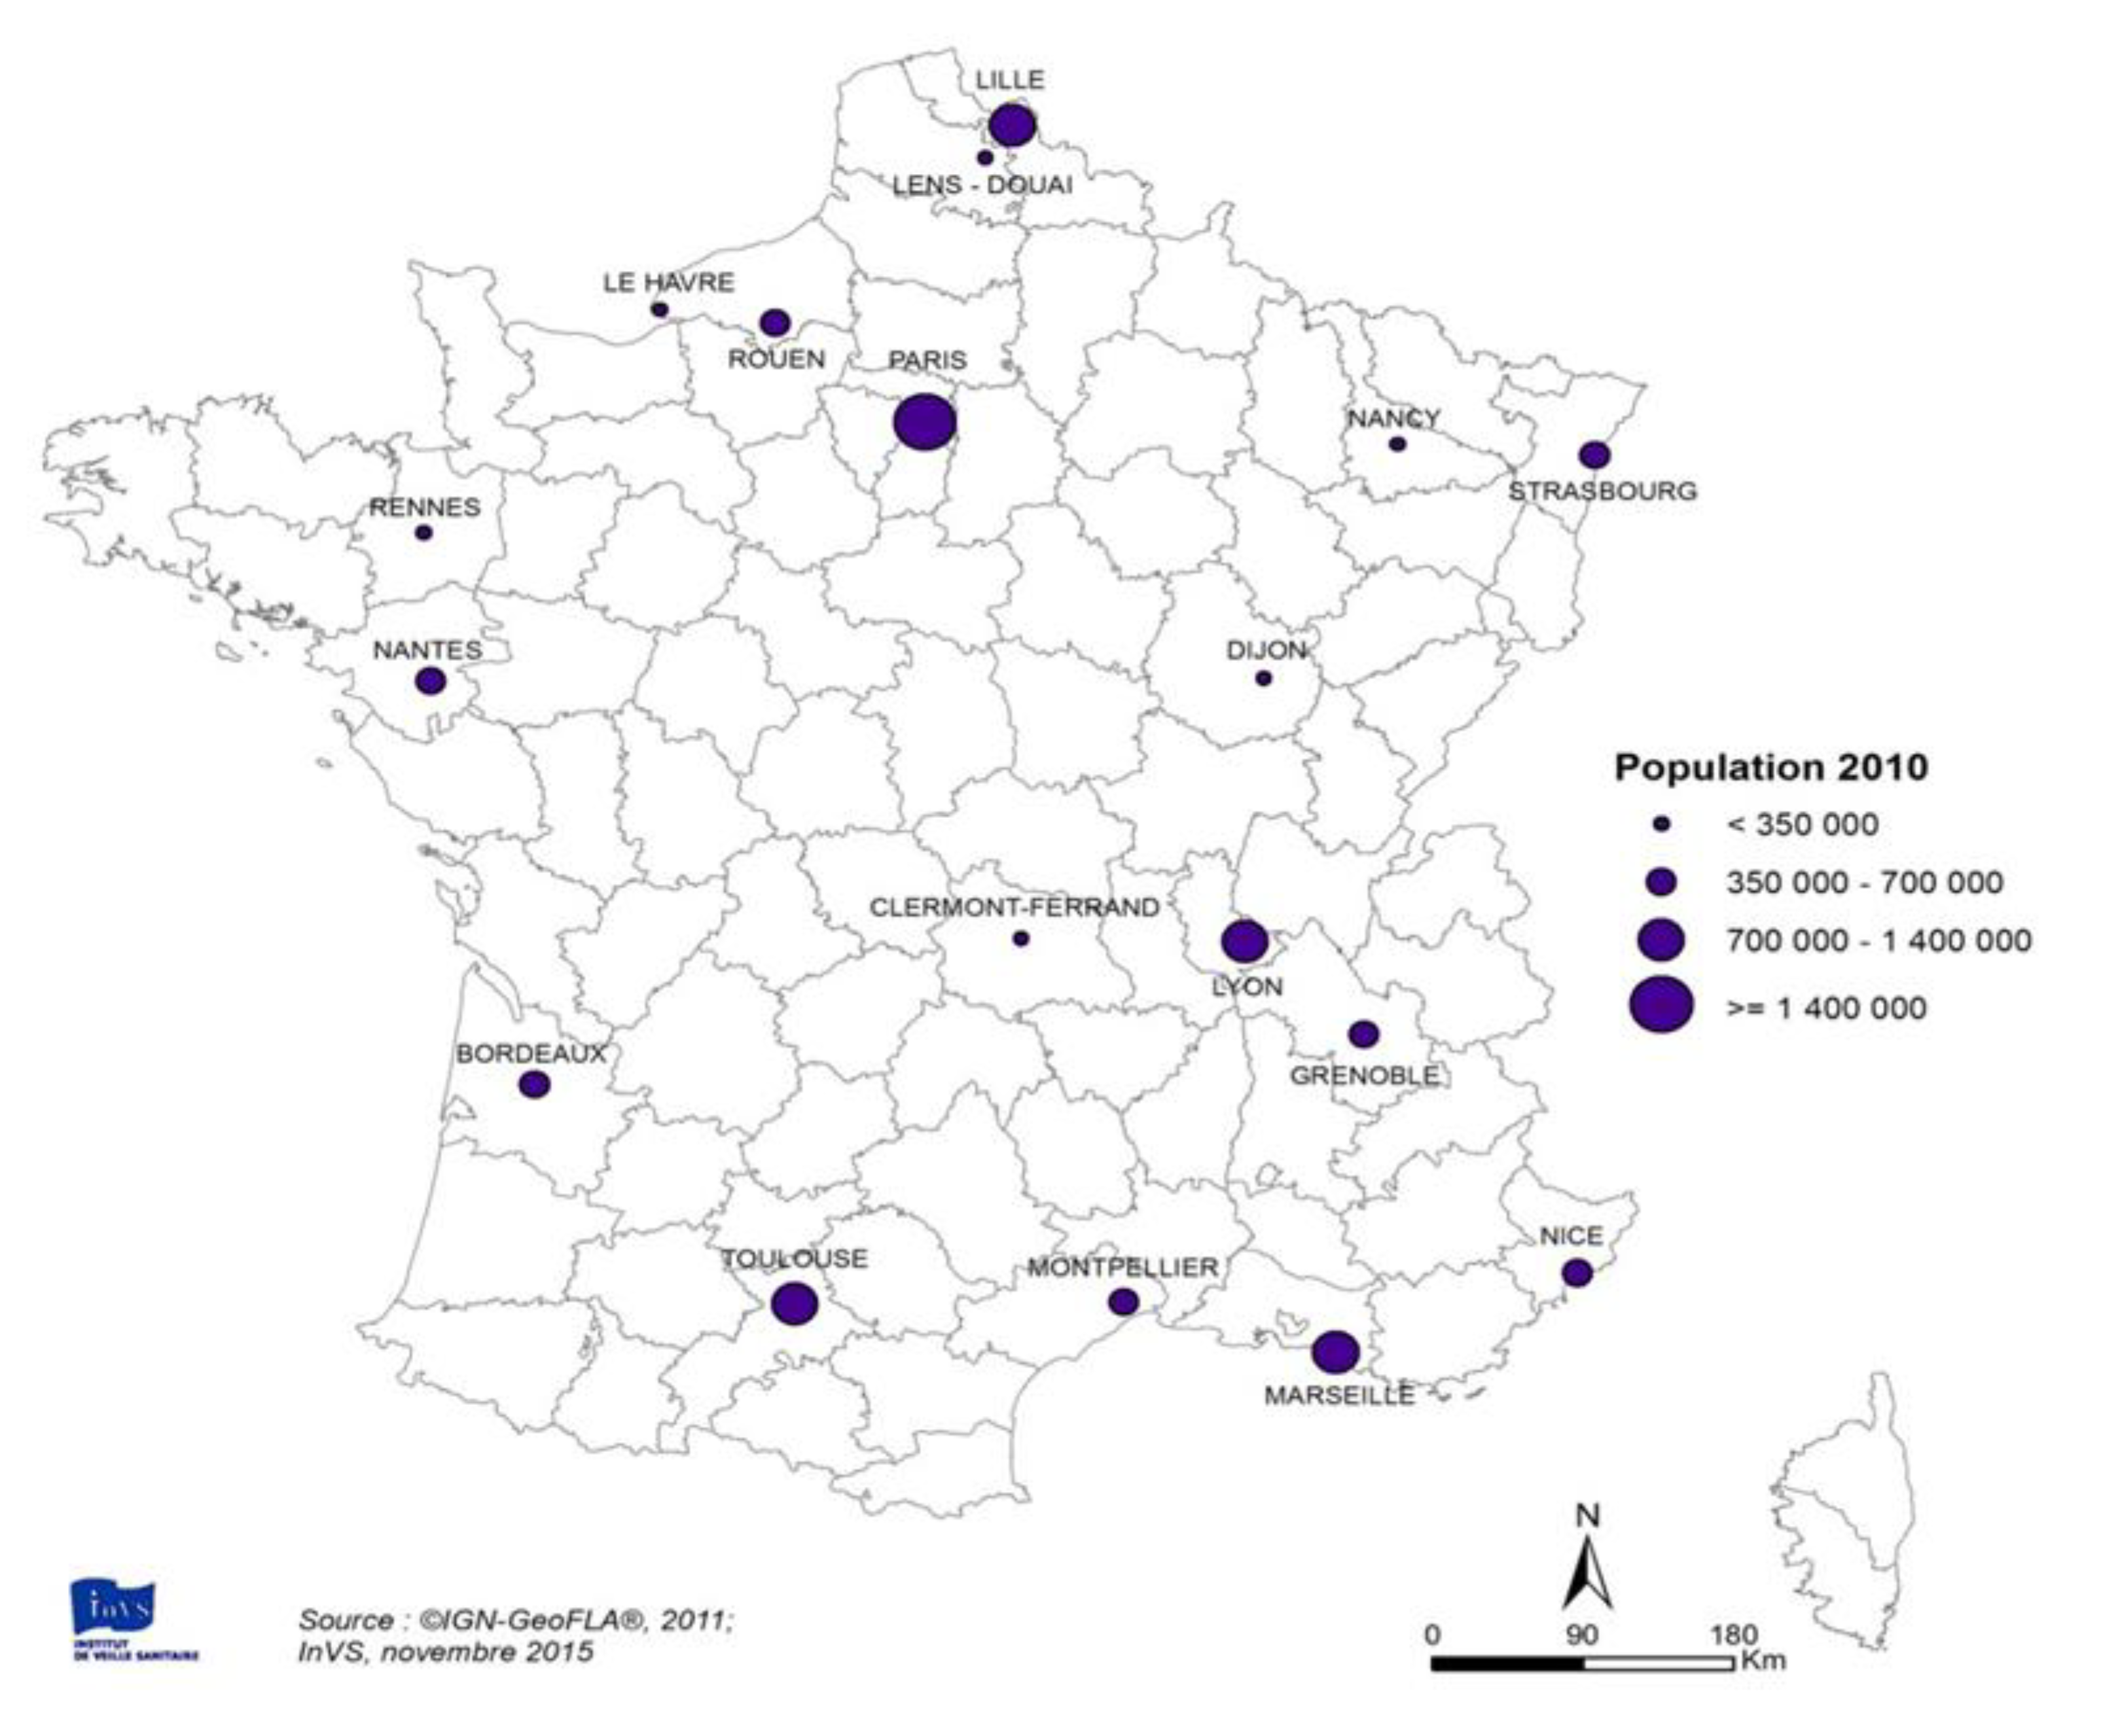
3.1. Main Characteristics of the Study Areas

3.1.1. Population Data

Table 2 summarizes population and mortality data for each area included in the analysis. The 18 areas covered a combined total of over 15 million inhabitants. The largest area was Paris, with more than 6.7 million inhabitants. With 8861 inhabitants per km2, the population density was two to eight times higher than in the other areas (Appendix BTable A1). Lille had the second largest population, but a density below 1900 inhabitants per km2, while Nice had one of the densest populations with more than 3600 inhabitants per km2, despite its mid-size population (see Appendix BTable A1).

3.1.2. Mortality Data

In the 18 French areas studied, the daily mean number of non-accidental deaths ranged from 4% in Rennes (one of the smallest areas) to 104.5% in Paris, the biggest area (Table 2). The percentage of non-accidental deaths in people aged 75 and over ranged from 62% in Lens-Douai, Le Havre, and Lille to 74% in Nice. The daily mean number of deaths for cardiovascular diseases ranged from 1.2% in Dijon to 23.8% in Paris. For respiratory mortality, the very small numbers of deaths prevented us from being able to perform statistical analyses of the links between air pollution and death with sufficient statistical power. Respiratory mortality was, therefore, not considered in this study.

3.1.3. Pollution Data

Mean levels of air pollution indicators (NO2, PM10) over the study period in each area are presented in Table 1.
There were large variations in NO2 levels across the 18 areas over the study period. The highest mean levels (36.0 µg m−3 in Paris and 32.7 µg m−3 in Marseille) were approximately twice as high as the lowest (17.9 µg m−3 in Nantes and 18.7 µg m−3 in Rennes). NO2 levels were higher during the cold period (November–April) than the warm period (May–October). During the cold period, mean levels ranged from 23 µg m−3 in Nantes to 42 µg m−3 in Paris. During the warm period, they ranged from 13 µg m−3 in Nantes to 30 µg m−3 in Paris.
Mean PM10 levels ranged from 18.9 (in Dijon) to 31.2 µg m−3 (in Marseille). Mean O3 levels ranged from 46.2 (in Strasbourg) to 85.0 µg m−3 (in Nice).

3.1.4. Temperature Data

Between 2010 and 2014, the minimum mean annual temperatures ranged from 6.5 (Nancy) to 13.1 °C (Nice), and maximum mean annual temperatures ranged from 14.1 (Le Havre) to 20.7 °C (Marseille). Mean annual temperatures ranged from 5.6 (Nancy) to 11.5 °C (Nice) during the cold period and from 15.4 (Rouen) to 21.4 °C (Marseille) during the warm period (Table 3). Temperature was taken into account in the analysis as a confounding factor.

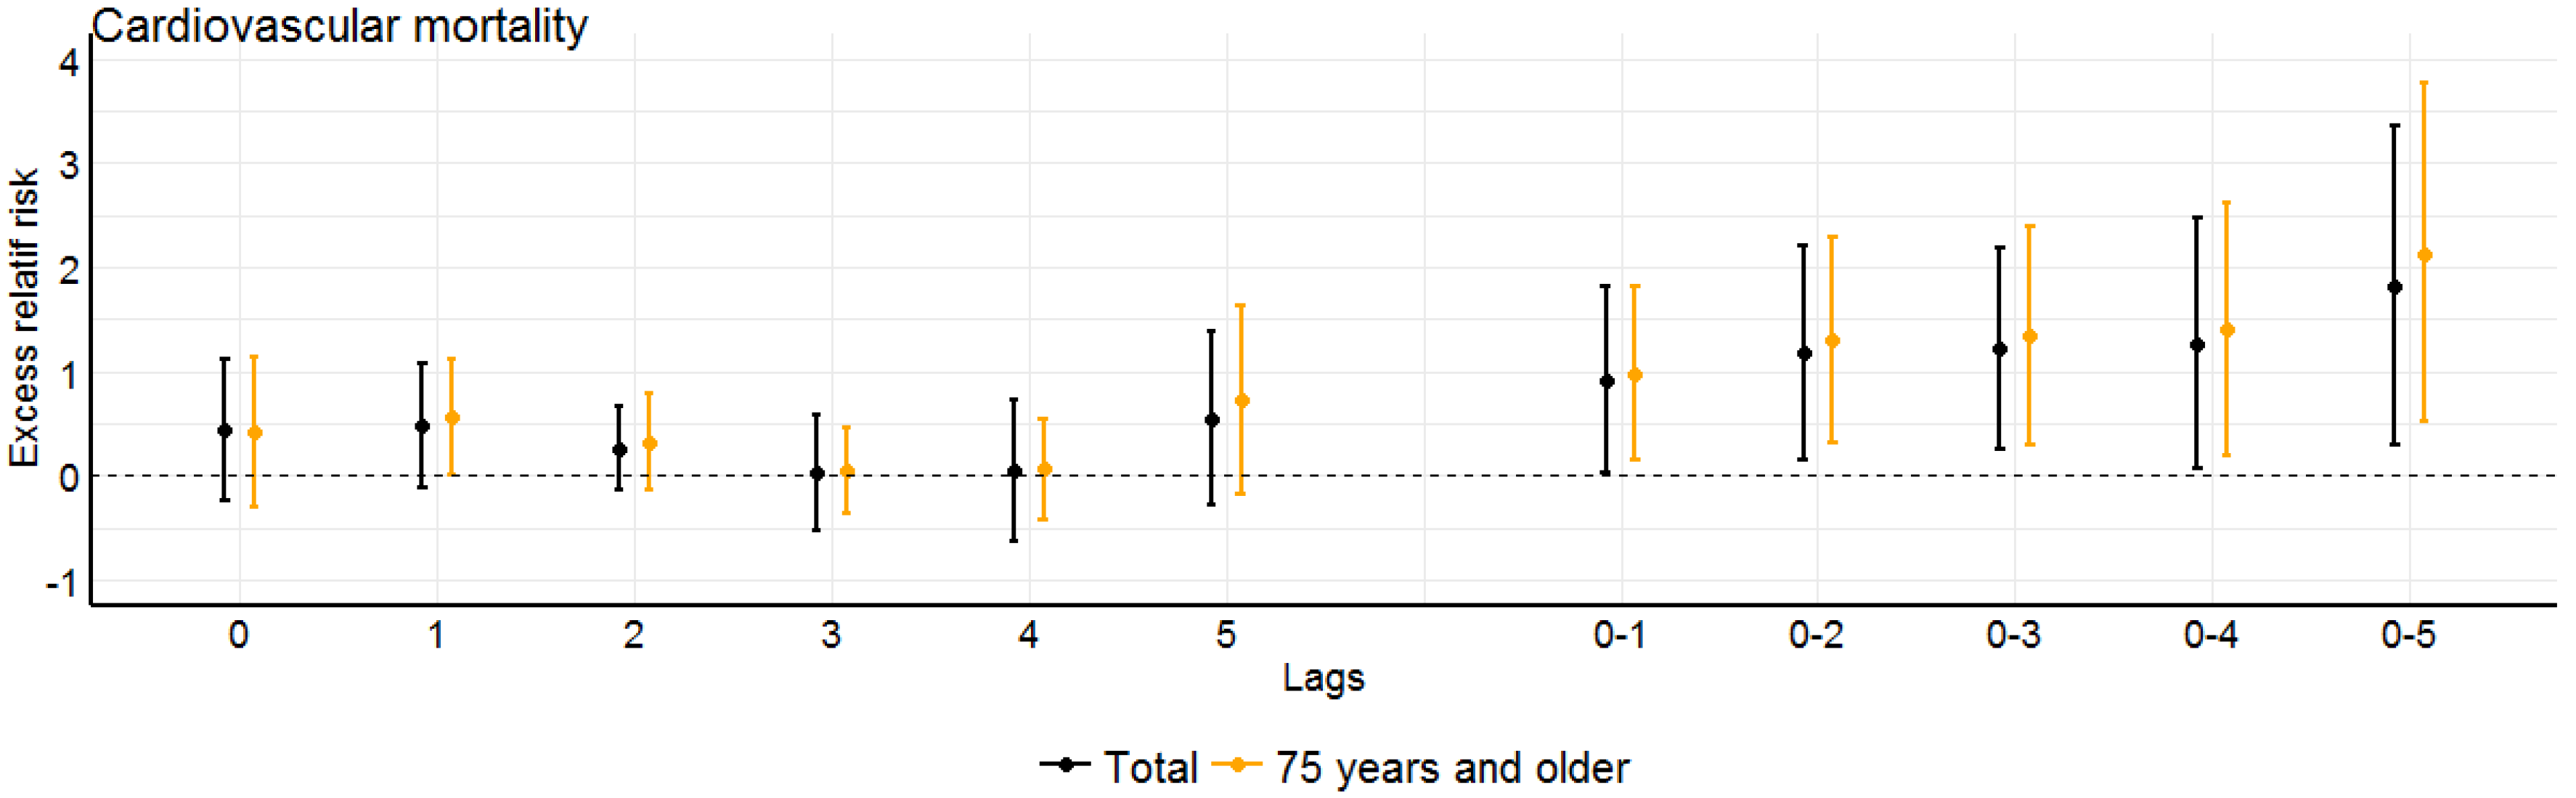
3.2. Concentration-Response Functions

3.2.1. NO2 Analysis of the Same Day and the Day before (lag 0–1)

Table 4 presents, for each full calendar year and for each period (i.e., warm and cold), the ERR estimates for non-accidental and cardiovascular deaths for a 10 µg m−3 increase in NO2 levels on the same day and the day before (lag 0–1). This table also presents sensitivity analyses with two-pollutant models for PM10 and O3.
We found a significant link between NO2 levels and non-accidental and cardiovascular deaths for each full calendar year and for the warm period each year, irrespective of the age group considered. For those aged 75 years and over, ERR estimates were slightly higher than for the total population. This difference was more marked for non-accidental mortality: 1.14% (95% confidence interval (CI): (0.63; 1.66)) and 0.75% (95% CI: (0.40; 1.10)), respectively. No age difference was observed in the ERR for cardiovascular deaths: 1.15% (95% CI: (0.40; 1.91)) and 1.13% (95% CI: (0.37; 1.90)), respectively.
All ERR values were also higher for the warm period than for the whole calendar year, irrespective of the cause of death or age group. The highest ERR was 3.17% (95% CI: (1.53; 4.84)) for cardiovascular deaths among those aged 75 years and over in the warm period. In the cold period, there was no association.
After adjusting the models for PM10, the ERR estimates remained unchanged in the annual period and in the cold period and were lower in the warm period. The ERR estimates also remained unchanged after adjusting the model for O3.

3.2.2. NO2 Analysis—Over the First Six Days (Lag 0–5)

Figure 2 shows the distribution of the ERR for non-accidental and cardiovascular deaths over 0 to 5 days measured separately (lag 0, lag 1, lag 5) and 0 to 5 cumulative days (lag 0–1, lag 0–2, lag 0–5) for a 10 µg m−3 increase in NO2. In cumulative lags, 0–5 effects were cumulated over 0 to 5 days (i.e., all contributions from day 0–5 were summed). An increase in ERR values was observed for the cumulative lags, irrespective of the cause of death or age group. The point estimate for the ERR for the cumulative lags for non-accidental deaths was slightly higher for those aged 75 years and over than for the total population. More specifically, the ERR for the cumulative 0–5 lags was 2.35% (95% CI: (1.35; 3.37)) for those aged 75 years and over and 1.74% (95% CI: (1; 1.48)) for the total population.

4. Discussion

In this study, we found an increase in the numbers of non-accidental and cardiovascular deaths associated with a 10 µg m−3 increase in NO2 for both the total population and people aged 75 years and over, for the entire study period (2010–2014), for warm and cold periods, and for the warm period alone. These study results complement the ERR values published by Blanchard et al. in 2008 [5] as they include new urban agglomerations that were integrated into the French national public health agency’s air and health program in 2011. Indeed, the addition of these areas with different profiles (population, pollution, and climate), helped us increase the statistical power of this meta-analysis.
The deleterious effects on health of NO2 have been examined by the US EPA Integrated Science Assessment report on the oxides of nitrogen. The report states that the cumulative body of evidence on NO2 indicates that short-term exposure can affect health, in particular, effects related to asthma exacerbation, and may be associated with cardiovascular effects and premature mortality. However, the report states that to assign a causal effect of NO2 on mortality requires more research to separate NO2 exposure effects from those of other traffic-related pollutants [6]. The REVIHAAP report by WHO [3] also states that the observed associations in epidemiological studies may not be completely attributable to NO2 per se, as NO2 may also include other constituents (which have adverse health effects) not represented by currently regulated pollutants. This is why NO2 is used as one possible tracer, indicator, or proxy of traffic air pollution among others in this study.
Using a single-pollutant (such as NO2) as a proxy for complex mixtures of pollutants, especially in urban areas, often misrepresents the real pollution mixture, as well as the associated health outcomes (which may depend upon a different component of the mixture). In this study, we were not able to distinguish which components of the mixture represented by NO2 were responsible for the observed effects. NO2 is typically formed through the following photochemical process. Due to ultraviolet radiation, NO2 dissociates into nitrogen oxide (NO) and atomic oxygen (O). Atomic oxygen (O) combines with dioxygen (O2) very quickly and produces the main photochemical pollutant, ozone (O3). This reaction occurs in the low layers of the atmosphere and favors sunshine and warm temperatures. Ozone can also react with NO to regenerate NO2 (https://www.aeroqual.com/meet-the-nitrogen-oxide-family). Relative toxicity of air pollution mixtures has been widely studied [19], and the effects of photochemistry on the toxicity of air pollution are well documented [20]. It is known that photochemical reactions can release secondary organic aerosols that increase inflammatory responses, and this phenomenon enhances the toxicity of air pollution [21,22].
The potential causal role of NO2 and the pathophysiological mechanisms by which NO2 may affect health have been studied. As per the REVIHAAP report [3], there is evidence of small effects on inflammation and increased airway hyperresponsiveness with NO2 per se in the range from 0.2 to 1 ppm (380 to 1880 µg m−3) from chamber studies (under a broad range of exposure conditions, with exposure durations of 15 min to 6 h, with some inconsistency in results), with more marked, consistent, responses observed from 1 ppm (1880 µg m−3). Newer review reports suggest weak to moderate lung cell changes in animals at one-hour concentrations of 0.2 to 0.8 ppm (380–1500 µg m−3). These concentration ranges are not far from concentrations that occur at the roadside or in traffic for multiple hours. The WHO report concludes that there is some mechanistic support for causality, particularly for respiratory outcomes. This is confirmed by Petit et al. [23], who state that NO2 is a toxic gas that can damage the lungs. When inhaled, it oxidizes protective antioxidants within the epithelial lining fluid and triggers extracellular damage in the airways. The presence of NO2 within the epithelial lining fluid triggers oxidative stress, possibly leading to edema, bronchoconstriction, and a reduced forced expiratory volume in 1 s.
Despite results in international studies showing the associations of NO2 with respiratory mortality, we were not able to carry out an analysis of this indicator because of the low number of deaths attributed to respiratory mortality in the study areas.
The present study showed that NO2 exposure was associated with an increased number of non-accidental and cardiovascular deaths. Excess relative risks estimated in the present study for a 10 µg m− 3 increase in NO2 were lower than those published in the previous meta-analysis in 2008, although the comparison was limited by the different statistical methods used in both studies, and the higher number of areas included in this work (18 vs 9) [5].
The study results for the general population were consistent with those in the literature and especially with those from multicenter and meta-analysis studies. Two similar studies, the first conducted in 2015 by Perez et al. in 21 cantons in Switzerland [9] and the second in 2016 by Carugno et al. in 18 areas of the Lombardy region of Italy [24], found a significant increase in all-cause deaths for a 10 µg m−3 increase in NO2 concentrations. The results of a meta-analysis of several studies performed throughout the world, conducted by Mills et al. in 2015, showed a similar risk, and when focusing only on European studies, the ERR was slightly higher [2]. Another study carried out in 2015 by Renzi et al. in the Rome area showed a higher risk than in the present study [25]. A study of the Vienna area by Neuberger et al. found a similar ERR to this study [10], and finally, a Canadian study by Crouse et al. showed a significantly lower risk than the present study [26] (Table 5).
Most international studies to date also examined the relationship between cardiovascular mortality and NO2 concentrations but found a slightly lower excess risk than in this study (1.13% [0.37–1.90]). In Europe, the meta-analysis results of Mills et al. in 2015 [2] and the Carugno et al. study [24] both showed a significant increase in cardiovascular mortality for a 10 µg m−3 increase in NO2, with an ERR close to this study. In contrast, the Swiss study by Perez et al. in 2015 [9], the worldwide study by Mills et al. in 2015 [2], and the Canadian study by Crouse et al. in 2015 [26] showed a significantly lower risk than the present study (Table 5).
We observed slightly higher ERR in people aged 75 and over than in the total population for non-accidental (1.14% vs 0.75%) and cardiovascular (1.15% vs 1.13%) deaths. Chinese studies have shown higher risks among people aged 75 and over, although age-related differences were negligible [27,28]. The Italian study by Carugno et al. in 2016 showed a higher risk for cardiovascular deaths but not for non-accidental deaths [24] in the same group. However, other studies have shown a lower risk for this sub-population [9] (Table 5).
NO2 associations were more evident in the warm period (May–October). Similar results have been observed in studies in several countries, for example, in Italy [24,29], South Africa [30], Canada [31], and China [28]. One likely explanation for this is that during the warm period, the concentrations measured by the monitoring stations better represent real exposure as people spend more time outdoors in the warm period and keep windows open, leading to ambient air pollutants entering their homes. Another hypothesis is that during the warm season, the increase in photochemical activity leads to a change in the composition of the mixture in automobile emissions, with more volatile organic compounds (VOC) and finer particles than in the cold period. As these pollutants have been identified as having health effects [3,30], the mixture of pollutants from automobile emissions, with NO2 as a proxy, would potentially have a larger health effect in the warm season.
In order to dissociate the effect of NO2 from that of other pollutants, in particular from traffic, we adjusted models for PM10 and O3. These were the only pollutants we could adjust for, despite PM2.5, SO2, and CO also being analyzed in other articles. In France, SO2 is not measured anymore in urban areas because concentrations are extremely low (except for hotspots), and for CO, we do not have continuous measurements. PM2.5 concentrations were not available in all the study areas, and, in most cases, data was not yet consolidated and came from only one monitoring station for all areas. It takes time for emitted particles to agglomerate and/or grow via uptake of secondary pollutants before they reach the size of PM10. However, because PM10 and PM2.5 indicators are highly correlated, and because it is preferable to work with robust data from several monitoring stations in order to limit the impact of possible measurement errors or missing data on an indicator, PM-adjusted models were only built for PM10. The estimates of ERR for NO2 remained unchanged after adjustment for PM10, and this result was consistent with the literature. Several studies reviewed in REVIHAAP by the WHO [3] also found significant associations between NO2 and all-cause mortality after adjustment for PM10 [29,32,33,34].
The present results remained unchanged after adjusting for O3. A Brazilian study [35] showed that the ERR for circulatory mortality differed little between single-pollutant NO2 analysis and analysis adjusted for the other pollutants (PM10, CO, and O3). A meta-analysis conducted in 2016 [36] identified that most studies showed a PM10-independent effect of NO2. More specifically, for all-cause mortality, a 10 µg m−3 increase in NO2 was associated with a 0.78% increase in the risk of death (95% CI: (0.47; 1.09)). This increase was 0.60% (95% CI: (0.33; 0.87)) after adjustment for particulate matter.
Finally, we observed an increase in ERR for cumulative lags, irrespective of the cause of death or the age group. This result was consistent with those found in international studies. The associations were larger on multi-day lags (0–5 cumulative lags) than on single-day lags (0–1 lags) [27,28,32,37].

5. Conclusions

This study found an association between short-term exposure to NO2 concentrations as a proxy of urban traffic pollution and the risk of death, with a higher risk for people aged 75 years and over. The results support the strengthening of measures to reduce traffic air pollution sources in Europe to protect the most vulnerable.

Author Contributions

Conceptualization, M.C., M.B., and V.W.; Methodology, M.C., M.B., and V.W.; Analysis, V.W. and M.C.; Data curation, M.C.; Writing—original draft preparation—review, M.C., Writing—review and editing M.C.; S.M., V.W., and M.B.; All authors have read and agreed to the published version of the manuscript.

Funding

This research received no external funding.

Acknowledgments

We would like to thank Météo-France (the French national meteorological service) and the Combined Official French Air Quality Monitoring Associations (AASQA) for environmental data, as well as the French Epidemiology Centre on the Medical Causes of Death (CépiDc, Inserm) for mortality data.

Conflicts of Interest

The authors declare no conflict of interest.

Appendix A

Figure A1. Assessment of the modeling assumptions for Paris.
Atmosphere 11 01198 g0a1aAtmosphere 11 01198 g0a1b
Figure A2. Assessment of the modeling assumptions for Montpellier.
Atmosphere 11 01198 g0a2aAtmosphere 11 01198 g0a2b

Appendix B

Table A1. Population density in 18 French areas: 2010–2014.
Urban AreaPopulation Density (Inhabitants/km2)
(2014 census)
Number of Municipalities
Bordeaux205622
Clermont-Ferrand195016
Dijon145515
Grenoble101346
Le Havre128716
Lens-Douai141732
Lille 185485
Lyon467919
Marseille22148
Montpellier136022
Nancy101038
Nantes105827
Nice36344
Paris8861124
Rennes22404
Rouen126243
Strasbourg201620
Toulouse153751

References

  1. Ministry of Health. Bilan de la Qualité de l’air en France en 2016; French Ministry of Health: Paris, France, 2017; pp. 1–28.
  2. Mills, I.C.; Atkinson, R.W.; Kang, S.; Walton, H.; Anderson, H.R. Quantitative systematic review of the associations between short-term exposure to nitrogen dioxide and mortality and hospital admissions. BMJ Open 2015, 5, e006946. [Google Scholar] [CrossRef]
  3. WHO. Review of Evidence on Health Aspectes of Air Pollution—Revihaap Project; World Health Organisation: Copenhague, Danemark, 2013; pp. 1–309. [Google Scholar]
  4. Anderson, H.R.; Atkinson, R.W.; Bremner, S.A.; Carrington, J.; Peacock, J. Quantitative Systematic Review of Short Term Associations Between Ambient Air Pollution (Particulate Matter, Ozone, Nitrogen Dioxide, Sulphur Dioxide and Carbon Monoxide), and Mortality and Morbidity; Department of Health: London, UK, 2007; p. 706.
  5. Blanchard, M.; Borrelli, D.; Chardon, B.; Chatignoux, E.; Declercq, C.; Fabre, P.; Host, S.; Jusot, J.F.; Larrieu, S.; Lefranc, A.; et al. Programme de surveillance air et santé. In Analyse des Liens à Court Terme Entre Pollution Atmosphérique Urbaine et Mortalité Dans Neuf Villes Françaises; Institut de Veille Sanitaire: Saint-Maurice, France, 2008; p. 41. [Google Scholar]
  6. EPA. U.S. Integrated Science Assessment (ISA) for Oxides of Nitrogen-Health Criteria (Final Report, 2016); EPA/600/R-15/068; U.S. Environmental Protection Agency: Washington, DC, USA, 2016.
  7. Samoli, E.; Aga, E.; Touloumi, G.; Nisiotis, K.; Forsberg, B.; Lefranc, A.; Pekkanen, J.; Wojtyniak, B.; Schindler, C.; Niciu, E.; et al. Short-term effects of nitrogen dioxide on mortality: An analysis within the APHEA project. Eur. Respir. J. 2006, 27, 1129–1138. [Google Scholar] [CrossRef] [PubMed]
  8. Stafoggia, M.; Faustini, A.; Rognoni, M.; Tessari, R.; Cadum, E.; Pacelli, B.; Pandolfi, P.; Miglio, R.; Mallone, S.; Vigotti, M.A.; et al. Air pollution and mortality in ten Italian cities. Results of the EpiAir Project. Epidemiol. Prev. 2009, 33 (Suppl. 1), 65–76. [Google Scholar] [PubMed]
  9. Perez, L.; Grize, L.; Infanger, D.; Kunzli, N.; Sommer, H.; Alt, G.M.; Schindler, C. Associations of daily levels of PM10 and NO2 with emergency hospital admissions and mortality in Switzerland: Trends and missed prevention potential over the last decade. Environ. Res. 2015, 140, 554–561. [Google Scholar] [CrossRef] [PubMed]
  10. Neuberger, M.; Moshammer, H.; Rabczenko, D. Acute and subacute effects of urban air pollution on cardiopulmonary emergencies and mortality: Time series studies in Austrian cities. Int. J. Environ. Res. Public Health 2013, 10, 4728–4751. [Google Scholar] [CrossRef]
  11. Corso, M.; Lagarrigue, R.; Medina, S. Pollution atmosphérique. In Guide Pour la Réalisation d’une Évaluation Quantitative des Impacts sur la Santé (EQIS). EQIS Avec une Exposition Mesurée; Santé Publique France: Saint-Maurice, France, 2019; p. 88. [Google Scholar]
  12. Hastie, T.J.; Tibshirani, R.J. Generalized Additive Models; CRC Press: Boca Raton, FL, USA, 1990; Volume 43. [Google Scholar]
  13. Touloumi, G.; Samoli, E.; Pipikou, M.; Le Tertre, A.; Atkinson, R.; Katsouyanni, K. Seasonal confounding in air pollution and health time-series studies: Effect on air pollution effect estimates. Stat. Med. 2006, 25, 4164–4178. [Google Scholar] [CrossRef]
  14. Gasparrini, A.; Guo, Y.; Hashizume, M.; Lavigne, E.; Zanobetti, A.; Schwartz, J.; Tobias, A.; Tong, S.; Rocklöv, J.; Forsberg, B.; et al. Mortality risk attributable to high and low ambient temperature: A multicountry observational study. Lancet 2015, 386, 369–375. [Google Scholar] [CrossRef]
  15. Pascal, M.; Wagner, V.; Corso, M.; Laaidi, K.; Ung, A.; Beaudeau, P. Heat and cold related-mortality in 18 French cities. Environ. Int. 2018, 121, 189–198. [Google Scholar] [CrossRef]
  16. Gasparrini, A.; Armstrong, B.; Kenward, M.G. Distributed lag non-linear models. Stat. Med. 2010, 29, 2224–2234. [Google Scholar] [CrossRef] [Green Version]
  17. Gasparrini, A.; Armstrong, B.; Kenward, M.G. Multivariate meta-analysis for non-linear and other multi-parameter associations. Stat. Med. 2012, 31, 3821–3839. [Google Scholar] [CrossRef] [Green Version]
  18. Higgins, J.P.; Thompson, S.G. Quantifying heterogeneity in a meta-analysis. Stat. Med. 2002, 21, 1539–1558. [Google Scholar] [CrossRef]
  19. Karagulian, F.; Belis, C.A.; Dora, C.F.C.; Prüss-Ustün, A.M.; Bonjour, S.; Adair-Rohani, H.; Amann, M. Contributions to cities’ ambient particulate matter (PM): A systematic review of local source contributions at global level. Atmos. Environ. 2015, 120, 475–483. [Google Scholar] [CrossRef]
  20. EPA. U.S. Final Report: Relative Toxicity of Air Pollution Mixtures U.S.; Environmental Protection Agency: Washington, DC, USA, 2016.
  21. Diaz, E.A.; Chung, Y.; Long, M.S.; Lawrence, J.; Papapostolou, V.; Lamoureux, D.; Mazzaro, V.; Buonfiglio, H.; Yoo, P.S.; Franco, F.; et al. Toxicological evaluation of realistic emissions source aerosols (TERESA): Mobile sources—Tunnel studies. In B52. Toxicology of Occupational and Environnemental Disease; American Thoracic Society: New York, NY, USA, 2011; p. A3231. [Google Scholar]
  22. Diaz, E.A.; Chung, Y.; Papapostolou, V.; Lawrence, J.; Long, M.S.; Hatakeyama, V.; Gomes, B.; Calil, Y.; Sato, R.; Koutrakis, P.; et al. Effects of fresh and aged vehicular exhaust emissions on breathing pattern and cellular responses--pilot single vehicle study. Inhal. Toxicol. 2012, 24, 288–295. [Google Scholar] [CrossRef] [Green Version]
  23. Petit, P.C.; Fine, D.H.; Vásquez, G.B.; Gamero, L.; Slaughter, M.S.; Dasse, K.A. The Pathophysiology of Nitrogen Dioxide During Inhaled Nitric Oxide Therapy. ASAIO J. 2017, 63, 7–13. [Google Scholar] [CrossRef]
  24. Carugno, M.; Consonni, D.; Randi, G.; Catelan, D.; Grisotto, L.; Bertazzi, P.A.; Biggeri, A.; Baccini, M. Air pollution exposure, cause-specific deaths and hospitalizations in a highly polluted Italian region. Environ. Res. 2016, 147, 415–424. [Google Scholar] [CrossRef] [Green Version]
  25. Renzi, M.; Stafoggia, M.; Faustini, A.; Cesaroni, G.; Cattani, G.; Forastiere, F. Analysis of Temporal Variability in the Short-term Effects of Ambient Air Pollutants on Nonaccidental Mortality in Rome, Italy (1998–2014). Environ. Health Perspect. 2017, 125, 067019. [Google Scholar] [CrossRef] [Green Version]
  26. Crouse, D.L.; Peters, P.A.; Hystad, P.; Brook, J.R.; Van Donkelaar, A.; Martin, R.V.; Villeneuve, P.J.; Jerrett, M.; Goldberg, M.S.; Pope, C.A., III; et al. Ambient PM2.5, O3, and NO2 exposures and associations with mortality over 16 years of follow-up in the Canadian Census Health and Environment Cohort (CanCHEC). Environ. Health Perspect. 2015, 123, 1180–1186. [Google Scholar] [CrossRef] [PubMed] [Green Version]
  27. Zhang, C.; Ding, R.; Xiao, C.; Xu, Y.; Cheng, H.; Zhu, F.; Lei, R.; Di, D.; Zhao, Q.; Cao, J. Association between air pollution and cardiovascular mortality in Hefei, China: A time-series analysis. Environ. Pollut. 2017, 229, 790–797. [Google Scholar] [CrossRef] [PubMed]
  28. Lu, F.; Zhou, L.; Xu, Y.; Zheng, T.; Guo, Y.; Wellenius, G.A.; Bassig, B.A.; Chen, X.; Wang, H.; Zheng, X. Short-term effects of air pollution on daily mortality and years of life lost in Nanjing, China. Sci. Total Environ. 2015, 536, 123–129. [Google Scholar] [CrossRef]
  29. Chiusolo, M.; Cadum, E.; Stafoggia, M.; Galassi, C.; Berti, G.; Faustini, A.; Bisanti, L.; Vigotti, M.A.; Dessi, M.P.; Cernigliaro, A.; et al. Short-Term Effects of Nitrogen Dioxide on Mortality and Susceptibility Factors in 10 Italian Cities: The EpiAir Study. Environ. Health Perspect. 2011, 119, 1233–1238. [Google Scholar] [CrossRef] [PubMed] [Green Version]
  30. Wichmann, J.; Voyi, K. Ambient air pollution exposure and respiratory, cardiovascular and cerebrovascular mortality in Cape Town, South Africa: 2001–2006. Int. J. Environ. Res. Public Health 2012, 9, 3978–4016. [Google Scholar] [CrossRef]
  31. Shin, H.H.; Stieb, D.; Burnett, R.; Takahara, G.; Jessiman, B. Tracking national and regional spatial-temporal mortality risk associated with NO2 concentrations in Canada: A Bayesian hierarchical two-level model. Risk Anal. 2012, 32, 513–530. [Google Scholar] [CrossRef]
  32. Chen, R.; Samoli, E.; Wong, C.M.; Huang, W.; Wang, Z.; Chen, B.; Kan, H. Associations between short-term exposure to nitrogen dioxide and mortality in 17 Chinese cities: The China Air Pollution and Health Effects Study (CAPES). Environ. Int. 2012, 45, 32–38. [Google Scholar] [CrossRef]
  33. Park, A.K.; Hong, Y.C.; Kim, H. Effect of changes in season and temperature on mortality associated with air pollution in Seoul, Korea. J. Epidemiol. Community Health 2011, 65, 368–375. [Google Scholar] [CrossRef]
  34. Wong, C.M.; Vichit-Vadakan, N.; Vajanapoom, N.; Ostro, B.; Thach, T.Q.; Chau, P.Y.; Chan, E.K.; Chung, R.Y.; Ou, C.Q.; Yang, L.; et al. Part 5. Public health and air pollution in Asia (PAPA): A combined analysis of four studies of air pollution and mortality. Res. Rep. Health Eff. Inst. 2010, 377–418. [Google Scholar] [PubMed]
  35. Costa, A.F.; Hoek, G.; Brunekreef, B.; Ponce de Leon, A.C.M. Effects of NO2 exposure on daily mortality in Sao Paulo, Brazil. Environ. Res. 2017, 159, 539–544. [Google Scholar] [CrossRef]
  36. Mills, I.C.; Atkinson, R.W.; Anderson, H.R.; Maynard, R.L.; Strachan, D.P. Distinguishing the associations between daily mortality and hospital admissions and nitrogen dioxide from those of particulate matter: A systematic review and meta-analysis. BMJ Open 2016, 6, e010751. [Google Scholar] [CrossRef] [PubMed] [Green Version]
  37. Li, H.; Chen, R.; Meng, X.; Zhao, Z.; Cai, J.; Wang, C.; Yang, C.; Kan, H. Short-term exposure to ambient air pollution and coronary heart disease mortality in 8 Chinese cities. Int. J. Cardiol. 2015, 197, 265–270. [Google Scholar] [CrossRef]
Figure 1. Map of 18 study areas and relative population sizes.
Atmosphere 11 01198 g001
Figure 2. Excess relative risk (ERR) and 95% confidence intervals (95% CI) for non-accidental and cardiovascular deaths associated with a 10 µg m−3 increase of NO2 concentrations, according to age (total population and ≥75 years) using different lags (single and cumulative) in single pollutant models (18 areas, metropolitan France, 2010–2014).
Atmosphere 11 01198 g002aAtmosphere 11 01198 g002b
Table 1. Mean levels of air pollution indicators and the number of monitoring stations considered to build the exposure indicator, according to study area: 2010–2014.
Study AreaDaily Mean NO2 LevelsDaily Mean PM10 LevelsDaily Maximum O3 from 8 h Running Means Levels
Mean
(Min–Max)
(µg m−3)
Number of Monitoring StationsMean
(Min–Max)
(µg m−3)
Number of Monitoring StationsMean
(Min–Max)
(µg m−3)
Number of Monitoring Stations
Bordeaux19.6 (2.0; 67.9)321.9 (6.2; 88.3)381.3 (3.7; 175.3)3
Clermont-Ferrand24.0 (2.1; 104.1)219.9 (2.4; 86.5)272.6 (1.7; 153.5)2
Dijon22.5 (2.4; 73.1)418.9 (2.9; 81.3)169.6 (4.0; 156.0)4
Grenoble23.8 (2.7; 80.8)324.1 (3.5; 90.7)363.0 (1.2; 157.1)6
Le Havre22.4 (2.0; 79.0)122.4 (4.0; 96.0)170.8 (3.8; 178.1)1
Lens-Douai21.7 (1.0; 81.0)224.2 (3.0; 97.6)255.5 (0.8; 175.5)2
Lille 25.3 (3.5; 80.3)323.6 (4.9; 100.8)357.5 (1.0; 193.6)5
Lyon31.1 (4.3; 96.3)425.2 (5.0; 98.3)364.8 (0.5; 184.4)4
Marseille32.7 (4.5; 82.3)431.2 (6.0; 105.5)277.6 (4.5; 178.0)2
Montpellier25.9 (1.1; 79.5)220.5 (3.7; 77.1)180.0 (13.3; 156.9)3
Nancy24.4 (4.7; 67.1)324.9 (4.6; 91.4)268.6 (1.9; 164.9)3
Nantes17.9 (1.8; 73.4)220.2 (5.7; 89.2)275.8 (7.6; 172.8)2
Nice24.9 (5.0; 55.0)125.3 (4.0; 59.0)185.0 (14.6; 176.5)2
Paris36.0 (8.3; 93.0)1525.1 (5.3; 111.8)758.7 (1.5; 179.8)13
Rennes18.7 (0.7; 84.45)119.6 (3.2; 89.0)163.8 (4.3; 154.4)1
Rouen25.7 (3.7; 75.0)324.6 (5.5; 112.5)265.1 (3.8; 173.8)4
Strasbourg27.0 (4.7; 73.5)220.9 (3.0; 78.7)246.2 (0.3; 196.1)2
Toulouse21.1 (2.3; 76.8)321.2 (4.1; 85.3)377.1 (5.1; 158.5)5
Table 2. Demographic characteristics and daily mean number of non-accidental and cardiovascular deaths for all ages and for people aged 75 years and over in 18 French areas: 2010–2014.
Demographic CharacteristicsDaily Mean Number of Deaths
Non-AccidentalCardiovascular
AreaTotal PopulationAll Ages75 Years and OverAll Ages75 Years and Over
Bordeaux686,82412.68.93.32.7
Clermont-Ferrand284,6725.841.51.2
Dijon241,5914.73.31.21
Grenoble484,12285.72.11.8
Le Havre235,565.83.61.51.1
Lens-Douai324,2868.65.32.11.6
Lille1,133,92020.712.95.23.9
Lyon1,082,18018.112.44.53.7
Marseille979,0521.615.35.84.7
Montpellier421,6476.64.61.81.4
Nancy328,9196.94.71.71.3
Nantes633,39110.67.22.82.3
Nice434,58111.78.63.12.6
Paris6,754,282104.566.823.818.7
Rennes250,4584.02.81.21
Rouen449,6879.96.62.72.1
Strasbourg448,4248.65.72.31.8
Toulouse814,16212.28.32.92.4
Table 3. Temperatures in 18 French areas: 2010–2014.
Urban AreaAverage Temperatures (°C) by Period
MinimumMaximumMean
Cold *Warm **Cold *Warm **Cold *Warm **
Bordeaux5.313.613.424.19.418.9
Clermont-Ferrand2.311.611.222.86.817.2
Dijon2.111.59.622.15.916.8
Grenoble1.712.311.224.26.518.3
Le Havre5.413.09.718.47.615.7
Lens-Douai3.111.49.520.36.315.9
Lille 3.111.49.520.36.315.9
Lyon3.613.611.123.97.418.7
Marseille5.816.114.526.710.221.4
Montpellier5.715.914.625.810.220.9
Nancy1.910.99.321.65.616.3
Nantes4.411.912.222.28.317.0
Nice8.118.114.824.211.521.2
Paris5.013.410.822.07.917.7
Rennes4.011.111.821.67.916.4
Rouen2.910.69.820.26.415.4
Strasbourg2.111.69.622.55.917.0
Toulouse4.914.312.824.88.919.6
* Cold period = November to April; ** Warm period = May to October.
Table 4. Excess relative risk (ERR) and 95% confidence intervals (95% CI) of non-accidental and cardiovascular deaths associated with a 10 µg m−3 increase of NO2 concentrations (lag 0–1 day) according to age (total population versus 75 years and over) using the single- and two-pollutant models (18 areas, metropolitan France, 2010–2014).
PollutantNon-Accidental Deaths Cardiovascular Deaths
Total Population≥75 YearsTotal Population≥75 Years
Annual
NO20.75 (0.40; 1.10)1.14 (0.63; 1.66)1.13 (0.37; 1.90) 1.15 (0.40; 1.91)
+PM100.58 (0.15; 1.01)0.79 (0.27; 1.33)0.96 (−0.10; 2.04) 1.11 (0.08; 2.16)
+O31.12 (0.63; 1.61)1.47 (0.85; 2.10)1.39 (0.53; 2.25) 1.39 (0.58; 2.21)
Cold period
NO20.01 (−0.41; 0.42)0.20 (−0.30; 0.71)0.23 (−0.61; 1.08)0.25 (−0.65; 1.16)
+PM100.09 (−0.42; 0.60)0.28 (-0.35; 0.90)0.46 (−0.74; 1.67)0.73 (−0.64; 2.11)
+O30.30 (−0.17; 0.77)0.59 (-0.03; 1.21)0.48 (−0.54; 1.51) 0.55 (−0.52; 1.63)
Warm period
NO22.65 (1.82; 3.48)3.07 (1.97; 4.18)3.05 (1.38; 4.74)3.17 (1.53; 4.84)
+PM101.33 (0.37; 2.29)1.61 (0.23; 3.00)1.48 (0.08; 2.90)1.68 (0.20; 3.18)
+O32.54 (1.62; 3.47)2.98 (1.82; 4.17)3.16 (1.32; 5.03) 3.41 (1.57; 5.29)
Table 5. Excess relative risk (ERR) and 95% confidence intervals (95% CI) of non-accidental and cardiovascular deaths associated with a 10 µg m−3 increase of NO2 concentrations (lag 0–1 day).
Non-Accidental Deaths Cardiovascular Deaths
ReferencesYearsAreasAll Ages (%)75 Years and Over (%)All Ages (%)75 Years and Over (%)
Perez et al. 2015Switzerland0.7 (0.1; 1.3)0.6 (0.0; 1.2)0.4 (−0.1; 0.8)0.3 (−0.3; 0.8)
Carugno et al.2016Italy0.7 (0.13; 1.27)-1.12 (0.14; 2.11)1.17 (0.1; 2.26)
Mills et al.2015World0.71 (0.43; 1.00)-0.88 (0.63; 1.13)-
European0.9 (0.45; 1.35)-1.03 (0.70; 1.36)-
Renzi et al.2017Rome1.8 (1.35; 2.25)---
Neuberger et al.2013Vienne0.8 (0.0; 1.6)---
Crouse et al.2015Canada0.5 (0.4; 0.6)-0.4 (0.3; 0.5)-
This study2020France0.75 (0.40; 1.106)1.14 (0.63; 1.66)1.13 (0.37; 1.90)1.15 (0.40; 1.91)
Publisher’s Note: MDPI stays neutral with regard to jurisdictional claims in published maps and institutional affiliations.

