Review

Thermal Environment of Urban Schoolyards: Current and Future Design with Respect to Children’s Thermal Comfort

by
Dimitrios Antoniadis
,
Nikolaos Katsoulas
* and
Dimitris Κ. Papanastasiou
Laboratory of Agricultural Constructions and Environmental Control, Department of Agriculture Crop Production and Rural Environment, University of Thessaly, Fytokou Str, N. Ionia, P.C. 38446 Volos, Greece
*
Author to whom correspondence should be addressed.
Atmosphere 2020, 11(11), 1144; https://doi.org/10.3390/atmos11111144
Submission received: 22 September 2020 / Revised: 15 October 2020 / Accepted: 17 October 2020 / Published: 22 October 2020
(This article belongs to the Special Issue Challenges in Applied Human Biometeorology)

Abstract

:
Urban outdoor thermal conditions, and its impacts on the health and well-being for the city inhabitants have reached increased attention among biometeorological studies during the last two decades. Children are considered more sensitive and vulnerable to hot ambient conditions compared to adults, and are affected strongly by their thermal environment. One of the urban outdoor environments that children spend almost one third of their school time is the schoolyard. The aims of the present manuscript were to review studies conducted worldwide, in order to present the biophysical characteristics of the typical design of the urban schoolyard. This was done to assess, in terms of bioclimatology, the interactions between the thermal environment and the children’s body, to discuss the adverse effects of thermal environment on children, especially the case of heat stress, and to propose measures that could be applied to improve the thermal environment of schoolyards, focusing on vegetation. Human thermal comfort monitoring tools are mainly developed for adults, thus, further research is needed to adapt them to children. The schemes that are usually followed to design urban schoolyards create conditions that favour the exposure of children to excessive heat, inducing high health risks to them. The literature survey showed that typical urban schoolyard design (i.e., dense surface materials, absence of trees) triggered high surface temperatures (that may exceed 58 °C) and increased absorption of radiative heat load (that may exceed 64 °C in terms of Mean Radiant Temperature) during a clear day with intense solar radiation. Furthermore, vegetation cover has a positive impact on schoolyard’s microclimate, by improving thermal comfort and reducing heat stress perception of children. Design options for urban schoolyards and strategies that can mitigate the adverse effects of heat stress are proposed with focus on vegetation cover that affect positively their thermal environment and improve their aesthetic and functionality.

1. Introduction

Rapid urbanization has been observed worldwide since 1950. While 70% of people worldwide lived in rural areas in 1950, 55% of the world’s population lived in urban areas in 2018. Urbanization is expected to increase in the next decades, but with considerable variation depending on the region. In 2018, almost 75% of the European population was living in urban areas. Future projections suggest a 5% and 10% increase by 2040, and 2050, respectively [1]. The increase of urban population combined with the unsustainable urban design, climate change effects and climate phenomena of urban scale, like the urban heat island, can modify urban biometeorological conditions, affecting the health and the quality of the life of citizens [2].
The thermal environment induces adverse effects on human health, affecting psychological responses and cardiovascular functions, and increasing human mortality [3,4,5]. These effects are more pronounced for vulnerable groups, like children [6]. This fact raised the interest of the scientific community during the past several years for studies into the biometeorological conditions of urban schoolyards, indicatively [7,8,9,10,11,12,13], as these urban outdoor environments are daily used by the children. Exposure to heat and radiation are often enhanced in urban schoolyards and in the majority of outdoor children play places. A schoolyard’s design in densely built cities is mainly based on structure materials that are characterized by high heat capacity, such as asphalt and cement, while trees are either absent or confined to the perimeter of the schoolyard [14]. Therefore, their users, being children, that spend one third of their school time there, are exposed to high temperatures, excessive heat and radiation during the hot periods of the year.
This paper aims to present a review of studies conducted worldwide that examined the impact of the design of urban schoolyards on their thermal environment and how it affects the thermal comfort of the main users, the children, focusing on heat stress. The review’s objectives are threefold: (i) to highlight and discuss human biometeorological aspects derived from the interactions between meteorological parameters and human body and monitoring of human thermal comfort; (ii) to describe the thermal perception of children; (iii) to identify the sustainable urban planning measures and strategies that can mitigate the adverse effects of heat stress and improve the thermal environment of schoolyards, with focus on vegetation cover.

2. Methodology

A comprehensive literature review identified 142 papers in English published in peer-reviewed international scientific journals, published in books, conferences’ proceedings, produced by research projects, or posted on scientific internet sites, during the period 2001–2020. This review was based on a systematic search in Scopus database and Google search by specific keywords. Five specific study categories were identified and specific combinations of keywords were applied to each category (Table 1). Additionally, the review identified 26 sources published earlier than 2001 that present fundamental issues related to the study categories at the present review. A total of 29 literature sources refer to more than one study category.

3. Human Biometeorological Aspects

3.1. General

The human thermo-physiological perception of thermal conditions encompasses both atmospheric heat exchanges with the body (stress) and the body’s physiological response (strain) [15]. The energy exchanges between the human body and its surrounding environment depend on local characteristics of meteorological variables (air temperature, water vapour pressure, near surface wind speed, the incoming from all directions short- and long-wave radiation) and on personal parameters (clothing insulation worn by the subject and metabolic rate) [15,16]. The energy fluxes that affect the human energy budget outdoors, are metabolic heat production within the body (M), net radiative exchange (R), convective heat loss (C), conductive heat loss (K), and evaporative heat loss (E) [17,18,19] (Figure 1).
They are combined in the well-established human energy budget equation (Equation (1)),
M + R − C − K − E − ΔS = 0
where ΔS is the change in heat storage (Wm−2), which is 0 at energy balance, >0 at energy surplus, and <0 at energy deficit [17,18,19].
Thermoregulation is the ability of an organism to keep its body temperature within certain boundaries. The thermoregulatory system is dedicated to control body temperature. This system is composed by 3 interconnected subsystems: Sensory, control and regulatory. The major components of the sensory system are thermal receptors that are located throughout the body. The hypothalamus located at brain’s base controls the whole system, while special mechanisms regulate heat production and loss. Heat is produced by metabolism as well as by human activity, while climatic variables are also interact with the human thermoregulatory system [20,21]. Heat is released to the environment by convection (sensible heat flux), conduction (contact with solids), evaporation (latent heat flux), radiation (long- and short-wave), and respiration (latent and sensible) [15]. If the human body cannot adapt to hot or cold environmental conditions through thermoregulation, thermal discomfort arises. Thermal comfort refers to the perceived and therefore subjective satisfaction with thermal environmental conditions of humans [22].

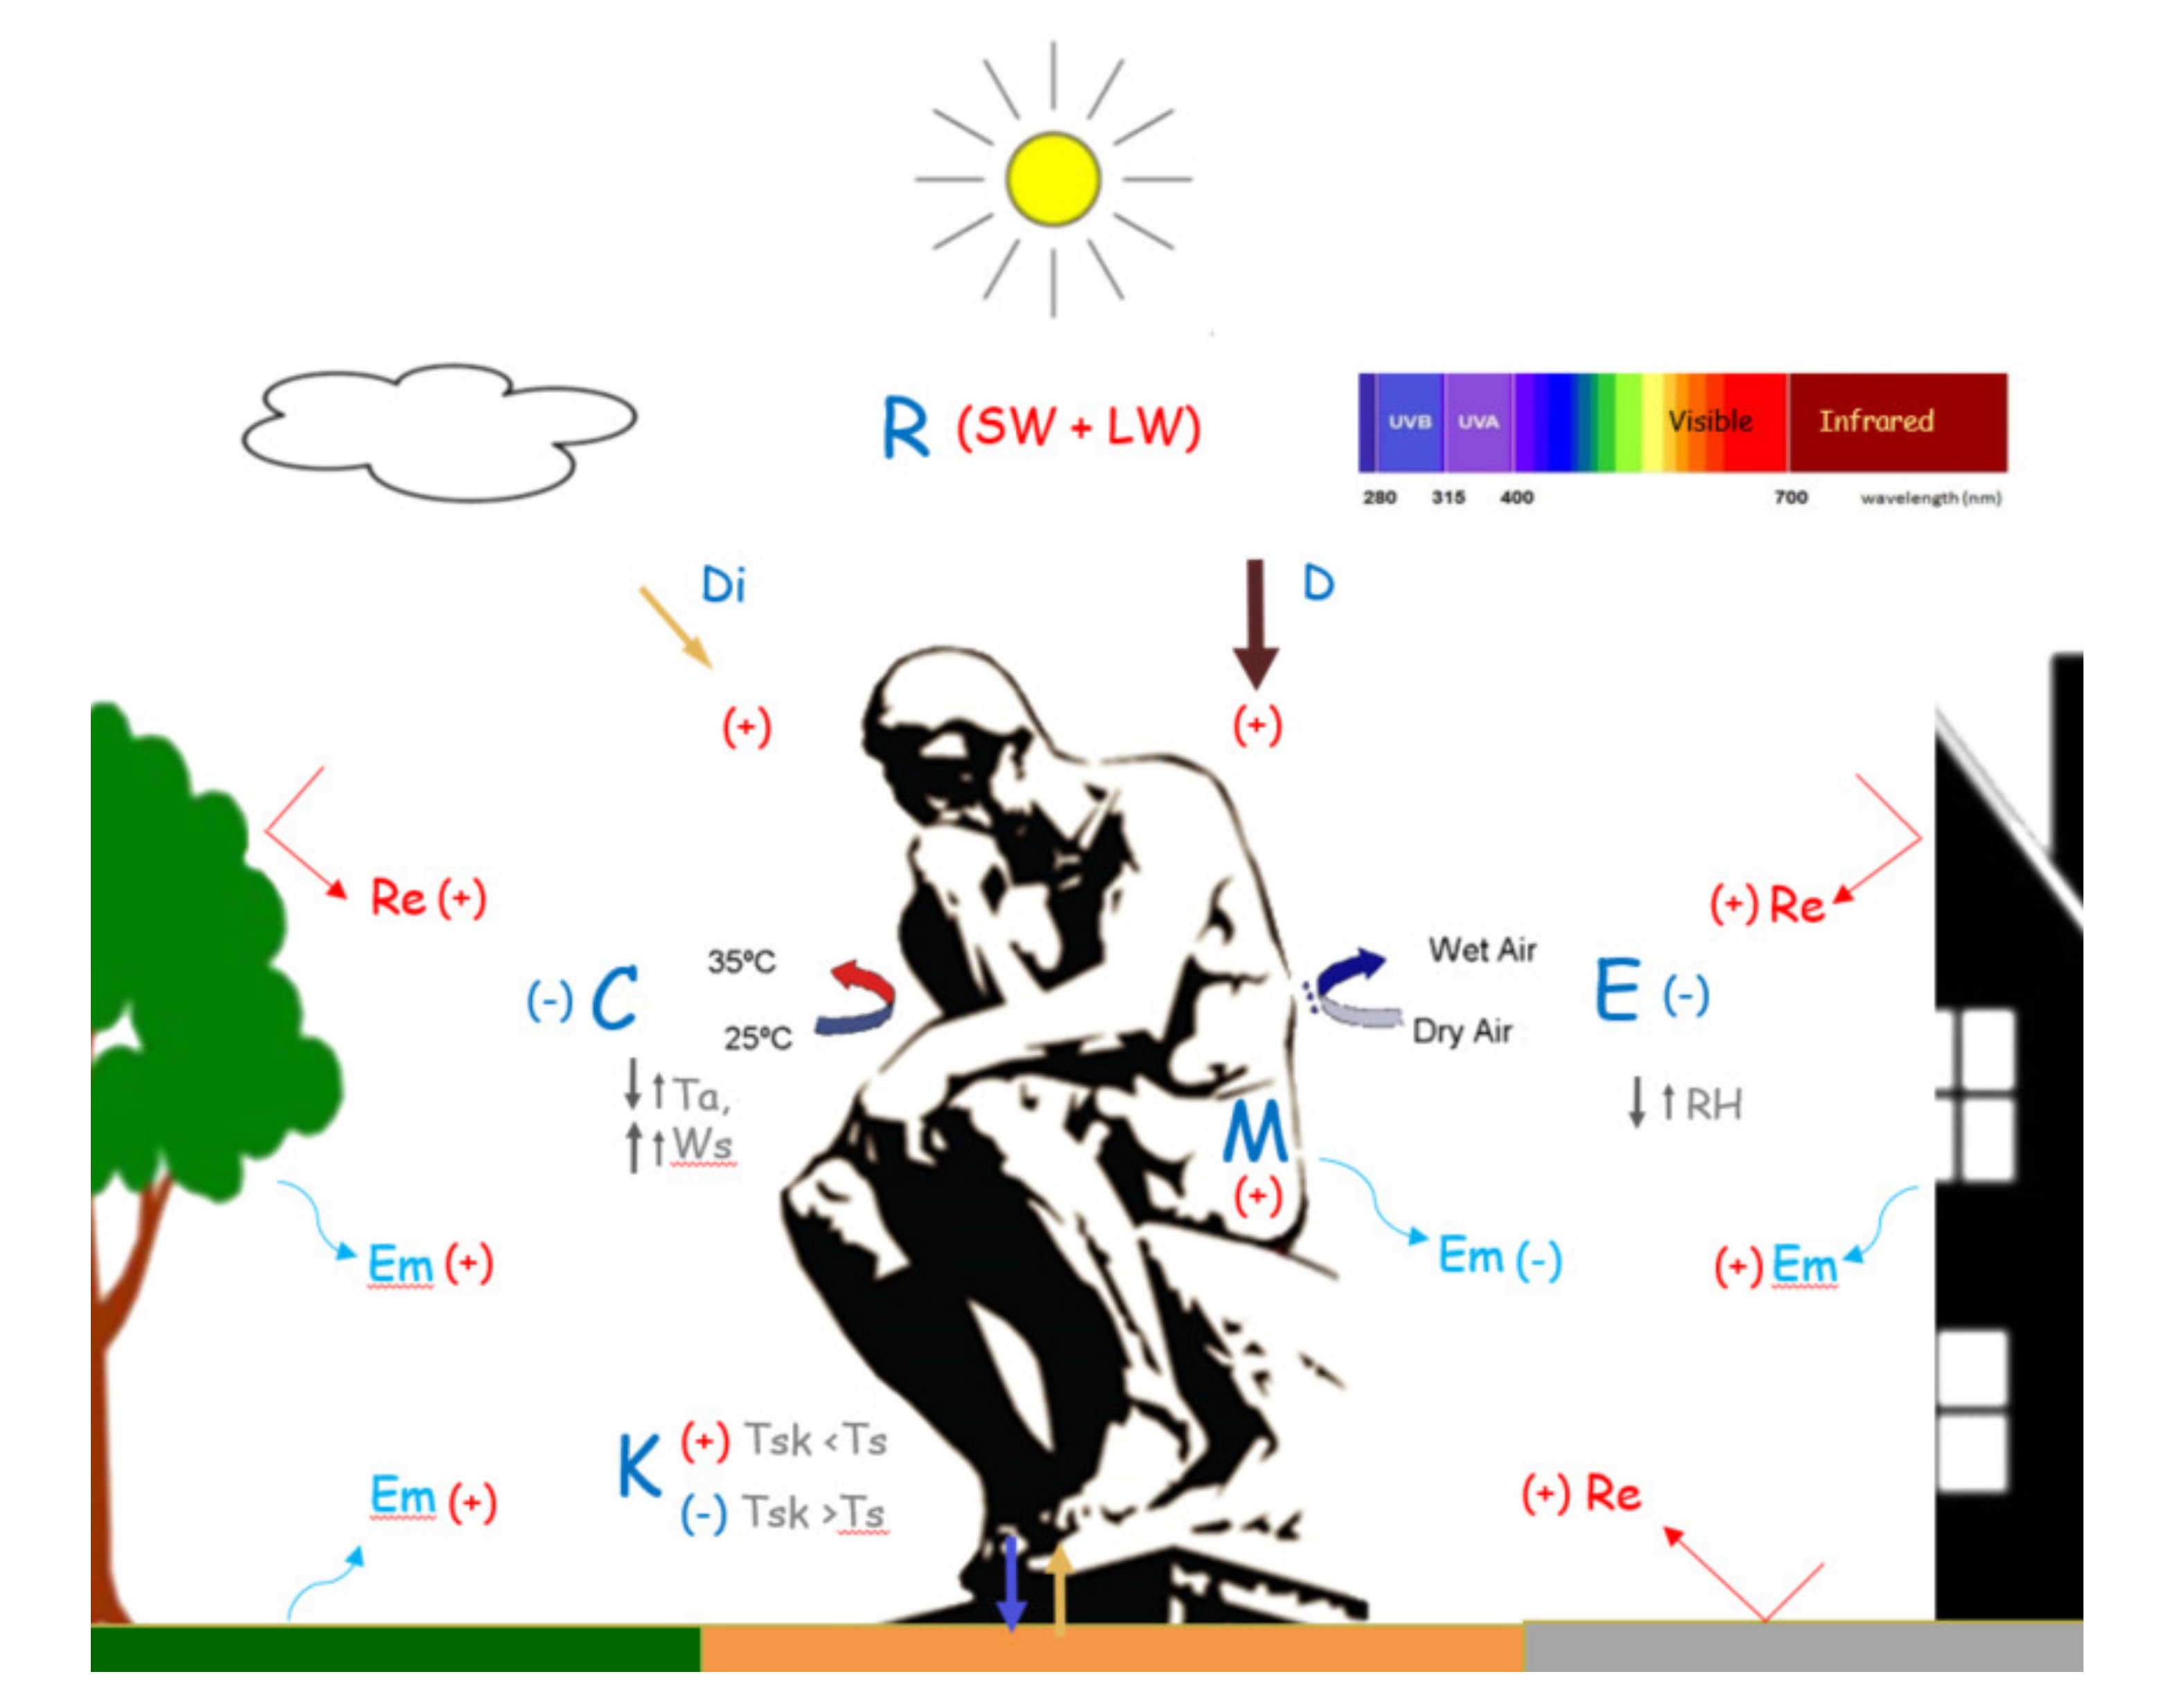
3.2. Interactions between Meteorological Parameters and Human Body

The term “thermal environment” in the common mind is related to air Temperature (Ta). Although the human thermo-physiological perception of thermal conditions, especially when talking for outdoor environments, exceeds that of solely Ta, and conglomerates with numerous other imperative climatic variables such as radiation fluxes, wind speed and humidity and incorporates human thermo-physiological factors [2].
In order to achieve thermal neutrality in the heat balance equation for the human body, which is a necessary condition for thermal comfort, the three climatic variables (solar radiation, wind speed, and humidity) could play a role in removing heat from the body when air temperature is lower than skin surface’s temperature. This occurs by adding radiative heat to the body when such gains are lower than metabolic heat production, and in interfering with evaporative heat loss from the lungs and with sweat evaporation from the skin surface [23].
The human body is exposed to short- and long-wave solar radiation fluxes, receiving direct, diffuse and reflected radiation from all-directions (upwards, downwards, peripherally). This fact contributes to human body’s sensible heat gain. Shading, sky view factors, the albedo of built and vegetative surfaces and of the body itself are factors that affect this absorption [24]. Under strong solar radiation flux, short-wave (solar) radiation is the main component of environmental heat load leading to potential heat stress [25]. Part of the absorbed heat is emitted by the human body as long-wave radiation back to the environment.
The solar radiation that is reflected by the ground depends strongly on surface’s albedo [26], which affects the interactions between the human body and the long- and short-wave radiation fluxes, the surface temperature and the near-surface air temperature [27].
The magnitude of long-wave radiation emitted by the ground depends on the surface temperature and material emission characteristics. Dry impermeable surfaces can produce high sensible heat flux, while sensible heat flux is reduced when the ground surface is covered with vegetation and is irrigated or in the presence of water bodies [24]. Natural or artificial objects could be used to shade the ground surface otherwise its temperature may be significantly increased [26].
Convective energy exchange refers mainly to the sensible heat flux through turbulence, while advection is managed through wind flow [28,29] and can occur as a function of the temperature difference between the skin and the air and an empirical heat transfer coefficient that is based on wind speed [24]. When wind speed is very low, stagnation is established, increasing the effect of heat stress, as the heat loss by convection is reduced.
Convective heat gain by the human body is increased when high air temperatures prevail, favouring heat stress and thermal discomfort conditions. When high relative humidity and high air temperature prevail, discomfort conditions are established and health risk is increased, as latent heat loss by evaporative cooling (i.e., through sweating) is reduced [26]. The extent of the effect of air’s temperature and humidity on an individual’s thermal comfort is also driven by other parameters like cultural habits, acclimatization, housing conditions, and clothing, introducing a site-specific component. Thus, comparative assessment of comfort studies should be treated with caution [23].

3.3. Monitoring Outdoor Human Thermal Comfort—Human Thermal Indices

Human thermal comfort is defined as “the state of mind, which expresses satisfaction with the thermal environment” (ASHRAE, 2004, 2010) [22,30]. During the last decades, many research studies have been conducted to assess and classify outdoor human thermal conditions [31]. The desire to compare between the findings of human thermal perception studies has led researchers to look for unified thermal criteria standardization, data collection methods (instrument and questionnaires), data analysing and reporting of the thermal comfort studies outcomes [32].
Thermal sensation can be assessed in two ways: (1) Through direct classification of an individual in a given environment following a hot to cold scale of defined steps of subjective characterization of the thermal environment; and (2) through energy balance modelling of an individual to predict its thermal sensation based on the difference between body’s heat gains (e.g., metabolism, radiation) and body’s normal losses (e.g., convection, evaporation) [33].
The human thermal comfort indices are a useful tool for quantitative and qualitative research regarding human wellbeing [34]. Comprehensive reviews that identify the most popular human thermal indices, examine their relation to the climatic conditions, and compare between human thermal perceptions in different climatic zones are [31,32,35].
The initial scientific approach have been followed mainly by researchers from the fields of public health, medicine, physiology, biometeorology and engineering to develop health warning systems, concentrated on the strain induced by hot or cold climatic conditions in different climate types [31]. After 2000, increased attention was paid on urban outdoor thermal conditions for the city inhabitants as a new field of research for architects, landscape designers and bioclimatologists, aiming to provide strategies for sustainable urban planning [31], to estimate urban heat island effects and to forecast biometeorological conditions [20].
Data observed during field studies have been exploited to develop a large variety of models, from simple to complex, that take into account energy exchange processes (Equation (1)) and weather conditions. The major energy balance models include steady state models that identify values at a single point in time and consider an average human body. The most important steady state models are the Predicted Mean Vote (PMV) [7], which was the first model that included all forms of heat exchange; the Klima Michel Model [36], which was a modification of Fanger’s PMV to incorporate complex outdoor radiation and introduced the output parameter “Perceived Temperature” (PT) [37]; the MEMI model (Munich Energy—balance Models for individuals) [20], which was a thermo-physiological heat balance model exploited as the basis to introduce the “Physiologically Equivalent Temperature” (PET) and the Outdoor Apparent Temperature [38]; the Man ENvironmental heat EXchange model) (MENEX model) [39,40]; and the multi-node dynamic-thermophysiological UTCI-Fiala model based on heat budget, thermoregulation, and clothing models [41,42]. Finally, The ‘COMfort FormulA’ (COMFA) energy budget model [43] exploits perspiration rate, energy budget, core body, and skin temperature to describe the human energy balance. This model is considered capable of estimating the thermal sensation of people characterized by a high rate of metabolic activity [44,45,46].
Nevertheless, steady-state models don’t consider the dynamic heat change during a period of time due to the variability of solar exposure, wind speed, and exposure duration and especially due to the accumulated heat during physical exercise that reduces the human capacity to acclimatize [47,48]. Therefore, related studies could be expanded on the development of the non-steady-state models to consider and quantify outdoor human comfort over time [47,48].
In addition to the developed models, in situ questionnaires and participant observation research to collect data on outdoor users’ perceptions, have been exploited to include the subjective sensation of users in different surroundings [49], while linear regression equations have been applied to define empirical indices that could be used to estimate the human comfort for a specific climate as a function of the thermal environment [35].
A recent pair of reviews [50,51] identified 165 human thermal indices for indoor and outdoor application that have been developed worldwide. From the early thermohygrometric indices that used simple climatic variables such as air temperature and air humidity to describe the human thermal sensation, in the last four decades effort have been made to develop universal human thermal indices, capable of evaluating both cold and hot conditions [31], some of which are among the most used until today; the Predicted Mean Vote (PMV) [17,52], the Physiologically Equivalent Temperature (PET) [21,53], the Temperature Humidity Index (THI) [54], the Perceived Temperature (PT) [37,55], the Standard Effective Temperature (SET*) [52,56] and its outdoor variant, OUT_-SET* [57] and the Universal Thermal Climate Index (UTCI) [15,58]. Hondula et al. [59] reviewed papers that examined thermal comfort aspects and near half of them used PET index to describe thermal comfort conditions, followed by UTCI, while Potchter et al. [31], found that only 4 (PET, PMV, UTCI, SET*) are widely in use for outdoor thermal perception studies. The three more popular indices (PET, PMV and UTCI) have the same characteristics, they are universal indices suitable for cold and hot environments, cover a wide range of thermal sensation or stress classification, and classify thermal sensation in 7 to 10 categories [31].
The human thermal index PET is based on the steady state MEMI model. It is a thermal index widely applied in different climatic zones [60], as it can be calibrated easily. It is measured in °C, making the results easily communicable among professionals to comprehend and approach urban climatological aspects effectively and easily comparable to assess different levels of human thermal perception and physiological stress [2]. The air temperature, the air relative humidity, the wind speed, the Mean Radiant Temperature (Tmrt), the metabolic rate, and the clothing type together with personal human characteristics are used as input variables to calculate the PET index. Among these variables the most important is Tmrt, which is defined as a combination of all short- and long-wave radiation fluxes [61] and expresses the effect of the surrounding radiation environment on the human body in °C. PET’s neutral sensation is adapted to different climates [62,63], while further development of PET index improved its capacity to estimate the bioclimatic performance in outdoor spaces [64,65].
The thermal index UTCI [66] was developed by 45 scientists with multidisciplinary backgrounds from 23 countries in order to standardize applications across major fields of human biometeorology. It has been applied to all climates and has achieved to simulate adequately the field data [67]. Charalampopoulos and Nouri, [34] investigated the behaviour of Human Thermal Indices under Divergent Atmospheric Conditions analysing commonly used human thermal indices, two Statistical/Algebraic indices (Thermohygrometric Index (THI) and HUMIDEX (HUM)), and four Energy Balance Model indices (Physiologically Equivalent Temperature (PET), modified PET (mPET) [64], Universal Thermal Climate Index (UTCI), and Perceived Temperature (PT). They concluded that the thermohygrometric indices cannot follow and present the thermal conditions’ variations as they exclude essential factors such as radiation fluxes, while on the other hand, UTCI is very sensitive under low radiation condition, and PET/mPET present higher sensitivity when the weather is dominated by high radiation and air temperature. These results reinforce the importance of energy balance models in obtaining wholesome understandings of thermo-physiological factors that are essential to human thermal comfort evaluations in urban environments [31].
Specialised software can simulate the thermal conditions of an urban area, which can then be evaluated by the calculation of human thermal indices. These software packages uses atmospheric data, built structures and vegetation of a given urban configuration as input data. Such available models are the ENVI-met software [68], the RayMan model [69], the SkyHelios model [70], the SOLWEIG software [71], the UMEP [72] and ANSYS Fluent models [73].
The Computational Fluid Dynamics (CFD) microclimate modelling system ENVI-met [74,75] is a holistic three-dimensional non-hydrostatic model that can be applied to simulate the surface-plant-air interactions in urban environments.
RayMan and SkyHelios models are open access micro-scale models that can be applied to estimate Sky View Factor, sunshine duration, shadow, and in general radiation fluxes. In addition, RayMan model is able to estimate the most modern thermal indices used in human biometeorology. These two models have the capability to handle several data formats, in order to produce their outputs and transfer information for further processing in urban climatological studies [70].
The SOLWEIG model (The Solar LongWave Environmental Irrandiance Geometry model) simulates spatial variations of Tmrt and 3D fluxes of long- and short-wave radiation, and after 2016 was incorporated in UMEP tool [71].
The open-source tool UMEP is a city-based climate service tool that combines models and tools essential for climate simulations. It exploits atmospheric and surface data from multiple sources to characterize the urban environment, to prepare meteorological data for urban studies, to perform simulations considering different scenarios, and to compare and visualise different combinations of climate indicators. [72].
Finally, ANSYS Fluent model is a fluid simulation software characterised by advanced capabilities to model the physics of turbulence, models, multiphase flows, heat and mass transfer, chemical reactions and other related phenomena [73].

3.4. Thermal Perception of Children

There is an increasing interest in designing urban areas to be thermally comfortable during hot weather so as to encourage people and especially children, who are considered more sensitive and vulnerable to hot ambient conditions compared to adults [76], to spend more time outdoors. Although many outdoor thermal comfort models have been developed, [35], none has been developed for children [48]. Designing outdoor areas for children based on adult thermal comfort models might result in areas that are thermally comfortable for adults, but not for children [48]. The concept of thermal comfort was introduced in 70s [77], but until today, it has been rarely addressed in relation to children.
The individual’s personal information about metabolism, age, gender, clothing, position and physical variables, are considered as factors that affect human thermal comfort [12]. Therefore, differences may arise among age groups [78,79,80,81,82]. When considering equation 1, specific differences can be identified for children compared to adults that refer to convective, evaporation and radiative heat exchanges [48] (Table 2). The major physical differences between children and adults are the higher surface area-to-body mass ratio of children [78,79] and their higher metabolic rate [79]. Cheng et al., [48] compared the energy budget differences of a 40-year old man (height = 176 cm, weight = 65 kg) and a 7-year-old boy (height = 121.9 cm weight = 22.9 kg) and found that during a clear hot day, the energy budget of the boy wearing T-shirt and shorts can be 21 W/m2 higher than the man’s energy budget. The higher surface area-to-body mass ratio of children increase the absorption of heat to them, resulting in higher convection heat exchange compared to adults, while children’s higher metabolic rate contributes to more heat production per body mass [48]. Also, children have inferior thermoregulation during extreme heat events compared to adults [83,84,85,86] among others due to undeveloped sweat gland capacity and lower sweat rate [78,85,87,88] that leads to lower evaporation heat exchange. All these differences trigger differences in children’s thermal perception compared to adults [12,48,89,90].
Children may experience more rapid heat exchanges in extreme environments [48,87,91,92]. In a hot environment, dry convective heat loss (C) is the mechanism that mainly drives heat loss from their body instead of evaporative heat loss (E) that is for adults [93]. This physiological difference could be attributed not to a lower number of sweat glands per surface area, but to a lower sweat rate per gland [83,84,94]. The children’s need to dissipate heat by convection and hence, the increased skin blood flow, that occurs when air temperatures exceeds skin’s temperature, results in a heat gain. This fact, combined with increased heat absorption rate due to the prevalence of high air temperatures, contributes to the establishment of heat stress condition in short time [6].
Surfaces that are not protected from solar radiation can reach high temperatures during the warm season, retain and emit large amounts of heat [33], enhancing the thermal impacts of long-wave heat fluxes to children, who are closer to the ground due to their smaller height compared to adults [6,95], as well as increasing the potential for heat illness and skin burns [13]. The effects are more pronounced when children have physical activity in a warm-to-hot environment, when the extra heat produced by metabolic activity can cause heat stress or illnesses [96] that include, in increasing order of severity, heat rash, heat oedema, heat syncope, heat cramps, heat exhaustion and life-threatening heatstroke [97]. Also, children are considered a vulnerable group to sun exposure and to sunburns arising from less adaptive behaviour (e.g., knowledge and sunscreen use), high intermittent exposures, and more sensitive skin, while exposure to high UV radiation, increase children’s cancer risks [33].
Vanos [6] discussed how the differences between children’s and adult’s physiology can potentially introduce inaccuracies in steady state models and thermal indices outcomes. Regarding body surface area (BSA), assuming an average BSA of 1.8 m2 (PET) and 1.86 m2 (UTCI) for an adult and a BSA of 0.72m2 for a five-year old child, and the same heat production of 90W for both, the result would be an average metabolic rate of 125 W m2 for the child and 50 W m2 for the adult (resting). Regarding the metabolic output in energy budget modelling, an average age and metabolic output is commonly assumed. Nevertheless, too much emphasis has been placed on the accuracy of the indices, whereas in reality, practicability and applicability play the most important role [98]. Although further research is required to adapt PET or UTCI for children as heat- related effects are more pronounced for children than for adults [99], these indices are among the most popular thermal comfort indices, although children’s thermal sensation under hot weather conditions is expected to be even higher than those estimated by PET, as there is a relatively higher rate of heat absorption and a quicker path to heat stress [6].
Although the assessment of the thermal environment of children within indoor classrooms has been studied since the 1960s, only a few studies investigated the relation between children age group and thermal perception outdoors [100]. Lai et al. [101] examined the relation between the subjective thermal sensation of three different age groups, namely children under 20 years old, adults aged between 20 and 60, and seniors over 60 and air temperature and showed that the mean thermal sensation, clothing level, and metabolic rate of the three different age groups at different air temperature ranges. The thermal sensation of the children was the highest, while that of the seniors was the lowest. The children felt the warmest because they were the most active. For all respondents, Thermal Sensation Vote (TSV) gradually increased with air temperature. When the air temperature was below 30 °C, the subjects adapted to temperature increase by reducing their clothing and activity levels to keep their thermal sensation. When the air temperature was above 30 °C, the adaptation behaviour of the subjects was no longer sufficient to cope with the high temperature. Also, Yang et al. [102] examined the mean TSV for different age groups including children under 15 years old at different air-dry bulb temperature levels. They investigated the relationship between microclimate environments, park use, and human behavioural patterns in the urban area of Umeå, Sweden, which is under subarctic climate. Observations of naturally occurring behaviour were recorded. Structured interviews, based on specially designed questionnaires, were performed. Human subjective responses from the questionnaire survey were compared with objectively measured results. Mean TSV of children was higher than that of adults, a fact that was attributed to children’s higher metabolic rates.
Kruger and Rossi, [23] evaluated the relationship between personal (gender and age) and microclimatic factors with the thermal sensation of people in downtown Curitiba, Brazil. They developed a formula, expressing the thermal sensation as a function of the climatic conditions to which people were exposed. The results indicated that younger males were more sensitive to heat than older males, while for females differences were even larger.
The study of Vanos et al. [100], in which they applied the COMFA energy budget model, was the first attempt to assess children’s thermal comfort (ages 9 to 13) during activity. This study investigated changes in incident radiation and metabolism when children were outdoors under sun and shade when hot weather prevailed. The model adequately predicted the thermal sensation of the children and succeeded to simulate the biophysical energy fluxes that are modified by activity and urban design interventions (metabolic heat, and radiation, respectively).
Cheng et al. [48], evaluated existing thermal comfort models to identify a comprehensive, validated model that had open architecture and that could be modified for children, in order to take into account children’s physical and physiological characteristics. In their work, they modified the COMFA model into a children’s version, named COMFA-kid, by adjusting the model’s components related to metabolic heat, convective heat, and evaporative heat exchange, and the accuracy of prediction was improved. In any case, both the COMFA model and the COMFA-kid model are steady-state models that estimate values at a single point in time. However, they do not consider the dynamic heat change during a period of time especially the accumulated core heat during exercise, a fact that highlights the need for further studies to develop non-steady-state models for children [48].

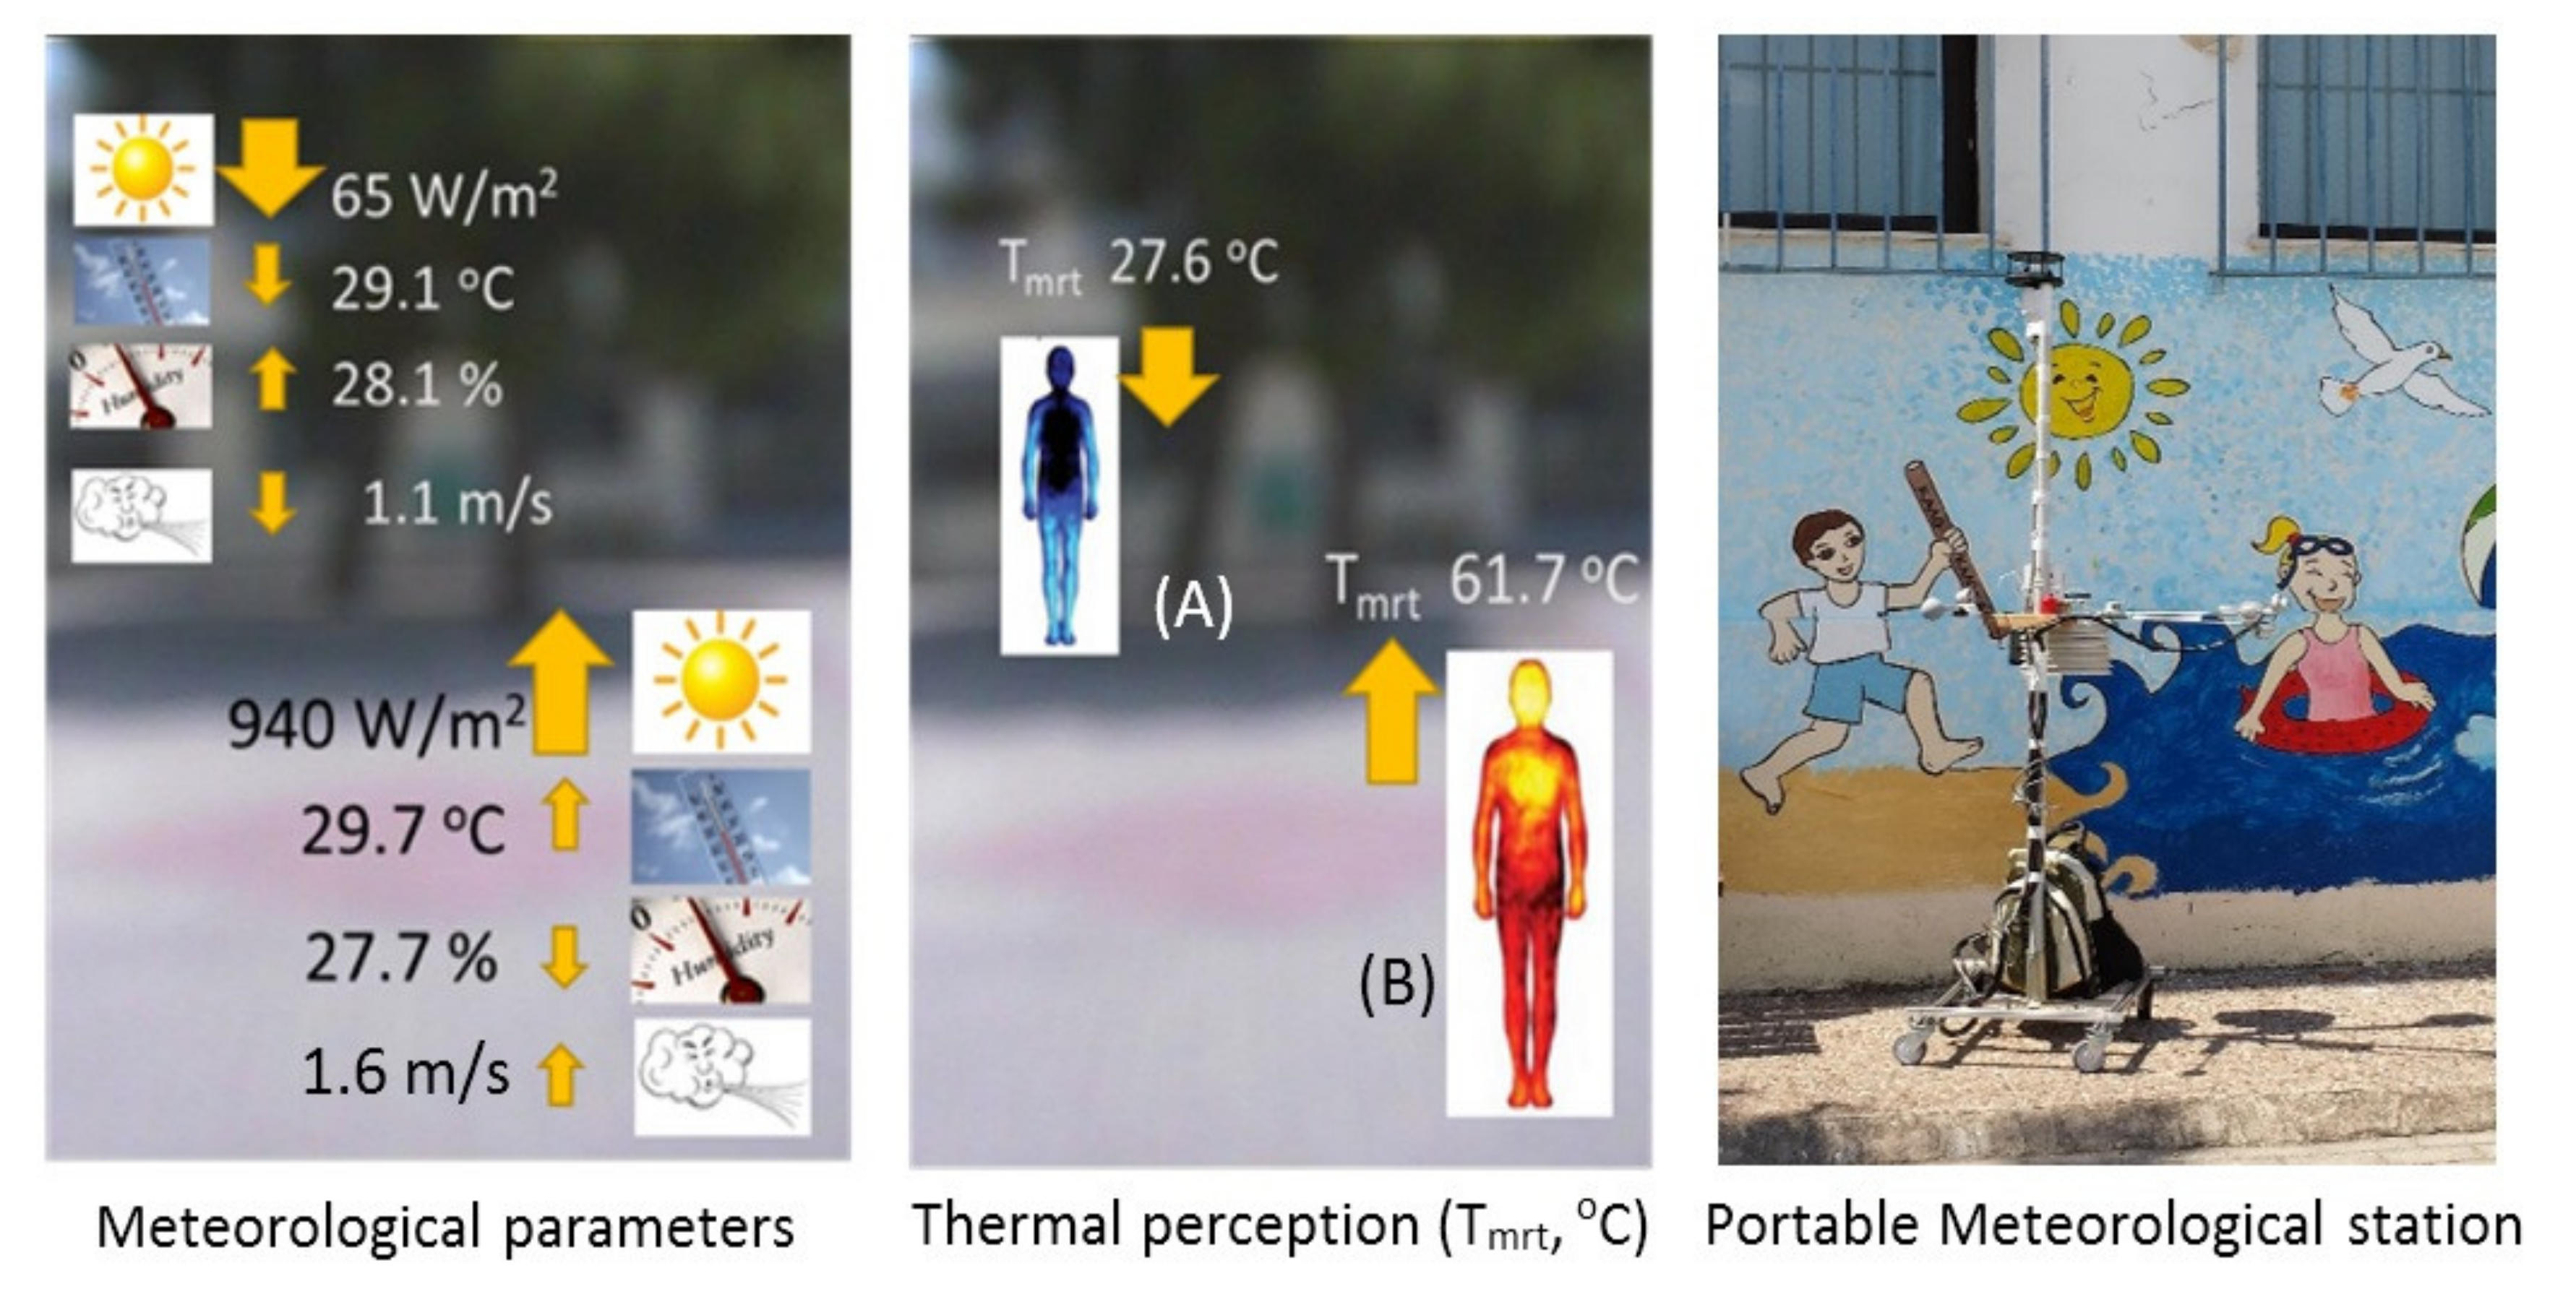
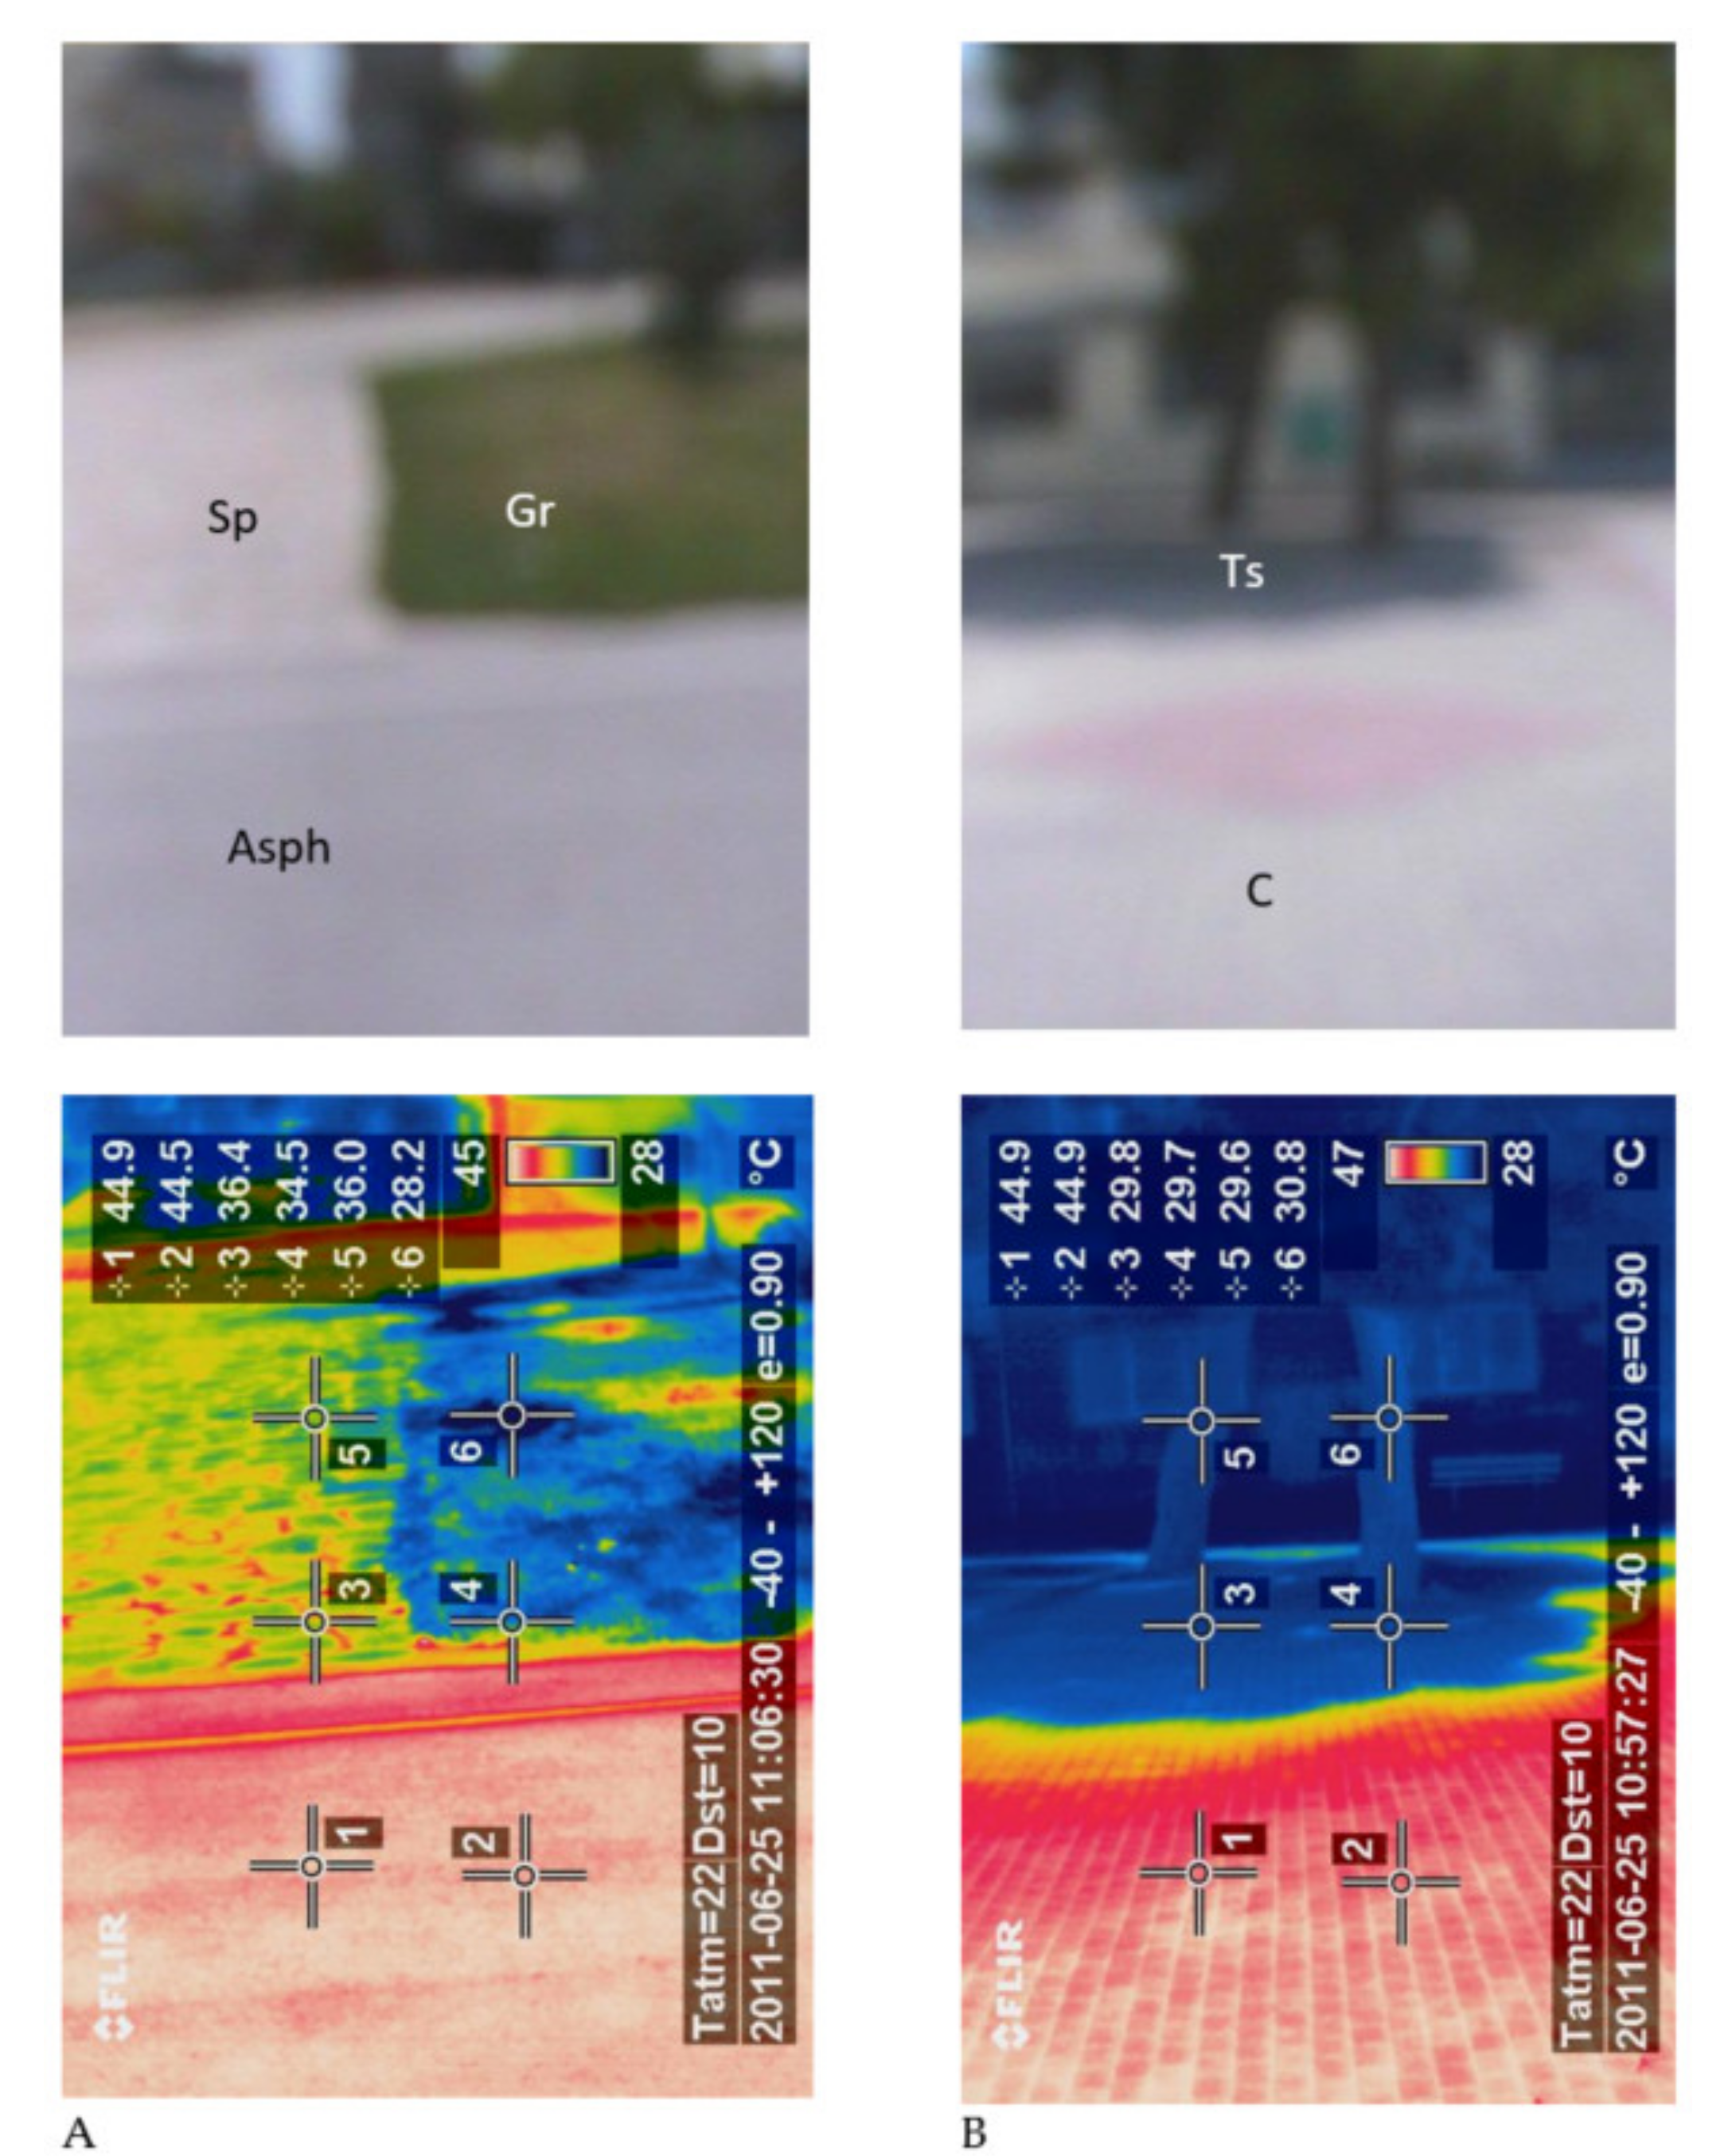
4. The Biophysical Environment of Urban Schoolyards

Urban schoolyards are public areas that are spatially distributed within a city. Although, one schoolyard occupies a relatively small area, the total area that all the schoolyards occupy in a city complex is significant [103]. Urban schoolyards are designed so as to serve several functions during a day, such as supporting children’s creative play, socialization, and supervision by the teachers, while keeping students healthy and safe is a key consideration [104].
The design and the built environment of urban schoolyards affect the local microclimate together with the heat perception and the heat load experienced by their users [6], mainly children and teachers. However, the environmental quality specifically focused on thermal comfort, air quality, or radiation exposure has received minor or no attention when defining design and safety standards [33].
In different countries, cities and climate zones around the world, the description of an urban schoolyard is the same: Urban schoolyards are hot [6,9,14,95,105], a fact that could be mainly attributed to the properties of the materials used to cover their surfaces (artificial materials with high heat capacities and/or heat conductivities, like asphalt, concrete, artificial turf, metal, rubber etc.) [13], the lack of shade [6,9,95] and the proximity to other hot areas [7]. Moogk-Soolis, who examined the surface temperatures of 15 schoolyards in Waterloo Ontario, Canada, [8] and of 275 schoolyards and 529 public spaces in South-central Canada [95], introduced the term “schoolyard heat island”, as surface temperatures in schoolyards were higher than in the surrounding streets. Indicatively, when air temperature was 27 °C, the average surface temperature of the unshaded area was 52.8 °C, being 20 °C hotter than that of the shaded area.
Schulman and Peters, [14] applied Geographic Information System software to classify and compare land cover on 75 schoolyards in Baltimore, Boston, and Detroit, USA. Schoolyards were mainly dominated by turf grass and impervious surfaces. Tree canopy occupied land cover in 13% of the schoolyards, 24% and 28% of the schoolyards had no fine, and no coarse vegetation, respectively, while 11% of schoolyards had no green space at all. Boston schoolyards were characterized by very high levels of impervious surface coverage and low levels of green space, and 30% of them had no tree cover, and more than 10% had no green space at all.
Antoniadis et al. [9], studied the thermal perception and heat stress conditions that prevailed in 2 schoolyards in Volos, a coastal city located in central Greece, under intense solar radiation and clear sky. The analysis was based on PET classes and revealed that the thermal conditions for the schoolyard’s users at the 85% and 15% of the measuring points were characterized as very hot and hot, respectively. Similar conclusion was drawn by a study conducted in Taiwan [10], where heat stress was high according to PET values (PET > 38 °C) between 10:00 and 16:00.
Another study conducted in a school located in El-Sherouk City, Egypt, revealed that the students felt high thermal discomfort in the courtyard during 11:00–12:00 (break time). In this school almost no plantation patterns existed, the courtyard was exposed to direct sunlight during the whole day, and shading was limited [105].
Finally, air temperature and PMV of 3 elementary school playground surface materials were investigated by field measurements and CFD simulation in Korea [106]. It was found that natural turf performed better than the artificial turf and the granite soil.
Summarizing in general the results of these studies, an urban schoolyard design scheme usually includes a great percent of areas with a sky-view factor greater than 0.70, a value that indicates an almost total absence of urban obstacles or structures [9]. Under these conditions, when hot weather and intense solar radiation prevails, PET values may be high, and are projected to be higher under climate change scenarios (e.g., RCP8.5/SRES A1FI scenario) [2]. Consequently, such a biophysical environment, considering also that heat extreme events can be amplified due to urban heat island and climate change effects, can induce dangerous and unsafe conditions for children [33]. Hence, more shade may increase physical activity as well as protect children from hot surfaces, thermal discomfort and UV radiation [13].

5. Effects of Vegetation on Thermal Environment

The benefits of vegetation (trees, shrubs, vines, and ground covers) in the urban environment are highlighted by numerous studies across different climatic zones [107,108,109,110,111,112,113,114,115,116,117,118,119,120,121,122,123,124,125,126,127,128,129,130] (Table 3). Vegetation, depending on the spaces and planting layout, modifies the microclimate at the micro and local scale [107,108,109], affecting the radiative budget [7,9,26,110,111], the aerodynamic properties [108,124], the heat and energy budget [109,112] and the moisture properties [113,114], reduce the surface’s temperature [7,9,12,115,124] and improve the human thermal comfort [9,114,115,116,118,119].
Urban trees have the ability to produce shade, coolness, shelter, moisture and air filtration [120]. Trees trigger a cooling effect during the warm seasons due to water loss through evapotranspiration and the increase of latent cooling, which is related to meteorological variables [117]. Evapotranspiration and shading effect are enhanced even on the small-scale level of one shade tree [26], while the shape and the area of plantation that faces the atmosphere plays an important role in modifying air humidity levels [105].
Trees, depending on species and age, have a significant effect on attenuating the outdoors radiative budget. During a sunny day from early spring to late autumn in warm, moderate and hot climates, trees play an important role in reducing the intensity of the incident solar radiation, a fact that changes Tmrt value and thus affecting the human thermal comfort in local scale. Microclimatic parameters under the shade of a dense tree or cluster of trees may have small differences, although the attenuation of incident solar radiation reduces human’s radiative budget and improves the human thermal comfort under the shade [118] (Figure 2).
Different tree species, at different ages, behave in diverse ways in outdoor spaces, because of their differences in shade pattern [110,115], different behaviour during the seasons [115], and variable effects depending on their presence in different urban configurations [119,129]. The geometric characteristics of trees, such as the height of the tree, the tree crown width and the trunk and branches structure, the size and the shape of the leaves together with the density and permeability of the crown, the increased solar reflectance, infrared emissivity and the reduced heat capacity compared to other materials, determine shading and can improve thermal comfort in a microclimate and can contribute to the reduction of surface temperatures [7,9,12,115,124].
The cooling potential of urban trees is also affected by the characteristics of the surrounding urban environment that include surface materials, geometry, height and density of buildings [24], traffic intensity, and street orientation. These properties make them flexible tools for environmental design [113,114,121] that can play a fundamental role in attenuating local ‘in-situ’, and adjacent thermo-physiological levels [115].

6. Integrated, Landscape and Architectural Strategies to Improve the Thermal Environment of Schoolyards

6.1. General

Although, researchers have considered thermal comfort issues when designing outdoor urban spaces since 2000 [131,132,133], climatic sensitive landscape design is not usually taken into account when planning and designing schoolyards. The management of environmental factors that affect thermal comfort have not been prioritized when designing playgrounds and schoolyards as other safety factors related to equipment and design standards (e.g., materials, structural integrity, surfacing, inspection, maintenance, etc.) [33].
Enhanced focus on bioclimatic design can substantially reduce heat stress potential in spaces that are more conducive to active play such as schoolyards, where children can thrive within safe thermal conditions for longer periods of time and gain the increased benefits from exercise even during the warm season [12]. Additionally, along with the provision of a thermally comfortable environment, other threats like the skin cancer, which has been associated with sunburn experienced in childhood [104] due to exposure to UV radiation [12], should be seriously taken into account when designing or re-designing schoolyards.
Mitigating strategies can be applied to improve the thermal environment and thermal comfort conditions in urban outdoor spaces [134], which can also be a useful tool when redesigning urban schoolyards. Considering the impact of local climate on principles of outdoor design [135] is regarded as a powerful tool when assessing the overall use (type, amount, intensity) of an outdoor space [6]. Improved computational models and availability of data resources and access will support this aspect [68,69,70,71,72,73]. Collaboration between urban climate modellers and biometeorologists will ensure that the input and output model variables and data sets are relevant to humans [59].
The most important component in a schoolyard design process, especially in its early stages, is the information related to thermal comfort [11]. Design scenarios should include the shading impact of the surrounding urban context and adjacent buildings on the schoolyard, the positioning of school buildings, the positioning of the outdoor areas and facilities according to the temporal and daily thermal comfort and the school needs, the creation of different types of thermal zones. This is based on sky view factors, the optimization of the use of surface materials and coverings, and together with different types of vegetation to optimize the spatial thermal performance of the schoolyard when children are present. An integrated school design approach, from a large to a small scale in the early design stages, coupling a verification experiment with a numerical simulation network using a school as study case in the summer of northern China has been proposed [11]. This integrated design method was found to reduce the outdoor discomfort time by 25% and the building cooling demand by 5%. Regarding the urban context and campus layout, they found that large open playground areas that are needed in schoolyards can be hardly entirely shaded during the hottest period of a day, due to the high solar altitude and their distance from surrounding shading buildings despite their heights, a fact that enhances thermal discomfort in the large open areas. In contrary, the spaces adjacent to buildings are more affected in terms of shading and wind pattern. Therefore, effective heat mitigation measures could be easier applied to a sport field with a higher degree of enclosure (e.g., in a schoolyard) than to an open, large-scale area (e.g., playground) [11]. Together with integrated school design scenarios, models such as the COMFA-kid model [48] can be exploited to estimate children’s thermal comfort in schoolyards and to assist landscape designers to understand thoroughly the effects of the thermal environment and general conception of how the environment on children’s health and to provide evidence-based design proposals.

6.2. Landscape Strategies to Improve Thermal Environment

In an existing schoolyard environment, landscape design options and tools can be exploited in order to mitigate heat effects and provide a comfortable thermal environment. These include an increase in vegetation, the use of shade, and the replacement of conventional paving materials with cool materials or vegetative surfaces. Architectural design issues that incorporate the use of vegetation, artificial shade etc. are presented in Section 6.3.

6.2.1. Increase of Greening

A variety of vegetation and planting solutions are available depending on the needs of a designer. The vegetation elements may be trees, shrubs, or grassland, with different characteristics, which can be planted on existing pavements, such as cement bricks, soil, or sand. The vegetation type may be evergreen or deciduous. The fact that resulting ability of trees produce shade, coolness, shelter, moisture and air filtration makes them flexible tools for environmental designers [108]. Therefore, vegetation and especially trees are factors that can significantly alter the microclimate of a schoolyard during daytime, when the vast majority of schools are open, contributing to the amelioration of unfavourable thermal conditions.
As trees modify the microclimate in different ways due to different features of each species and planting strategies, a first step towards facilitating decisions on various aspects of tree planting is to rank, categorize and fit the tree species into different criteria and systems [115], and incorporate them into toolkits developed for such purposes in the form of tree selection guides, e.g., [136].
This specific knowledge about trees shading and climate adaptation in urban areas is an important step in the development of urban design guidelines [115], as landscape designers could take decisions for different climate zones [122]. A second step includes designing trees’ planting positions based on the needs of the schoolyard and the desired final plant foliage volume, in order to improve the thermal environment. The clustering of trees may be in linear arrangement, in group arrangement, or random. Clusters of trees can multiply the cooling effect of one tree [129]. However, it is important the designer to be aware of certain rules on how tree formation can effectively shade a large area, especially for aligned clusters (e.g., the distance between trees needs to be relative to the diameter of the crown) [115]. A third step includes consideration of the orientation of planting. The optimal distribution of single trees or clusters to produce shading during the harshest conditions is the main driver for improving human thermal comfort [115]. The designer has to take into account the direction and the angle of the sun during the hot hours of the day, the area that is needed to be shaded, the time period when the area is needed to be shaded according to school time schedule, and the prevailing wind speed. Finally, besides thermal comfort, the ecological, economic, cultural, and aesthetic aspects of urban planning must be considered.
Therefore, strategic placement, density of planting, and tree species selection according to its characteristics, are of great importance [130]. Research on the evaluation of different arboreal species commonly found and tree-planning needs appropriate for current climate conditions and future climate projections considering the urbanization of cities is still needed [115]. Finally, the landscape designer has to take into account that urban trees face significant challenges that affect their health [137]. These include maintenance issues (personnel, technical infrastructure, budget), poor water availability, inadequate space for root systems and soil compaction due to extensive imperviousness [130]. Many countries have begun to incorporate the design or re-design of schoolyards into national shade guidelines [138,139,140] that include the use of physical shade and good practices applied in other countries that could be adapted to local climates [104].

6.2.2. Heat Stress Mitigation Measures Referring to Schoolyard Paving Materials

Asphalt is commonly used to cover schoolyard playgrounds like football and basketball fields, as it is a clean, tidy, economical and time lasting material. However, the use of asphalt is considered as the major factor that makes playgrounds to be hot. Materials with high heat capacities and/or thermal conductivities, like black rubber, concrete, asphalt, artificial turf, steel, and aluminum, can reach temperatures that exceed the thresholds that can cause burn injury to a child when exposed to direct sunlight [13]. The use of various shock-absorbing ground materials in playgrounds, like sand, wood chips, pea gravel, and rubber, is popular, as they reduce the risk of injury due to falling [141]. However, such surfaces usually reach the highest surface temperatures when exposed to the sun.
The properties of the materials control whether the surface heats up and cools down quickly or stores the heat, while shading affects the surface temperature and heat storage and emission (Figure 3). In schoolyard playgrounds, it is proposed to use surfaces characterized by high albedo coefficient, such as photocatalytic cool asphalt and cool pavement tiles. Materials with high solar reflectance and high infrared emissivity are characterized as ‘cool’. Materials characterized by high solar reflectance absorb less solar radiation compared to the conventional materials. This fact prevents the surface temperature to rise when high solar radiation flow is observed [142]. When material’s surface temperature is low, ambient air temperature is reduced, as heat convection intensity from a cooler surface is lower [143]. Materials characterized by high infrared emissivity enhance the release of long-wave radiation, resulting in dissipation of the stored heat. It is worth mentioning that the results of some studies indicate that the application of high-albedo strategies on dry surfaces may not improve the thermal comfort as expected, as the increase of reflected radiation contributes to the deterioration of thermal comfort conditions [27,144,145,146]. In these cases, energy partitioning into latent heat by using vegetation or water may be a more efficient solution to improve thermal comfort during daytime.
Another practice could be the replacement of hard schoolyard surfaces with soft materials or vegetated ground areas, while the spatial configuration of green areas can also affect the microclimate and thermal comfort. In general, vegetation’s cooling potential depends mainly on its ability to absorb significant amount of short-wave solar radiation and use the absorbed heat for evapotranspiration. In this way, the ground and its surrounding areas are kept relatively cool. Moistening the vegetated surface with water is crucial, as otherwise dry soil or even dry turf acts as impermeable material with surface temperatures getting overwhelming, surpassing the surface temperatures of asphalt [7]. Irrigation mainly increases latent heat though evapotranspiration and thus decreases the sensible heat flux [117]. However, the cooling of the surface may weaken turbulent mixing near the ground, blocking the deposition of air pollutants in the surface [147].
Antoniadis et al. [7] implemented a design plan for an urban schoolyard in Volos, Greece, proposing installation of shading canopies and replacement of hard surfaces with green cover. They applied the microclimate mode ENVI-met (V4) (Figure 4) and found that 69.9% of the schoolyard area was improved by two or three PET scale classes, and that the microclimate was improved in 82% of the total courtyard area. Tree canopies reduced the direct incident radiation, Tmrt and PET index, more than 90%, up to 31 °C, and up to 19 °C, respectively at the final development of the trees, during a clear sky sunny day. The redesign of the schoolyard was completed with the participation of students and the school community (Figure 5).
Huang et al. [148] renovated a playground by adding shading shelters and vegetation cover to reduce summertime heat stress. Data based on field observations, questionnaires, and measurements were collected under a variety of weather conditions over 4 years and on-site thermal environment was assessed by applying UTCI. Their experiment confirmed the relation between outdoor thermal environment and activities; the renovated playground attracted 80% more occupants in summer; people stayed longer, reported less heat stress, and interacted with each other more often.

6.3. Architectural Heat Stress Mitigation Strategies

Schoolyard microclimate can also be influenced by architectural stress heat mitigation strategies, such as innovative green technologies [149]. Green design interventions can be extended to the school building’s shell (e.g., green roofs on the top of the school building, green walls and green façades on school building’s vertical outer shell) and to schoolyards (e.g., shelf standing vegetated pergolas). Green architectural interventions on buildings affect mainly the indoor environment [150], as they can decrease the cooling energy demand of the school building. Their influence on the outdoor environment is quite limited. The building façade design has a measurable impact only on the spaces that are close to the buildings, and the roof interventions mainly modify the energy transfer on or above the roof level [11]. The growing conditions for plants used in these technologies are often extreme as plants can be exposed to strong winds, increased solar radiation, and quick loss of energy during the night, similar to desert conditions. Research and development in the field of green infrastructures for the building envelope are steadily progressing, providing evidence for aesthetic improvements, environmental, social and economic benefits [151,152,153,154]), educational and ecological benefits for children living in urban areas. Vegetated pergolas with climbing plants (e.g., Parthenocissus sp.) can be positioned as sitting places along large unshaded areas as cooling points. The use of deciduous plants will retain the benefits of winter solar gains to the users of the pergolas. Additionally, innovative techniques can be used to add greenery benefits in the environment of school buildings such as the hydroponic vegetated pergolas [152,155].
Artificial shade in the form of foldable meshes, shade sails or permanent pergolas, is also a very effective and flexible way to reduce Tmrt and surface temperature, without irrigation needs [13]. National shade guidelines [138,139,140] include detailed guidance regarding the addition of artificial shade in schoolyards.

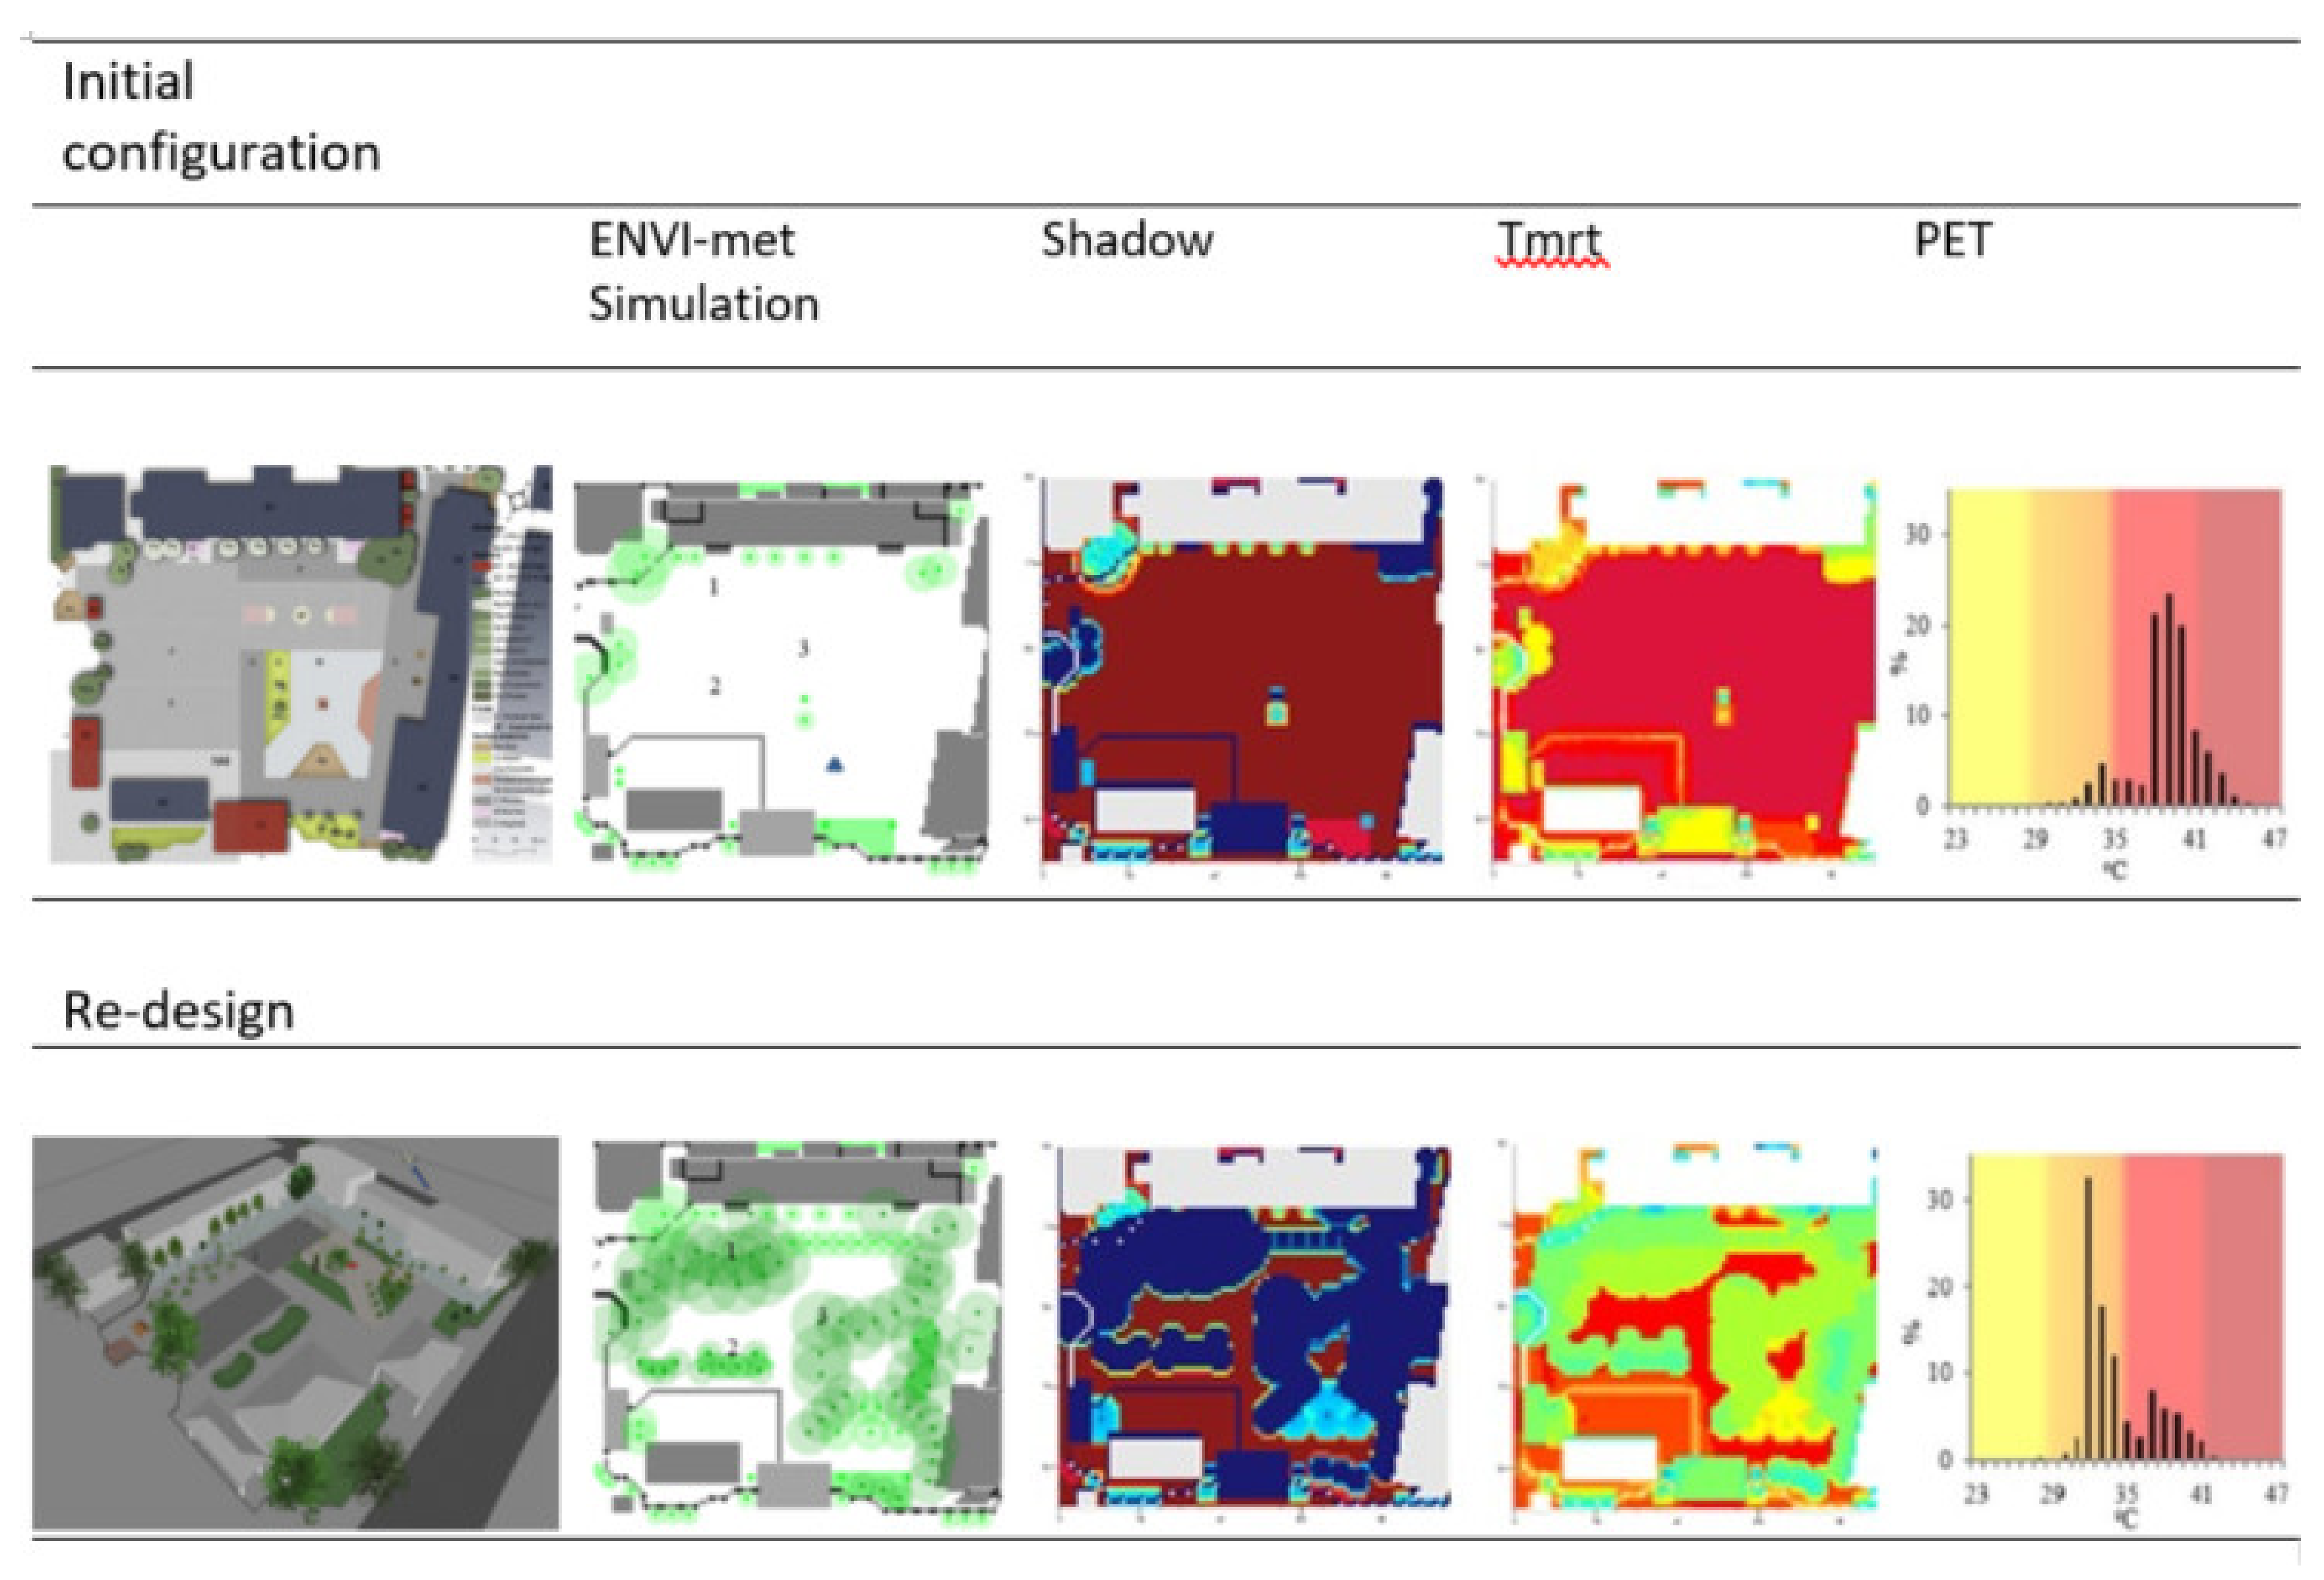
6.4. Greening a Schoolyard—Design Examples

Danks, [156], was one of the pioneers in schoolyard greening transformation, proposing the movement “Asphalt to ecosystems” for the design for schoolyard transformation. The Children and Nature Network, was a national movement in USA for green schoolyards in every community, while the Green Schoolyards Action Agenda in which participate nearly 100 organizations envision green schoolyards as multi-functional school grounds designed for, and by, the school community, that offer places for students, teachers, parents and community members to play, learn, explore, grow and have access to nature in schoolyards, gaining momentum around the world [157].
Greening schoolyards has been recently adopted by many planners as a method to cope with extreme heat, flooding, and other increasingly disruptive climate related events [103], and to implement a framework that incorporates nature-based solutions in urban planning [158].
Paris, Chicago and Amsterdam are cities that are currently implementing green schoolyard programs [102]. In the frame of Paris ”Oasis” project [159], the greening of a total of 700 schoolyards of 197 acres would increase the total green space of Paris by a fifth, affecting the thermal environment at a distance up to 200 m from a schoolyard. Paris aims to eventually implement a cooling programme for all schools, starting first with the gradual replacement of their ubiquitous asphalt with vegetation. Paris envisions schoolyards as cool refuges, welcoming people who are vulnerable to heat waves during extreme weather events. Paris also wants to design the schoolyards in a way to support urban agriculture in order to enhance resilience of the city’s food systems. Having extensive stakeholder engagement, the” Oasis” schoolyard greening has started in 2018 in 3 schools and is expected to end covering all schools by 2040.
The “Space to Grow: Greening Chicago Schoolyards” [160] program enables school authorities to use resources to transform not only schoolyards, but larger areas to support citizens’ access to recreation and park spaces. The program follows a participatory planning and design approach that is coordinated by 2 community-based teams, a planning team and a garden team. The program annually calls for 6 schools to get $1.5 million each to convert their concrete/asphalt surfaces into green schoolyards and engage the entire school community in the planning process. By 2019 a total of 34 green schoolyards have been treated.
In the Netherlands, a schoolyard is in the top three favorite playgrounds among children. The (re) design of school playgrounds in primary education offers children more opportunities for active and diverse play and to explore nature during and after school time in their neighborhood. During the period 2016–2019, the Education and Green and Sustainability departments of Amsterdam’s municipality provided a budget for the Amsterdam Impulse Schoolyards (AIS), of up to €70.000 per schoolyard. An important condition in applying for the subsidy was that schools were self-financed by 20%. The program was very successful and 85 schools participated, thus a time extension was planned for the period 2020–2024. It is expected that 60 more schoolyards will be greened. The aims and interventions of AIS include stimulating active play, adding 25% more green per schoolyard, contributing to the rainwater absorption programme, supporting outdoor educational activities, encouraging citizen participation and promoting sustainability. The schoolyard must be accessible to the public, even after school.
Green Schoolyards America Program seeks to transform asphalt-covered school grounds into park-like green spaces that improve children’s well-being, learning, and play, while contributing to the ecological health and resilience of the cities, working to change the norm for school ground design, use, and management so that all children will have access to the natural world in the places they already visit on a daily basis [161].

7. Concluding Remarks

Heat and its implications for human health and well-being have been a dominant topic of biometeorological studies. Children are considered as a vulnerable group affected by the thermal environment. Children consider the schoolyard as a space for recreation, play, relaxation, and communication with classmates, spending there much time during a day. This paper presented a review of the studies conducted worldwide since 2001 that examined the impacts of schoolyards’ design on the human thermal comfort. It also discussed measures that could be applied to improve the thermal environment of schoolyards, focusing on vegetation.
The literature survey showed that schoolyards in urban areas are usually made of asphalt and other paved materials, and are characterized by the absence of trees. Therefore, the unobstructed incident solar radiation with its thermal load is directed towards and absorbed or absorbed and accumulated to the dense surface materials leading to high surface temperatures; and then reemitted upwards again absorbed by the users of the schoolyard, mainly the children, creating conditions of thermal discomfort.
The individual’s personal information about metabolism, age, gender, clothing, position and physical variables, are considered as factors that affect human thermal comfort, creating conditions of thermal discomfort through heat stress. These factors are used when applying energy balance models and thermal indices to monitor human thermal comfort. One of the limitations is that human thermal comfort monitoring tools are mainly developed for adults, thus there is a knowledge gap in the literature in the field of monitoring children’s thermal perception outdoors. As specific physiological differences can be identified for children compared to adults that refer to convective, evaporation and radiative heat exchanges, potentially inaccuracies may introduce when applying these tools for children, thus further research is needed to adapt them to children.
The effects of vegetation on schoolyard’s microclimate is important, as it affects positively the thermal environment, heat perception and human thermal comfort. Vegetation plays a major influence on radiative fluxes. Shade elements reduce or block the incident radiation that is absorbed by humans, while surface vegetative elements reduce the emitted heat compared to hard material. Additionally, vegetation triggers cooling due to evapotranspiration, by which radiant energy driving the surface energy balance is converted into latent, as opposed to sensible heat.
Design options for schoolyards were proposed that have mainly focused on vegetation, in order to minimize negative health impacts and provide a thermally comfortable environment. These include tree and ground vegetation planting, green interventions to buildings including artificial shade and replacement of conventional paving materials with cool materials.
One of the critical aspects derived from reviewing the results of biometeorological studies is that, until recent years, not much or no attention was placed on the design of schoolyards focusing on the thermal environment and its influence on children’s health, behavior and physiology. Although, greening schoolyards has been recently gained momentum around the world and adopted by many urban planners as a method to cope with extreme heat stress, flooding, and other increasingly disruptive climate related events, while in the school level offer students the benefits to access nature and to improve their thermal and aesthetic environment.

Author Contributions

Writing—original draft preparation, D.A.; writing—review and editing, N.K., D.Κ.P.; supervision, N.K.; All authors have read and agreed to the published version of the manuscript.

Funding

This research received no external funding.

Conflicts of Interest

The authors declare no conflict of interest.

References

  1. United Nations Department of Economic and Social Affairs. Population Division World Urbanization Prospects 2018: Highlights (ST/ESA/SER.A/421); United Nations Department of Economic and Social Affairs: New York, NY, USA, 2019. [Google Scholar]
  2. Santos Nouri, A.; Charalampopoulos, I.; Matzarakis, A. Beyond singular climatic variables—Identifying the dynamics of wholesome thermo-physiological factors for existing/future human thermal comfort during hot dry mediterranean summers. Int. J. Environ. Res. Public Health 2018, 15, 23–62. [Google Scholar]
  3. Rowell, L.B. Human cardiovascular adjustments to exercise and thermal stress. Physiol. Rev. 1974, 54, 75–159. [Google Scholar]
  4. Laschewski, G.; Jendritzky, G. Effects of the thermal environment on human health: An investigation of 30 years of daily mortality data from SW Germany. Clim. Res. 2002, 21, 91–103. [Google Scholar]
  5. Morabito, M.; Crisci, A.; Messeri, A.; Capecchi, V.; Modesti, P.A.; Gensini, G.F.; Orlandini, S. Environmental temperature and thermal indices: What is the most effective predictor of heat-related mortality in different geographical contexts? Sci. World J. 2014, 2014, 1–15. [Google Scholar]
  6. Vanos, J.K. Children’s health and vulnerability in outdoor microclimates: A comprehensive review. Environ. Int. 2015, 76, 1–15. [Google Scholar]
  7. Antoniadis, D.; Katsoulas, N.; Kittas, C. Simulation of schoolyard’s microclimate and human thermal comfort under Mediterranean climate conditions: Effects of trees and green structures. Int. J. Biometeorol. 2018, 62, 2025–2036. [Google Scholar]
  8. Moogk-Soulis, C. Schoolyard heat islands: A case study in Waterloo, Ontario. In Proceedings of the 5th Canadian Urban Forestry Conference, York, ON, Canada, 7–9 October 2002; pp. 24–27. [Google Scholar]
  9. Antoniadis, D.; Katsoulas, N.; Papanastasiou, D.; Christidou, V.; Kittas, C. Evaluation of thermal perception in schoolyards under Mediterranean climate conditions. Int. J. Biometeorol. 2016, 60, 319–334. [Google Scholar]
  10. Shih, W.-M.; Lin, T.-P.; Tan, N.-X.; Liu, M.-H. Long-term perceptions of outdoor thermal environments in an elementary school in a hot-humid climate. Int. J. Biometeorol. 2017, 61, 1657–1666. [Google Scholar]
  11. Zhang, A.; Bokel, R.; van den Dobbelsteen, A.; Sun, Y.; Huang, Q.; Zhang, Q. An integrated school and schoolyard design method for summer thermal comfort and energy efficiency in Northern China. Build. Environ. 2017, 124, 369–387. [Google Scholar]
  12. Vanos, J.K.; McKercher, G.R.; Naughton, K.; Lochbaum, M. Schoolyard shade and sun exposure: Assessment of personal monitoring during children’s physical activity. Photochem. Photobiol. 2017, 93, 1123–1132. [Google Scholar]
  13. Vanos, J.K.; Middel, A.; McKercher, G.R.; Kuras, E.R.; Ruddell, B.L. Hot playgrounds and children’s health: A multiscale analysis of surface temperatures in Arizona, USA. Landsc. Urban Plan. 2016, 146, 29–42. [Google Scholar]
  14. Schulman, A.; Peters, C.A. GIS analysis of urban schoolyard landcover in three US cities. Urban Ecosyst. 2008, 11, 65–80. [Google Scholar]
  15. Jendritzky, G.; de Dear, R.; Havenith, G. UTCI—Why another thermal index? Int. J. Biometeorol. 2012, 56, 421–428. [Google Scholar]
  16. Taleghani, M. Outdoor thermal comfort by different heat mitigation strategies—A review. Renew. Sustain. Energy Rev. 2018, 81, 2011–2018. [Google Scholar]
  17. Fanger, O. Thermal Comfort; McGraw-Hill Book Company: New York, NY, USA, 1972. [Google Scholar]
  18. Parsons, K. Human Thermal Environments: The Effects of Hot, Moderate, and Cold Environments on Human Health, Comfort, and Performance; CRC Press: Boca Raton, FL, USA, 2014. [Google Scholar]
  19. Vanos, J.K.; Warland, J.S.; Gillespie, T.J.; Kenny, N.A. Review of the physiology of human thermal comfort while exercising in urban landscapes and implications for bioclimatic design. Int. J. Biometeorol. 2010, 54, 319–334. [Google Scholar]
  20. Höppe, P.R. Heat balance modelling. Experientia 1993, 49, 741–746. [Google Scholar]
  21. Höppe, P. The physiological equivalent temperature–a universal index for the biometeorological assessment of the thermal environment. Int. J. Biometeorol. 1999, 43, 71–75. [Google Scholar]
  22. Ashrae, A. Standard 55-2004 Thermal Environmental Conditions for Human Occupancy; American Society of Heating, Refrigerating and Air-Conditioning Engineers, Inc.: Atlanta, GA, USA, 2004. [Google Scholar]
  23. Krüger, E.L.; Rossi, F.A. Effect of personal and microclimatic variables on observed thermal sensation from a field study in southern Brazil. Build. Environ. 2011, 46, 690–697. [Google Scholar]
  24. Shashua-Bar, L.; Pearlmutter, D.; Erell, E. The influence of trees and grass on outdoor thermal comfort in a hot-arid environment. Int. J. Climatol. 2011, 31, 1498–1506. [Google Scholar]
  25. Brotherhood, J.R. Heat stress and strain in exercise and sport. J. Sci. Med. Sport 2008, 11, 6–19. [Google Scholar]
  26. Takács, Á.; Kiss, M.; Hof, A.; Tanács, E.; Gulyás, Á.; Kántor, N. Microclimate modification by urban shade trees–an integrated approach to aid ecosystem service based decision-making. Procedia Environ. Sci. 2016, 32, 97–109. [Google Scholar]
  27. Hardin, A.; Vanos, J. The influence of surface type on the absorbed radiation by a human under hot, dry conditions. Int. J. Biometeorol. 2018, 62, 43–56. [Google Scholar]
  28. Li, H.; Wolter, M.; Wang, X.; Sodoudi, S. Impact of land cover data on the simulation of urban heat island for Berlin using WRF coupled with bulk approach of Noah-LSM. Theor. Appl. Climatol. 2018, 134, 67–81. [Google Scholar]
  29. Li, H.; Zhou, Y.; Wang, X.; Zhou, X.; Zhang, H.; Sodoudi, S. Quantifying urban heat island intensity and its physical mechanism using WRF/UCM. Sci. Total Environ. 2019, 650, 3110–3119. [Google Scholar]
  30. ASHRAE, A. Standard 55-2010: Thermal Environment Conditions for Human Occupancy; American Society of Heating, Ventilating and Air-Conditioning Engineers Inc.: Atlanta, GA, USA, 2012. [Google Scholar]
  31. Potchter, O.; Cohen, P.; Lin, T.-P.; Matzarakis, A. Outdoor human thermal perception in various climates: A comprehensive review of approaches, methods and quantification. Sci. Total Environ. 2018, 631, 390–406. [Google Scholar]
  32. Johansson, E.; Thorsson, S.; Emmanuel, R.; Krüger, E. Instruments and methods in outdoor thermal comfort studies–The need for standardization. Urban Clim. 2014, 10, 346–366. [Google Scholar]
  33. Kennedy, E.O.H.; Vanos, J. Thermally Comfortable Playgrounds: A review of literature and survey of experts. In Standards Council of Canada—National Program for Playground Safety; Technical Report—Project Number 2019-64; University of Northern Iowa: Cedar Falls, IA, USA, 2019. [Google Scholar]
  34. Charalampopoulos, I.; Santos Nouri, A. Investigating the behaviour of human thermal indices under divergent atmospheric conditions: A sensitivity analysis approach. Atmosphere 2019, 10, 580. [Google Scholar]
  35. Coccolo, S.; Kämpf, J.; Scartezzini, J.-L.; Pearlmutter, D. Outdoor human comfort and thermal stress: A comprehensive review on models and standards. Urban Clim. 2016, 18, 33–57. [Google Scholar]
  36. Jendritzky, G.; Nübler, W. A model analysing the urban thermal environment in physiologically significant terms. Arch. Meteorol. Geophys. Bioclimatol. Ser. B 1981, 29, 313–326. [Google Scholar]
  37. Staiger, H.; Laschewski, G.; Grätz, A. The perceived temperature—A versatile index for the assessment of the human thermal environment. Part A: Scientific basics. Int. J. Biometeorol. 2012, 56, 165–176. [Google Scholar]
  38. Steadman, R.G. A universal scale of apparent temperature. J. Clim. Appl. Meteorol. 1984, 23, 1674–1687. [Google Scholar]
  39. Błażejczyk, K. New climatological and physiological model of the Human Heat Balance outdoor (MENEX) and its applications in bioclimatological studies in different scales. Zesz. Inst. Geogr. I Przestrz. Zagospod. Pan 1994, 28, 27–58. [Google Scholar]
  40. Blazejczyk, K. MENEX_2005-the updated version of man-environment heat exchange model. Available online: http://www.igipz.pan.pl/tl_files/igipz/ZGiK/opracowania/indywidualne/blazejczyk/MENEX_2005.pdf (accessed on 12 October 2020).
  41. Fiala, D.; Havenith, G.; Bröde, P.; Kampmann, B.; Jendritzky, G. UTCI-Fiala multi-node model of human heat transfer and temperature regulation. Int. J. Biometeorol. 2012, 56, 429–441. [Google Scholar]
  42. Havenith, G.; Fiala, D.; Błazejczyk, K.; Richards, M.; Bröde, P.; Holmér, I.; Rintamaki, H.; Benshabat, Y.; Jendritzky, G. The UTCI-clothing model. Int. J. Biometeorol. 2012, 56, 461–470. [Google Scholar]
  43. Brown, R.; Gillespie, T. Estimating outdoor thermal comfort using a cylindrical radiation thermometer and an energy budget model. Int. J. Biometeorol. 1986, 30, 43–52. [Google Scholar]
  44. Kenny, N.A.; Warland, J.S.; Brown, R.D.; Gillespie, T.G. Part A: Assessing the performance of the COMFA outdoor thermal comfort model on subjects performing physical activity. Int. J. Biometeorol. 2009, 53, 415. [Google Scholar]
  45. Kenny, N.A.; Warland, J.S.; Brown, R.D.; Gillespie, T.G. Part B: Revisions to the COMFA outdoor thermal comfort model for application to subjects performing physical activity. Int. J. Biometeorol. 2009, 53, 429. [Google Scholar]
  46. Vanos, J.K.; Warland, J.S.; Gillespie, T.J.; Kenny, N.A. Thermal comfort modelling of body temperature and psychological variations of a human exercising in an outdoor environment. Int. J. Biometeorol. 2012, 56, 21–32. [Google Scholar]
  47. Höppe, P. Different aspects of assessing indoor and outdoor thermal comfort. Energy Build. 2002, 34, 661–665. [Google Scholar]
  48. Cheng, W.; Brown, R.D. An energy budget model for estimating the thermal comfort of children. Int. J. Biometeorol. 2020, 64, 1355–1366. [Google Scholar]
  49. Kántor, N.; Unger, J.; Gulyás, Á. Subjective estimations of thermal environment in recreational urban spaces—Part 2: International comparison. Int. J. Biometeorol. 2012, 56, 1089–1101. [Google Scholar]
  50. de Freitas, C.R.; Grigorieva, E.A. A comprehensive catalogue and classification of human thermal climate indices. Int. J. Biometeorol. 2015, 59, 109–120. [Google Scholar]
  51. de Freitas, C.R.; Grigorieva, E.A. A comparison and appraisal of a comprehensive range of human thermal climate indices. Int. J. Biometeorol. 2017, 61, 487–512. [Google Scholar]
  52. Gagge, A.P.; Fobelets, A.; Berglund, L. A standard predictive Index of human reponse to thermal enviroment. Trans. Am. Soc. Heat. Refrig. Air Cond. Eng. 1986, 92, 709–731. [Google Scholar]
  53. Mayer, H.; Höppe, P. Thermal comfort of man in different urban environments. Theor. Appl. Climatol. 1987, 38, 43–49. [Google Scholar]
  54. Kyle, W. The human bioclimate of Hong Kong. In Proceedings of the Contemporary Climatology Conference, Masaryk University, Brno, The Czech Republic, 15–20 August 1994; pp. 345–350. [Google Scholar]
  55. Staiger, H.; Bucher, K.; Jendritzky, G. Gefühlte Temperatur. Die physiologisch gerechte Bewertung von Wärmebelastung und Kältestress beim Aufenthalt im Freien in der Maßzahl Grad Celsius. Ann. Der Meteorol. 1997, 33, 100–107. [Google Scholar]
  56. Gonzalez, R.; Nishi, Y.; Gagge, A. Experimental evaluation of standard effective temperature a new biometeorological index of man’s thermal discomfort. Int. J. Biometeorol. 1974, 18, 1–15. [Google Scholar]
  57. Pickup, J.; de Dear, R. An outdoor thermal comfort index (OUT_SET*)-part I-the model and its assumptions. In Proceedings of the 5th International Congress of Biometeorology and International Conference on Urban Climatolog, Macquarie University, Sydney, Australia, 8–12 November 1999; pp. 279–283. [Google Scholar]
  58. Jendritzky, G.; Havenith, G.; Weihs, P.; Batchvarova, E. Towards a Universal Thermal Climate Index UTCI for assessing the thermal environment of the human being. Final Rep. Cost Action 2009, 730, 1–26. [Google Scholar]
  59. Hondula, D.M.; Balling, R.C.; Andrade, R.; Krayenhoff, E.S.; Middel, A.; Urban, A.; Georgescu, M.; Sailor, D.J. Biometeorology for cities. Int. J. Biometeorol. 2017, 61, 59–69. [Google Scholar]
  60. Matzarakis, A.; Mayer, H.; Iziomon, M.G. Applications of a universal thermal index: Physiological equivalent temperature. Int. J. Biometeorol. 1999, 43, 76–84. [Google Scholar]
  61. Thorsson, S.; Lindberg, F.; Eliasson, I.; Holmer, B. Different methods for estimating the mean radiant temperature in an outdoor urban setting. Int. J. Climatol. A J. R. Meteorol. Soc. 2007, 27, 1983–1993. [Google Scholar]
  62. Lin, T.-P.; Matzarakis, A.; Hwang, R.-L. Shading effect on long-term outdoor thermal comfort. Build. Environ. 2010, 45, 213–221. [Google Scholar]
  63. Cohen, P.; Potchter, O.; Matzarakis, A. Human thermal perception of Coastal Mediterranean outdoor urban environments. Appl. Geogr. 2013, 37, 1–10. [Google Scholar]
  64. Chen, Y.-C.; Matzarakis, A. Modification of physiologically equivalent temperature. J. Heat Isl. Inst. Int. 2014, 9, 26–32. [Google Scholar]
  65. Charalampopoulos, I.; Tsiros, I.; Chronopoulou-Sereli, A.; Matzarakis, A. A methodology for the evaluation of the human-bioclimatic performance of open spaces. Theor. Appl. Climatol. 2017, 128, 811–820. [Google Scholar]
  66. Błażejczyk, K.; Broede, P.; Fiala, D.; Havenith, G.; Holmér, I.; Jendritzky, G.; Kampmann, B.; Kunert, A. Principles of the new Universal Thermal Climate Index (UTCI) and its application to bioclimatic research in European scale. Misc. Geogr. 2010, 14, 91–102. [Google Scholar]
  67. Blazejczyk, K.; Epstein, Y.; Jendritzky, G.; Staiger, H.; Tinz, B. Comparison of UTCI to selected thermal indices. Int. J. Biometeorol. 2012, 56, 515–535. [Google Scholar]
  68. Bruse, M. Using ENVI-Met Met BioMet. 2014. Available online: https://envi-met.info/public/files/docs/Quickstart_biomet.pdf (accessed on 19 October 2020).
  69. Matzarakis, A.; Rutz, F.; Mayer, H. Modelling radiation fluxes in simple and complex environments—Application of the RayMan model. Int. J. Biometeorol. 2007, 51, 323–334. [Google Scholar]
  70. Matzarakis, A. Linking urban micro scale models-The models RayMan and SkyHelios. Proceedings of ICUC8–8th International Conference on Urban Climates, UCD, Dublin, Ireland, 6–10 August 2012. [Google Scholar]
  71. Lindberg, F.; Holmer, B.; Thorsson, S.S. SOLWEIG1D. User Man. Version. 2015. Available online: https://www.gu.se/geovetenskaper/digitalAssets/1536/1536039_solweig1d-user-manual.pdf (accessed on 19 October 2020).
  72. Lindberg, F.; Grimmond, C.S.B.; Gabey, A.; Huang, B.; Kent, C.W.; Sun, T.; Theeuwes, N.E.; Järvi, L.; Ward, H.C.; Capel-Timms, I. Urban Multi-scale Environmental Predictor (UMEP): An integrated tool for city-based climate services. Environ. Model. Softw. 2018, 99, 70–87. [Google Scholar]
  73. Ansys Fluent. Available online: https://www.ansys.com/products/fluids/ansys-fluent (accessed on 12 October 2020).
  74. Bruse, M.; Fleer, H. Simulating surface–plant–air interactions inside urban environments with a three dimensional numerical model. Environ. Model. Softw. 1998, 13, 373–384. [Google Scholar]
  75. Huttner, S. Further Development and Application of the 3D Microclimate Simulation ENVI-Met. Ph.D. Thesis, University of Mainz, Mainz, Germany, 2012. [Google Scholar]
  76. Balbus, J.M.; Malina, C. Identifying vulnerable subpopulations for climate change health effects in the United States. J. Occup. Environ. Med. 2009, 51, 33–37. [Google Scholar]
  77. Fanger, P.O. Thermal comfort. In Analysis and Applications in Environmental Engineering; Technical University of Denmark, Laboratory of Heating and Air Conditioning, Danish Technical Press: Copenhagen, Denmark, 1970. [Google Scholar]
  78. Falk, B.; Bar-Or, O.; Calvert, R.; MacDougall, J.D. Sweat gland response to exercise in the heat among pre-, mid-, and late-pubertal boys. Med. Sci. Sports Exerc. 1992, 24, 313. [Google Scholar]
  79. Wenger, C.B. The regulation of body temperature. In Medical Physiology, 2nd ed.; Rhoades, R., Tanner, G., Eds.; Little Brown & Co.: Boston, MA, USA, 2003; pp. 527–550. [Google Scholar]
  80. Havenith, G. Metabolic rate and clothing insulation data of children and adolescents during various school activities. Ergonomics 2007, 50, 1689–1701. [Google Scholar]
  81. Stevens, C.; Kenneth, K.; Choo, J. Temperature sensitivity of the body surface over the life span. Somatosens. Mot. Res. 1998, 15, 13–28. [Google Scholar]
  82. Schellen, L.; van Marken Lichtenbelt, W.D.; Loomans, M.G.; Toftum, J.; De Wit, M.H. Differences between young adults and elderly in thermal comfort, productivity, and thermal physiology in response to a moderate temperature drift and a steady-state condition. Indoor Air 2010, 20, 273–283. [Google Scholar]
  83. Falk, B.; Dotan, R. Children’s thermoregulation during exercise in the heat—A revisit. Appl. Physiol. Nutr. Metab. 2008, 33, 420–427. [Google Scholar]
  84. Morrison, S.A.; Sims, S.T. Thermoregulation in children: Exercise, heat stress & fluid balance. Ann. Kinesiol. 2014, 5, 41–54. [Google Scholar]
  85. Tsuzuki-Hayakawa, K.; Tochihara, Y.; Ohnaka, T. Thermoregulation during heat exposure of young children compared to their mothers. Eur. J. Appl. Physiol. Occup. Physiol. 1995, 72, 12–17. [Google Scholar]
  86. Inbar, O.; Morris, N.; Epstein, Y.; Gass, G. Comparison of thermoregulatory responses to exercise in dry heat among prepubertal boys, young adults and older males. Exp. Physiol. 2004, 89, 691–700. [Google Scholar]
  87. Inoue, Y.; Kuwahara, T.; Araki, T. Maturation-and aging-related changes in heat loss effector function. J. Physiol. Anthropol. Appl. Hum. Sci. 2004, 23, 289–294. [Google Scholar]
  88. Leites, G.T.; Cunha, G.S.; Obeid, J.; Wilk, B.; Meyer, F.; Timmons, B.W. Thermoregulation in boys and men exercising at the same heat production per unit body mass. Eur. J. Appl. Physiol. 2016, 116, 1411–1419. [Google Scholar]
  89. Teli, D.; Jentsch, M.F.; James, P.A. Naturally ventilated classrooms: An assessment of existing comfort models for predicting the thermal sensation and preference of primary school children. Energy Build. 2012, 53, 166–182. [Google Scholar]
  90. Yun, H.; Nam, I.; Kim, J.; Yang, J.; Lee, K.; Sohn, J. A field study of thermal comfort for kindergarten children in Korea: An assessment of existing models and preferences of children. Build. Environ. 2014, 75, 182–189. [Google Scholar]
  91. Naughton, G.; Carlson, J.S. Reducing the risk of heat-related decrements to physical activity in young people. J. Sci. Med. Sport 2008, 11, 58–65. [Google Scholar]
  92. Inoue, Y.; Araki, T.; Tsujita, J. Thermoregulatory responses of prepubertal boys and young men in changing temperature linearly from 28 to 15 C. Eur. J. Appl. Physiol. Occup. Physiol. 1996, 72, 204–208. [Google Scholar]
  93. Falk, B. Effects of thermal stress during rest and exercise in the paediatric population. Sports Med. 1998, 25, 221–240. [Google Scholar]
  94. Bytomski, J.R.; Squire, D.L. Heat illness in children. Curr. Sports Med. Rep. 2003, 2, 320–324. [Google Scholar]
  95. Moogk-Soulis, C. Schoolyard heat islands: A case in Waterloo, Ontario. In Proceedings of the 5th Canadian Urban Forest Conference, Windsor, Sarnia, ON, Canada, 5–6 October 2010; pp. 24–27. [Google Scholar]
  96. Armstrong, L.E.; Casa, D.J.; Millard-Stafford, M.; Moran, D.S.; Pyne, S.W.; Roberts, W.O.; American College of Sports Medicine. American College of Sports Medicine position stand. Exertional heat illness during training and competition. Med. Sci. Sports Exerc. 2007, 39, 556. [Google Scholar]
  97. Vanos, J.; Fahy, K.; Tu, C.; Demolder, C.; Coleman, T. Impacts of Design on Children’s Personal Heat and Radiation Exposures during Outdoor Activity: A Case Study in San Diego, California. In Proceedings of the 10th International Conference on Urban Climate/14th Symposium on the Urban Environment, New York, NY, USA, 6–10 August 2018. [Google Scholar]
  98. Epstein, Y.; Moran, D.S. Thermal comfort and the heat stress indices. Ind. Health 2006, 44, 388–398. [Google Scholar]
  99. Sheffield, P.E.; Landrigan, P.J. Global climate change and children’s health: Threats and strategies for prevention. Environ. Health Perspect. 2011, 119, 291–298. [Google Scholar]
  100. Vanos, J.K.; Herdt, A.J.; Lochbaum, M.R. Effects of physical activity and shade on the heat balance and thermal perceptions of children in a playground microclimate. Build. Environ. 2017, 126, 119–131. [Google Scholar]
  101. Lai, D.; Guo, D.; Hou, Y.; Lin, C.; Chen, Q. Studies of outdoor thermal comfort in northern China. Build. Environ. 2014, 77, 110–118. [Google Scholar]
  102. Yang, B.; Olofsson, T.; Nair, G.; Kabanshi, A. Outdoor thermal comfort under subarctic climate of north Sweden—A pilot study in Umeå. Sustain. Cities Soc. 2017, 28, 387–397. [Google Scholar]
  103. Flax, L.; Altes, R.K.; Kupers, R.; Mons, B. Greening schoolyards—An urban resilience perspective. Cities 2020, 106, 1028–1090. [Google Scholar]
  104. Brown, R.D.; Corry, R.C. Evidence-Based Landscape Architecture for Human Health and Well-Being. Sustainability 2020, 12, 1360. [Google Scholar]
  105. El-Bardisy, W.M.; Fahmy, M.; El-Gohary, G.F. Climatic sensitive landscape design: Towards a better microclimate through plantation in public schools, Cairo, Egypt. Procedia Soc. Behav. Sci. 2016, 216, 206–216. [Google Scholar]
  106. Lim, J.-B.; Yu, J.; Lee, J.-Y.; Lee, K.-S. Comparison of thermal effects of different school ground surface materials-A case of Yooljeon elementary school. J. Korean Assoc. Geogr. Inf. Stud. 2015, 18, 28–44. [Google Scholar]
  107. Dimoudi, A.; Nikolopoulou, M. Vegetation in the urban environment: Microclimatic analysis and benefits. Energy Build. 2003, 35, 69–76. [Google Scholar]
  108. Oke, T.R. The micrometeorology of the urban forest. Philos. Trans. R. Soc. Lond. B Biol. Sci. 1989, 324, 335–349. [Google Scholar]
  109. Shashua-Bar, L.; Potchter, O.; Bitan, A.; Boltansky, D.; Yaakov, Y. Microclimate modelling of street tree species effects within the varied urban morphology in the Mediterranean city of Tel Aviv, Israel. Int. J. Climatol. A J. R. Meteorol. Soc. 2010, 30, 44–57. [Google Scholar]
  110. Brown, R.; Gillespie, T. Estimating radiation received by a person under different species of shade trees. J. Arboric. 1990, 16, 158–161. [Google Scholar]
  111. Georgi, N.J.; Zafiriadis, K. The impact of park trees on microclimate in urban areas. Urban Ecosyst. 2006, 9, 195–209. [Google Scholar]
  112. Santamouris, M. Energy and Climate in the Urban Built Environment; Routledge: Abingdon, UK, 2013. [Google Scholar]
  113. Shashua-Bar, L.; Hoffman, M.E. Vegetation as a climatic component in the design of an urban street: An empirical model for predicting the cooling effect of urban green areas with trees. Energy Build. 2000, 31, 221–235. [Google Scholar]
  114. Shashua-Bar, L.; Tsiros, I.X.; Hoffman, M. Passive cooling design options to ameliorate thermal comfort in urban streets of a Mediterranean climate (Athens) under hot summer conditions. Build. Environ. 2012, 57, 110–119. [Google Scholar]
  115. De Abreu-Harbich, L.V.; Labaki, L.C.; Matzarakis, A. Effect of tree planting design and tree species on human thermal comfort in the tropics. Landsc. Urban Plan. 2015, 138, 99–109. [Google Scholar]
  116. Gulyás, Á.; Unger, J.; Matzarakis, A. Assessment of the microclimatic and human comfort conditions in a complex urban environment: Modelling and measurements. Build. Environ. 2006, 41, 1713–1722. [Google Scholar]
  117. Li, H.; Wang, A.; Yuan, F.; Guan, D.; Jin, C.; Wu, J.; Zhao, T. Evapotranspiration dynamics over a temperate meadow ecosystem in eastern Inner Mongolia, China. Environ. Earth Sci. 2016, 75, 978. [Google Scholar]
  118. Antoniadis, D. Investigation of the Effect of Vegetation and Green Infrastructures on Outdoor Bioclimatology: The Case Study of the Environment of Urban School Buildings. Ph.D. Thesis, Univestity Thessaly, Volos, Greece, 2018. [Google Scholar]
  119. Santos Nouri, A.; Fröhlich, D.; Matos Silva, M.; Matzarakis, A. The impact of Tipuana tipu species on local human thermal comfort thresholds in different urban canyon cases in Mediterranean climates: Lisbon, Portugal. Atmosphere 2018, 9, 12. [Google Scholar]
  120. Lin, B.-S.; Lin, Y.-J. Cooling effect of shade trees with different characteristics in a subtropical urban park. HortScience 2010, 45, 83–86. [Google Scholar]
  121. Brown, R.D.; Gillespie, T.J. Microclimatic Landscape Design: Creating Thermal Comfort and Energy Efficiency; Wiley: New York, NY, USA, 1995; Volume 1. [Google Scholar]
  122. Moser, A.; Rötzer, T.; Pauleit, S.; Pretzsch, H. Structure and ecosystem services of small-leaved lime (Tilia cordata Mill.) and black locust (Robinia pseudoacacia L.) in urban environments. Urban For. Urban Green. 2015, 14, 1110–1121. [Google Scholar]
  123. Fahmy, M.; Sharples, S.; Yahiya, M. LAI based trees selection for mid latitude urban developments: A microclimatic study in Cairo, Egypt. Build. Environ. 2010, 45, 345–357. [Google Scholar]
  124. Tanaka, K.; Hashimoto, S. Plant canopy effects on soil thermal and hydrological properties and soil respiration. Ecol. Model. 2006, 196, 32–44. [Google Scholar]
  125. Shashua-Bar, L.; Pearlmutter, D.; Erell, E. The cooling efficiency of urban landscape strategies in a hot dry climate. Landsc. Urban Plan. 2009, 92, 179–186. [Google Scholar]
  126. Bréda, N.; Granier, A. Intra-and interannual variations of transpiration, leaf area index and radial growth of a sessile oak stand (Quercus petraea). Ann. Sci. For. 1996, 53, 521–536. [Google Scholar]
  127. Rey, J.M. Modelling potential evapotranspiration of potential vegetation. Ecol. Model. 1999, 123, 141–159. [Google Scholar]
  128. Skelhorn, C.; Lindley, S.; Levermore, G. The impact of vegetation types on air and surface temperatures in a temperate city: A fine scale assessment in Manchester, UK. Landsc. Urban Plan. 2014, 121, 129–140. [Google Scholar]
  129. Streiling, S.; Matzarakis, A. Influence of single and small clusters of trees on the bioclimate of a city: A case study. J. Arboric. 2003, 29, 309–316. [Google Scholar]
  130. Coutts, A.M.; White, E.C.; Tapper, N.J.; Beringer, J.; Livesley, S.J. Temperature and human thermal comfort effects of street trees across three contrasting street canyon environments. Theor. Appl. Climatol. 2016, 124, 55–68. [Google Scholar]
  131. Nikolopoulou, M.; Lykoudis, S. Thermal comfort in outdoor urban spaces: Analysis across different European countries. Build. Environ. 2006, 41, 1455–1470. [Google Scholar]
  132. Nikolopoulou, M.; Steemers, K. Thermal comfort and psychological adaptation as a guide for designing urban spaces. Energy Build. 2003, 35, 95–101. [Google Scholar]
  133. Nikolopoulou, M. Designing Open Spaces in the Urban Environment: A Bioclimatic Approach; RUROS—Rediscovering the Urban Realm and Open Spaces; Centre for Renewable Energy Sources (CRES): Athens, Greece, 2004; Available online: http://www.cres.gr/kape/education/1.design_guidelines_en.pdf (accessed on 19 October 2020).
  134. Lai, D.; Liu, W.; Gan, T.; Liu, K.; Chen, Q. A review of mitigating strategies to improve the thermal environment and thermal comfort in urban outdoor spaces. Sci. Total Environ. 2019, 661, 337–353. [Google Scholar]
  135. Bechtel, B.; Alexander, P.J.; Böhner, J.; Ching, J.; Conrad, O.; Feddema, J.; Mills, G.; See, L.; Stewart, I. Mapping local climate zones for a worldwide database of the form and function of cities. ISPRS Int. J. Geo-Inf. 2015, 4, 199–219. [Google Scholar]
  136. Cityofboise.org. Tree Selection Guide. 2018. Available online: https://www.cityofboise.org/departments/parks-and-recreation/community-forestry/forestry-programs-and-education/tree-selection-guide/ (accessed on 12 October 2020).
  137. May, P.B.; Livesley, S.J.; Shears, I. Managing and monitoring tree health and soil water status during extreme drought in Melbourne, Victoria. Arboric. Urban 2013, 39, 136–145. [Google Scholar]
  138. Shade Guidelines. Available online: https://www.sunsmart.com.au/publications-posters/search.asp?ConfirmationFormSubmitted=true&FormSubmitted=true&FormName=resourcessearchform&CurrentPage=1&ContainerId=resource_order_form_resources&ContentType=resource&Keywords=&category=all&Field010=%5B--0--%5D&Field010=all (accessed on 12 October 2020).
  139. Shade Guidelines. Available online: https://www.publichealthgreybruce.on.ca/Portals/0/Topics/FamilyHealth/Sunsense/shade_guidelines.pdf (accessed on 12 October 2020).
  140. Guidelines for Shade Planning and Design. Available online: https://cancernz.org.nz/assets/Sunsmart/Sunsmart-resources/Guidelines-Under-Cover (accessed on 12 October 2020).
  141. CPSC. Handbook for Public Playground Safety; U.S. Consumer Product Safety Commission: Washington, DC, USA, 2010. Available online: https://www.ihs.gov/headstart/documents/HandbookforPlaygroundSafety.pdf (accessed on 19 October 2020).
  142. Zinzi, M. Optical and thermal characterisation of cool asphalts to mitigate urban temperatures and building cooling demand. Build. Environ. 2013, 60, 56–65. [Google Scholar]
  143. Doulos, L.; Santamouris, M.; Livada, I. Passive cooling of outdoor urban spaces. The role of materials. Sol. Energy 2004, 77, 231–249. [Google Scholar]
  144. Erell, E.; Pearlmutter, D.; Boneh, D.; Kutiel, P.B. Effect of high-albedo materials on pedestrian heat stress in urban street canyons. Urban Clim. 2014, 10, 367–386. [Google Scholar]
  145. Lindberg, F.; Onomura, S.; Grimmond, C. Influence of ground surface characteristics on the mean radiant temperature in urban areas. Int. J. Biometeorol. 2016, 60, 1439–1452. [Google Scholar]
  146. Taleghani, M.; Sailor, D.; Ban-Weiss, G.A. Micrometeorological simulations to predict the impacts of heat mitigation strategies on pedestrian thermal comfort in a Los Angeles neighborhood. Environ. Res. Lett. 2016, 11, 1–12. [Google Scholar]
  147. Li, H.; Sodoudi, S.; Liu, J.; Tao, W. Temporal variation of urban aerosol pollution island and its relationship with urban heat island. Atmos. Res. 2020, 241, 104957. [Google Scholar]
  148. Huang, J.; Zhou, C.; Zhuo, Y.; Xu, L.; Jiang, Y. Outdoor thermal environments and activities in open space: An experiment study in humid subtropical climates. Build. Environ. 2016, 103, 238–249. [Google Scholar]
  149. Varras, G.; Vozikis, K.-T.; Myriounis, C.; Tsirogiannis, I.L.; Kitta, E. Design of extensive green roofs for the major school plants of Piraeus. In Proceedings of the II International Symposium on Horticulture in 2nd Symposium on Horticulture in Europe, Angers, France, 1–5 July 2012; Volume 2015, pp. 959–966. [Google Scholar]
  150. Kumar, R.; Kaushik, S. Performance evaluation of green roof and shading for thermal protection of buildings. Build. Environ. 2005, 40, 1505–1511. [Google Scholar]
  151. Tsirogiannis, I.; Karras, G.; Lambraki, E.; Varras, G.; Savvas, D.; Castellano, S. Evaluation of a plastic tube based hydroponic system for horizontal and vertical green surfaces on buildings. In Proceedings of the XXIX International Horticultural Congress on Horticulture: Sustaining Lives, Livelihoods and Landscapes (IHC2014), Brisbane, Australia, 17 August 2014; Volume 1108, pp. 323–330. [Google Scholar]
  152. Katsoulas, N.; Antoniadis, D.; Tsirogiannis, I.; Labraki, E.; Bartzanas, T.; Kittas, C. Microclimatic effects of planted hydroponic structures in urban environment: Measurements and simulations. Int. J. Biometeorol. 2017, 61, 943–956. [Google Scholar]
  153. Bianco, L.; Serra, V.; Larcher, F.; Perino, M. Thermal behaviour assessment of a novel vertical greenery module system: First results of a long-term monitoring campaign in an outdoor test cell. Energy Effic. 2017, 10, 625–638. [Google Scholar]
  154. Medl, A.; Stangl, R.; Florineth, F. Vertical greening systems–A review on recent technologies and research advancement. Build. Environ. 2017, 125, 227–239. [Google Scholar]
  155. Montero, J.; Salas, M.; Mellado, P. Hydroponic pergola as an example of living furniture in urban landscape. In Proceedings of the II International Conference on Landscape and Urban Horticulture, Bologna, Italy, 9–13 June 2010; Volume 881, p. 355. [Google Scholar]
  156. Danks, S.G. Asphalt to Ecosystems: Design Ideas for Schoolyard Transformation; New Village Press: New York, NY, USA, 2010. [Google Scholar]
  157. Danks, S.G. The Green Schoolyard Movement: Gaining Momentum Around the World. Retrieved 8 April 2019, from Children & Nature Network. 2014. Available online: https://www.childrenandnature.org/2014/02/06/greenschoolyardsnearby-nature-access-for-all/.nat (accessed on 12 October 2020).
  158. Bush, J.; Doyon, A. Building urban resilience with nature-based solutions: How can urban planning contribute? Cities 2019, 95, 102483. [Google Scholar]
  159. Paris OASIS—School yards, P.O.-S. 2019. Available online: https://www.uia-initiative.eu/en/uia-cities/paris-call3 (accessed on 12 October 2020).
  160. Space to Grow: Greening Chicago Schoolyards. 2019. Available online: https://www.spacetogrowchicago.org/ (accessed on 12 October 2020).
  161. Green Schoolyards America Program. Available online: https://www.greenschoolyards.org/news/2016/7/14/the-green-schoolyard-movement-gaining-momentum-around-the-world (accessed on 12 October 2020).
Figure 1. Energy fluxes that affect the human energy budget outdoors. M: Metabolism; C: Convection—Moving air removes radiated heat; K: Conduction—direct heat transfer by conduct; E: Evaporation—Loss of heat by evaporation of water; R: Radiation—SW, LW, D, Di, Re: Short-wave, Long-wave, Direct, Diffused, Reflected respectively; Em: emission of LW radiation; Ta: air temperature; Ws: Wind Speed; RH: air Relative Humidity; Tsk: Skin Temperature; Ts: Surface Temperature; (+) heat gain (−) heat loss; up arrow: increase, down arrow: decrease.
Atmosphere 11 01144 g001
Figure 2. Spatial distribution of microclimatic parameters (measured by a portable meteorological station) and human thermal perception expressed in Tmrt (calculated by Rayman model) under the shade of a cluster of 2 Pinus trees (A) and a nearby position exposed to intense incident solar radiation (B). Source [118].
Atmosphere 11 01144 g002
Figure 3. Surface temperatures of (A) ground covering materials with different properties and (B) ground under the tree shade or exposed to sun. Sp: Schistolithus plates; Gr: Grass; Asph: Asphalt; C: Pavers; Ts: Tree shade.
Atmosphere 11 01144 g003
Figure 4. Application of the microclimate mode ENVI-met (V4) for the simulation of the effects of redesign proposal at an urban schoolyard in Volos, Greece. Source [7].
Atmosphere 11 01144 g004
Figure 5. Implementation of the redesign proposal of [7] in an urban schoolyard in Volos, Greece, with the participation of students and the school community. A total of 75 shade trees were planted, 3 amphitheatrical mounds planted with turf, 400 m2 of new area planted with turf were introduced and wooden configurations together with playing facilities were added.
Atmosphere 11 01144 g005
Table 1. Main categories and keywords of the literature studied and presented herein.
Study CategoryKeywords Number of Relevant Manuscripts Found
Studies which assessed human thermal perception in outdoor urban environments and the monitoring of outdoor human thermal comfort“human thermal comfort” and “outdoor” and “urban” and “human thermal index”66
Studies that linked heat perception and thermal comfort to the age group of children“thermal comfort” and children, “heat stress” and “mortality”, “morbidity” or “thermal perception” and “children”34
Studies that described the design of urban schoolyards and its impact on the biometeorological conditions especially on sunny days in warm or hot climates“school*” and “design” and “thermal conditions” and “heat stress”16
Selection of studies that focused mainly on the cooling impact of vegetation on the thermal environment of urban outdoor spaces. “thermal comfort” and “urban” and “trees” and “vegetation”30
Studies that proposed strategies to mitigate the heat stress and improve schoolyards thermal environment of schoolyards users, together with the movement “Greening Schoolyards” “mitigation strategies” and “heat stress” and “School*” and “design”, “greening Schoolyards”51
Table 2. Physiological differences between children and adults that trigger differences in children’s thermal perception in hot environment.
Physical ParameterChildrenEffectReference
Surface area-to-body mass ratioHigherHigher heat absorption[78,79]
Metabolic rateHigherHigher heat production[48,79]
HeightLower height.
Body closer to the ground
Thermal impacts of long-wave heat fluxes of high surface temperatures[6,33,95]
SkinMore sensitive [33]
Physical activityHigherHigher metabolic heat production[96,97]
Heat lossDry convective compared to adults evaporative heat loss [93]
ThermoregulationInferior [83,84,85,86]
Undeveloped sweat gland capacity [78,85,87,88]
Lower sweat rate [83,84,94]
Lower evaporation heat exchange[12,48,89,90]
Adaptive behaviourLess adaptiveLess knowledge for sun protection[33]
Heat exchangesRapidEstablishment of heat stress condition in short time[6,48,87,91,92]
Thermal perception Inferior [12,48,89,90]
Table 3. Effects of vegetation on microclimate during the warmest hours of the day.
Under the Tree Crown
EffectsTree Characteristics MechanismReferences
Reduction of Tair [12,26,62,109,111,112,120,121,122,123,124,125,126,127,128,130]
Light green leaf colourIncreased solar reflectance
Larger foliage density (larger Leaf Area Index, LAI) Larger amount of leaves thus, larger amount of evapotranspiration that dissipate more heat through latent cooling
Leaf thicknessThe thinner the leaf is, the less is the cooling effect
Leaf surface roughnessThe rougher the leaf the less absorbs solar radiation
Increase of RHLarger Foliage density
(LAI index)
Larger amount of leaves, thus larger amount of evapotranspiration and water vapour loss to the microenvironment[26,111,114,115,116,120,122,126,127]
Reduction of incident solar radiation [9,26,110,111,115,116,118,120,122,123,124,125,126,129]
Larger Foliage density
(LAI index)
Reduce the permeability of the crown to solar radiation
Light green leaf colourIncreased solar reflectance
Crown absorbance and reflectance of solar radiationReduce the infrared emissivity and the crown heat capacity
Different tree species and at different ages and seasonsDifferences in shade pattern
Tree’s configurationClusters of trees at small distances increase the effects
Modify the wind propertiesCrown width and trunk and branches structureReduce wind flow and increase wind turbulence[108,124]
Reduction of surface temperaturesIncreased tree’s shadingTree shade reduce the surface temperature as less solar energy reach the ground, reduce the heat energy that is trapped into the body of the surface and reduce the emission of long-wave radiation from the surface[7,9,12,115,120,124,128]
Improve the human thermal comfortReduced radiative budgetReduce Tmrt and thermal comfort indices[9,24,114,115,116,119,129,130]
Over vegetated surface cover
Low grass albedo Drives the reflected short-wave radiation and the convective heat removal that affects evaporative cooling[24]
Irrigated grassReduce emission of long-wave radiation[24]
Shaded grassGreater cooling effect[125]
Publisher’s Note: MDPI stays neutral with regard to jurisdictional claims in published maps and institutional affiliations.

