1. Introduction
Non-Exhaust Emissions (NEE) have become a relevant research topic during the recent years. Not only because exhaust emissions could be reduced significantly by a huge number of measures, but also because the fraction of NEE is expected to be relevant on total transportation emissions.
However, one of the measures for relevance is the so-called Emission Factor (EF), indicated by emitted particle mass (in mg) per driven vehicle kilometer [mg/km]. Since a huge range of those EF for NEE in general, brake particle emissions and tire particle emissions in particular can be found, it is clear that a need for the development of a measurement methodology to determine robust and reliable emission factors (EF) exist [
1,
2,
3].
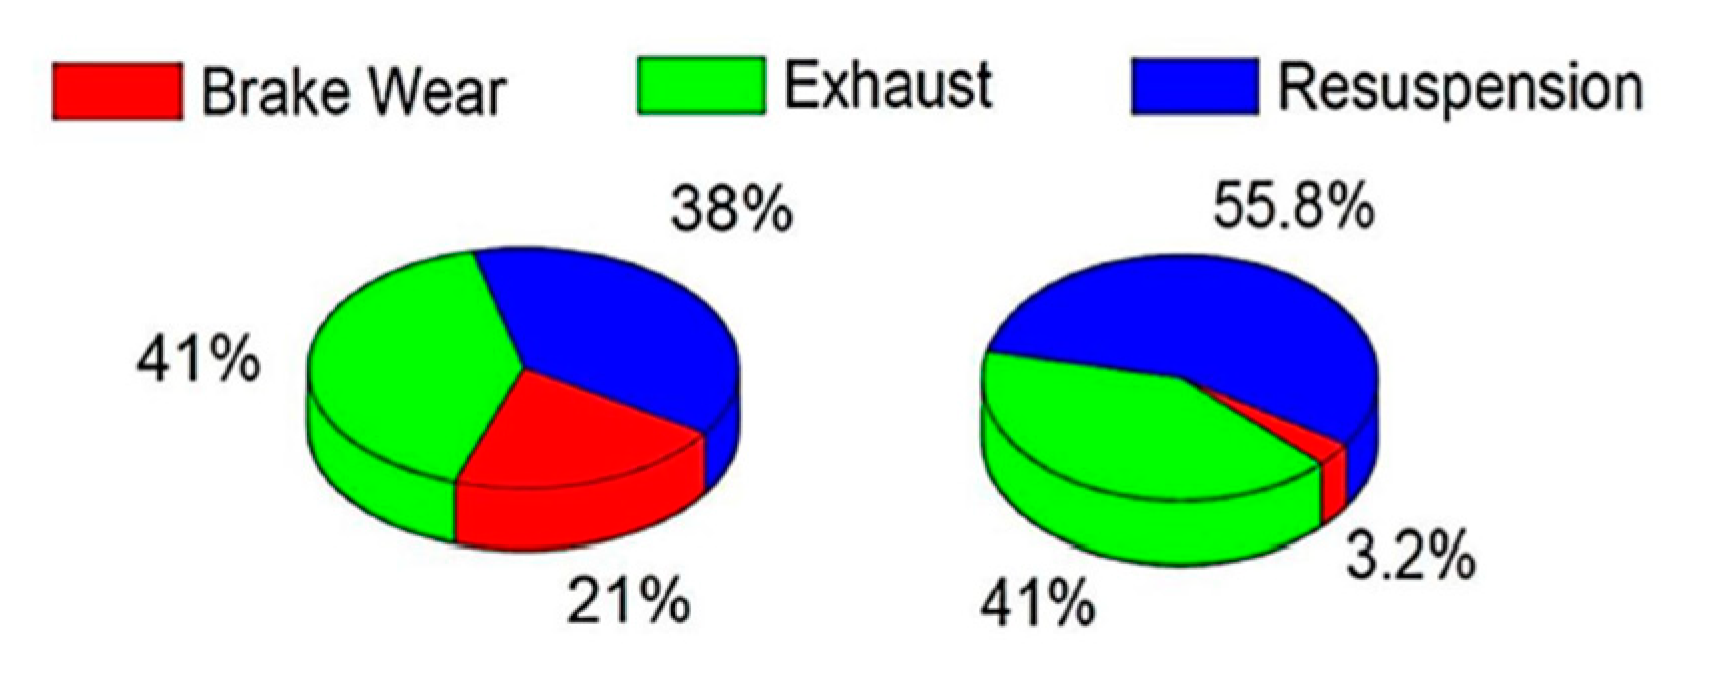
However, even if the current EF have to be improved, one example of the fraction of NEE on traffic emissions is illustrated by
Figure 1. It shows on one hand the importance of brake particle emissions, on the other hand it is also relevant where to measure since the location obviously owns a certain impact on the emission contributions. As a conclusion, it might be helpful to study the overall road transport emissions, as it is discussed in [
4]. The authors indicate amongst others the fraction of brake particle emissions in the UK, which might give a “bigger picture” than measurement results of an intersection. It is stated, that non-exhaust already exceeds exhaust PM (2018). Furthermore, they expect non-exhaust to be 10% while exhaust is expected to be only 1% with respect to overall PM
2.5 emissions in UK.
The Particle Measurement Programme Informal Working Group (PMP IWG) is a group under the auspices of the United Nations Working Party on Pollution and Energy (UNECE GRPE). The PMP group activities initially focused on the development of an alternative metric with increased sensitivity compared to the existing particulate matter mass measurement system for Heavy Duty and Light Duty engines/vehicles. Since 2014, the PMP group also comprises experts from the field of non-exhaust emissions as it has been working on the issue of brake and tyre wear emissions.
Based on the latest version of its Terms of Reference, the PMP group aims at the development of a commonly accepted methodology for sampling and measuring brake wear particles. The main goal of the methodology is to render possible future studies on brake emissions comparable to each other as well as come up with realistic brake particle mass (PM) and particle number (PN) emission factors.
Regarding brake particle emissions, such a methodology considers two major items: the test cycle and the measurement setup.
Many approaches exist how one can develop a testing cycle. Since the objective from the European Commission always addressed a more customer-oriented load cycle, the typical performance-driven test cycles from the industry were not a proper solution. Hence, a new proposed cycle is oriented on the worldwide harmonized light vehicles test procedure (WLTP) database, the so-called novel-WLTP [
5].
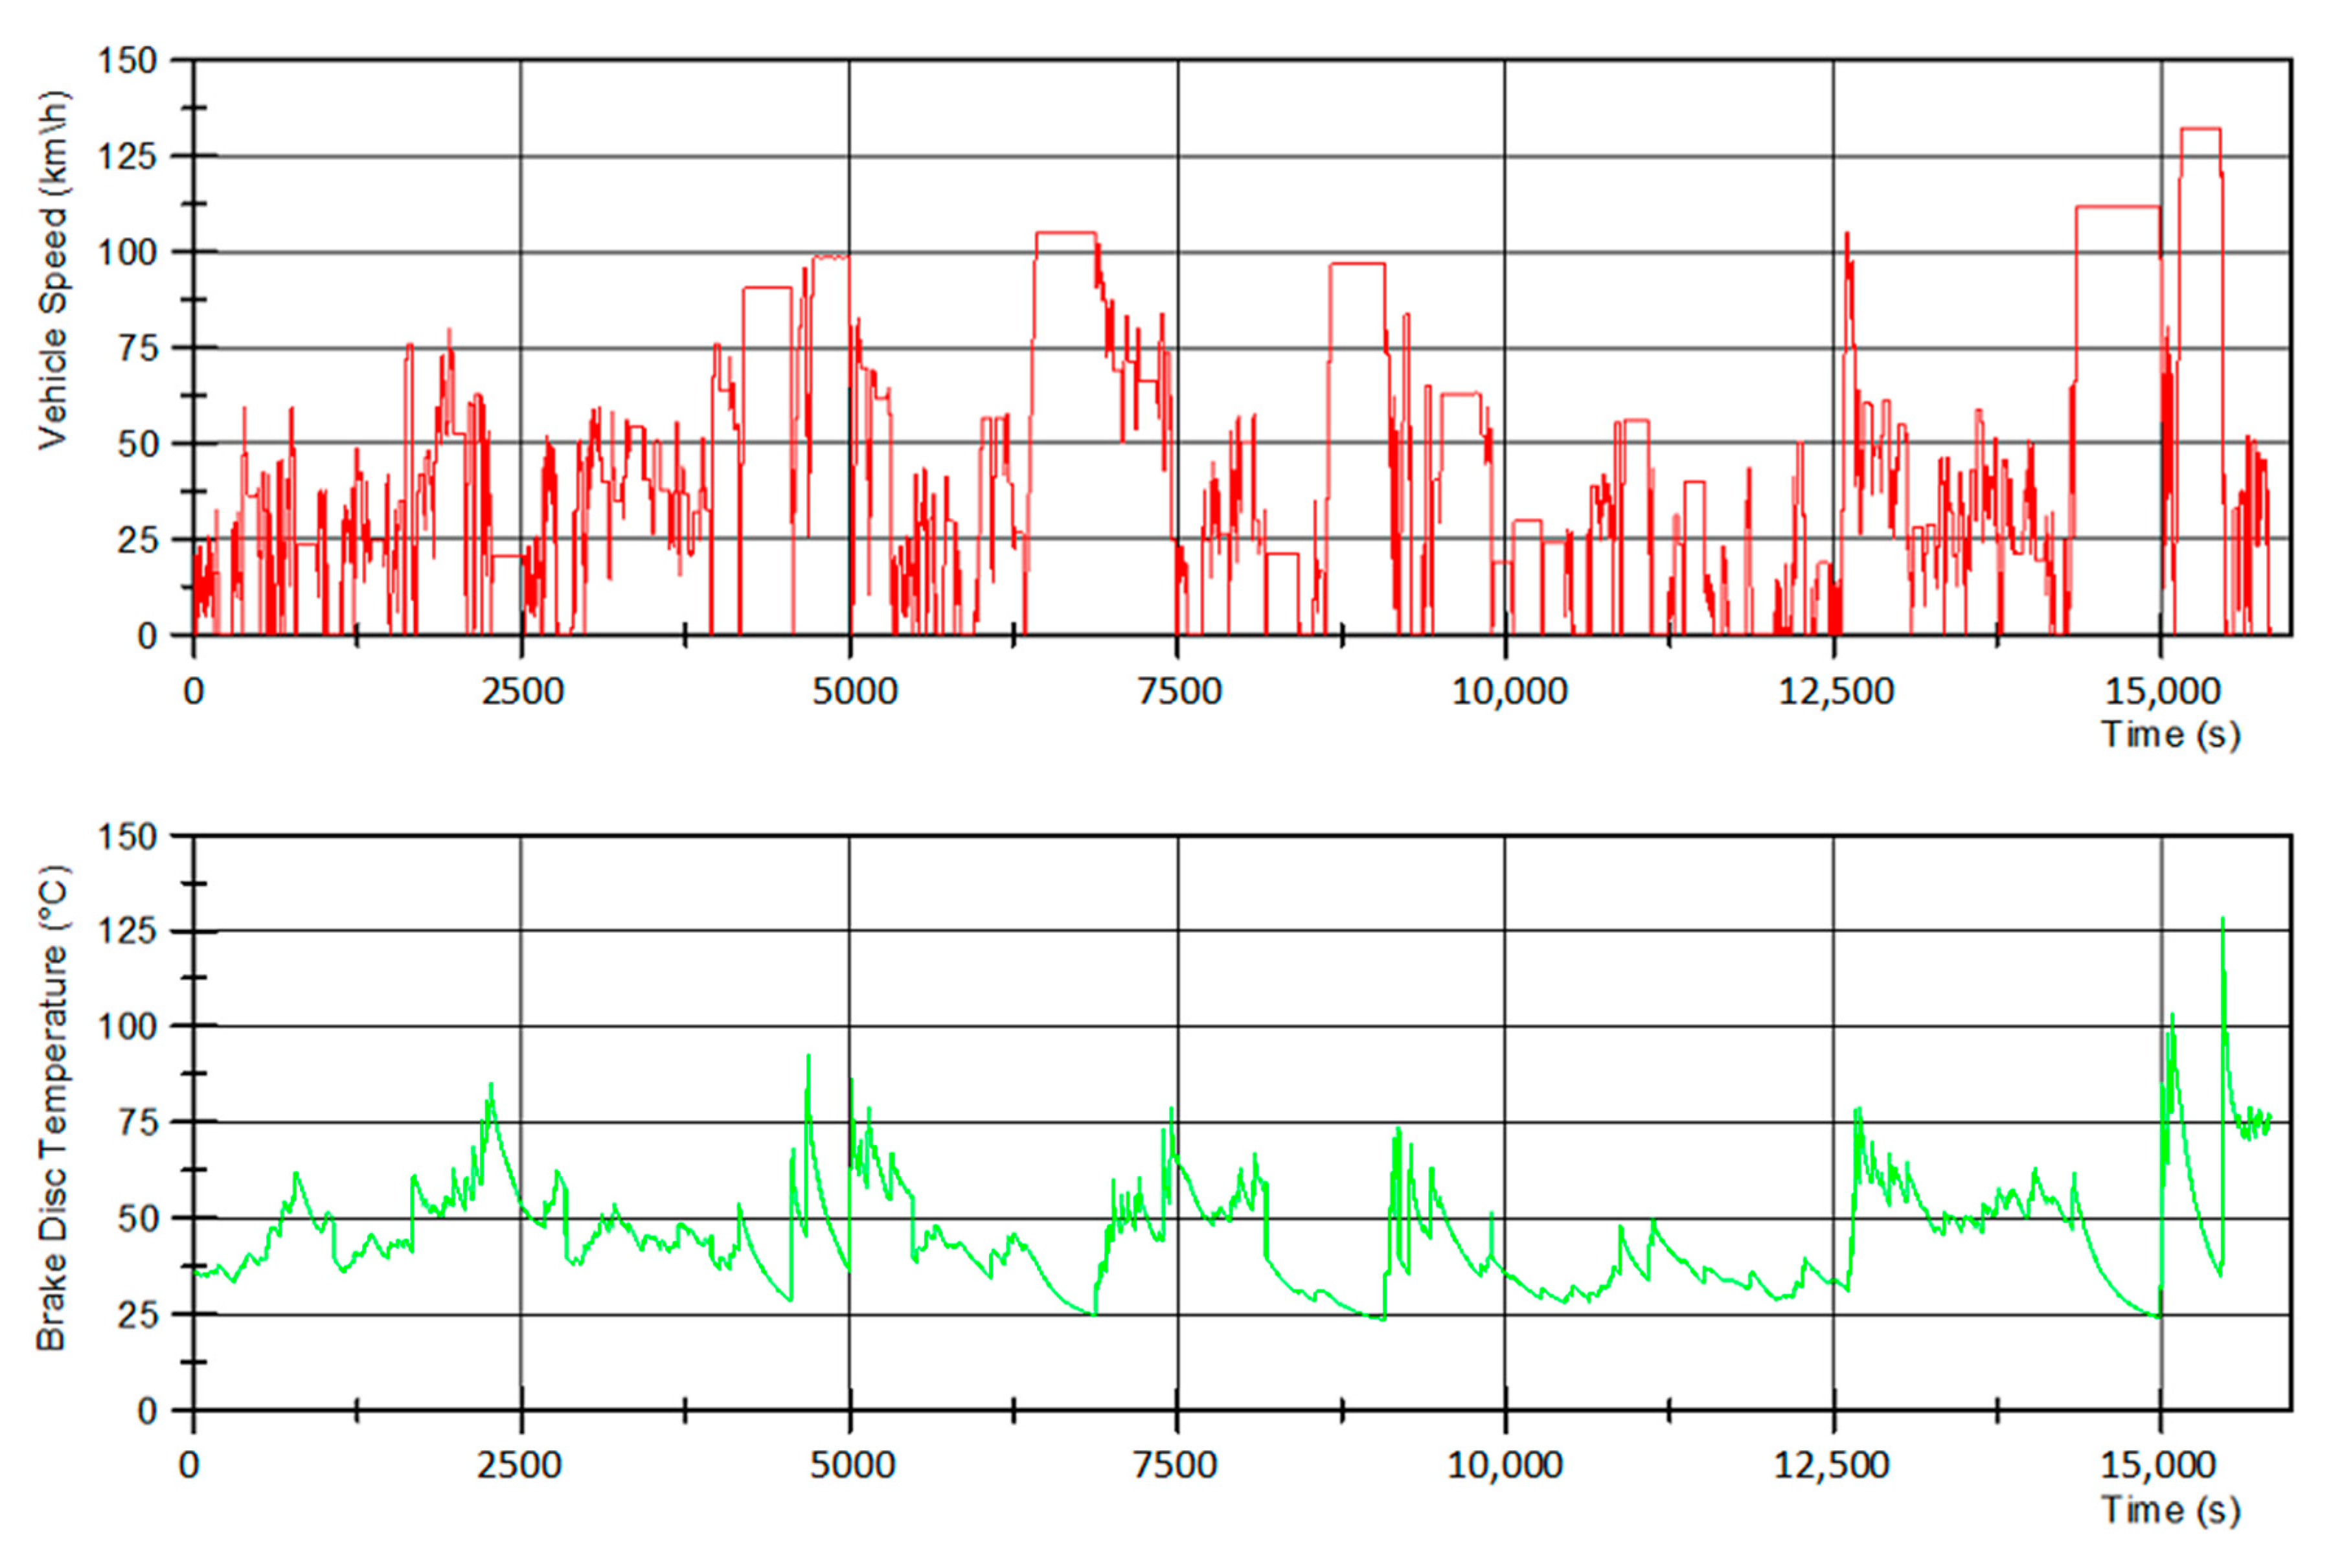
In
Figure 2 the vehicle speed trace and the temperature for the front brake disc (based on measurement results by the authors) are shown and introduce the character of the test cycle very well. The approach follows a vehicle speed-controlled scenario and considers 10 trips with an increasing load profile. In between, cooling or so-called soak times are implemented to represent breaks and periods of standstill. It can be seen easily that neither the vehicle speed, nor the obtained temperatures are too challenging—the cycle is developed to be representative and customer-oriented.
Regarding the setup, many research teams all over the world started investigations and development activities. However, the use of a brake dynamometer is recommended by the PMP IWG Non-Exhaust Emissions to characterize brake particle emissions since it represents the best compromise between feasibility and a representative measurement approach. The focus is on the friction couple itself, external factors such as the role of friction of road surfaces or the impact of the powertrain concept are not considered by the PMP IWG Non-Exhaust Emissions.
Japanese experts around Hagino focused very quickly on an approach to determine especially the particle mass (PM), where the source of the occurrence of particles should be also taken into account. Their findings showed bimodal shaped peaks of airborne wear particles of disc brakes caused by the actual brake application as well as by residual drag. The detected weights of particles (PM) differ depending on the various framework parameters like settings, assemblies, velocities and deceleration levels. The brake temperature control in particular is a crucial setting to provide a representative value and certain reproducibility of the measurements, since higher temperatures will lead to an increase in wear particles [
6,
7].
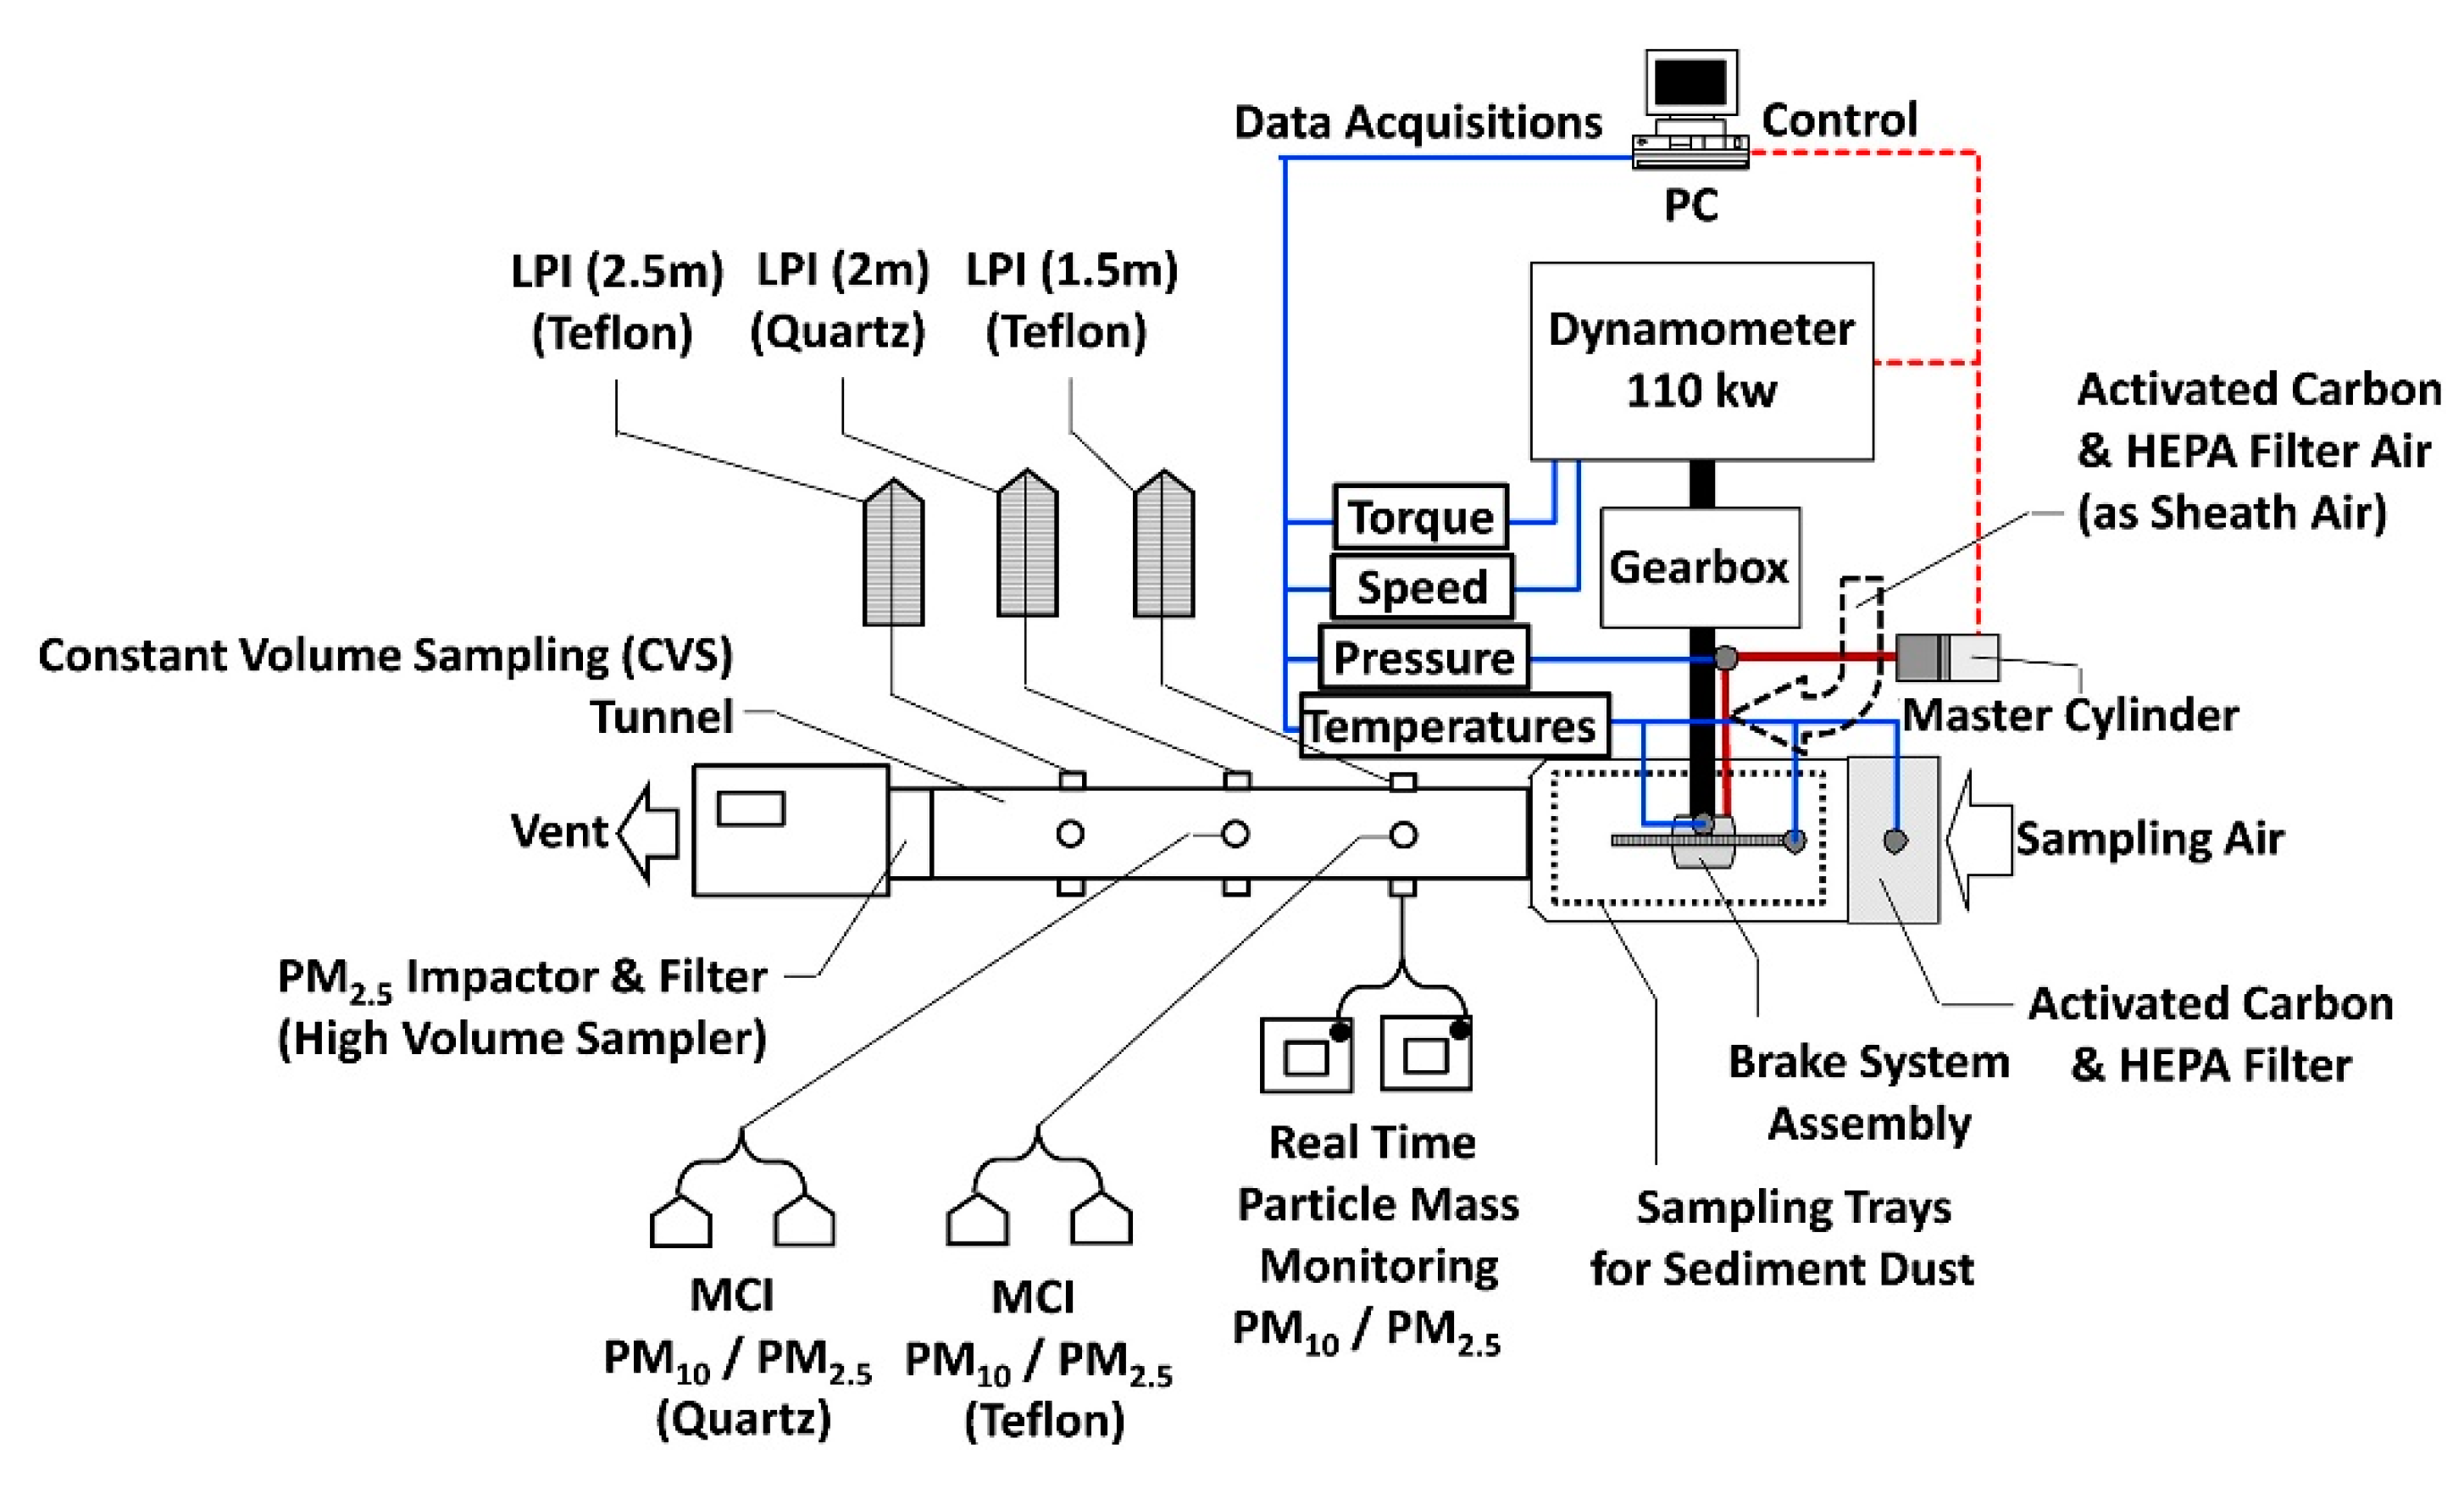
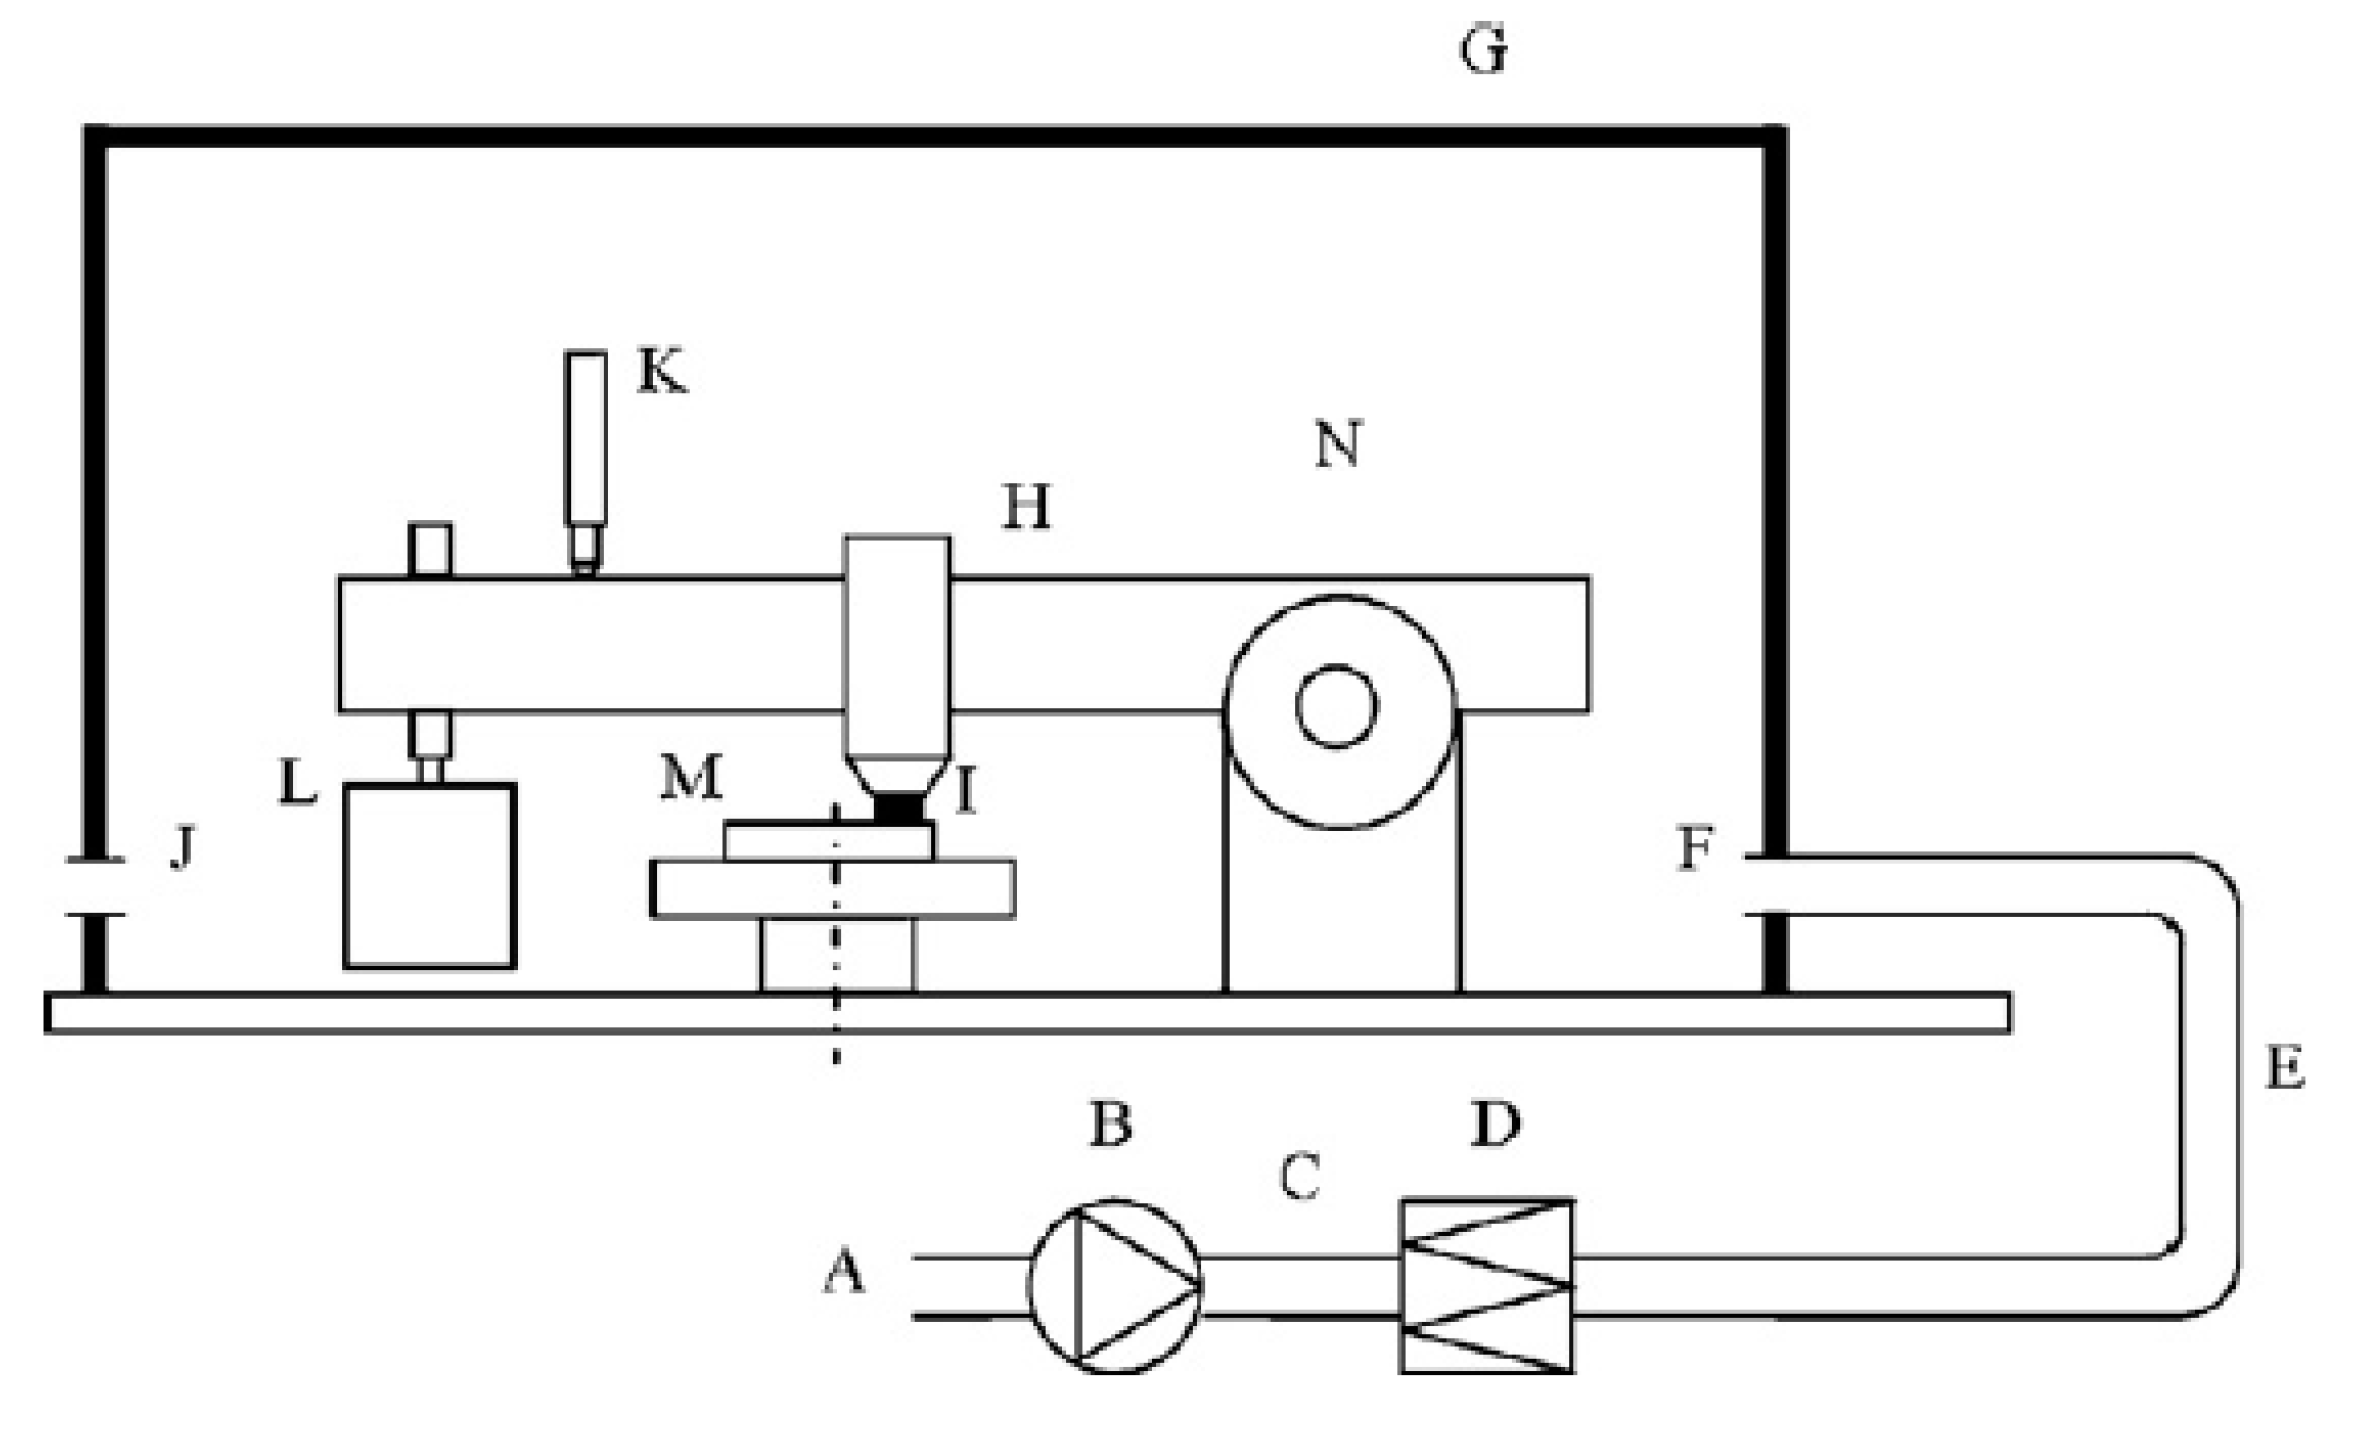
The Japanese experts designed a setup that allowed investigations of several influencing factors (
Figure 3). Hence, the impact of the cooling air, position and kind of measurement devices and also the role of friction couples is investigated by the authors. However, this proposed setup owns a significant drawback from the industrialization point of view. Since the dilution/exhaust duct considers a long length without bends, it is hard to be implemented in an industrial test field with several other test benches.
Another approach is described amongst others in [
8]. The introduced design setup reveals the measurement possibilities very well: particle number concentration, particle size distributions and also particle mass can be characterized. The setup itself represents a very compact design that allows the integration into existing brake dynamometer test fields. Results of the investigations with this setup are comparable to the findings of [
6,
7]. Increased temperature levels due to longer applied brake pressure lead to higher particles in number (PN). Another outcome is that ultrafine particles occur particularly within a time range with temperatures being higher, while more coarse particles occur at lower temperature levels.
A very profound and in-depth analysis of the wear products is given in [
9]. The authors confirm that brake wear particles include a wide size range from the micro- to nanoscale. Electron microscopic analyses confirm that particles occur mainly as polydisperse, heterogeneous aggregates. Regarding the nanoscale particles, it is stated that they are often nearly spherical and occur also as single particles. Furthermore, chemical analyses reveal that the particles’ chemical composition is dominated by Fe and in smaller sizes by Ca ± Fe ± Ti.
In addition, the REBRAKE and LOWBRASYS projects delivered very relevant and important technical solutions [
10,
11].
The researcher propose also a very compact housing and sampling situation that can be easily integrated to an existing brake dynamometer.
Figure 4 reveals an exhaust duct with increased bending diameters that should allow an increased particle transport efficiency. Regarding the duct diameters and required cooling air rates, this proposal might be critical for some brake applications in terms of their thermal behavior.
Beside those introduced approaches, which are exclusively focused on the integration of industrial brake dynamometers, another important (complementary) approach deals with fundamental tribological studies and led to the use of a tribometer setup [
12].
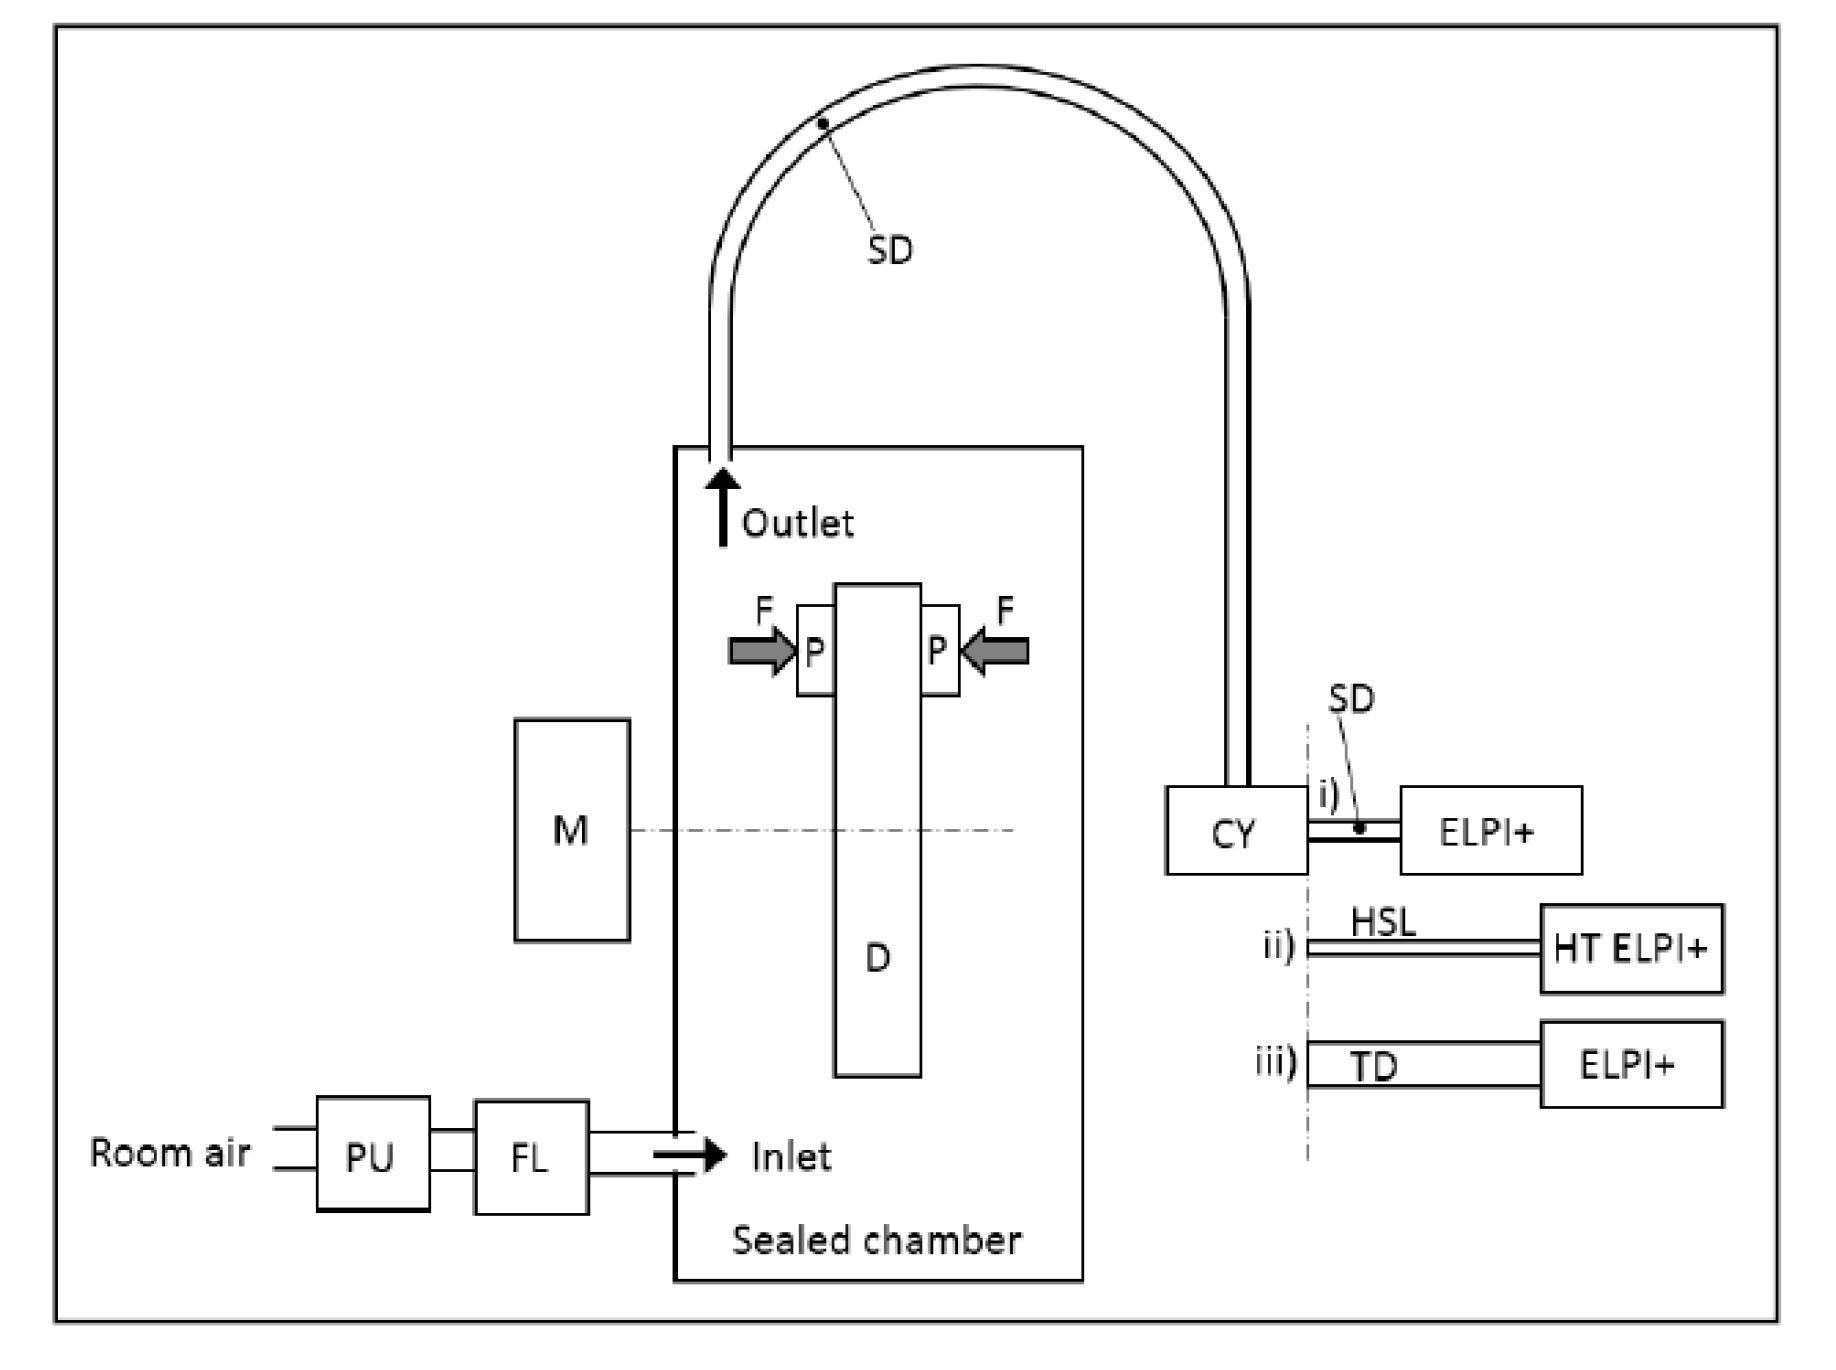
Even if the setup (
Figure 5) does not consider pre-conditioned air, it is suitable to investigate and study the fundamental tribological mechanisms of different friction materials. Hence, the particle number concentration, particle size distribution and particle mass were investigated for simplified load profiles and different brake pad materials (low steel and NAO). It is clearly shown that the low-steel pad provides higher coefficient of friction, but also leads to an increase in particle concentration due to both, wear of the pad and the brake disc compared to the NAO pad. In principle, a higher concentration of wear particles leads to a higher amount of airborne particles. Additionally, the NAO pad provides a more stable coefficient of friction during brake applications. The deviation in particle concentration results was higher for the low-steel pad.
The rate of wear is determined largely by the composition of the linings used and the mode of driving to which the brakes are subjected. This in turn will influence the physical and chemical characteristics of the emitted particles [
13].
However, since industrial partners focus very strongly on the PMP IWG NEE activities, the authors of this article also concentrate their investigations on a brake dynamometer [
14,
15].
During preliminary studies, it was important to develop a robust measurement setup that leads to representative results.
Hence, the authors considered beside a sufficient dilution length (length l = 10–20 × duct diameter d) also the preconditioning of the cooling air.
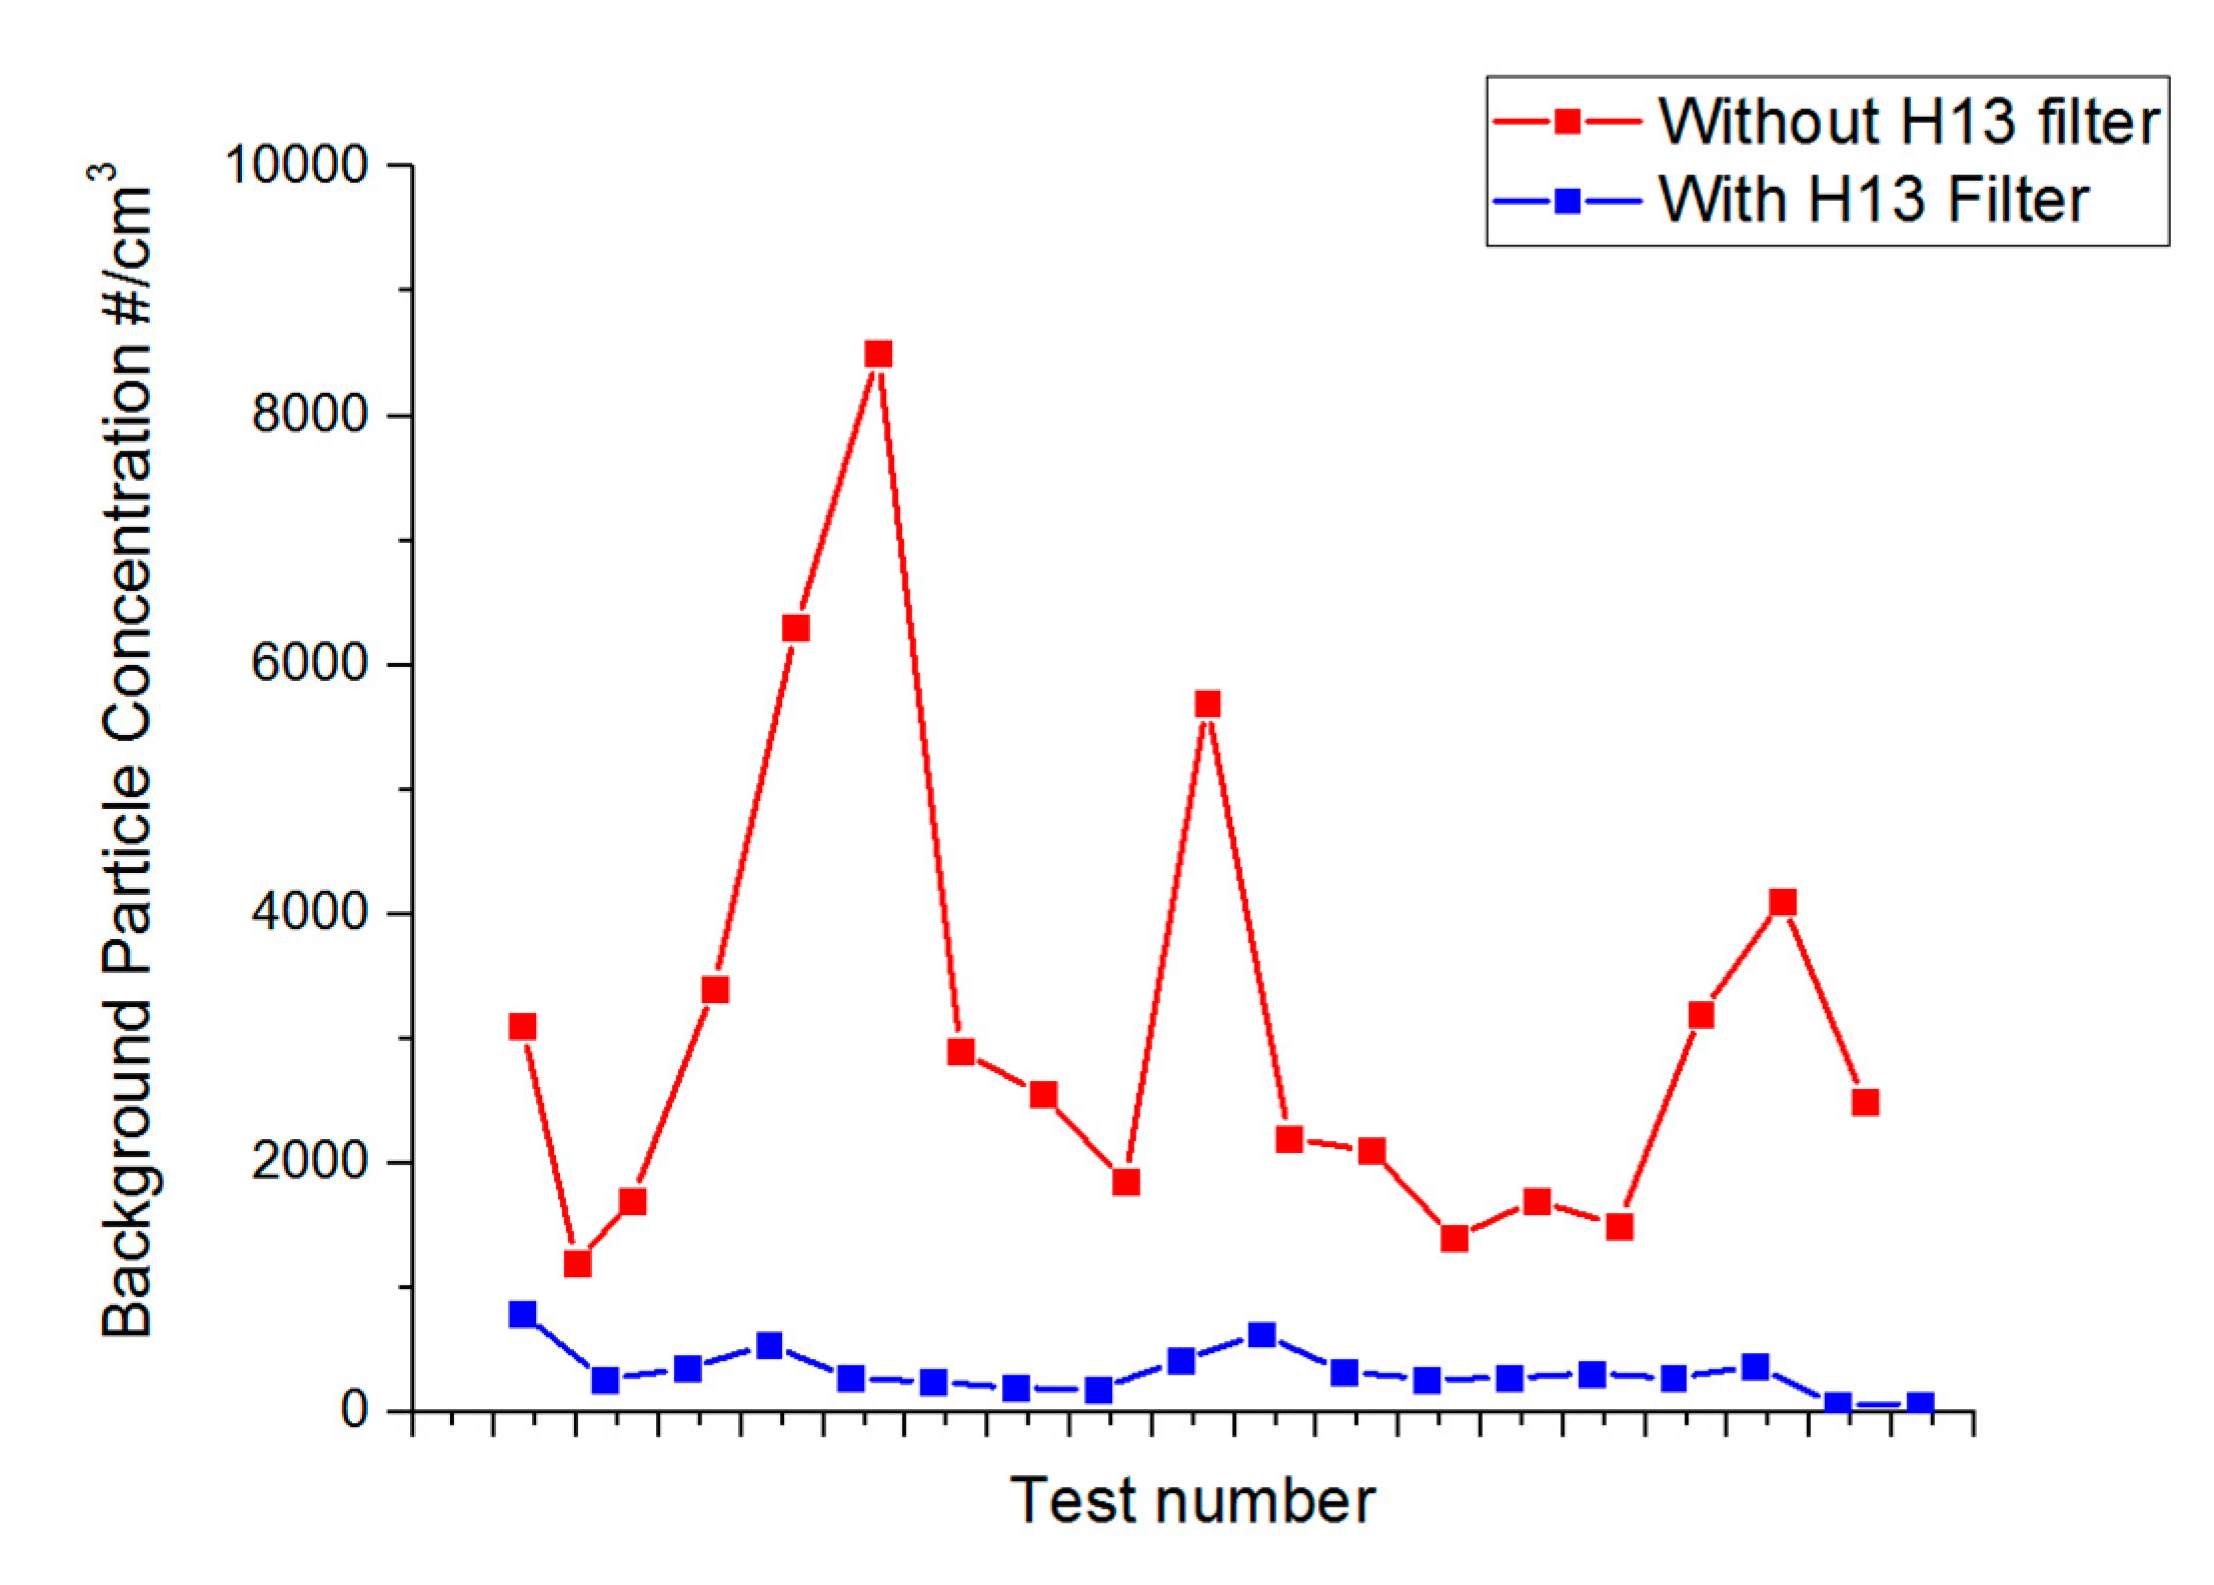
In
Figure 6, a comparison is shown that underlines the necessity of the use of a HEPA/H13 filter for brake particle emission measurements. The use of the filter ensures not only a much lower particle background level, but also a much more stable behavior what is not affected by external events (like passing vehicles next to the cooling air intake outside the laboratory).
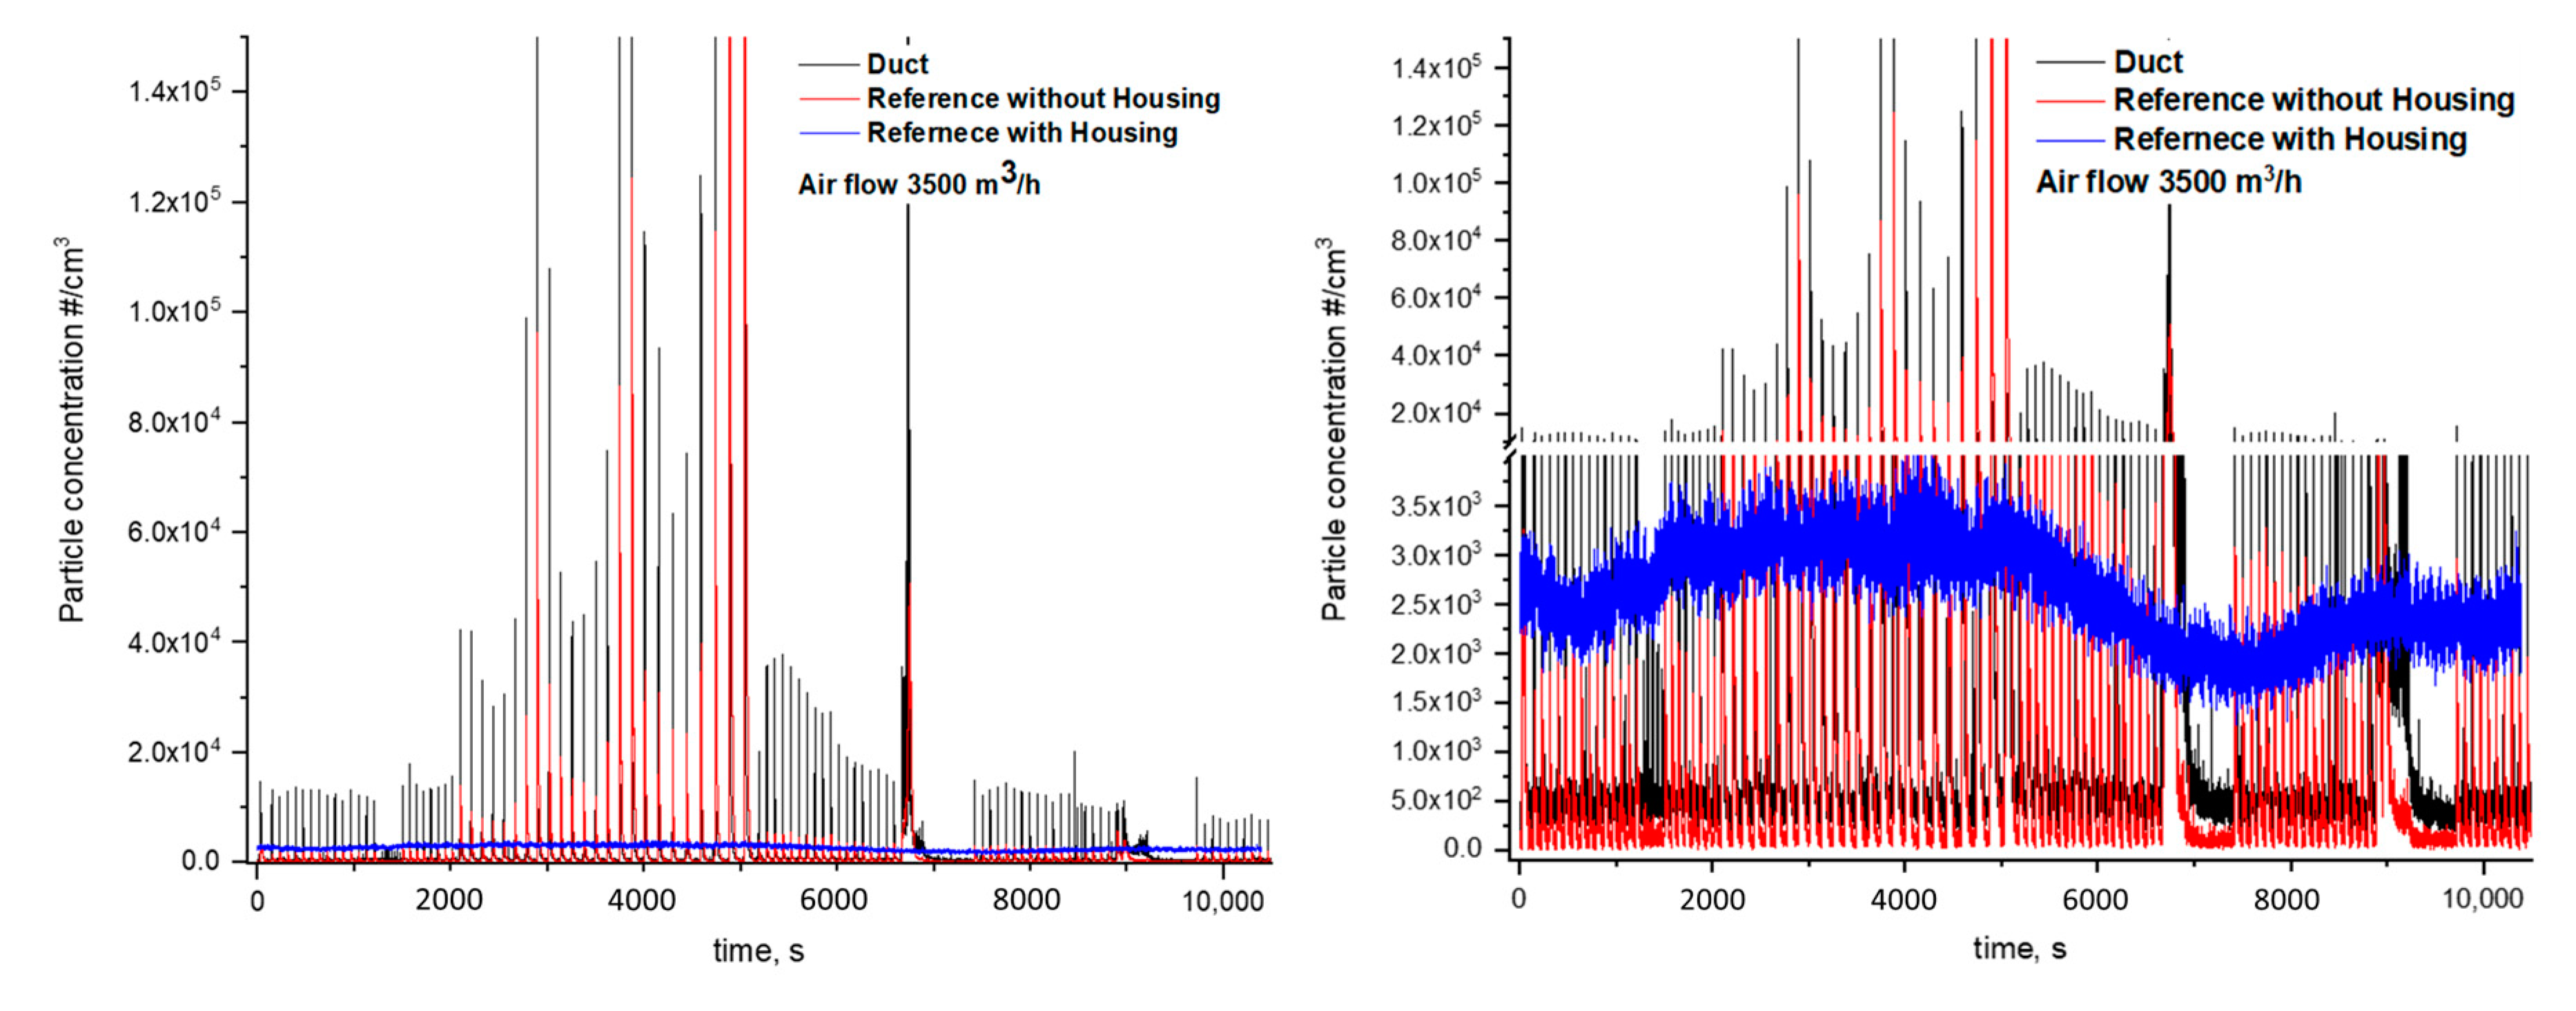
Additionally, a housing around the brake setup is useful.
Figure 7 illustrates the particle number concentration for a reference sampling point inside the bench test chamber. The housing reduces the particle losses massively and ensures in the end a real constant volume sampling (CVS) approach.
Even if huge efforts were already spent on brake particle emission investigations, many open questions remain and further efforts are necessary to understand the emission characteristics as well as the measurement methods themselves better. This article intends to address and investigate the impacts of bedding, production batch, brake lining composition and inertia variation on brake particle emission testing.
2. Experiments
The proposed experimental setup is based on a brake dynamometer, which is used for performance testing of brake systems. Its customized design allows it to operate below atmospheric pressure and specific ambient conditions can be considered as well. It must be underlined that the cooling air is preconditioned by the use of a HEPA filter (H13), also the possibility of temperature control between −30 °C and +20 °C is given. Since the role of climatic parameters is very important, higher humidity for instance can facilitate particle agglomerations, the cooling air temperature is (20 ± 2) °C while the relative humidity is (50 ± 10)% RH during all the presented experiments. Both parameters are oriented on the recommendations of the PMP IWG Non-Exhaust Emissions.
The in-take air flow rates can be varied between 930 m3/h and 3300 m3/h to determine the influence of the cooling air speed. The Horiba GIANT 5200 owns an inertia simulation range from 10 kgm2 to 200 kgm2 and allows to consider a maximum speed of 2500 rpm at a maximum power output of 190 kW.
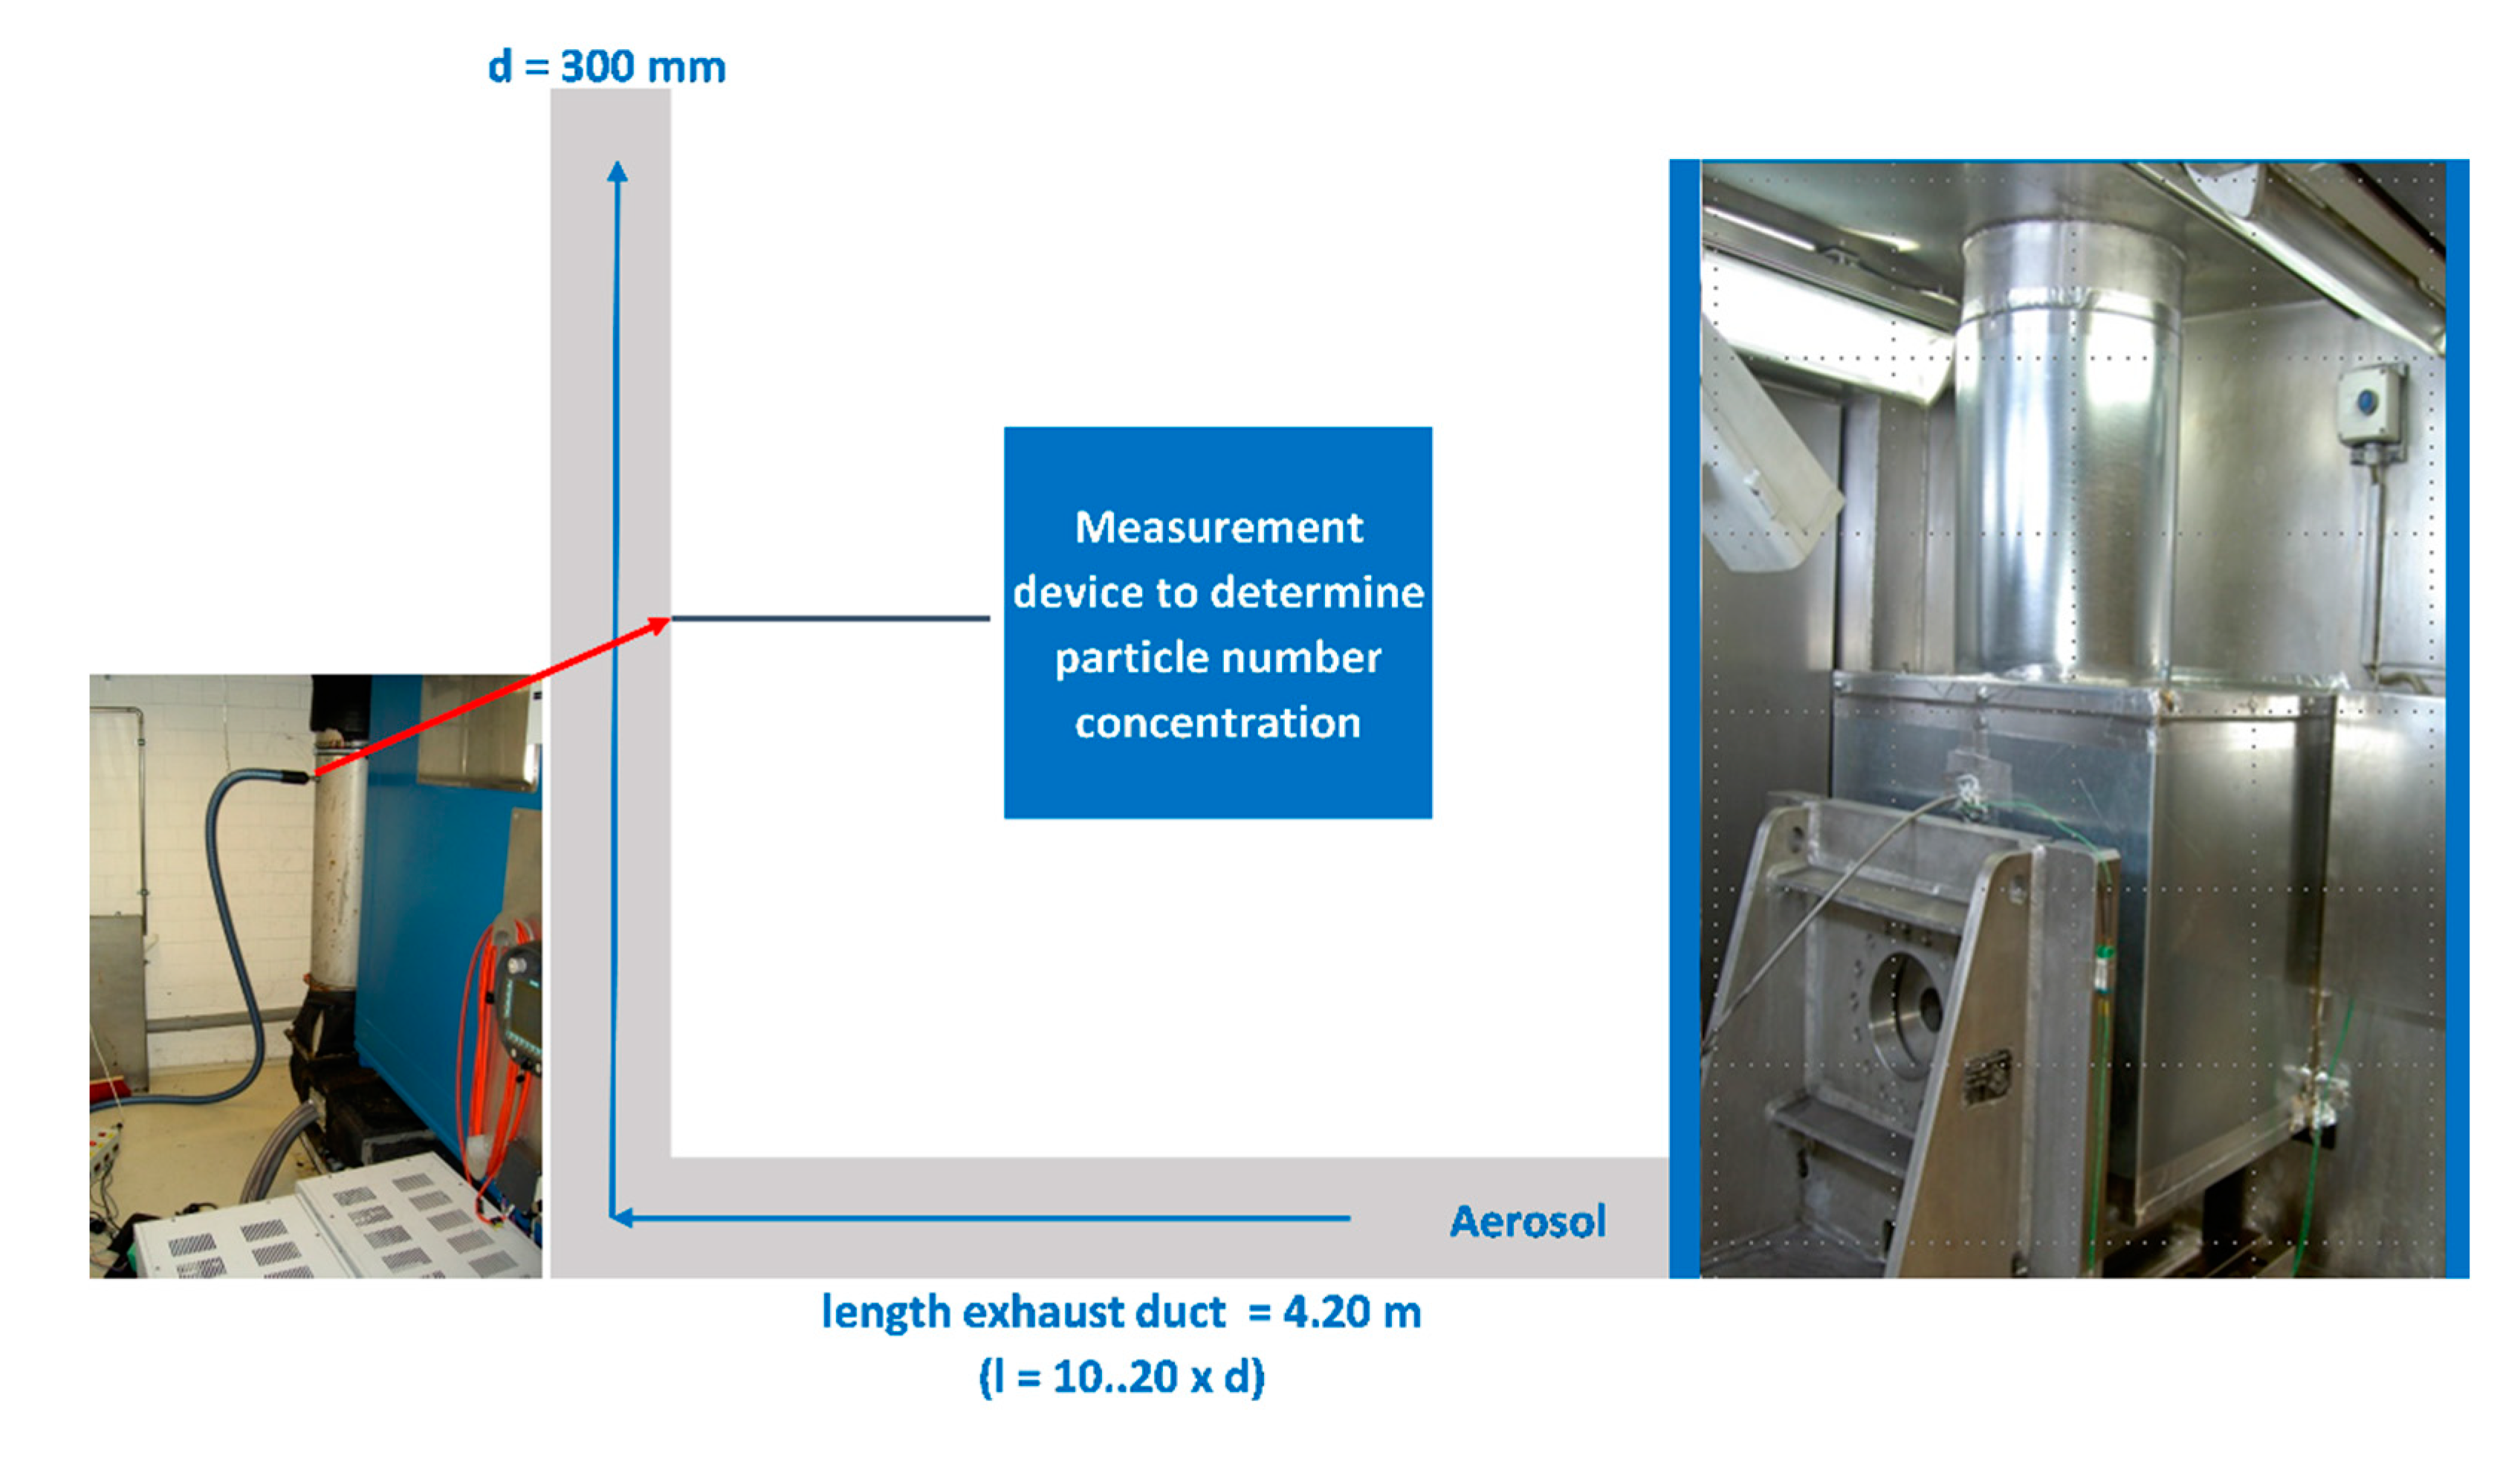
Furthermore, the sampling procedure and sampling location are crucial for brake particle emission testing. The proposed test setup is introduced in
Figure 8.
Due to the fact, that the focus of the investigations is on particle number concentration (PNC), a homogenous mixture of the aerosol is strictly recommended. That means that the distance l from the particle emission source (in other words the brake caliper) to the sampling location should be defined in dependency of the diameter d of the exhaust duct, which acts as a dilution tunnel. According to the GRPE-48-11 regulation (with l = 10 − 20 × d), the sampling location is defined as l = 14 × D. Moreover, it is worthwhile to be mentioned that a sophisticated housing around the brake system (foundation brake) is installed. This allows a direct airflow around the brake and helps to avoid particle losses inside the test chamber (see also
Section 1).
The particle number concentration PNC is characterized for the complete measurement campaign by a MEXA 2000 SPCS system. It is a modified version to detect sub-23 nm particles in the range between 10 and 2.5 µm.
For the entire measurement campaign, the already introduced novel-WLTP test cycle was used to be in line with the recommendations from the PMP IWG Non-Exhaust Emissions.
Finally, the subjects of the investigations are introduced. The authors selected a 19″ front axle brake system with a six-piston fixed caliper made of aluminum. Serial production friction couples are used. They consist of a gray-cast iron brake rotor. In terms of the brake lining, a low-steel lining material, which is copper free (low steel) is used. Additionally, a second brake pad composition is considered, namely a copper-free NAO material (NAO). Those two formulations represent the worldwide majority of brake lining materials.
Since the temperature characteristics are relevant for tribological and emission testing, two different measurement locations are selected. The first one considers a thermocouple that is embedded in the rubbing ring of the brake disc. The second one means a thermocouple integrated in the friction lining, close to the friction zone.
3. Results
3.1. Impact of Bedding
Friction couples of foundation brake systems require a sophisticated run in, the so-called bedding, before they can be used adequately and reveal their proper characteristics. From the tribological point of view, it means that the coefficient of friction (COF) is stabilized after the bedding. For emission testing, the cumulative particle number concentration should also indicate a certain saturation.
Hence, a new, unused friction couple (so-called green friction pair) was investigated. The study considers a low-steel brake lining in combination with a gray-cast iron brake disc and an inertia simulation of I = 105 kgm2.
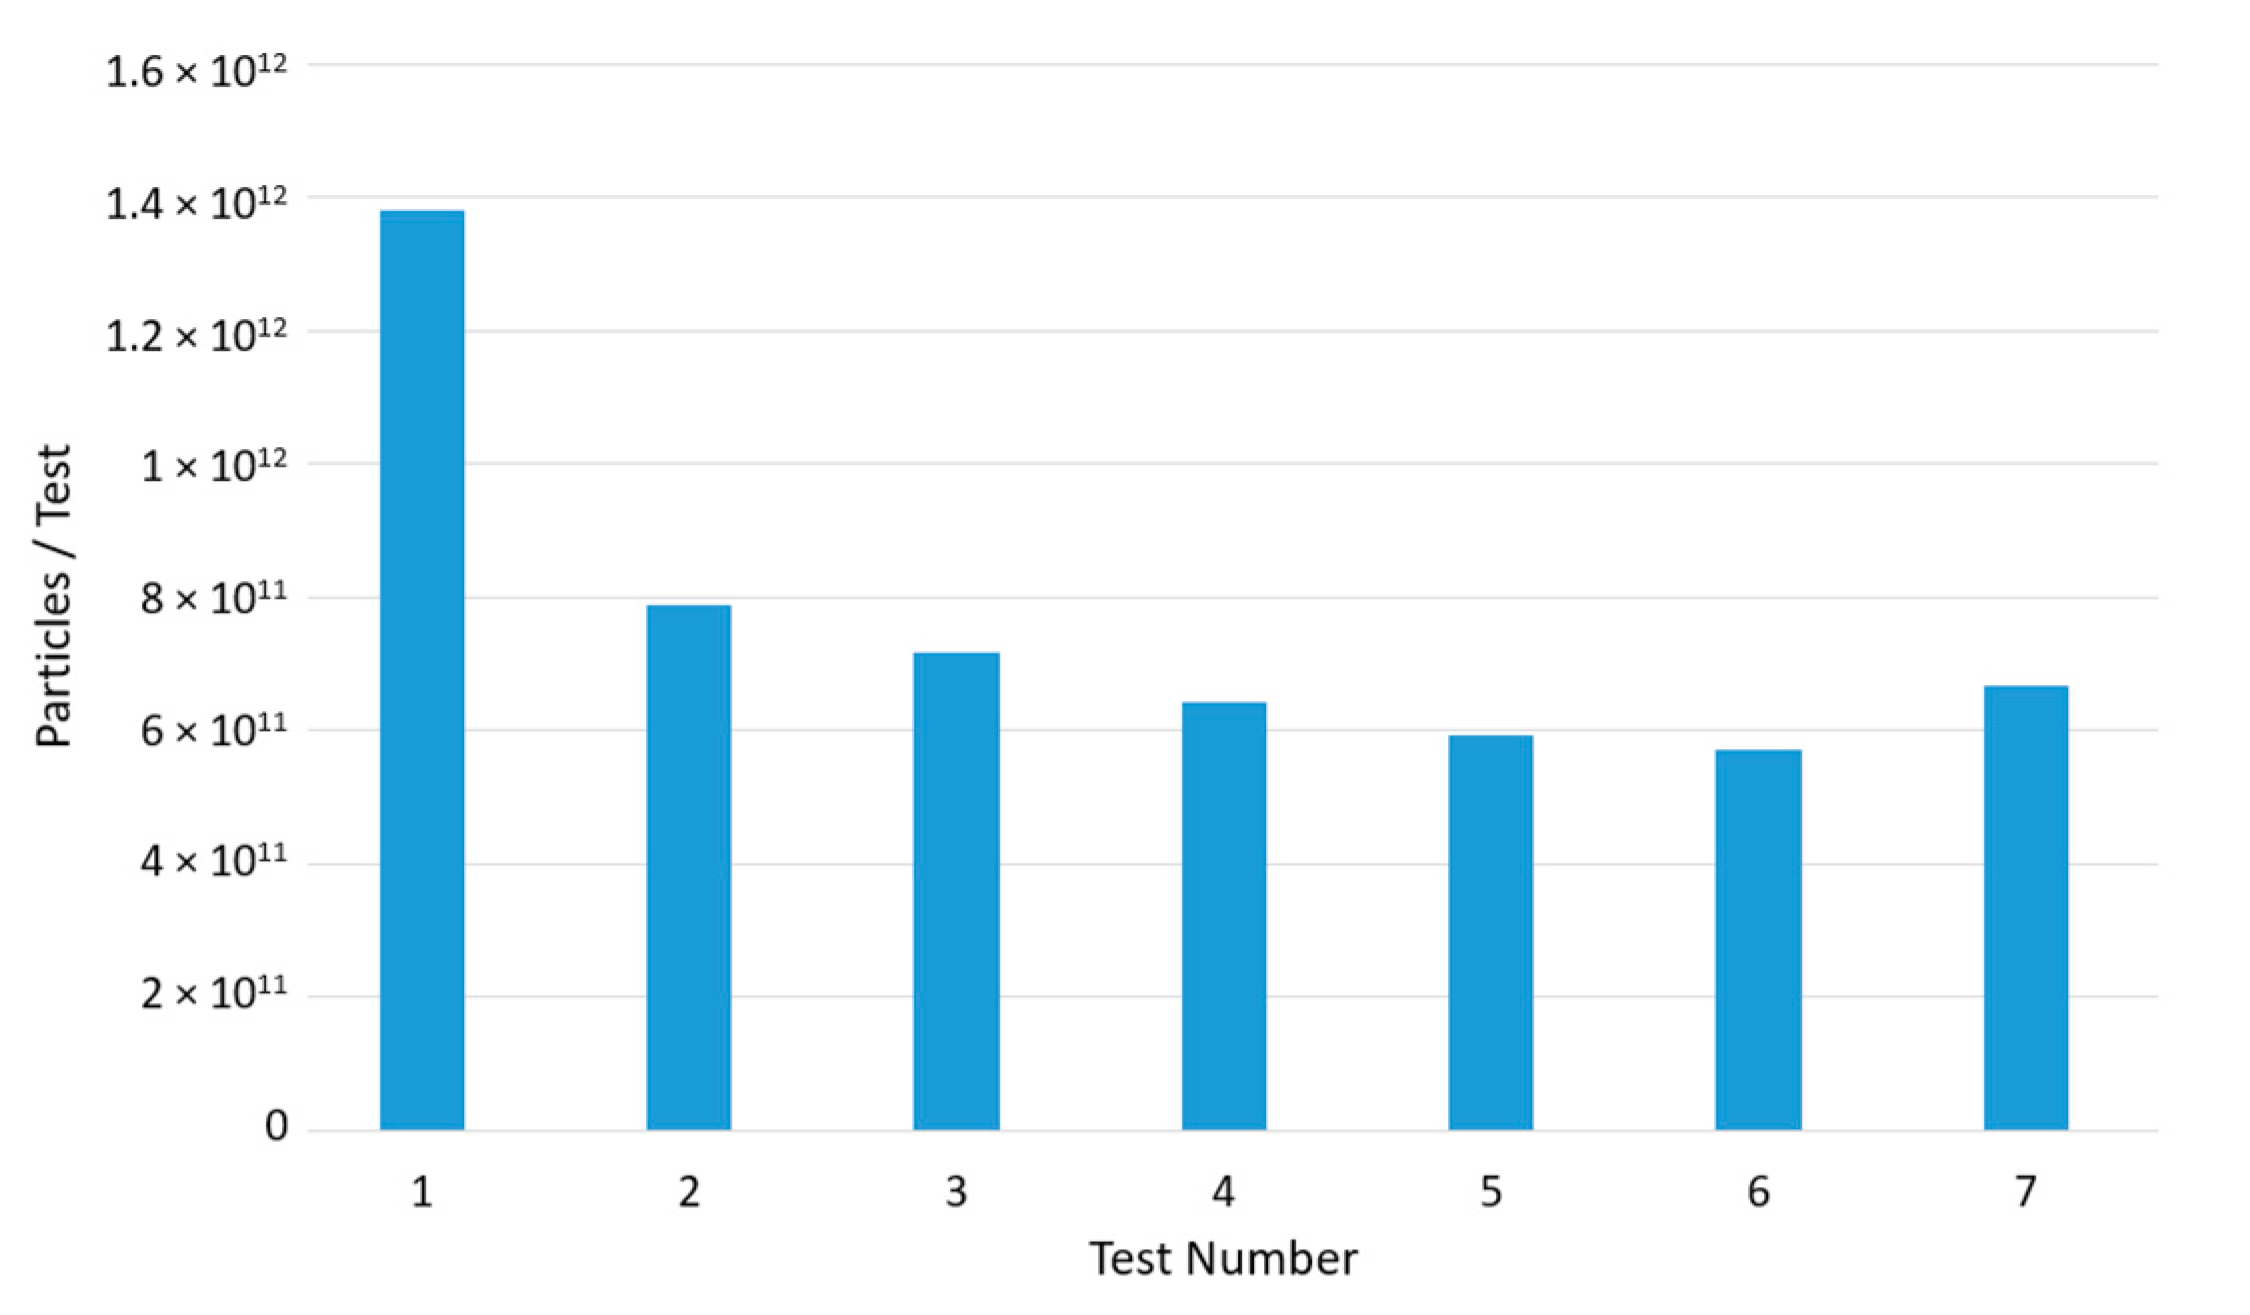
Figure 9 introduces the trend of cumulative particle number concentrations for a sequence of several test cycles. The diagram indicates clearly the impact and relevance of the bedding procedure, which is in this example the same cycle that is used for emission testing. After three runs of the novel-WLTP cycle, a saturation of the emissions can be stated.
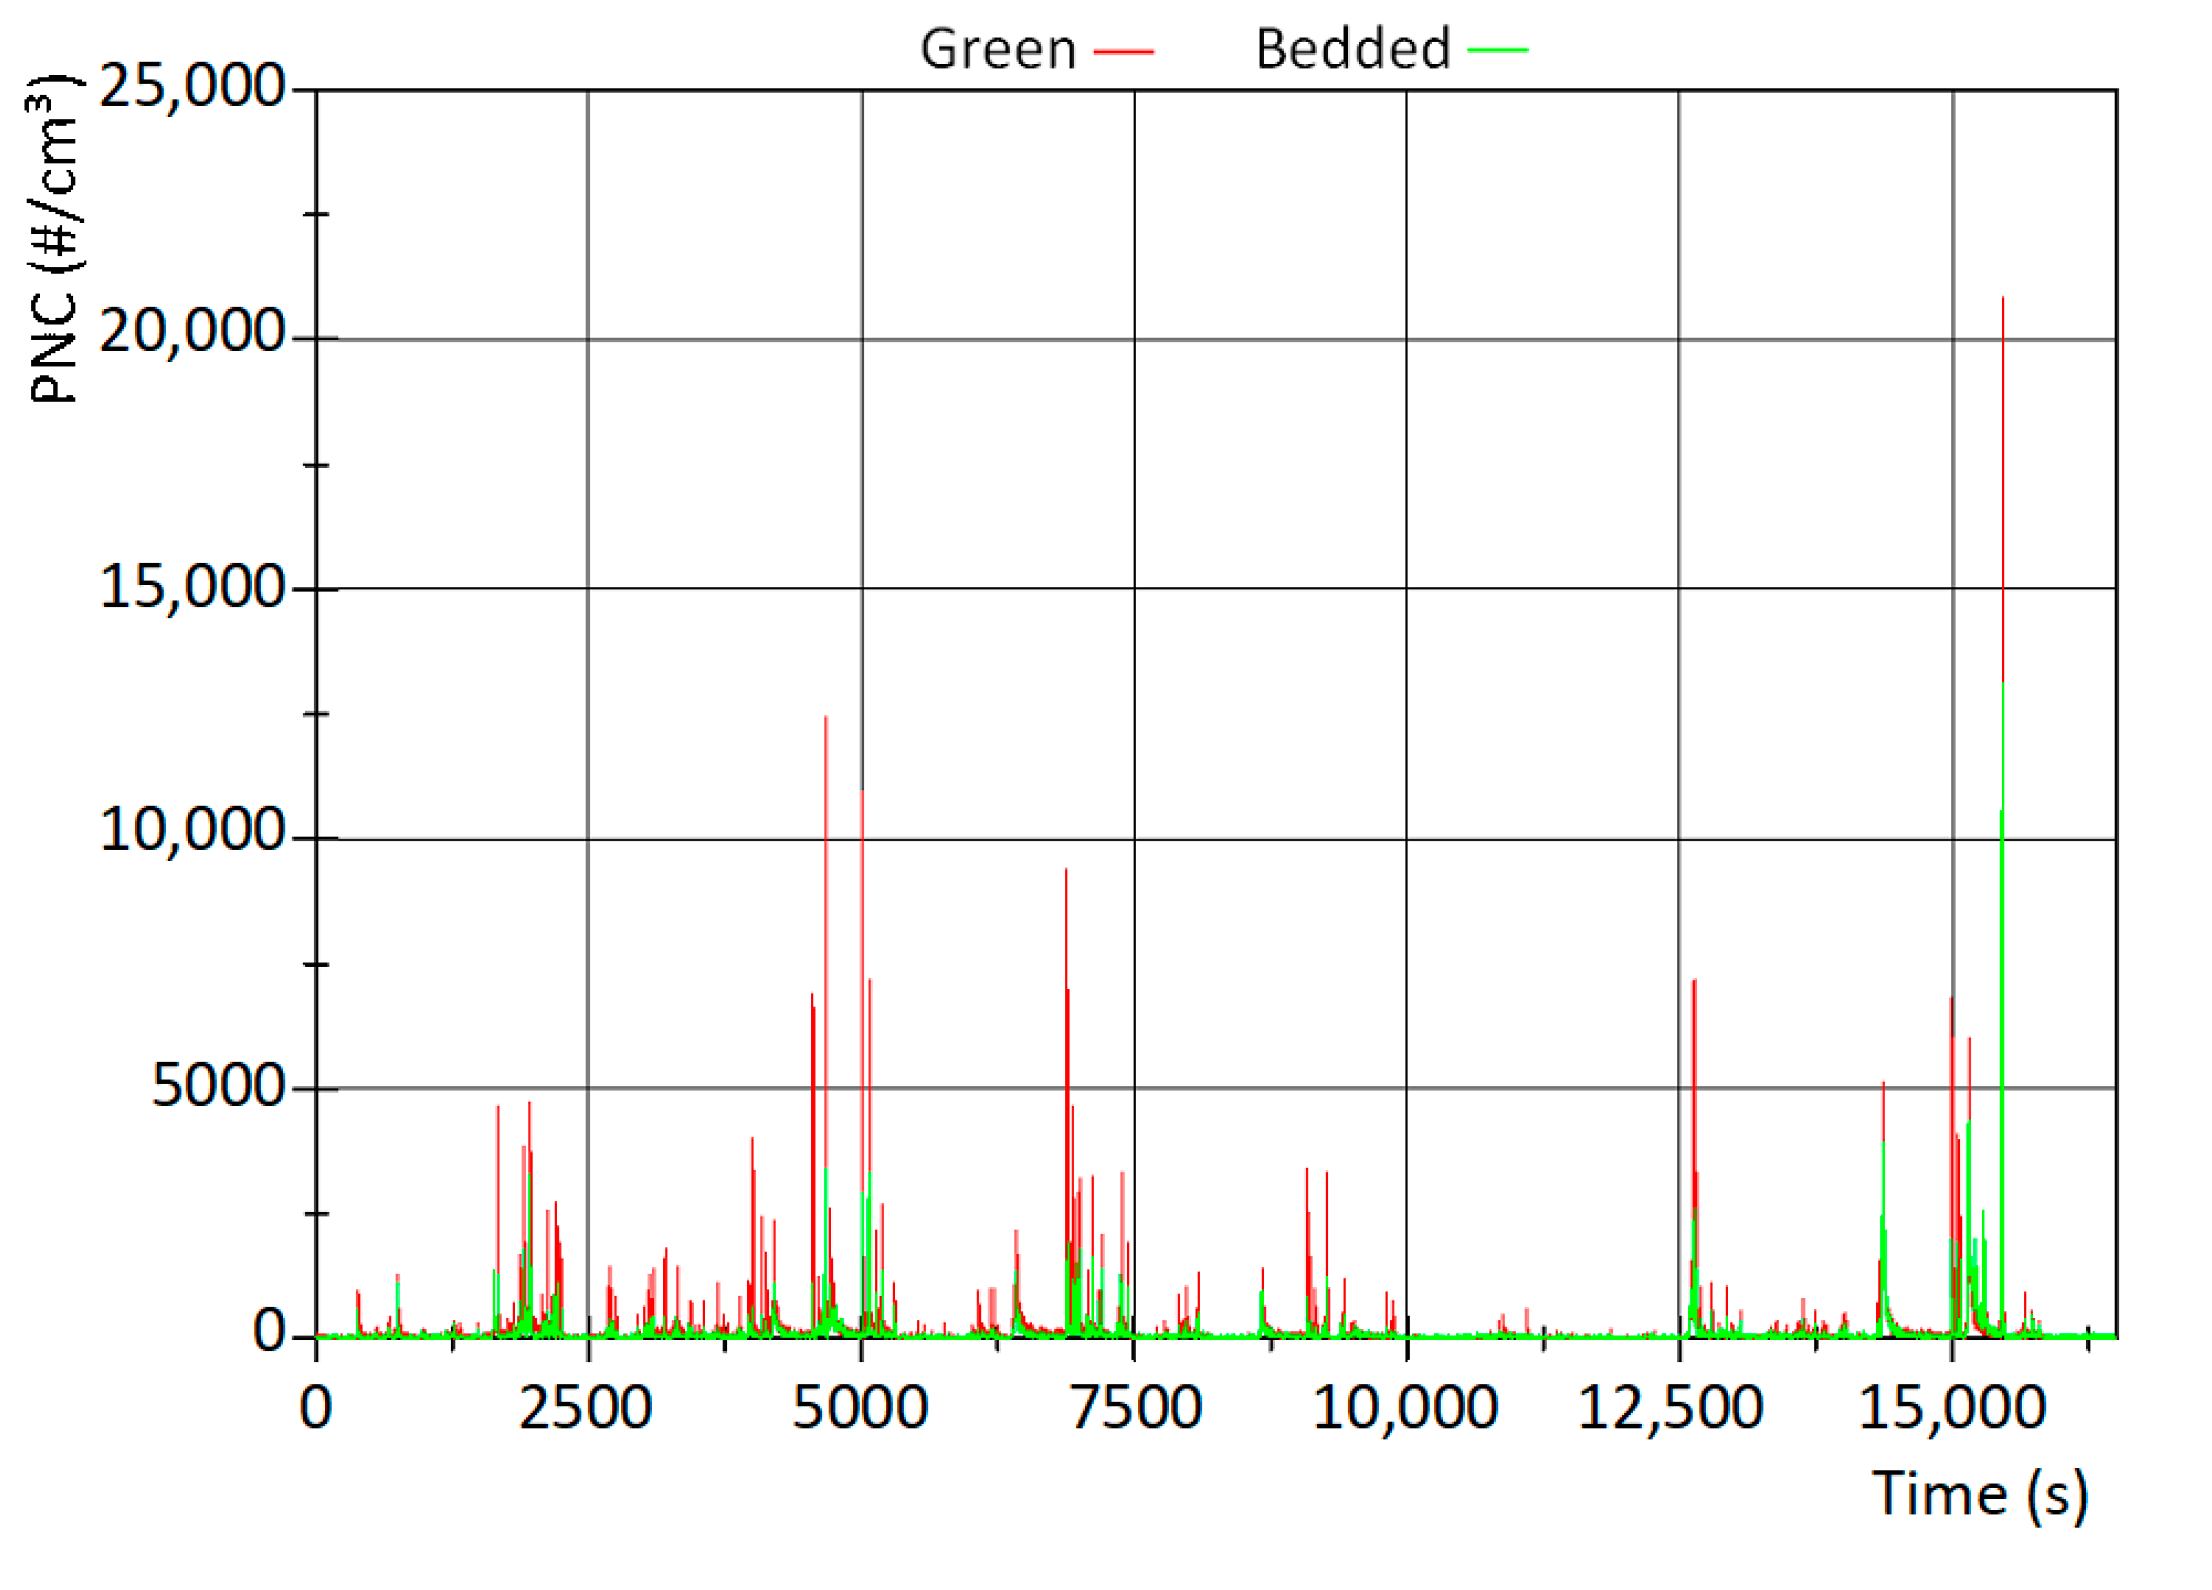
Figure 10 gives an overview of the time history of the particle number concentration for the entire cycle, the tribological conditions “green” and “bedded” are compared.
Thanks to this diagram, one can easily understand that emission peaks for the entire cycle are significantly higher for the new friction couple than for the bedded one. However, a more detailed picture is given by
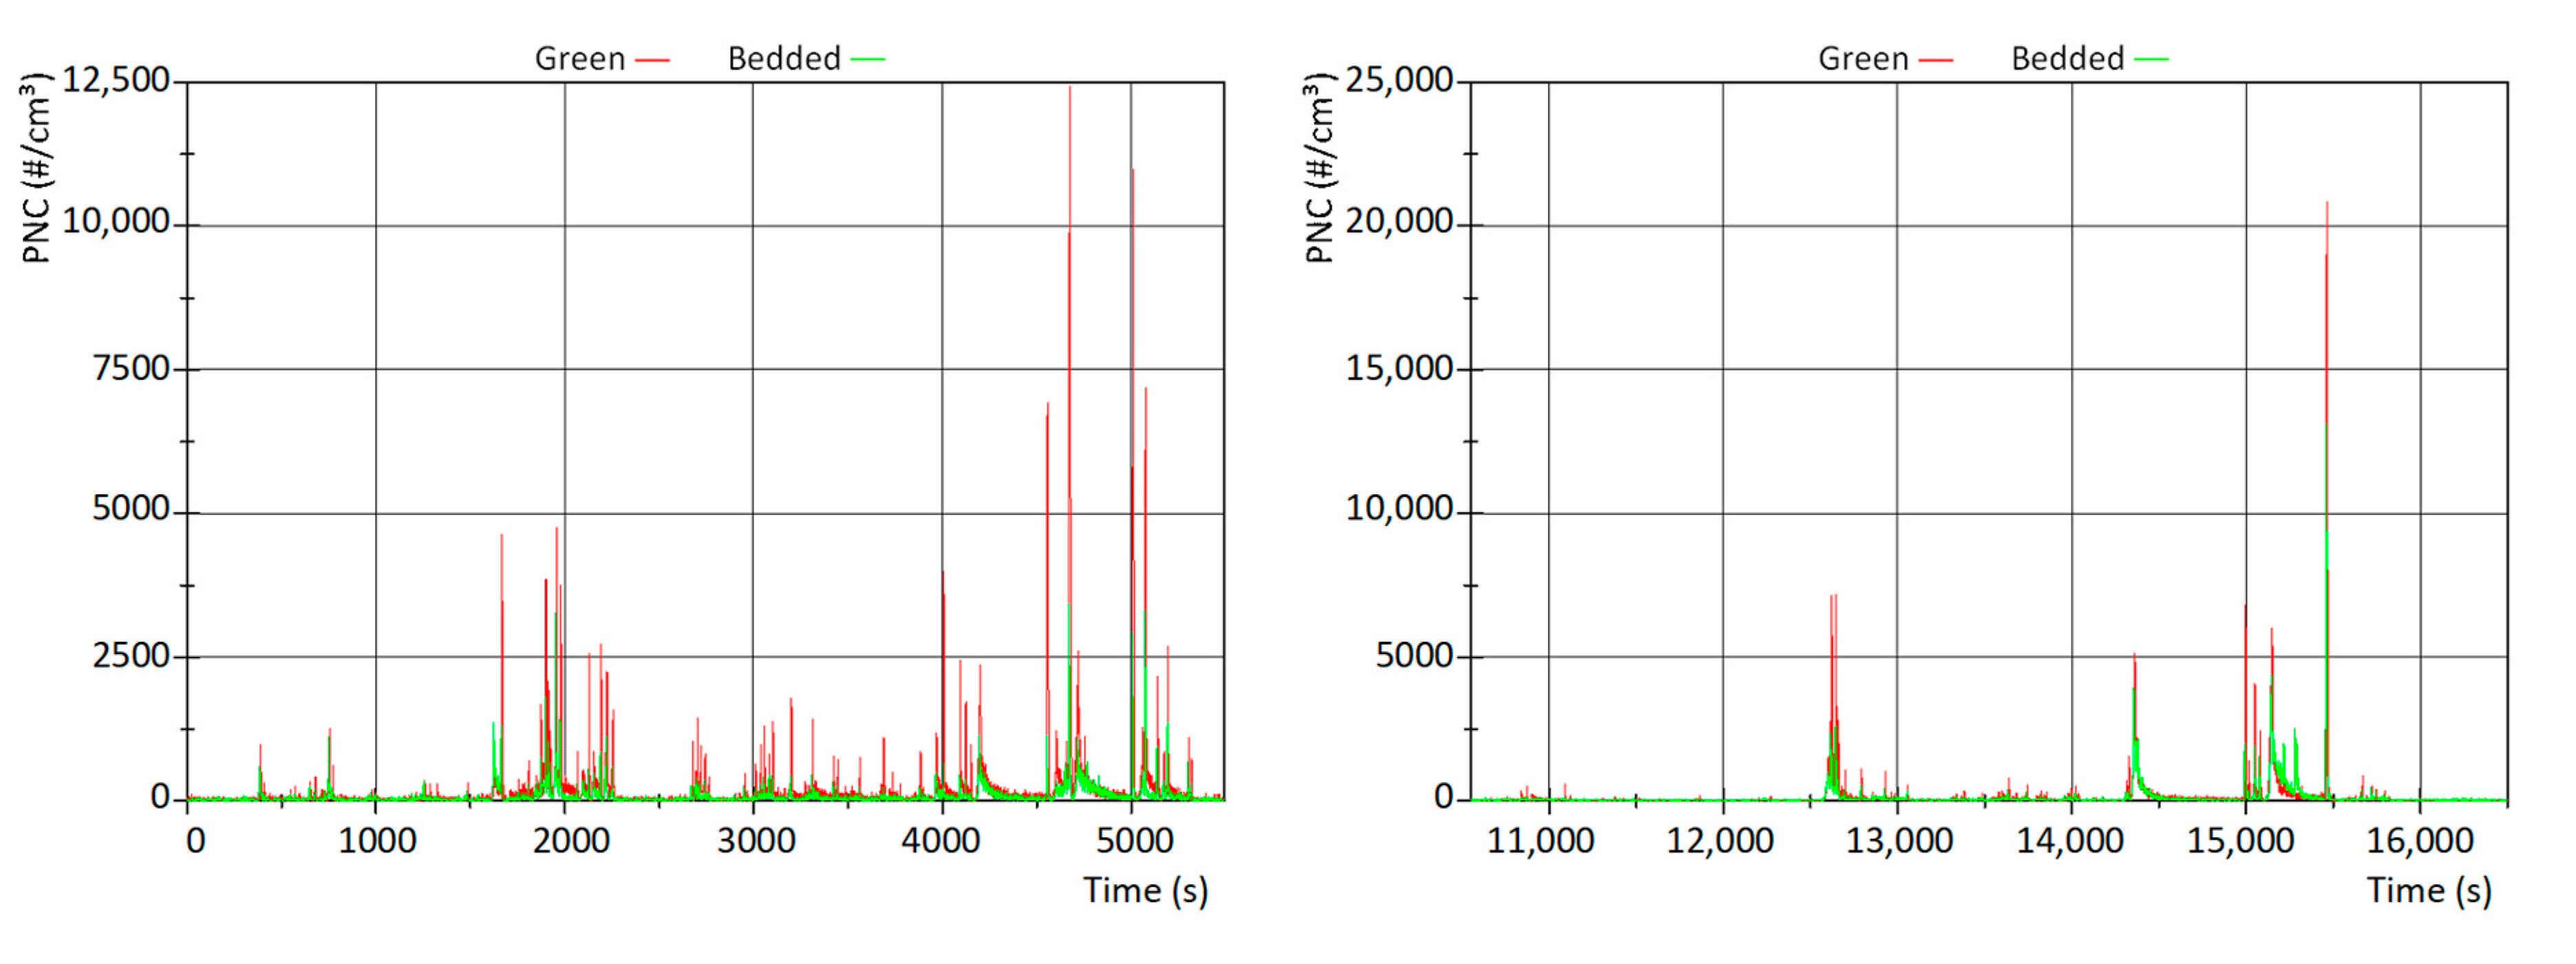
Figure 11.
During the initial phase of the cycle (Trips 1–4) the “green” friction pair indicates significant peaks for many single brake applications, a very good signal-to-noise-ratio (SNR) can be confirmed. The bedded couple meanwhile reveals a much lower emission level and for low load brake applications (in the middle region of the left diagram) single emission peaks are hardly detectable, the SNR is much lower.
A similar picture is given by the analysis of Trip 10, the test sequence with the highest load during the novel-WLTP cycle. Interestingly, the bedded couple reveals also a higher peak where no brake actuation takes place and the green pair does not show a peak at all. The phenomenon is linked to the so-called reservoir dynamics, which will be discussed in
Section 3.4 in more detail.
Tribology and emissions are directly linked to the thermal behavior in the friction zone.
Figure 12 indicates the temperature history of the brake disc (left) and the brake lining (right). Even if the emissions of the “green” and “bedded” couple vary, the temperature levels are very similar and do not reveal relevant deviations. This underlines the importance of the friction surface condition and reveals that the temperature history is obviously not a sophisticated indicator for a bedded friction state.
3.2. Impact of Brake Lining Composition
Even if modern foundation brake systems of passenger cars consider a gray-cast iron brake disc as one part of the friction couple, different brake lining compositions exist. The two most important categories are low-steel pads (also known as “ECE”, since they are developed and produced mostly for the European market) and non-asbestos organics (NAO), which are mainly designed for the North American and Asian markets. Amongst others, these two material concepts can be distinguished by the fraction of metallic components: low steels own a significant fraction of iron contents, while NAOs usually go without.
In this example, a low steel and NAO serial production brake lining of the same dimensions are part of the investigation. Before the testing, both samples were bedded to ensure a saturated and stabilized emission behavior.
As a first result, the cumulative particle number concentration for the low steel is 5.9 × 10¹¹ #/test while the NAO performs with 1.5 × 10¹¹ #/test significantly better.
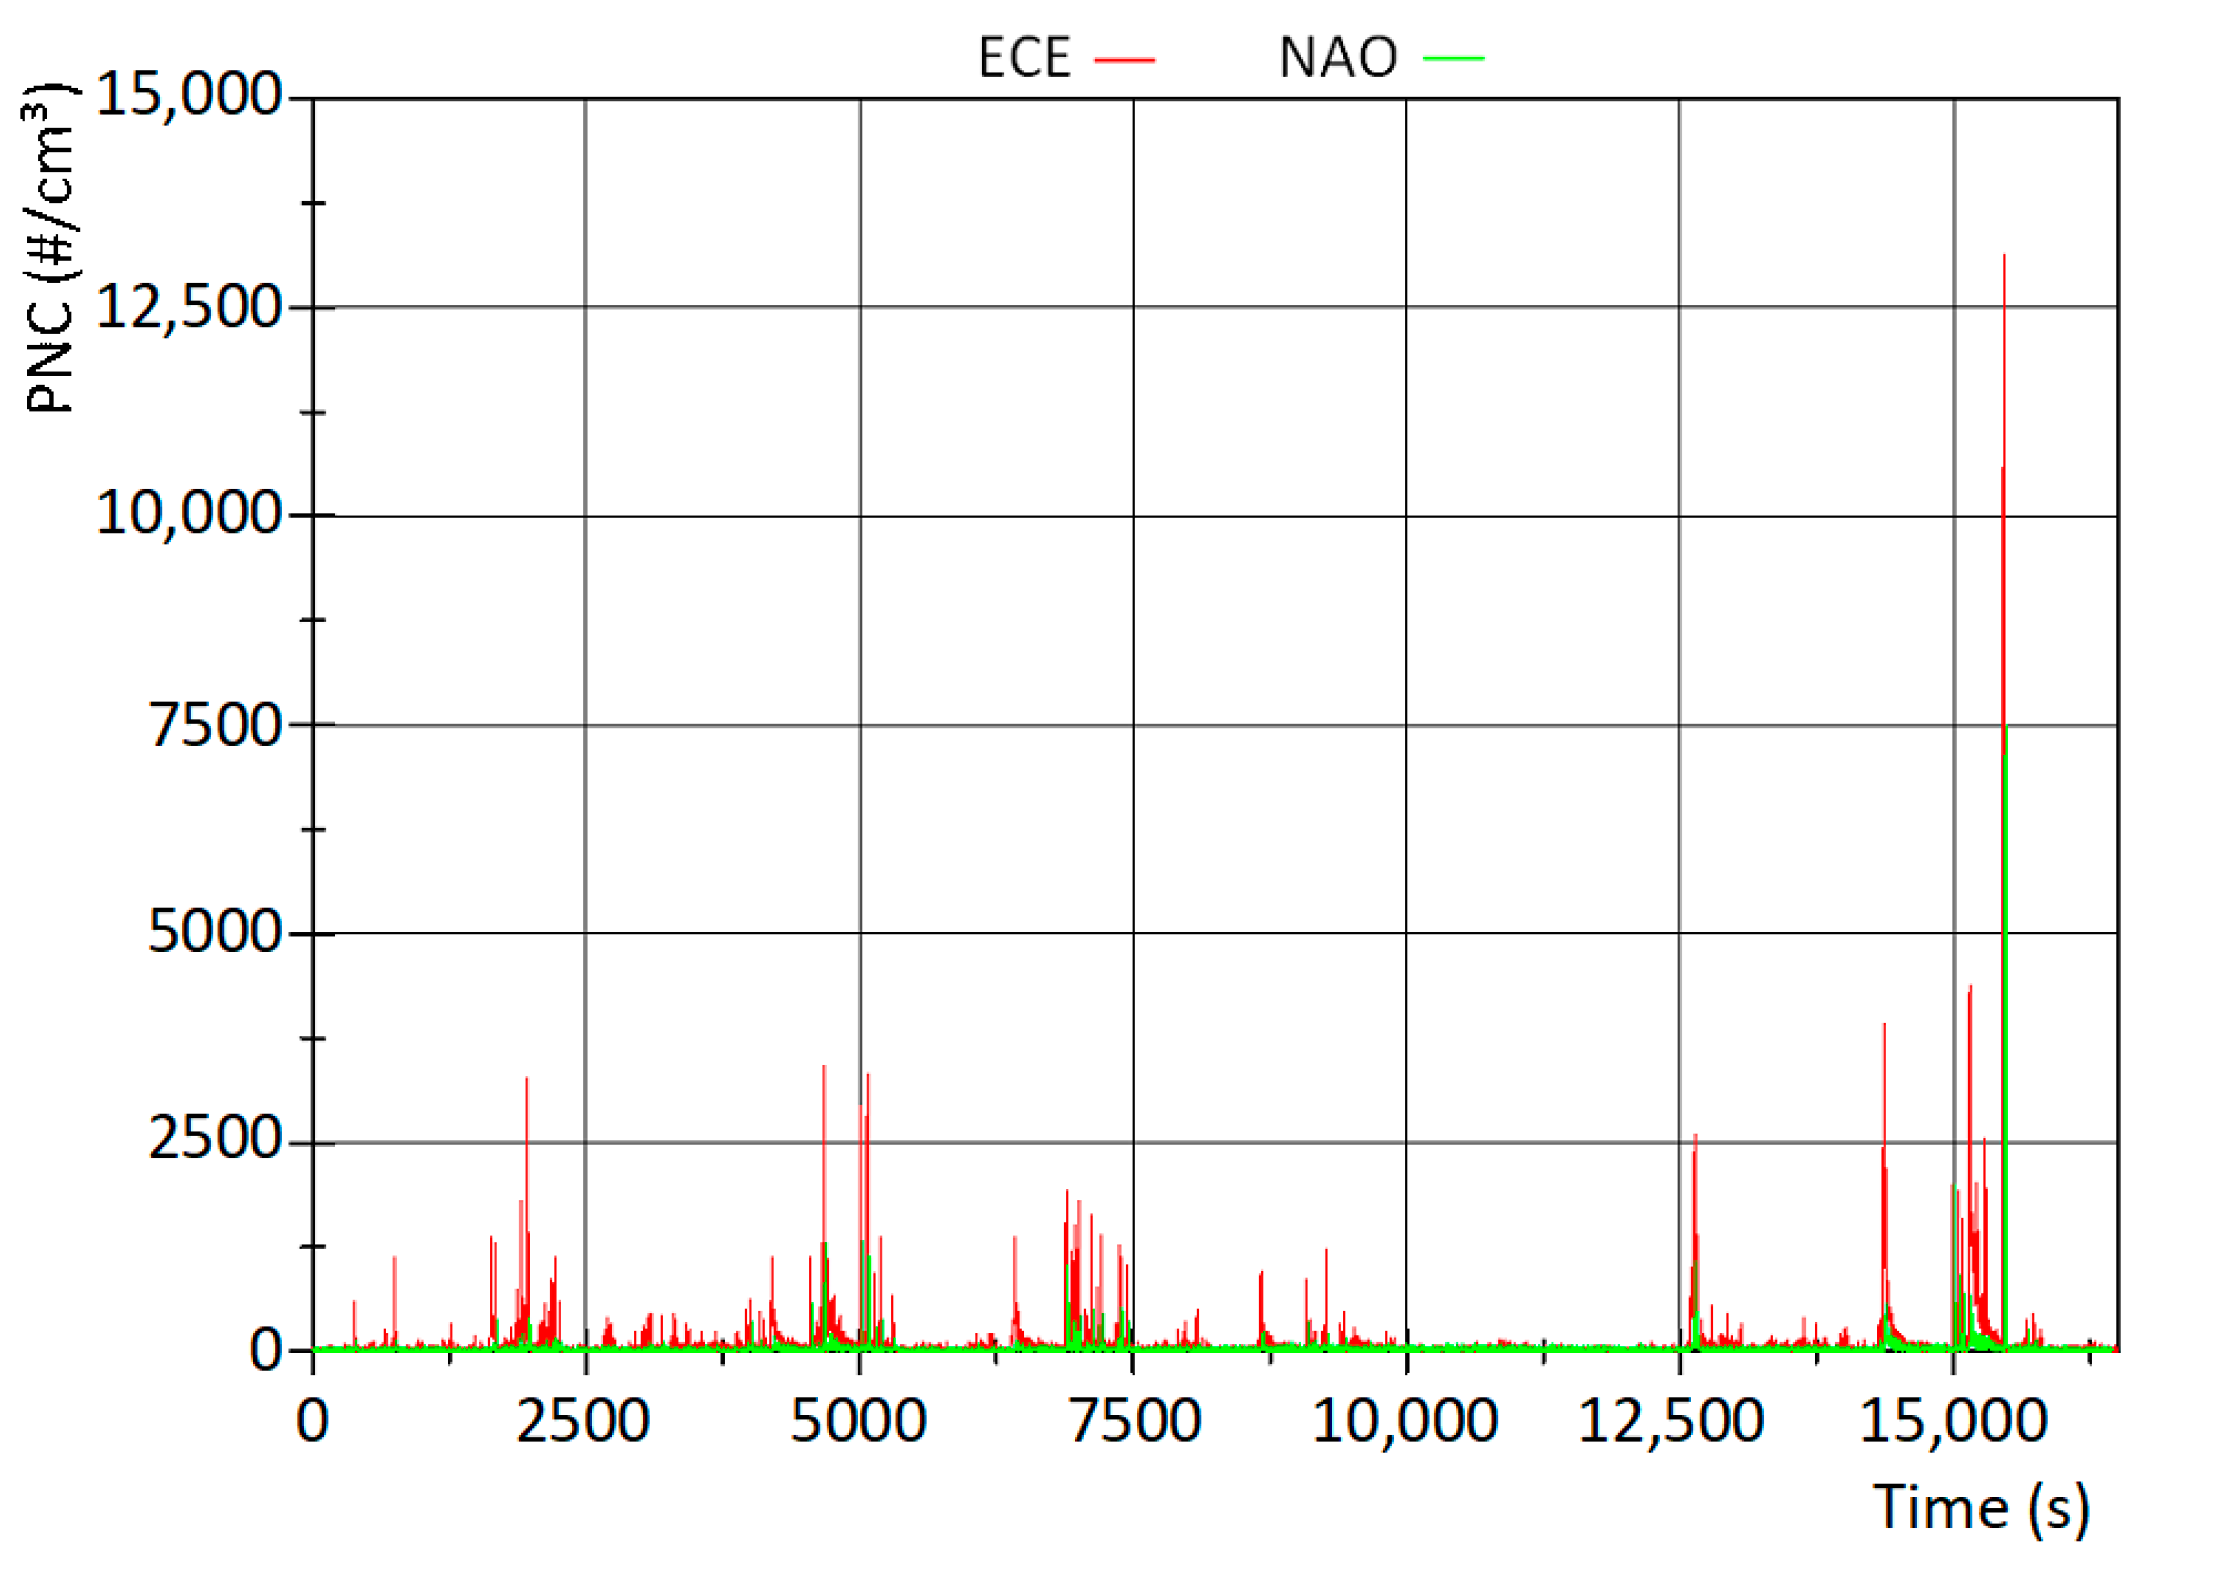
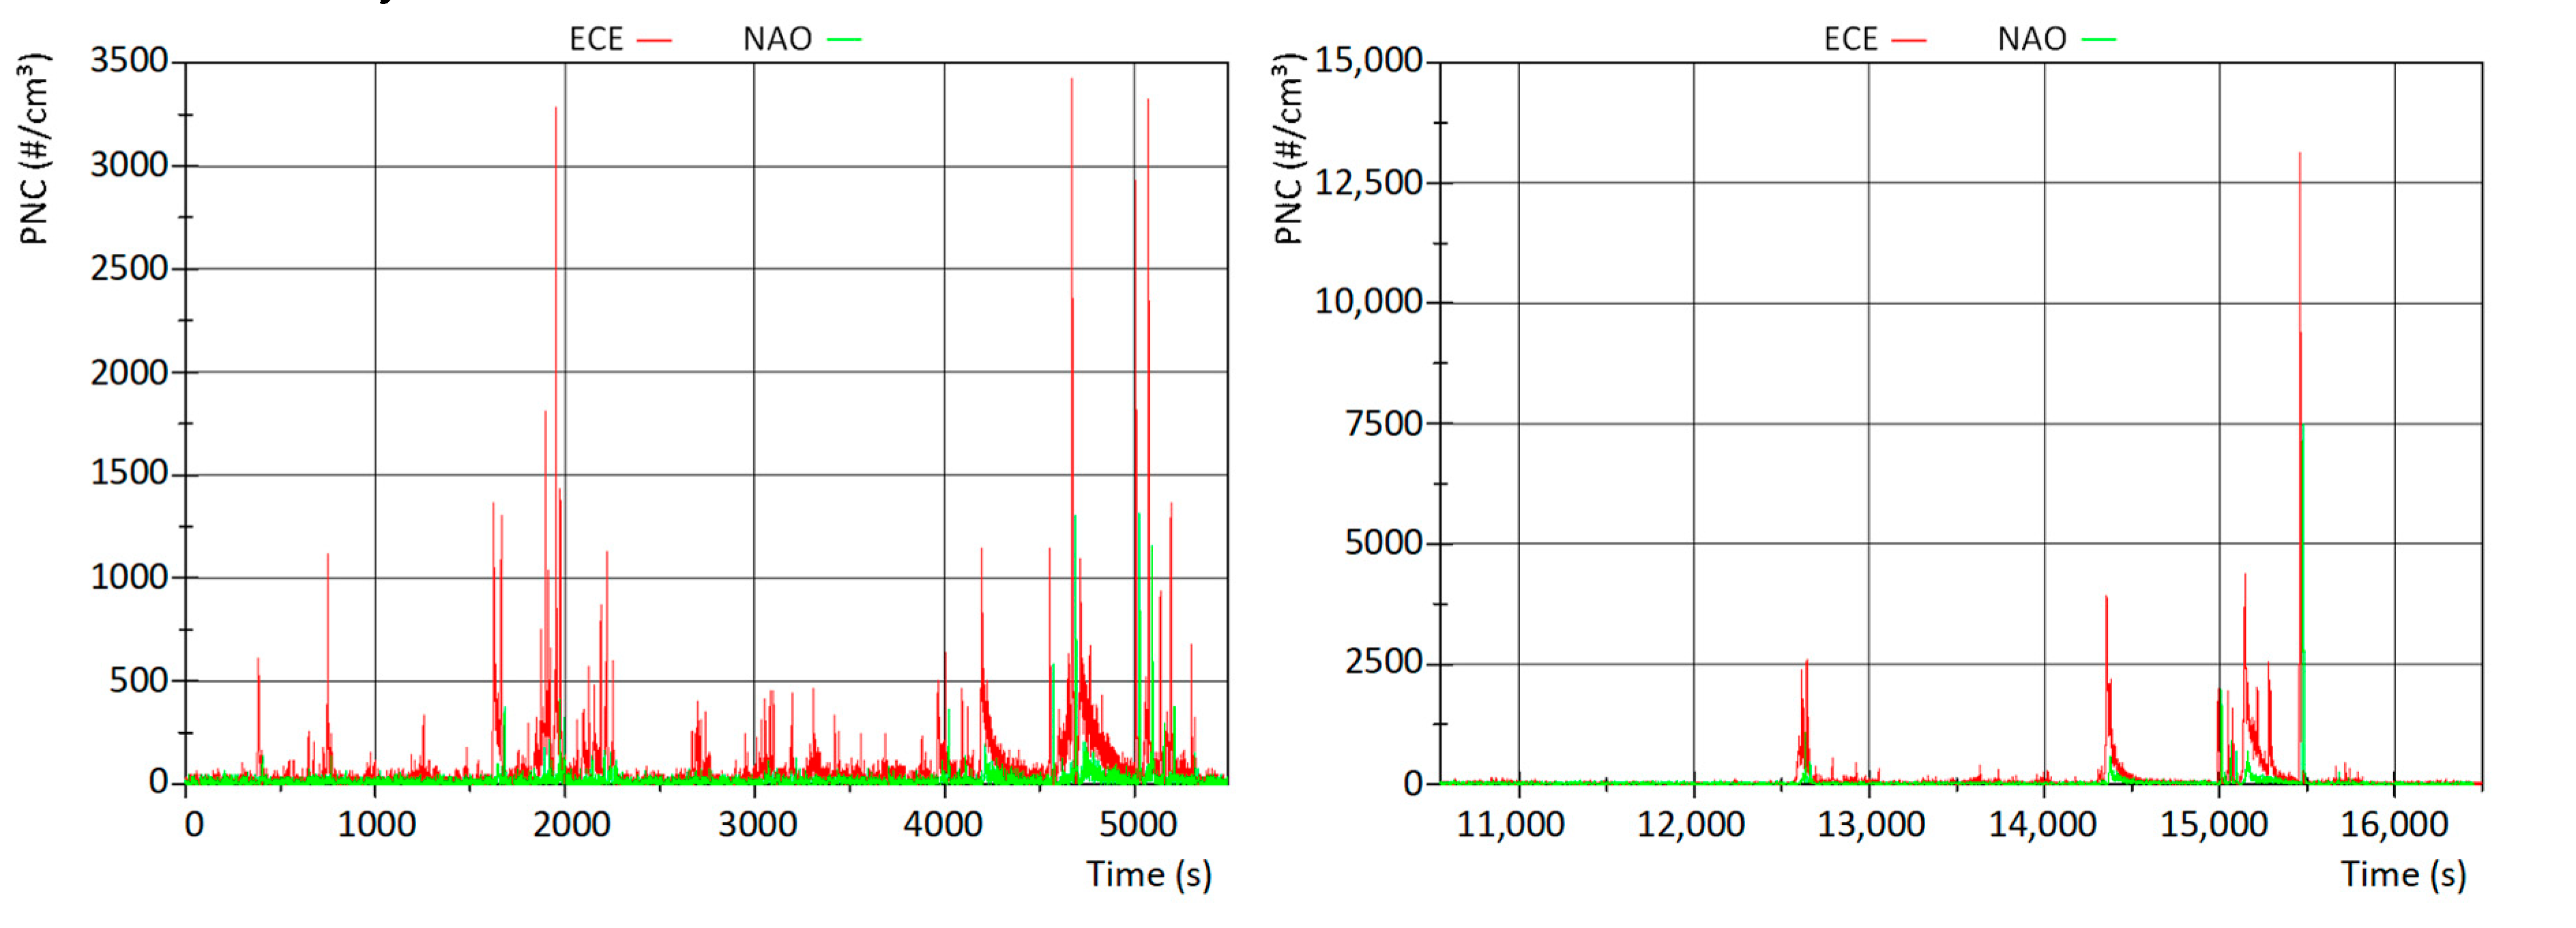
Figure 13 gives an insight into the time history of the emission level during the entire cycle. The diagram confirms the good performance of the NAO, which shows a much lower emission level during the entire test cycle.
A closer look to the first four trips of the cycle (
Figure 14, left) reveals clear peaks for the low-steel lining, meaning that the SNR is very good. The NAO shows only some minor peaks, the signal is dominated by noise.
Trip 10 (
Figure 14, right) confirms these statements, even if the SNR for the NAO improves. Due to the higher load requirements, the NAO shows also some clear peaks. Interestingly, even for the brake applications with the highest temperatures, the NAO remains on a lower emission level compared to the low-steel lining.
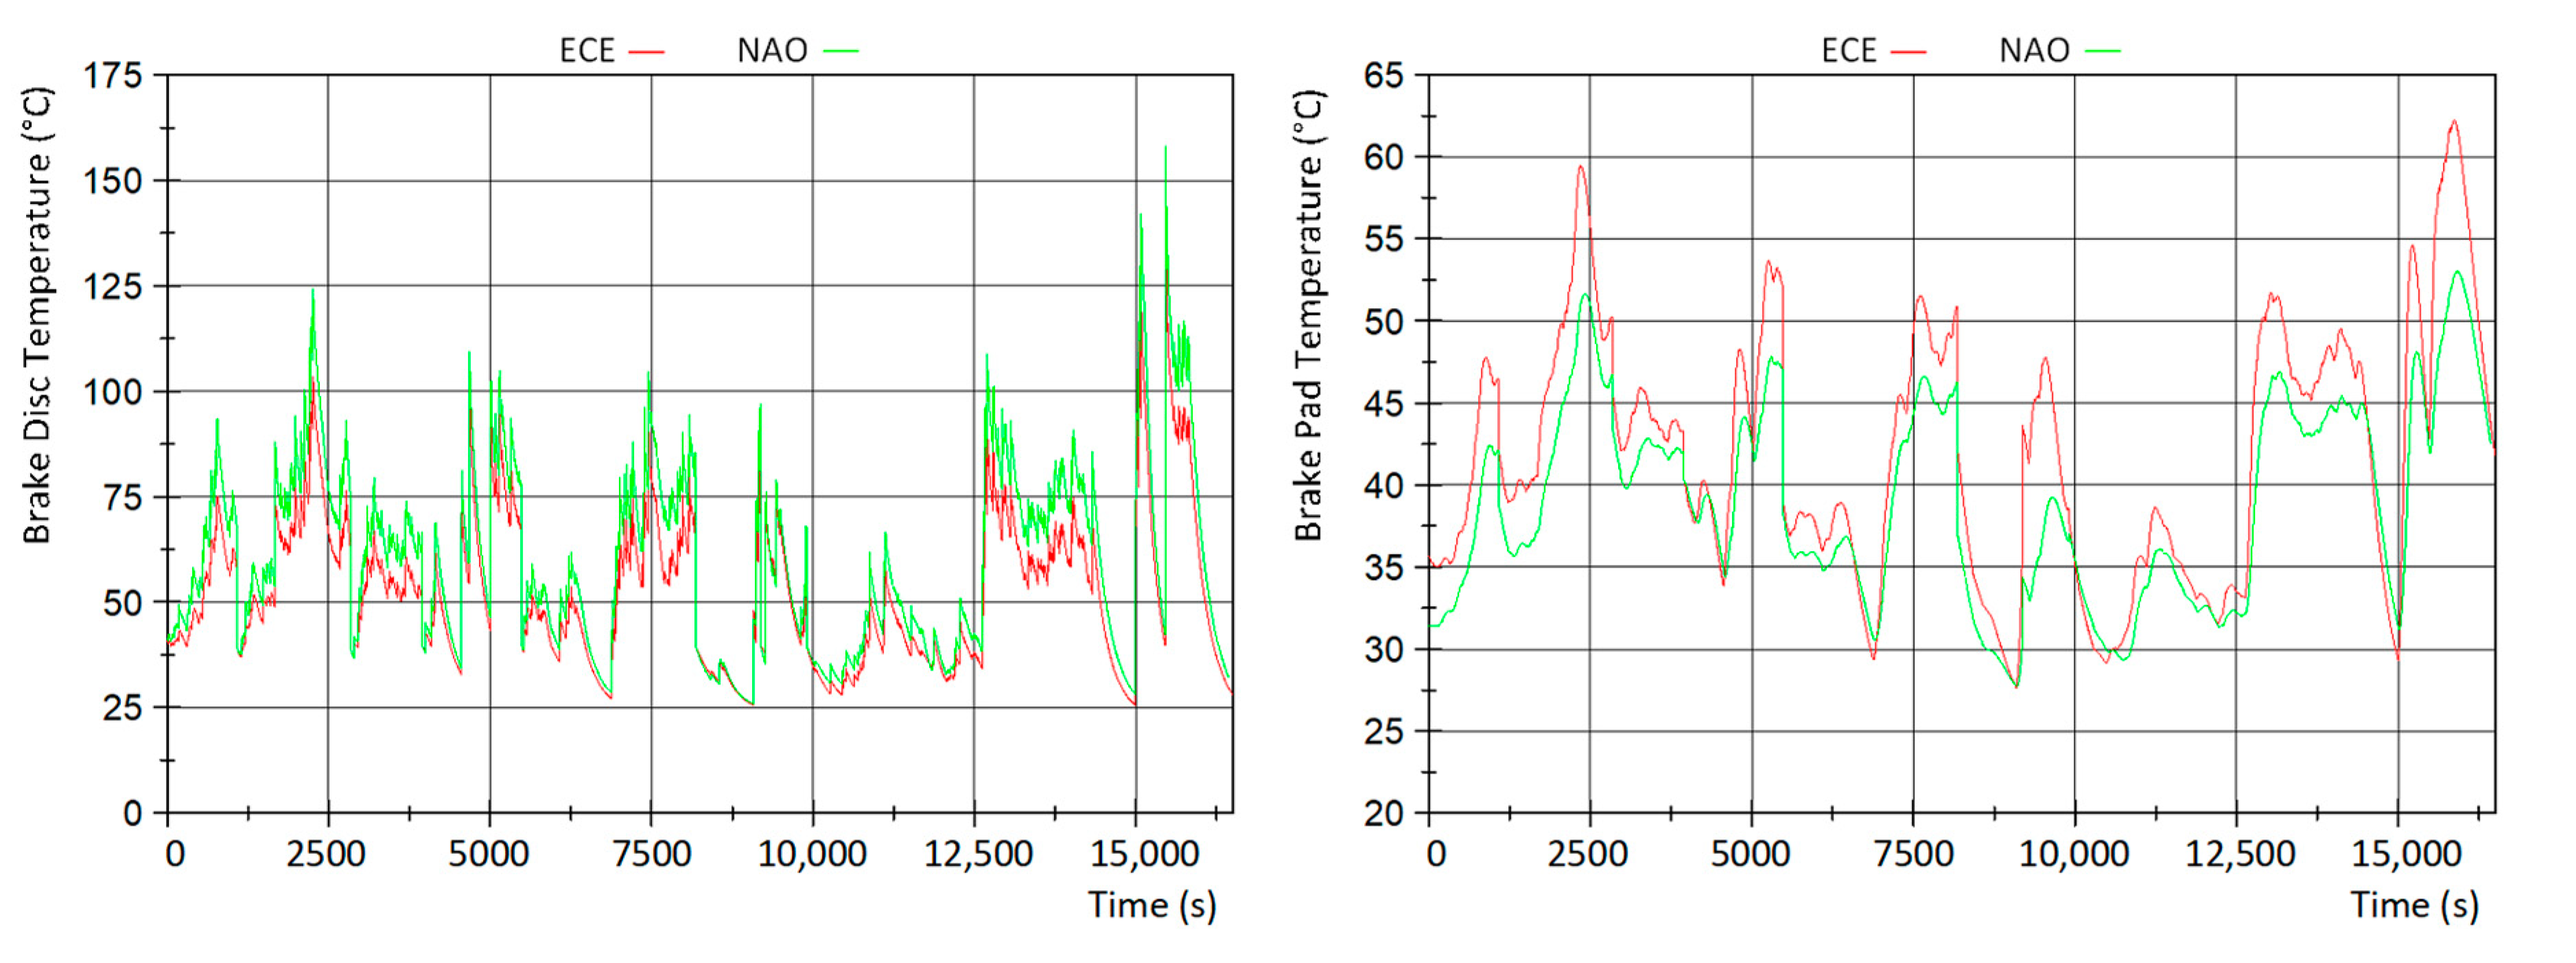
Figure 15 helps to understand the temperature characteristics in the friction zone. A clear trend that links the emissions with the temperature level is hard to find. While the disc temperature of the NAO is higher, the lining temperature is lower compared to the ECE lining. Hence, the emission level for both compositions is mostly dominated by the tribological mechanisms of the material concepts. The temperature plays only a minor role while using the novel-WLTP cycle.
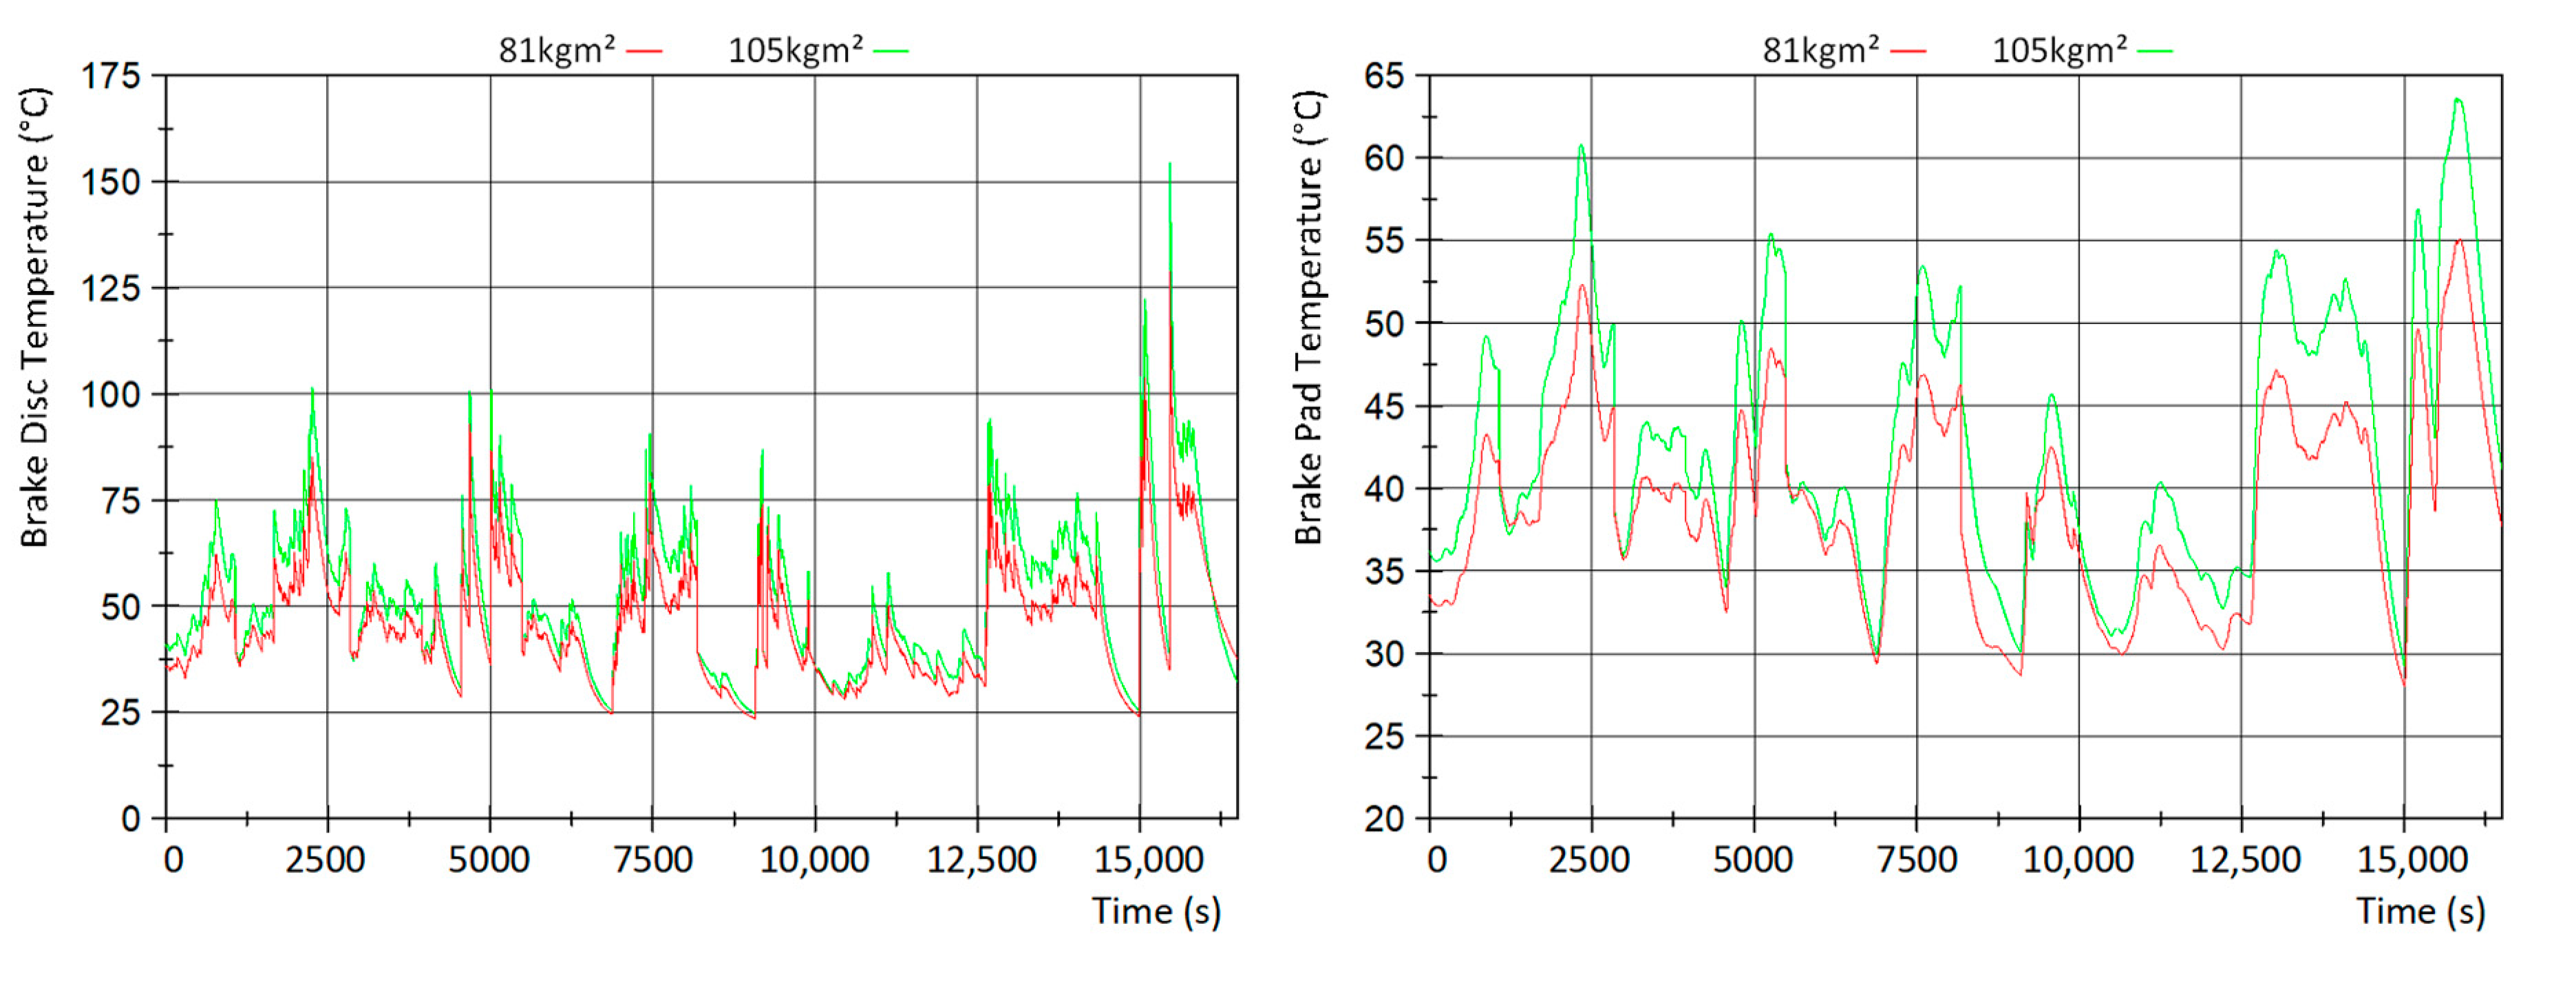
3.3. Impact of Inertia
Since modern passenger cars are designed according to a platform architecture approach, foundation brake configurations are used for various cars. Hence, different inertias (which represent the vehicle weight) can be considered for the same brake system. In particular, a low-steel lining material was selected and bedded in each case. Regarding the inertia variation, two cases are considered: I = 81 kgm2 (mid-size sedan) and I = 105 kgm2 (mid-size SUV).
The cumulative particle number concentration for the sedan can be stated with 3.6 × 10¹¹ #/test while for the higher inertia the concentration is 9.4 × 10¹¹ #/test.
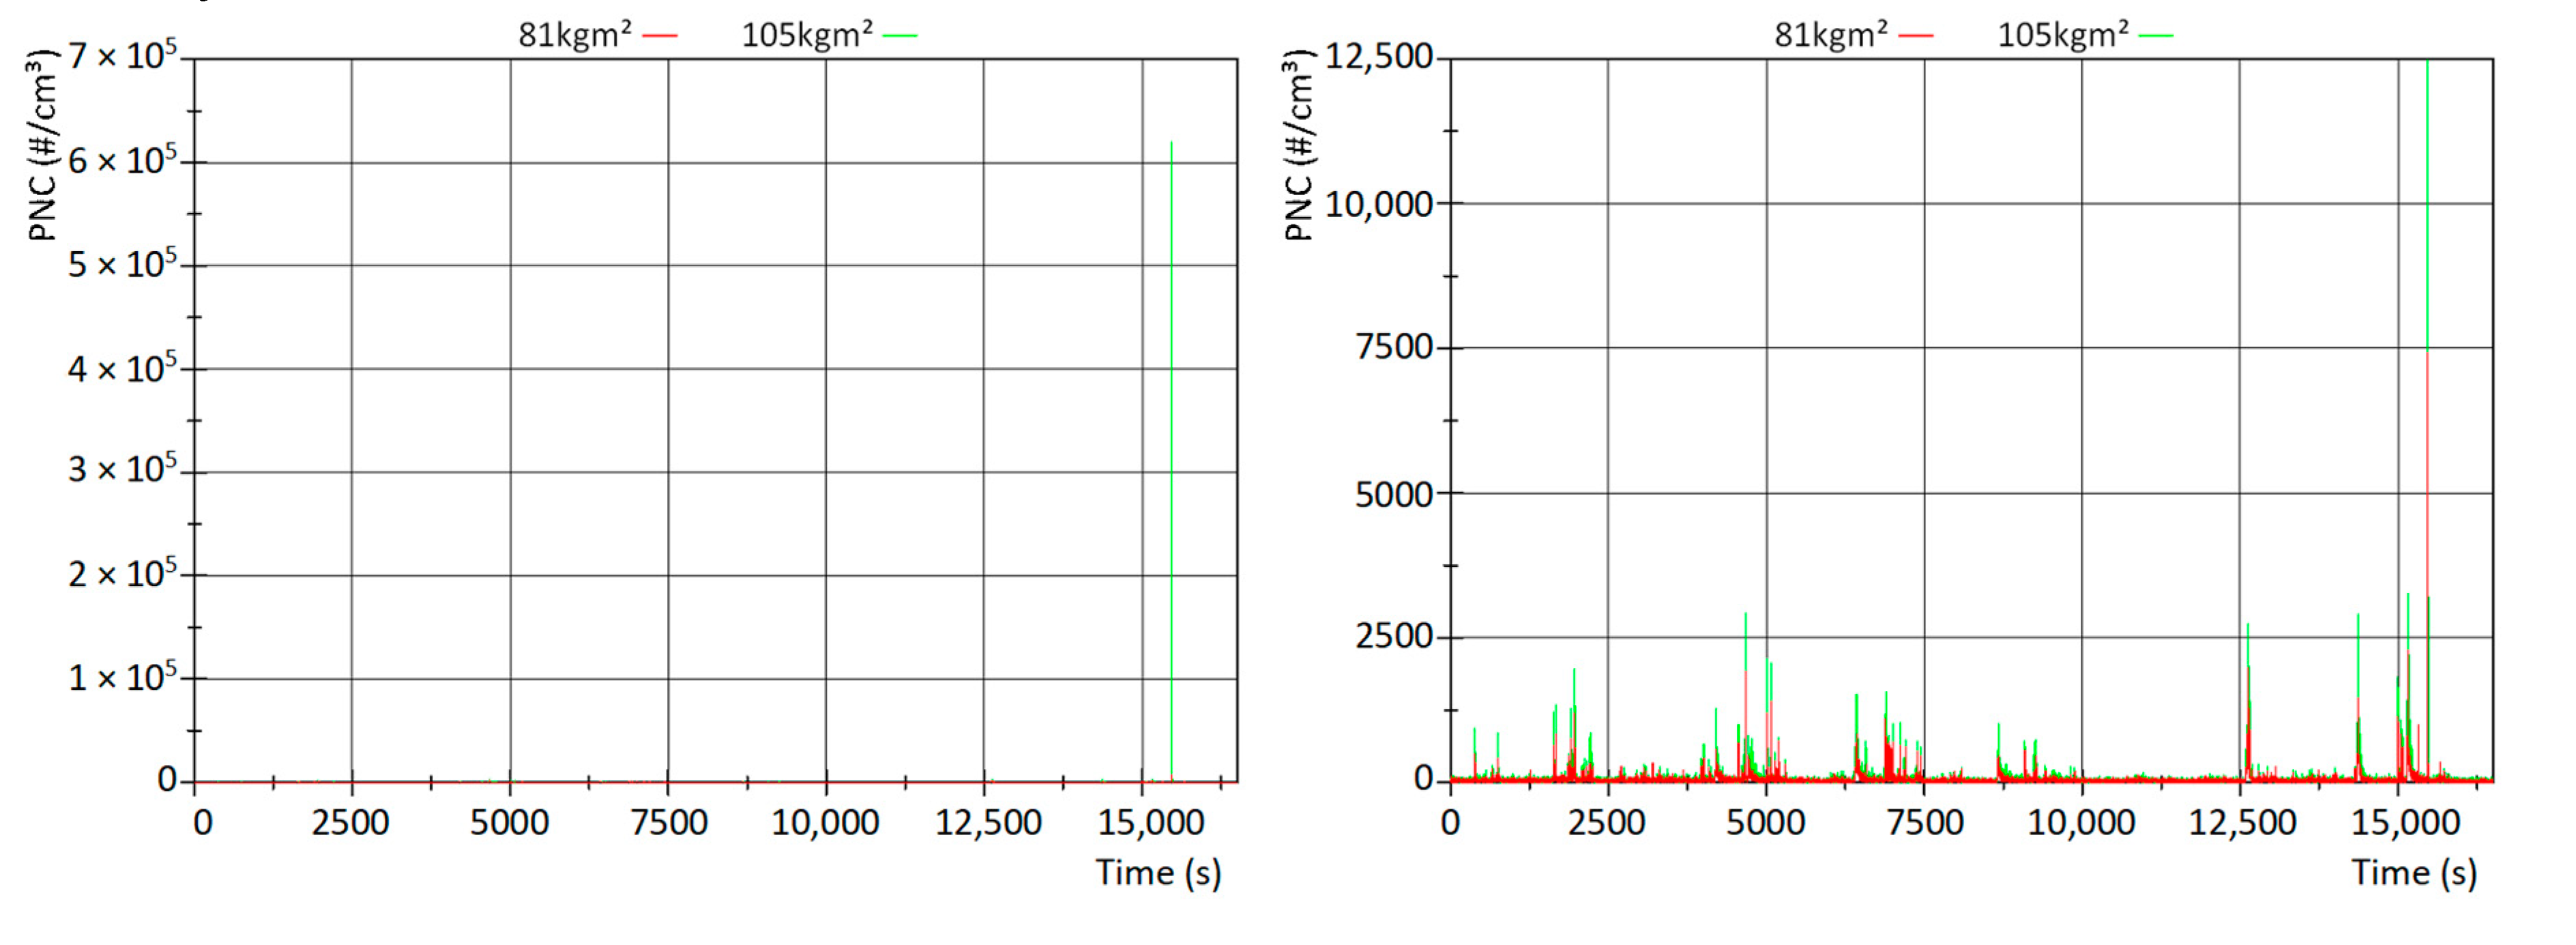
Figure 16 illustrates the emissions during the entire test cycle. It must be mentioned that the brake application with the highest load (Trip 10) shows a significant higher peak for the higher inertia (Fihure 16, left). Hence, the diagram scale is adjusted (
Figure 16, right) to give a better insight of the details. The comparison indicates clearly that the increased inertia leads to higher peaks during the entire cycle.
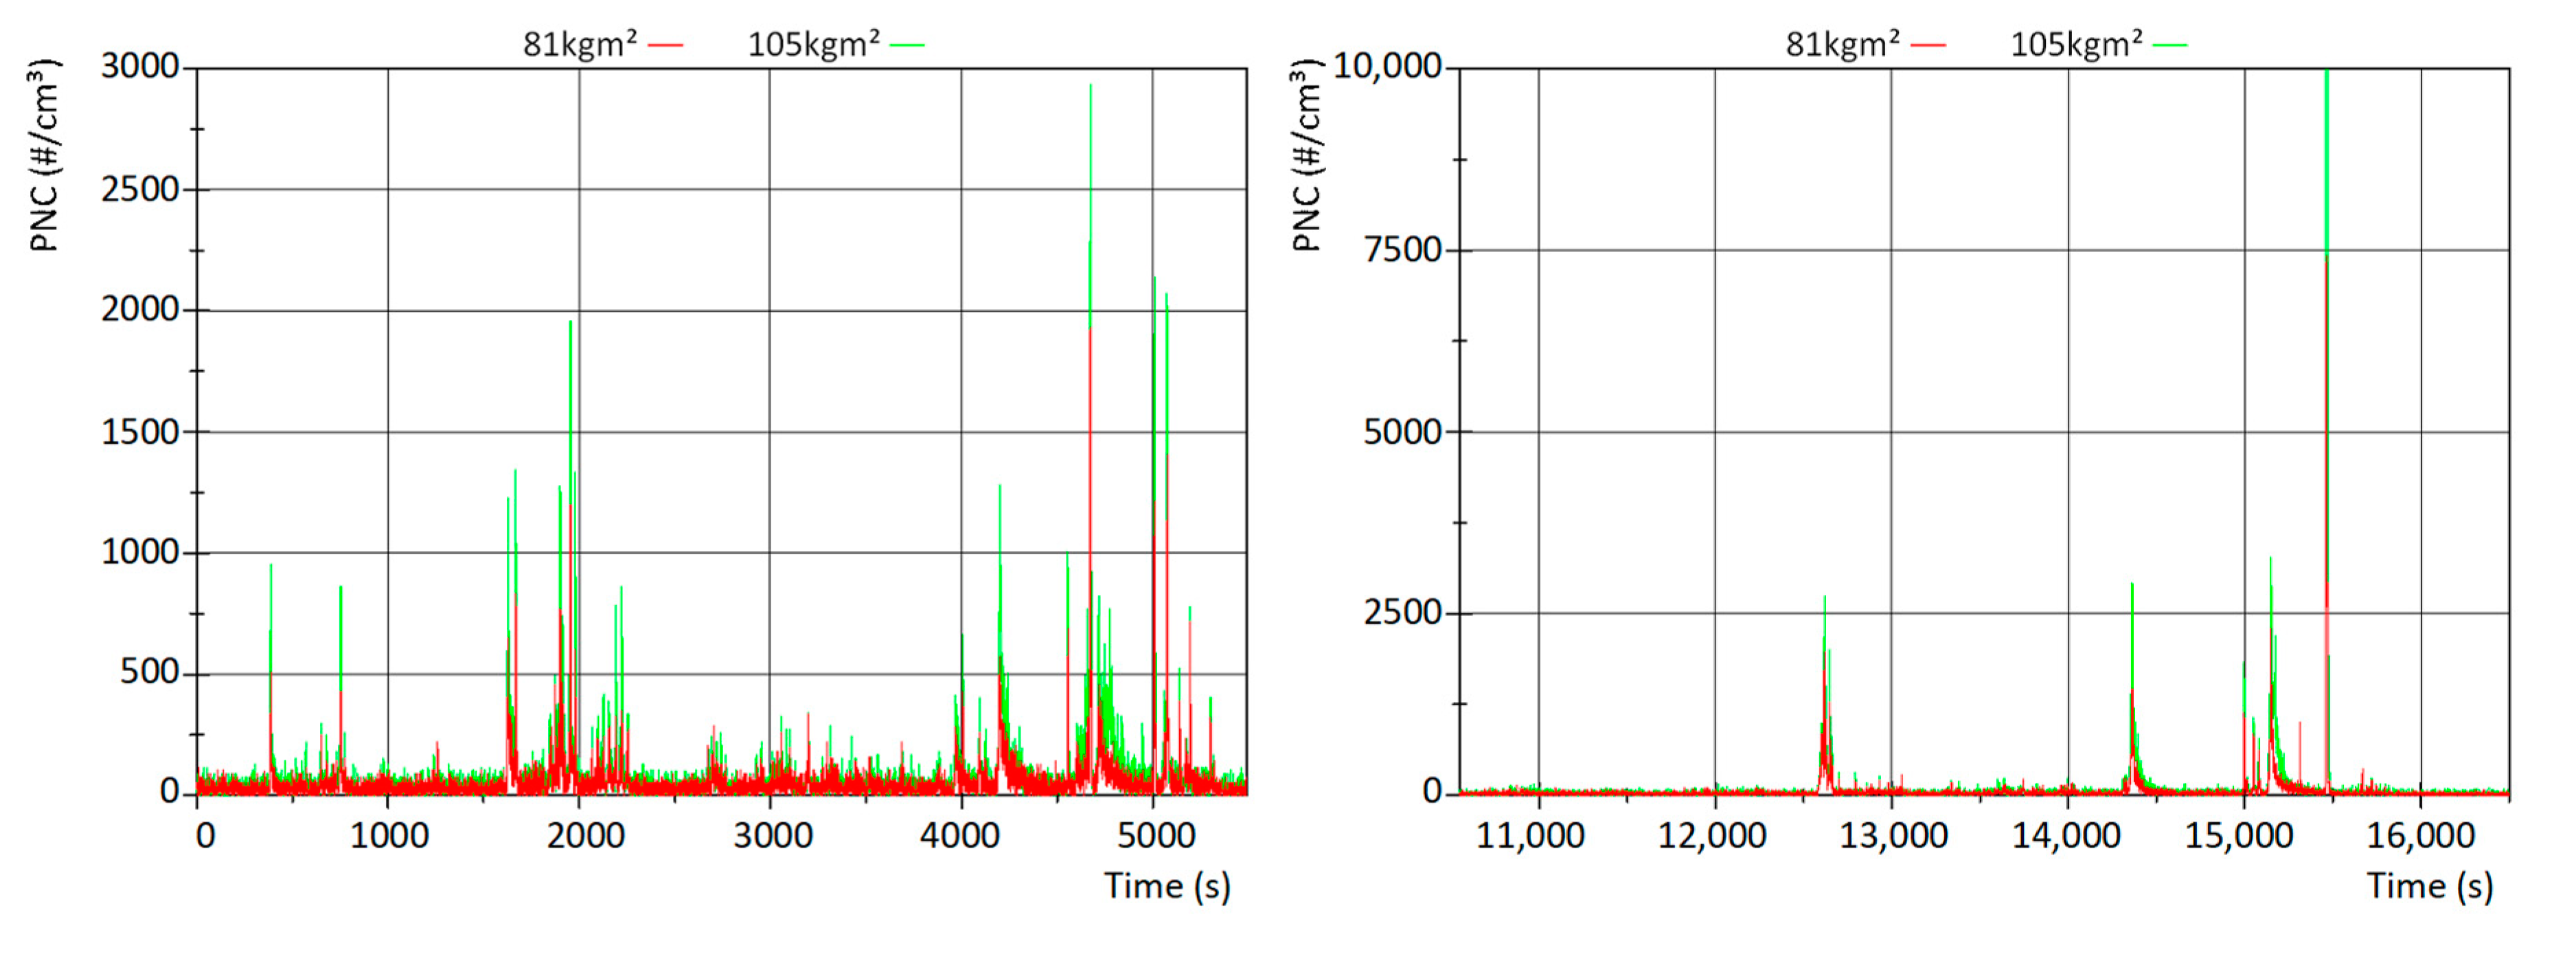
The closer look to the first four trips (
Figure 17, left) confirms this picture as well as Trip 10 (
Figure 17, right). Interestingly, the inertia increase leads to higher peaks due to the brake applications, but additional off-brake peaks cannot be stated. This leads to the expectation that the temperature might play a relevant role.
Figure 18 impressively illustrates that the temperature level for both brake disc and lining increases in a relevant way. Hence, it can be concluded that even with the customer-oriented novel-WLTP test cycle, the role of temperature can be investigated and that the inertia has a significant impact on the emission level during the braking phases.
3.4. Impact of Load Profile
Beside the impact bedding, brake lining composition and inertia, the authors want to highlight the role of the load profile as well. So-called reservoir dynamics, which are described in detail in [
16,
17,
18], can mean a relevant influence on emissions. This is confirmed in [
19] for the standard WLTC class 3 approach (the cycle described can be find in [
20]) and for the industrial development test cycle LACT in [
21]. However, since the novel-WLTP is tailored to emission testing for brake systems, it is useful to investigate the role of reservoir dynamics for this load profile as well.
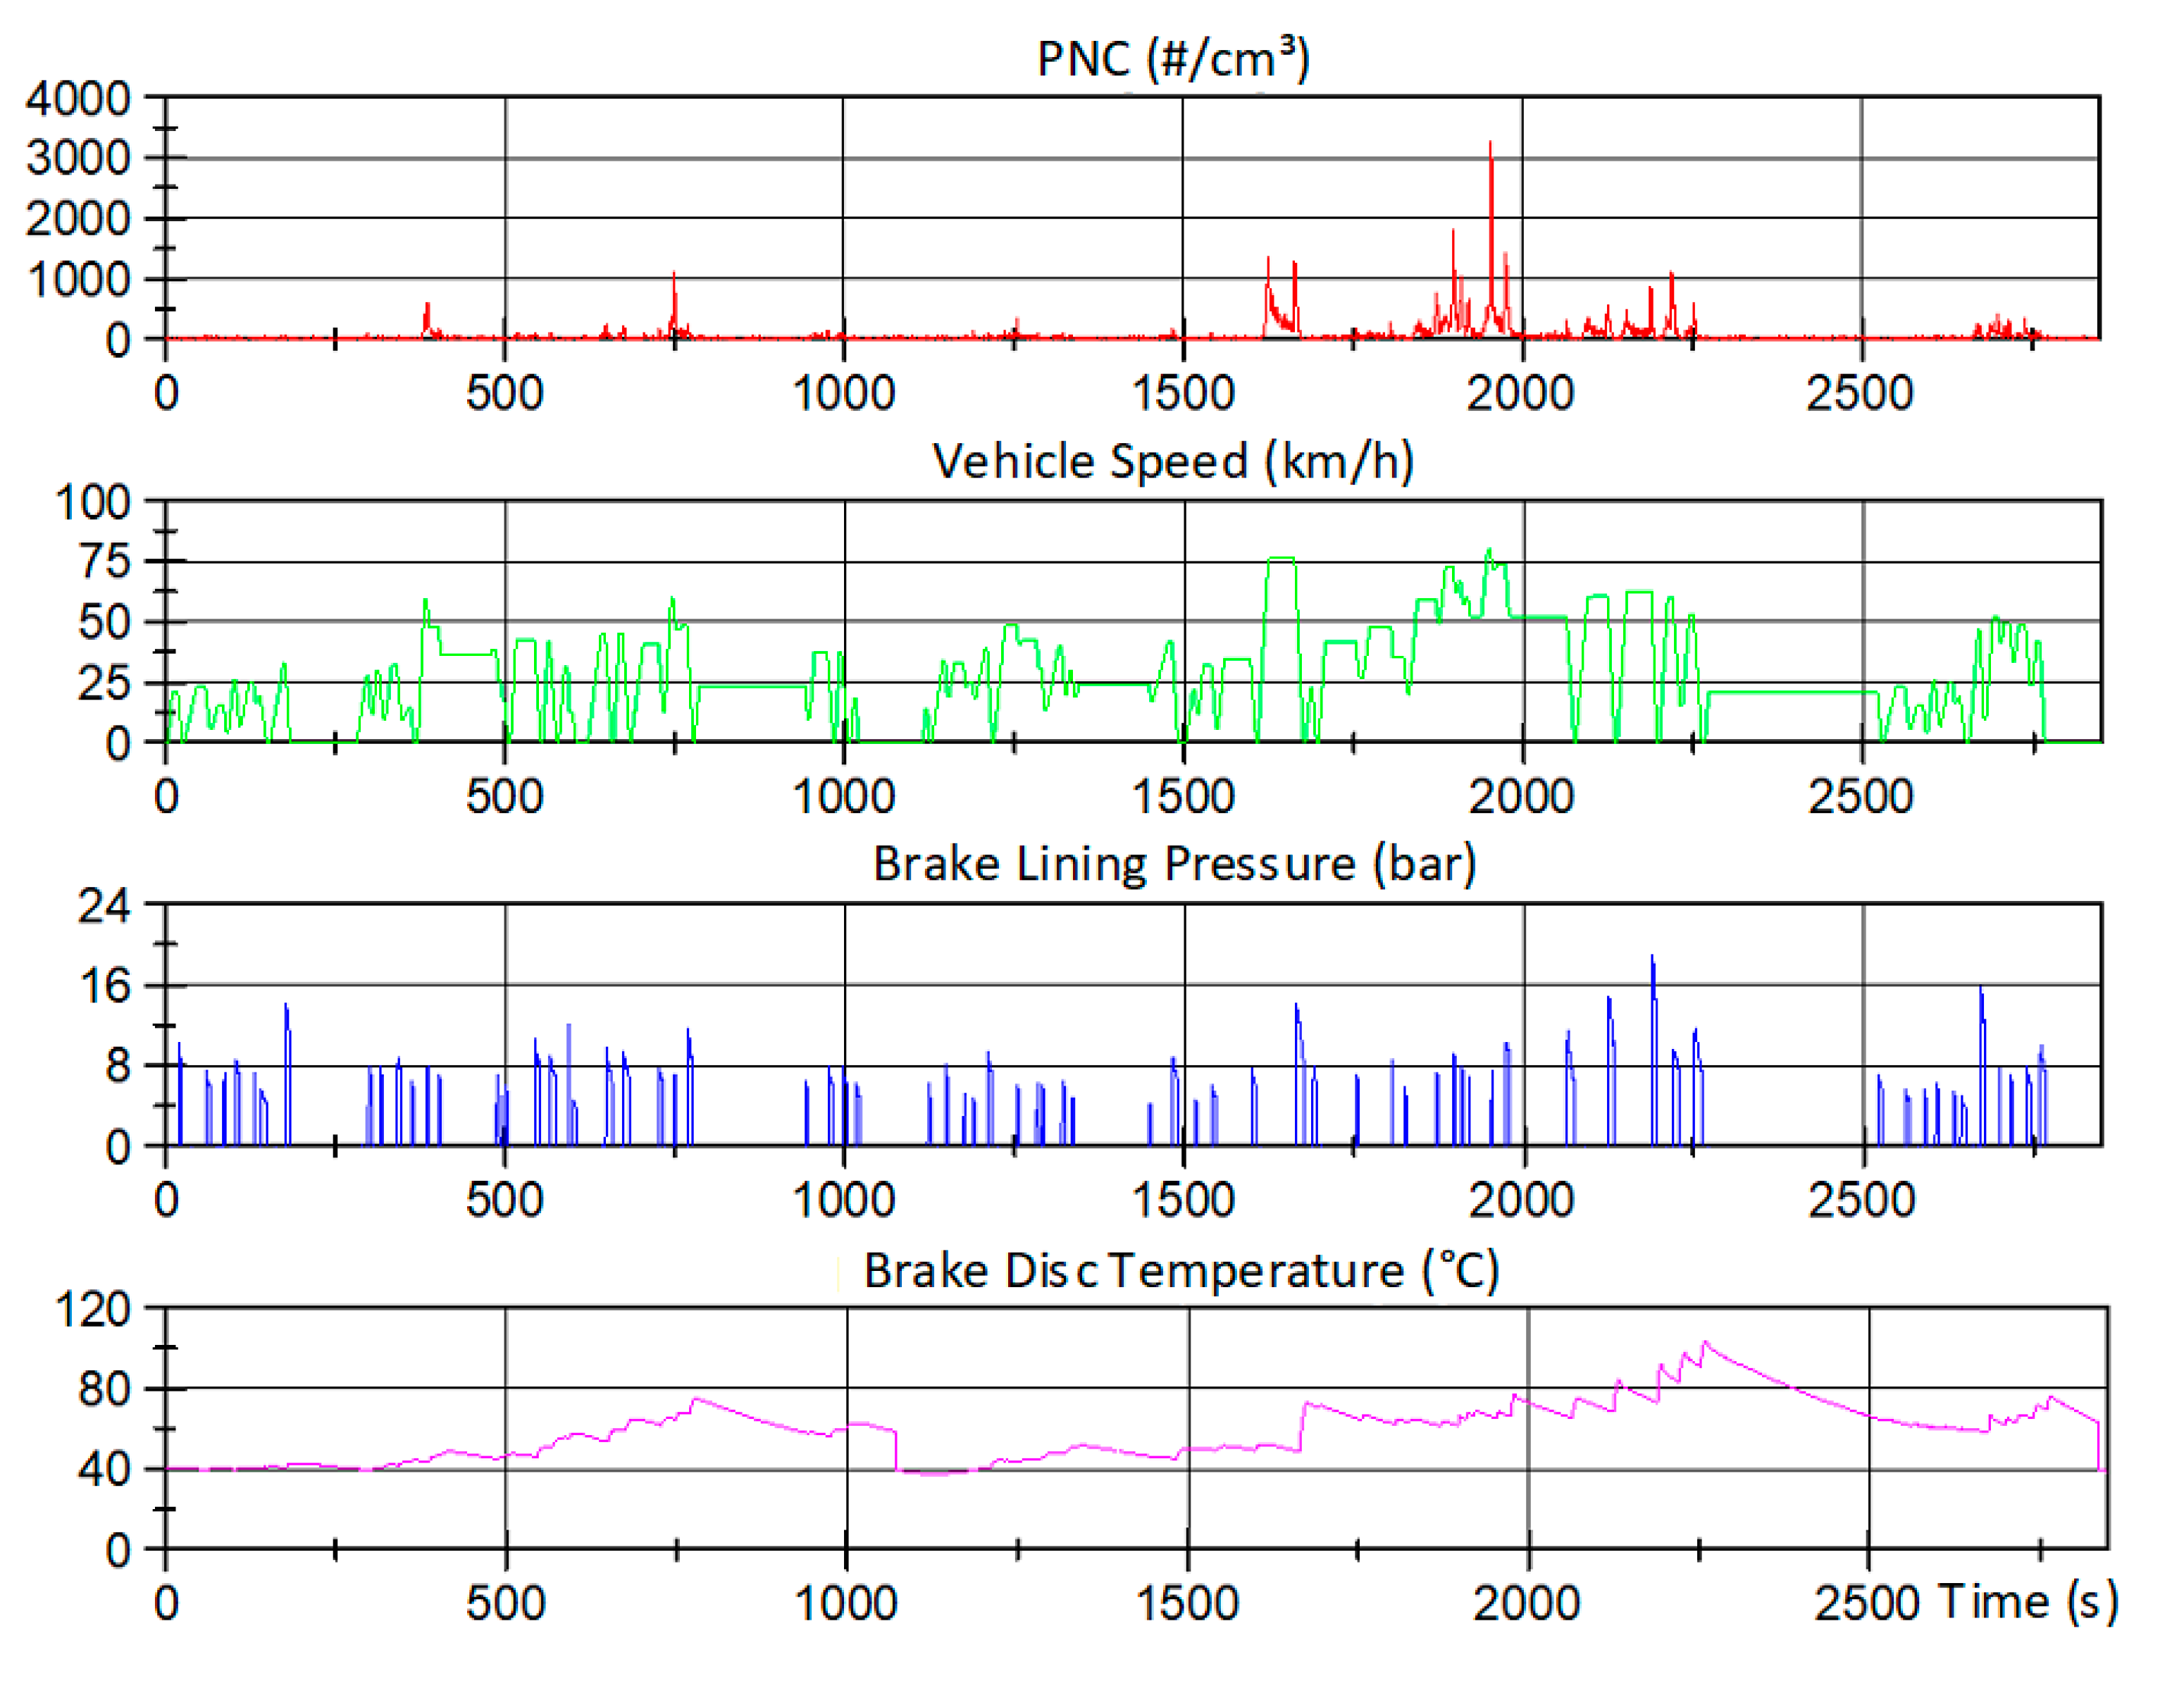
In
Figure 19, the time history of particle number concentration, vehicle speed, brake line pressure and temperature (brake disc) is shown for Trips 1 and 2. The diagrams reveal a clear dependency from vehicle speed and brake disc temperature. Speeds below 50 kph and temperatures below 60 to 70 °C do not lead to detectable emissions. The highest emission level is reached at highest vehicle speed, not at highest temperatures within the first two trips, even if a maximum temperature of approximately 100 °C is reached.
A global look to the data leads to the impression that wear debris might be generated during the cycle, but only emitted after acceleration phases and reaching limit values for vehicle speed. A closer look to Trip 10 intends to give some further insights.
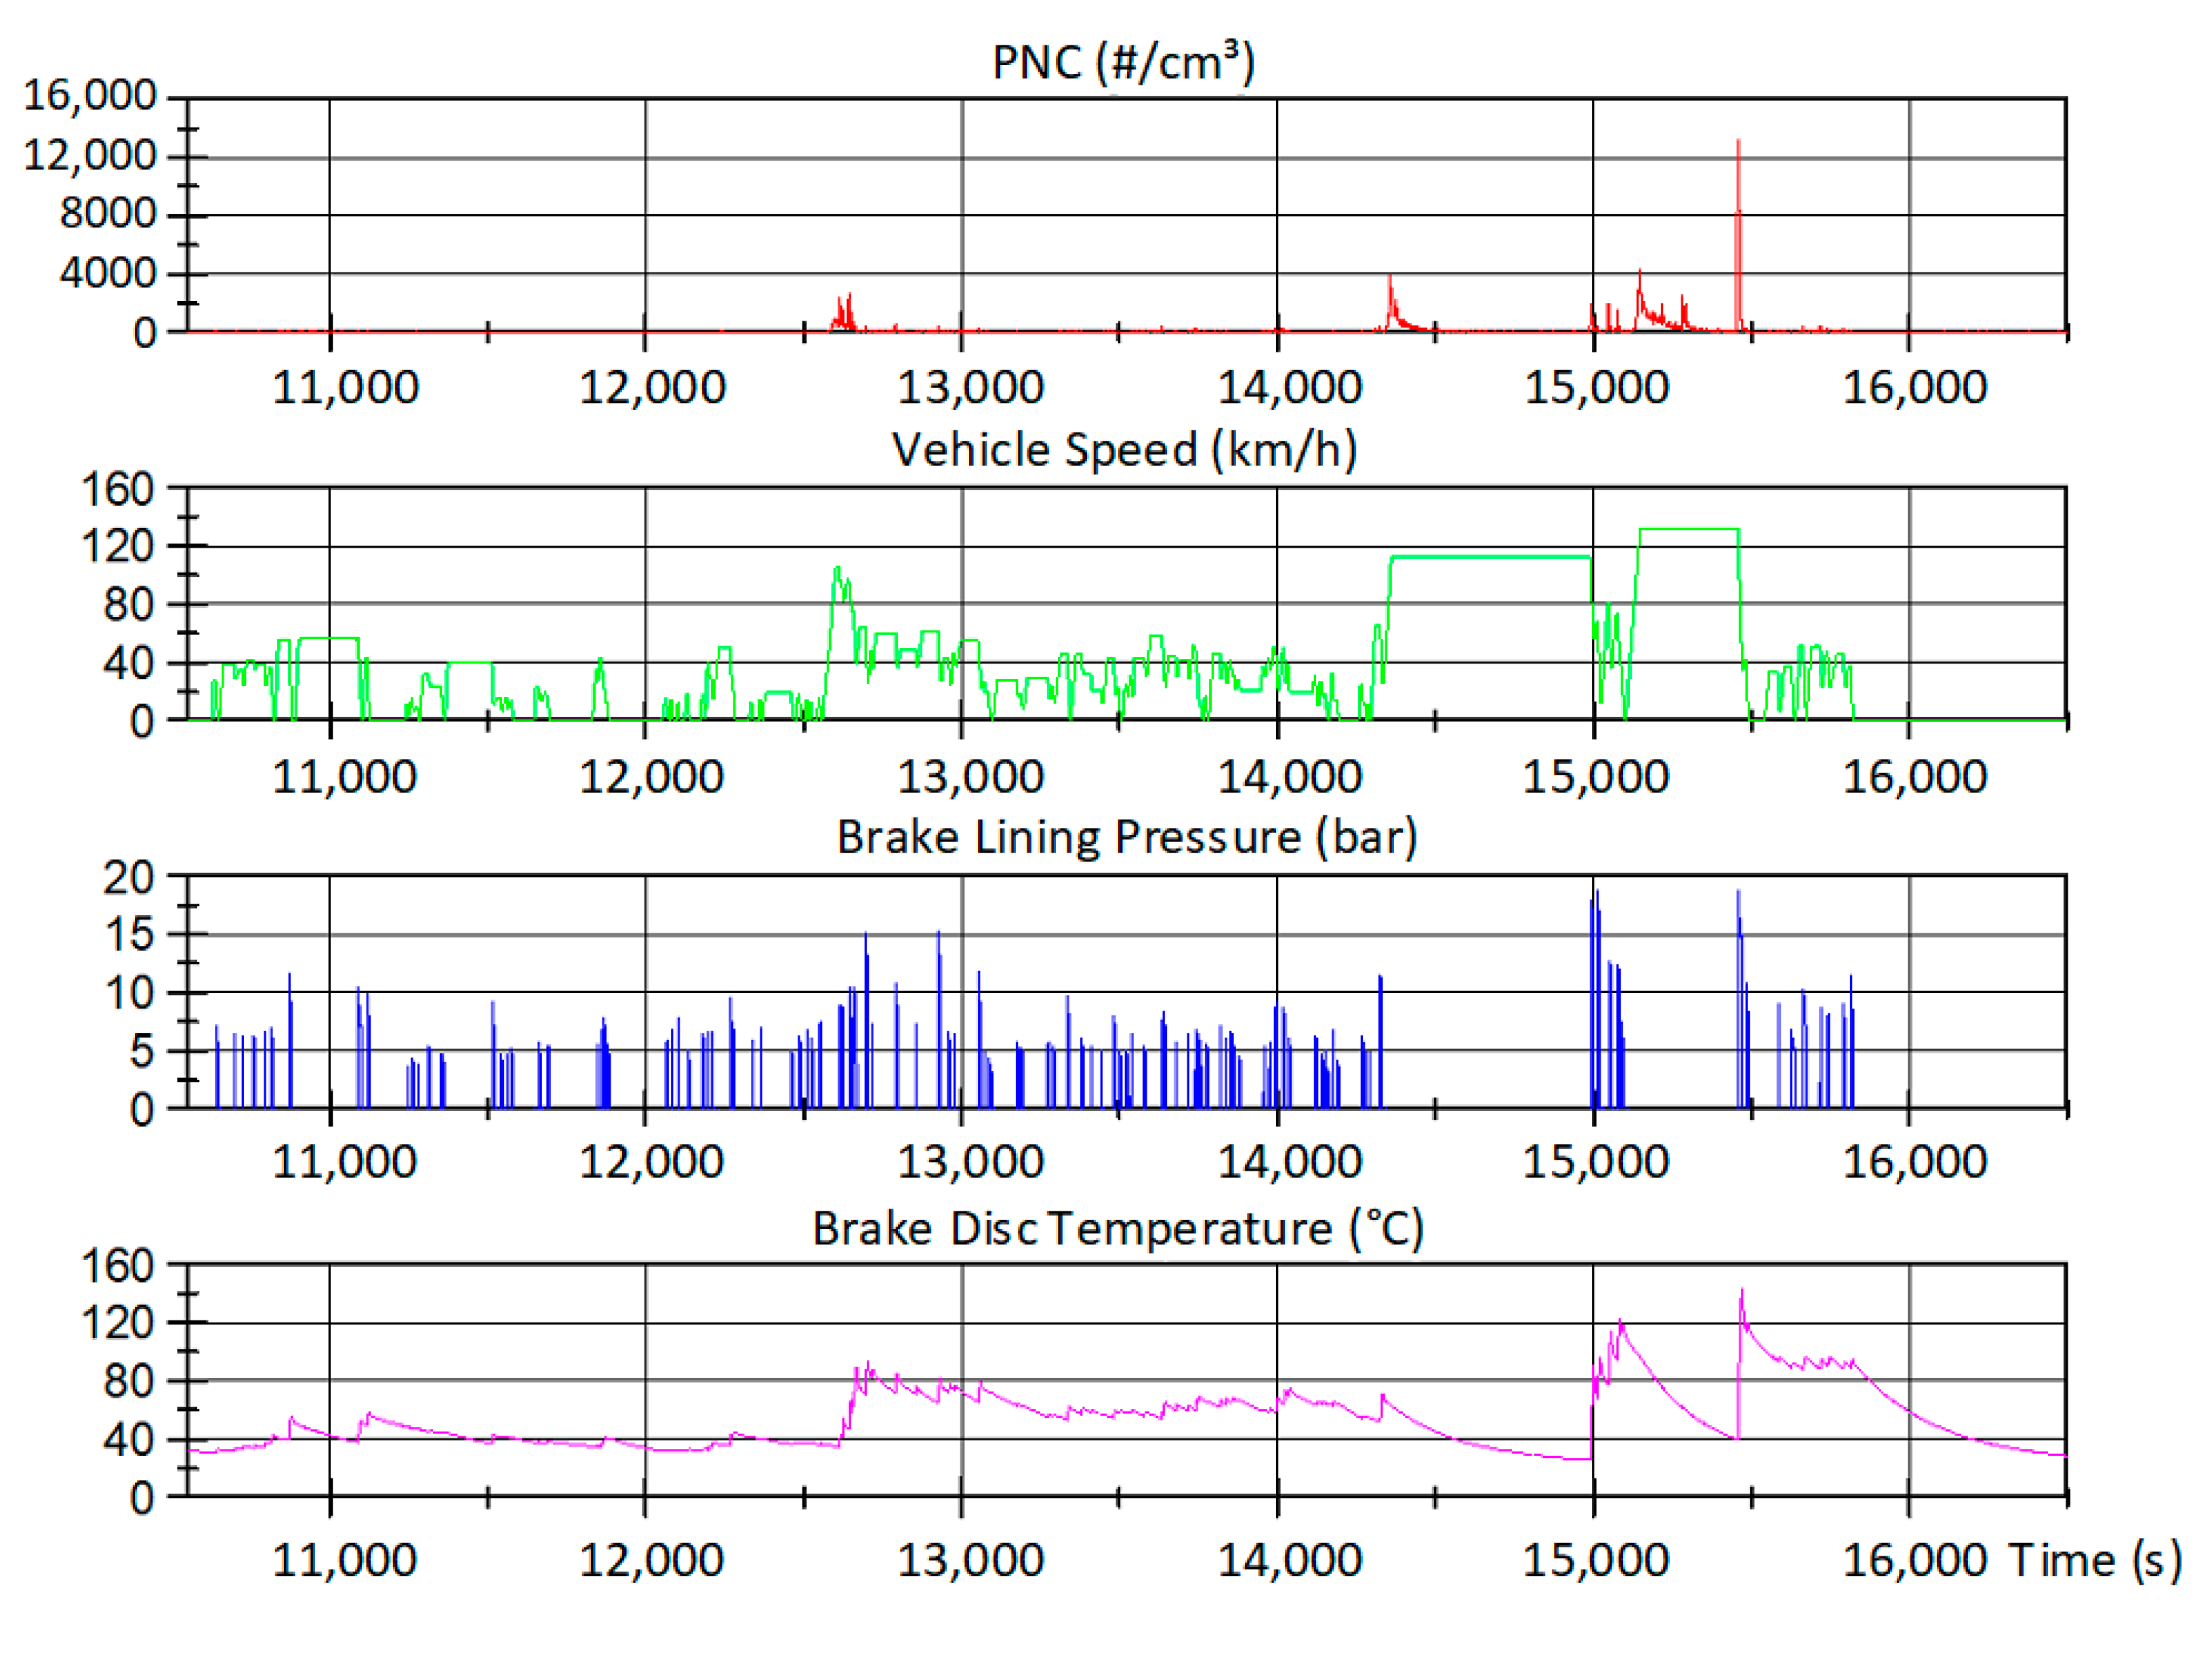
According to
Figure 20, it can be confirmed that acceleration phases that lead to the highest speed values (110 and 132 kph, respectively) of the cycle cause significant emissions without brake applications.
However, the combination of top speed and maximum temperature leads finally to the highest peak emissions. A reason for this characteristic might be the fact that the temperature exceeds values of 120–130 °C. From previous investigations and the literature it is known that friction couples own a so-called “shift temperature”. Exceeding this value leads to a significant increase of brake particle emissions [
5,
13,
22].
Interestingly, after this brake application, the emissions decrease significantly even if the temperature remains on a level of approximately 90 °C. Since the speed goes down to 50 kph, it confirms the statements derived from Trips 1 and 2.
4. Discussion
The role of bedding in terms of brake particle emissions is discussed as a first impact. Several questions are linked to the bedding procedure. Traditional friction testing states that a bedding is completed when the coefficient of friction is stable. In terms of emissions, one has to focus on the emission level. The presented results show a stabilization of the cumulated particle number concentration after three novel-WLTP cycles. This answers also another question that deals with the extent of the bedding procedure. Even if not several different procedures were investigated, it is shown that the novel-WLTP itself works properly as a bedding procedure approach. With the consideration of a total duration of approximately 15 h just for the bedding, it is clear that from the industrial point of view improvements are necessary. However, at least regarding the functionality, this approach is a sophisticated one. Additionally, one can ask if about the relation in terms of emissions between new and bedded friction couples. The results reveal a factor of at least two referring to the first test run what means that emissions are more than doubled compared to a bedded friction couple. This underlines the importance of a real bedding and gives also the hint to future electrified vehicles with high rates of regenerative braking. It is highly recommended that those friction pairs are bedded properly before using the car. Furthermore, it was observed that the non-bedded friction couples do not exhibit relevant emissions due to the reservoir dynamics. This is also relevant for the understanding of tribological mechanisms since it confirms that those effects are established only by reaching a bedded state.
In terms of different brake lining compositions, it is well known from wear testing (according to industrial standards) that NAO brake linings perform better than low steels. The question, if it is also valid for emission testing can be clearly answered with yes. The presented results revealed especially for low load sections such a low emission level that one can ask if the signal-to-noise-ratio is still sufficient to detect emissions correctly. Since a closer look to the results indicates also clear emission peaks in the time history, the authors state that the proposed measurement setup and used test cycle are also suitable for NAO brake lining concepts. However, it might be necessary to adjust the measurement concept when alternative friction materials such as coated brake discs will be introduced to the mass marked. Finally, the relevance of the friction zone temperature has to be discussed. NAO brake lining materials own a different thermal conductivity compared to low-steel materials. However, since no clear trend between the temperature levels of brake disc and brake pad and the emission level can be stated, the authors have shown that the different tribological mechanisms of NAO and low steel lead to the varying emission levels. Such an indication is helpful for the brake lining manufacturers to focus in the future on the friction zone dynamics and aim patch and debris dynamics that are oriented on NAO brake pads.
Regarding the impact of inertia, industrial standard tests reveal that an increase leads also to higher wear and temperature levels. However, the question is of course, is it also valid the for novel-WLTP cycle? Even if this test cycle is much more customer oriented and owns mostly low-load brake applications, the influence of the inertia can be confirmed as well. The emission levels for two typical vehicle categories and their respective inertia reveal clear differences during the entire test cycle and not only for the brake applications of Trip 10 with higher load requirements. Beside this, the importance of this impact has to be discussed. The results demonstrate clearly that smaller changes of the inertia can lead to differences of the emission level by factor two to three. Hence, the authors would like to underline how important it is for brake particle emissions to reduce vehicle weight of next generation vehicles. Furthermore, the discussion of other impacts revealed the role of tribological mechanisms that are more relevant than the temperature characteristics when the novel-WLTP test cycle is applied. Regarding the inertia the authors state that it is actually the temperature that plays a dominant role. The friction zone temperatures (brake disc and brake pad) increase directly with the inertia, higher emissions are obtained for the single-brake applications while additional off-break peaks (due to reservoir dynamic effects) cannot be confirmed. As a consequence for the vehicle manufacturer, beside vehicle weight reduction measures it is also helpful to improve the cooling of the foundation brake. Hence, the lowered temperature level should also lead to less emissions.
When it comes to the impact of the load profile, it should be discussed if there are thresholds for vehicle speed, brake line pressure and temperature for increased emissions. The results confirm thresholds for vehicle speed and brake disc temperature, but not clearly for the brake pressure. The detailed values indicate that especially for urban driving conditions the emission level is extremely low and it is hard to detect clear emission peaks. This questions at least the role of brake particle emissions in terms of their fraction on urban air pollution levels and indicates that other sources might be much more relevant. Discussing the importance of the load history, the authors confirm that also the novel-WLTP test cycle is suitable to characterize the effect of reservoir dynamics. For the low load sections, these emissions might even exceed those that are generated directly by a single brake event. However, the high load applications of Trip 10 indicate also the relevance of the temperature and temperature threshold respectively. As a consequence, one can recommend to avoid higher temperature levels to a minimum. The emissions after and during off-brake phases must also be considered. Measures to reduced residual drag torque seem to be also an appropriate approach for emission improvements.
5. Conclusions
The presented paper intends to address some still open items regarding brake particle emission testing.
The first item deals with the impact of bedding of the friction couple. New friction pairs emit much more particles than bedded ones, but no off-brake contributions (reservoir dynamics are not established yet) can be stated. In general, the bedding helps to reduce emissions significantly. A proper measure to ensure or indicate saturated emission conditions is the emission testing itself, while it was clearly shown that the temperature is not a sophisticated indicator.
The impact of brake lining compositions reveals a much better performance of the NAO than the low steel, what is valid for the entire cycle. Even the highest loads (reaching the maximum temperature level) do not lead to exceed the emission level of the low-steel material. The NAO indicates different temperature characteristics than the low steel for brake disc and lining temperature, but no direct correlations to the emissions can be concluded. This means that the composition itself and the resulting tribological mechanisms determine the emissions significantly. However, it must be mentioned that a certain influence of the composition exists—different NAO and low-steel concepts may behave differently.
In terms of the impact of inertia, one can confirm that an increasing inertia leads to elevated emission levels, as it can be expected. Interestingly, additional off-brake peaks are not observed. The reason for increased emissions is an elevated temperature level of the friction zone—this confirms not only the importance of the temperature, but also the fact that the customer-oriented novel-WLTP test cycle is suitable to investigate the role of temperature
Finally, the impact of load profile was investigated. The authors have shown that vehicle speed and brake disc temperature have to pass certain thresholds to be able to detect brake particle emissions. Additionally, the investigations underline the importance of reservoir dynamics.
The presented study considered two serial production brake lining compositions in combination with standard gray cast iron brake discs. The investigations have shown some general relevant conclusions regarding various impacts. However, it must be stated that a huge variety of low-steel and NAO families exist that might reveal different characteristics compared to those that have been presented. Additionally, the impact of different production batches might be interesting to be investigated since it is well known that batch impact on tribological properties exist. Hence, one can expect that also emissions are affected by the production batch influence.


