Article

Mass Transport of Gases across the Air–Water Interface: Implications for Aldehyde Emissions in the Uinta Basin, Utah, USA

by
Marc L. Mansfield
Department of Chemistry and Biochemistry, Utah State University Uintah Basin, 320 North Aggie Boulevard, Vernal, UT 84078, USA
Atmosphere 2020, 11(10), 1057; https://doi.org/10.3390/atmos11101057
Submission received: 29 August 2020 / Revised: 21 September 2020 / Accepted: 30 September 2020 / Published: 2 October 2020

Abstract

:
When they dissolve in water, aldehydes become hydrated to gem-diols: R COH + H 2 O RCH ( OH ) 2 . Such reactions can complicate air–water transport models. Because of a persistent belief that the gem-diols do not exist in the vapor phase, typical models do not allow them to pass through the air–water interface, but in fact, they do. Therefore, transport models that allow both molecular forms to exist in both phases and to pass through the interface are needed. Such a model is presented here as a generalization of Whitman’s two-film model. Since Whitman’s model has fallen into disuse, justification of its use is also given. There are hypothetical instances for which the flux predicted by the current model is significantly larger than the flux predicted when models forbid the diol form from passing through the interface. However, for formaldehyde and acetaldehyde, the difference is about 6% and 2%, respectively.

1. Introduction

Exceptionally high ozone concentrations occur during many winters in the Uinta basin of eastern Utah [1,2,3,4,5]. The physics and chemistry of winter ozone formation given the prevailing emissions and meteorology are not completely understood. For example, models routinely underestimate ozone concentrations. Some models suggest that there is a missing source of formaldehyde and other carbonyls [6,7,8]. This has led us to consider other possible carbonyl sources [9], including produced water evaporation ponds [10,11,12] and the snowpack [13,14,15], and to an examination of models of the transport of aldehydes across the air–water interface. Ice crystals in the environment have a surface liquid-like layer. To an initial approximation, transport between snow and the atmosphere resembles transport across the air–liquid water interface [16,17,18]. This paper is a result of that study.
The theory of mass transport of volatile gases between a liquid and a vapor phase is well developed but becomes more complex when the gas undergoes a reaction in the aqueous phase. Examples include the following reactions:
f o r m a l d e h y d e m e t h a n e d i o l HCHO + H 2 O H 2 C ( OH ) 2
a c e t a l d e h y d e 1 , 1   e t h a n e d i o l CH 3 COH + H 2 O CH 3 CH ( OH ) 2
c a r b o n   d i o x i d e   c a r b o n i c   a c i d   b i c a r b o n a t e c a r b o n a t e
CO 2 + H 2 O HO ( CO ) OH HC O 3 +   H + C O 3 2 + 2 H +
d i s s o c i a t i o n   o f   HCl   ( a n d   o t h e r   a c i d s ) HCl     H + +   Cl
I will represent all these reactions as 1 ↔ 2, where 1 represents the compound on the left that dominates in the vapor phase. Based on the assumption that the diols, carbonic acid, bicarbonate, carbonate, and chloride do not exist in the vapor phase, it has always been assumed that when form 1 reacts in the aqueous phase to give form 2, then 2 must convert back to 1 while still in the aqueous phase before it can cross into the vapor phase. The primary purpose of this paper is to examine models that challenge this assumption. Of course, the ions do not exist in the vapor phase, but the diols do. Many measurements have detected methanediol vapor in equilibrium with aqueous formaldehyde solutions [19,20]. Methanediol hydrolysis is catalyzed by water and other small molecules, and methanediol has extreme stability in isolation [21,22,23,24]. 1,1-Ethanediol in the gas phase has not been studied experimentally, but its reactions are probably similar to methanediol. Once we accept the gas-phase existence of these molecules, we also have to assume that they cross the air–water interface in the diol form. In this paper, I generalize existing models to the case in which both compounds are assumed to exist in both phases and are also assumed to cross the interface. I apply these models to formaldehyde and acetaldehyde transport across the air–water interface.
Interestingly, the existence of carbonic acid molecules in the gas phase has also been established, and they are also predicted to be highly stable in isolation [25,26,27,28,29,30,31,32]; thus, it is also safe to assume that they cross the air–water interface. However, at the acidities expected in the environment, only a small fraction of dissolved carbon dioxide is found in the carbonic acid form; much more is present as free carbon dioxide, bicarbonate, or carbonate. Therefore, when we write 1 ↔ 2 for the carbon dioxide system, we can assume that form 1 is free carbon dioxide, while form 2 is bicarbonate plus carbonate, and we can ignore carbonic acid altogether. Whenever form 2 is ionic, it is appropriate to assume that it does not cross the interface and that existing models suffice. New models are needed for the aldehydes, but not for carbon dioxide or hydrogen chloride.
Mass-transfer theory of transport across the air–water interface has been under development for nearly a century, beginning with Whitman [33] and his “two-film” model. Later decades saw the development of “surface renewal” and “penetration” models [34,35,36,37,38,39] and arguments based on the Schmidt number [40,41,42]. The Whitman model is relatively simple and today is used mainly only for pedagogy [43]. However, it was the first model to postulate that to cross the interface, solute molecules must traverse two separate, stagnant films, one on each side of the interface, under conditions in which transport only occurs by molecular diffusivity. It predicts mass-transfer coefficients that scale with molecular diffusivity D to the first power. Later models are more in line with experiments with D1/2 or D2/3 scaling laws [44,45,46,47,48,49,50,51,52]. There have also been generalizations that allow both for irreversible [37,53] and reversible [54,55] aqueous phase reactions. However, to the best of my knowledge, no one has ever studied models that allow for reactions in both phases and for both forms to cross the interface.

2. Description of the Models

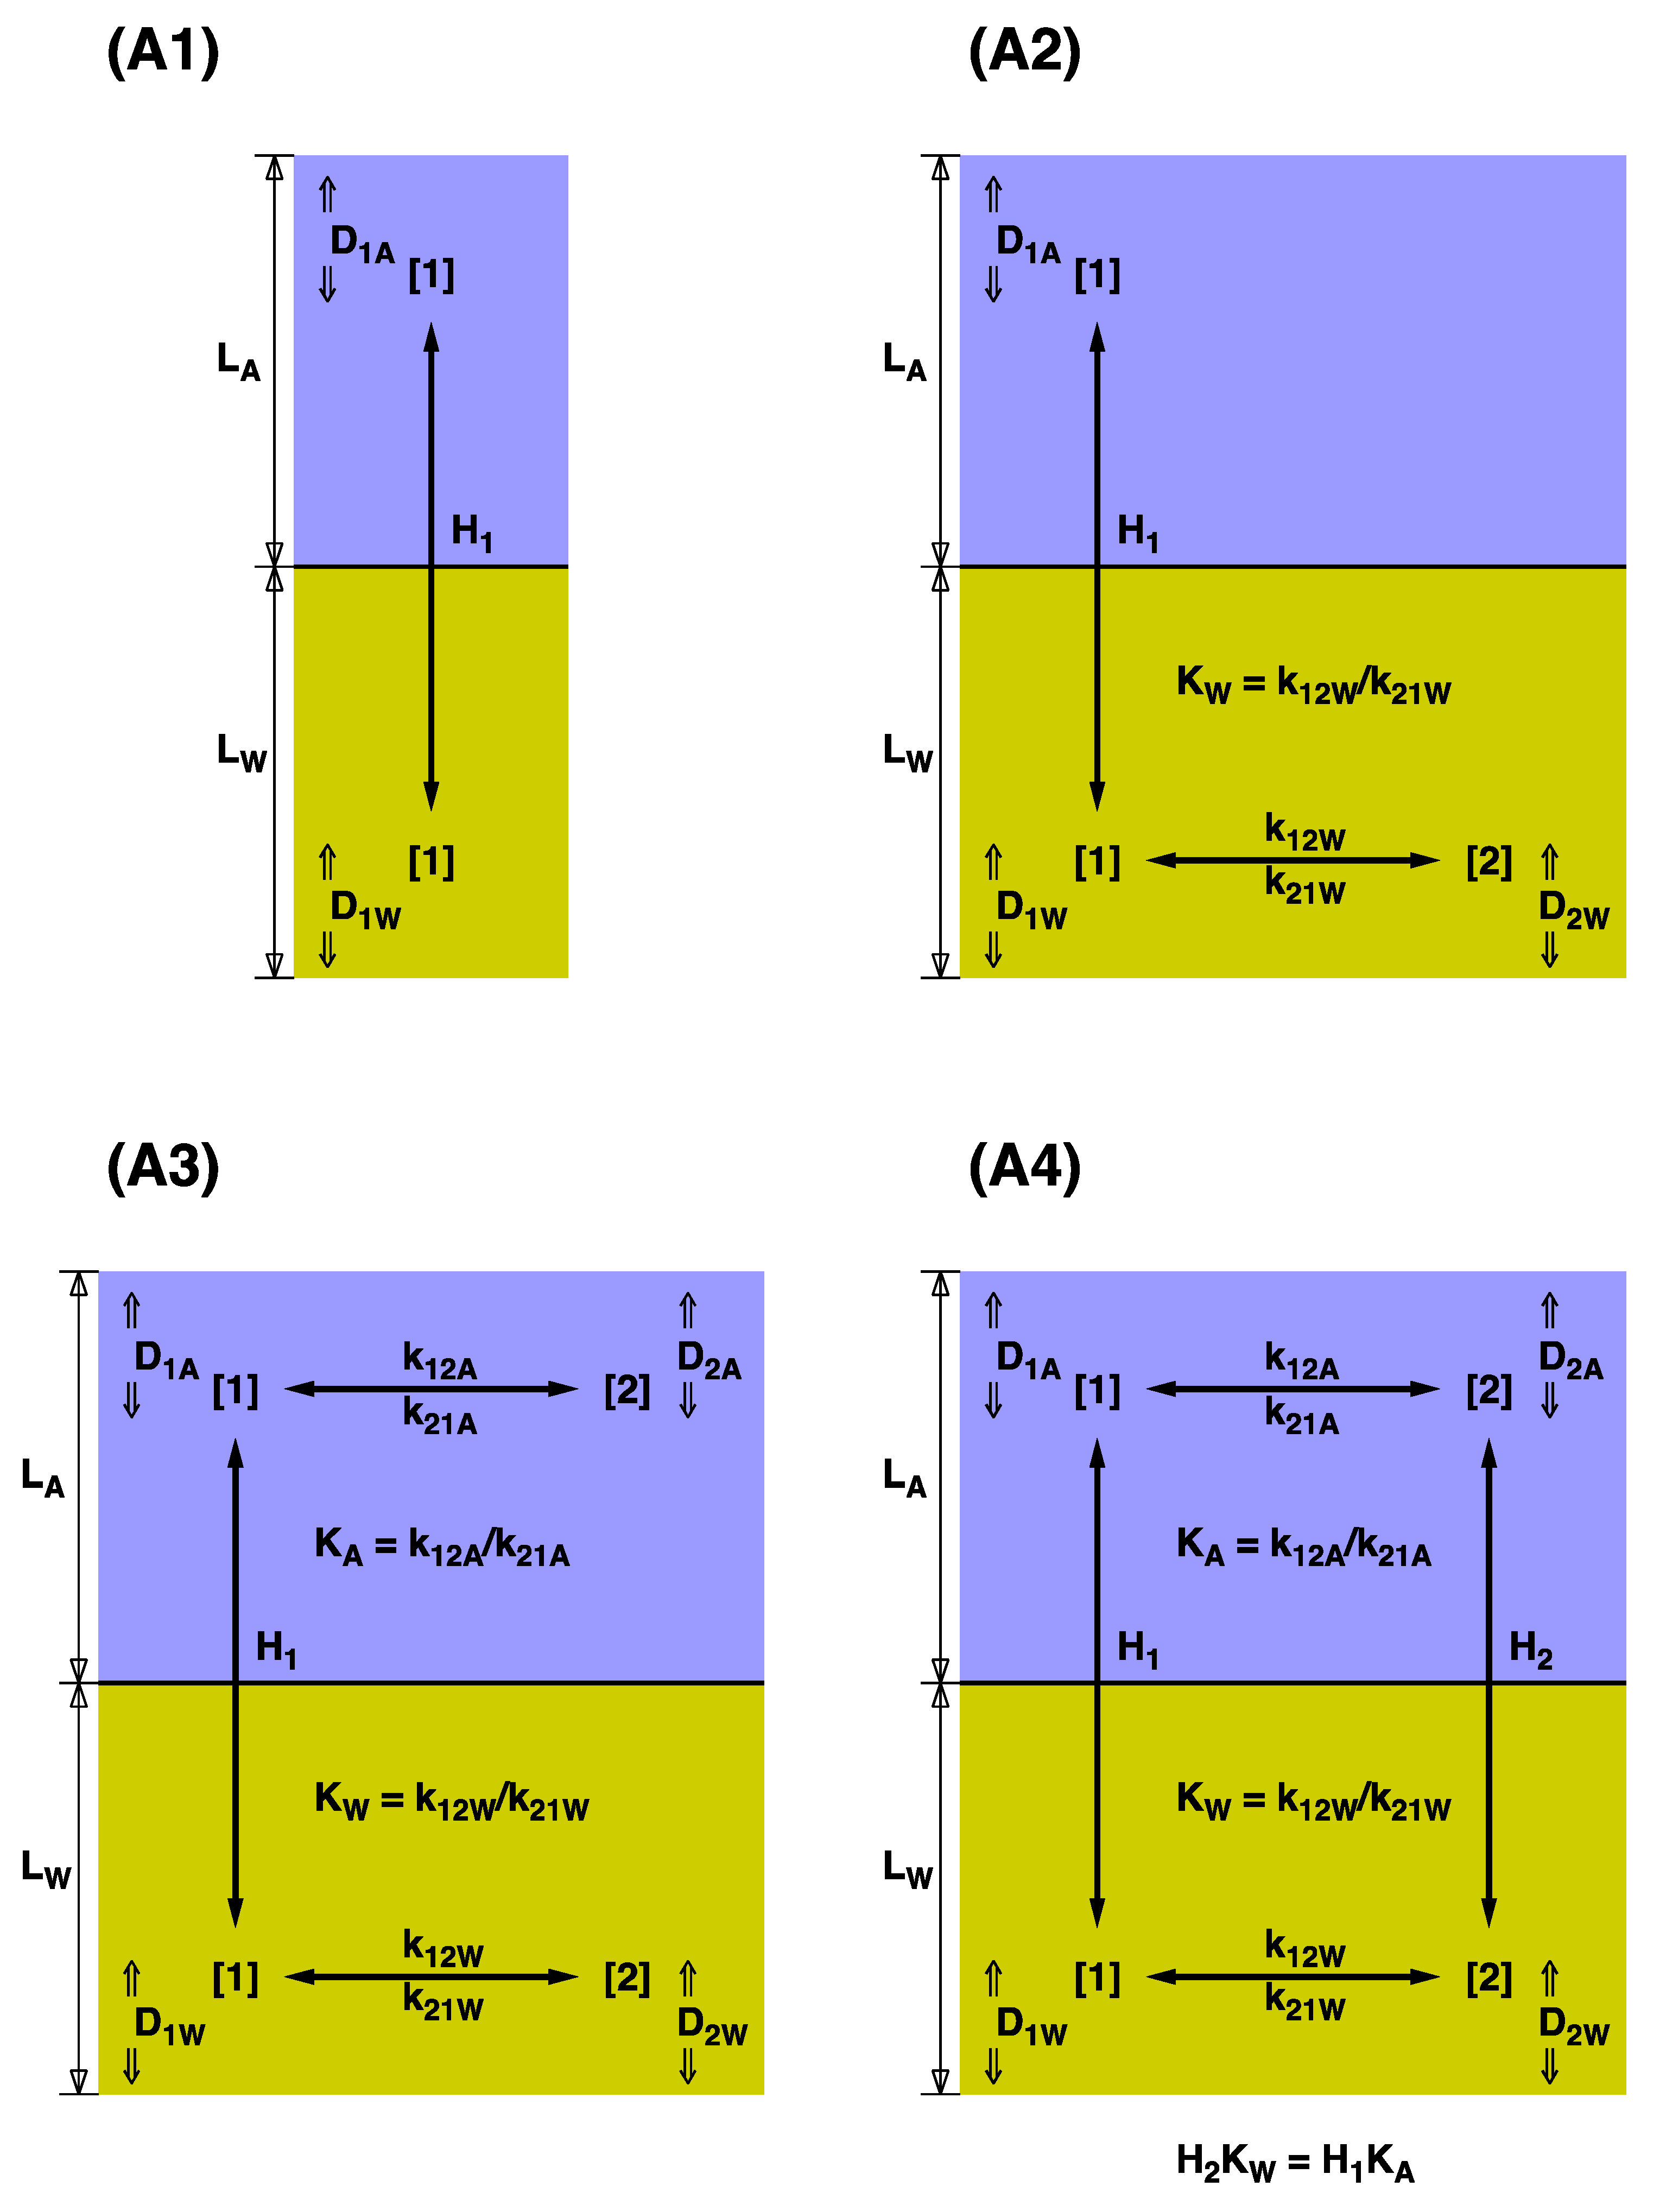
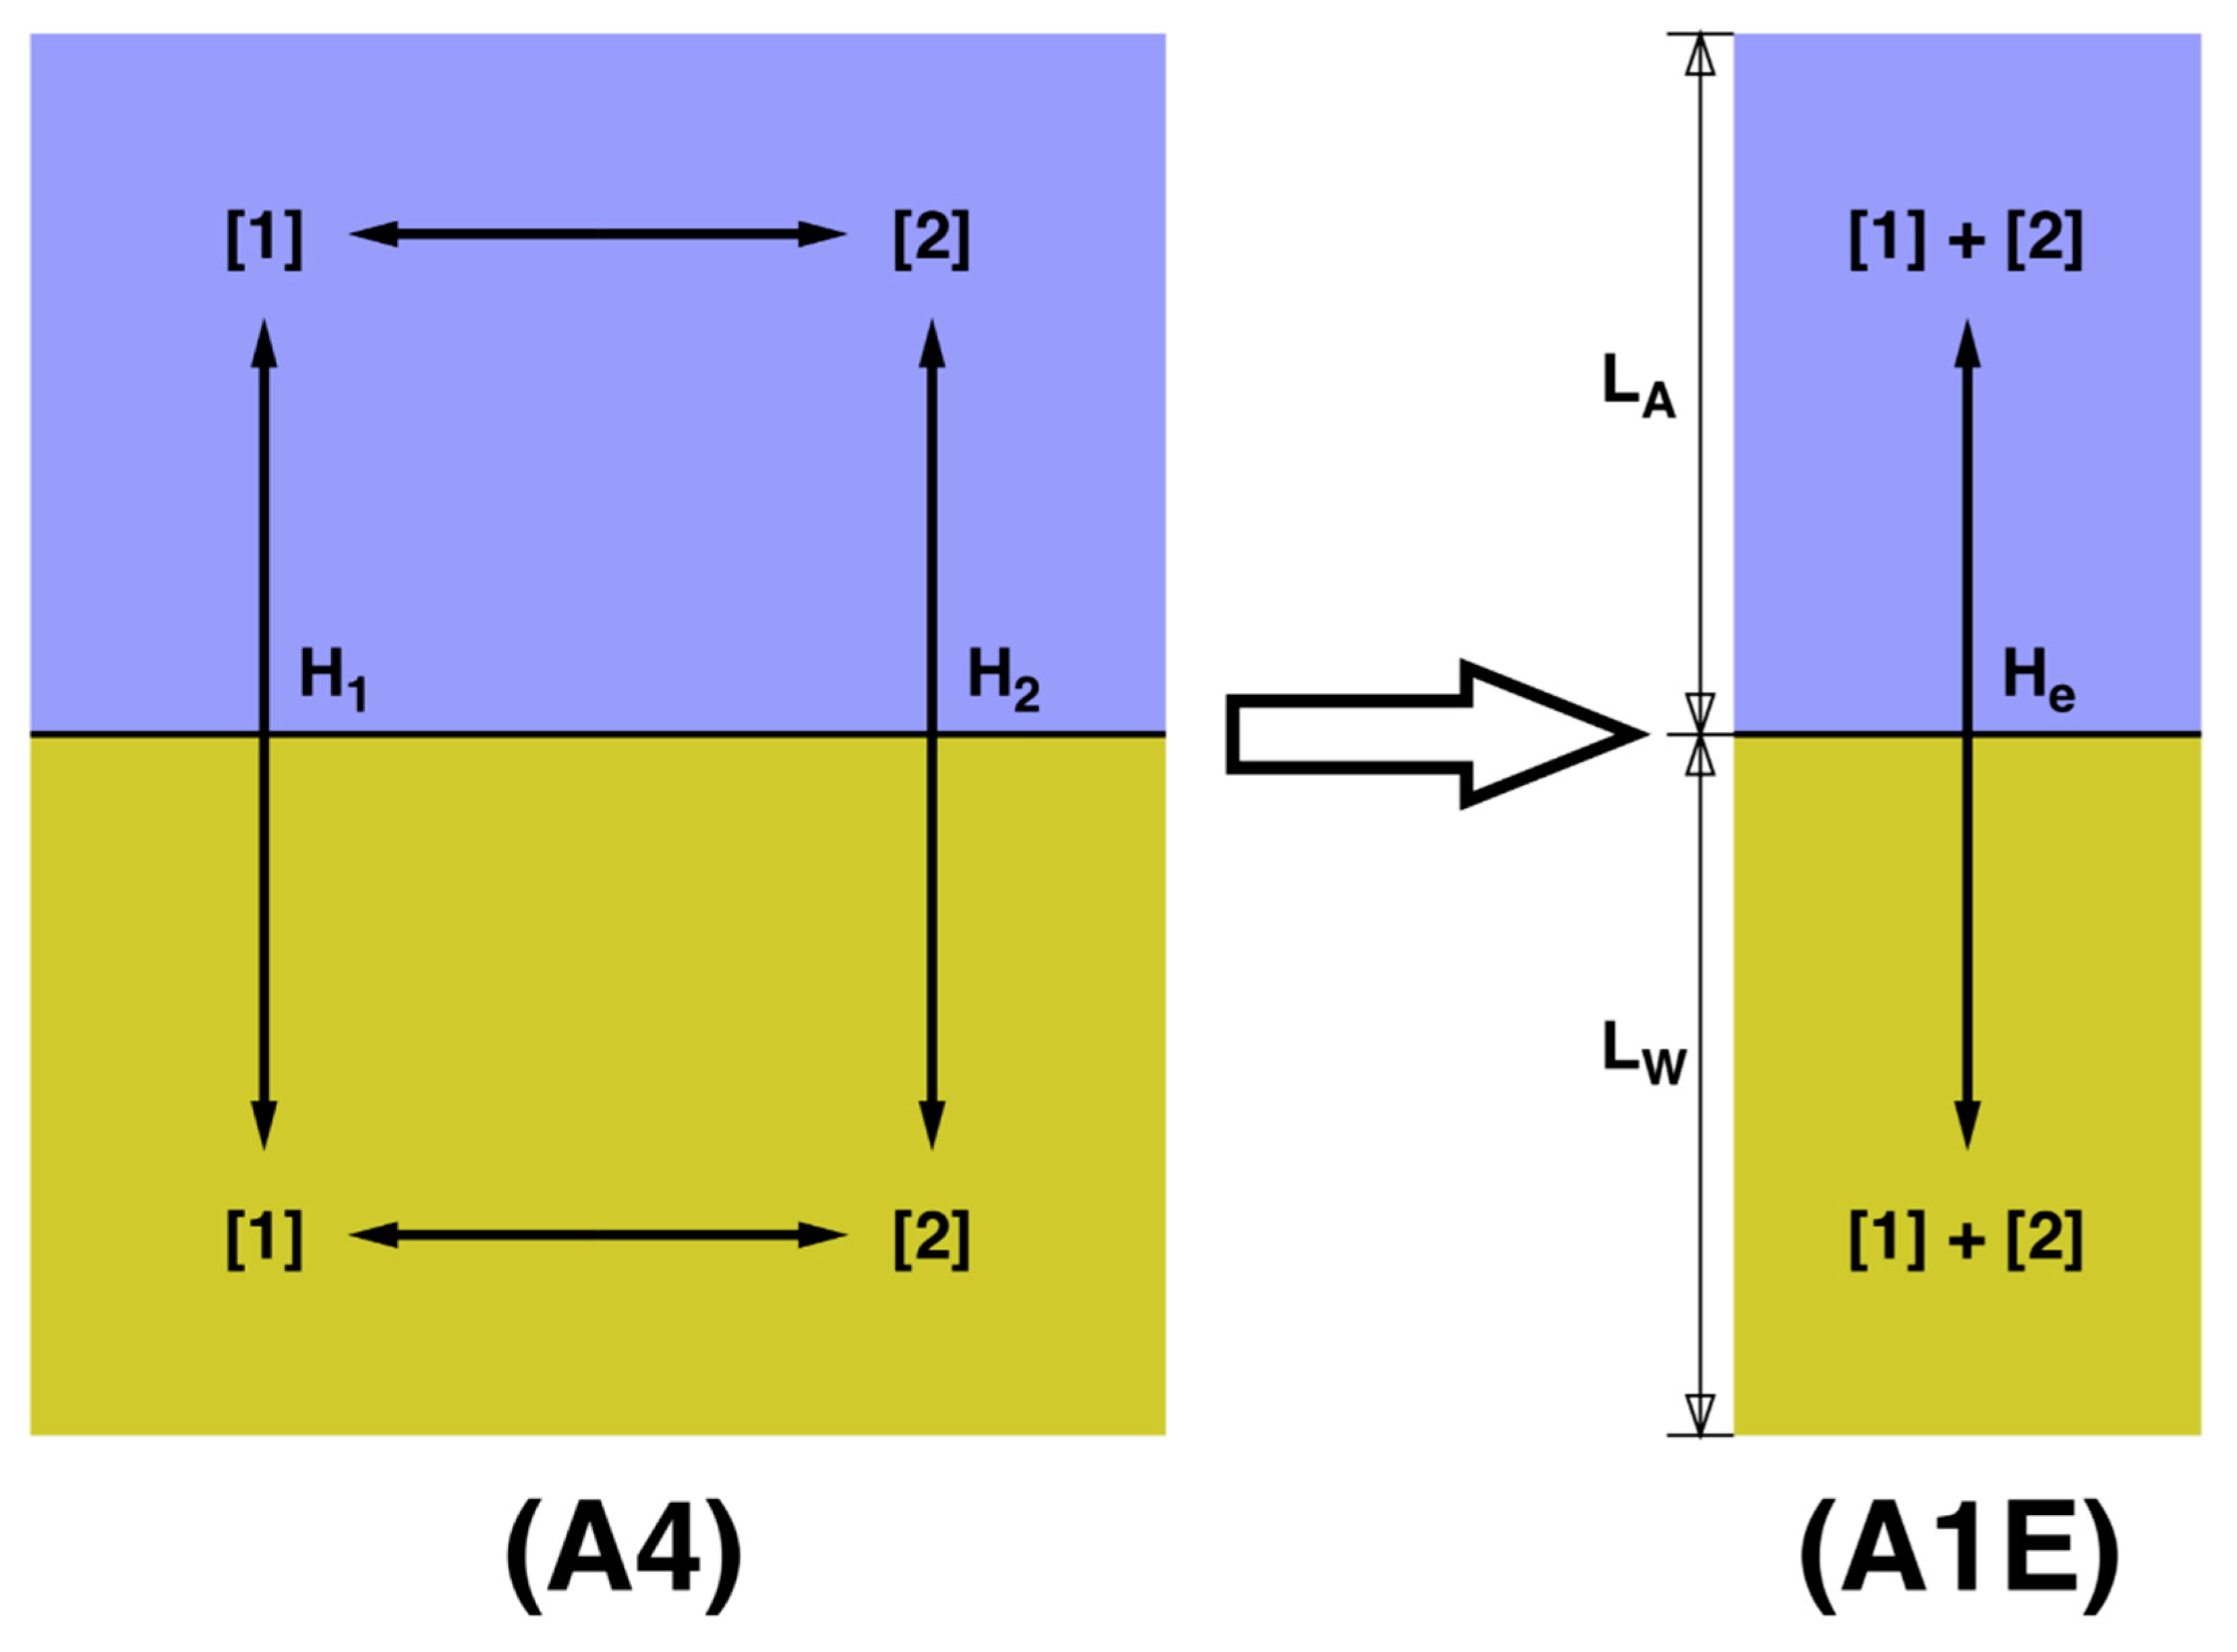
In this paper, I generalize the Whitman model [33] to the case of two reacting species. Five separate models, represented in Figure 1 and Figure 2, will be discussed in this paper. Whitman’s model [33] is denoted A1. It models a single compound able to move between the water and air phases. Model A2 was first introduced by Hoover and Berkshire [54]. It permits the reversible reaction 1 ↔ 2 only in the water phase, and only form 1 is able to move across the barrier and exist in the vapor phase. Model A3 assumes that 1 and 2 react reversibly in both phases, but still, only form 1 is able to cross the barrier. Model A4 allows for the reaction in both phases, and it allows for both compounds to cross the barrier. To the best of my knowledge, models A3 and A4 have never been presented in the literature. A fifth model is considered when, without ignoring the existence of both forms of the compound, our analytical techniques do not permit us to distinguish them, and we treat 1 + 2 as a blended compound. Let A1E refer to the model designed to be a single-compound effective representation of A4. Below, I give best techniques for designing an appropriate A1E model.
The steady-state reaction–diffusion equations can be solved exactly for all models A1 through A4 if we restrict ourselves to generalizations of the Whitman model [33]. Numerical treatments of model A2 in the context of surface renewal and other more modern models have been considered by Glasscock and Rochelle [55]. Despite yielding exact solutions, each succeeding model is algebraically and numerically more complex than the previous. Therefore, the exact solutions will only be summarized here; details and derivations are given in the Supplementary Material.

3. Definition of Variables

Table 1 defines the variables employed. We distinguish between “system” variables that define the physical and chemical properties of the system, “concentration” variables that represent concentrations of the two compounds at specific depths, and “derived” variables, used for notational convenience. The subscripts “1” and “2” identify variables that are specific to compounds 1 and 2, respectively. The subscripts “A” and “W” identify variables specific to the air and water phases, respectively. The subscript “t” for total represents a sum of properties over both compounds, e.g., Ft = F1 + F2 is the total flux. The subscripts “0” and “∞” attached to concentration variables indicate interfacial and far-field concentrations, respectively. A generic expression valid for either phase or for either compound can appear in this paper without the relevant subscripts.
The reaction rate constants k12 and k21 are pseudo-first order, since variations in water concentration are negligible. k12 refers to the rate of 1 → 2 and vice versa. Enhancement factors appear in models A2 and A3 as multipliers of certain transfer coefficients. As defined, enhancement factors are always greater than 1, so these models predict that reactions can accelerate transfer. Because diffusivities of small molecules agree better than an order of magnitude, we can usually expect that Q 1 . Because compounds 1 and 2 usually do not have the same mass, molar concentrations are used throughout. The equilibrium constants are defined as K = [diol]/[aldehyde]. I use the dimensionless air-over-water form of Henry’s constant.
H 1 = C 1 A , e q C 1 W , e q   ,   H 2 = C 2 A , e q C 2 W , e q
with the subscript “eq” denoting equilibrium concentrations. It is important to distinguish between “intrinsic” and “effective” Henry’s constants. H1 and H2 as they are used here are intrinsic. H1 is the ratio of aldehyde concentrations only, excluding the gem-diol form. H2 is the ratio of only the gem-diol concentrations. Effective Henry’s constants blur the distinction between the aldehyde and the gem-diol forms:
H e = C 1 A + C 2 A C 1 W + C 2 W = H 1 + H 2 K W 1 + K W = H 1 ( 1 + K A ) ( 1 + K W )
Effective Henry’s constants appear commonly in the literature, especially when measurement techniques are unable to distinguish the two forms of the molecule. Not all the variables given in Table 1 are independent. Interrelations between variables are listed in Table 2. These interrelations are results of physical laws or of fundamental assumptions in the models.

4. Justification of the Whitman Model

Because the Whitman model [33] has fallen into disuse, I now justify using generalizations of it in this study. The essential argument is that when Whitman’s film thickness is chosen to duplicate the flux of any of the more recent models, we can expect that it gives the same qualitative dynamics, the difference in D-scaling notwithstanding. Fundamentally, the difference between the Whitman model and, for example, the Schmidt number models is the assumed mathematical form of the eddy diffusivity. For Whitman, we have
E ( z ) = { D ,   i f   0 < z < L ,   i f   z > L
The eddy diffusivity for the Schmidt number models can be written as
E ( z ) = D [ 1 + ( z L ) p ]
L′ is a lumped quantity with units of length. Physical arguments require p = 2 or 3 [40,41,42]. Interestingly, Equation (3) is the large-p version of Equation (4). Calculation of the transfer coefficient involves the integral
k 1 = 0 d z E ( z )
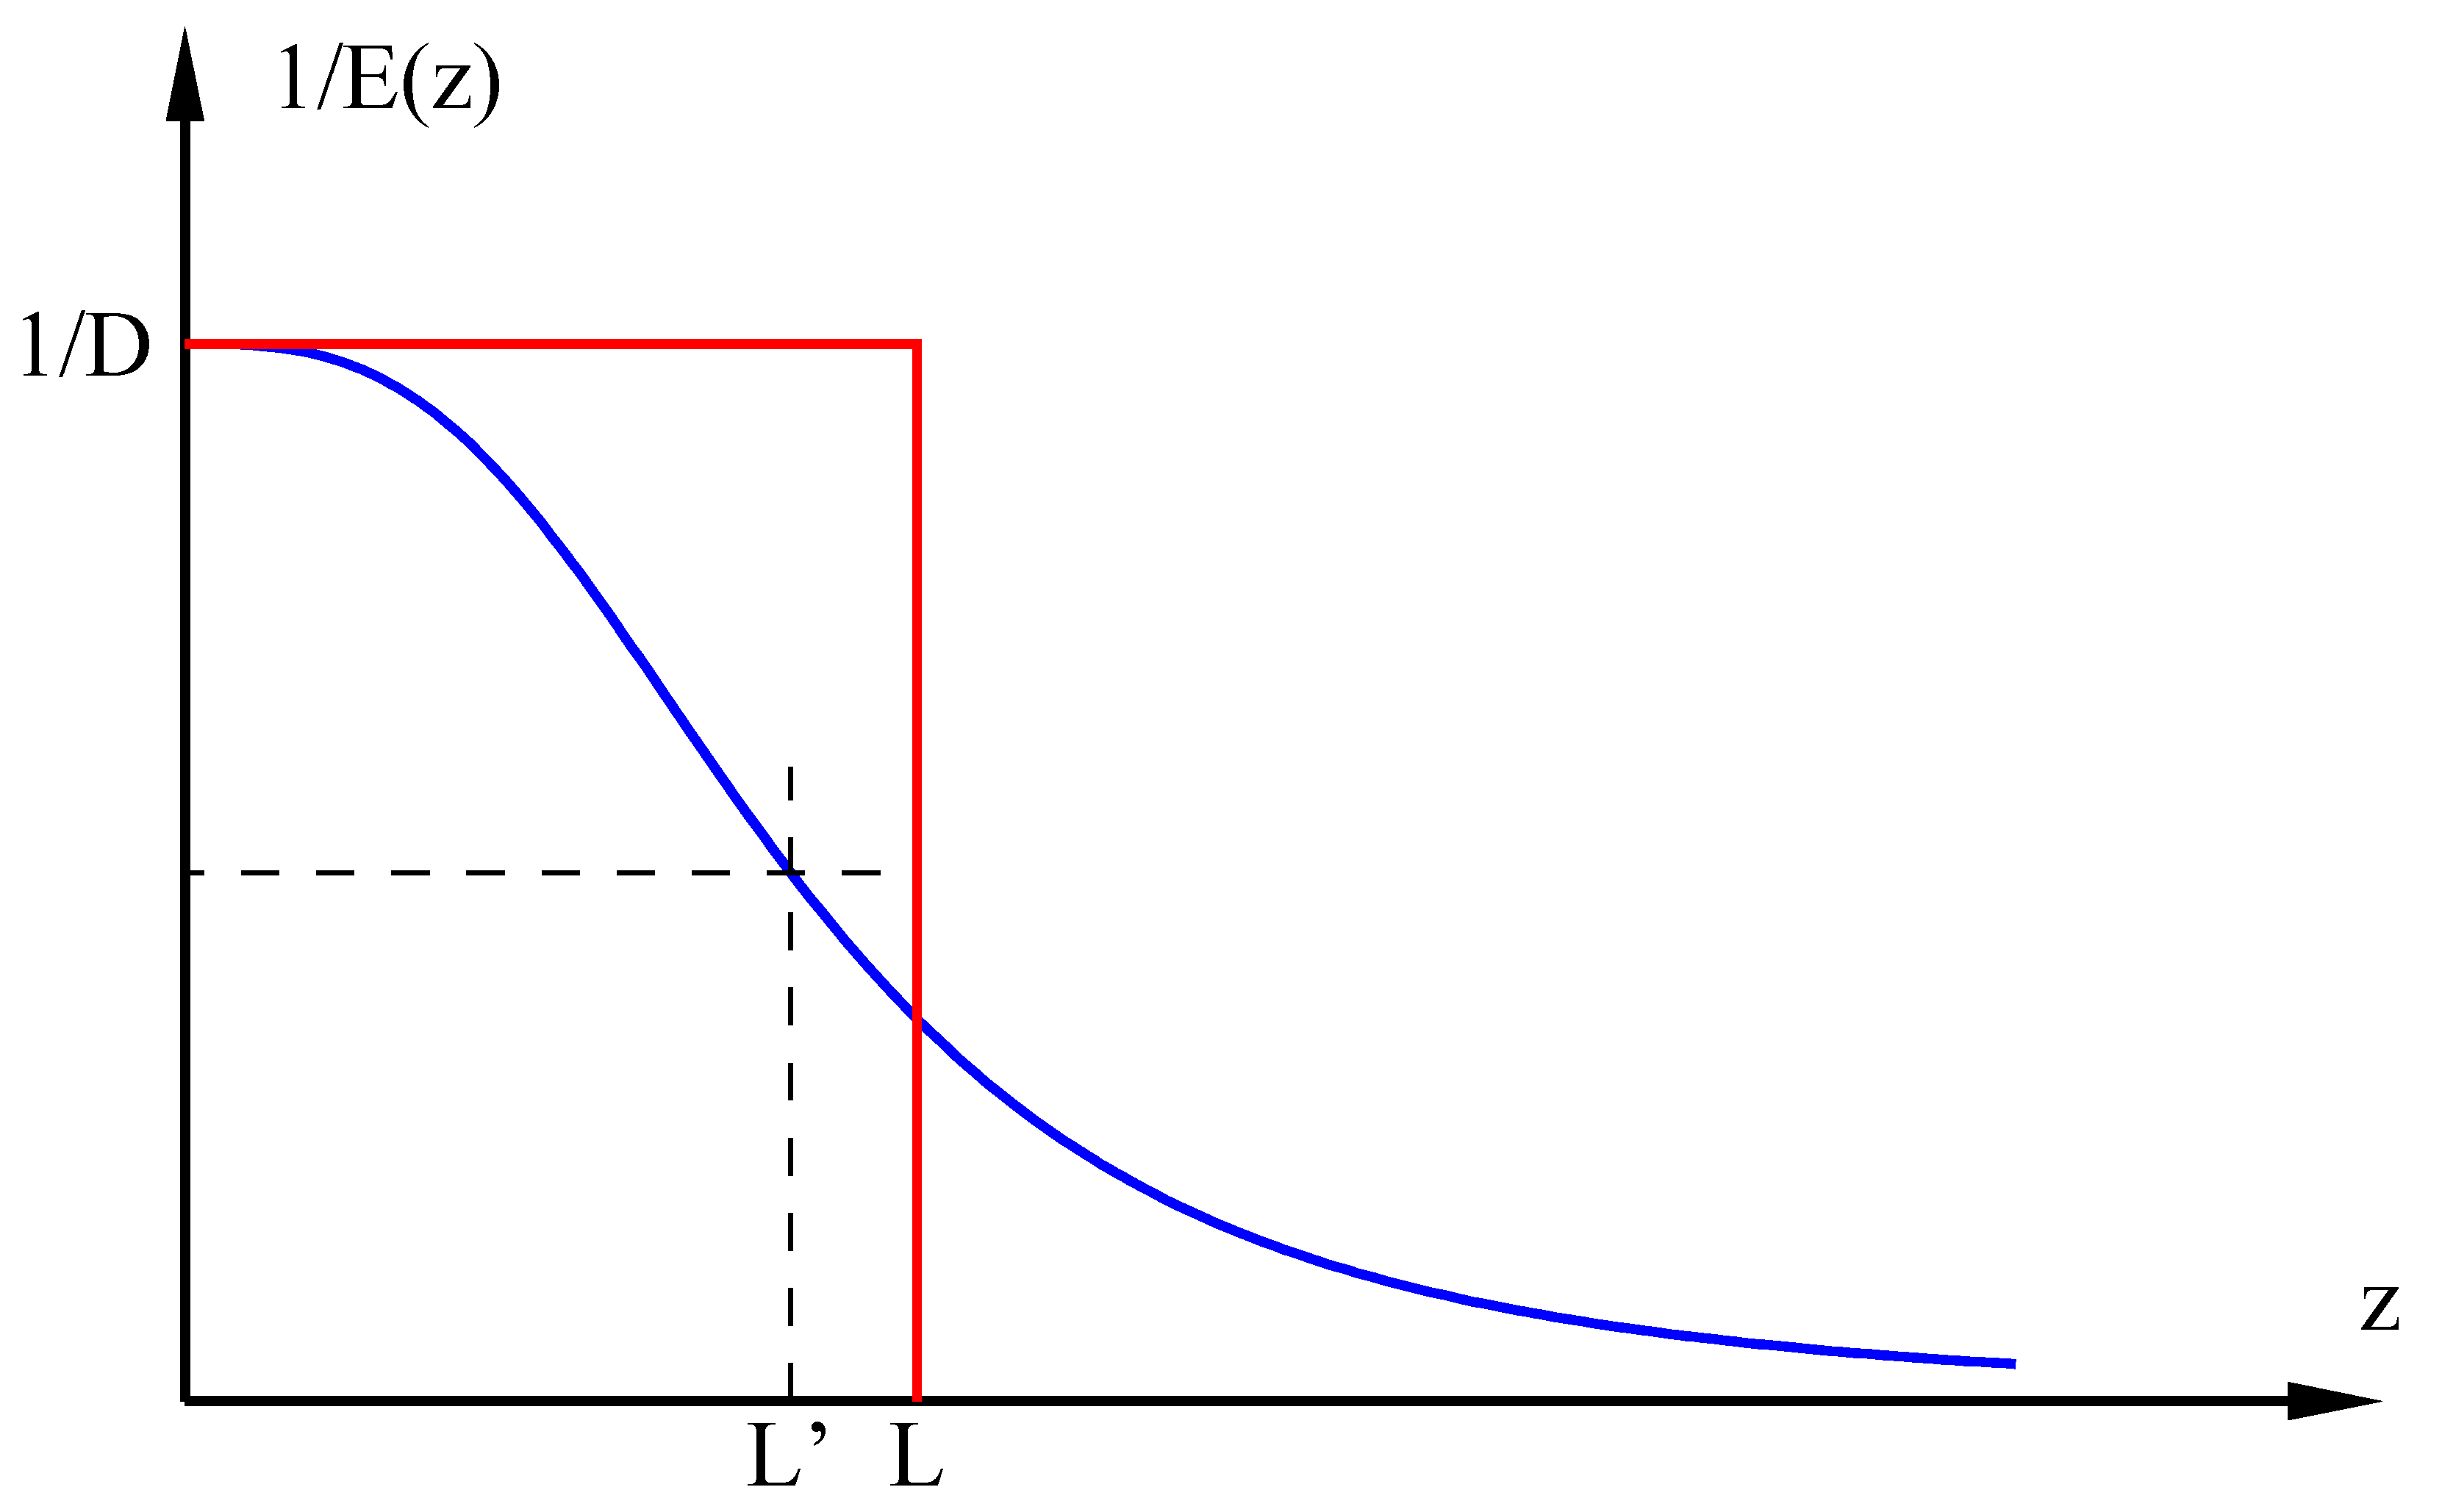
The integrands 1/E(z) of Equations (3) and (4) are both plotted in Figure 3. L′ and 1/D are measures, respectively, of the breadth and height of the area under the blue curve, meaning that Equation (4) gives this scaling law: k   ~   D / L . Equation (3) implies k = D / L . Therefore, when properly chosen, there is a value of L L for which both models give the same k. Because the Whitman model has the same effective film thickness as the Schmidt number model, and because its diffusivity is approximately equal to the eddy diffusivity in the film, we expect that the two models give the same qualitative dynamics.
However, the scaling law k   ~   D / L does not seem to be appropriate for the Schmidt number models, which give k   ~   D 1 / 2 or D 2 / 3 . The explanation of the discrepancy is that L′ is indeed a measure of film thickness, but as a lumped variable, it has its own D dependence. The scaling law for the Schmidt number models emerges from the assumptions (1) that E(0) = D, and (2) that the term in zp is determined only by fluid-dynamic properties of the solvent; no property of the solute, including D, is assumed to enter. Rather, the coefficient of the term in zp is assumed to depend only on three parameters, solvent viscosity η, solvent density ρ, and friction velocity at the interface, u* [42]. For any given p, there is only one combination of these three parameters that yields the correct units. The resultant scaling laws for L′ and k are:
L ~ ( η ρ ) ( p 1 ) / p ( u * ) 1 D 1 / p
k   ~   ( S c ) n u *   w i t h   n = ( p 1 ) / p
Here, S c = η / ρ D is the Schmidt number of the solvent; u* is the friction velocity; and n is 1/2 and 2/3 respectively, when p = 2 or 3. Dependence on wind speed enters L′ through the parameter u*.

5. Properties of the Models

See the Supplementary Material for derivations of all the models and a detailed discussion of their properties. In this section, I summarize some of the more important properties of the models.

5.1. Independent Concentration Variables and Equilibrium Conditions

Because of the interrelations between concentration variables listed in Table 2, only two concentration variables are independent in any of the models. For model A1, C W and C A are the logical choices for independent concentration variables, while for the other models, C 1 W and C 1 A make the most sense. This is because the most natural boundary conditions on the problem are the specification of the far-field concentrations. Then C 2 W and C 2 A are fixed by the far-field equilibrium assumption, Table 2, Row 3. The ratios C 10 A / C 10 W and C 20 A / C 20 W are fixed by the assumption of rapid equilibration across the interface, Table 2, Row 4. The values of C 10 W and C 20 W are fixed by the steady-state requirement that all fluxes through the interface be balanced.
Furthermore, I define the following dimensionless ratio
m = C 1 A H 1 C 1 W
or, for model A1,
m = C A H C W
I use m to replace dependence on C 1 A . m is useful because it indicates whether air or water concentrations are in excess and it indicates the direction of flow between the two phases. For this reason, I call it the “equilibrium indicator.” In any of the models, the total flux through the interface can be factored into three terms:
F = ( 1 m ) C 1 W   f
I observe the convention that positive flux flows from the water to the air. Then m < 1 corresponds to net positive flux, m > 1 to net negative flux, and m = 1 corresponds to equilibrium with zero flux. f plays the role of a mass-transfer coefficient and has units of velocity. It will be written with subscripts “A1,” “A2,” etc., to distinguish between the different models. However, other definitions of the mass-transfer coefficients are found in the literature; for examples, see Section 7.3.

5.2. Converting Model A1 to A1E

Here I give the complete description of model A1E. The total flux for the original Whitman model, model A1 (see the Supplementary Material), is
F = k W k A ( H k A + k W ) ( H C W C A )
with
k W = D W L W ,   k A = D A L A ,   H = C A 0 C W 0
To obtain model A1E, use the effective Henry’s constant, Equation (2), and weighted averages of the diffusivities:
D e A = D 1 A + K A D 2 A 1 + K A
D e W = D 1 W + K W D 2 W 1 + K W
ζ e A = D e A L A = ζ A ( Q A + K A 1 + K A )
ζ e W = D e W L W = ζ W ( Q W + K W 1 + K W )
and write this for the flux:
F A 1 E = ζ e W ζ e A ( H e ζ e A + ζ e W ) [ H e ( C 1 W + C 2 W ) ( C 1 A + C 2 A ) ]
With these substitutions: C 1 A = m H 1 C 1 W , C 2 W = K W C 1 W , C 2 A = K A C 1 A , we can write
F A 1 E = f A 1 E ( 1 m ) C 1 W
where
f A 1 E = ζ e W ζ e A ( H e ζ e A + ζ e W ) H 1 ( 1 + K A )
or
1 f A 1 E = 1 ( Q A + K A ) H 1 ζ A + 1 ( Q W + K W ) ζ W

5.3. Properties of the Models

All the following properties are established fully in the supplementary information.
(1) Whitman showed us [33] that one or the other of the two films is often rate-determining. In such cases, the mass-transfer coefficients depend only on system parameters of the rate-limiting film, and we speak of “air-layer” or “water-layer control”. ζ A ζ W produces air control and vice versa. The two variables RA and RW satisfy R A + R W = 1 (see the supplementary information) and indicate the extent of control by one side or the other. When R A 1 , the system is under air-barrier control; when R W 1 , it is under water barrier control.
(2) In all cases, f A 1 < f A 2 < f A 3 < f A 4 < f A 1 E , but there are limiting cases in which any two may become arbitrarily close. The first two inequalities are not surprising; we expect any kinetic process to speed up when new pathways open up. f A 1 E f A 4 often occurs when the system is under either air- or water-barrier control. It also occurs when the reactions are so fast that the two molecular forms have no individual identity.
(3) fA3 < fA4 always, but they often agree well. Good agreement occurs, for example, whenever flux of 2 through the interface is negligible. However, poor agreement is also observed, indicating that there are conditions in which models A2 or A3 are inadequate. The passage of both forms through the interface should not generally be ignored.
(4) Instances of f A 1 E f A 4 or f A 3 f A 4 are beneficial because of the numerical complexity of model A4. Unfortunately, it is generally not possible to know when the approximations are valid without actually performing the calculations.
(5) The reaction–diffusion distances d1, d2, and d defined in Table 1 measure the typical distance over which molecules diffuse before they react. The dimensionless ratio Λ distinguishes between systems with fast or slow reactions: if Λ << 1, then molecules do not interconvert as they diffuse through the film, while if Λ >> 1, they interconvert many times.
(6) Results of all models simplify in certain limits summarized in Table 3. Models A2 and A3 both involve enhancement factors that change from E 1 (no enhancement) when Λ 1 ,   to E ( Q + K ) / Q when Λ 1 . The enhancement factors can be very large when K >> 1. In model A4, the enhancement terms do not directly factor out of the formulas, but enhancement is occurring as can be seen in Table 3. However, in model A4, the magnitude of the enhancement does not evolve with changing Λ, but remains near (Q + K)/Q for all Λ.
(7) Table 3 lets us identify several regimes for which model A3 and A4 differ significantly; for example, under air-side control when Λ A 1 and K A 1 , and under water-side control when Λ W 1 and K W 1 .

6. Aldehyde ↔ Gem-Diol Reactions

We consider the hydration reaction of formaldehyde to form methanediol:
HCHO + H 2 O CH 2 ( OH ) 2
and of acetaldehyde to form 1,1-ethanediol:
CH 3 COH + H 2 O CH 3 CH ( OH ) 2
In aqueous solution, the diols can continue to add aldehyde units to form higher oligomers [56], but at the aldehyde and diol concentrations expected in the environment, those compounds can be neglected [57].
According to theoretical estimates [21,23] the unimolecular decay rate of methanediol is very low, giving a half-life at 300 K in an extreme vacuum longer than the age of the universe. However, in the atmosphere and in the aqueous phase, the reaction is catalyzed by H2O, by organic and inorganic acids, by bases, and by the hydroperoxyl radical. The reaction is probably also autocatalytic [22,58,59,60]. Calculations also indicate that the acid and radical catalysts may be more efficient than water, although the relative abundance of water still means that it is the most important catalyst.
A half-century ago, Eigen [61] suggested that water catalysis proceeds via a concerted exchange of protons involving two water molecules. That view has been confirmed theoretically, along with the suggestion that three-water catalysis is even faster [21,23,62,63]. These findings imply that the absolute rate constants are probably second or third order in water. The gas-phase pseudo-first-order reaction rates k12A and k21A are then expected to be strong functions of the concentrations of any catalysts and to be slower than the equivalent reactions in the aqueous phase where the catalyst concentration is larger. The air film at the interface is expected to be water saturated, which translates into a strong temperature dependence for k12A and k21A arising from the dependence of absolute humidity on temperature. The aqueous reactions are also catalyzed by H3O+ and OH so that k12W and k21W are pH dependent, and their values are lowest at about pH 7.
The rigorously defined gas-phase equilibrium constant for the reaction aldehyde + H2O ↔ diol is written in terms of the partial pressures of each gas as
κ A = P d i o l   P 0 P a l d e h y d e   P H 2 O
where P0 is a reference pressure of 1 atm. The expression we use for KA is
K A = [ d i o l ] [ a l d e h y d e ] = P d i o l P a l d e h y d e = ( P H 2 O P 0 )   κ A
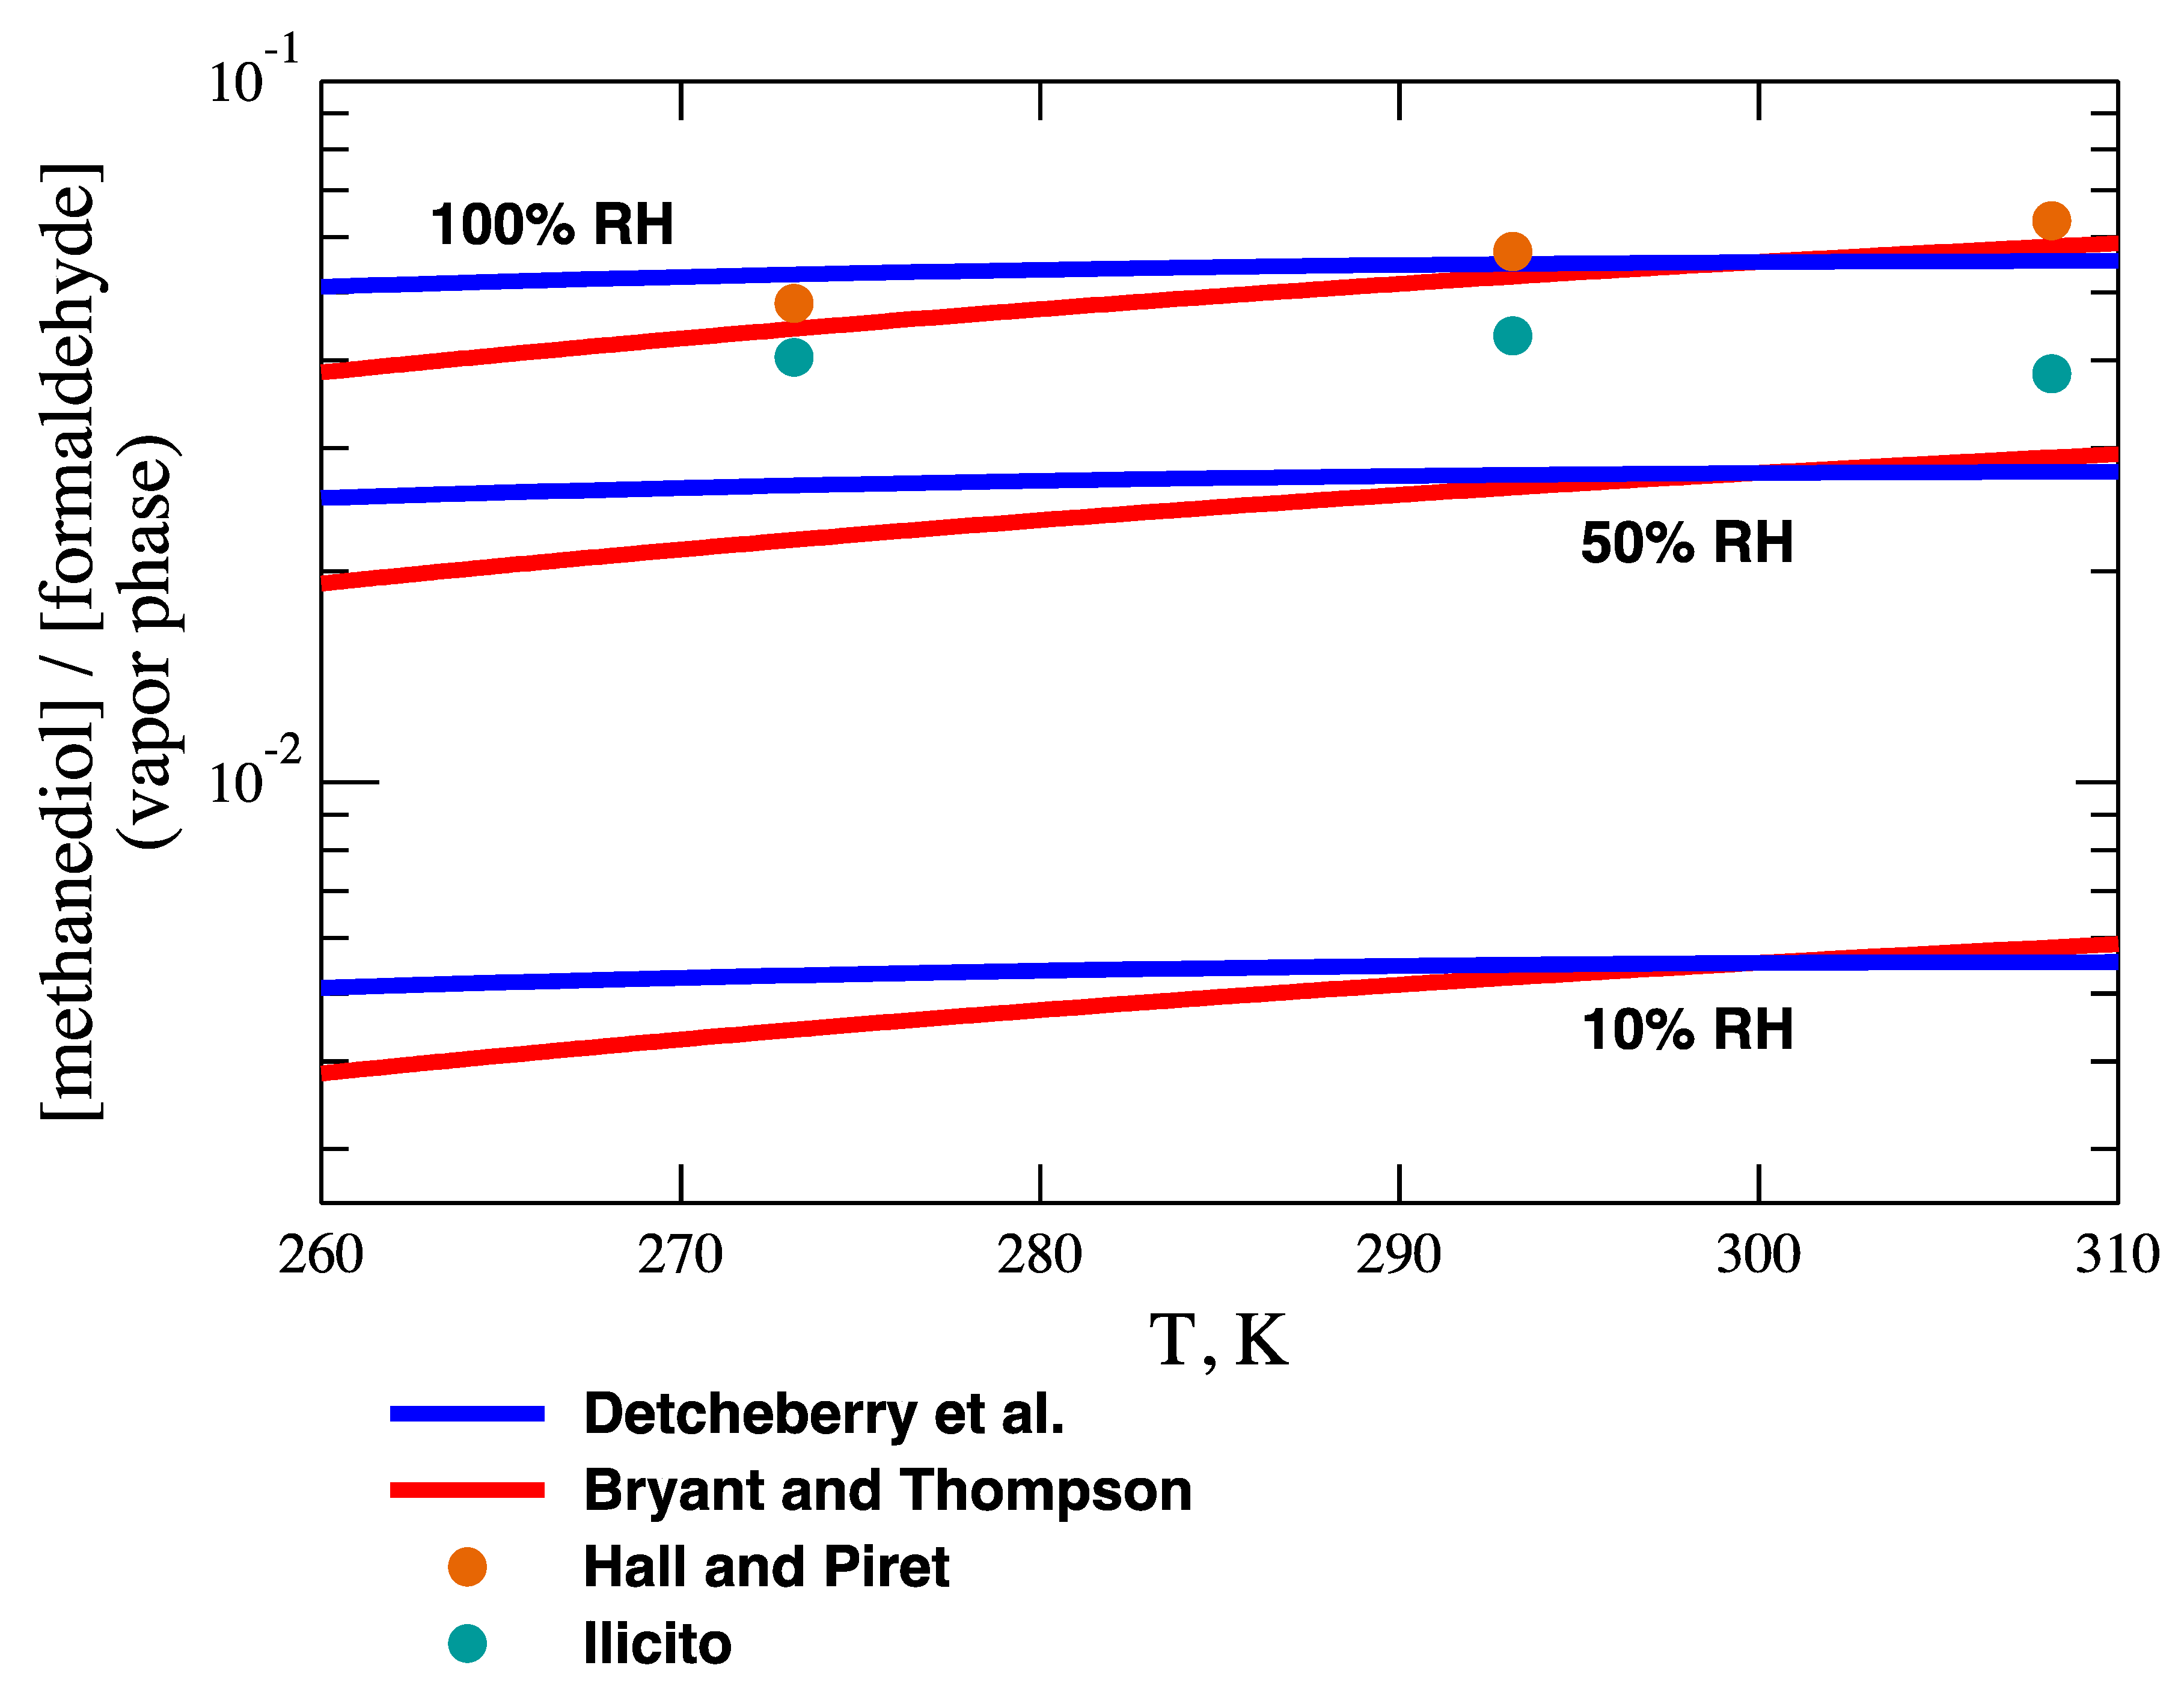
meaning that literature values of κ A must be corrected using the partial pressure of water vapor (0.039 atm at 298.15 K). The rigorous equilibrium constant has strong temperature dependence [64,65], but so does the partial pressure of water vapor [66]. Interestingly, the two effects largely compensate, and KA for the formaldehyde reaction is essentially independent of temperature, as shown in Figure 4. The effect of relative humidity on KA is also displayed in Figure 4. Of course, in the air film at the air–water interface, 100% relative humidity can be assumed.
Table 4 and Table 5 contain literature data on each aldehyde reaction. Henry’s constants H1 for the aldehydes have been retrieved from Sander’s compilation [67]. H2 for the gem-diols does not appear in his compilation, but it is constrained by the values of H1, KA, and KW. Henry’s constants are often difficult to measure, and there is usually considerable scatter in Sander’s compilation for any one compound, often by more than an order of magnitude. Here, I take the median Henry’s constants from the compilation, which appear to be good consensus values. Sander tabulates effective Henry’s constants, He, for formaldehyde and acetaldehyde. Therefore, his entries must also be converted to intrinsic constants.
Molecular diffusivities were calculated using several different empirical correlations [68,69,70,71]. The quantities KW, k12W and k21W have been extensively measured and calculated theoretically. For these quantities, Table 4 and Table 5 report ranges of values equal to the middle half of datasets of independently measured or computed values. The value of the formaldehyde KA is taken from Figure 4 at 100% relative humidity.
Apparently, the only publication considering the equilibrium constant of the vapor-phase hydration of acetaldehyde is a theoretical calculation by Rayne and Forest [83] obtaining κ A 0.005 (geometric mean of three separate estimates) at 298.15 K. For formaldehyde at 298.15 K, Rayne and Forest obtain κ A 0.07 (geometric mean of three separate estimates), whereas experimental values are around 1.75 [64], i.e., the Rayne–Forest formaldehyde estimate is a factor of about 25 too low. Applying the same ratio to acetaldehyde yields κ A 0.12 and K A 0.005 . Therefore, in the following, we will estimate K A 0.005 for acetaldehyde, all the while considering this to be a poorly constrained value.
The rates k12A and k21A have never been measured for either system, but their ratio is constrained by KA. Therefore, the only available constraints on k12A and k21A are k 21 A k 21 W and k 12 A k 12 W , as explained above. In calculations reported below, I have allowed k12A and k21A to vary by about four orders of magnitude while enforcing these constraints.

7. Results

7.1. Numerical Results for Formaldehyde and Acetaldehyde

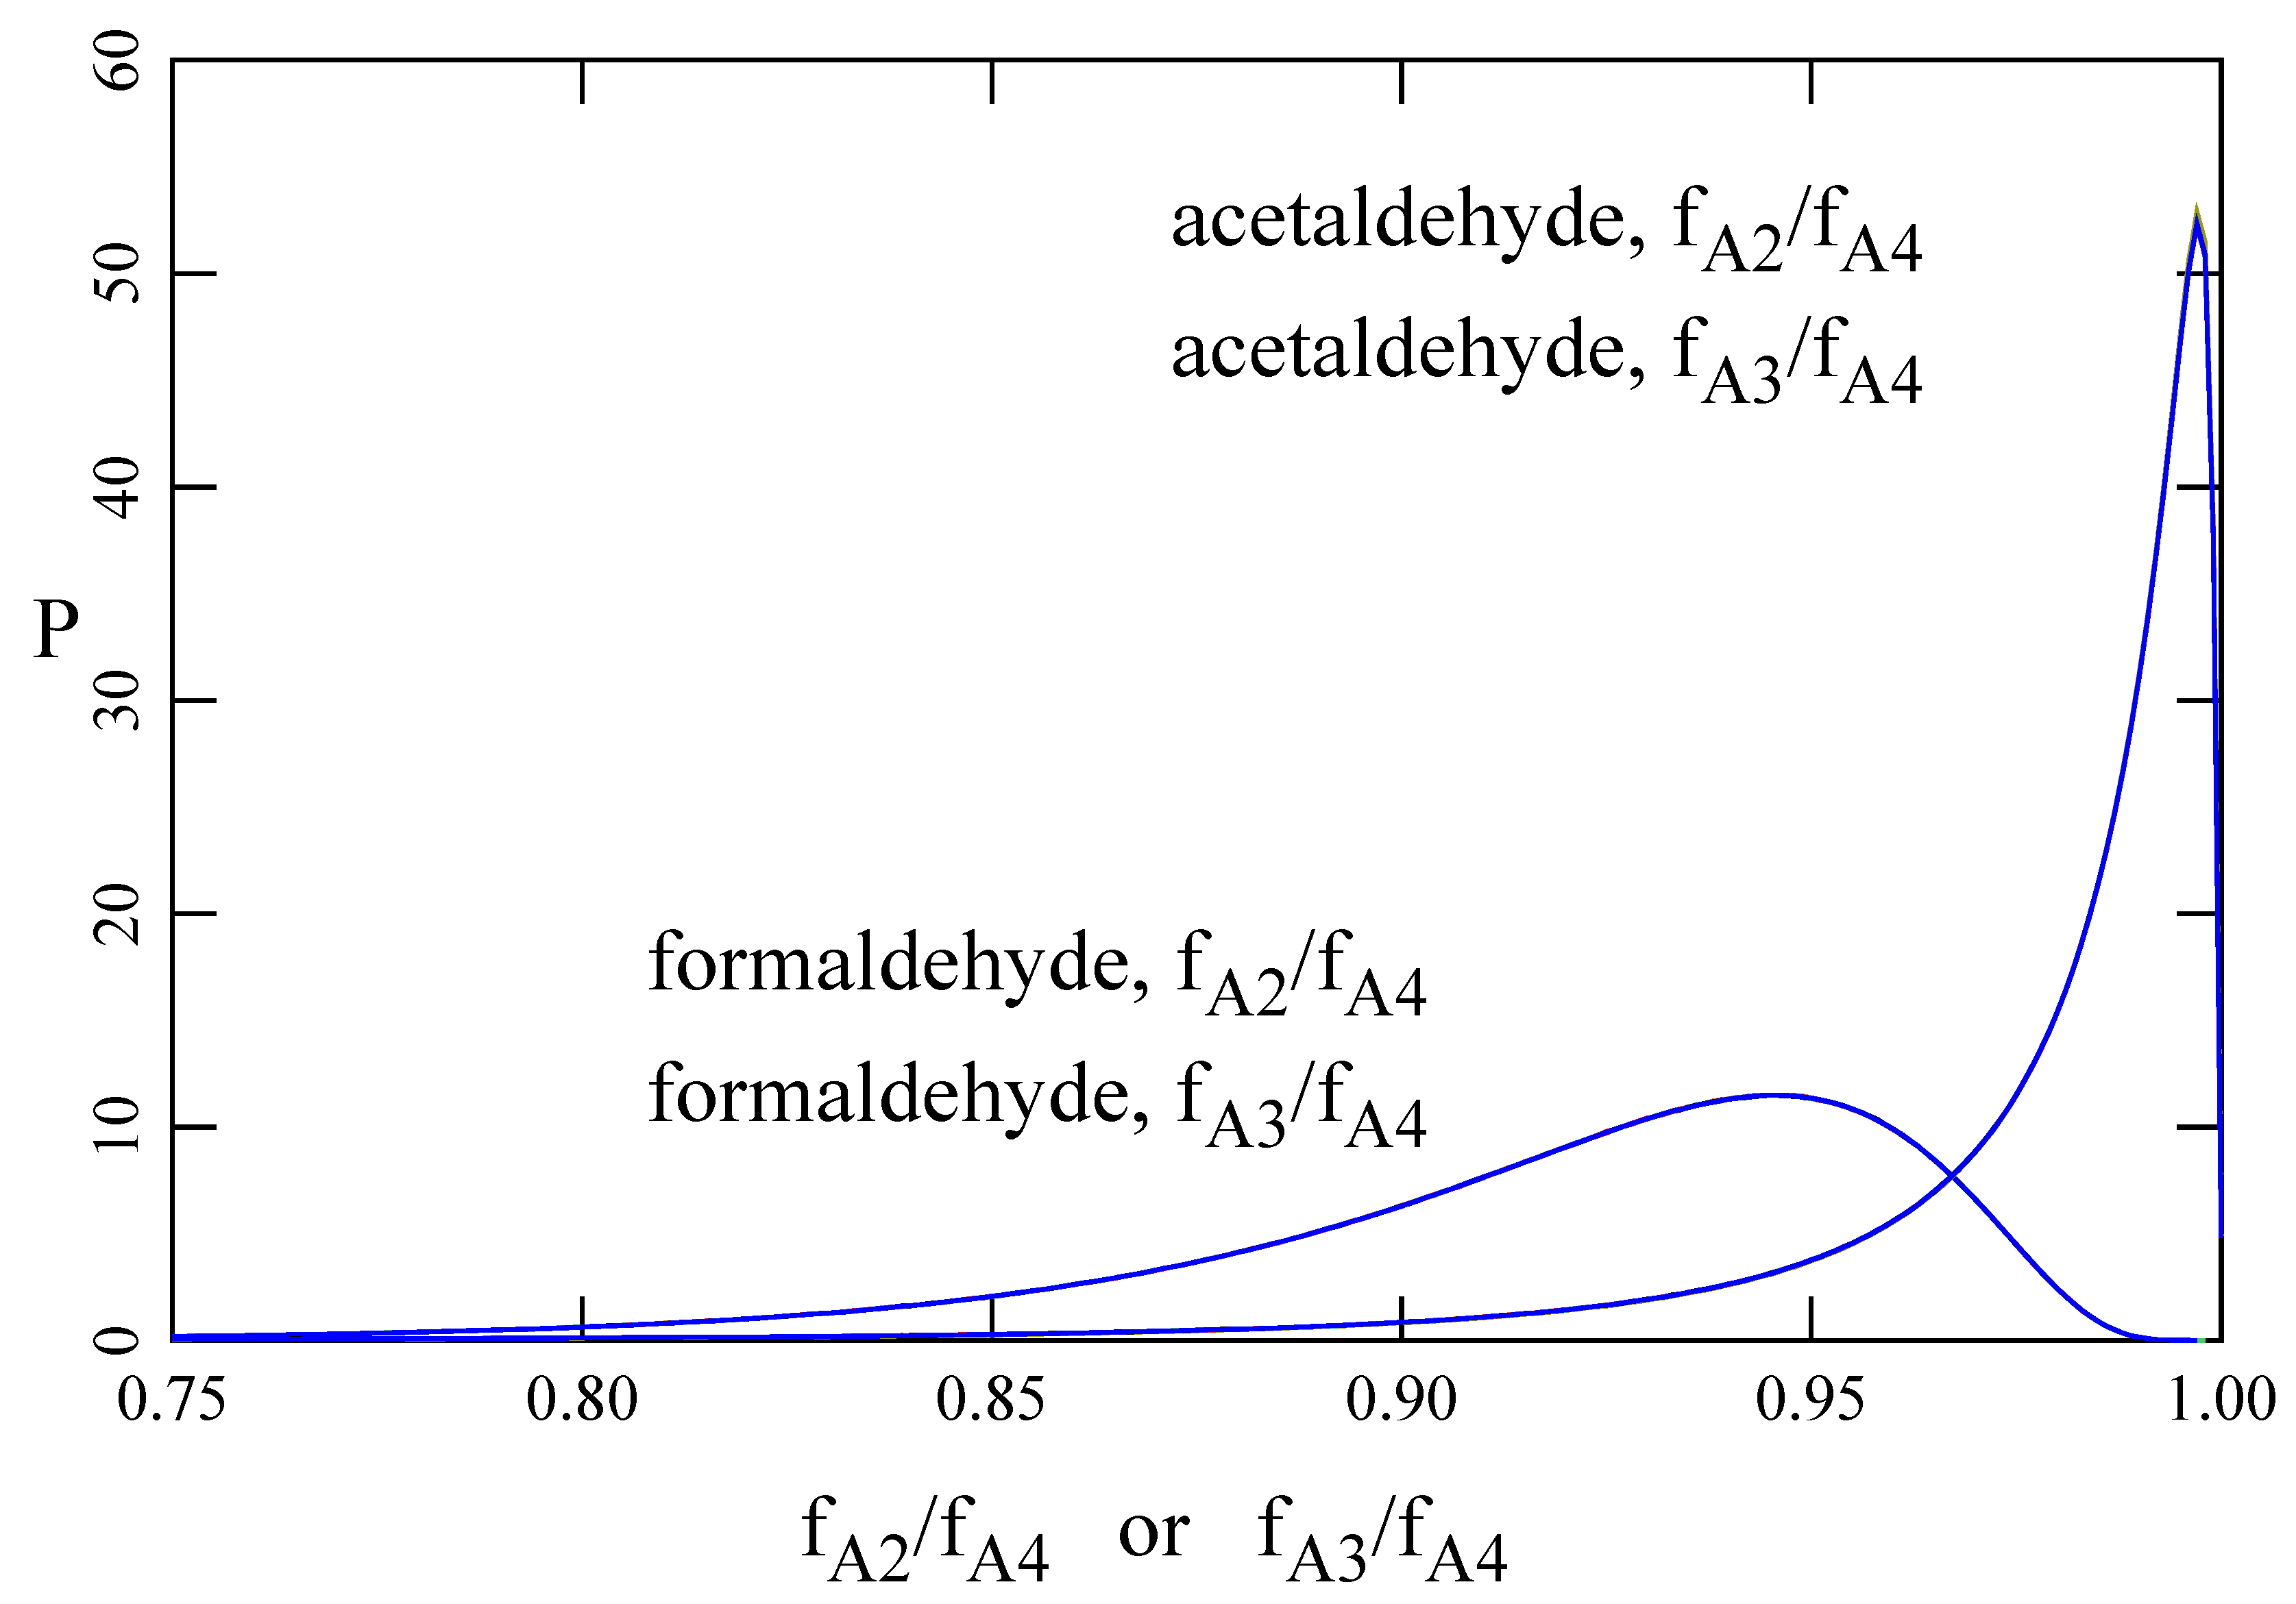
Table 6 summarizes numerical calculations for formaldehyde and acetaldehyde assuming the values given in Table 4 and Table 5. Because it is poorly constrained, k21A was allowed to vary from 10 6   s 1 to 10 2.5   s 1 , but the final results for f are insensitive to this variation. Neither the air- nor the water-side dominates in either system (RA = 0.544 or 0.234). fA1E is 87% and 58% larger than fA4 for formaldehyde and acetaldehyde, respectively, so model A1E is not accurate in these cases. The ratios f A 2 / f A 4 and f A 3 / f A 4 are, respectively, 0.935 and 0.984, so model A3 is adequate for formaldehyde and acetaldehyde.
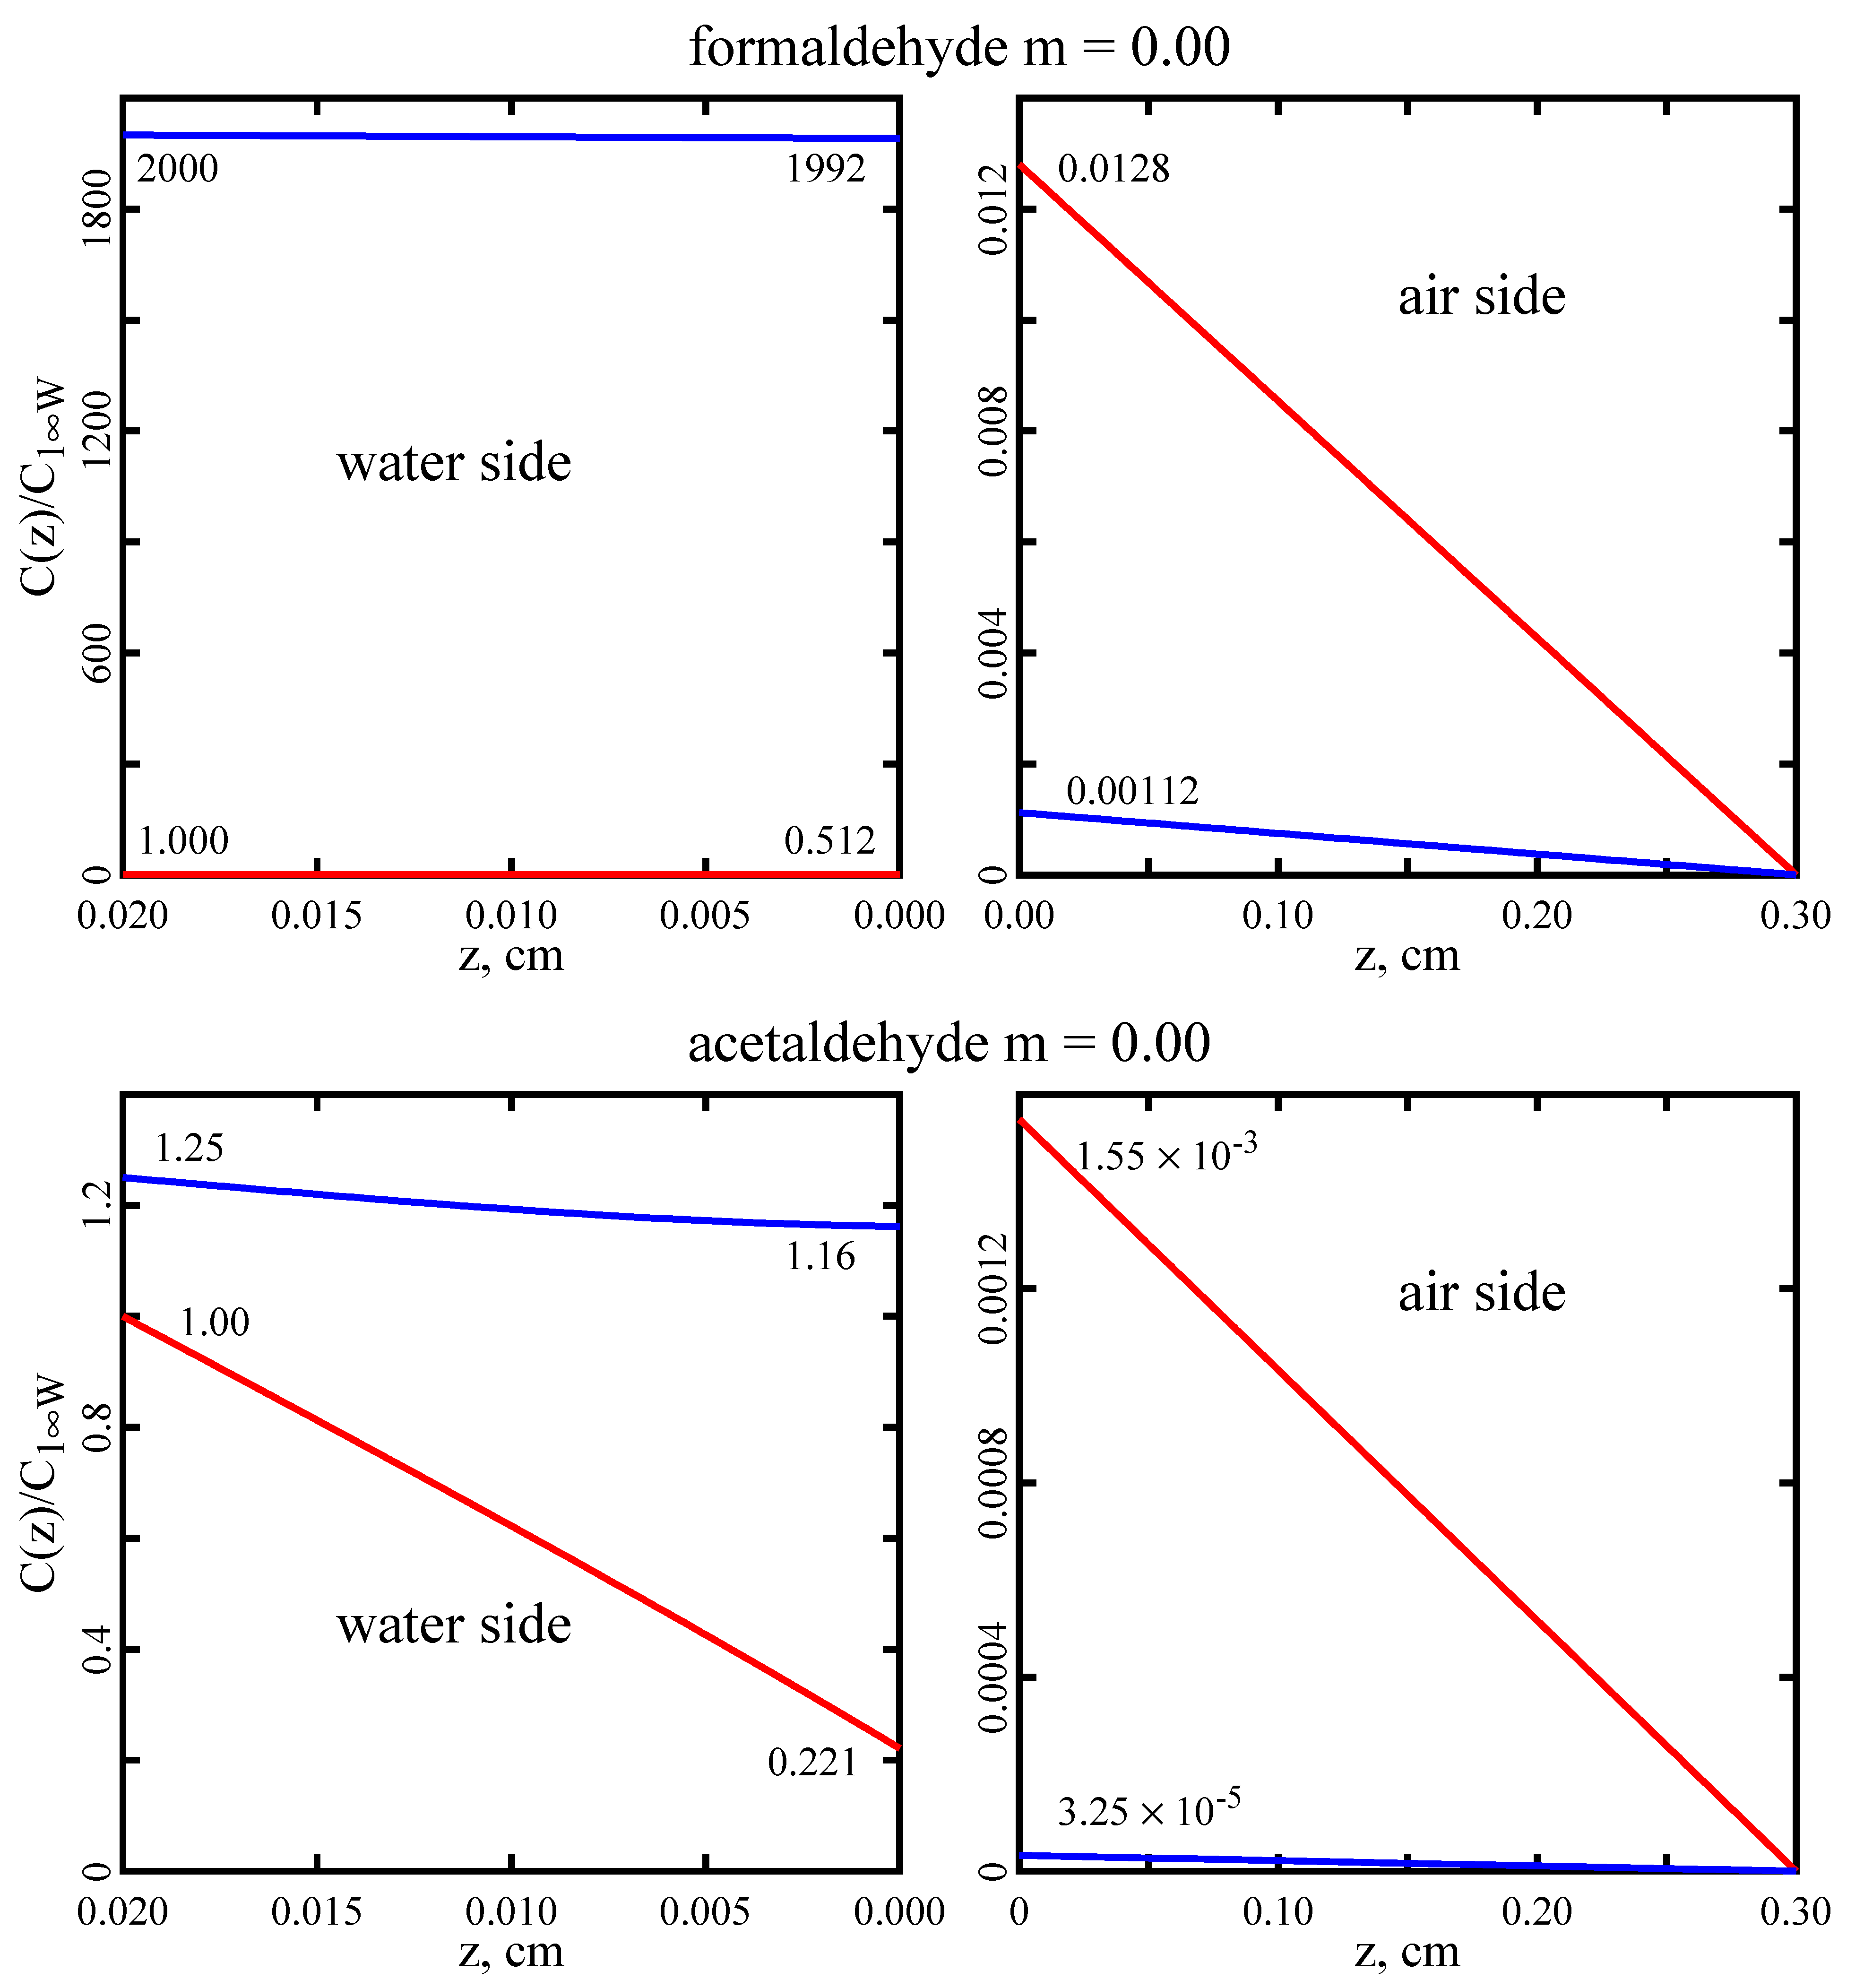
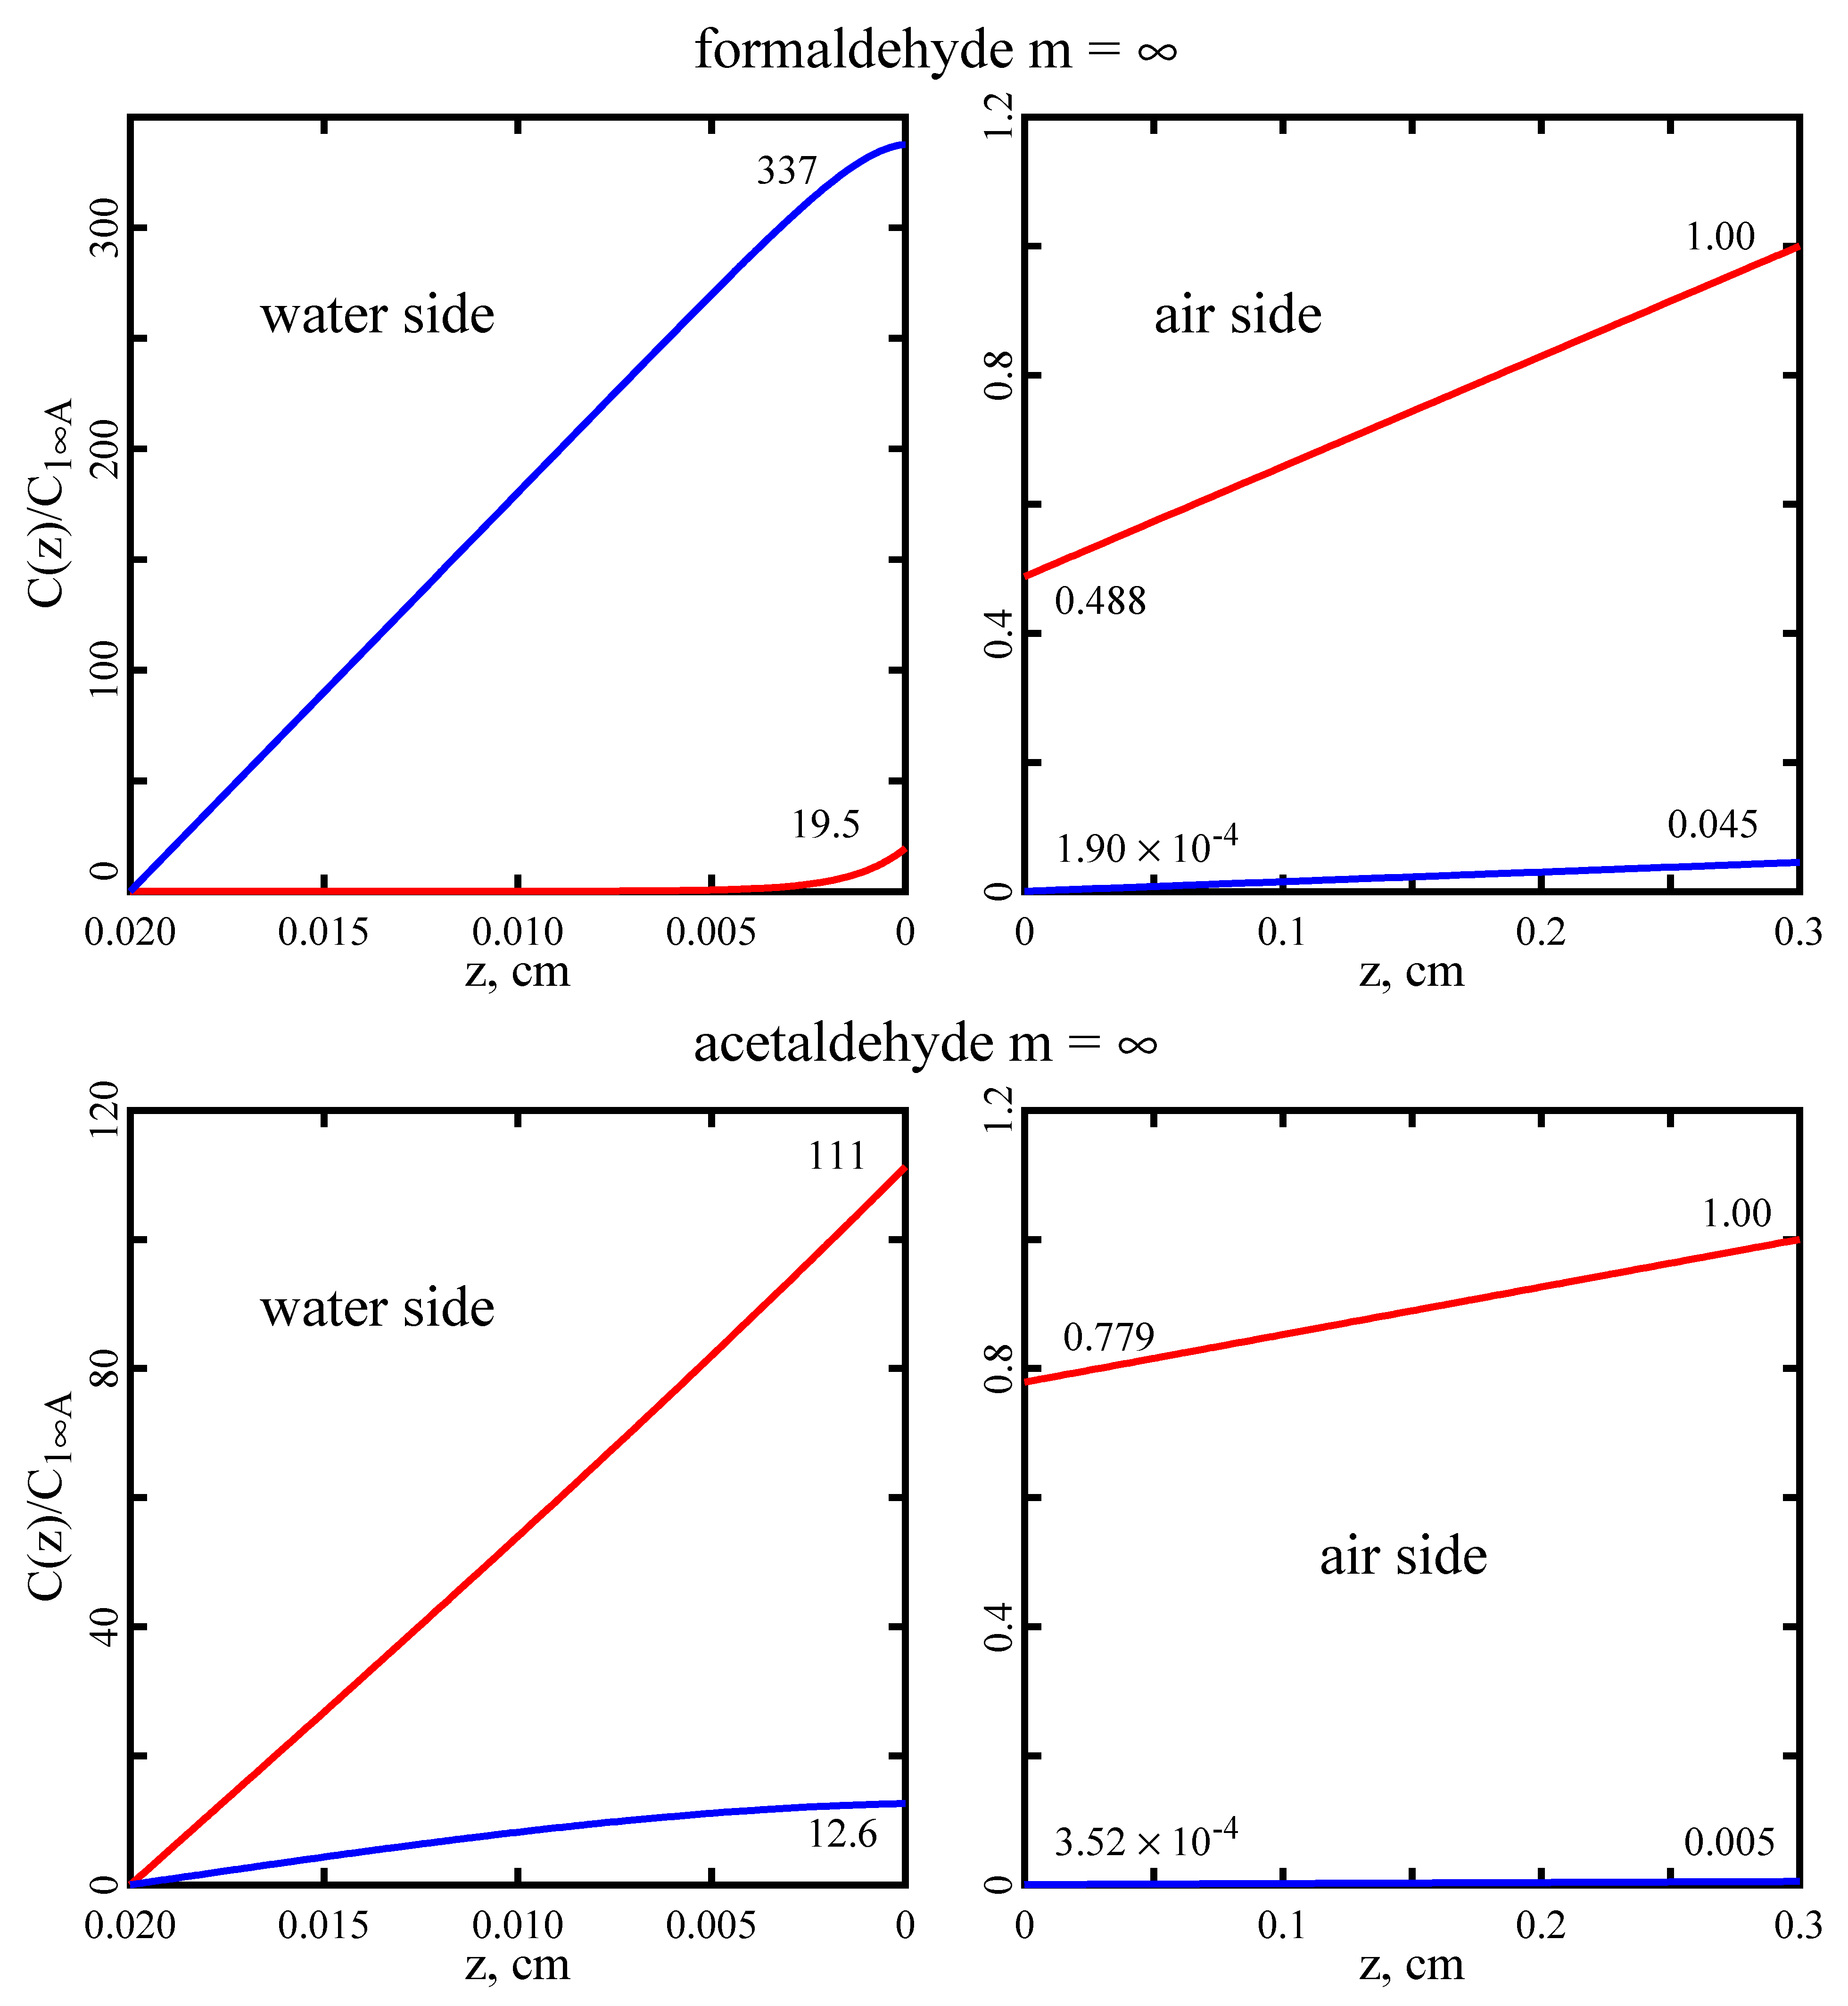
Figure 5 displays concentration profiles in the two films when m = 0 (corresponding to zero far-field concentration in the air side). The [diol]/[aldehyde] ratios are in excess of KA and KW throughout the air and water films. Similarly, Figure 6 displays concentration profiles in the m limit (corresponding to zero far-field concentration in the water side). Then, the [diol]/[aldehyde] ratios fall below KA and KW.

7.2. Sensitivity to Parameter Variations

Most of the variables in Table 4 and Table 5 are sensitive to temperature, humidity, pH, salinity, etc., and are also subject to experimental uncertainty. To judge the impact of such variations on the results, I performed Monte Carlo calculations in which values of the input variables H1, D1W, D2W, D1A, D2A, k12W, k21W, KA, LW, and LA were sampled independently from log-normal distributions
P ( X ) = ( 2 π σ 2 ) 1 / 2 exp [ ( x μ ) 2 2 σ 2 ] ,   x = log 10 X
Consistent with the range of entries in Table 4 and Table 5 and defined in Table 7. The mode of a log-normal distribution is at X = 10 μ , while σ controls the breadth. k21A was allowed to vary subject to the constraints k21A < k21W and k12A < k12W. The variables KW, k12A, and H2 were then calculated to enforce constraints given in Table 2. When σ = 0.15, 95% of the log-normal distribution lies within the range 0.5 × 10 μ and 2 × 10 μ . Because KA for formaldehyde is not well known, its σ has been set at 0.5, which places 95% of the distribution between one order of magnitude below and one order of magnitude above 10 μ . Other less well-constrained variables have been assigned σ’s of 0.2 or 0.3.
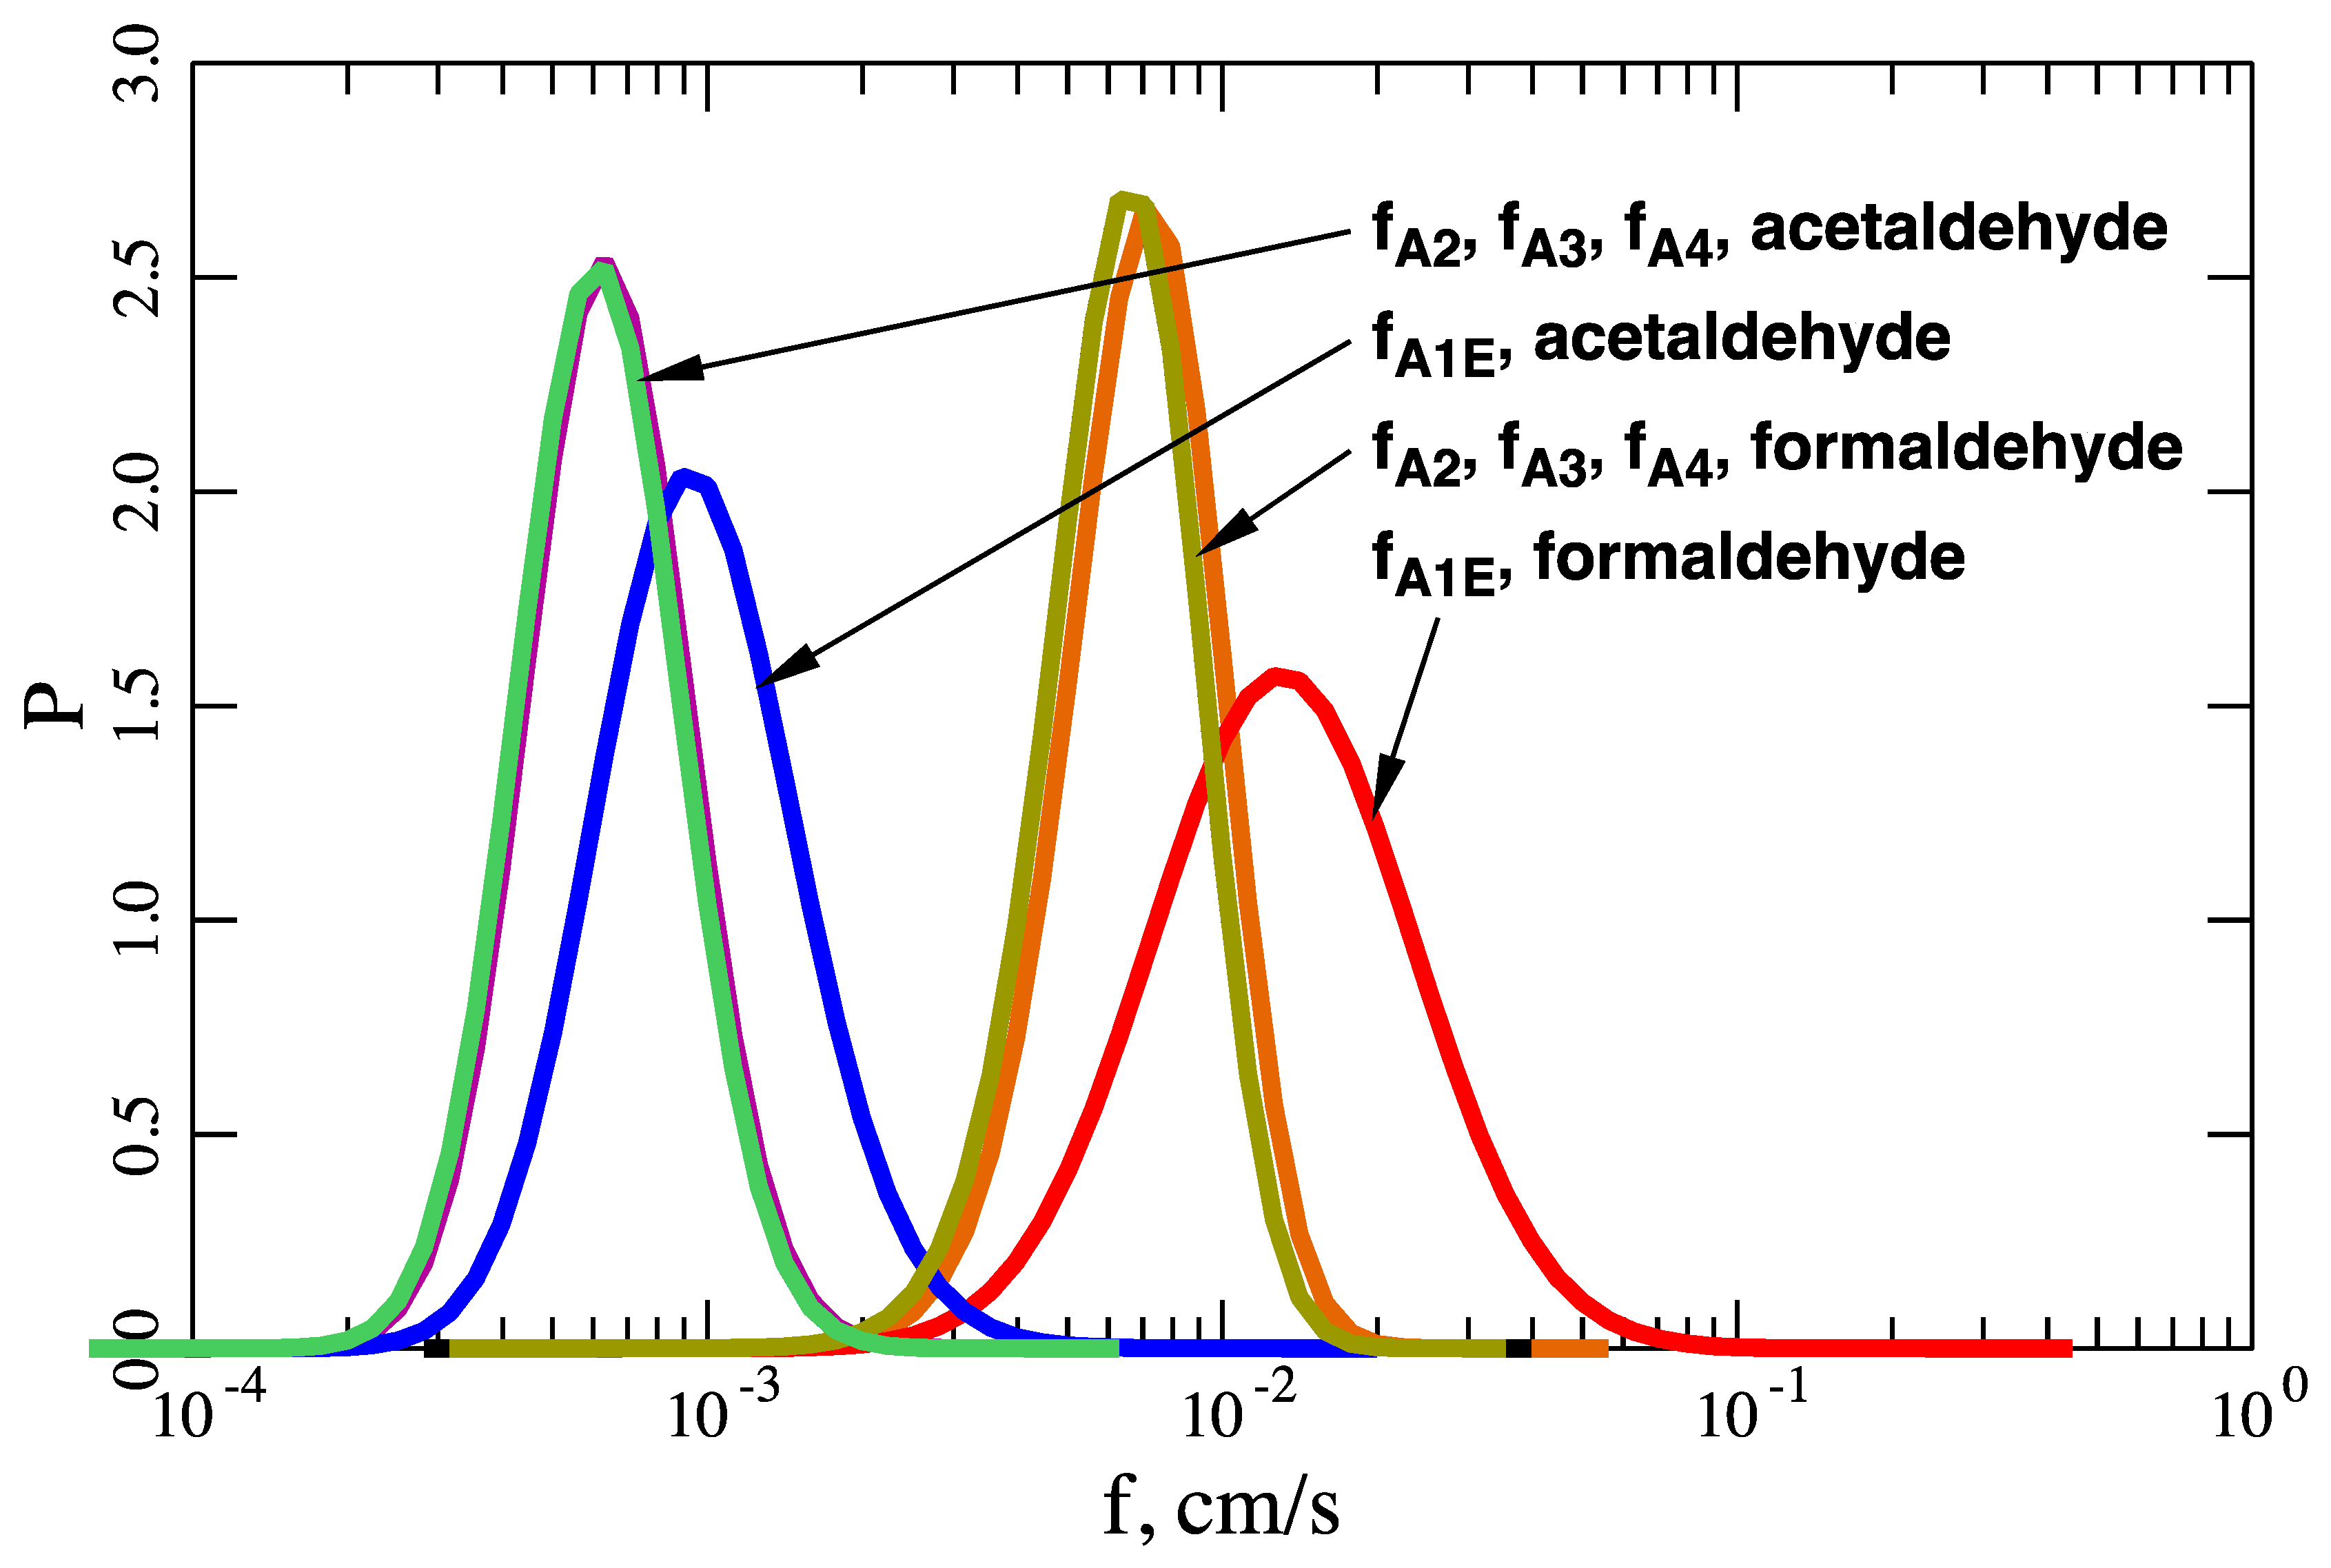
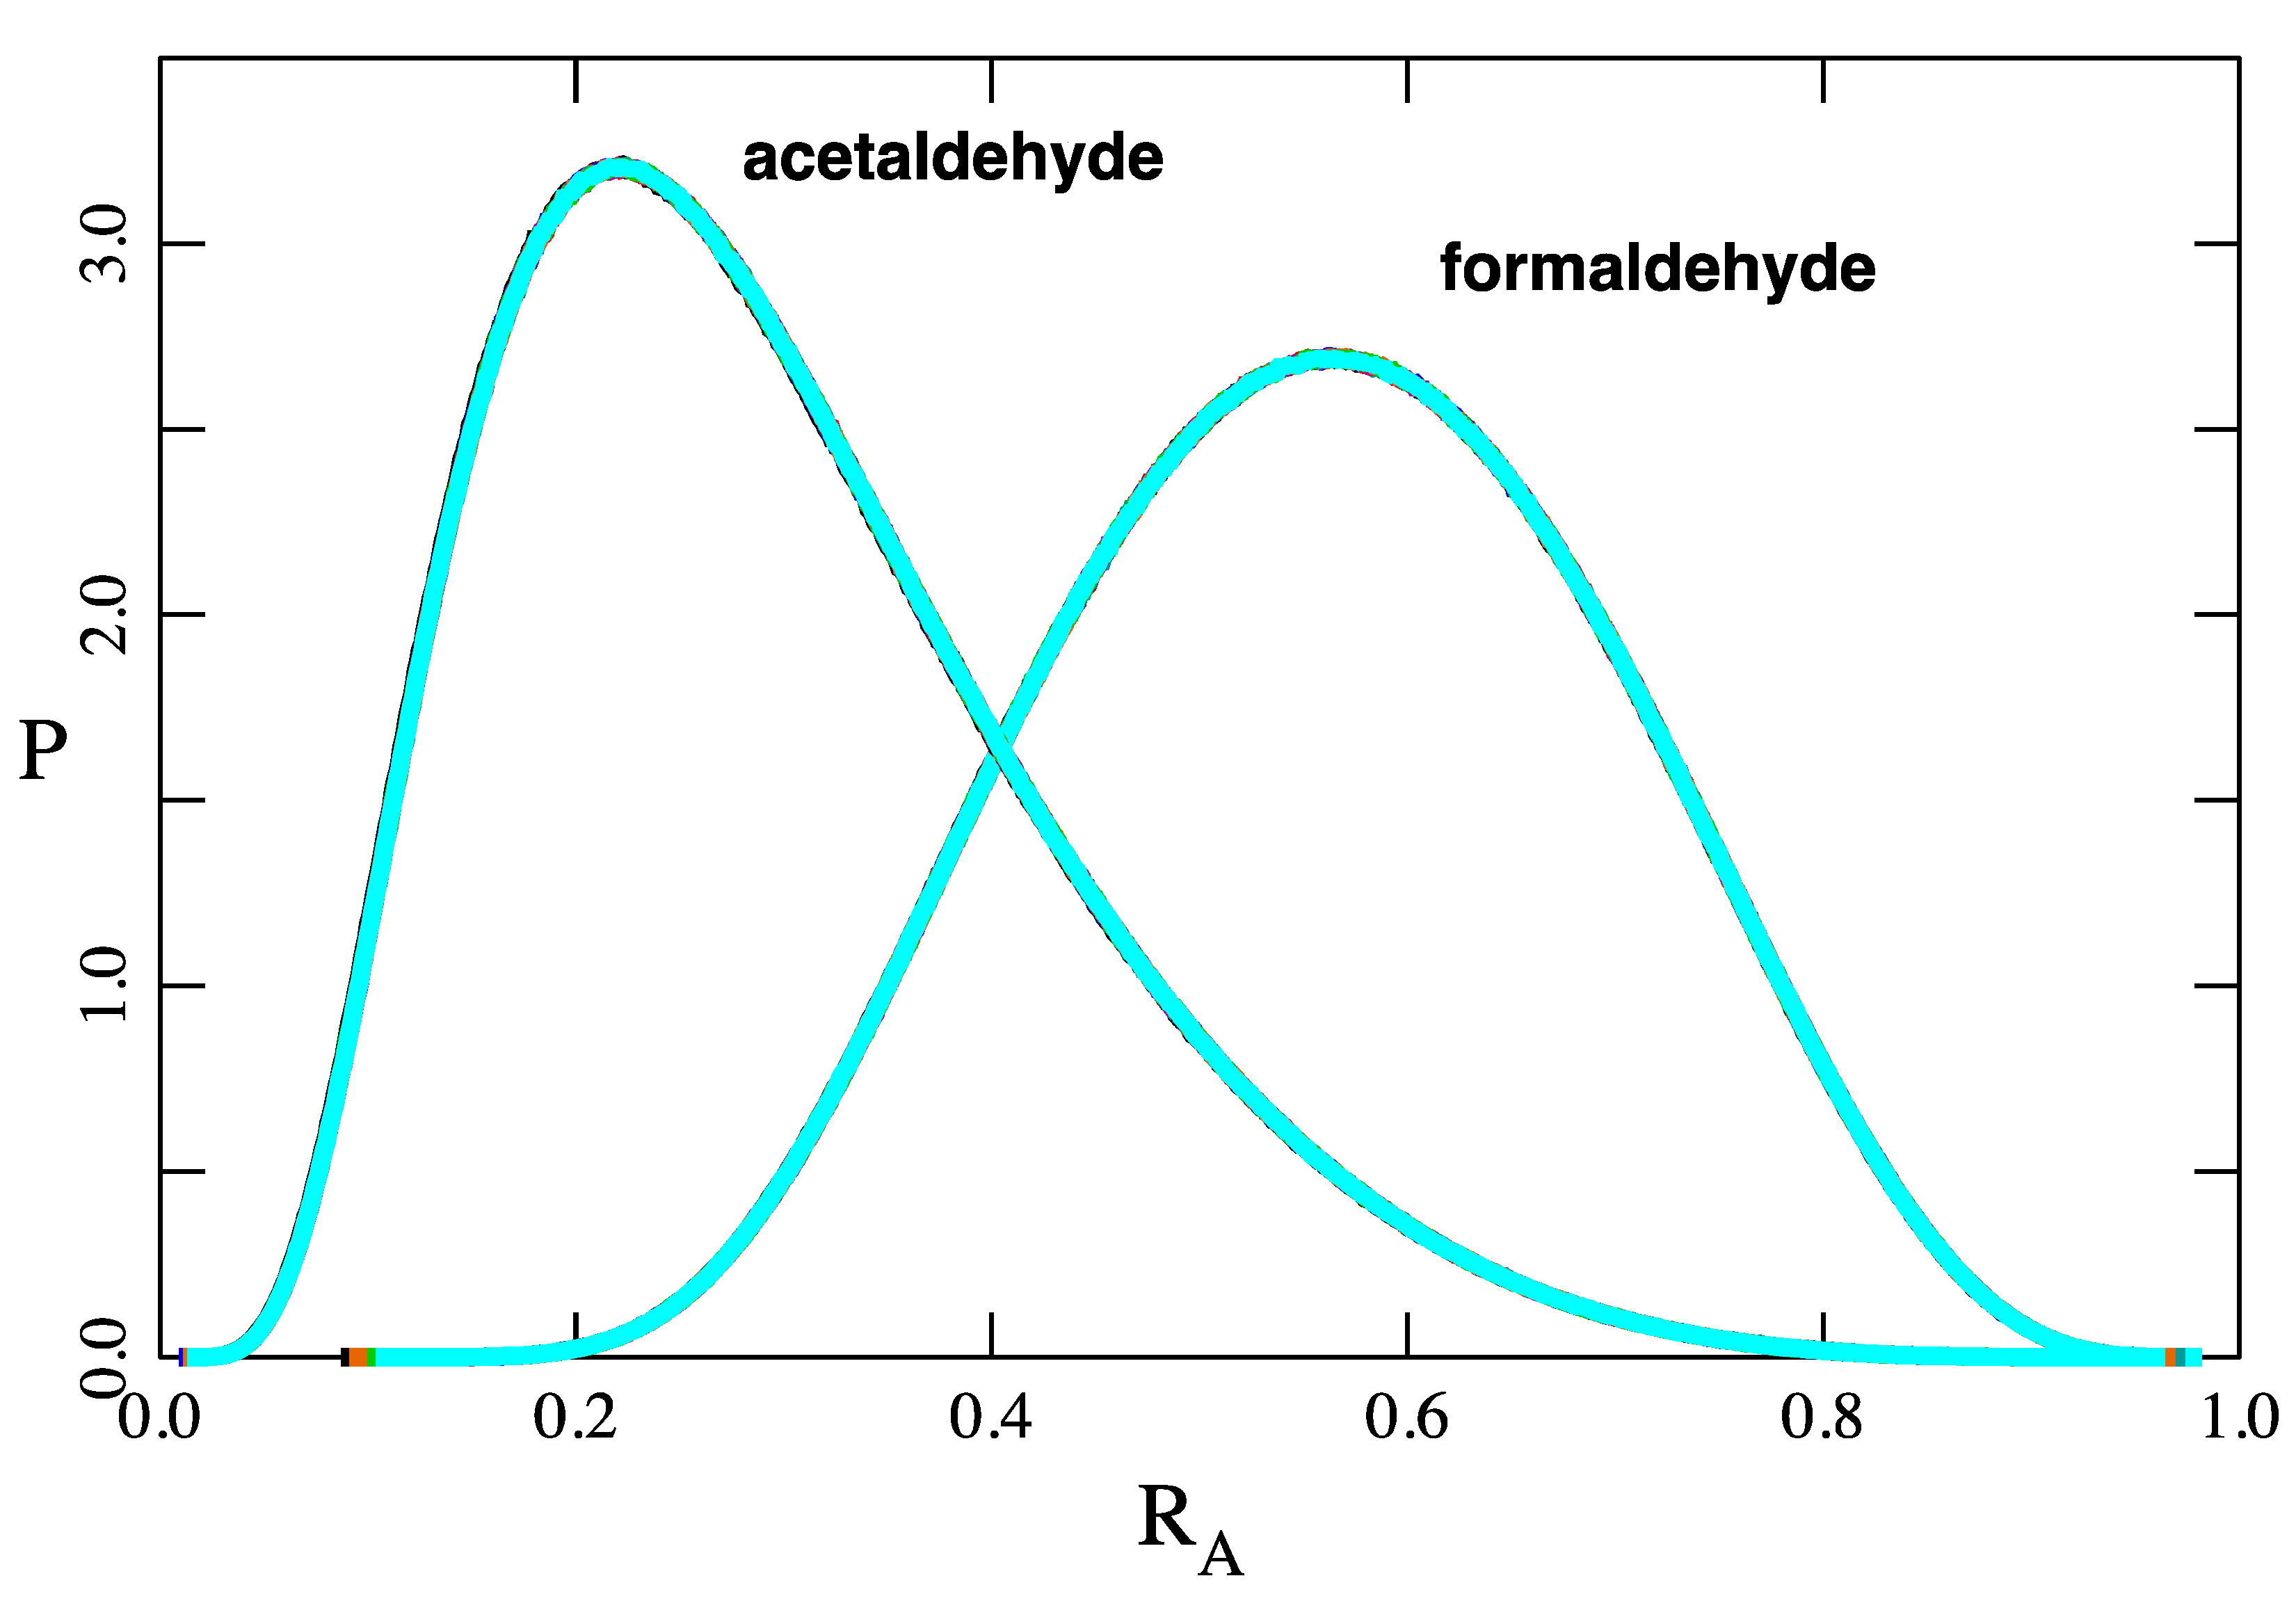
Figure 7 shows the distributions of fA1E, fA2, fA3, and fA4 for both the formaldehyde and acetaldehyde models. The results obviously satisfy the inequalities fA2 < fA3 < fA4 < fA1E, although the fA2, fA3 and fA4 curves are almost completely superimposable. Figure 8 shows the distributions of RA for both models. These rather broad distributions, with RA occurring over much of the available range 0 < RA < 1, indicate that neither model has exclusively air- or water-barrier control. Both models are near a tipping point: modulations of less than an order of magnitude in the model parameters significantly shift the balance between air- and water-control. Figure 9 shows the distributions of the ratios fA1E/fA4, which confirms the inequality fA4 < fA1E. fA1E is on the order of 20% and 50% higher than fA4 for the two respective models. Figure 10 displays the distribution of fA3/fA4 and fA2/fA4 for the formaldehyde and acetaldehyde models. The fA3 and fA2 curves are indistinguishable because fA2 is very near fA3 for these models. For acetaldehyde, fA2 and fA3 are typically 94.5% of fA4, but distributed broadly, while for formaldehyde, the ratio is about 99.7%.

7.3. Comparison with Experiment

Two separate measurement sets are considered here. (1) Seyfioglu and Odabasi [84] measured transport of formaldehyde from air to water, which corresponds to the m limit. In their notation, F = K g C g (with the sign flipped to be consistent with my sign convention). Cg is the gas-phase concentration, equivalent to C 1 A + C 2 A . In the limit m of model A4, F = C 1 A f A 4 / H 1 . Therefore, the connection between the two notations is f A 4 = H 1 ( 1 + K A ) K g . (2) Liu et al. [85] measured He for formaldehyde at 23 °C to be in the range ( 0.896   to   1.23 ) × 10 5 , near the consensus value, 1.3 × 10 5 , reported by Sander [67]. They also measured water-to-air fluxes of formaldehyde. In their notation, F = K 0 L C L , with C L = C 1 W + C 2 W . Compare this with the notation F = C 1 W f A 4 in the m 0 limit of model A4. The connection between the two notations is f A 4 = ( 1 + K W ) K 0 L .
Table 8 compares predictions from data in Table 6 against the two sets of measurements. Wind speeds as cited in each paper have been adjusted to U10, the wind speed at 10 m above the water surface, using the 1/7-th power law [86]. As expected, the data display variations due to variable wind speed or agitation of the water phase. However, the model predictions are all consistent with the experiment, especially at lower wind speeds. In Section 4, we saw that LA or LW are effective film thicknesses, free to be chosen to give agreement with experiment. Therefore, the agreement displayed in Table 8 is mainly a testament to the ability of Schwarzenbach et al. [43] to estimate good LA and LW values.

8. Summary

Volatile gases such as formaldehyde and acetaldehyde undergo hydration reactions in aqueous solution, forming methanediol and 1,1 ethanediol, respectively. Conventional wisdom has dictated that the hydrated forms do not exist in the vapor phase. Therefore, models designed to treat the transport of these compounds between an aqueous phase (oceans, lakes, wastewater lagoons, aqueous aerosols, etc.) and the atmosphere have always assumed that molecules traverse the interface only in the anhydrous form [37,43,53,54,55]. We now know that the conventional wisdom is wrong—the diols exit in the vapor phase [19,20,21,22,23,24]. The hydrated molecules are inherently very stable, but catalysts are readily available in the atmosphere leading to chemical equilibrium between both forms. These equilibria strongly favor the anhydrous form [21,22,23,61,62].
This paper introduces a model of the transport of molecules across the air–water interface that exist in two interconvertible forms, 1 ↔ 2, in both phases and in which both forms are assumed to cross the interface. For formaldehyde and acetaldehyde, the former model (A3) predicts fluxes a few percent less that the new one (A4). However, there are conditions for which the differences between the two models may be much greater.
It is also important to emphasize the difference between intrinsic and effective Henry’s constants. For formaldehyde and acetaldehyde, the model employing an effective Henry’s constant (A1E) overpredicts fluxes by about 90% and 60%, respectively. This is significant because most literature citations report the effective Henry’s constant [67].

Supplementary Materials

The following are available online at https://www.mdpi.com/2073-4433/11/10/1057/s1, Reacting species models.xlsm. Codes the calculation of flux in models A1E, A2, A3, and A4. When prompted, the user should select “Enable Macros”. Reacting species paper supplemental.pdf. Gives derivations and numerical analysis of all models.

Funding

This research was funded by [Uintah County Impact Mitigation Special Services District].

Conflicts of Interest

The authors declare no conflict of interest.

References

  1. Schnell, R.C.; Oltmans, S.J.; Neely, R.; Endres, M.S.; Molenar, J.V.; White, A.B. Rapid photochemical production of ozone at high concentrations in a rural site during winter. Nat. Geosci. 2009, 2, 120–122. [Google Scholar] [CrossRef]
  2. Martin, R.; Moore, K.; Mansfield, M.; Hill, S.; Harper, K.; Shorthill, H. Final Report: Uinta Basin Winter Ozone and Air Quality Study—December 2010–March 2011. 2011. Available online: https://binghamresearch.usu.edu/files/edl_2010-11_report_ozone_final.pdf (accessed on 14 August 2020).
  3. Lyman, S.; Shorthill, H. Final Report: 2012 Uintah Basin Winter Ozone & Air Quality Study. 2013. Available online: https://binghamresearch.usu.edu/files/ubos_2011-12_final_report.pdf (accessed on 14 August 2020).
  4. Lyman, S.; Mansfield, M.; Shorthill, H. Final Report: 2013 Uintah Basin Winter Ozone & Air Quality Study. 2013. Available online: https://binghamresearch.usu.edu/files/2013%20final%20report%20uimssd%20R.pdf (accessed on 14 August 2020).
  5. Air Data: Air Quality Data Collected at Outdoor Monitors Across the US. Available online: https://www.epa.gov/outdoor-air-quality-data (accessed on 14 August 2020).
  6. Edwards, P.M.; Brown, S.S.; Roberts, J.M.; Ahmadov, R.; Banta, R.M.; De Gouw, J.; Dubé, W.P.; Field, R.A.; Flynn, J.H.; Gilman, J.B.; et al. High winter ozone pollution from carbonyl photolysis in an oil and gas basin. Nature 2014, 514, 351–354. [Google Scholar] [CrossRef]
  7. Ahmadov, R.; McKeen, S.; Trainer, M.; Banta, R.; Brewer, A.; Brown, S.; Edwards, P.M.; De Gouw, J.; Frost, G.J.; Gilman, J.; et al. Understanding high wintertime ozone pollution events in an oil- and natural gas-producing region of the western US. Atmos. Chem. Phys. Discuss. 2015, 15, 411–429. [Google Scholar] [CrossRef] [Green Version]
  8. Matichuk, R.; Tonnesen, G.; Luecken, D.; Gilliam, R.; Napelenok, S.L.; Baker, K.R.; Schwede, D.; Murphy, B.; Helmig, D.; Lyman, S.N.; et al. Evaluation of the Community Multiscale Air Quality Model for Simulating Winter Ozone Formation in the Uinta Basin. J. Geophys. Res. Atmos. 2017, 122, 13545–13572. [Google Scholar] [CrossRef] [PubMed]
  9. Lyman, S.; Tran, T. Final Report: Measurement of Carbonyl Emissions from Oil and Gas Sources in the Uintah Basin. 2015. Available online: https://binghamresearch.usu.edu/files/CarbonylEmiss_FnlRprt_31jul2015.pdf (accessed on 14 August 2020).
  10. Lyman, S.N.; Mansfield, M.L.; Tran, H.N.; Evans, J.D.; Jones, C.; O’Neil, T.; Bowers, R.; Smith, A.; Keslar, C. Emissions of organic compounds from produced water ponds I: Characteristics and speciation. Sci. Total Environ. 2018, 619, 896–905. [Google Scholar] [CrossRef] [PubMed] [Green Version]
  11. Tran, H.N.; Lyman, S.N.; Mansfield, M.L.; O’Neil, T.; Bowers, R.L.; Smith, A.P.; Keslar, C. Emissions of organic compounds from produced water ponds II: Evaluation of flux chamber measurements with inverse-modeling techniques. J. Air Waste Manag. Assoc. 2018, 68, 713–724. [Google Scholar] [CrossRef] [PubMed]
  12. Mansfield, M.L.; Tran, H.N.; Lyman, S.N.; Bowers, R.L.; Smith, A.P.; Keslar, C. Emissions of organic compounds from produced water ponds III: Mass-transfer coefficients, composition-emission correlations, and contributions to regional emissions. Sci. Total Environ. 2018, 627, 860–868. [Google Scholar] [CrossRef]
  13. Sumner, A.L.; Shepson, P.B. Snowpack production of formaldehyde and its effect on the Arctic troposphere. Nature 1999, 398, 230–233. [Google Scholar] [CrossRef]
  14. Hutterli, M.A.; Röthlisberger, R.; Bales, R.C. Atmosphere-to-snow-to-firn transfer studies of HCHO at Summit, Greenland. Geophys. Res. Lett. 1999, 26, 1691–1694. [Google Scholar] [CrossRef] [Green Version]
  15. Perrier, S.; Houdier, S.; Dominé, F.; Cabanes, A.; Legagneux, L.; Sumner, A.L.; Shepson, P.B. Formaldehyde in Arctic snow. Incorporation into ice particles and evolution in the snowpack. Atmos. Environ. 2002, 36, 2695–2705. [Google Scholar] [CrossRef]
  16. Dash, J.G.; Fu, H.; Wettlaufer, J.S. The premelting of ice and its environmental consequences. Rep. Prog. Phys. 1995, 58, 115–167. [Google Scholar] [CrossRef]
  17. Petrenko, V.F.; Whitworth, R.W. Physics of Ice; Oxford University Press: Oxford, UK, 1999. [Google Scholar]
  18. Dash, J.G.; Rempel, A.W.; Wettlaufer, J.S. The physics of premelted ice and its geophysical consequences. Rev. Mod. Phys. 2006, 78, 695–741. [Google Scholar] [CrossRef] [Green Version]
  19. Hall, M.W.; Piret, E.L. Distillation Principles of Formaldehyde Solutions-State of Formaldehyde in the Vapor Phase. Ind. Eng. Chem. 1949, 41, 1277–1286. [Google Scholar] [CrossRef]
  20. Gold, A.; Utterback, D.F.; Millington, D.S. Quantitative analysis of gas-phase formaldehyde molecular species at equilibrium with formalin solution. Anal. Chem. 1984, 56, 2879–2882. [Google Scholar] [CrossRef] [PubMed]
  21. Kent, D.R.; Widicus, S.L.; Blake, G.A.; Goddard, W.A. A theoretical study of the conversion of gas phase methanediol to formaldehyde. J. Chem. Phys. 2003, 119, 5117–5120. [Google Scholar] [CrossRef] [Green Version]
  22. Hazra, M.K.; Francisco, J.S.; Sinha, A. Gas Phase Hydrolysis of Formaldehyde to Form Methanediol: Impact of Formic Acid Catalysis. J. Phys. Chem. A 2013, 117, 11704–11710. [Google Scholar] [CrossRef] [PubMed]
  23. Inaba, S. Theoretical Study of Decomposition of Methanediol in Aqueous Solution. J. Phys. Chem. A 2015, 119, 5816–5825. [Google Scholar] [CrossRef]
  24. Bai, Z.; Liu, H.; Liu, Y.; Wu, L. Prediction of the vapor–liquid equilibrium of chemical reactive systems containing formaldehyde using the COSMO-RS method. Fluid Phase Equilibria 2016, 415, 125–133. [Google Scholar] [CrossRef]
  25. Terlouw, J.K.; Lebrilla, C.B.; Schwarz, H. Thermolysis of NH4HCO3—A Simple Route to the Formation of Free Carbonic Acid (H2CO3) in the Gas Phase. Angew. Chem. Int. Ed. 1987, 26, 354–355. [Google Scholar] [CrossRef]
  26. Hage, W. Carbonic Acid in the Gas Phase and Its Astrophysical Relevance. Science 1998, 279, 1332–1335. [Google Scholar] [CrossRef]
  27. Loerting, T.; Tautermann, C.S.; Kroemer, R.T.; Kohl, I.; Hallbrucker, A.; Mayer, E.; Liedl, K.R. On the Surprising Kinetic Stability of Carbonic Acid (H2CO3). Angew. Chem. Int. Ed. 2000, 39, 891–894. [Google Scholar] [CrossRef]
  28. Mori, T.; Suma, K.; Sumiyoshi, Y.; Endo, Y. Spectroscopic detection of isolated carbonic acid. J. Chem. Phys. 2009, 130, 204308. [Google Scholar] [CrossRef] [PubMed]
  29. Chiavarino, B.; Crestoni, M.-E.; Fornarini, S.; Lanucara, F.; Lemaire, J.; Maître, P. Mid-IR Spectroscopy and Structural Features of Protonated Carbonic Acid in the Gas Phase. ChemPhysChem 2009, 10, 520–522. [Google Scholar] [CrossRef] [PubMed]
  30. Bernard, J.; Seidl, M.; Kohl, I.; Liedl, K.R.; Mayer, E.; Gálvez, Ó.; Grothe, H.; Loerting, T. Back Cover: Spectroscopic Observation of Matrix-Isolated Carbonic Acid Trapped from the Gas Phase (Angew. Chem. Int. Ed. 8/2011). Angew. Chem. Int. Ed. 2011, 50, 1946. [Google Scholar] [CrossRef]
  31. Bernard, J.; Huber, R.G.; Liedl, K.R.; Grothe, H.; Loerting, T. Matrix Isolation Studies of Carbonic Acid—The Vapor Phase above the β-Polymorph. J. Am. Chem. Soc. 2013, 135, 7732–7737. [Google Scholar] [CrossRef]
  32. De Marothy, S.A. Autocatalytic decomposition of carbonic acid. Int. J. Quantum Chem. 2013, 113, 2306–2311. [Google Scholar] [CrossRef]
  33. Whitman, W.G. The Two-Film Theory of Gas Absorption. Chem. Metall. Eng. 1923, 29, 146–148. [Google Scholar] [CrossRef]
  34. Higbie, R. The Rate of Adsorption of a Pure Gas into a Still Liquid During Short Periods of Exposure. Trans. Am. Ins. Chem. Eng. 1935, 35, 365–389. [Google Scholar]
  35. Danckwerts, P.V. Significance of Liquid-Film Coefficients in Gas Absorption. Ind. Eng. Chem. 1951, 43, 1460–1467. [Google Scholar] [CrossRef]
  36. Danckwerts, P.V.; Kennedy, A.M. Kinetics of Liquid-Film Process in Gas Absorption. Part, I. Models of the Absorption Process. Trans. Inst. Chem. Eng. 1954, 32, S101–S104. [Google Scholar]
  37. Danckwerts, P.V. Gas absorption accompanied by chemical reaction. AIChE J. 1955, 1, 456–463. [Google Scholar] [CrossRef]
  38. Toor, H.L.; Marchello, J.M. Film-penetration model for mass and heat transfer. AIChE J. 1958, 4, 97–101. [Google Scholar] [CrossRef]
  39. Harriott, P. A random eddy modification of the penetration theory. Chem. Eng. Sci. 1962, 17, 149–154. [Google Scholar] [CrossRef]
  40. Deacon, E.L. Gas transfer to and across an air-water interface. Tellus 1977, 29, 363–374. [Google Scholar] [CrossRef]
  41. Deacon, E.L. Sea-Air Gas Transfer: The Wind Speed Dependence. Bound. Layer Meteorol. 1981, 21, 31–37. [Google Scholar] [CrossRef]
  42. Jähne, B.; Haußecker, H. Air-Water Gas Exchange. Annu. Rev. Fluid Mech. 1998, 30, 443–468. [Google Scholar] [CrossRef]
  43. Schwarzenbach, R.P.; Gschwend, P.M.; Imboden, D.M. Environmental Organic Chemistry, 2nd ed.; Wiley-Interscience: Hoboken, NJ, USA, 2003. [Google Scholar]
  44. Möller, U.; Schumann, G. Mechanisms of transport from the atmosphere to the Earth’s surface. J. Geophys. Res. Space Phys. 1970, 75, 3013–3019. [Google Scholar] [CrossRef]
  45. Tamir, A.; Merchuk, J. Effect of diffusivity on gas-side mass transfer coefficient. Chem. Eng. Sci. 1978, 33, 1371–1374. [Google Scholar] [CrossRef]
  46. Mackay, D.; Yeun, A.T.K. Mass transfer coefficient correlations for volatilization of organic solutes from water. Environ. Sci. Technol. 1983, 17, 211–217. [Google Scholar] [CrossRef]
  47. Holmén, K.; Liss, P. Models for air-water gas transfer: An experimental investigation. Tellus 1984, 36B, 92–100. [Google Scholar] [CrossRef]
  48. Liss, P.S.; Merlivat, L. Air-Sea Gas Exchange Rates: Introduction and Synthesis. In The Role of Air-Sea Exchange in Geochemical Cycling; Buat-Ménard, P., Ed.; D. Reidel Publishing: Dordrecht, The Netherlands, 1986; pp. 113–127. [Google Scholar]
  49. Jähne, B.; Münnich, K.O.; Bösinger, R.; Dutzi, A.; Huber, W.; Libner, P. On the parameters influencing air-water gas exchange. J. Geophys. Res. Space Phys. 1987, 92, 1937–1949. [Google Scholar] [CrossRef]
  50. Asher, W.E.; Pankow, J.F. Prediction of gas/water mass transport coefficients by a surface renewal model. Environ. Sci. Technol. 1991, 25, 1294–1300. [Google Scholar] [CrossRef]
  51. Watson, A.J.; Upstill-Goddard, R.C.; Liss, P.S. Air–sea gas exchange in rough and stormy seas measured by a dual-tracer technique. Nature 1991, 349, 145–147. [Google Scholar] [CrossRef]
  52. Clark, J.F.; Schlosser, P.; Wanninkhof, R.; Simpson, H.J.; Schuster, W.S.F.; Ho, D.T. Gas transfer velocities for SF6 and 3He in a small pond at low wind speeds. Geophys. Res. Lett. 1995, 22, 93–96. [Google Scholar] [CrossRef] [Green Version]
  53. Marangozis, J.; Trass, O.; Johnson, A.I. Mass transfer in turbulent flow with and without chemical reaction. Can. J. Chem. Eng. 1963, 41, 195–202. [Google Scholar] [CrossRef]
  54. Hoover, T.E.; Berkshire, D.C. Effects of hydration on carbon dioxide exchange across an air-water interface. J. Geophys. Res. Space Phys. 1969, 74, 456–464. [Google Scholar] [CrossRef]
  55. Glasscock, D.A.; Rochelle, G.T. Numerical simulation of theories for gas absorption with chemical reaction. AIChE J. 1989, 35, 1271–1281. [Google Scholar] [CrossRef]
  56. Walker, J.F. Formaldehyde; Reinhold: New York, NY, USA, 1964. [Google Scholar]
  57. Winkelman, J.; Voorwinde, O.; Ottens, M.; Beenackers, A.; Janssen, L. Kinetics and chemical equilibrium of the hydration of formaldehyde. Chem. Eng. Sci. 2002, 57, 4067–4076. [Google Scholar] [CrossRef] [Green Version]
  58. Greenzaid, P.; Luz, Z.; Samuel, D. A Nuclear Magnetic Resonance Study of the Reversible Hydration of Aliphatic Aldehydes and Ketones. II. The Acid-Catalyzed Oxygen Exchange of Acetaldehyde. J. Am. Chem. Soc. 1967, 89, 756–759. [Google Scholar] [CrossRef]
  59. Kumar, M.; Francisco, J.S. The Role of Catalysis in Alkanediol Decomposition: Implications for General Detection of Alkanediols and Their Formation in the Atmosphere. J. Phys. Chem. A 2015, 119, 9821–9833. [Google Scholar] [CrossRef]
  60. Kumar, M.; Anglada, J.M.; Francisco, J.S. Role of Proton Tunneling and Metal-Free Organocatalysis in the Decomposition of Methanediol: A Theoretical Study. J. Phys. Chem. A 2017, 121, 4318–4325. [Google Scholar] [CrossRef] [PubMed]
  61. Eigen, M. Kinetics of proton transfer processes. Discuss. Faraday Soc. 1965, 39, 7–15. [Google Scholar] [CrossRef]
  62. Wolfe, S.; Kim, C.-K.; Yang, K.; Weinberg, N.; Shi, Z. Hydration of the Carbonyl Group. A Theoretical Study of the Cooperative Mechanism. J. Am. Chem. Soc. 1995, 117, 4240–4260. [Google Scholar] [CrossRef]
  63. Kua, J.; Avila, J.E.; Lee, C.G.; Smith, W.D. Mapping the Kinetic and Thermodynamic Landscape of Formaldehyde Oligomerization under Neutral Conditions. J. Phys. Chem. A 2013, 117, 12658–12667. [Google Scholar] [CrossRef] [PubMed]
  64. Bryant, W.M.D.; Thompson, J.B. Chemical thermodynamics of polymerization of formaldehyde in an aqueous environment. J. Polym. Sci. Part A-1: Polym. Chem. 1971, 9, 2523–2540. [Google Scholar] [CrossRef]
  65. Detcheberry, M.; Destrac, P.; Meyer, X.-M.; Condoret, J.-S. Phase equilibria of aqueous solutions of formaldehyde and methanol: Improved approach using UNIQUAC coupled to chemical equilibria. Fluid Phase Equilibria 2015, 392, 84–94. [Google Scholar] [CrossRef] [Green Version]
  66. Seinfeld, J.H.; Pandis, S.N. Atmospheric Chemistry and Physics, 2nd ed.; Wiley-Interscience: Hoboken, NJ, USA, 2006; p. 765. [Google Scholar]
  67. Sander, R. Compilation of Henry’s law constants (version 4.0) for water as solvent. Atmos. Chem. Phys. Discuss. 2015, 15, 4399–4981. [Google Scholar] [CrossRef] [Green Version]
  68. Wilke, C.R.; Chang, P. Correlation of diffusion coefficients in dilute solutions. AIChE J. 1955, 1, 264–270. [Google Scholar] [CrossRef]
  69. Fuller, E.N.; Schettler, P.D.; Giddings, J.D. New method for prediction of binary gas-phase diffusion coefficients. Ind. Eng. Chem. 1966, 58, 18–27. [Google Scholar] [CrossRef]
  70. Hayduk, W.; Minhas, B.S. Correlations for prediction of molecular diffusivities in liquids. Can. J. Chem. Eng. 1982, 60, 295–299. [Google Scholar] [CrossRef]
  71. Johnson, M. A numerical scheme to calculate temperature and salinity dependent air-water transfer velocities for any gas. Ocean Sci. 2010, 6, 913–932. [Google Scholar] [CrossRef] [Green Version]
  72. Greenzaid, P.; Luz, Z.; Samuel, D. A Nuclear Magnetic Resonance Study of the Reversible Hydration of Aliphatic Aldehydes and Ketones. I. Oxygen-17 and Proton Spectra and Equilibrium Constants. J. Chem. Soc. 1967, 89, 749–756. [Google Scholar] [CrossRef]
  73. Zavitsas, A.A.; Coffiner, M.; Wiseman, T.; Zavitsas, L.R. The Reversible Hydration of Formaldehyde. Thermodynamic Parameters. J. Phys. Chem. 1970, 74, 2746–2750. [Google Scholar] [CrossRef]
  74. Los, J.; Roeleveld, L.; Wetsema, B. Pulse polarography Part X. formaldehyde hydration in aqueous acetate and phosphate buffer solutions. J. Electroanal. Chem. 1977, 75, 819–837. [Google Scholar] [CrossRef]
  75. Doussin, J.-F.; Monod, A. Structure–activity relationship for the estimation of OH-oxidation rate constants of carbonyl compounds in the aqueous phase. Atmos. Chem. Phys. Discuss. 2013, 13, 11625–11641. [Google Scholar] [CrossRef] [Green Version]
  76. Rivlin, M.; Eliav, U.; Navon, G. NMR Studies of the Equilibria and Reaction Rates in Aqueous Solutions of Formaldehyde. J. Phys. Chem. B 2015, 119, 4479–4487. [Google Scholar] [CrossRef] [PubMed]
  77. Guthrie, J.P. Hydration of Carbonyl Compounds, an Analysis in Terms of Multidimensional Marcus Theory. J. Am. Chem. Soc. 2000, 122, 5529–5538. [Google Scholar] [CrossRef]
  78. Inaba, S.; Sameera, W.M.C. Dehydration of Methanediol in Aqueous Solution: An ONIOM(QM/MM) Study. J. Phys. Chem. A 2016, 120, 6670–6676. [Google Scholar] [CrossRef]
  79. Socrates, G. Hydration study of acetaldehyde and propionaldehyde. J. Org. Chem. 1969, 34, 2958–2961. [Google Scholar] [CrossRef]
  80. Sørensen, P.E.; Jencks, W.P. Acid- and Base-Catalyzed Decomposition of Acetaldehyde Hydrate and Hemiacetals in Aqueous Solution. J. Am. Chem. Soc. 1987, 109, 4675–4690. [Google Scholar] [CrossRef]
  81. Cheshnovsky, D.; Navon, G. Nuclear magnetic resonance studies of carbonic anhydrase catalyzed reversible hydration of acetaldehyde by the saturation transfer method. Biochemistry 1980, 19, 1866–1873. [Google Scholar] [CrossRef]
  82. Scheithauer, A.; Von Harbou, E.; Hasse, H.; Grützner, T.; Rijksen, C.; Zollinger, D.; Thiel, W.R. 1H- and13C-NMR spectroscopic study of chemical equilibria in the system acetaldehyde + water. AIChE J. 2014, 61, 177–187. [Google Scholar] [CrossRef]
  83. Rayne, S.; Forest, K. A high-level theoretical study into the atmospheric phase hydration, bond dissociation enthalpies, and acidity of aldehydes. J. Phys. Org. Chem. 2016, 29, 336–345. [Google Scholar] [CrossRef]
  84. Seyfioglu, R.; Odabasi, M. Investigation of air–water exchange of formaldehyde using the water surface sampler: Flux enhancement due to chemical reaction. Atmos. Environ. 2006, 40, 3503–3512. [Google Scholar] [CrossRef]
  85. Liu, X.; Guo, Z.; Roache, N.F.; Mocka, C.A.; Allen, M.R.; Mason, M.A. Henry’s Law Constant and Overall Mass Transfer Coefficient for Formaldehyde Emission from Small Water Pools under Simulated Indoor Environmental Conditions. Environ. Sci. Technol. 2015, 49, 1603–1610. [Google Scholar] [CrossRef] [PubMed]
  86. De Chant, L.J. The venerable 1/7th power law turbulent velocity profile: A classical nonlinear boundary value problem solution and its relationship to stochastic processes. Appl. Math. Comput. 2005, 161, 463–474. [Google Scholar] [CrossRef]
Figure 1. Four different models can be defined. A1 treats a single compound that does not react. Models A2, A3, and A4 assume that compound 1 reacts to form compound 2, either only in the water phase or in both phases. Model A4 also assumes that both forms, 1 and 2, are able to cross the interface. A1 is equivalent to Whitman [33], and A2 is equivalent to Hoover and Berkshire [54].
Atmosphere 11 01057 g001
Figure 2. A fifth model, A1E, can be considered if we treat 1 + 2 as a blended compound.
Atmosphere 11 01057 g002
Figure 3. The red rectangle and blue curve are 1/E(z) for E(z) as given in Equations (3) and (4), respectively. They are drawn with the same area under the curves. L’ is the width at half-height of the blue curve; the area under the blue curve scales as L′/D. The red rectangle has area L/D.
Atmosphere 11 01057 g003
Figure 4. Temperature dependence of the formaldehyde KA. Data are from Detcheberry et al., Bryant and Thompson, and from Iliceto and Hall and Piret as quoted by Bryant and Thompson [64,65]. The saturation vapor pressure of water was calculated according to [66]. The red and blue traces were also calculated assuming three different values of relative humidity.
Atmosphere 11 01057 g004
Figure 5. Concentration profiles through the films as calculated in model A4 with m = 0 and corresponding to the calculations summarized in Table 6. All concentrations are normalized to C 1 W = 1 . Red = aldehyde concentration, blue = diol concentration. Intercepts at z = 0 and L are shown.
Atmosphere 11 01057 g005
Figure 6. Concentration profiles through the films as calculated in model A4 with m and corresponding to the calculations summarized in Table 6. All concentrations are normalized to C 1 A = 1 . Red = aldehyde concentration, blue = diol concentration. Intercepts at z = 0 and L are shown.
Atmosphere 11 01057 g006
Figure 7. Distributions of fA1E, fA2, fA3, and fA4 when model parameters are selected according to Table 7. The curves for fA2, fA3, and fA4 are practically identical at the resolution of the figure. Results for k21A between 10 6 s 1 and 10 2.5 s 1 have all been included, but also cannot be resolved.
Atmosphere 11 01057 g007
Figure 8. Distributions of RA when model parameters are selected according to Table 7. Individual curves for k21A between 10 6 s 1 and 10 2.5 s 1 have all been drawn but lie on top of each other at the resolution of the figure.
Atmosphere 11 01057 g008
Figure 9. Distribution of the ratio fA1E/fA4 for the formaldehyde and acetaldehyde models. Curves for k21A between 10 6   s 1 and 10 2.5   s 1 are all displayed, but except for acetaldehyde at k 21 A = 10 2.5   s 1 , they are practically indistinguishable; 1.8% and 0.6% of the probability density, for formaldehyde and acetaldehyde respectively, are in the tails at fA1E/fA4 > 4.
Atmosphere 11 01057 g009
Figure 10. Distributions of fA3/fA4 and fA2/fA4 for the formaldehyde and acetaldehyde models. Curves for eight different values of k21A have been plotted but are indistinguishable, as are the curves for fA2 and fA3.
Atmosphere 11 01057 g010
Table 1. List of system and concentration variables.
NotationDescriptionUnits
SYSTEM VARIABLES
D 1 A ,   D 2 A ,   D 1 W ,   D 2 W Molecular diffusivities cm 2   s 1
k 12 A ,   k 21 A ,   k 12 W ,   k 21 W Reaction rate constants s 1
K A ,   K W Equilibrium constantsdimensionless
H 1 ,   H 2 Intrinsic Henry’s constantsdimensionless
H e Effective Henry’s constantdimensionless
L A ,   L W Film thicknessescm
F 1 ,   F 2 ,   F t Fluxes through the interface mol   cm 2   s 1
f 1 ,   f 2 ,   f t Mass transfer coefficients cm   s 1
CONCENTRATION VARIABLES
C 1 W ,   C 1 A ,   C 2 W ,   C 2 A Concentrations at specific depths mol   cm 3
C 10 W ,   C 10 A ,   C 20 W ,   C 20 A
DERIVED VARIABLES
Q = D 1 D 2 Diffusivity ratiosdimensionless
m = C 1 A H 1 C 1 W Equilibrium indicatordimensionless
d 1 = ( D 1 k 12 ) 1 / 2 Reaction–diffusion distancescm
d 2 = ( D 2 k 21 ) 1 / 2
d = ( d 1 2 + d 2 2 ) 1 / 2
Λ = L d Reduced film thicknessdimensionless
ζ A = D 2 A L A ,   ζ W = D 2 W L W Q A ζ A = D 1 A L A ,   Q W ζ W = D 1 W L W
Zeta-notation cm   s 1
E = Λ ( Q + K ) Λ Q + K tanh Λ Enhancement factorsdimensionless
Table 2. Relationships between variables reduce the number of degrees of freedom in any model.
RELATIONSHIPJUSTIFICATION
K A = k 12 A k 21 A Equilibrium constants are ratios of forward and reverse rate constants.
K W = k 12 W k 21 W
H 2 K W = H 1 K A Required by detailed balance.
C 2 W = K W   C 1 W Assumption of far-field chemical equilibrium.
C 2 A = K A   C 1 A
C 10 A = H 1   C 10 W Assumption of rapid exchange through the interface and local equilibrium across the interface.
C 20 A = H 2   C 20 W
Table 3. Results of all models simplify in certain limits.
Limiting ValueAir-Side Control
ζ W ζ A
Water-Side Control
ζ W ζ A
f A 1 E ζ A H 1 ( Q A + K A ) ζ W ( Q W + K W )
f A 2 ζ A H 1 Q A ζ W Q W E W
( Λ W 1 ) ζ W Q W ( Λ W 1 ) ζ W ( Q W + K W )
f A 3 ζ A H 1 Q A E A ζ W Q W E W
( Λ A 1 ) ζ A H 1 Q A ( Λ A 1 ) ζ A H 1 ( Q A + K A ) ( Λ W 1 ) ζ W Q W ( Λ W 1 ) ζ W ( Q W + K W )
f A 4 ζ A H 1 ( Q A + K A ) ζ W ( Q W + K W )
Table 4. Data relevant to the HCHO CH 2 ( OH ) 2 reaction at ≈ 300K and pH 7.
VariableValue or RangeSource
H 1 0.025Median from [67], corrected to intrinsic.
H 2 10 7 Never measured, but constrained by H1, KA, KW.
D 1 W 1.87 × 10 5   cm 2   s 1 [68,70,71]
D 2 W 1.57 × 10 5   cm 2   s 1 [68,70,71]
D 1 A 0.155   cm 2   s 1 [69,71]
D 2 A 0.124   cm 2   s 1 [69,71]
K A 0.045Figure 4.
K W 1800 to 2270 Middle seven of thirteen independent datapoints (experimental and theoretical) [63,64,72,73,74,75,76]
L A 0.3 cm[43]
L W 0.02 cm[43]
k 12 W 9.8   s 1   to   10.6   s 1 Middle four of six independent datapoints (experimental and theoretical) [74,75,77]
k 21 W ( 4.5   to   5.3 ) × 10 3   s 1 Middle four of six independent datapoints (experimental and theoretical) [59,75,78]
k 12 A UnknownNever measured, but ratio k 12 A / k 21 A is constrained.
k 21 A UnknownNever measured, but ratio k 12 A / k 21 A is constrained.
Table 5. Data relevant to the CH 3 COH CH 3 CH ( OH ) 2 reaction at ≈ 300K and pH 7.
VariableValue or RangeSource
H1 7.0 × 10 3 Median from [67] corrected to intrinsic.
H2 10 5 Never measured, but constrained by H1, KA, KW.
D 1 A 0.119   cm 2   s 1 [69,71]
D 2 A 0.103   cm 2   s 1 [69,71]
D 1 W 1.46 × 10 5   cm 2   s 1 [68,70,71]
D 2 W 1.29 × 10 5   cm 2   s 1 [68,70,71]
KA 0.005 Poorly constrained. See text.
KW1.19 to 1.35The middle thirteen of 27 independent datapoints (experimental and theoretical) [73,76,79,80,81,82]
LA0.3 cm[43]
LW0.02 cm[43]
k12AUnknownNever measured, but ratio k 12 A / k 21 A is constrained.
k21AUnknownNever measured, but ratio k 12 A / k 21 A is constrained.
k12W ( 0.005   to   0.015 )   s 1 Middle four of eight independent datapoints (experimental and theoretical) [75,77].
k21W ( 0.0041   to   0.012 )   s 1 Middle four of eight independent datapoints (experimental and theoretical) [75,80].
Table 6. Sample calculations. k21A was allowed to assume eight different values as indicated. Each of these generated eight different values for k12A, dA, and ΛA, but all remaining variables were insensitive to these variations, at least to the number of significant figures given.
VariableFormaldehydeAcetaldehyde
H10.025 7.0 × 10 3
D 1 W / ( cm 2   s 1 ) 1.87 × 10 5 1.46 × 10 5
D 2 W / ( cm 2   s 1 ) 1.57 × 10 5 1.29 × 10 5
D 1 A / ( cm 2   s 1 ) 0.1550.119
D 2 A / ( cm 2   s 1 ) 0.1240.103
k 12 W / s 1 10.00.01
k 21 W / s 1 5.0 × 10 3 0.008
KA0.0450.005
LW/cm0.020.02
LA/cm0.30.3
k 21 A / s 1 { 10 X } a { 10 X } a
KW20001.25
k 12 A / s 1 0.045 × { 10 X } a 0.005 × { 10 X } a
H2 5.625 × 10 7 2.8 × 10 5
dA/cm{6.15, 10.9, 19.5, 34.6, 61.5, 109, 195, 346}{5.69, 10.1, 18.0, 32.0, 56.9, 101, 180, 320}
dW/cm 1.37 × 10 3 2.77 × 10 2
QA1.251.16
QW1.191.13
ΛA { 488 ,   274 ,   154 ,   86.7 ,   48.8 ,   27.4 ,   15.4 ,   8.67 } × 10 4 { 527 ,   296 ,   167 ,   93.7 ,   52.7 ,   29.6 , 16.7 ,   9.37 } × 10 4
ΛW14.60.723
H e 1.3 × 10 5 3.1 × 10 3
ζ A / ( cm   s 1 ) 0.4130.343
ζ W / ( cm   s 1 ) 7.85 × 10 4 6.45 × 10 4
RA0.5440.234
f A 1 E / ( cm   s 1 ) 0.0133 9.91 × 10 4
f A 4 / ( cm   s 1 ) 7.08 × 10 3 6.25 × 10 4
f A 3 / ( cm   s 1 ) 6.62 × 10 3 6.15 × 10 4
f A 2 / ( cm   s 1 ) 6.62 × 10 3 6.15 × 10 4
a X { 2.5 ,   3.0 ,   3.5 ,   4.0 ,   4.5 ,   5.0 ,   5.5 ,   6.0 } .
Table 7. Distribution of variables used with the formaldehyde and acetaldehyde models.
VariableFormaldehydeAcetaldehyde
μσμσ
H1−1.60.15−2.20.15
D 1 W / ( cm 2   s 1 ) −4.70.15−4.80.15
D 2 W / ( cm 2   s 1 ) −4.80.15−4.90.15
D 1 A / ( cm 2   s 1 ) −0.80.15−0.90.15
D 2 A / ( cm 2   s 1 ) −0.90.15−1.00.15
k 12 W / ( s 1 ) 1.00.2−2.00.3
k 21 W / ( s 1 ) −2.30.2−2.10.3
KA−1.30.15−2.30.5
LW/cm−1.70.15−1.70.15
LA/cm−0.50.15−0.50.15
k21AUnconstrained, except to enforce k 21 A < k 21 W and k 12 A < k 12 W
KW = k 12 W / k 21 W
k12A = K A   k 21 A
H2 = H 1 K A / K W
Table 8. Comparison with experiment.
Seyfioglu and Odabasi [84]; Formaldehyde; Air → Water Experiments; Model A4.
Experimental conditions U 10 / ( m   s 1 ) K g H 1 ( 1 + K A ) / ( cm   s 1 ) f A 4 / ( cm   s 1 )
Laboratory8 ( 15.1 ± 5.5 ) × 10 3 ( 5   to   10 ) × 10 3
Field4 ( 6.3 ± 3.1 ) × 10 3
Liu et al. [85]; Formaldehyde; Water → Air Experiments; Model A4.
Experimental conditions U 10 / ( m   s 1 ) K 0 L ( 1 + K W ) / ( cm   s 1 ) f A 4 / ( cm   s 1 )
Without stirring0.4 4.66 × 10 3 ( 5   to   10 ) × 10 3
4.51 × 10 3
With stirring0.4 5.61 × 10 3
6.06 × 10 3
6.06 × 10 3