Article

Nitrous Oxide from Beef Cattle Manure: Effects of Temperature, Water Addition and Manure Properties on Denitrification and Nitrification †

1
USDA–ARS Conservation and Production Research Laboratory, Bushland, TX 79012, USA
2
USDA–ARS Agroecosystem Management Research Unit, Lincoln, NE 68583, USA
3
Texas A&M AgriLife Research and Extension, Amarillo, TX 79106, USA
4
USDA–ARS Meat Animal Research Center, Clay Center, NE 68933, USA
*
Author to whom correspondence should be addressed.
Mention of trade names or commercial products in this publication is solely for the purpose of providing specific information and does not imply recommendation or endorsement by the US Department of Agriculture. USDA is an equal–opportunity provider and employer.
Atmosphere 2020, 11(10), 1056; https://doi.org/10.3390/atmos11101056
Submission received: 20 August 2020 / Revised: 18 September 2020 / Accepted: 19 September 2020 / Published: 2 October 2020

Abstract

:
Beef feedyards produce nitrous oxide (N2O), a potent greenhouse gas. Limited research has evaluated the processes that produce feedyard N2O, and how rainfall and temperature impact N2O losses. Manure in feedyard pens develops into a complex ecosystem of microbes, extracellular enzymes, feces, and urine, with varying H2O content. This study aimed to improve understanding of feedyard N cycling under differing environmental conditions by incubation of manure in simulated feedyard pens using large chambers under laboratory conditions. We hypothesized that nitrification was the primary source of feedyard N2O, with interactions among temperature, H2O content, and manure properties. Emissions of N2O were monitored with a real–time N2O analyzer. Manure samples were taken at intervals for analyses of physicochemical properties, denitrification enzyme activity (DEA), and nitrification activity (NA). Due to equipment limitations, there was only one chamber per temperature tested. Correlation was poor among N2O emissions and rates of DEA and NA. However, significant relationships were found among key manure characteristics, such as ammonia/ammonium and nitrate/nitrite concentrations, manure dry matter, redox status, and temperature. These data suggest that most N2O was derived from denitrification in the top 5 cm of the manure pack. Further study is warranted to identify the processes involved in flushes of N2O emitted immediately after rainfall, possibly due to abiotic chemical reactions that release N2O sequestered in manure pores.

1. Introduction

Beef cattle feedyards produce nitrous oxide (N2O) from manure [1,2,3,4,5,6]. Nitrous oxide is a potent greenhouse gas (GHG) implicated in climate change due to a global warming potential (GWP) of 265–298 carbon dioxide equivalent (CO2e). Approximately 25% of total GHG (N2O and methane (CH4)) from beef production originates from manure in animal pens and housing [7]. However, few studies have evaluated the processes via which feedyard N2O is produced and the effects of environmental factors on these processes. Two primary modes of N2O production in soil, manure, sediments, and other substrates are nitrification and denitrification [5,8]. Nitrification and denitrification generally occur under differing conditions (i.e., redox status, available substrates, and microbial community structure and activity) but can occur simultaneously or in tandem in complex ecosystems. Despite significant research on feedyard N2O, a few key questions remain: (1) What processes are involved in feedyard N2O production and how are they affected by temperature and rainfall? (2) What is the primary source of N2O within a feedyard pen, i.e., the surface manure or the deeper, more anaerobic manure pack? A typical Texas feedyard, under typical dry conditions, is presented in Figure 1.
Feedyard N2O emissions are highly variable over both space and time [4,5]. This variability has been linked to temperature [2,4,9], H2O content [2,3,4,10], and manure characteristics [1,4,11,12,13]. Unfortunately, the relationships observed between these variables and N2O losses have been inconsistent, likely due to differences in manure physicochemical properties and treatment effects among studies. Redding et al. [1] used nonflow–through, nonsteady–state (NFT–NSS) chambers and saw high emissions (1.18 mg N2O–N·m−2·h−1) in northern Australia, but emissions were dramatically lower (0.01 mg N2O–N·m−2·h−1) at a feedyard in southern Australia. In another study, Parker et al. [2] showed that N2O from dry manure was negligible (0.054 mg N2O–N·m−2·h−1) but increased to as much as 200 mg N2O–N·m−2·h−1 for a few hours after a simulated rainfall event. These data were somewhat consistent with the variability found by Redding et al. [1] and Aguilar et al. [10] at regional Australian feedyards and seasonally at a Kansas feedyard, respectively. Using an empirical model, Parker et al. [14] predicted that open–lot feedyards in the Texas panhandle emitted an annual average of 0.12 kg N2O–N·animal−1·year−1. This unnecessary loss of valuable N could potentially be sustainably mitigated by reducing N2O emissions and retaining N in manure and composts for later use as crop fertilizer.
In soils, N2O is produced via multiple processes, including nitrification, denitrification, coupled nitrification–denitrification, dissimilatory nitrate reduction to ammonium (DNRA), anaerobic ammonia oxidation (Anammox), and various forms of chemodenitrification [8,15]. This should also be true for feedyard N transformations because of the complexity and heterogeneity of pen manure and changing weather in a system exposed to ambient conditions; it is unlikely that one single process is responsible for all feedyard N2O. The urine and feces excreted within feedyard pens forms an ecosystem of organic matter (OM) and nutrients essential for microbial metabolism (i.e., nitrogen (N), phosphorus (P), and sulfur (S)), bacteria, fungi and actinomycetes, and extracellular enzymes involved in nutrient cycling. Manure accumulates during a typical 150 day cattle finishing period to form a layered “pack” where properties (e.g., density, porosity, OM complexity, ammonia/ammonium (NHx) and nitrate/nitrite (NOx) availability, and microbial community structure) vary with depth [16,17]. To date, the relationship among feedyard N2O production, manure depth, and changing temperature and H2O content are unclear.
Despite the numerous possible avenues of N2O production, denitrification and nitrification are the predominant N2O production pathways in soil and manure composts. Nitrification occurs under aerobic conditions and is the stepwise oxidation of NH4+ or organic N to NO3. Gross potential nitrification rates, measured as nitrification activity (NA), are used to assess in vitro N transformations [18]. Denitrification is a facultative respiratory pathway that occurs under anaerobic/anoxic conditions and in anaerobic microsites [8,19,20]. In the absence of O2, oxidized N species (i.e., NOx, NO, and N2O) are reduced and coupled to electron transport phosphorylation. Nitrous oxide is a frequent end–product if conditions are not optimal for the final step of N2O reduction to N2 [21]. The rate of potential denitrifier enzyme activity (DEA) in soil is commonly assessed in vitro [22], and DEA rates were determined for beef manure under varying conditions [11,12].
The N cycle in feedyards differs from agricultural soils because there is no route within animal pens for plant NHx or NOx uptake. Thus, some excess N remains in the manure, a large portion (~50%) is lost to the atmosphere as ammonia (NH3), and smaller amounts of N2O, dinitrogen (N2), and nitric oxide (NO) are also emitted. Feedyard N can also be lost via runoff and leaching of liquid or particulate forms. The fate of manure N depends on the consortia of microbial species present, activities of enzymes involved in OM degradation and N mineralization, manure chemistry, aeration (i.e., O2 content), H2O content, and substrate availability for microbial energy and respiration. Specific N2O production pathways vary with conditions and may occur consecutively or simultaneously in sequestered microsites within the manure pack [23,24,25].
To date, no study has assessed the interaction among N2O emissions, key variables, and DEA and NA rates in feedyard manure. The objective of this study was to simulate feedyard conditions in a controlled laboratory setting to improve understanding of feedyard N cycling so that effective N2O mitigation methods can be developed and employed. We hypothesized that both nitrification and denitrification contribute to feedyard N2O, but their predominance differs with environmental conditions and depth within the manure pack.

2. Experiments

2.1. Large–Chamber Incubation Study

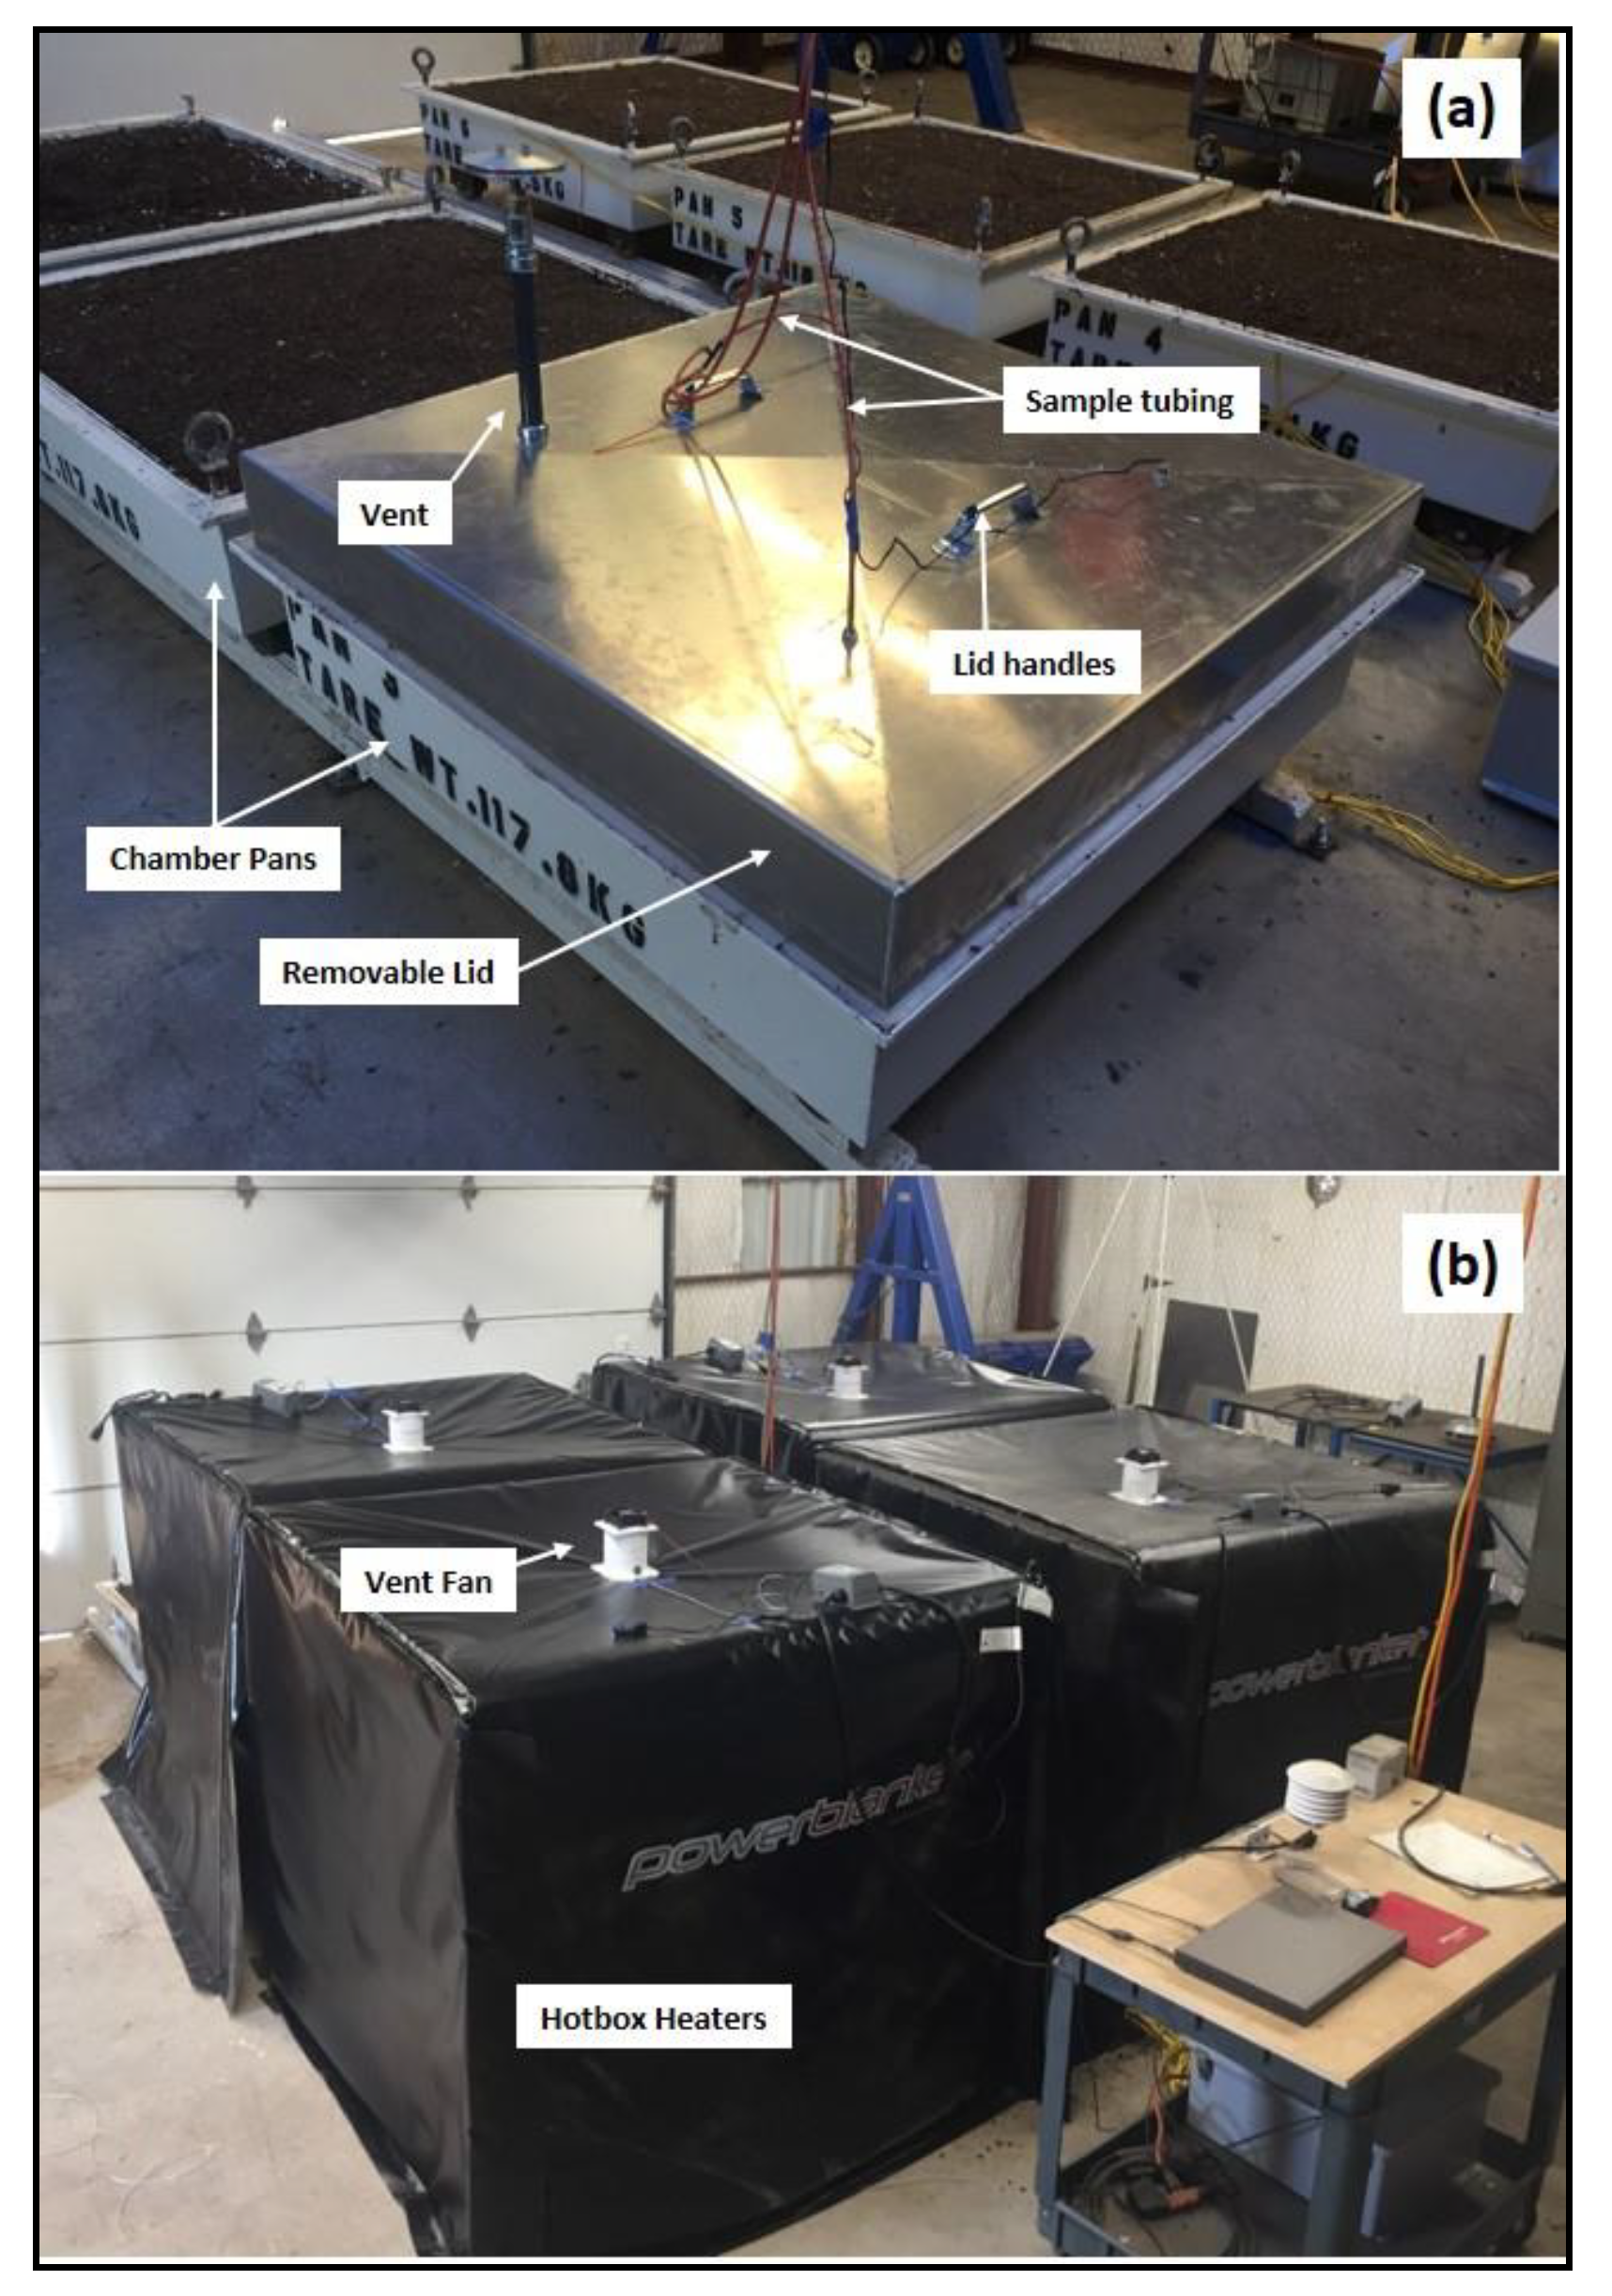
Manure that accumulated during a typical 150 day finishing period was scraped from a pen at a commercial feedyard in the Texas Panhandle and transported to the United States Department of Agriculture–Agricultural Research Service (USDA–ARS) Conservation and Production Research Laboratory in Bushland, TX. The manure was a mixture of unconsolidated, loose surface manure and deeper packed manure from cattle fed a steam–flaked corn–based diet. Selected physicochemical parameters of the manure were as follows: 91% dry matter (DM); 55% OM; 341 mg NHx·kg−1; 5.7 mg NOx·kg−1; 2.6% total nitrogen (TN); 27.7% total carbon (TC); C:N ratio of 10.8. The manure was roughly ground (<0.64 mm) with a 15–HP, 420 cc chipper/shredder (Stanley Black & Decker, New Britain, CT, USA). Manure (109 mm depth) was added to each of five 1 m2 (surface area) chambers (Figure 2a). Compacted native caliche (calcium carbonate soil; 89 mm) underlaid the manure in each chamber to simulate the relatively impermeable soil–manure interface under regional soil–surfaced feedyard pens [26,27]. The manure was compacted to an approximate dry bulk density of 0.61 g·cm−3 with a handheld tamper. The experimental period was 59 days in length and occurred in winter and spring of 2017. Chamber temperatures were controlled with 1.3 × 1.3 × 1.3 m “hotbox” material warmers (Model HB64–1440, Powerblanket, Salt Lake City, UT, USA) with digital temperature controllers and 12 V exhaust fans for venting (Figure 2b). In addition, silicone heating pads with digital temperature controllers (ProTherm Industries, Inc., Hermitage, TN, USA) were bonded to the bottom of each chamber. A single chamber (Chamber 1) did not have thermal regulation and was exposed to ambient temperatures, which varied diurnally and seasonally in an indoor facility without temperature control.
Two simulated 25 mm rainfall episodes were conducted by evenly applying distilled H2O with a handheld watering can to the surface of each manure–filled chamber on 13 February (Day 1) and 17 March 2017 (Day 22). This decreased the manure DM content at 0–5 cm depth to ~77% and 68% on these days, respectively, and ~75% DM at the 5–10 cm depth on both days (Table 1). During the 8.4 week study, the manure in the chambers dried naturally between H2O applications for investigation of dry–wet cycling effects. From Day 1 to 21, the five chambers were maintained at (1) 5.0, (2) 11.2, (3) 21.5, (4) 26.8, and (5) 17.2 °C. These temperatures simulated a range of winter, fall, and spring temperatures in the Texas Panhandle. On Day 22, the second simulated rainfall was applied and the temperatures of three chambers (1, 2, and 5) were increased and maintained at (1) 15, (2) 38.1, and (5) 46.2 °C. Headspace N2O concentrations were measured from each chamber at 30 min intervals on the days of H2O addition, and then daily (~6:00 a.m. Central Standard Time) for the remainder of the study. Details on the chamber system are available in Parker et al. [1,2]. In short, the chambers were fitted with a vented, portable lid that was moved among the chambers. Headspace air was recirculated from the sealed chamber with polyethylene tubing to a real–time N2O analyzer (Model N2O/CO–30–EP Enhanced Performance, Los Gatos Research, Inc., San Jose, CA, USA). Concentrations of N2O were recorded at 1 s intervals during 60 s measurement periods, with flux rates calculated from the slopes of N2O concentrations vs. time using linear regression for 30 s periods. Emissions data were reported by Parker et al. [3] and are presented in Figure 3. Chamber temperatures (±0.1 °C) were monitored with thermistors (model #ACC–SEN–SDIP, Acclima, Inc., Meridian, ID, USA) placed mid–depth in the manure of each chamber.

2.2. Manure Collection and Analyses

Manure samples were collected in triplicate from each chamber 2 h after H2O application on Days 1 and 22, and then at 10:00 a.m. CST on Days 9, 18, 30, and 59. Manures were collected with a small trowel at depths of 0–5 cm and 5–10 cm inside a 30 cm (height) × 7.6 cm (diameter) tin cylinder inserted vertically into the manure. Care was taken to avoid disturbance of the manure both inside (i.e., depth mixing) and near the cylinder (i.e., integrity of emitting surface). For each sample, manure from the top 5 cm was removed manually, placed in polyethylene bags, and then stored on dry ice. The 5–10 cm depth fraction was collected and stored in the same manner.
Within an hour after sampling, oxidation–reduction potential (Eh) was measured according to using a Pocket Pro ORP Tester (Hach Company, Loveland, CO, USA), where manure was slightly wetted with degassed deionized H2O. Manure pH was measured (1:10 (w/w) with deionized H2O (pH 8.01)) with an Accumet XL250 pH meter and AccuCap combination pH electrode (Thermo Fisher Scientific, Waltham, MA, USA). Manure DM was determined gravimetrically after drying overnight at 105 °C. Concentrations of OM were determined by loss on ignition at 500 °C. Total N and TC contents were measured with a varioMAX CN analyzer (Elementar Analysensyteme GmbH, Hanau, DEU, Germany). NHx and NOx were extracted from manure samples with 2.0 M potassium chloride (KCl) for 30 min and quantified colorimetrically with a SEAL Analytical AQ2 Discrete Analyzer (SEAL Analytical Inc., Mequon, WI, USA) and the United State’s Environmental Protection Act Method 350.1 (NHx) and Method 353.1 (NOx) [26].

2.3. Potential Denitrifier and Nitrification Enzyme Activities

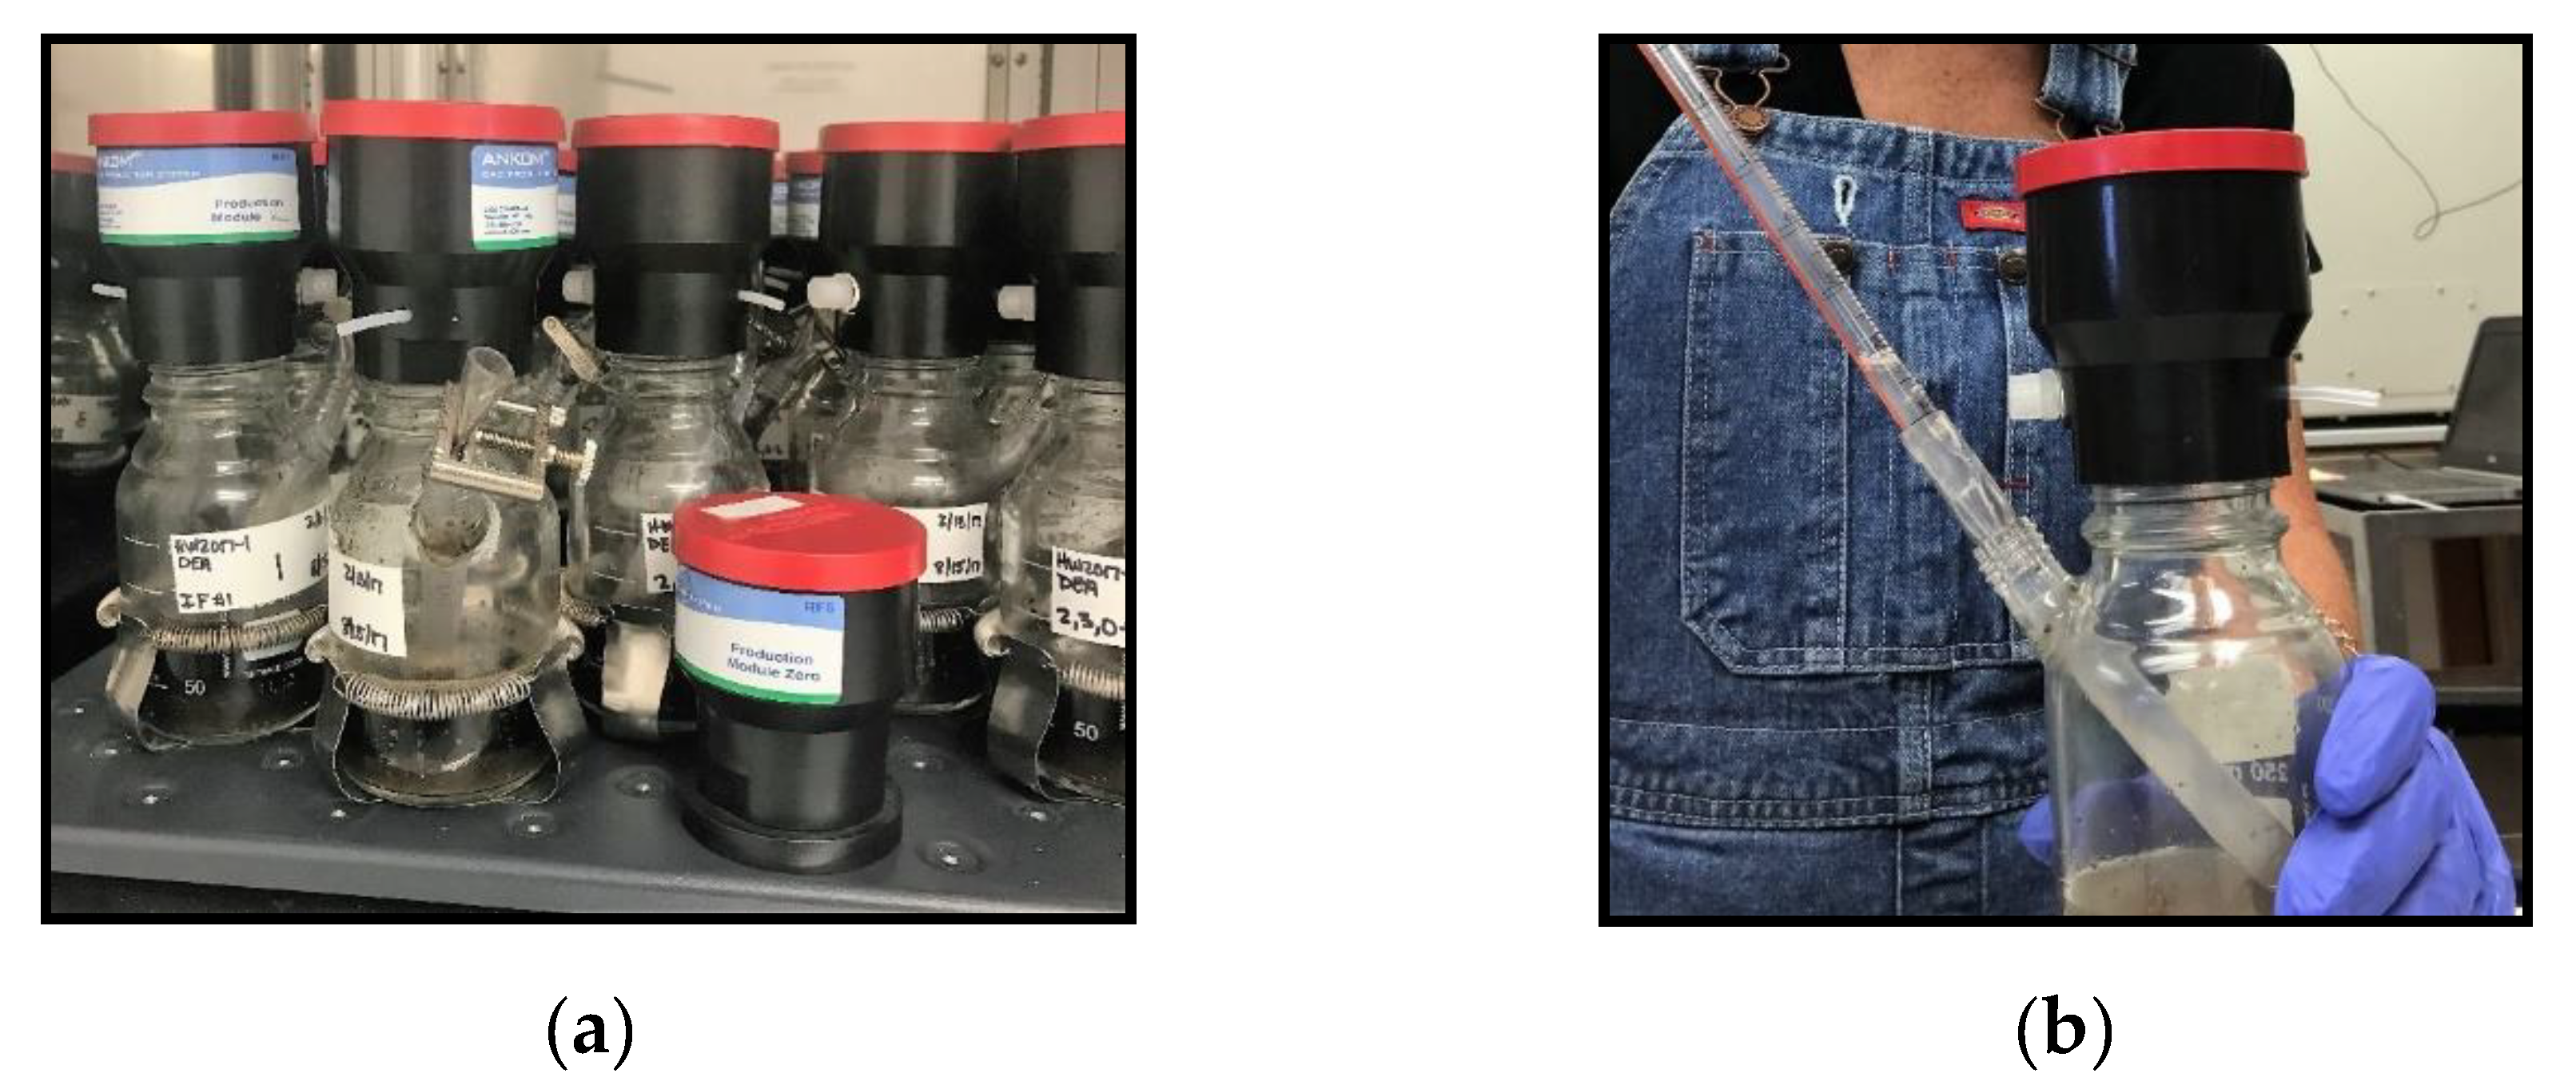
Denitrifier enzyme activity was determined according to Woodbury et al. [11] and Ayadi et al. [12]. In brief, 10 g (DM) of each triplicate sample was placed in 250 mL Ankom bottles with sealable sidearm ports (Ankom Technology, Macedon, NY, USA). A solution (90 mL) of 0.5 g·L−1 chloramphenicol, 5 mM glucose, and 10 mM potassium nitrate (KNO3) was added to each bottle, swirled to mix, and flushed with argon to create anaerobic conditions. The bottles were quickly capped with Ankom RF1 Gas Production Modules programmed to an Ankom Base Coordinator to release headspace gas (Figure 4a). The bottles were shaken at 21 °C for 54 h at 180 rpm. Liquid samples (1.0 mL) were collected with a thin pipette through the bottle side ports at 0, 2, 4, 6, 24, 48, and 54 h (Figure 4b), placed in 1.5 mL microcentrifuge tubes, flash–frozen in dry ice/ethanol, and stored at −80 °C. Samples were then analyzed for NOx as previously described. Rates of DEA were calculated with linear regression of NOx loss over time according to Ayadi et al. [12]. However, graphs of the data showed that a linear fit for the entire 54 h period was not ideal: R2 values ranged from 0.682–0.991. A bimodal data trend indicated there was either (1) more than one mechanism of NOx transformation occurring, or (2) a lag in enzyme activation (Figure 5). To accommodate for the different DEA rates over time, linear regression was used to calculate rates for DEA–short (DEAs) from 0–24 h incubations and DEA–long (DEAl) from 24–54 h incubations. Although linear regression did not always produce the best model fit for DEAl data, this method was selected to ease comparison with other DEA rates because of high variability in the patterns of DEAl rates over time.
The protocol to assess nitrification as NA was adapted from Ayadi et al. [12] and Woodbury et al. [11]. Manure (5 g DM) was placed in 250 mL Erlenmeyer flasks with 50 mL of 1.0 mM phosphate buffer containing 0.25 mM ammonium sulfate ((NH4)2SO4) and 0.1 M potassium chlorate (KClO3). Flasks were loosely capped with aluminum foil and incubated/shaken at 180 rpm in the dark at 21 °C. As previously described for DEA analyses, liquid samples were removed at intervals of 0, 2, 4, 6, and 24 h, frozen, stored, and later colorimetrically analyzed for NOx concentrations. Changes in NOx over time were used to calculate NA rates using linear regression of data from 0–6 h (mean R2 = 0.902). Quadratic and other regression fits were attempted; however, linear regression produced the highest R2 values.
It is important to note that these DEA and NA rates are “potential” gross rates rather than in situ net denitrification and nitrification rates because these assays were designed with optimized reaction conditions (e.g., appropriate redox status, high substrate concentrations, standardized temperatures). To minimize laboratory hazards, acetylene was not used in the DEA assay to block conversion of N2O to N2. Furthermore, no instrumentation was available to measure headspace N2; it was assumed that all NOx was converted to N2O and overestimation of true N2O production could have occurred. Due to spatial and temporal variability in feedyard pen manure, in situ feedyard N transformations may be lower and more variable than measured in laboratory DEA and NA assays. However, DEA and NA studies provided background information on potential N transformations in manure over time and with temperature and H2O content changes.

2.4. Statistical Analyses

Data were analyzed with the SAS PROC GLM procedure (SAS Institute Inc., Cary, NC, USA). The experiment included two depths (0–5 cm, 5–10 cm), eight temperatures (5.9, 11.2, 15.0, 17.2, 21.5, 26.8, 38.1, and 46.2 °C), two H2O applications (Day 1 and 22), and six manure sampling days. A total of 180 samples were collected. Rates of DEA and NA were calculated as the slope of regression analyses (Microsoft Excel, Microsoft Corp., Redmond, WA, USA). Significant differences among treatments were determined using ANOVA, where p ≤ 0.05. Duncan’s least significant difference test was used for mean separations. Pearson’s correlation coefficients were employed to determine positive and negative relationships among variables with Proc CORR.

3. Results and Discussion

3.1. Manure Properties

Selected physicochemical properties of the manures from the two depths, five chambers, and six sampling dates are presented in Table 1, along with N2O emissions data from Parker et al. [3]. Manure DM content after both artificial rainfall events ranged from 63% to 82% at 0–5 cm and 66% to 85% at 5–10 cm. Overall, manure DM was negatively related to N2O emissions (p ≤ 0.001) at both depths (Figure 6), indicating that a higher H2O content led to increased emissions and suggesting denitrification as a N2O production mechanism. Regression R2 values were 0.50 (0–5 cm) and 0.18 (5–10 cm) for N2O emissions as a function of manure DM, which indicated that the majority of N2O was derived from the manure surface rather than deeper in the pack. Previous studies used 15N isotope analyses to determine N2O production mechanisms in composts and manure–amended soil [28,29]. Water–filled pore space (WFPS) was found to be a key factor in determining N2O emission process in manure–amended soils, with up to 77% of N2O originating from heterotrophic denitrification at high WFPS (70% and 80% WFPS) and nitrification at 60% WFPS [30]. The manure used in the current study was considerably drier than the soils of Baral et al. [30], even after simulated rainfall application; however, denitrifiers could be active in sequestered anaerobic microsites within the manure. Maeda et al. [29] reported that the production method for N2O from dairy manure compost differed with sampling depth, where the isotope site preference, which can indicate origin as nitrification or denitrification, showed that surface samples produced N2O via bacterial denitrification. In contrast, samples from the core of the compost pile displayed unrecognized isotopic signatures that could not be interpreted. These authors concluded that N2O from compost largely originated from bacterial denitrification of recently turned material on the surface of the compost pile.
On days of simulated rainfall, added H2O did not visibly infiltrate to the 5–10 cm depth and tended to form a crust on the manure surface; however, there were some differences in Eh over time (Table 1). There was a tendency for reduced Eh with simulated rainfall at both depths that increased as the manures dried between rainfall events. The relationship between N2O emissions and Eh differed with depth. Eh had a strong relationship with emissions at 0–5 cm, where a more negative Eh (reducing environment) was associated with increased N2O (p ≤ 0.01; Figure 6a); however, the relationship was positive at 5–10 cm (p ≤ 0.001; Figure 6b). The rationale behind this difference was unclear but simulated rainfall generally produced conditions favorable for denitrification (lower Eh and DM content).
Manure is highly buffered due to organic components that control pH via base cation exchange, decarboxylation of organic anions, and other chemical mechanisms [27,28,29,30]. In the current study, manure pH was within the narrow ranges of 8.8–9.2 (0–5 cm) and 8.8–9.0 (5–10 cm) (Table 1). Nevertheless, there were some significant pH differences among the chambers; chambers held at higher temperatures tended to have lower manure pH values, but there was no clear relationship between pH and temperature (R2 = 0.031). Negative relationships between N2O emissions and manure pH were identified at both depths (p ≤ 0.05), suggesting greater N2O losses at lower pH (Figure 6). However, caution must be used when interpreting these data due to pH effects on other gaseous N species, such as NH3; higher manure pH promotes NH3 volatilization [31,32,33,34,35,36]. The slightly higher pH observed in some chambers of this study could have favored NH3 over N2O emission, which would reduce the amount of NH4+ available for nitrification to N2O.
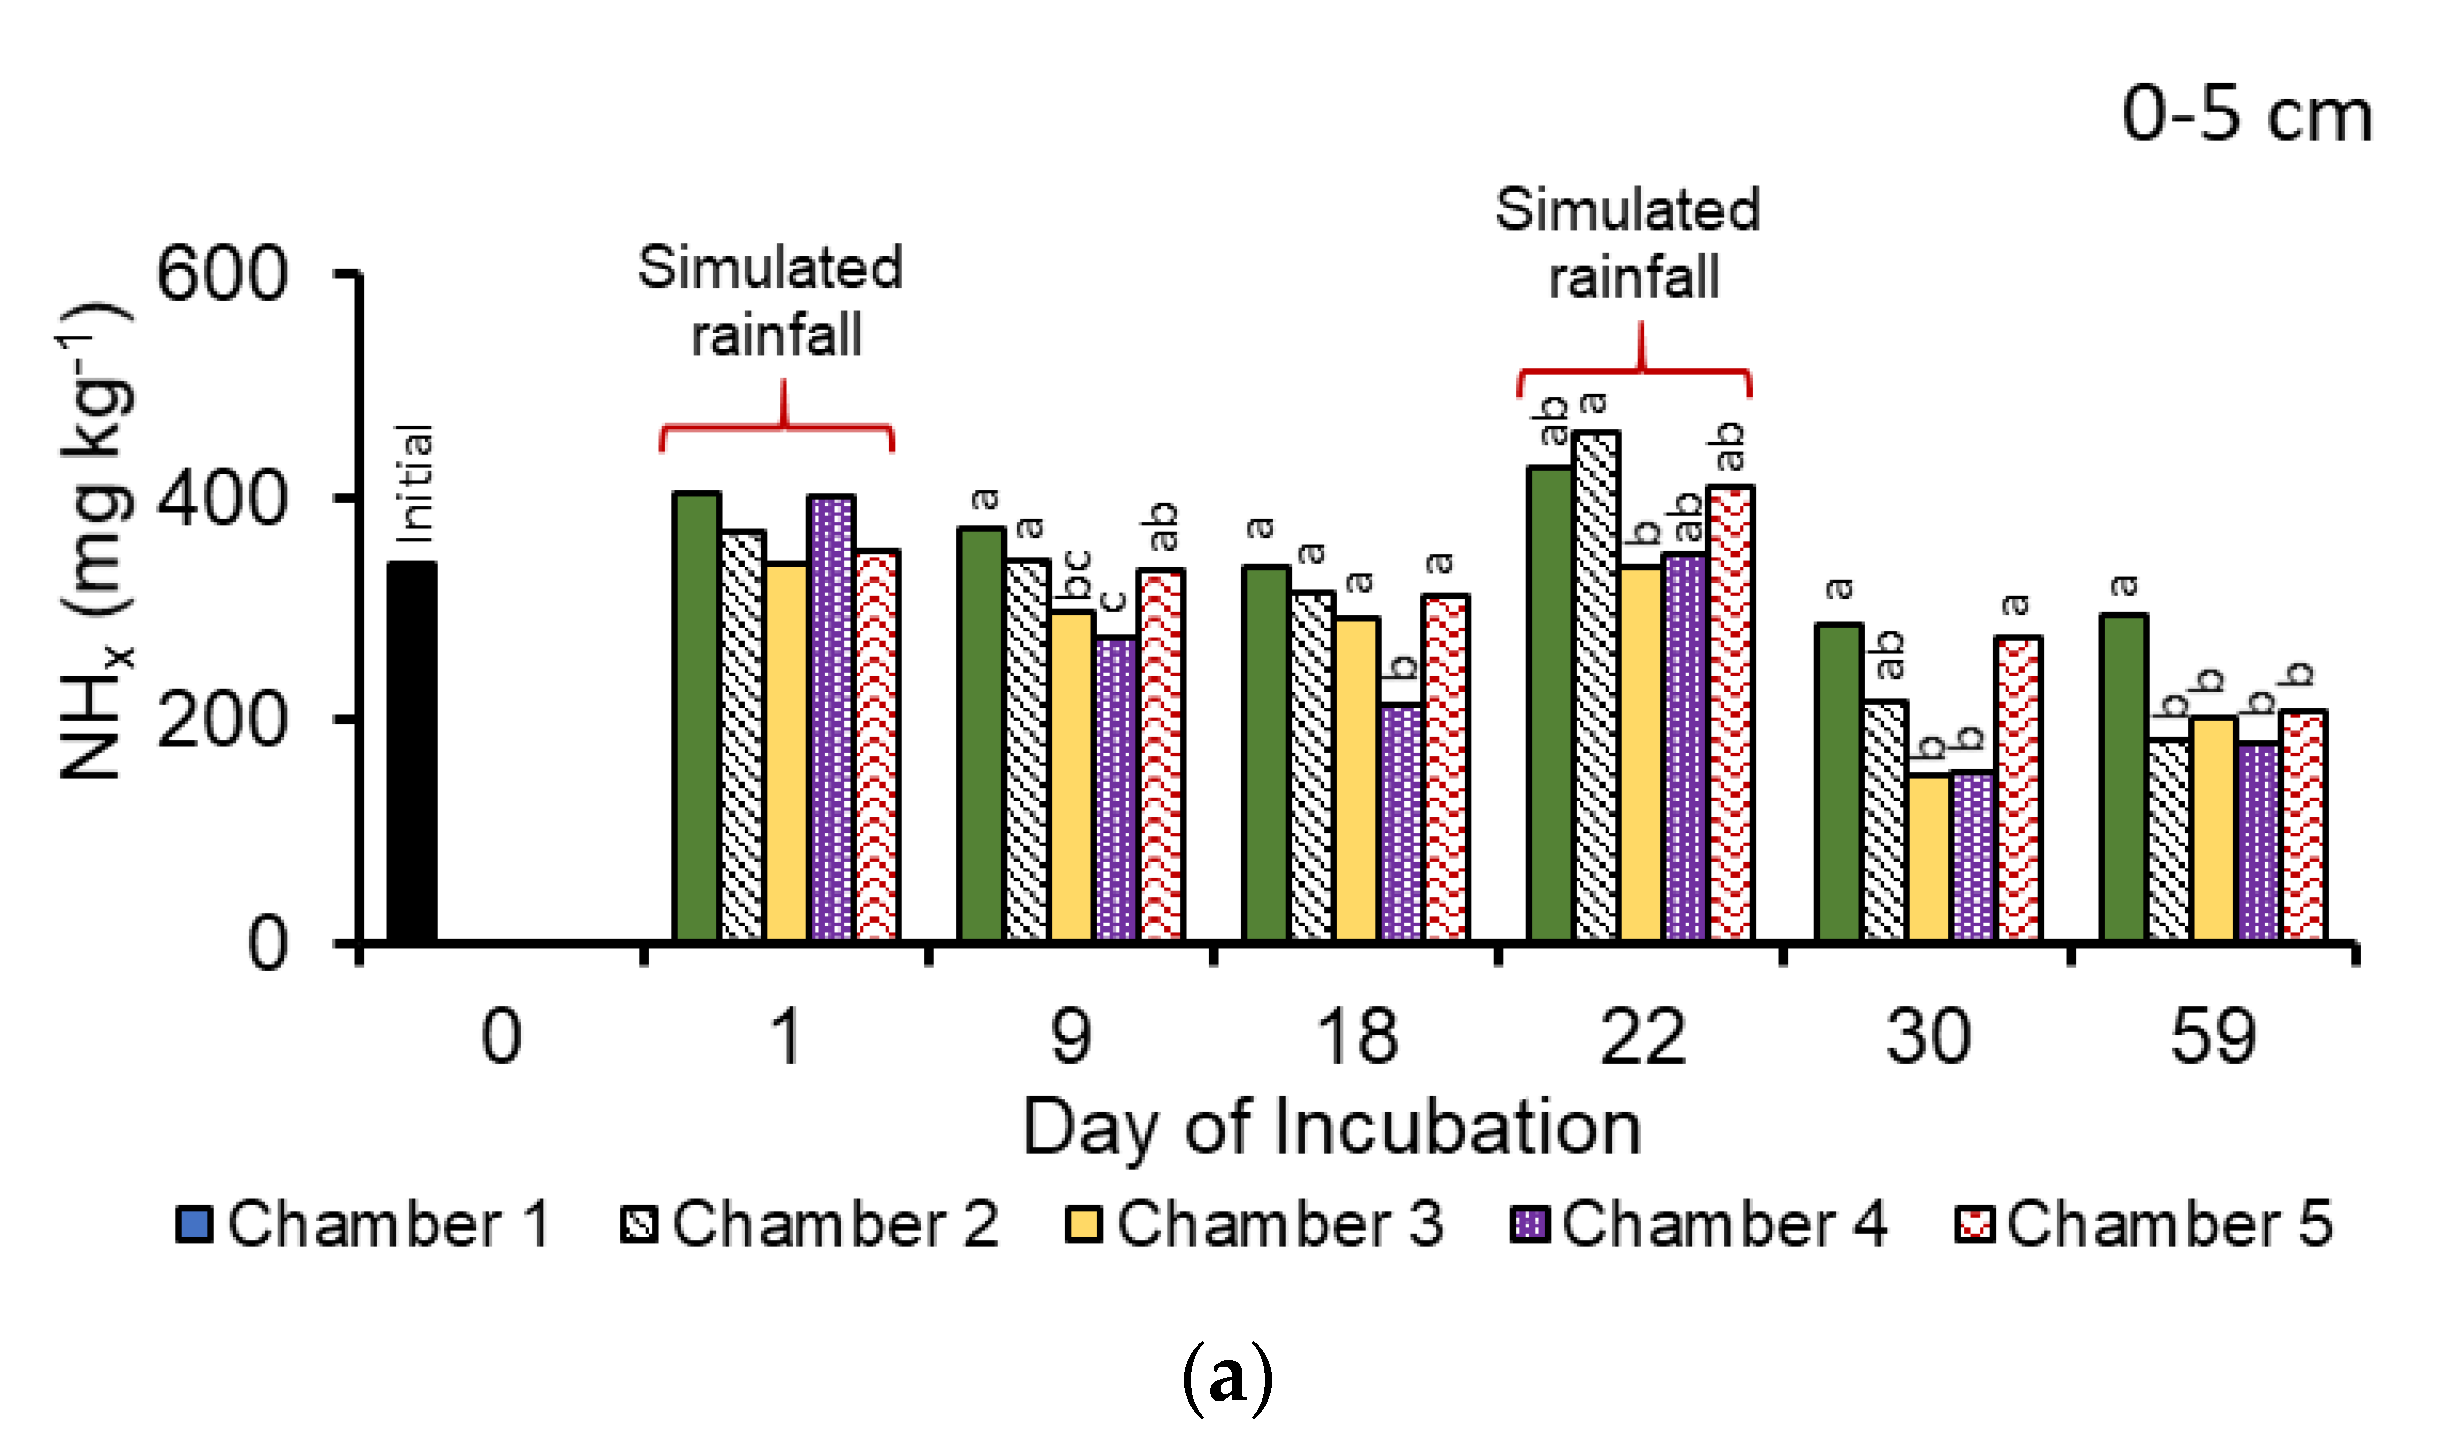
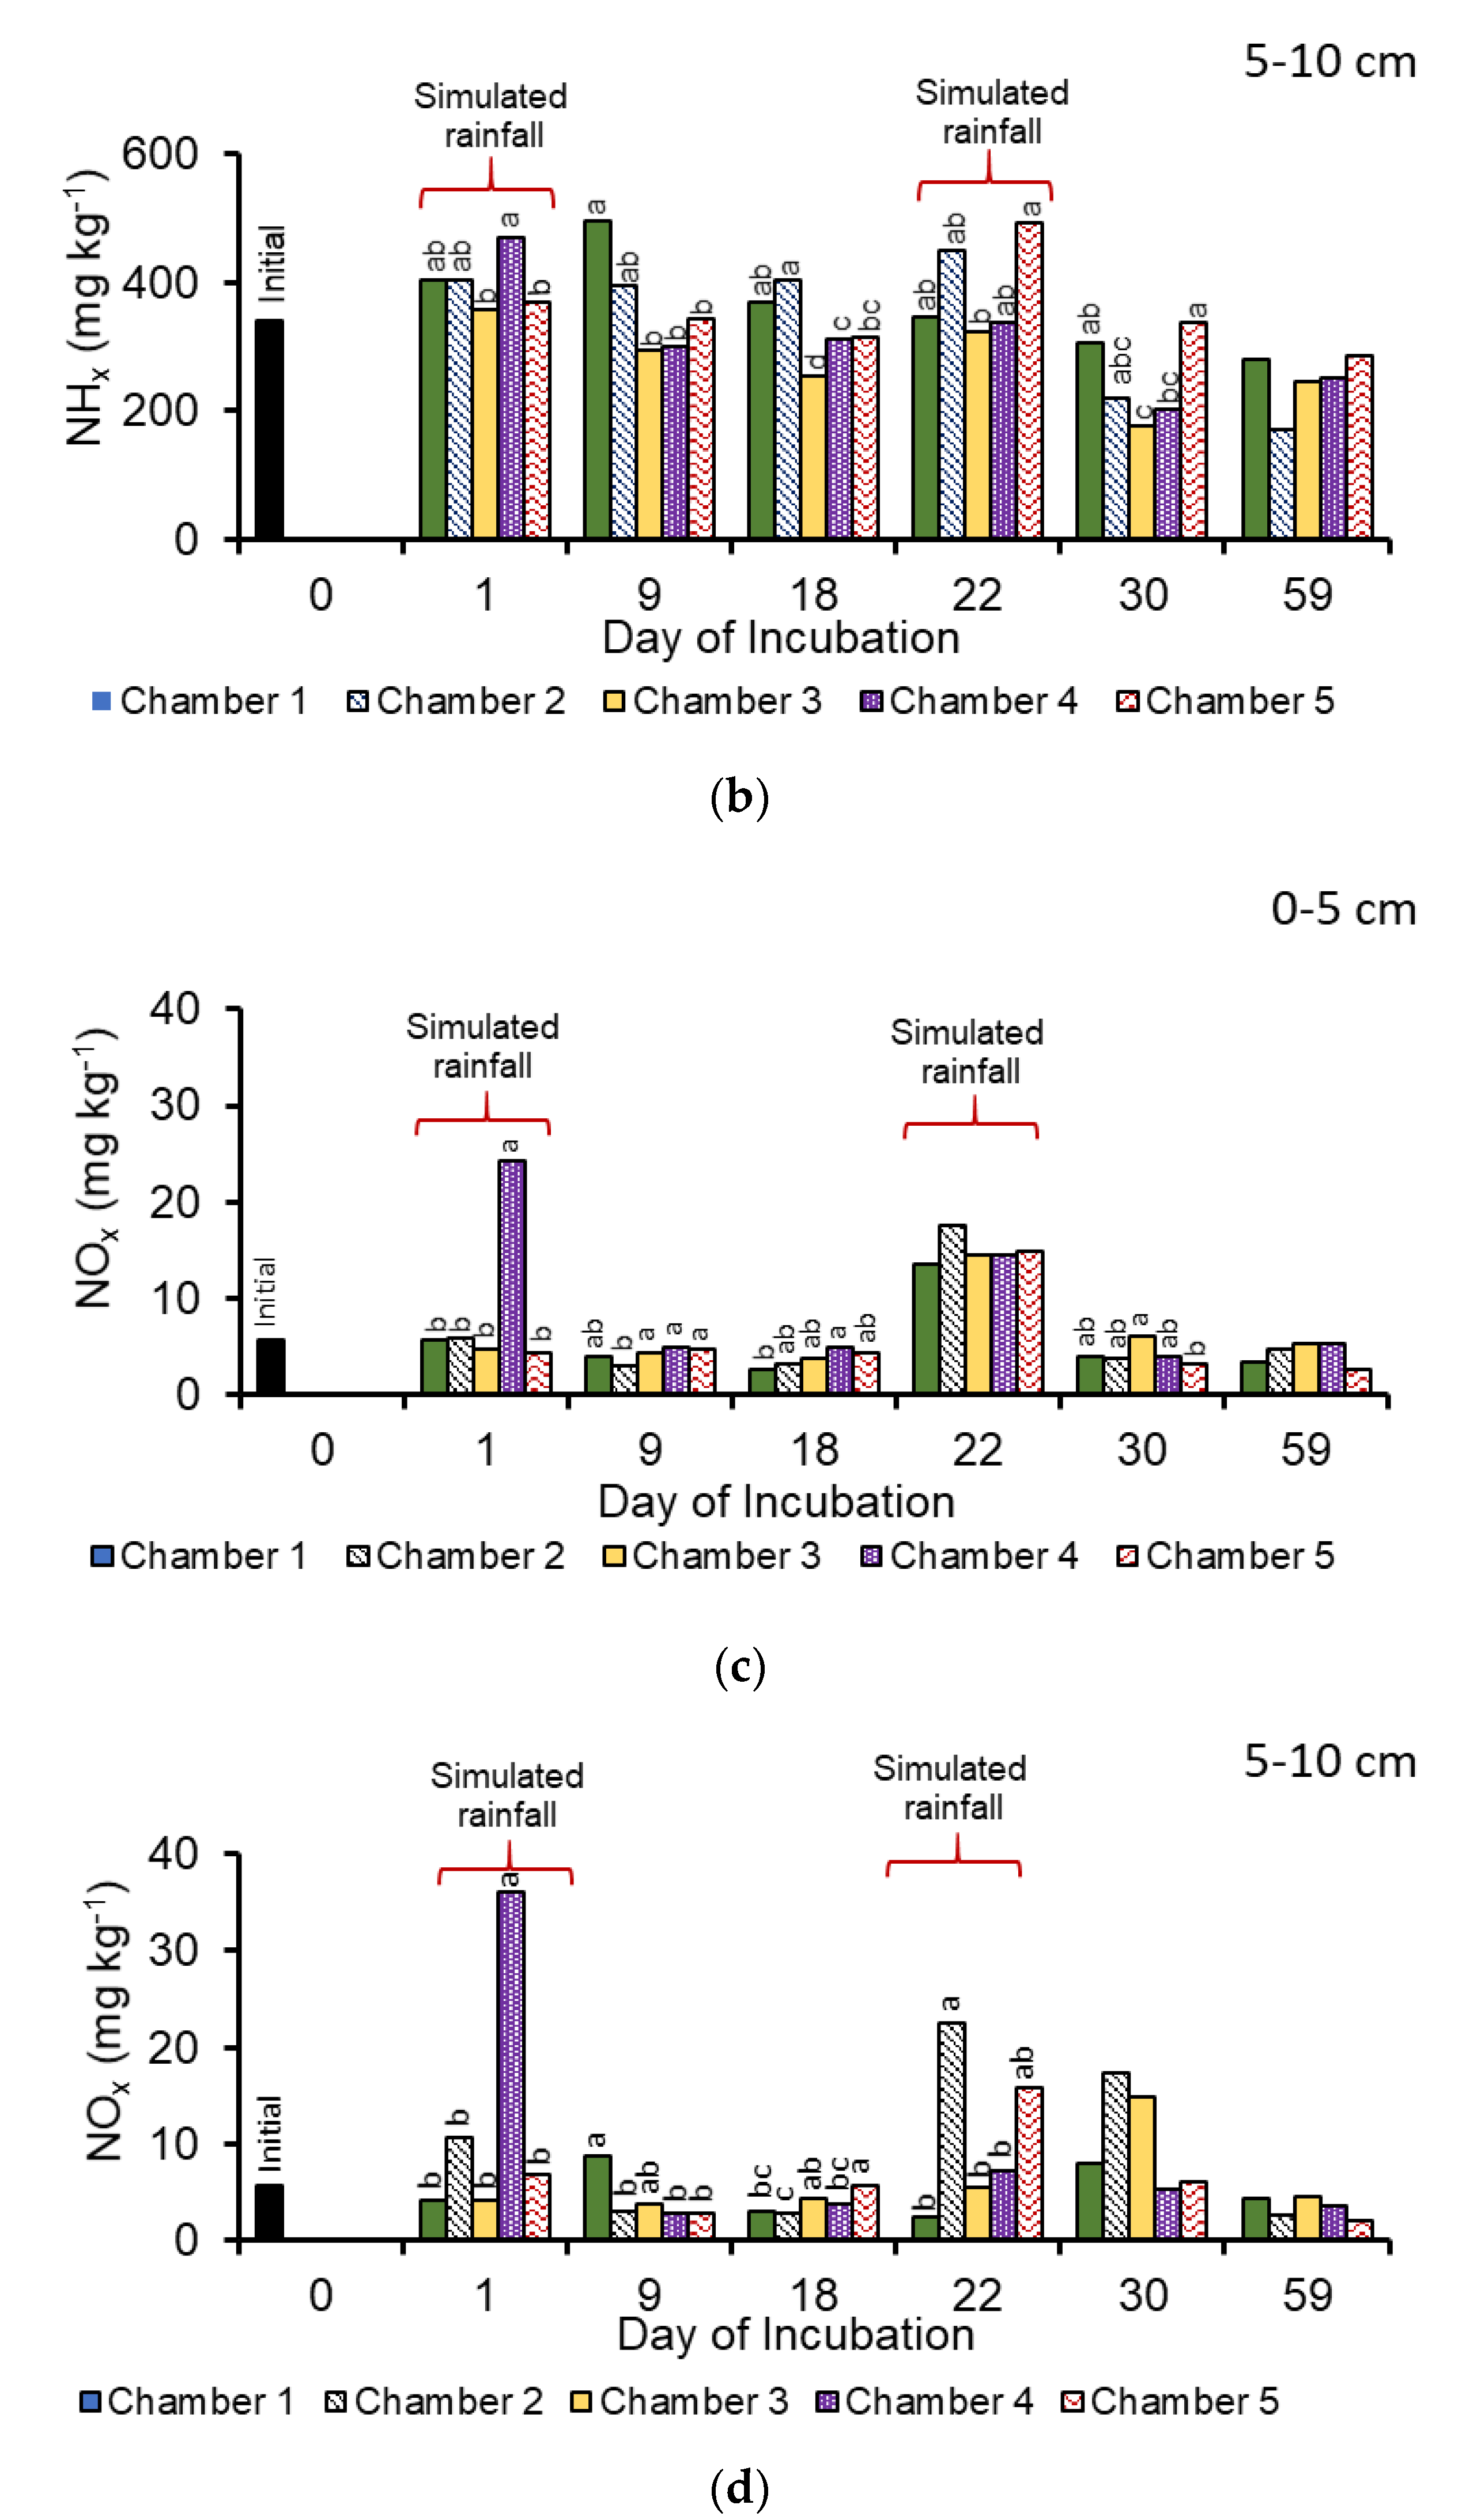
Only minor changes in manure TN and TC contents were noted with time, temperature, or depth, where TN and TC ranged from 2.4–2.9% and 25–31% DM, respectively (Table 1). The R2 values for N2O against TN and TC were low: 0.02 for both parameters at 0–5 cm, and 0.04 (TN) and 0.01 (TC) at 5–10 cm. This indicated that manure TC and TN contents did not change appreciatively and were not major factors involved in controlling N2O losses in this study. The major substrates for denitrification and nitrification, NHx and NOx, showed some interesting changes during the study period. Concentrations of NHx were highest after simulated rainfall applications on days 1 and 22, with mean values of 385 and 396 mg NHx·kg−1 at 0–5 and 5–10 cm, respectively. Concentrations of NHx then decreased over time, particularly at temperatures between 21.5 and 40 °C (Figure 7a,b). This decrease was likely due to NH3 volatilization or nitrification of NHx to NOx; however, no corresponding increase in NOx was observed (Figure 7c,d; Table 1). Concentrations of NHx were positively related to N2O emissions at both depths (p ≤ 0.001) (Figure 6), with R2 values of 0.23 at 0–5 cm and 0.18 at 5–10 cm. At 0–5 cm, NHx content tended to be lower at higher temperatures, indicating NH3 losses or nitrification (Figure 7a). After the second simulated rainfall (Day 22), there were notable increases in NHx at 5–10 cm when temperatures were >40 °C (Figure 7b); however, regression analyses of temperature against NHx produced poor R2 values (p < 0.06) that did not clearly indicate a relationship between NHx and temperature within the manure pack. By the end of the experiment, NHx concentrations ranged from 179–294 mg·kg−1 and 170–285 mg·kg−1 at 0–5 and 5–10 cm, respectively (Table 1).
Concentrations of NOx at 0–5 cm ranged from 4.3 to 24 mg·kg−1 after the first simulated rainfall, then tended to decrease over time until the second simulated rainfall (Table 1, Figure 7c). Interestingly, NOx concentrations of Chamber 4 (26.8 °C) at both depths were higher than in the other chambers after the first rainfall application (Figure 7c,d). The rationale behind this NOx spike may be related to the interaction of high chamber temperature with H2O application to very dry manure. A large flush of N2O was emitted at this time (Table 1), which was highest (152 mg N2O–N·m−2·h−1) from Chamber 4. This suggests that the high NOx content could be a result of conversion of NHx to NOx via nitrification or release of NOx sequestered in manure pores that would then be available for denitrification to N2O. Similar observations of a rapid flush of N2O were observed in wetted soils by Rudaz et al. who found that denitrification was a major source of N2O when soils had a high water content and that denitrifiers adapt quickly to changing conditions to take advantage of available resources. Alternately, this could be due to chemodenitrification following wet–dry cycling, where NO2 reacts with lignins and other forms of manure OM to form nitroso and oximino compounds prior to abiotic N2 and N2O formation [36,37,38,39,40,41]. Passive diffusive N2O emissions were documented from soil when water displaces the soil air during infiltration [37]. While it was unclear why NOx concentrations in Chamber 4 were higher than in other chambers at the first simulated rainfall, these values quickly decreased and were similar to observations in other chambers for the rest of the study. Correlation analyses revealed a strong positive relationship between NOx and N2O losses (p < 0.001) (Figure 6), and regression R2 values were 0.55 (0–5 cm) and 0.33 (5–10 cm). These values support the premise that most N2O was derived from the manure surface. From these limited data, it is difficult to discern if nitrification, denitrification, or some other (bio)physicochemical process were responsible for N2O fluxes. However, data for NOx and NHx suggest that both nitrification and denitrification processes could occur simultaneously after rainfall, as measured concentrations of both substrates tended to increase after H2O application. Anaerobic, reducing conditions created by H2O addition to the manure surface provided an environment for denitrification on the manure surface, while higher NHx concentrations induced by wetting created conditions suitable for nitrification at both depths.

3.2. Nitrous Oxide Emissions

This work builds on that of Parker et al. [3], who reported N2O emissions from this study. In summary, a rapid, large flush of N2O was detected 2 to 11 h after both simulated rainfall events, with magnitudes ranging from <20 to 190 mg N2O–N·m−2·h−1 (Figure 3). This occurred at all temperatures tested, but the rate was greatest in higher–temperature chambers; emissions at 5.0, 11.2, and 15.0 °C were very low (Figure 5). A similar early N2O flush from agricultural soils was reported by Manalil et al. [42], who proposed that emissions immediately after wetting occurred because H2O displaced O2 during infiltration into manure and created anaerobic conditions that promoted denitrification in a high–N and high–C environment. Xu et al. [37] also saw passive N2O diffusion as water infiltrated soil airspaces and displaced sequestered N2O. Alternate explanations could be (1) displacement and release of N2O sequestered in manure pore spaces, (2) aggregate disruption with release of previously protected substrate, and/or (3) increased soluble substrate availability. Other means of N2O release could be an abiotic physicochemical event such as pH/Eh effects, wet–dry cycling, chemical dissociation of hydroxylamine or other N species to N2O, or complex interactions among biotic and abiotic processes [8,41,42,43].
At higher temperatures (≥38 °C), a second N2O episode occurred ~3 days after H2O addition (Figure 3b). This emission peak was shorter in height (0.06 to 35 mg N2O–N·m−2·h−1) than the first episode, but had a longer duration (~2 weeks) and was stimulated by higher temperatures to produce a N2O flush that was greater in both magnitude and duration than the initial N2O peak after wetting. A second emission peak was also observed at 31 °C in an earlier work by Parker et al. [1], who used the same methodologies as the current study. Emissions of N2O during the second episode began ~24 h after H2O application and peaked after 3 days. The absence of the second peak from most chambers at lower temperatures (Figure 3a) was likely due to suboptimal conditions for OM mineralization and microbial/enzymatic processes related to N2O production. A thermostat malfunction occurred in Chamber 3, where the temperature increased to 45 °C for 6 h at 9 days after H2O application, causing a brief spike in emissions and providing further evidence for temperature effects on N2O from feedyards. At higher temperatures, the majority of N2O was derived from the second peak, accounting for 80–89% of cumulative emissions (Figure 3b). These results suggest that maximum cumulative feedyard N2O emissions should occur in warm/hot seasons around a week after a rainfall event; brief, but intense, flushes of N2O occur immediately after rainfall and emit more N2O at higher temperatures.
In soils, monitoring changes in TN, TC, C:N ratios, NHx, and NOx may help infer N2O production mechanisms. However, feedyard manure is complex and heterogeneous, contains nonlimiting amounts of C and N, and has variable aerobic and anaerobic microsites (e.g., near water troughs and lounging areas, deep in the manure pack) [4,5,9,43]. As manure changes with wetting and drying, there is potential for simultaneous or coupled N2O production from both denitrification and nitrification [8,11,43]. In addition, N2O could be produced by a suite of biotic and abiotic reactions related to wet–dry cycling [41]. In a study by Redding et al. [1], N2O emissions were positively related to manure density, pH, and temperature, whereas negative relationships were identified between N2O and manure H2O and organic C contents. Waldrip et al. [4] conducted 15 NFT–NSS measurement campaigns on two commercial Texas feedyards and developed predictive empirical models, where temperature and manure NOx and H2O contents were positively related to measured N2O losses. Negative relationships were identified between N2O and manure OM, NHx, dissolved organic C (DOC), and dissolved N contents, as well as ultraviolet–visible (UV–vis) parameters related to OM complexity/availability. Differences in C and N availability for microbial growth and energy could impact microbial community structure, gene abundances, and activities of enzymes involved in denitrification and nitrification in feedyard manure.
There is uncertainty about the source of N2O on feedyards. Is it emitted from the drier, aerobic, loose manure on the pen surface, or is it derived from deeper in the manure pack, where H2O content is higher, and OM is more mature and stable? Mielke et al. [26] reported feedyard manure bulk densities that ranged from 0.75 to 0.93 g·cm−3, which are typical of the deeper manure in the Texas Panhandle. In contrast, bulk densities of <0.50 g·cm−3 are common for the loose surface manure. Furthermore, self–sealing of the pores in the deeper layers occurs due to physical compaction and biological gleying, where microbial mucilage clogs pores and creates anaerobic conditions [26,27]. It is unclear to what extent the deeper manure is permeable to gas diffusion leading to N2O loss to surface air. The regression data of the current study suggested that N2O losses were more closely related to surface manure characteristics than the pack manure. Further study is required to determine manure pack diffusion of N2O under feedyard conditions.

3.3. Denitrification Enzyme Activity

Assays of DEA measure the concentration of denitrifying enzymes in a sample on the basis of the principle that denitrification rates are proportional to enzyme concentrations under nonlimiting conditions. The DEA assay conducted for the current study was based on Tiedje [22] and optimized for beef manure [11,12]. The optimized assay considered the high amounts of glucose and KNO3 needed to provide nonlimiting conditions for feedyard microorganisms [11]. In typical DEA assays, acetylene gas is added to the headspace to block conversion of N2O to N2 in the last step of the denitrification pathway. Acetylene was not used in our assays due to safety concerns; thus, measured DEA in this study was a proxy of NOx loss in solution rather than N2O production into the headspace. In preliminary studies, the chloramphenicol concentration (0.5 mg·L−1) was optimized to effectively inhibit de novo enzyme synthesis without influencing DEA rates. The raw data plots of changes in NOx concentration over the entire 54 h incubation time were not linear at either depth; average R2 values were 0.889 ± 0.60 (range 0.682 to 0.991). There was a bimodal response, where DEA rates increased after 24 h. Example raw DEA data are presented in Figure 8, which shows NOx losses 8 days after the first simulated rainfall event. This bimodal response could be due to the presence of two or more types of denitrification enzymes (one slow and one faster), time required to adapt to conditions, or an unknown phenomenon. Researchers have proposed different sampling times for DEA assays. Smith and Tiedje [43] and Tiedje [22] recommended a 1 h incubation period that should not exceed 2 h. Woodbury et al. [11] adopted this approach and conducted 2 h DEA incubations with beef manure, with samples taken every 15 min. Ayadi et al. [12] adopted a longer–term approach with an incubation time of 56 h. Our approach included both shorter– (DEAs, 0–24 h) and longer–term (DEAl, 24–54 h) measures to determine DEA rates, with a total incubation time of 54 h.
There was clear variability in DEA rates both among samples and at different depths (Figure 8). This was particularly noticeable at 5–10 cm, where NOx concentrations ranged from ~0.20 to 0.48 mmol·g−1 at 30 h, but then rapidly decreased to very low levels in all samples (Figure 8b). The surface samples (0–5 cm) showed highly variable, but generally slower, NOx utilization after 24 h than at 5–10 cm. The data were split into 0–24 h and 24–54 h periods and further evaluated as DEA–short (DEAs) and DEA–long (DEAl), respectively. Rates of DEA, DEAs, and DEAl are presented in Table 2.
Prior to H2O application, DEA rates were 0.65 + 0.16 μmol N2O·g−1·h−1 (R2 = 0.90). These rates were very low compared to those of Woodbury et al. [11] and Ayadi et al. [12], which recorded data from beef manure in mmol, rather than the μmol·g−1·h−1 values of the current study. Two hours after the first H2O application, manure in Chamber 5 (17.2 °C) at 0–5 cm had higher DEA rates than the ambient control (Chamber 1) (Table 2a). This was followed by a period where all chamber DEA rates were statistically equivalent until Day 59, where DEA in Chamber 5 was 50% lower (0.45 μmol·g−1·h−1) than in other chambers (~0.90 μmol·g−1·h−1). This was likely due to enzyme inhibition or suboptimal conditions for microbial activity after the temperature of Chamber 5 was increased from 17.2 °C to 46.2 °C on Day 22. This effect was also seen at 5–10 cm, with higher rates in Chambers 4 and 5 (1.05 and 0.94 μmol·g−1·h−1, respectively) than ambient control (0.46 μmol·g−1·h−1) on Day 1 and reduced DEA in Chamber 5 on Day 59, compared to other chambers. At the lower depth, the chambers with the highest temperatures (Chambers 2 and 5) tended to have lower DEA, suggesting that the high temperatures slowed denitrification under these conditions. Overall, manure DEA rates were not significantly related to N2O emissions (p = 0.137; Figure 6). However, there were negative relationships between 0–5 cm DEA rates and NOx values (p = 0.005) and TC:TN ratio (p = 0.010) (Table 3a). At 0–5 cm, no relationships were found among DEA and temperature, manure DM, or Eh values. DEA was not a good predictor of N2O emissions at 0–5 cm (p = 0.137, R2 = 0.024). Furthermore, no significant relationship was found between DEA and NA rates in surface manure (p = 0.728, R2 = 0.001), suggesting that coupled nitrification–denitrification was not the primary source of emissions at 0–5 cm depth.
Using correlation coefficients, only manure pH was found to be significantly related to DEA at 5–10 cm (Table 2b). While DEA at 0–5 cm was negatively (p < 0.05) related to NOx concentrations and C:N ratios (Table 2a); these same relationships were not found at 5–10 cm (Table 2b). Ayadi et al. [12] reported longer–term DEA rates (24–56 h) in fresh bedded beef manure pack that ranged from 0.8 to 1.4 mmol·g−1·h−1. In their study, DEA rates were decreased at a higher temperature (40 °C) but increased to ~3.5 mmol·g−1·h−1 with manure age. This suggests that there is an adaptation period required for denitrifiers to adjust to higher temperatures.
Calculations for rate of DEA in the current study were broken into 0–24 h for short–term DEA (DEAs) and longer–term (24–54 h) rates (DEAl) on the basis of the bimodal nature of the raw data for NOx disappearance (Figure 6). Rates for DEAs were slower than DEA over the entire 54 h incubation, with mean DEAs values of 0.41 and 0.22 μmol·g−1·h−1 for 0–5 and 5–10 cm, respectively (Table 1). There were very few significant differences in DEAs among chambers at either depth or between depths; however, at the second H2O application on Day 22, DEAs at 0–5 cm in Chamber 2 (40 °C) was over twofold greater than ambient control (15 °C). In addition, there was a trend for increased DEAs in Chamber 4 (26.8 °C). At this depth, DEAs was negatively related to manure NHx content (p < 0.0001) and C:N ratios (p = 0.003) (Table 3a). At 5–10 cm, H2O addition did little to affect DEAs, which is understandable due to limited visible infiltration of simulated rainfall into the manure. DEAs at 5–10 cm was negatively related to manure DM, NHx and NOx contents, and C:N ratio (p = 0.003 to 0.0001). There was a positive relationship with DEAs and TN (p = 0.024) (Table 3b).
In general, DEA and DEAs rates were much lower than Woodbury et al. [11], who reported that 2 h DEA rates in feedyard manure were 29 to 132 mmol·g−1·h−1. The difference between results obtained in the current study and Woodbury et al. [11] could be due to manure characteristics; Woodbury et al. [11] measured seasonal DEA rates at different depths and locations within a feedyard pen with a downgradient, where DEA of the surface manure was much higher than that of the deeper manure pack. They also noted that rates in the surface layer of unconsolidated manure were 29 to 132 mmol·g−1·h−1 and tended to be higher at the lower side of the pen, where runoff occurred. In contrast, DEA in the manure pack was much lower at 0.0 to 6.8 mmol·g−1·h−1. The differences between the current study and those of Woodbury et al. [11] were likely because our manure was a composite of surface and pack manure after cattle had been transported to slaughter. It was scraped to near the soil level, ground, and added to chambers. In contrast, Woodbury et al. [11] measured DEA from fresher manure collected from locations in an occupied cattle pen. It is likely that the lower concentrations of NHx and NOx (due to NH3 volatilization over time), combined with the dry nature of the manure in the current study, had some impact on measured DEA rates. From these data, however, it can be discerned that short–term DEA in dry manure was slow but increased over time and with H2O addition. Temperature did not have a clear–cut effect on DEAs but was negatively related to NHx (p < 0.0001), where higher temperatures would promote NH3 volatilization and manure NHx losses.
Rates for DEAl (24–54 h) were up to fourfold higher than DEA and DEAs rates, ranging from 0.94 to 1.69 μmol·g−1·h−1 at 0–5 cm after the first H2O addition (Table 2). Rates of DEAl tended to be slightly lower at 5–10 cm that at 0–5 cm and decreased over time. The rate of DEAl at 0–5 cm was negatively related to temperature (p = 0.0005) and positively related to NHx contents (p < 0.0001). In addition, NHx was positively related to DEAl at 5–10 cm. This could suggest coupled nitrification–denitrification (NH4+ to NO3 via nitrification and then NO3 to N2O/N2 via denitrification). At 5–10 cm, the temperature response was negligible (p = 0.087), but pH was negatively related to DEAl (p = 0.001). However, there were no significant differences among DEAl in chambers for most of the study, except for reduced rates at 46.2 °C (Chamber 5) on Day 59 at 5–10 cm.
In general, measures of potential DEA did not provide sufficient data to make a hard case about the effects of temperature, rainfall, or depth on dentrification–related N2O emissions from feedyard manure. However, from these data, we can ascertain that short–term DEA rates were very low at both depths, and DEAs was unlikely to contribute to the initial peak observed immediately after simulated rainfall addition (Figure 3). The time period for the DEAl data would also exclude longer–term DEA from suspicion as the cause of the first observed N2O peak but does not exclude denitrification as the rationale behind the second, temperature–related N2O peak observed (Figure 3b). Relationships identified among DEA, DEAs, and DEAl data and manure chemical characteristics suggest denitrifier involvement in the N2O production process in feedyard manure (Table 3) and should be further explored.

3.4. Nitrification Enzyme Activity

At the beginning of the experiment, NA rates at 0–5 cm and 5–10 cm ranged from 0.10–0.18 and 0.11–0.17 μmol·g−1·h−1, respectively (Table 2). Although there were some differences in NA among chambers, they were inconsistent between the two sampled depths. At 0–5 cm, there was a tendency for increased NA with temperature, but this same trend was not obvious at 5–10 cm. Nitrification is a key process in the manure N cycle, with NHx oxidation as the first and limiting step of the nitrification process. Pearson’s correlation coefficients revealed a negative relationship among NA in the surface manure and N2O emissions (p = 0.0003), pH (p = 0.008), and NOx concentrations (p = 0.0018), and a positive relationship with manure DM content (p < 0.0001) (Table 3). Similarly, at 5–10 cm, NA was negatively related to N2O emissions (p = 0.02), NHx (p = 0.022), and NOx (p = 0.012), and positively related to DM content (p < 0.0001). NA data are presented in Table 2, where H2O addition at 0–5 cm on Day 22 reduced NA, but then NA increased with the highest activity on Day 30 in Chamber 5 (46.2 °C). The same trend was not observed at 5–10 cm. In general, NA was considerably lower than DEA at both depths and was not related to DEA, which should exclude coupled nitrification–denitrification as the predominant pathway(s) of N2O production in feedyard manure.
Although the pH range for this study was narrow (8.81–9.23), there was a significant relationship between pH at 0–5 cm and NA. Nitrification in soils is favored by a DM content of 15–20%, and this trend for higher NA in dryer substrate was observed as a positive correlation with between NA and manure DM (Table 3). Soil and microbial properties have been found to regulate NA, particularly pH and abundance of ammonia–oxidizing bacteria (AOB). Lin et al. [44] found that AOB, particularly Nitrospira Cluster 8a, explained 73% of the variation in soil NA. In the current study, NA values were significantly higher than those of Ayadi et al. [12], who reported NA in the nmol range rather than the μmol range of the current study. Ayadi et al. [12] found that temperature had a major effect, where incubation of bedded beef manure at 40 °C had more than twofold higher NA than that at 10 °C. In contrast, temperature had no significant effect on NA in the current study at either depth (p ≥ 0.72). Given the temperature response observed in N2O emissions (Figure 3b) and the lack of correlation with temperature and NA rates, it could be assumed that the majority of the N2O emitted in the wide peak ~2 days after wetting was derived from denitrification rather than nitrification.

4. Conclusions

Correlation analyses of all variables against N2O emissions proved useful in identifying key parameters involved in N2O production and emission from dry feedyard manure. Fluxes of N2O increased immediately after simulated rainfall and a second, temperature–related N2O flush was observed after the second simulated rainfall application. The variables most highly positively related to N2O flux were NOx and NHx concentrations and temperature at both depths (p ≤ 0.01 to 0.001). Negatively related variables at 0–5 cm were DM (p ≤ 0.001), NA, Eh, and pH (all p ≤ 0.01). These data suggest that N2O from feedyards was largely emitted from surface manure (0–5 cm) via denitrification when DM content was lower (i.e., higher H2O content) and Eh, pH, and potential nitrification rates were low. Higher temperatures promoted N2O emissions and influenced rates of DEA. However, analyses of DEA did not show any significant relationship with N2O fluxes. It is possible that DEA rates were already high (or low), and the “optimal” conditions provided in the DEA assay did not stimulate nor inhibit DEA. On the basis of these data, we propose that most N2O was emitted from the surface of the manure–packed chambers via denitrification after simulated rainfall; however, we cannot exclude the contribution of nitrification under drier conditions. Further study, perhaps with isotopic analysis, is warranted to ascertain if the first flush of N2O after simulated rainfall to dry manure was produced biotically or an abiotic N2O–releasing mechanism.

Author Contributions

H.M.W., experimental design, data analyses and manuscript preparation; D.B.P., experimental design and GHG capture; S.M., laboratory analyses, troubleshooting and data analyses; D.N.M., experimental guidance and data analyses; K.D.C., experimental design and GHG capture; R.W.T., manuscript review; B.R.M., data analyses and manuscript preparation; M.J.S., project collaborator and manuscript review; B.W., project collaborator and manuscript review. All authors have read and agreed to the published version of the manuscript.

Funding

This research received no external funding.

Acknowledgments

The authors thank Heather Robbe, Kathleen Webb, Kaitlin Dowdy, and Will Willis for technical assistance.

Conflicts of Interest

The authors declare no conflict of interest.

References

  1. Redding, M.R.; Devereux, J.; Phillips, F.; Lewis, R.; Naylor, T.; Kearton, T.; Hill, C.J.; Weidemann, S. Field measurement of beef pen manure methane and nitrous oxide reveals a surprise for inventory calculations. J. Environ. Qual. 2015, 44, 720–728. [Google Scholar] [CrossRef] [PubMed]
  2. Parker, D.B.; Waldrip, H.M.; Casey, K.D.; Todd, R.W.; Willis, W.W.; Webb, K. Temporal nitrous oxide emissions from beef cattle feedlot manure following a simulated rainfall event. J. Environ. Qual. 2017, 46, 733–740. [Google Scholar] [CrossRef] [PubMed]
  3. Parker, D.B.; Casey, K.D.; Todd, R.W.; Waldrip, H.M.; Marek, G.M.; Auvermann, B.W.; Marek, T.H.; Webb, K.; Willis, W.M.; Pemberton, B.; et al. Improved chamber systems for rapid, real–time nitrous oxide emissions from manure and soil. Trans. ASABE 2017, 60, 1235–1258. [Google Scholar] [CrossRef]
  4. Waldrip, H.M.; Casey, K.D.; Todd, R.W.; Parker, D.B. Nitrous oxide emissions from Southern High Plains beef cattle feedyards: Measurement and modeling. Trans. ASABE 2017, 60, 1209–1221. [Google Scholar] [CrossRef]
  5. Waldrip, H.M.; Todd, R.W.; Parker, D.B.; Cole, N.A.; Rotz, C.A.; Casey, K.D. Nitrous oxide emissions from open–lot cattle feedyards: A review. J. Environ. Qual. 2016, 45, 17971811. [Google Scholar] [CrossRef] [PubMed] [Green Version]
  6. Woodbury, B.L.; Gilley, J.E.; Parker, D.B.; Stromer, B.S. Greenhouse gas emissions from beef feedlot surface materials as affected by diet, moisture, temperature, and time. Trans. ASABE 2018, 61, 571–582. [Google Scholar] [CrossRef] [Green Version]
  7. Costa, C., Jr.; Li, C.; Cerri, C.E.P.; Cerri, C.C. Measuring and modeling nitrous oxide and methane emissions from beef cattle feedlot manure management: First assessments under Brazilian condition. J. Environ. Sci. Health B 2014, 49, 696–711. [Google Scholar] [CrossRef]
  8. Butterbach–Bahl, K.; Baggs, E.M.; Dannenmann, M.; Kiese, R.; Zechmeister–Boltenstern, S. Nitrous oxide emissions from soils: How well do we understand the processes and their controls? Philos. Trans. R. Soc. B 2013, 368, 20130122. [Google Scholar] [CrossRef]
  9. Parker, D.B.; Waldrip, H.M.; Casey, K.D.; Woodbury, B.L.; Spiehs, M.J.; Webb, K.; Willis, W.M. How do temperature and rainfall affect nitrous oxide emissions from open–lot beef cattle feedyard pens? Trans. ASABE 2018, 61, 1049–1061. [Google Scholar] [CrossRef]
  10. Aguilar, O.A.; Maghirang, R.; Rice, C.W.; Trabue, S.L.; Erickson, L.E. Nitrous oxide fluxes from a commercial beef cattle feedlot in Kansas. Air Soil Water Res. 2014, 7, 35–45. [Google Scholar] [CrossRef]
  11. Woodbury, B.L.; Miller, D.N.; Nienaber, J.A.; Eigenberg, R.A. Seasonal and spatial variations of denitrifying enzyme activity in feedlot soil. Trans. ASABE 2001, 44, 1635–1642. [Google Scholar] [CrossRef]
  12. Ayadi, F.Y.; Spiehs, M.J.; Cortus, E.L.; Miller, D.N.; Djira, G.D. Physical, chemical, and biological properties of simulated beef cattle bedded manure packs. Trans. ASABE 2015, 58, 797–811. [Google Scholar] [CrossRef]
  13. Liao, W.; Liu, C.; Gao, Z. Impacts of feedlot floor condition, deposition frequency, and inhibitors on N2O and CH4 emissions from feedlot dung and urine patches. J. Air Waste Manag. Assoc. 2018, 68, 700–712. [Google Scholar] [CrossRef] [PubMed] [Green Version]
  14. Parker, D.B.; Casey, K.D.; Cortus, E.L.; Min, B.R.; Waldrip, H.M.; Woodbury, B.; Spiehs, M. Empirical model of annual nitrous oxide emissions from open–lot beef cattle feedyard pens (version 2). In Proceedings of the 2019 ASABE Annual International Meeting, Boston, MA, USA, 7–10 July 2019. Paper No. 1900299. [Google Scholar] [CrossRef]
  15. Giles, M.; Morley, N.; Baggs, E.M.; Daniell, T.J. Soil nitrate reducing processes–drivers, mechanisms for spatial variation, and significance for nitrous oxide production. Front. Microbiol. 2012, 3, 407. [Google Scholar] [CrossRef] [PubMed] [Green Version]
  16. Rice, W.C.; Mason, A.M.; Cole, N.A.; Clark, R.N. The Influence of Feedlot Pen Surface Layers on Microbial Community Structure and Diversity. In Proceedings of the International Symposium on Air Quality and Waste Management for Agriculture, Broomfield, CO, USA, 16–19 September 2017. [Google Scholar]
  17. Cole, N.A.; Mason, A.M.; Todd, R.W.; Rhoades, M.; Parker, D.B. Chemical composition of pen surface layers of beef cattle feedyards. Prof. Anim. Sci. 2009, 25, 541–552. [Google Scholar] [CrossRef]
  18. Hart, S.C.; Stark, J.M.; Davidson, E.A.; Firestone, M.K. Nitrogen mineralization, immobilization and nitrification. In Methods of Soil Analysis. Part. 2—Microbiological and Biochemical Properties; Weaver, R.W., Angle, J.S., Bottomley, P.S., Eds.; Soil Science Society of America: Madison, WI, USA, 1994; pp. 985–1018. [Google Scholar]
  19. Zumft, W.G. Cell biology and molecular basis of denitrification. Microbiol. Mol. Biol. Rev. 1997, 61, 533–616. [Google Scholar] [CrossRef] [PubMed]
  20. Jones, C.M.; Stres, B.; Rosenquist, M.; Hallin, S. Phylogenetic analysis of nitrite, nitric oxide, and nitrous oxide respiratory enzymes reveal a complex evolutionary history for denitrification. Mol. Biol. Evol. 2008, 25, 1955–1966. [Google Scholar] [CrossRef]
  21. Firestone, M.K.; Firestone, R.B.; Tiedje, J.M. Nitrous oxide from soil denitrification: Factors controlling its biological production. Science 1980, 208, 749–751. [Google Scholar] [CrossRef]
  22. Tiedje, J.M. Denitrifiers. In Methods of Soil Analysis: Part 2. Microbial and Biochemical Properties; Chapter 14; Bigham, J.M., Ed.; SSSA: Madison, WI, USA, 1994. [Google Scholar]
  23. Azam, F.; Müller, C.; Weiske, A.; Benckiser, G.; Ottow, J. Nitrification and denitrification as sources of atmospheric nitrous oxide– Role of oxidizable carbon and applied nitrogen. Biol. Fertil. Soils 2002, 35, 54–61. [Google Scholar] [CrossRef]
  24. Wu, D.; Cárdenas, L.M.; Calvet, S.; Brüggemann, N.; Loick, N.; Liu, S.; Bol, R. The effect of nitrification inhibitor on N2O, NO and N2 emissions under different soil moisture levels in a permanent grassland soil. Soil Biol. Biochem. 2017, 113, 153–160. [Google Scholar] [CrossRef]
  25. Lai, T.V.; Denton, M.D. N2O and N2 emissions from denitrification respond differently to temperature and nitrogen supply. J. Soils Sediments 2018, 18, 1548–1557. [Google Scholar] [CrossRef]
  26. USEPA. Methods for the Determination of Inorganic Substances in Environmental Samples; USEPA 600/R–93/100; United States Environmental Protection Agency: Cincinnati, OH, USA, 1993. Available online: https://nepis.epa.gov/Exe/ZyNET.exe/30002U3P.TXT?ZyActionD=ZyDocument&Client=EPA&Index=1991+Thru+1994&Docs=&Query=&Time=&EndTime=&SearchMethod=1&TocRestrict=n&Toc=&TocEntry=&QField=&QFieldYear=&QFieldMonth=&QFieldDay=&IntQFieldOp=0&ExtQFieldOp=0&XmlQuery=&File=D%3A%5Czyfiles%5CIndex%20Data%5C91thru94%5CTxt%5C00000008%5C30002U3P.txt&User=ANONYMOUS&Password=anonymous&SortMethod=h%7C–&MaximumDocuments=1&FuzzyDegree=0&ImageQuality=r75g8/r75g8/x150y150g16/i425&Display=hpfr&DefSeekPage=x&SearchBack=ZyActionL&Back=ZyActionS&BackDesc=Results%20page&MaximumPages=1&ZyEntry=1&SeekPage=x&ZyPURL (accessed on 18 September 2020).
  27. Mielke, L.N.; Swanson, N.P.; McCalla, T.M. Soil profile conditions of cattle feedlots. J. Environ. Qual. 1974, 3, 14–17. [Google Scholar] [CrossRef]
  28. Miller, J.J.; Curtis, T.; Larney, F.J.; McAllister, T.A. Physical and chemical properties of feedlot pen surfaces located on moderately coarse– and moderately fine–textured soils in Southern Alberta. J. Environ. Qual. 2008, 37, 1589–1598. [Google Scholar] [CrossRef] [PubMed]
  29. Maeda, K.; Toyoda, S.; Hanajima, D.; Yoshida, N. Denitrifiers in the surface zone are primarily responsible for the nitrous oxide emission of dairy manure compost. J. Hazard. Mat. 2013, 248–249, 329–336. [Google Scholar] [CrossRef] [PubMed]
  30. Baral, K.R.; Arthur, E.; Olesen, J.E.; Peterson, S.O. Predicting nitrous oxide emissions from manure properties and soil moisture: An incubation experiment. Soil Biol. Biochem. 2016, 97, 112–120. [Google Scholar] [CrossRef]
  31. Rudaz, A.O.; Davidson, E.A.; Firestone, M.K. Sources of nitrous oxide production following wetting of dry soil. FEMS Microbiol. Lett. 1991, 85, 117–124. [Google Scholar] [CrossRef] [Green Version]
  32. Butterly, C.R.; Baldock, J.A.; Tang, C.X. The contribution of crop residues to changes in soil pH under field conditions. Plant Soil 2013, 366, 185–198. [Google Scholar] [CrossRef]
  33. Cai, Z.; Wang, B.; Xu, M.; Zhang, H.; He, X.; Zhang, L.; Gao, S. Intensified soil acidification from chemical N fertilization and prevention by manure in an 18–year field experiment in the red soil of southern China. J. Soils Sediments 2015, 15, 260–270. [Google Scholar] [CrossRef]
  34. Shi, R.-Y.; Liu, Z.-D.; Li, Y.; Jiant, T.; Xu, M.; Li, J.-Y.; Xu, R.-K. Mechanisms for increasing soil resistance to acidification by long–term manure application. Soil Tillage Res. 2019, 185, 77–84. [Google Scholar] [CrossRef]
  35. Fordham, A.W.; Schwertmann, U. Composition and reactions of liquid manure (gulle), with particular reference to phosphate: III. pH buffering capacity and organic components. J. Environ. Qual. 1977, 6, 140–144. [Google Scholar] [CrossRef]
  36. Ni, J. Mechanistic models of ammonia release from liquid manure: A review. J. Agric. Eng. Res. 1999, 72, 1–17. [Google Scholar] [CrossRef]
  37. Xu, J.; Wei, Q.; Yang, S.; Liao, L.; Qi, Z.; Wang, W. Soil degassing during watering: An overlooked soil N2O emission process. Environ. Pollut. 2018, 242, 257–263. [Google Scholar] [CrossRef] [PubMed]
  38. Chaoui, H.; Montes, F.; Rotz, C.A.; Richard, T.L. Volatile ammonia fraction and flux from thin layers of buffered ammonium solution and dairy cattle manure. Trans. ASABE 2009, 52, 1695–1706. [Google Scholar] [CrossRef]
  39. Harrison–Kirk, T.; Beare, M.H.; Meenken, E.D.; Condron, L.M. Soil organic matter and texture affect. responses to dry/wet cycles: Effects on carbon dioxide and nitrous oxide emissions. Soil Biol. Biochem. 2013, 57, 43–55. [Google Scholar] [CrossRef]
  40. Manalil, S.; Riethmuller, G.; Flower, K. Rapid emissions of nitrous oxide from fallow over summer following wetting in a Mediterranean–type environment. Soil Tillage Res. 2014, 143, 130–136. [Google Scholar] [CrossRef]
  41. Congreves, K.A.; Wagner–Riddle, C.; Si, B.C.; Clough, T.J. Nitrous oxide emissions and biogeochemical responses to soil freezing–thawing and drying–rewetting. Soil Biol. Biochem. 2018, 117, 5–15. [Google Scholar] [CrossRef]
  42. Waldrip, H.M.; He, Z.; Todd, R.W.; Hunt, J.F.; Cole, N.A. Characterization of organic matter in beef feedyard manure by UV–visible and Fourier transform infrared spectroscopies. J. Environ. Qual. 2014, 43, 690–700. [Google Scholar] [CrossRef] [PubMed]
  43. Smith, M.S.; Tiedje, J.M. Isolation and characterization of a nitrite reductase gene and its use as a probe for denitrifying bacteria. Appl. Environ. Microbiol. 1979, 58, 376–384. [Google Scholar] [CrossRef] [Green Version]
  44. Lin, Y.; Ye, G.; Luo, J.; Di, H.J.; Liu, D.; Fan, J.; Ding, W. Nitrospira Cluster 8a plays a predominant role in the nitrification process of a subtropical ultisol under long–term inorganic and organic fertilization. Appl. Environ. Microbiol. 2018, 84, e01031-18. [Google Scholar] [CrossRef] [Green Version]
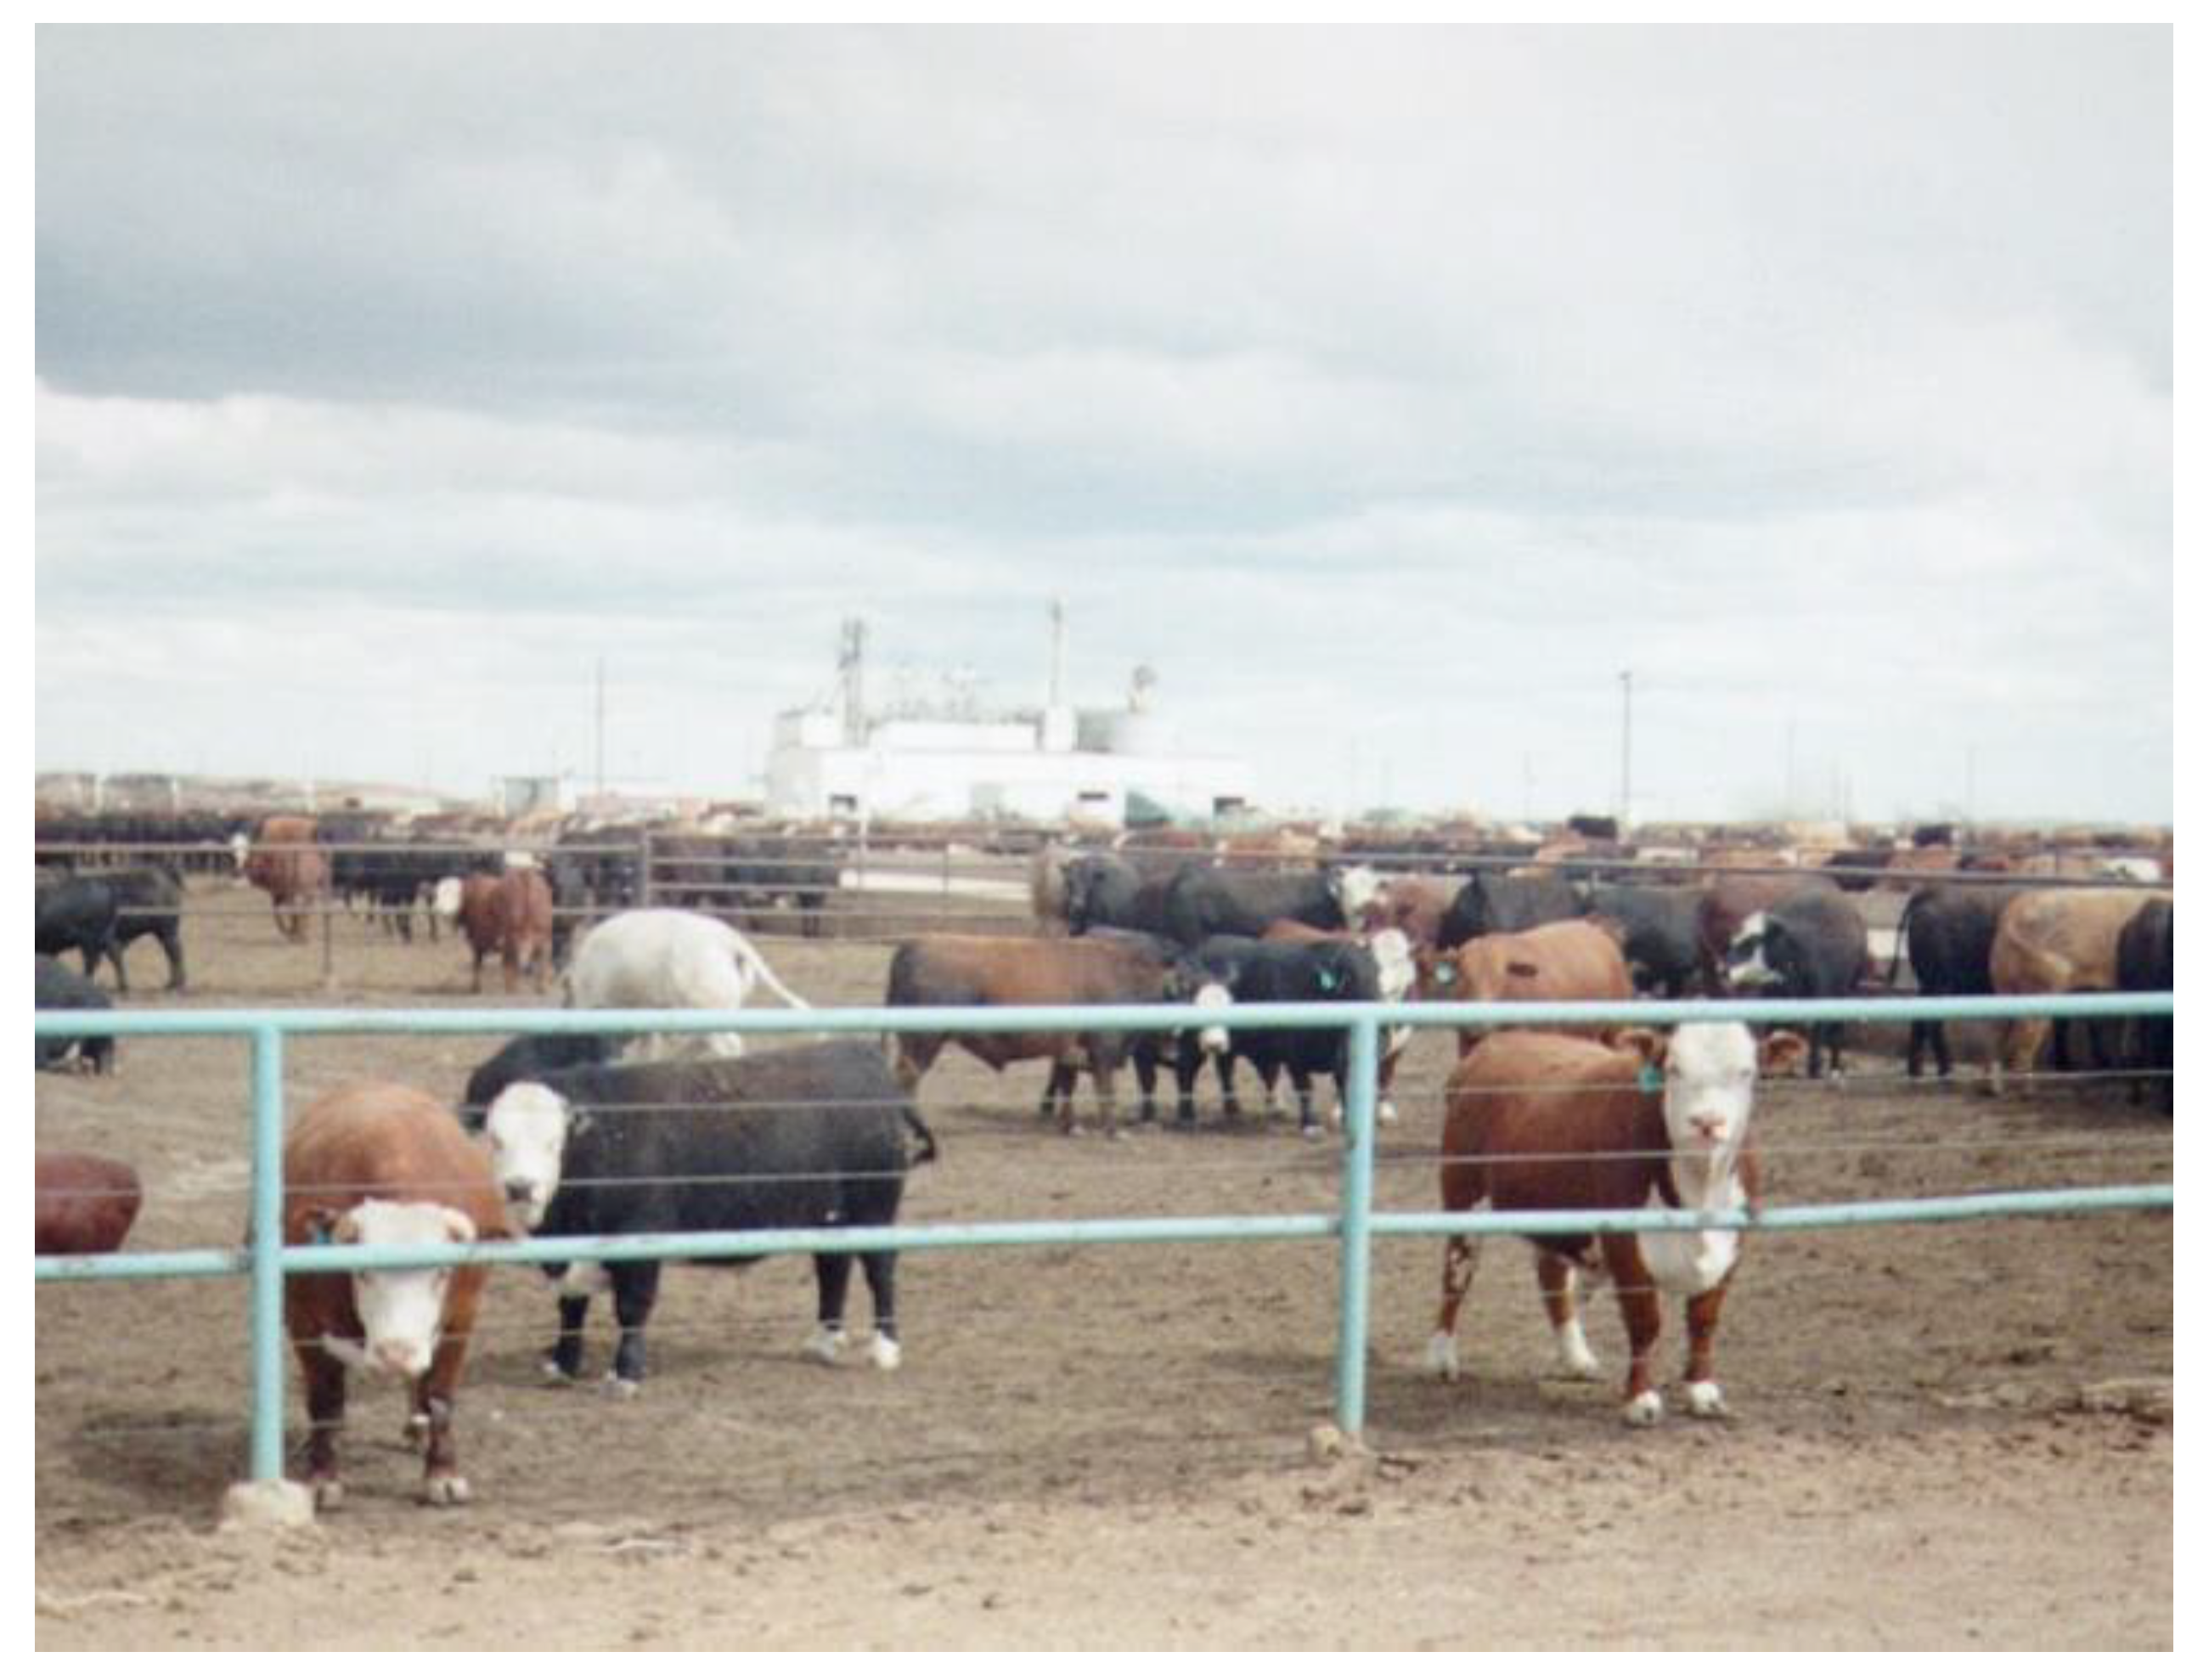
Figure 1. Commercial feedyard in the Texas Panhandle. Cattle are kept in soil–surfaced pens at a density of ~15 m2·animal−1 for 150 to 180 days. Manure accumulates until cattle are removed for slaughter. The pens develop wet/muddy areas, dry areas, and areas with high urine/feces where cattle congregate. The underlying manure forms a dense “pack” that generally contains more H2O than surface manure.
Atmosphere 11 01056 g001
Figure 2. Equipment for determining nitrous oxide emissions from feedyard manure: (a) emissions were measured from five 1.0 m2 (surface area) chambers sealed with a portable lid. Polyethylene tubing recirculated sampled air between chambers and a Los Gatos N2O analyzer; (b) chamber temperatures were controlled with vented thermal blankets. Source: Parker et al. [1].
Atmosphere 11 01056 g002
Figure 3. N2O–N fluxes from feedyard manure following two simulated rainfall applications. Emissions were baseline until H2O was added, and then a large peak was observed in all chambers: (a) Days 1–20, and (b) Days 20–59, where temperatures were increased in three chambers and a second, longer–term N2O peak was observed that was related to temperature. Source: Parker et al. [3].
Atmosphere 11 01056 g003
Figure 4. (a) Denitrifier enzyme activity (DEA) analyses on manure using an Ankom system. (b) Liquid samples were collected through an anaerobic sidearm port on Ankom bottles and analyzed for nitrate/nitrite disappearance over time. The Ankom Gas Production module (lid) released excess headspace gas from bottle at predetermined pressure.
Atmosphere 11 01056 g004
Figure 5. Example curve of nitrate/nitrite (NOx) loss for denitrification enzyme activity (DEA) studies. There were clear bimodal trends for all plots, where DEA rates changed after 24 h. Thus, DEA rates were also calculated as DEA–short (DEAs; 0–24 h) and DEA–long (DEAl 24–54 h).
Atmosphere 11 01056 g005
Figure 6. Pearson correlation coefficients (r values) of measured variables against nitrous oxide (N2O) emissions at (a) 0–5 cm depth and (b) 5–10 cm depth. Bars to the right of the y–axis indicate a positive (+) relationship and bars to the left are negatively (−) correlated. Asterisks indicate significant relationships at * p ≤ 0.05, ** p ≤ 0.01, *** p ≤ 0.001.
Atmosphere 11 01056 g006
Figure 7. Concentrations of ammonia/ammonium (NHx) and nitrate/nitrite (NOx) during the study period in the five chambers at 0–5 cm and 5–10 cm depths. Columns with different superscript letters on each day were significantly different at p < 0.05. (a) NHx at 0–5 cm, (b) NHx at 5–10 cm, (c) NOx at 0–5 cm, (d) NOx at 5–10 cm.
Atmosphere 11 01056 g007aAtmosphere 11 01056 g007b
Figure 8. Example plots of nitrate/nitrite (NOx) disappearance over 54 h of anaerobic incubation for denitrification enzyme activity (DEA) studies in manure from (a) 0–5 cm depth and (b) 5–10 cm depth. These data were used to calculate DEA rates.
Atmosphere 11 01056 g008
Table 1. Nitrous oxide (N2O) emissions, temperature and manure characteristics in five chambers (1, 2, 3, 4, and 5) that received two simulated rainfall episodes. Chambers were held at temperatures ranging from 5.0 to 46.2 °C, with increases on Day 22 (changes in italics). Samples were taken at (a) 0–5 cm and (b) 5–10 cm depths.
(a)
Day and ChamberTemp (°C)N2O–N
(mg·m−2·h−1)
DM
(%)
OM
(% DM)
Eh
(mV)
pHNHx
(mg·kg−1)
NOx
(mg·kg−1)
Total N
(% DM)
Total C
(% DM)
1 (1st H2O application)
15.01.4377.6 ab*54.7−27.09.004035.68 b2.49 b26.3 bc
211.24.2676.3 ab55.3−29.79.053685.78 b2.62 ab28.4 a
321.566.180.6 a55.7−19.78.923414.65 b2.58 ab26.5 bc
426.815268.7 b55.1−22.38.8640224.2 a2.68 a28.1 ab
517.225.581.9 a56.0−14.08.943524.27 b2.51 b26.1 c
9
15.00.2180.7 b56.2−15.38.95 a371 a3.85 ab2.67 a28.6 a
211.20.4687.4 a54.3−32.78.82 b343 a2.93 b2.53 b26.6 b
321.50.5086.1 ab54.9−12.38.85 ab297 bc4.38 a2.62 ab27.6 ab
426.81.5887.9 a56.0−21.38.95 a273 c4.99 a2.68 a28.3 a
517.20.4587.6 a55.1−12.38.86 ab334 ab4.68 a2.66 ab27.6 ab
18
15.00.0188.8 b56.0−65.79.07337 a2.65 b2.5526.4 b
211.22.1391.6 a56.4−61.38.94315 a3.10 ab2.6328.3 a
321.50.8391.8 a55.6−67.79.03290 a3.67 ab2.5627.2 ab
426.80.9392.0 a55.3−66.39.04215 b4.98 a2.5926.6 ab
517.24.3490.1 ab57.0−68.39.00312 a4.42 ab2.6628.1 ab
22 (2nd H2O application)
115.021.370.957.4 a−16.3 a9.06 a427 ab13.62.5928.1 ab
238.194.163.153.4 c−98.3 b8.85 b458 a17.62.5927.2 ab
321.558.770.056.3 ab−37.3 ab8.98 a338 b12.52.6728.8 a
426.885.263.455.5 b−69.7 ab8.94 ab348 ab14.52.4726.0 b
546.210671.554.7 bc−62.7 ab8.94 ab408 ab14.92.4025.6 b
30
115.00.2273.1 c56.1 a−26.7 b9.23 a286 a3.99 ab2.90 a30.5 a
238.113.189.0 ab52.7 b2.33 a9.03 bc217 ab3.69 ab2.70 ab28.0 ab
321.53.3382.3 b55.4 a−16.3 ab9.22 ab150 b5.99 a2.75 ab28.0 ab
426.84.5086.9 ab53.7 ab−16.3 ab9.16 ab153 b3.89 ab2.65 b26.8 bc
546.26.7192.1 a55.5 a−23.0 b8.89 c275 a3.25 b2.43 c25.1 c
59
115.02.0887.9 c56.552.3 a8.95 ab294 a3.45 bc2.66 a28.1
238.10.8991.7 ab54.916.0 b8.96 ab183 b3.83 abc2.66 a27.7
321.50.4190.4 b55.1−3.33 c9.09 ab201 b4.79 ab2.56 ab26.9
426.80.6291.1 b55.0−11.3 c9.13 a179 b5.32 a2.61 ab27.4
546.20.5593.4 a53.80.00 bc8.94 b209 b2.66 c2.50 b27.0
(b)
Day and ChamberTemp (°C)N2O–N
(mg·m−2·h−1)
DM
(%)
OM
(% DM)
Eh
(mV)
pHNHx
(mg·kg−1)
NOx
(mg·kg−1)
Total N
(% DM)
Total C
(% DM)
1 (1st H2O application)
15.01.4375.155.6−32.7 b9.03 a404 ab4.19 b2.5728.4
211.24.2671.655.1−30.7 b8.97 ab405 ab10.7 b2.6428.0
321.566.183.054.3−32.0 b8.94 ab357 b4.12 b2.5526.0
426.815265.654.7−20.7 ab8.83 b469 a36.2 a2.6927.2
517.225.577.755.7−13.0 a8.96 ab370 b6.74 b2.5726.0
9
15.00.2174.1 b54.9−21.08.87497 a8.65 a2.6127.5
211.20.4681.4 ab52.9−30.38.84394 ab2.99 b2.5726.6
321.50.5082.1 ab53.1−18.38.83294 b3.78 ab2.4525.5
426.81.5884.9 a54.2−21.78.85301 b2.76 b2.6027.2
517.20.4584.3 a52.7−19.38.81343 b2.86 b2.5926.9
18
15.00.00884.355.6−59.09.00369 ab2.96 bc2.5827.1
211.22.1386.755.0−60.08.99404 a2.72 c2.5826.9
321.50.83088.055.2−62.79.02255 d4.40 ab2.6027.1
426.80.93087.155.2−62.09.07313 c3.67 bc2.6126.7
517.24.3482.756.2−67.39.00316 bc5.68 a2.6528.1
22 (2nd H2O application)
115.021.385.4 a55.5 ab−25.3 a9.02 a347 ab2.48 b2.55 b25.7
238.194.168.1 ab53.6 bc−146 b8.79 b450 ab22.5 a2.58 b26.5
321.558.781.3 ab56.5 a−67.0 a8.99 a323 b5.40 b2.65 ab27.3
426.885.266.7 b52.3 c−80.7 ab8.94 a339 ab7.20 b2.87 a28.9
546.210670.6 ab54.9 abc−67.0 a8.92 ab492 a15.8 ab2.66 ab27.2
30
115.00.2263.8 b55.3−22.7 b9.05 a307 ab8.032.7126.9
238.113.179.3 a52.5−6.67 a8.97 a220 abc17.42.6926.1
321.53.3366.2 b52.4−14.3 ab9.04 a176 c14.82.7726.2
426.84.5078.8 a52.1−22.3 b9.00 a203 bc5.242.6326.2
546.26.7184.3 a53.6−26.3 b8.82 b337 a6.102.7327.7
59
115.02.0883.6 b53.235.0 a8.972794.412.60 ab27.2
238.10.8987.1 ab50.615.7 ab8.961702.662.59 ab25.8
321.50.4186.0 ab52.90.33 bc8.922474.582.65 a26.4
426.80.6289.3 ab55.0−9.67 c8.932533.512.48 b25.4
546.20.5591.1 a53.8−12.3 c8.882852.062.53 ab26.1
N2O, nitrous oxide; Eh, oxidation–reduction potential; DM, dry matter; OM, organic matter; NHx, ammonium/ammonia; NOx, nitrate/nitrite; total N, total nitrogen; total C, total carbon. * For each day, values within a column followed by different letters were significantly different (p ≤ 0.05) from other chambers on the same sampling day.
Table 2. Denitrifier enzyme activity (DEA) and nitrification enzyme activity (NA) in five chambers (1, 2, 3, 4, and 5) that received two simulated rainfall episodes. Chambers were held at temperatures ranging from 5.0 to 46.2 °C, with increases on Day 22 (changes in italics). Samples were taken at 0–5 cm and 5–10 cm depths. Temperatures denoted in bold italics increased on Day 22. DEA rates were calculated as follows: (1) DEA, 0–54 h incubation; (2) DEAs, 0–24 h incubation; (3) DEAl, 24–54 h incubation.
Day and ChamberTemp (°C)DEA
(μmol·g−1·h−1)
DEAs
(μmol·g−1·h−1)
DEAl
(μmol·g−1·h−1)
NA
(μmol·g−1·h−1)
0–5 cm5–10 cm0–5 cm5–10 cm0–5 cm5–10 cm0–5 cm5–10 cm
1
15.00.34 b0.46 b0.240.231.14 ab0.79 b0.18 a0.17
211.20.69 ab0.74 ab0.250.171.24 ab1.45 a0.10 b0.12
321.50.67 b0.80 ab0.340.240.94 b1.40 ab0.14 ab0.16
426.80.90 ab1.05 a0.440.291.69 a1.96 a0.11 ab0.11
517.20.95 a0.94 a0.800.151.58 a1.79 a0.11 ab0.13
9
15.00.943.760.320.52 a*1.561.460.14 b0.11 b
211.20.930.970.640.33 ab1.071.520.17 ab0.15 ab
321.50.960.970.610.22 ab1.161.660.20 ab0.20 a
426.80.960.920.810.26 ab0.951.530.24 a0.15 ab
517.20.890.880.270.14 b1.441.700.18 ab0.12 b
18
15.00.810.85 a0.17 b0.231.50a1.330.140.11 c
211.20.850.88 a0.17 b0.301.32a1.330.140.13 bc
321.50.870.88 a0.56 ab0.331.07ab1.280.180.16 b
426.80.840.43 b0.84 a0.430.79b1.300.160.23 a
517.20.780.61 ab0.27 b0.431.36a1.090.180.13 bc
22
115.00.630.740.250.16 b1.081.060.09 abc0.13 ab
238.10.680.940.520.65 a1.011.540.10 ab0.10 ab
321.50.570.640.310.32 b0.901.030.12 a0.16 a
426.80.840.660.540.47 ab1.220.950.05 c0.09 b
546.20.640.570.210.18 b1.161.070.06 bc0.08 b
30
115.00.741.03 a0.33 b0.741.200.96 ab0.10 b0.05 b
238.10.850.66 b0.72 ab0.650.890.75 b0.08 b0.14 a
321.50.821.02 a0.66 ab0.820.831.04 ab0.14 ab0.08 b
426.80.961.12 a0.82 a0.900.870.90 ab0.07 b0.16 a
546.20.850.94 a0.40 ab0.351.021.24 a0.24 a0.16 a
59
115.00.90 a1.02 a0.31 b0.511.29 a1.160.17 ab0.14 ab
238.10.85 a0.83 a0.63 ab0.560.84 ab1.010.09 b0.18 a
321.50.86 a0.92 a0.66 ab0.521.09 ab1.350.14 ab0.14 ab
426.80.93 a0.83 a0.88 a0.240.97 ab1.480.12 ab0.13 ab
546.20.45 b0.40 b0.64 ab0.400.60 b0.710.20 a0.09 b
* For each day, values within a column followed by different letters were significantly different among chambers on that particular sampling day (p ≤ 0.05).
Table 3. Pearson’s correlation coefficients (R values) among measured parameters and denitrifier enzyme activity (DEA) and nitrification activity (NA). DEA–short (DEAs, 0–24 h incubation) and DEA–long (DEAl, 24–54 h incubation) were also analyzed at depths of (a) 0–5 cm and (b) 5–10 cm; p–values for each parameter are in parentheses. Asterisks indicate significance at * p ≤ 0.05, ** p ≤ 0.01, and *** p ≤ 0.001.
(a)
0–5 cm depthDEADEAsDEAlNA
N2O emissions−0.156 (0.137)−0.083 (0.428)0.155 (0.139)−0.369 (0.0003) ***
Temperature−0.139 (0.191)0.169 (0.112)−0.359 (0.0005) ***−0.038 (0.722)
Dry matter0.171 (0.103)0.114 (0.275)−0.183 (0.079)0.471 (<0.0001) ***
Eh0.065 (0.540)−0.018 (0.862)−0.056 (0.591)0.129 (0.218)
pH0.047 (0.659)0.143 (0.180)−0.152 (0.152)−0.278 (0.008) **
Total nitrogen0.098 (0.352)0.082 (0.436)0.022 (0.835)−0.060 (0.570)
Total carbon−0.041 (0.700)−0.079 (0.452)0.088 (0.400)−0.023 (0.823)
Ammonium/ammonia−0.176 (0.094)−0.442 (<0.0001) ***0.464 (<0.0001) ***−0.026 (0.802)
Nitrate/nitrite−0.289 (0.005) **−0.098 (0.350)0.042 (0.689)−0.320 (0.002) **
TC:TN−0.266 (0.010) **−0.308 (0.003) **0.134 (0.202)0.053 (0.614)
DEA–––0.405 (<0.0001) ***0.426 (<0.0001) ***0.001 (0.991)
DEAs0.405 (<0.0001) ***–––−0.408 (<0.0001) ***−0.118 (0.268)
DEAl0.426 (<0.0001) ***−0.408 (<0.0001) ***–––−0.039 (0.712)
NA0.001 (0.991)−0.118 (0.268)−0.039 (0.712)–––
(b)
5–10 cm depthDEADEAsDEAlNA
N2O emissions−0.065 (0.545)−0.055 (0.608)0.156 (0.142)−0.244 (0.020) *
Temperature−0.196 (0.064)0.069 (0.522)−0.181 (0.087)−0.022 (0.834)
Dry matter−0.025 (0.817)−0.378 (0.0003) ***−0.108 (0.310)0.516 (<0.0001) ***
Eh0.134 (0.208)−0.028 (0.792)−0.008 (0.939)0.146 (0.170)
pH−0.228 (0.031) *0.183 (0.086)−0.372 (0.0003) **0.125 (0.242)
Total nitrogen0.003 (0.978)0.239 (0.024) *−0.102 (0.340)−0.180 (0.090)
Total carbon−0.044 (0.683)−0.166 (0.121)−0.025 (0.815)−0.055 (0.609)
Ammonium/ammonia0.021(0.846)−0.387 (0.0002) ***0.339 (0.0011) **−0.241 (0.022) *
Nitrate/nitrite−0.001 (0.992)−0.255 (0.016) *0.193 (0.068)−0.265 (0.012) *
TC:TN−0.060 (0.573)−0.482 (<0.0001) ***0.084 (0.429)0.136 (0.202)
DEA–––0.060 (0.574)0.219 (0.038) *−0.075 (0.483)
DEAs0.060 (0.574)–––−0.291 (0.006) **−0.189 (0.076)
DEAl0.219 (0.038) *−0.291 (0.006) **–––0.0004 (1.00)
NA−0.075 (0.483)−0.189 (0.076)0.0004 (1.00)–––
N2O, nitrous oxide; Eh, redox potential; TC, total carbon; TN, total nitrogen.