Article

Spread of COVID-19, Meteorological Conditions and Air Quality in the City of Buenos Aires, Argentina: Two Facets Observed during Its Pandemic Lockdown

by
Tomás R. Bolaño-Ortiz
1,2,*,
Romina M. Pascual-Flores
1,2,
S. Enrique Puliafito
1,2,
Yiniva Camargo-Caicedo
3,
Lucas L. Berná-Peña
1,4,
María F. Ruggeri
5,
Ana I. Lopez-Noreña
1,2,
María F. Tames
1,2 and
Francisco Cereceda-Balic
5,6
1
Mendoza Regional Faculty—National Technological University (FRM-UTN), Mendoza M5500, Argentina
2
National Scientific and Technical Research Council (CONICET), Mendoza M5500, Argentina
3
Environmental Systems Modeling Research Group—GIMSA, Universidad del Magdalena, Santa Marta 470001, Colombia
4
National Agency of Scientific and Technological Promotion (ANPCyT), Buenos Aires B1675, Argentina
5
Centre for Environmental Technologies – Universidad Técnica Federico Santa María (CETAM-UTFSM), Valparaíso 46383, Chile
6
Department of Chemistry, Universidad Técnica Federico Santa María (UTFSM), Valparaíso 46383, Chile
*
Author to whom correspondence should be addressed.
Atmosphere 2020, 11(10), 1045; https://doi.org/10.3390/atmos11101045
Submission received: 2 September 2020 / Revised: 20 September 2020 / Accepted: 25 September 2020 / Published: 30 September 2020
(This article belongs to the Special Issue Coronavirus Pandemic Shutdown Effects on Urban Air Quality)

Abstract

:
This work studied the spread of COVID-19, the meteorological conditions and the air quality in a megacity from two viewpoints: (1) the correlation between meteorological and air quality (PM10 and NO2) variables with infections and deaths due COVID-19, and (2) the improvement in air quality. Both analyses were performed for the pandemic lockdown due to COVID-19 in the City of Buenos Aires (CABA), the capital and the largest city in Argentina. Daily data from temperature, rainfall, average relative humidity, wind speed, PM10, NO2, new cases and deaths due COVID-19 were analyzed. Our findings showed a significant correlation of meteorological and air quality variables with COVID-19 cases. The highest temperature correlation occurred before the confirmation day of new cases. PM10 presented the highest correlation within 13 to 15 days lag, while NO2 within 3 to 6 days lag. Also, reductions in PM10 and NO2 were observed. This study shows that exposure to air pollution was significantly correlated with an increased risk of becoming infected and dying due to COVID-19. Thus, these results show that the NO2 and PM10 levels in CABA can serve as one of the indicators to assess vulnerability to COVID-19. In addition, decision-makers can use this information to adopt strategies to restrict human mobility during the COVID-19 pandemic and future outbreaks of similar diseases in CABA.

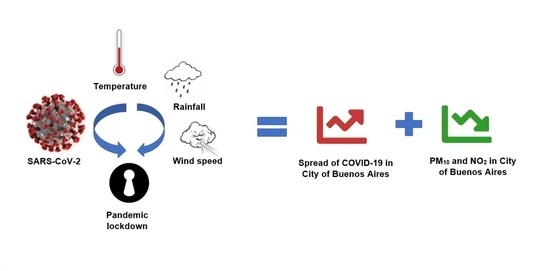
Graphical Abstract

1. Introduction

The Coronavirus disease 2019 (COVID-19) is identified as an infectious disease caused by severe acute respiratory syndrome novel coronavirus 2 (SARS-CoV-2) [1]. November 2019 was the date of the world’s first case of coronavirus (COVID-19). Patient zero could be a person living in Hubei-Wuhan (China). On December 2019, China alerted the World Health Organization (WHO) of several cases of unusual pneumonia in Wuhan, therefore officially identifying the cause of the COVID-19 outbreak in Wuhan, China [2]. COVID-19 produces mild symptoms in most people (fever, cough, sore throat, difficulty breathing, among others), but can also lead to severe respiratory illness and death [3]. On 11 March 2020, the WHO made the assessment that COVID-19 can be characterized as a pandemic [1].
Wang et al. [4] analyzed the characteristics of patients infected with COVID-19 and compared it to other pandemic diseases. Their results showed the danger of the novel coronavirus, and they emphasized the need to do everything possible to understand and control the disease. This situation positioned COVID-19 as one of the most tempting challenges and the greatest tragedy of the century after World War II [5]. In addition to the terrible effects on global health, after the first peak of infections, attention has focused on analyzing the impact of the COVID-19 pandemic on the economy, social aspects and on improved air quality [6,7]. In fact, studies at national level showed improvements in air quality due to reductions in aerosol optical depth (AOD) level in India [5], PM2.5 in China [8], CO, NO, NO2, PM10 and O3 in Brazil [3,9], and at the international level due to the reduction in the level of tropospheric NO2 observed by satellite data [10] during the COVID-19 pandemic lockdown. Recent researches have reported air quality improvements associated with social distancing measures and consequent reduced vehicular traffic [3,9,11,12,13,14]. Other studies also showed that meteorological and pollution indicators are significantly related to the spread of COVID-19 in Jakarta, Indonesia [15], New York City [16], and California state [17], the United States, Oslo, Norway [18], Brazil [19] and the Latin America and the Caribbean region [20].
By 30 April 2020, COVID-19 had spread in almost all countries, and this pandemic had infected 5.934 million people worldwide, while the death toll worldwide exceeds 367 thousand [1]. In Argentina, the first case was confirmed on 3 March 2020 by the Ministry of Health. As the cases spread, as in most countries, Argentina adopted restrictions on different social activities, imposing social distancing; nevertheless, COVID-19 infections spread quickly in Argentina, especially in CABA [21]. Then, on 20 March 2020, the Argentine government established the public health emergency and national quarantine (also called as lockdown). They closed industries and institutions of all kinds: schools and universities, shopping malls, restaurants and bars, squares and parks. Only activities such as basic health services, energy generation and food production, among others, were allowed [22]. By the end of May 2020, there were 14,702 confirmed cases and 510 deaths [21]. The City of Buenos Aires (CABA) reported 56% of the total cases and 44.7% of the deaths from COVID-19 in Argentina [21].
The spread of the COVID-19 pandemic in CABA has caused many deaths and economic losses due to the lockdown measures too [23]. As previously mentioned, different studies have shown that the impact of COVID-19 could be modulated by social, economic and, local meteorological and pollution variables. In addition, restrictions to reduce COVID-19 spread are generating unprecedented ways to improve air quality [3,9,12]. Therefore, the main objectives of our research were (a) to analyze the correlation between COVID-19 infections with meteorological and air quality variables considering the virus incubation period up to 14 days prior [14,24,25], and (b) to discuss the impacts on air quality due to PM10 and NO2 through the COVID-19 pandemic lockdown at CABA from March to May 2020. This study explains how some meteorological and air quality variables control the spread of COVID-19 in CABA. It also provides results for designing strategies to deal with future outbreaks of COVID-19 and prevent future pandemics of similar viral diseases [26]. Additionally, it allows us to know better how to improve air quality as a result of restrictions on anthropogenic activities in CABA, under circumstances hitherto never observed. Section 2 describes the study, data set, and procedures used. In Section 3, we display “the two facets observed” during the pandemic lockdown: (a) estimation of the correlation of infections and deaths due COVID-19 with meteorological and air quality variables in CABA, and (b) impact analysis of the air quality change in CABA due the COVID-19 pandemic. Moreover, we discuss the results by comparing the most recent literature available. Finally, conclusions are found in Section 4.

2. Data and Methodology

2.1. Study Area

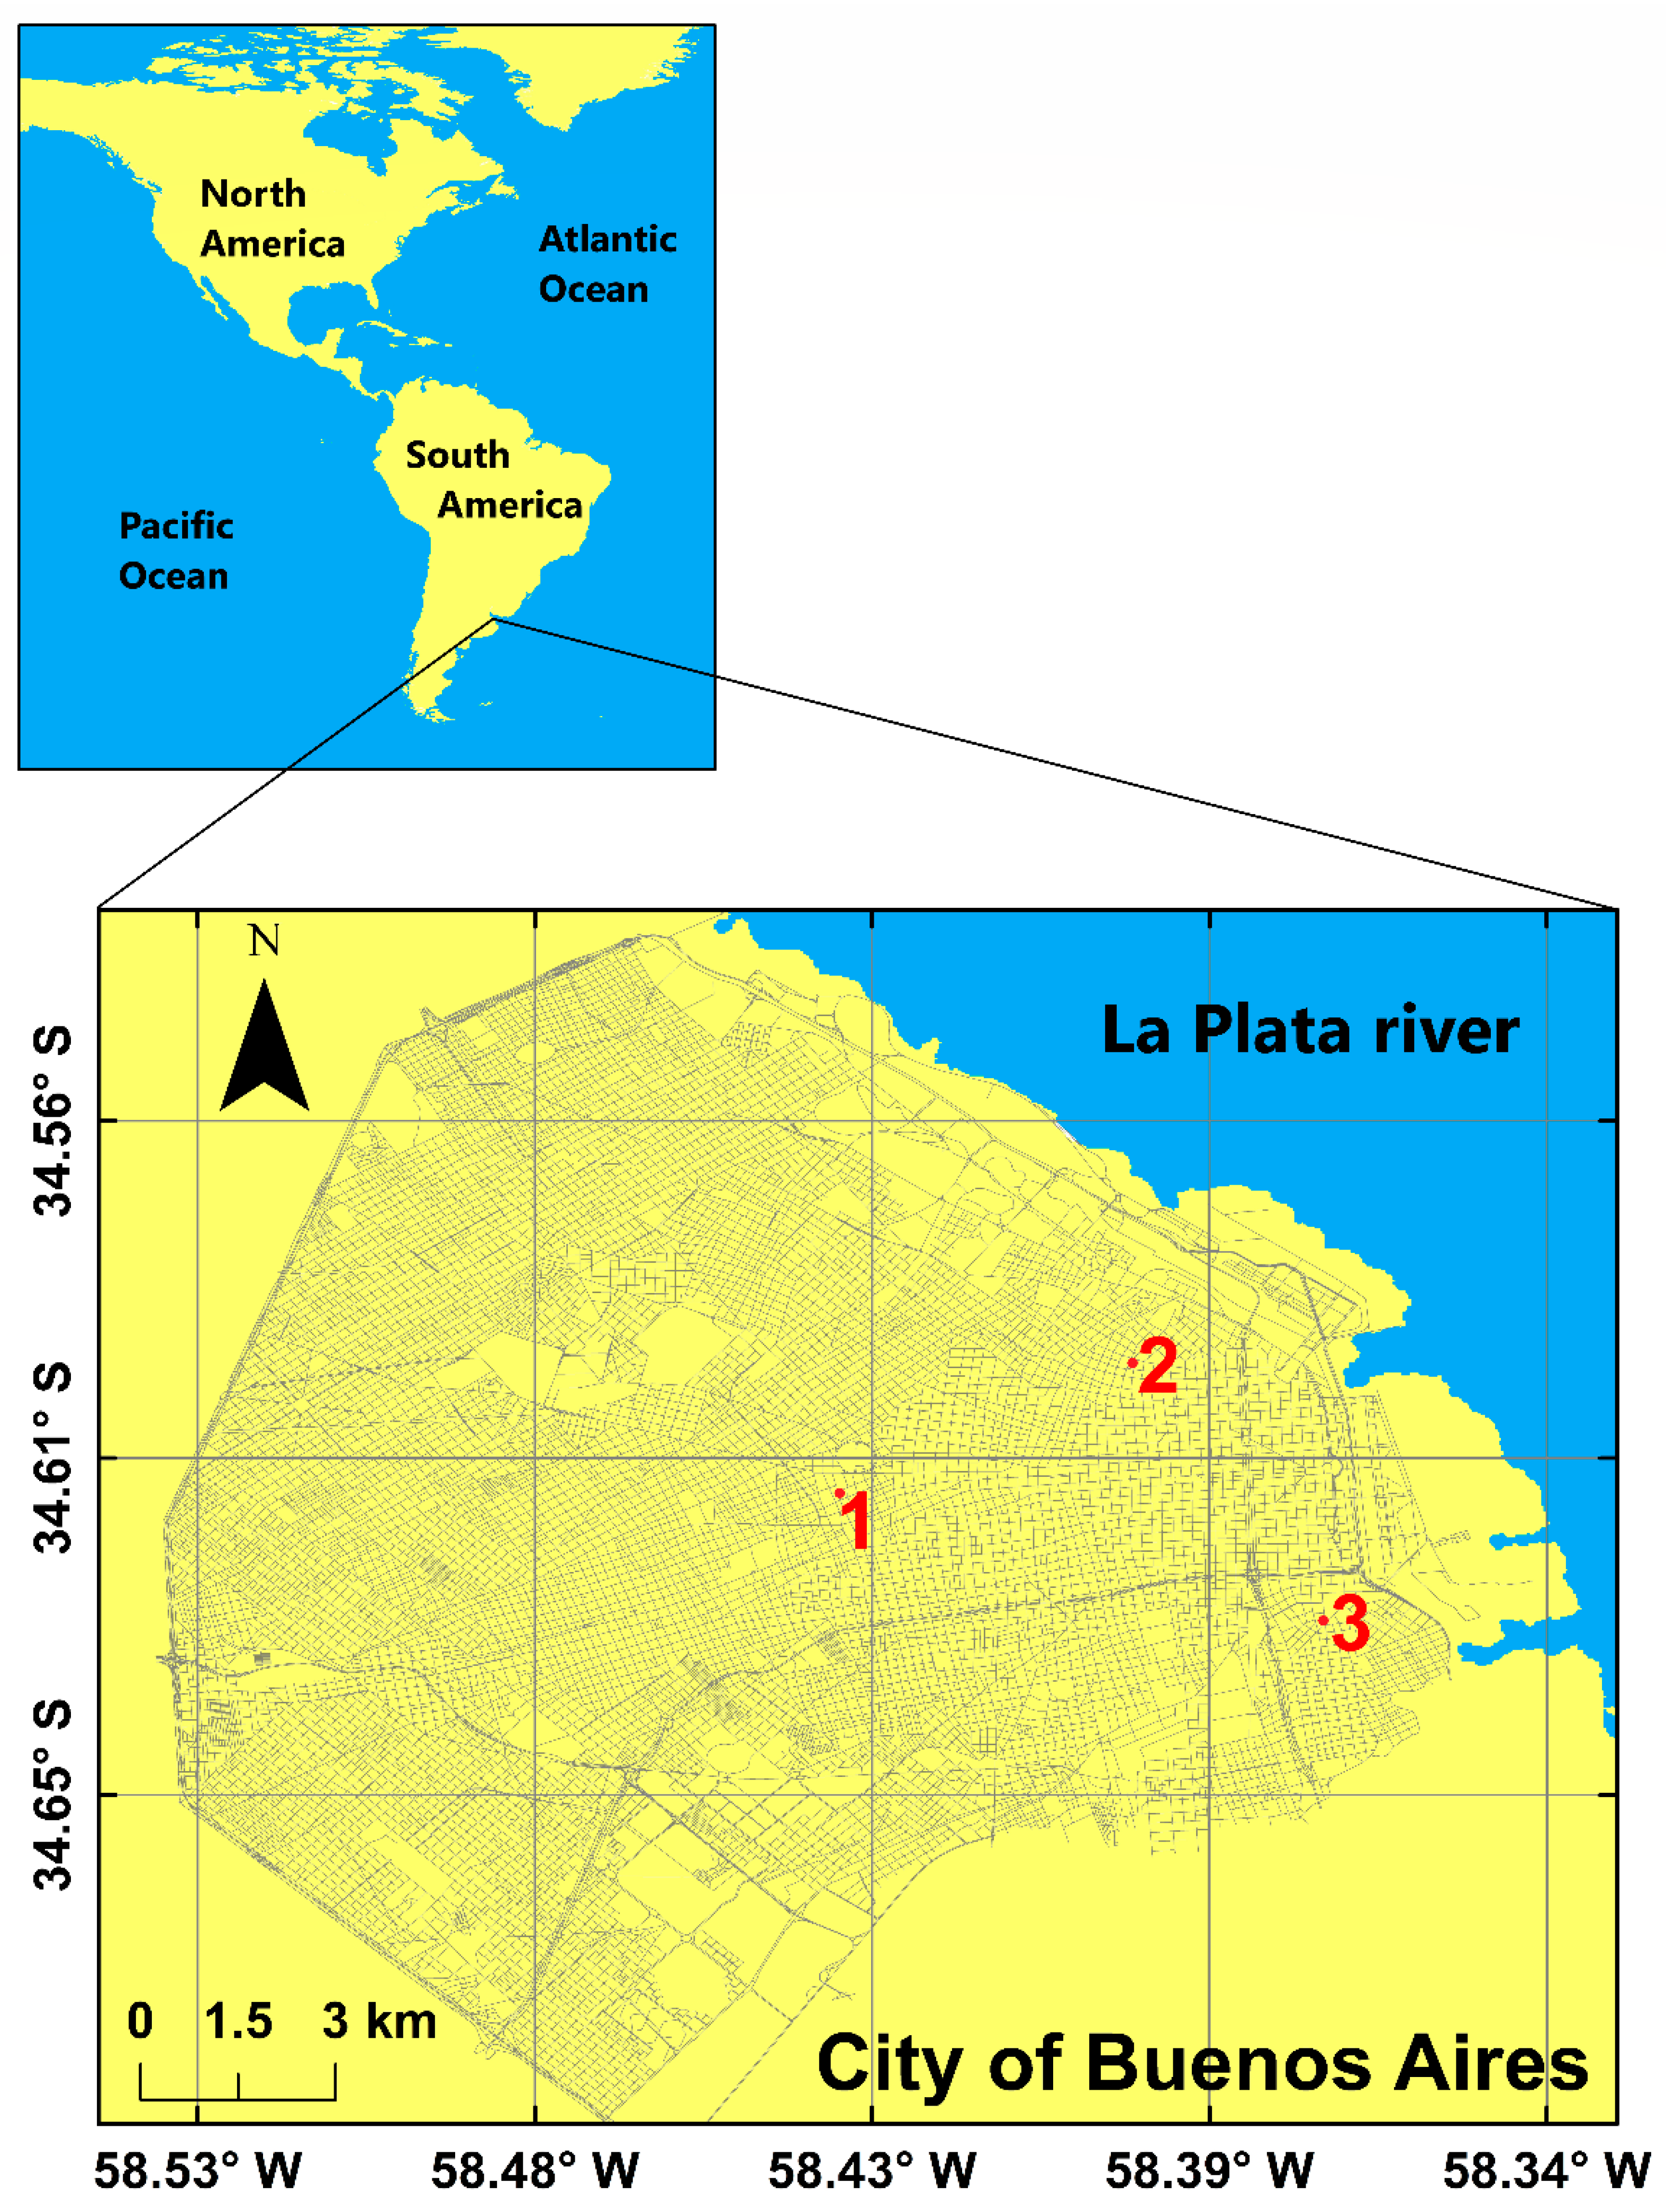
CABA is the capital and the largest city of Argentina. As shown in Figure 1, the city is located on the western shore of the estuary La Plata River, on the South American continent’s southeastern coast (34°36′ S, 58°22′ W). The area of CABA is 203 km2 and its population in 2020 based on projections of results of the 2010 Population Census is 3,075,646 inhabitants, with a population growth rate of 9.58% per year [27].

2.2. Data Collection

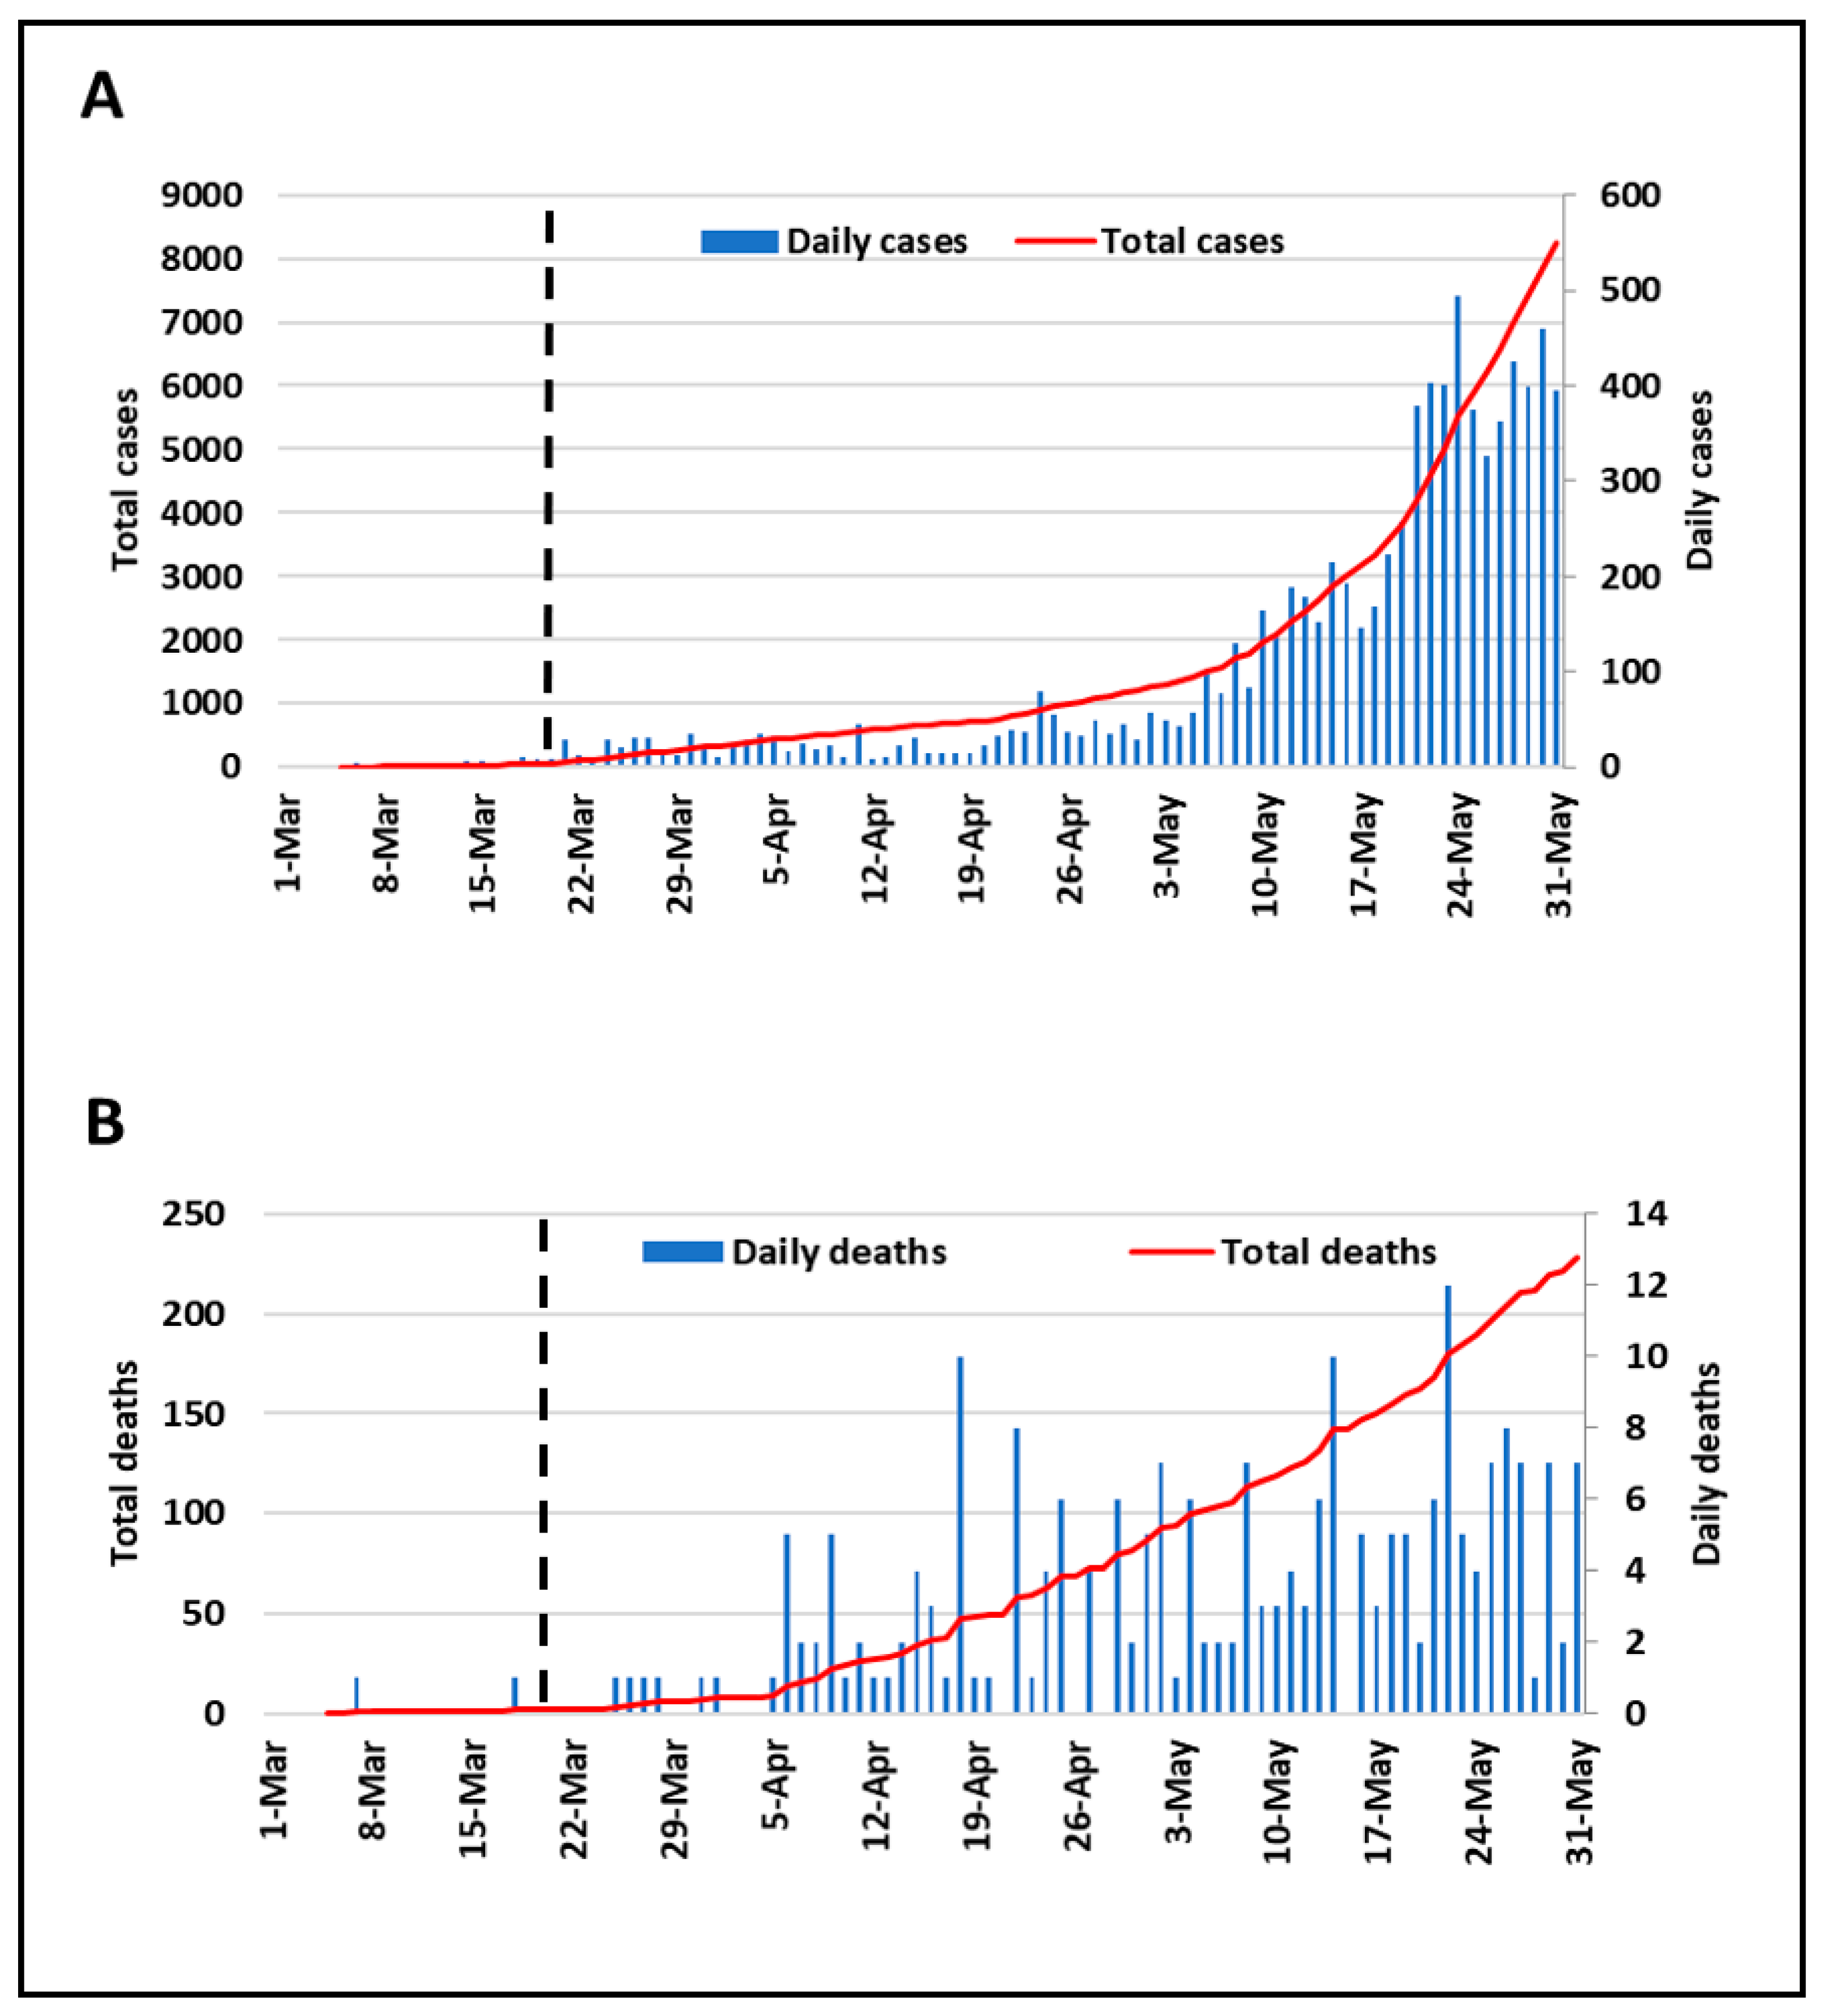
The data set used in this investigation was from 5 March to 31 May 2020 (Figure 2). It was obtained from the Ministry of Health for new cases (daily), total cases (accumulated), and mortality (daily) due to COVID-19 [21]. Daily meteorological data were obtained from Argentina’s National Weather Service [28]. The data consist of minimum temperature (°C), maximum temperature (°C), average temperature (°C), humidity (%), and accumulated Rainfall (mm).
The Spearman rank correlation tests were used to examine the correlation between variables, typically used for a non-normal distribution dataset, as shown in other studies [15,16,18,20]. Non-normal distribution was verified previously by the Shapiro-Wilk normality test application as shown in Table A1 (Appendix A). The correlations were done for new cases, total cases and mortality due to COVID-19, with meteorological and air quality variables, using lag up to 15 days over CABA.
Two commonly reported pollutants (PM10 and NO2) were obtained from the air quality network of this city. This data was obtained from hourly records from its three representative stations (see Figure 1) [29]. Then, we estimated the daily mean values of the recorded data, considering those data with a temporal representation greater than 75% of the time during the study period. Also, PM10 and NO2 pollutants data measured by the air quality network of this city were compared with data measured by the S5p/TROPOMI-ESA [30,31], both at the same time in 2019 and 2020.

2.3. Satellite Data Processing and Analysis

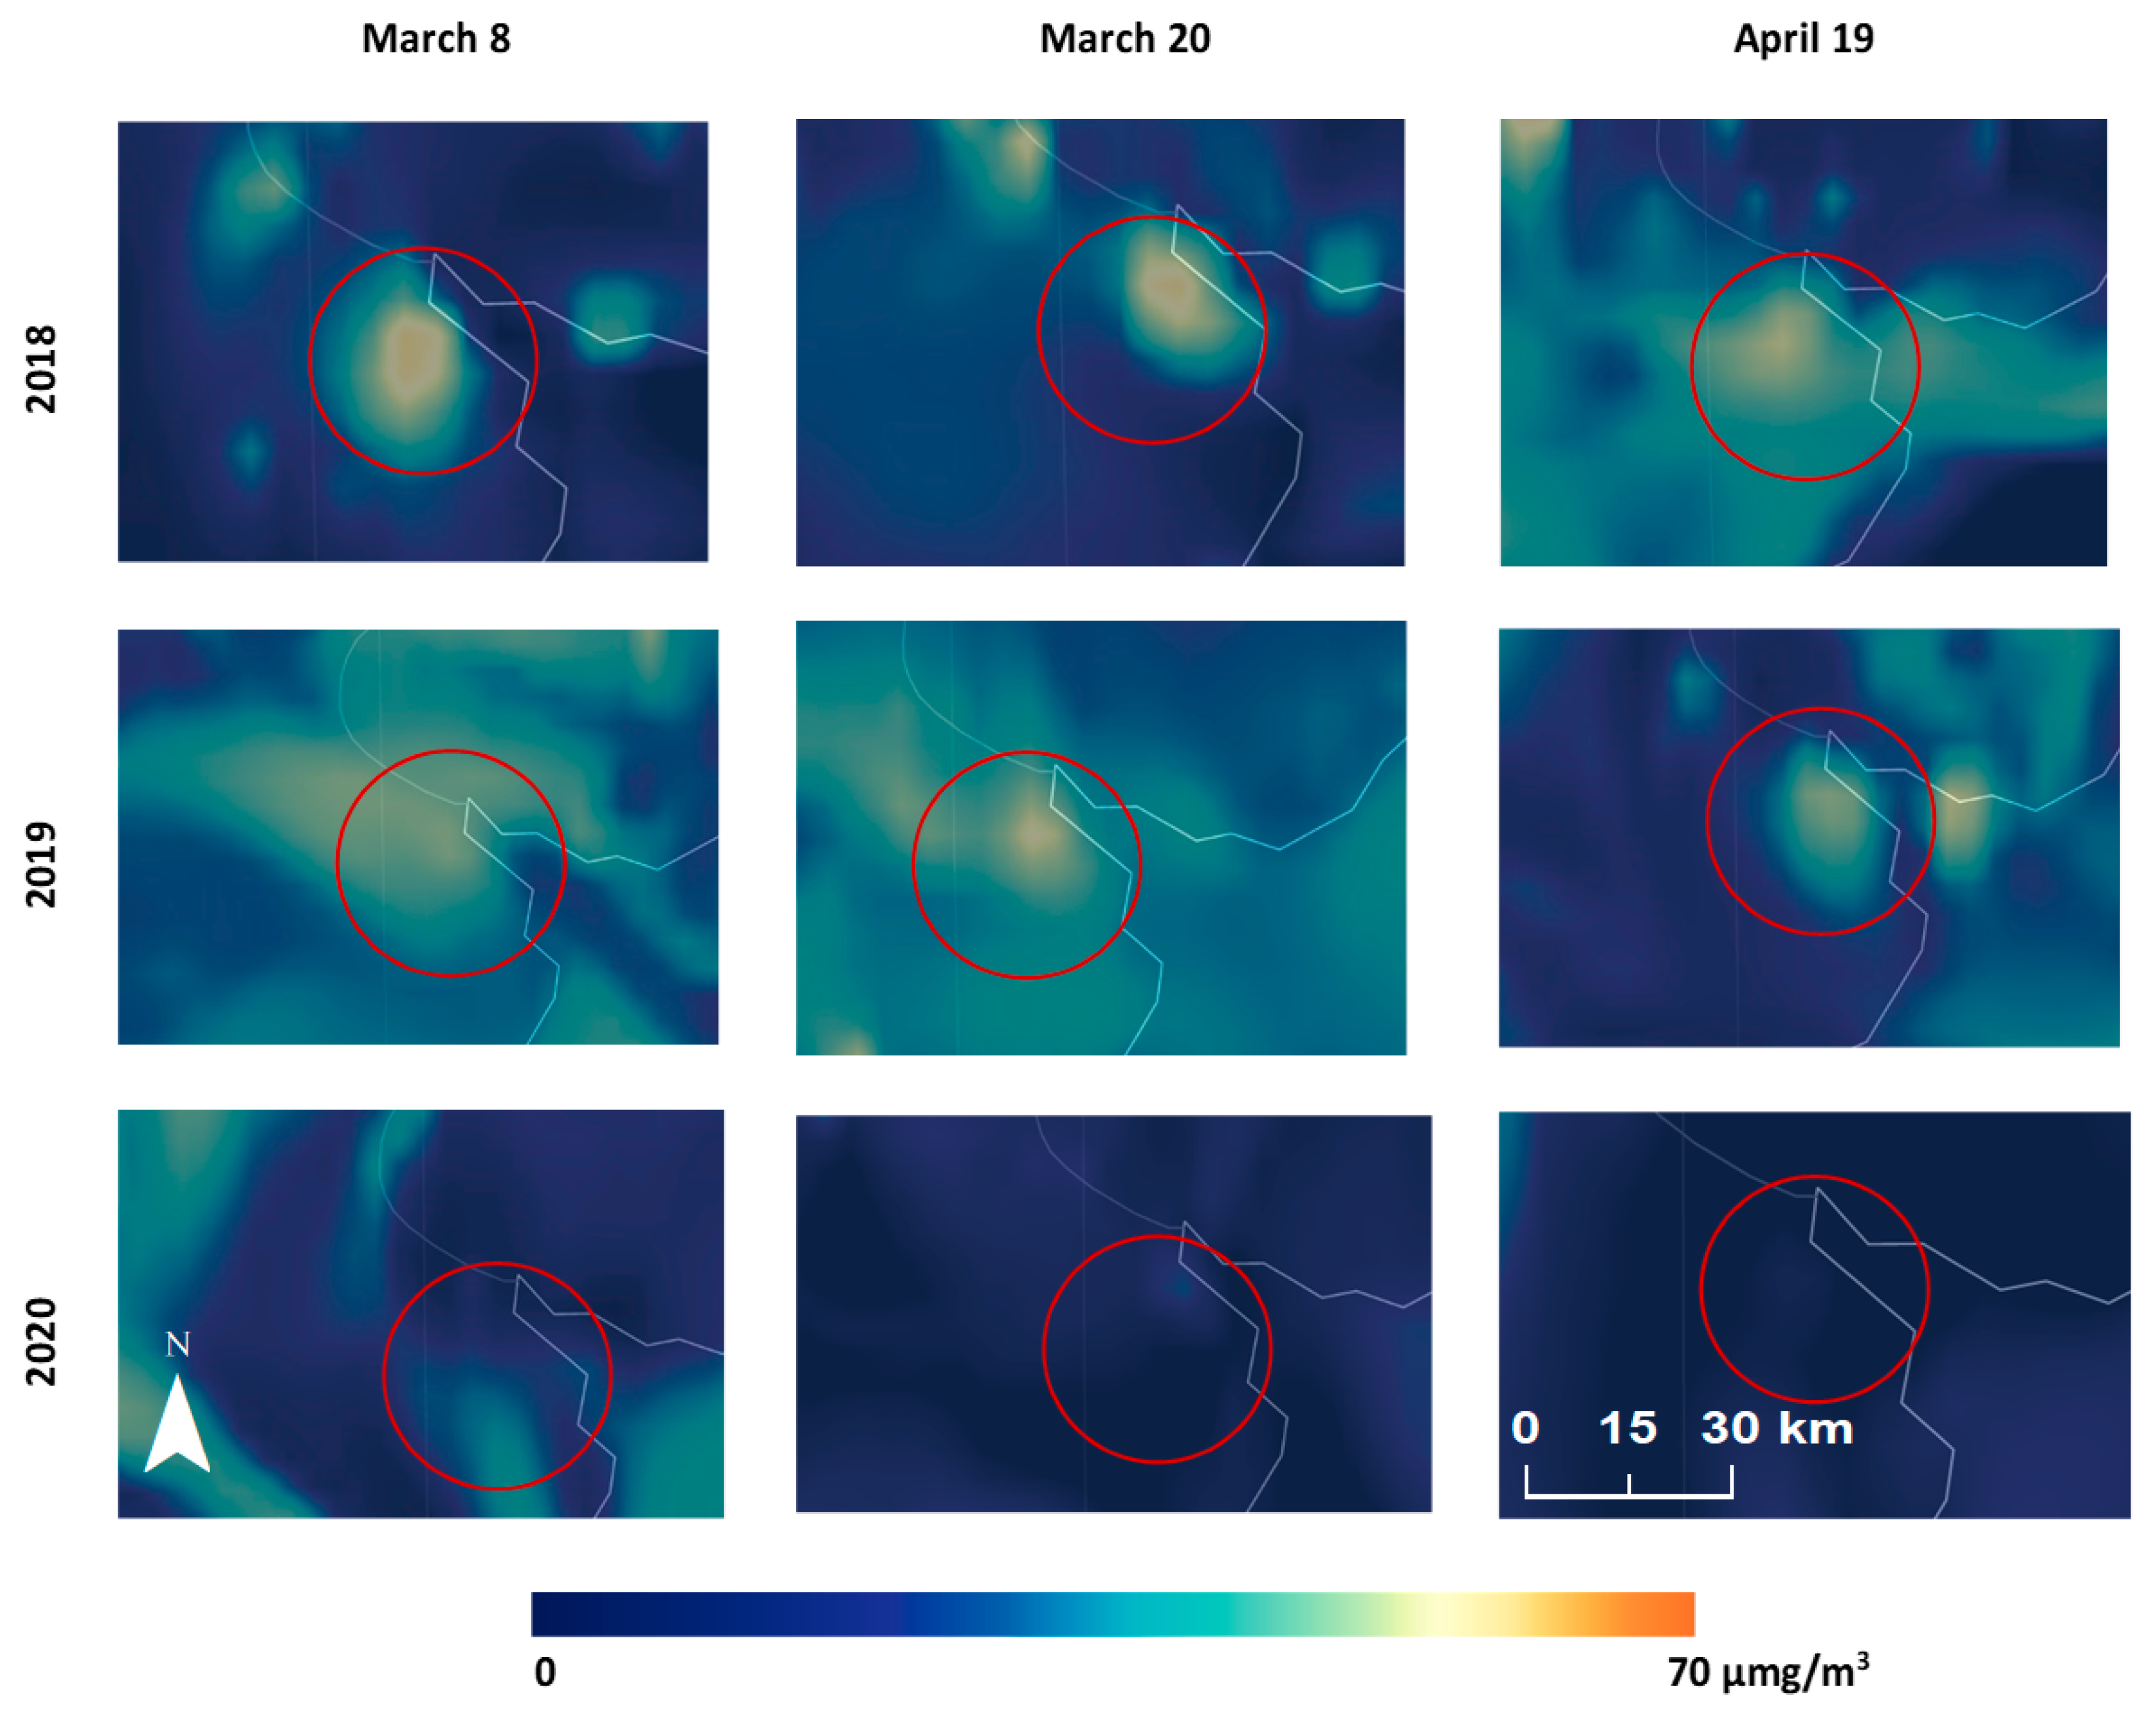
The European Space Agency (ESA) Sentinel-5 Precursor (S5p) is a low Earth orbit polar satellite which provides information and services on air quality, climate, and the ozone layer. The payload of the mission is the TROPOspheric Monitoring Instrument (TROPOMI) that measures key atmospheric constituents including ozone, NO2, SO2, CO, CH4, CH2O and aerosol properties [30]. The level 2 product of NO2 tropospheric column gives the total atmospheric NO2 column between the surface and the tropopause with a spatial resolution of 3.5 km × 7 km. The quality of the product observations depends mainly on cloud cover, surface albedo, and presence of snow, among other factors. A quality assurance variable (qa_value) ranges from 0 to 1. The recommended qa_value = 0.75 removes cloud-cover scenes, partially snow/ice-covered scenes, errors, and problematic retrievals [32]. The data provided by the satellite is given with an orthogonal scanline to the flight direction of circa 2600 km. Each observational data has a temporal dimension referenced to the orbit start time and spatial dimension in scanline and flight direction, which are georeferenced with latitude and longitude coordinates. Then, in order to represent the satellite data for the periods and study area in CABA, the TROPOMI NO2 level 2 product data (molecules/cm2) were remapped in a cylindrical projection with a resolution of 0.05° × 0.05°. Each observation remapped on the same output pixel is averaged, obtaining a single georeferenced output for the whole dataset. The air quality network of CABA does not measure PM2.5. Therefore, PM2.5 levels have been retrieved from satellite images obtained on 8 March, 20 March and 19 April (2018, 2019 and 2020), using Copernicus’ Earth online viewer [33], as shown in Figure A1, Appendix A.

3. Results and Discussions

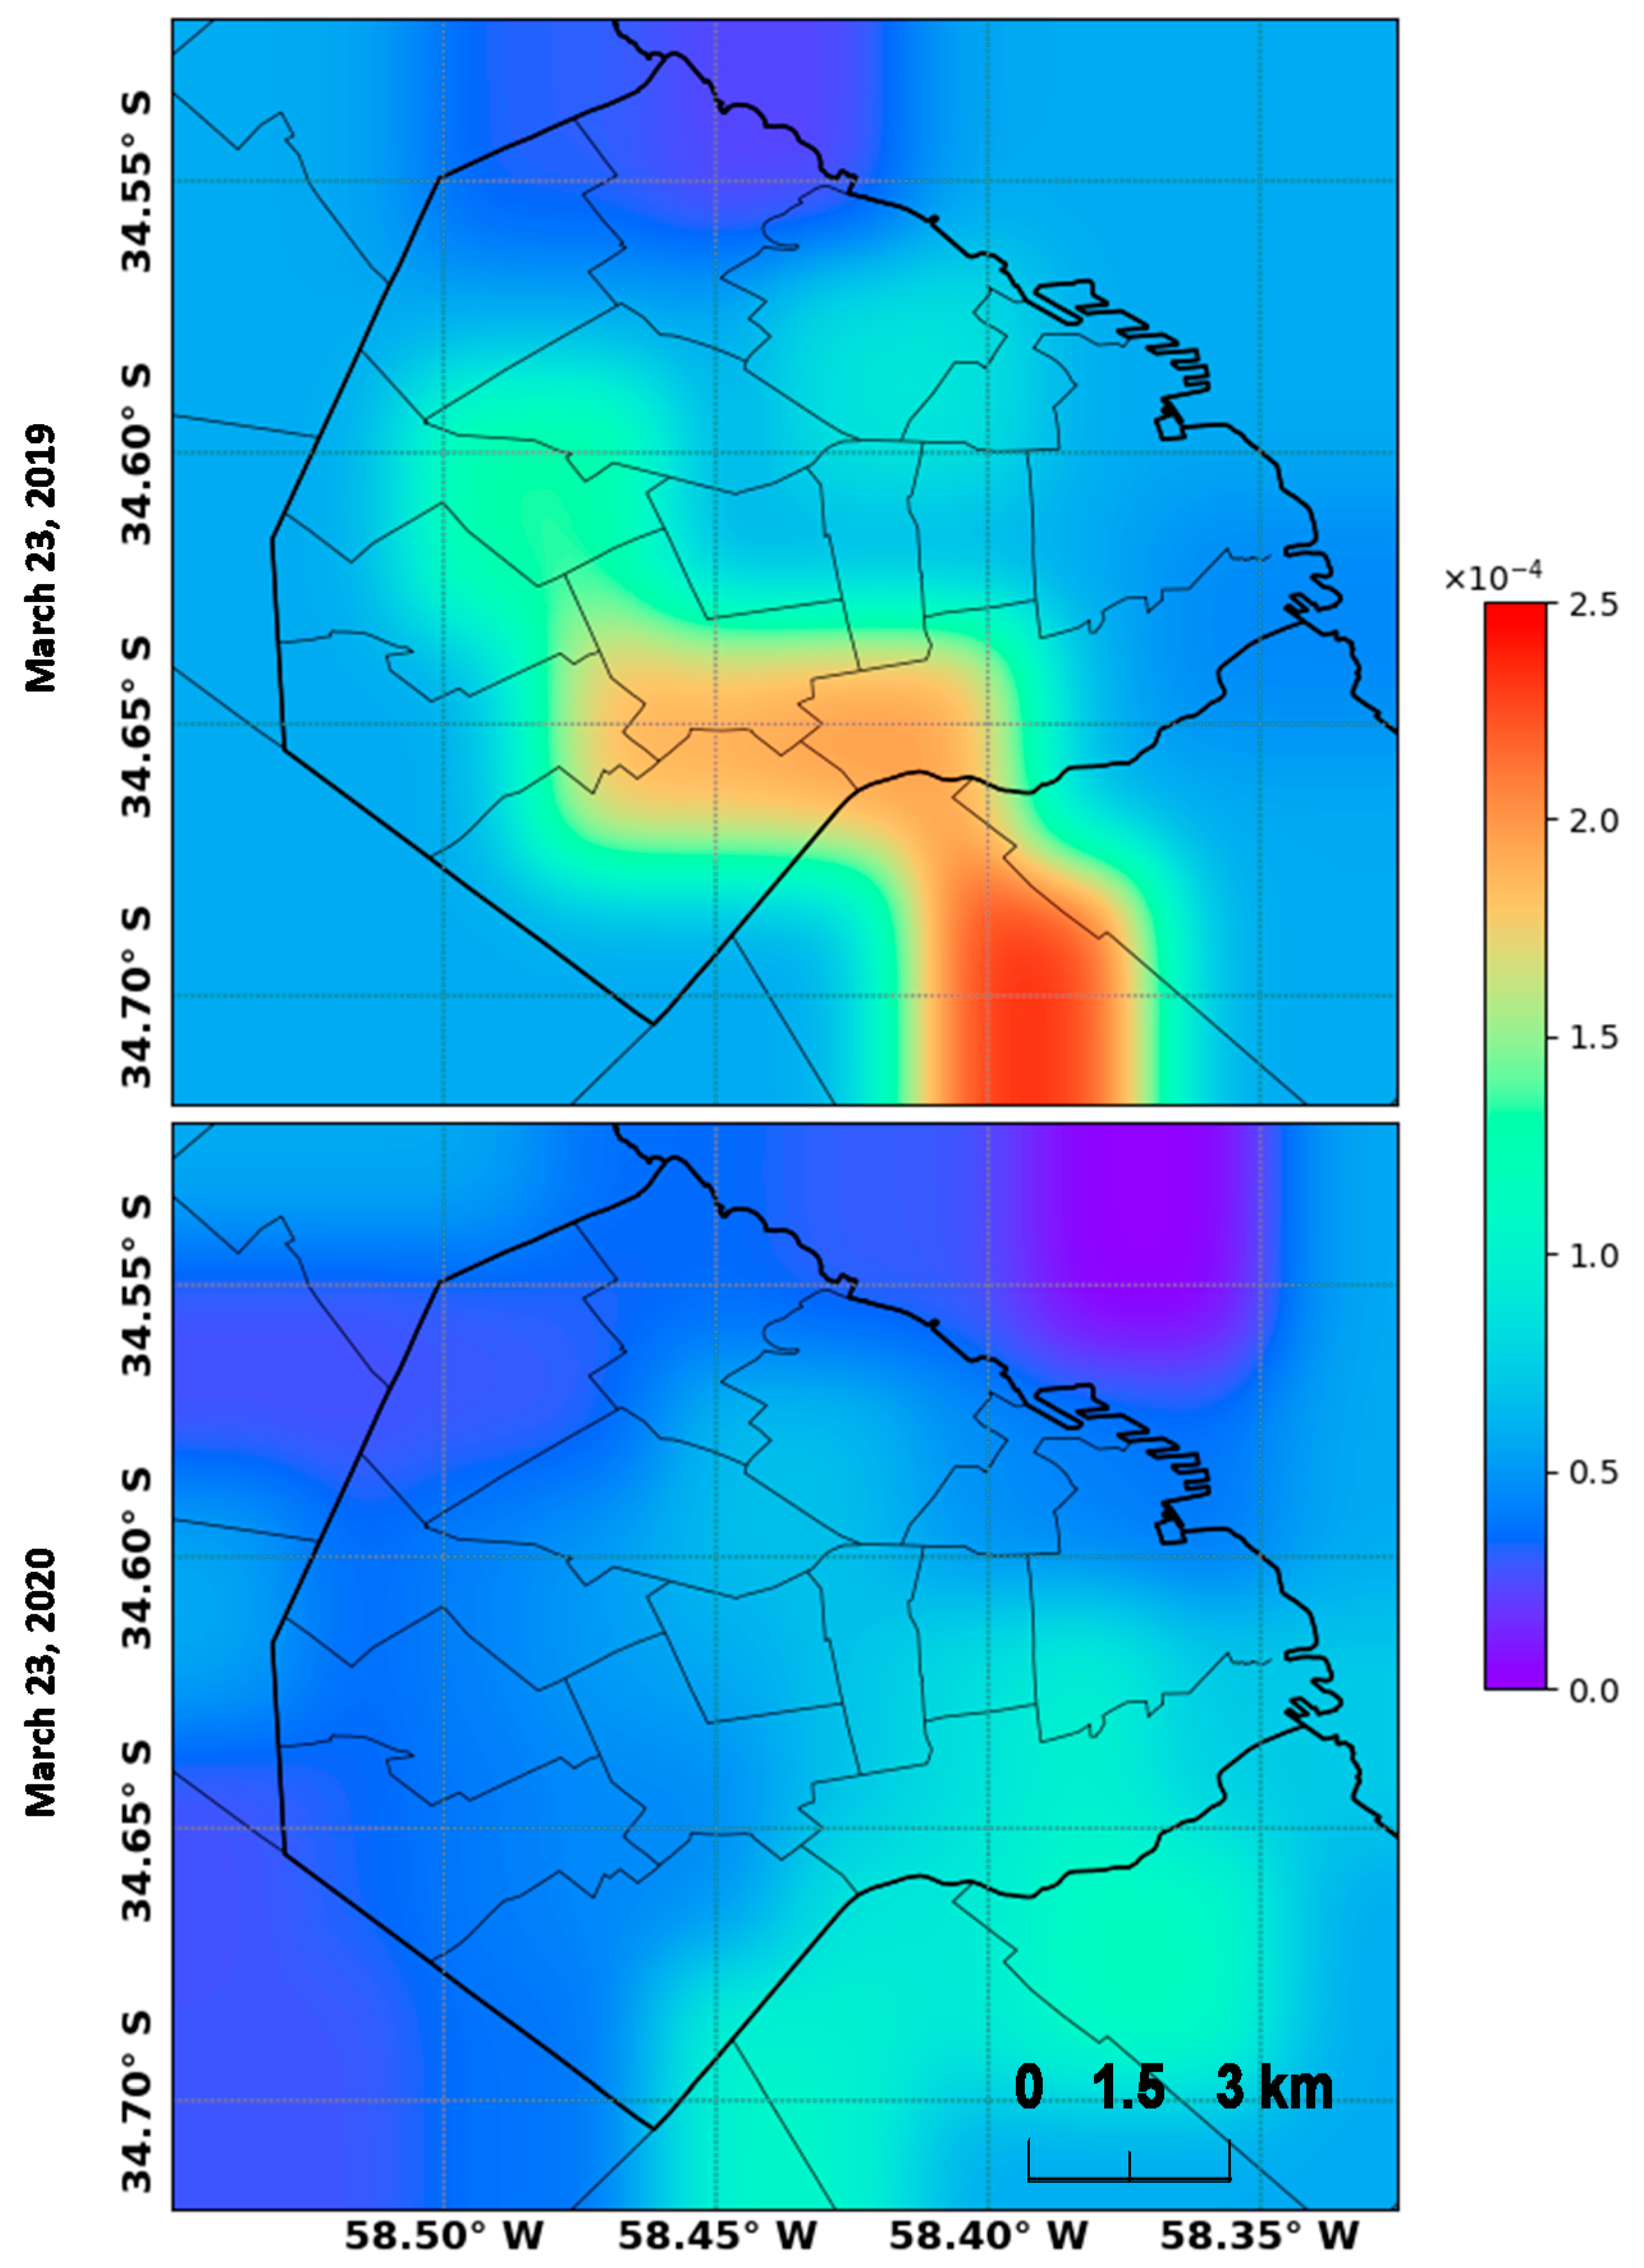
CABA is the head political, financial, tourist, and cultural metropolis of Argentina. It is also the most densely populated Argentine city, with 14,450.8 pop/km2 [34]. Figure 2 shows the daily and accumulated evolution of transmission cases and deaths by COVID-19 in this city, which deserves special attention due to its relevance, as well as its high population density. Previous studies indicated the importance of the analysis of meteorological conditions in the spread of COVID-19 in highly densely populated areas [15,35]. On 5 March, the first national case of COVID-19 was confirmed in CABA [21]. In a few days, as cases rapidly multiplied, the Argentine national government established a lockdown on 20 March to minimize and control the spread of this pandemic disease [22]. Nevertheless, infections and deaths continued to grow rapidly (Figure 2). Because of the lockdown, observations indicated that NO2 concentration levels over the city decreased [30,31] (Figure 3), as well as PM2.5 levels, as is shown in Appendix A, Figure A1. This circumstance is analyzed in the following subsections.

3.1. Correlation SARS-CoV-2 Infections with Meteorological and Air Quality Variables

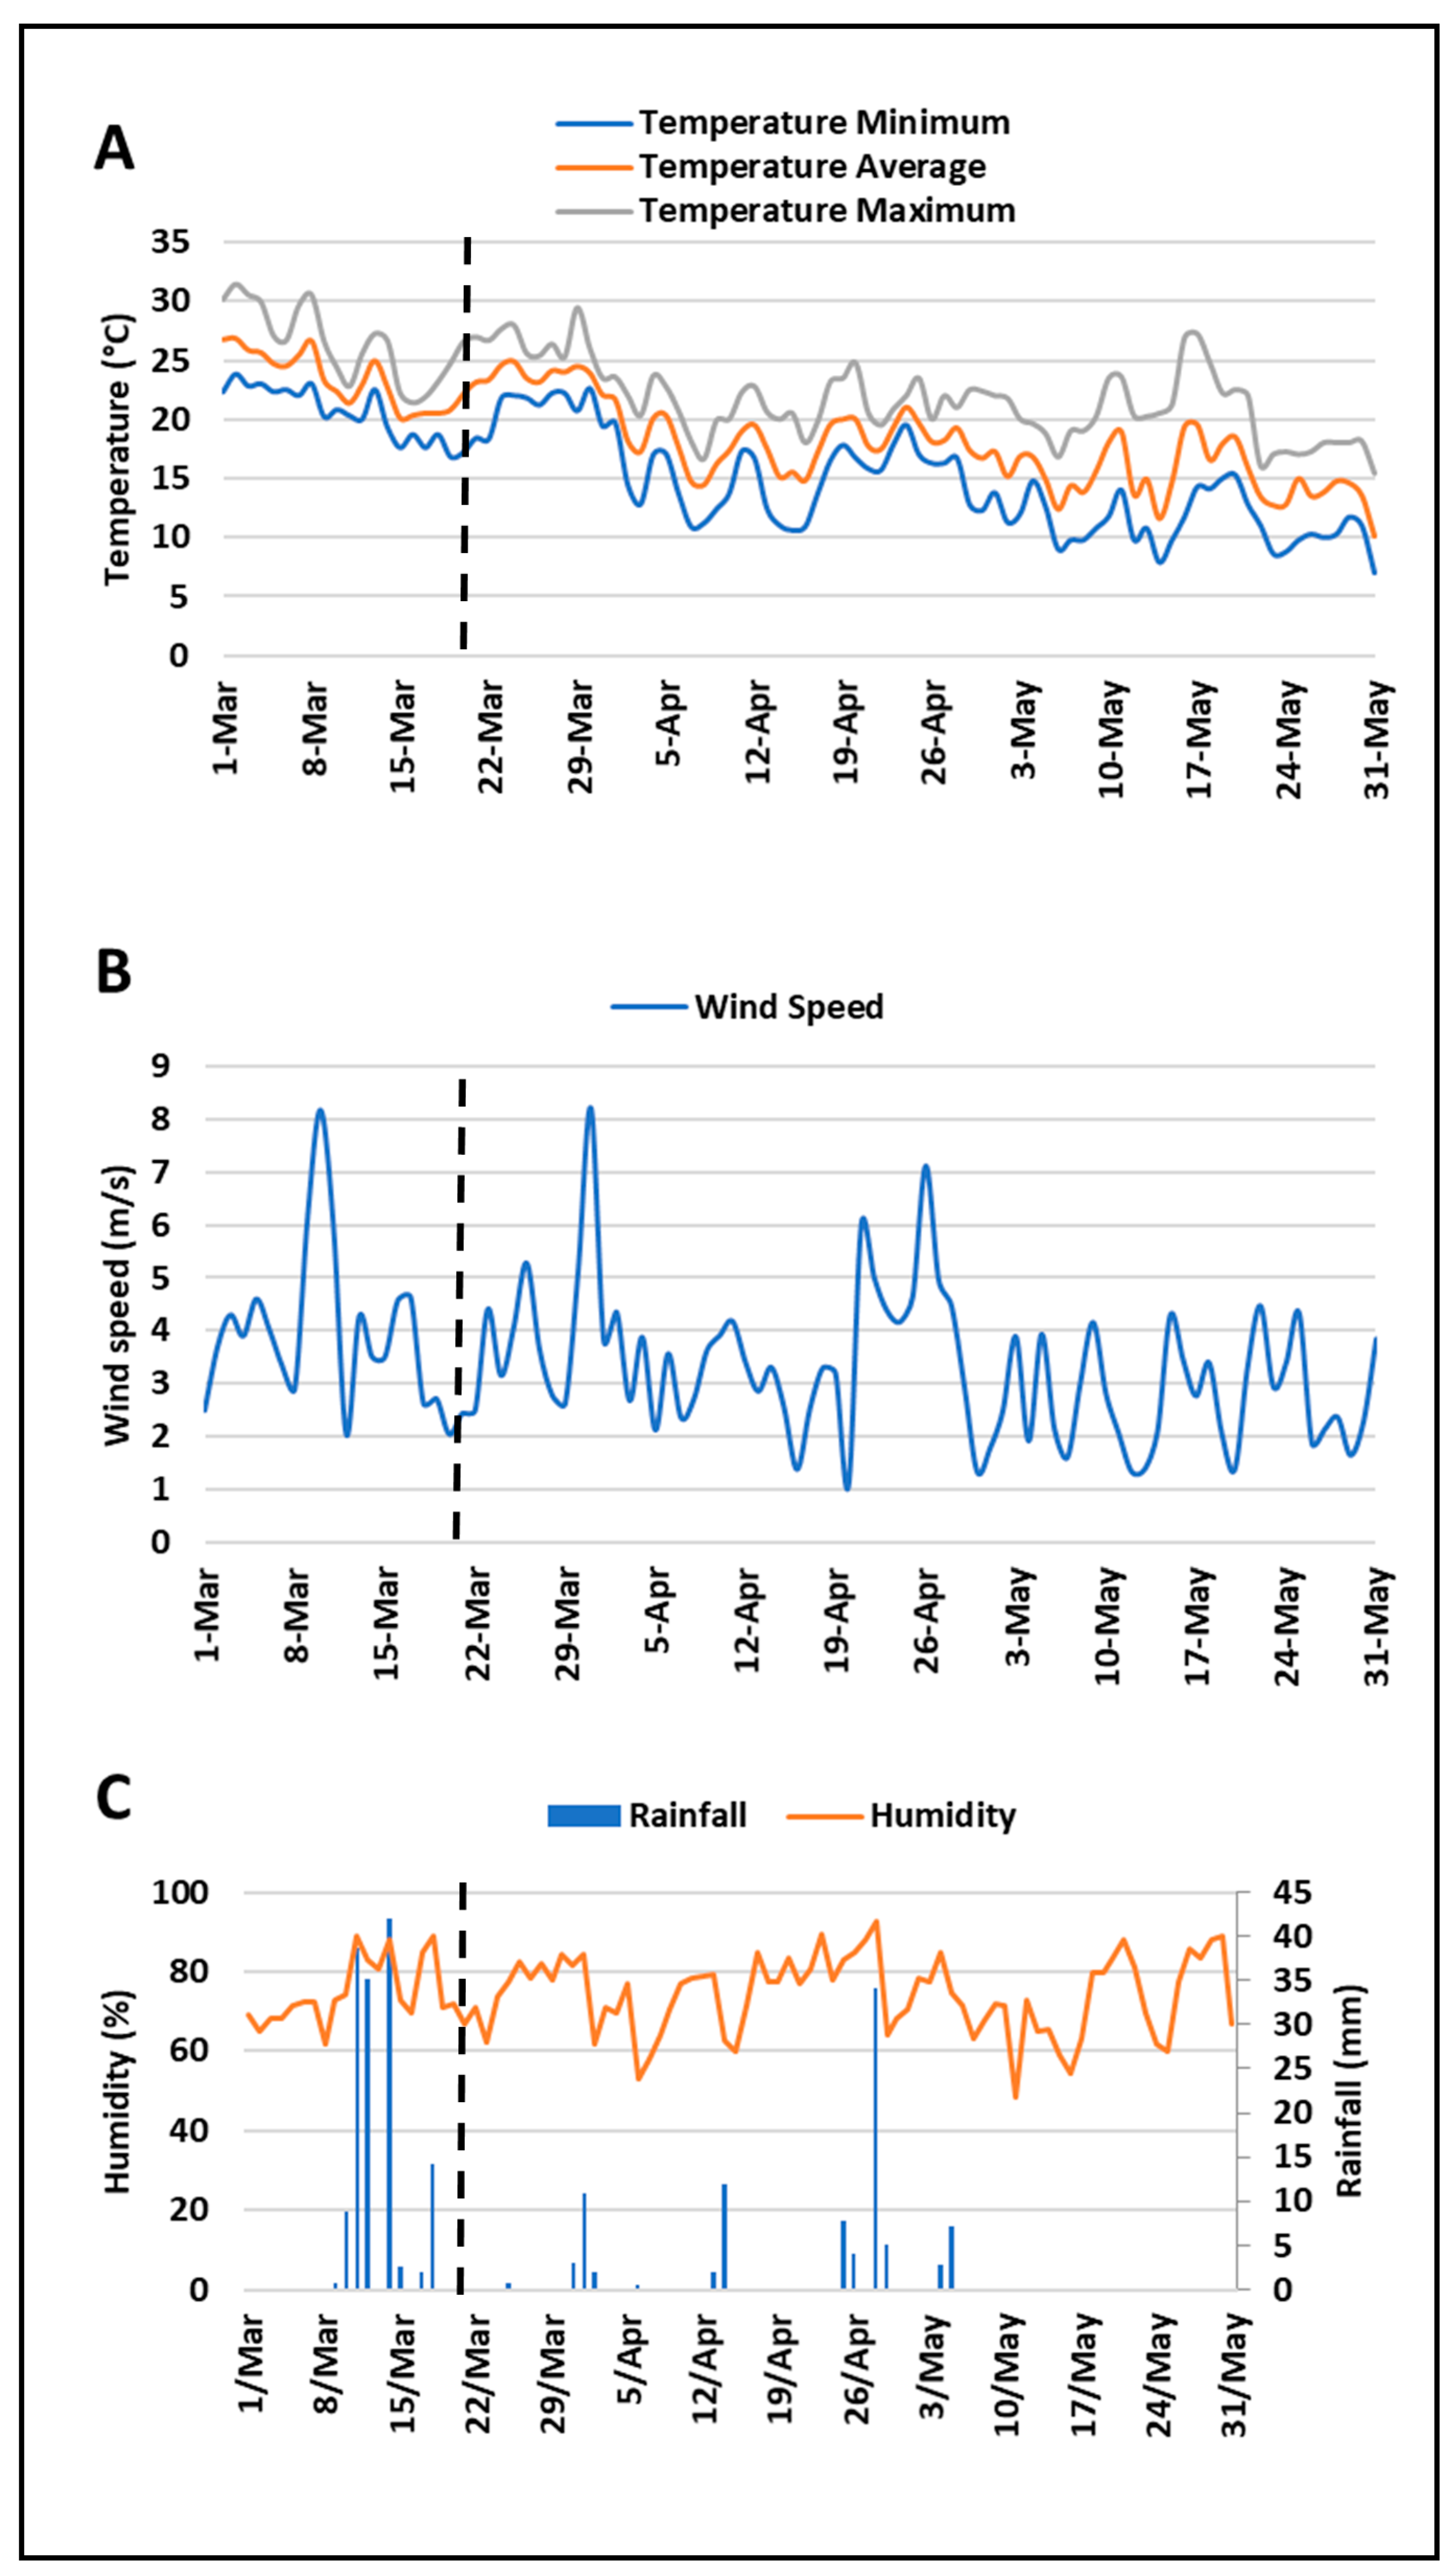
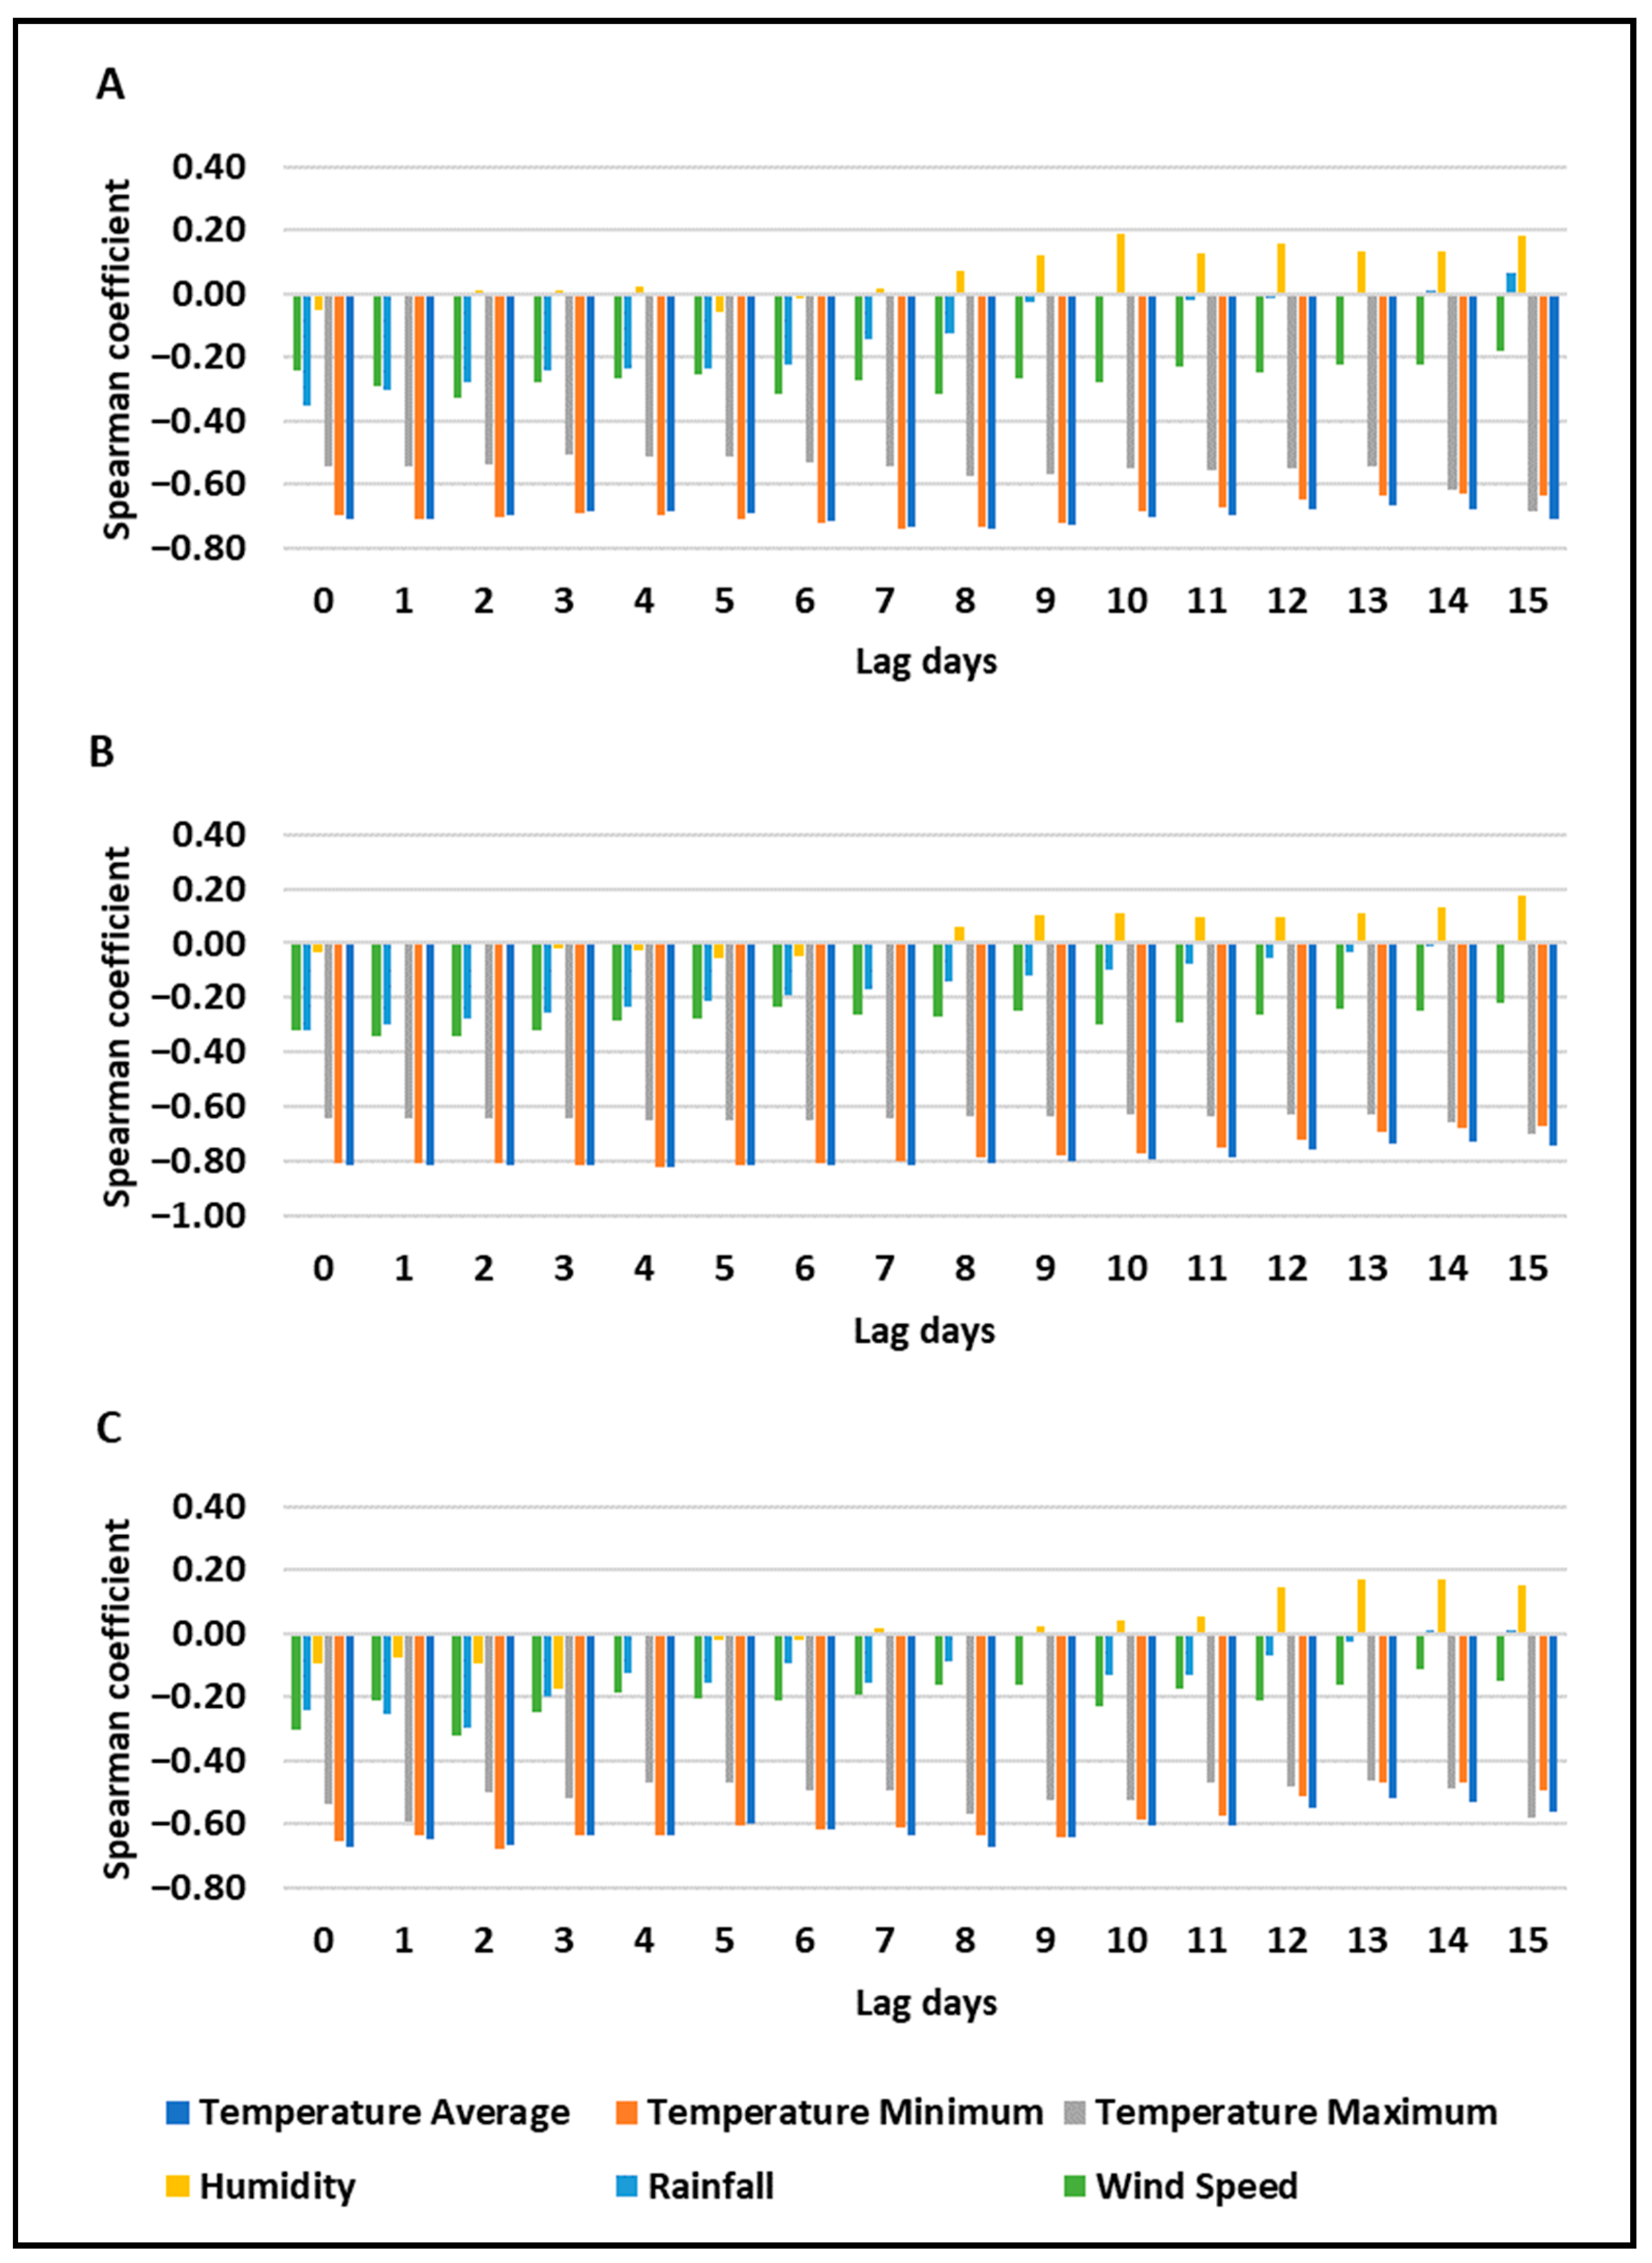
Figure 4A shows a decrease in maximum, minimum, and average temperature since the months analyzed correspond to the austral fall season. The rainfall had variations between 10 and 40 mm/day, while relative humidity presented an average of 74.5% (Figure 4C). The average daily wind speed (Figure 4B) presented peaks above 8 m/s in March, decreasing in April to 7 m/s and 4.4 m/s in May, 2020. This situation is due to the weakening of the winds in fall and winter [36,37,38]. Figure 5 presents the statistical correlation coefficient for meteorological variables with new cases, total cases and mortality. New cases (Figure 5A) had a higher negative correlation at 8 days lag (r = −0.74, p < 0.01), 7 days lag (r = −0.74, p < 0.01) and 15 days lag (r = −0.68, p < 0.01) for average temperature, minimum temperature and maximum temperature, respectively. Humidity and rainfall with, new cases showed a higher positive correlation at 10 days lag (r = 0.19, p < 0.05) and 0 day (r = −0.35, p < 0.01), respectively. Wind speed had a higher negative correlation at 2 days lag (r = −0.33, p < 0.01). Total cases (Figure 5B) showed a higher negative correlation at 4 days lag (r = −0.82 and r = −0.72, p < 0.01) for average and minimum temperature, respectively, while this occurred with 15 days lag (r = −0.70, p < 0.01) for maximum temperature.
Humidity showed a higher positive correlation with total cases at 15 days lag (r = 0.18, p < 0.05), and rainfall showed significant correlations at day 0 (r = −0.32, p < 0.01). Also, wind speed had a higher negative correlation at 2 days lag (r = −0.27, p < 0.01) in total cases. Mortality (Figure 5C) presented higher negative correlation at 7 days lag (r = −0.65, p < 0.01) for average temperature, at 2 days lag (r = −0.68, p < 0.01) for minimum temperature and 1 day lag for maximum temperature (r = −0.59, p < 0.01). Humidity and mortality cases did not show a significant correlation, but rainfall showed a high negative correlation at 2 days lag (r = −0.33, p < 0.01). Also, wind speed displayed a high negative correlation at 2 days lag (r = −0.32, p < 0.01). Few studies have investigated the relationship of SARS-CoV-2 virus infections with meteorological variables using days lag to consider their incubation time. A recent study investigated the effects of temperature and humidity on new daily cases and new COVID-19 deaths in 166 countries, using day lag up to 3 days, and showed negative correlations with temperature and humidity [39]. These results are consistent with what has been found in this study for temperatures but not for humidity, where positive correlations were found. Another study conducted in Hong Kong showed humidity and rainfall had a positive correlation with virus diseases [40].
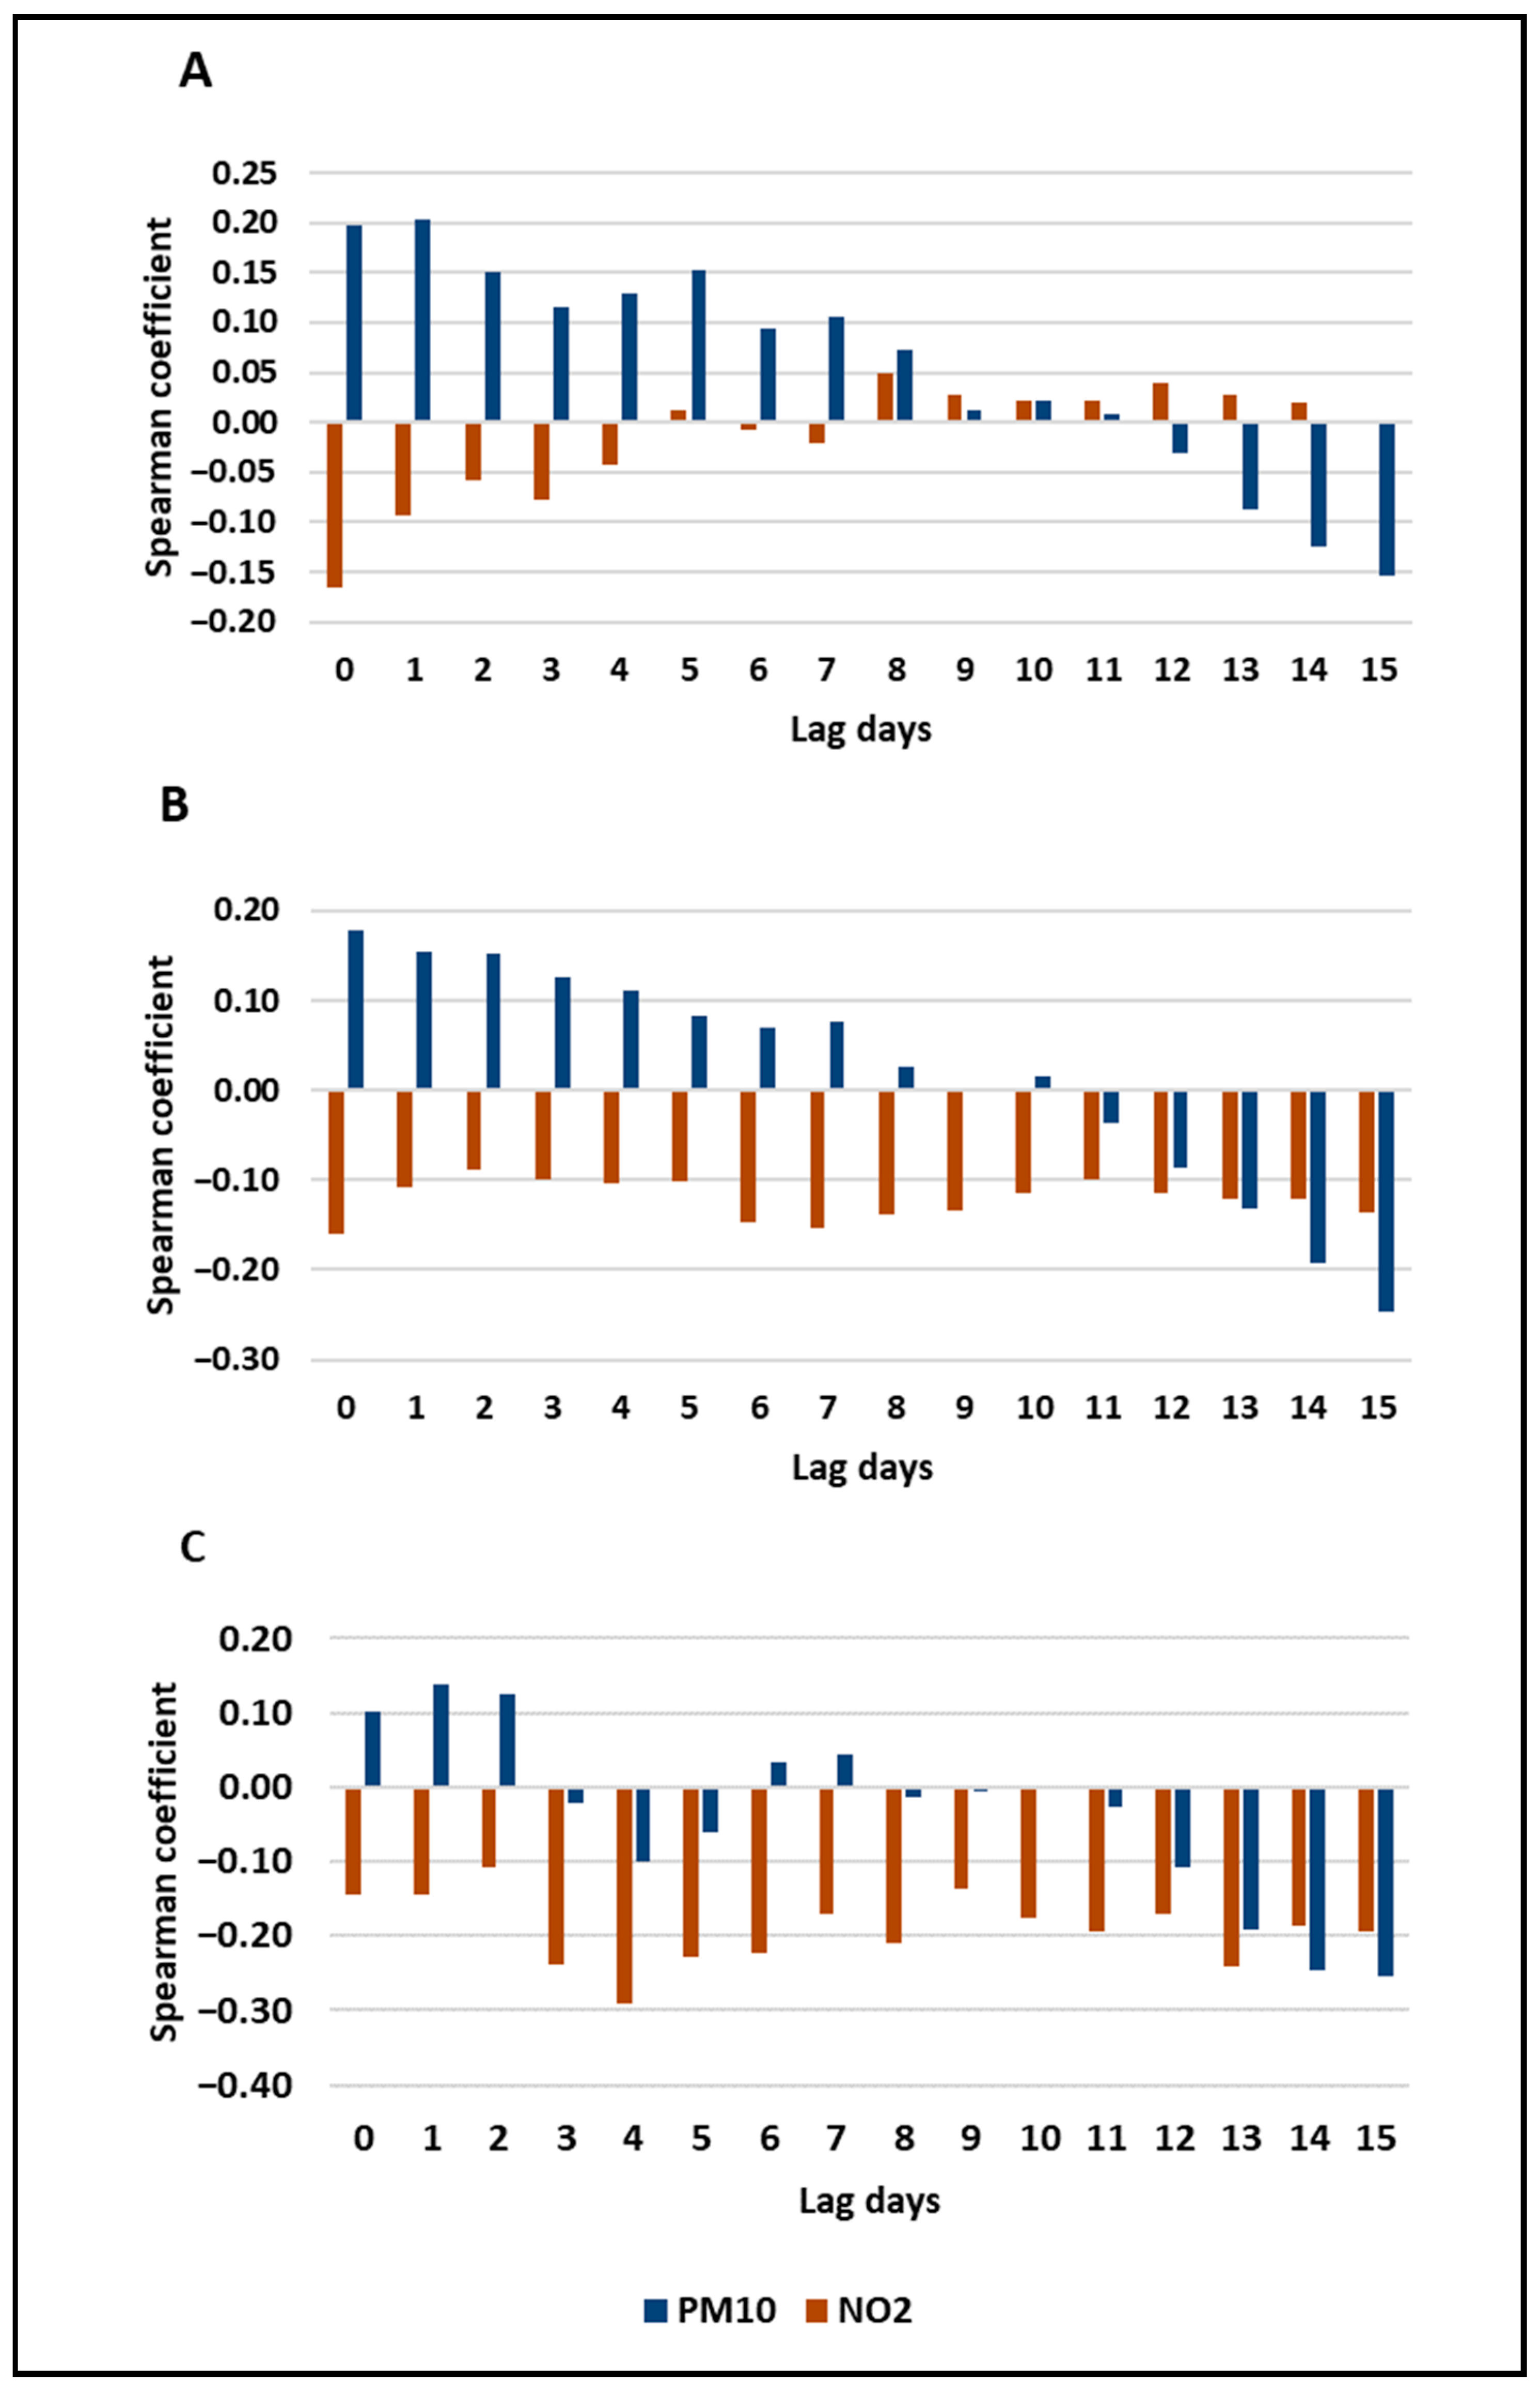
Air quality as PM10 and NO2 variables (shown in Figure 6) demonstrated a significant correlation with new cases, total cases, and mortality. Correlation with PM10 was noted the highest correlation in new cases (1 day lag, r = 0.20, p < 0.1), total cases (15 days lag, r = −0.25, p < 0.05), and mortality (15 days lag, r = −0.25, p < 0.05). However, PM10 correlation with total cases also showed a positive relationship (0 day, r = 0.18, p < 0.1). NO2 did not show significant correlation with new and total cases (p < 0.1), but it showed a negative correlation with mortality (4 days lag, r = −0.29, p < 0.01). Recent studies conducted in New York City showed that average air quality is significant for new cases, total cases, and mortality by COVID-19 [16]. Additionally, Table 1 displays a comparison of our data with previous studies that demonstrate a relationship between COVID-19 infection and deaths with air pollutants. These results agree with the findings presented here. Overall, these findings are consistent with other research showing that wind speed, humidity, temperature and air quality have a significant correlation with the transmission of infectious diseases and their associated deaths [16,41,42]. In that direction, results showed significant correlations (p < 0.01) using 7 to 15 days lag for meteorological conditions, 12 to 15 days lag for PM10 and 1 to 5 days lag for NO2.

3.2. Impacts on the Air Quality

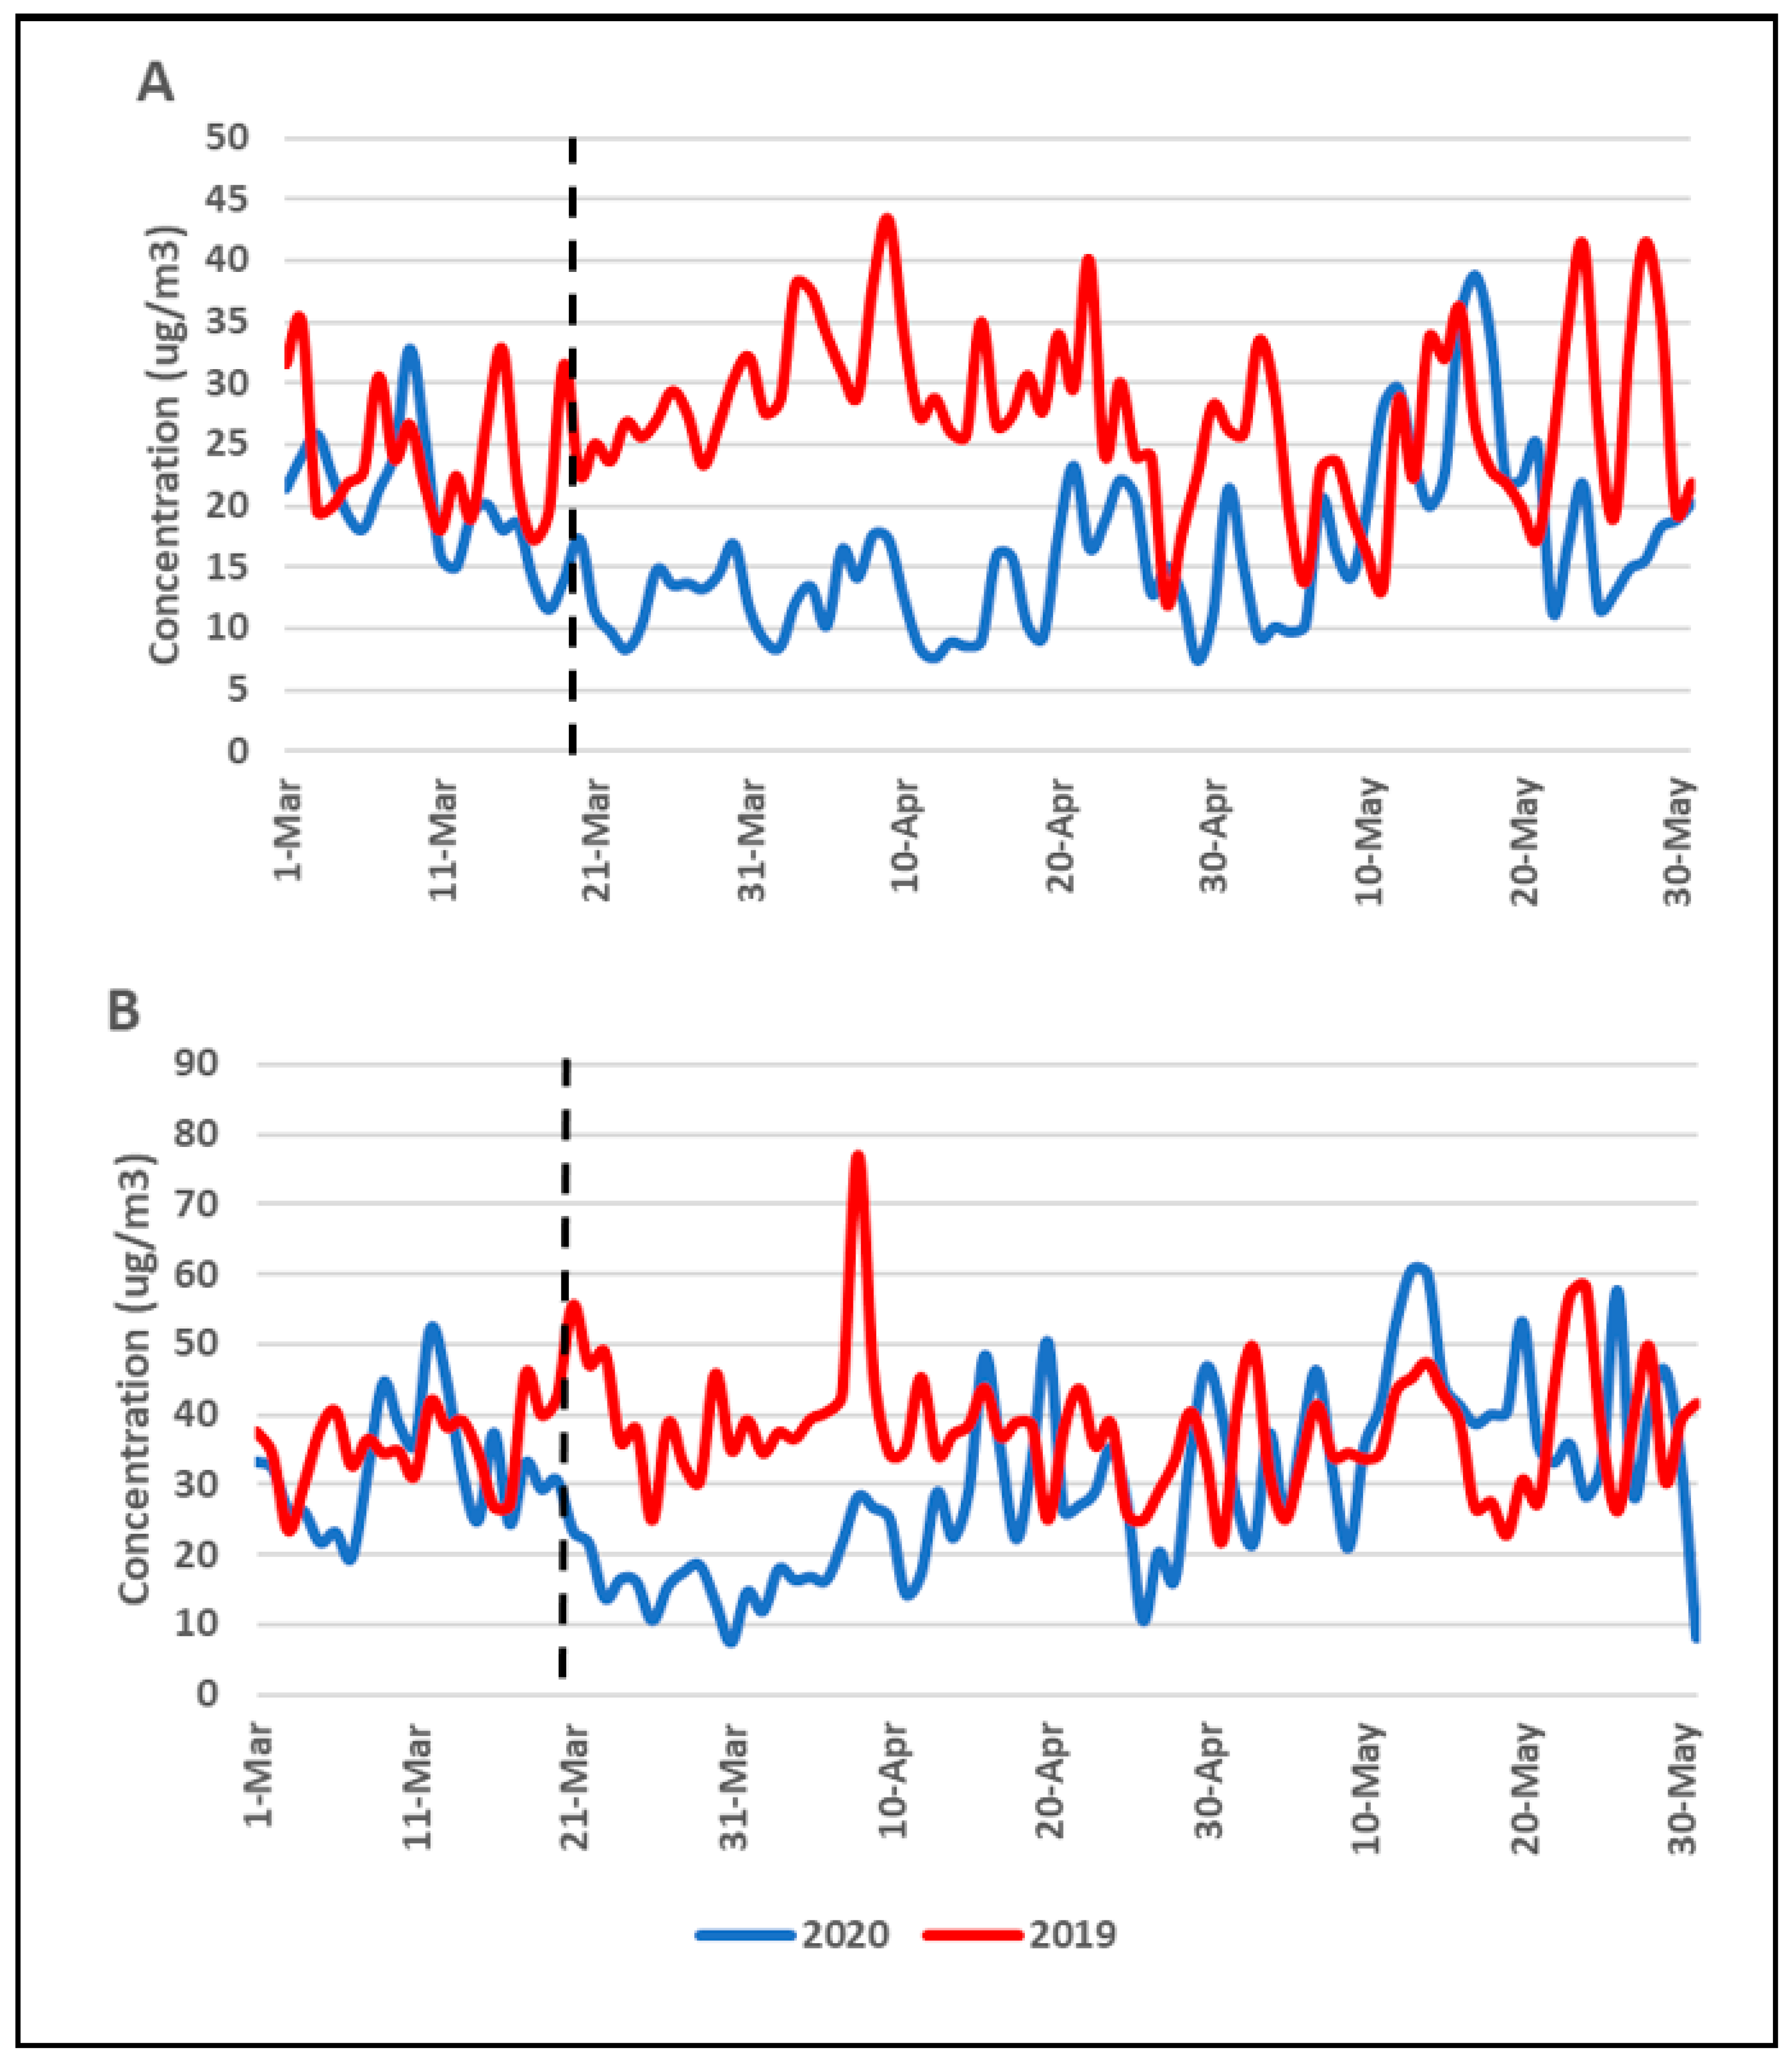
Figure 7 shows the variations for PM10 and NO2 average concentrations measured by the air quality stations in CABA. During the analyzed period of 2019, average concentration of PM10 was 26.80 μg/m3 with a maximum of 43.29 μg/m3 and a minimum of 12.04 μg/m3. While on the same period of 2020, PM10 average concentration was 16.79 μg/m3 with a maximum of 38.81 μg/m3 and a minimum of 7.33 μg/m3. NO2 showed an average of 37.46 μg/m3, maximum of 77.01 μg/m3, and a minimum of 21.87 μg/m3 in 2019, and these average concentrations in 2020 decreased to 30.03 μg/m3, a maximum 60.64 μg/m3 and a minimum of 7.48 μg/m3. Also, as shown in Figure 7, the greatest reduction in the concentration of PM10 and NO2 in 2020 occurred from the start of the lockdown (March 20) to April 20. Then, concentrations showed behavior similar to 2019, possibly related to the easing of the lockdown, made to minimize the negative impact on the economy [22]. Arkouli et al. [36] showed that CABA in the cold season presents the lowest values of the ventilation coefficient. Therefore, it indicated higher probabilities of poor air quality, and that was confirmed by the higher concentrations of PM10 and PM2.5 measured by them. Other studies showed that 45.5% of NOx emissions in this city were from mobile sources, such as cars, taxis, buses and trucks [38].
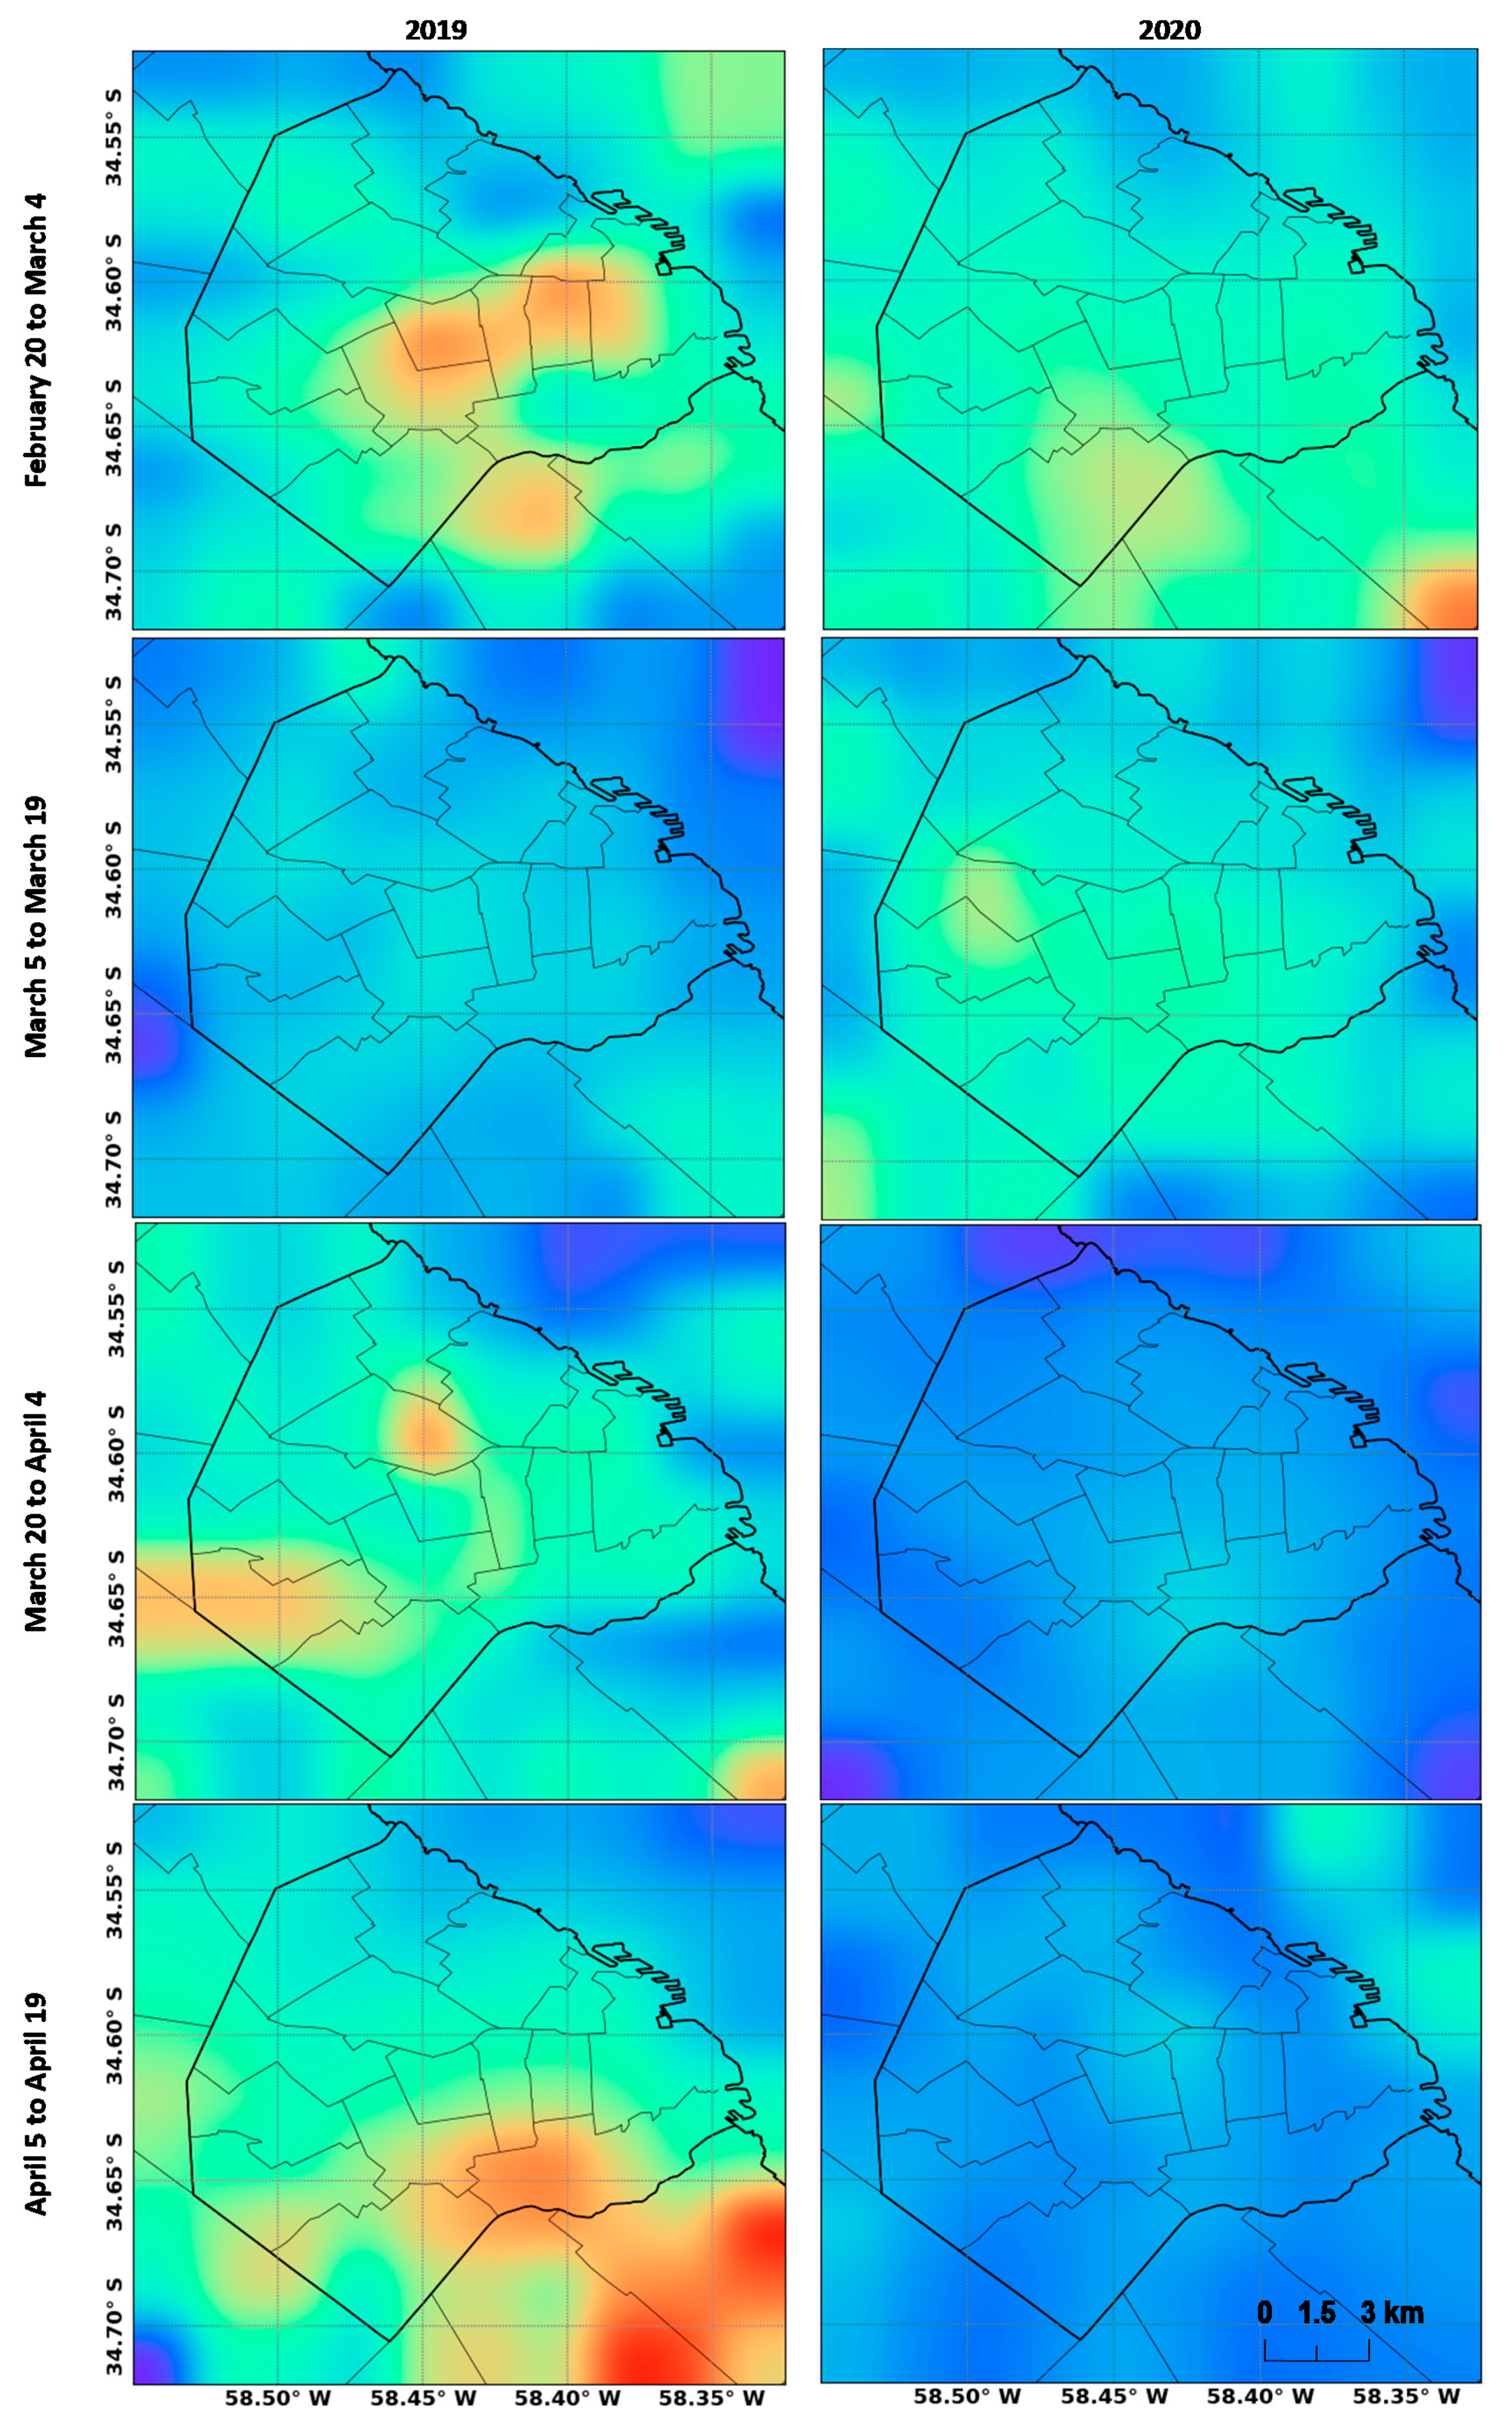
During the COVID-19 pandemic lockdown, several studies around the world have studied its impact on air quality. Ghahremanloo et al. [51] reported NO2 reductions of up to 83% in East Asia, while in Southeast Asia, region reductions were observed in PM10 (26–31%), PM2.5 (23–32%), NO2 (63–64%), SO2 (9–20%), and CO (25–31%), in urban areas from Malaysia [52]. In India, AOD reductions of up to 50% were perceived in New Delhi [5]. Otmani et al. [53] found reductions of 75%, 49% and 96% for PM10, SO2 and NO2 in Salé City (Morocco). Also, emissions of NO2 have been reduced up to 40% in Iraq compared to the pre-lockdown [54]. The United Kingdom showed average reductions of NO, NO2 and NOx between 32% and 50% at roadsides on lockdown [55]. Changes in the United States’ air pollution showed declining NO2 of 25.5% compared to historical years [56]. Additionally, Muhammad et al. [10] using satellite data showed NO2 reductions of 20–30% in Italy, France, and Spain. Thus, in line with our findings, this pollutant reduction is related to the lockdown aimed to stop the spread of the SARS-CoV-2 virus. Especially, after 20 March (start of lockdown), a decrease was observed in the average daily concentrations measured by the air quality network of CABA, as shown with a red line in Figure 7. Tropospheric NO2 measured by the S5p/TROPOMI-ESA (Figure 8) over CABA allowed us to compare the variability and distribution of NO2 after and during the pandemic time, compared with the same period of 2019. The images show a notable reduction in the level of tropospheric NO2 from 20 March to 19 April 2020 compared to the same period in 2019.

3.3. The Two Facets Observed on COVID-19 Pandemic Lockdown

Pandemic lockdown is a critical time due to infected people with SARS-CoV-2, increasing cases of death, and economic damage [7]. However, it has generated a window to analyze the correlation between rapidly spreading viral diseases like COVID-19 with weather and air quality indicators. Our findings show correlations between meteorological and air quality variables several days before positive identification or death (shown in Figure 5 and Figure 6). Thus, this study allows us to expand knowledge about the meteorological and air quality variables analyzed that could be used for decision-makers to consider designing measures to reduce the risk of COVID-19 and death, and also to better understand how the analyzed variables can vary in the different climate change scenarios and therefore in the spread of viral diseases [57,58].
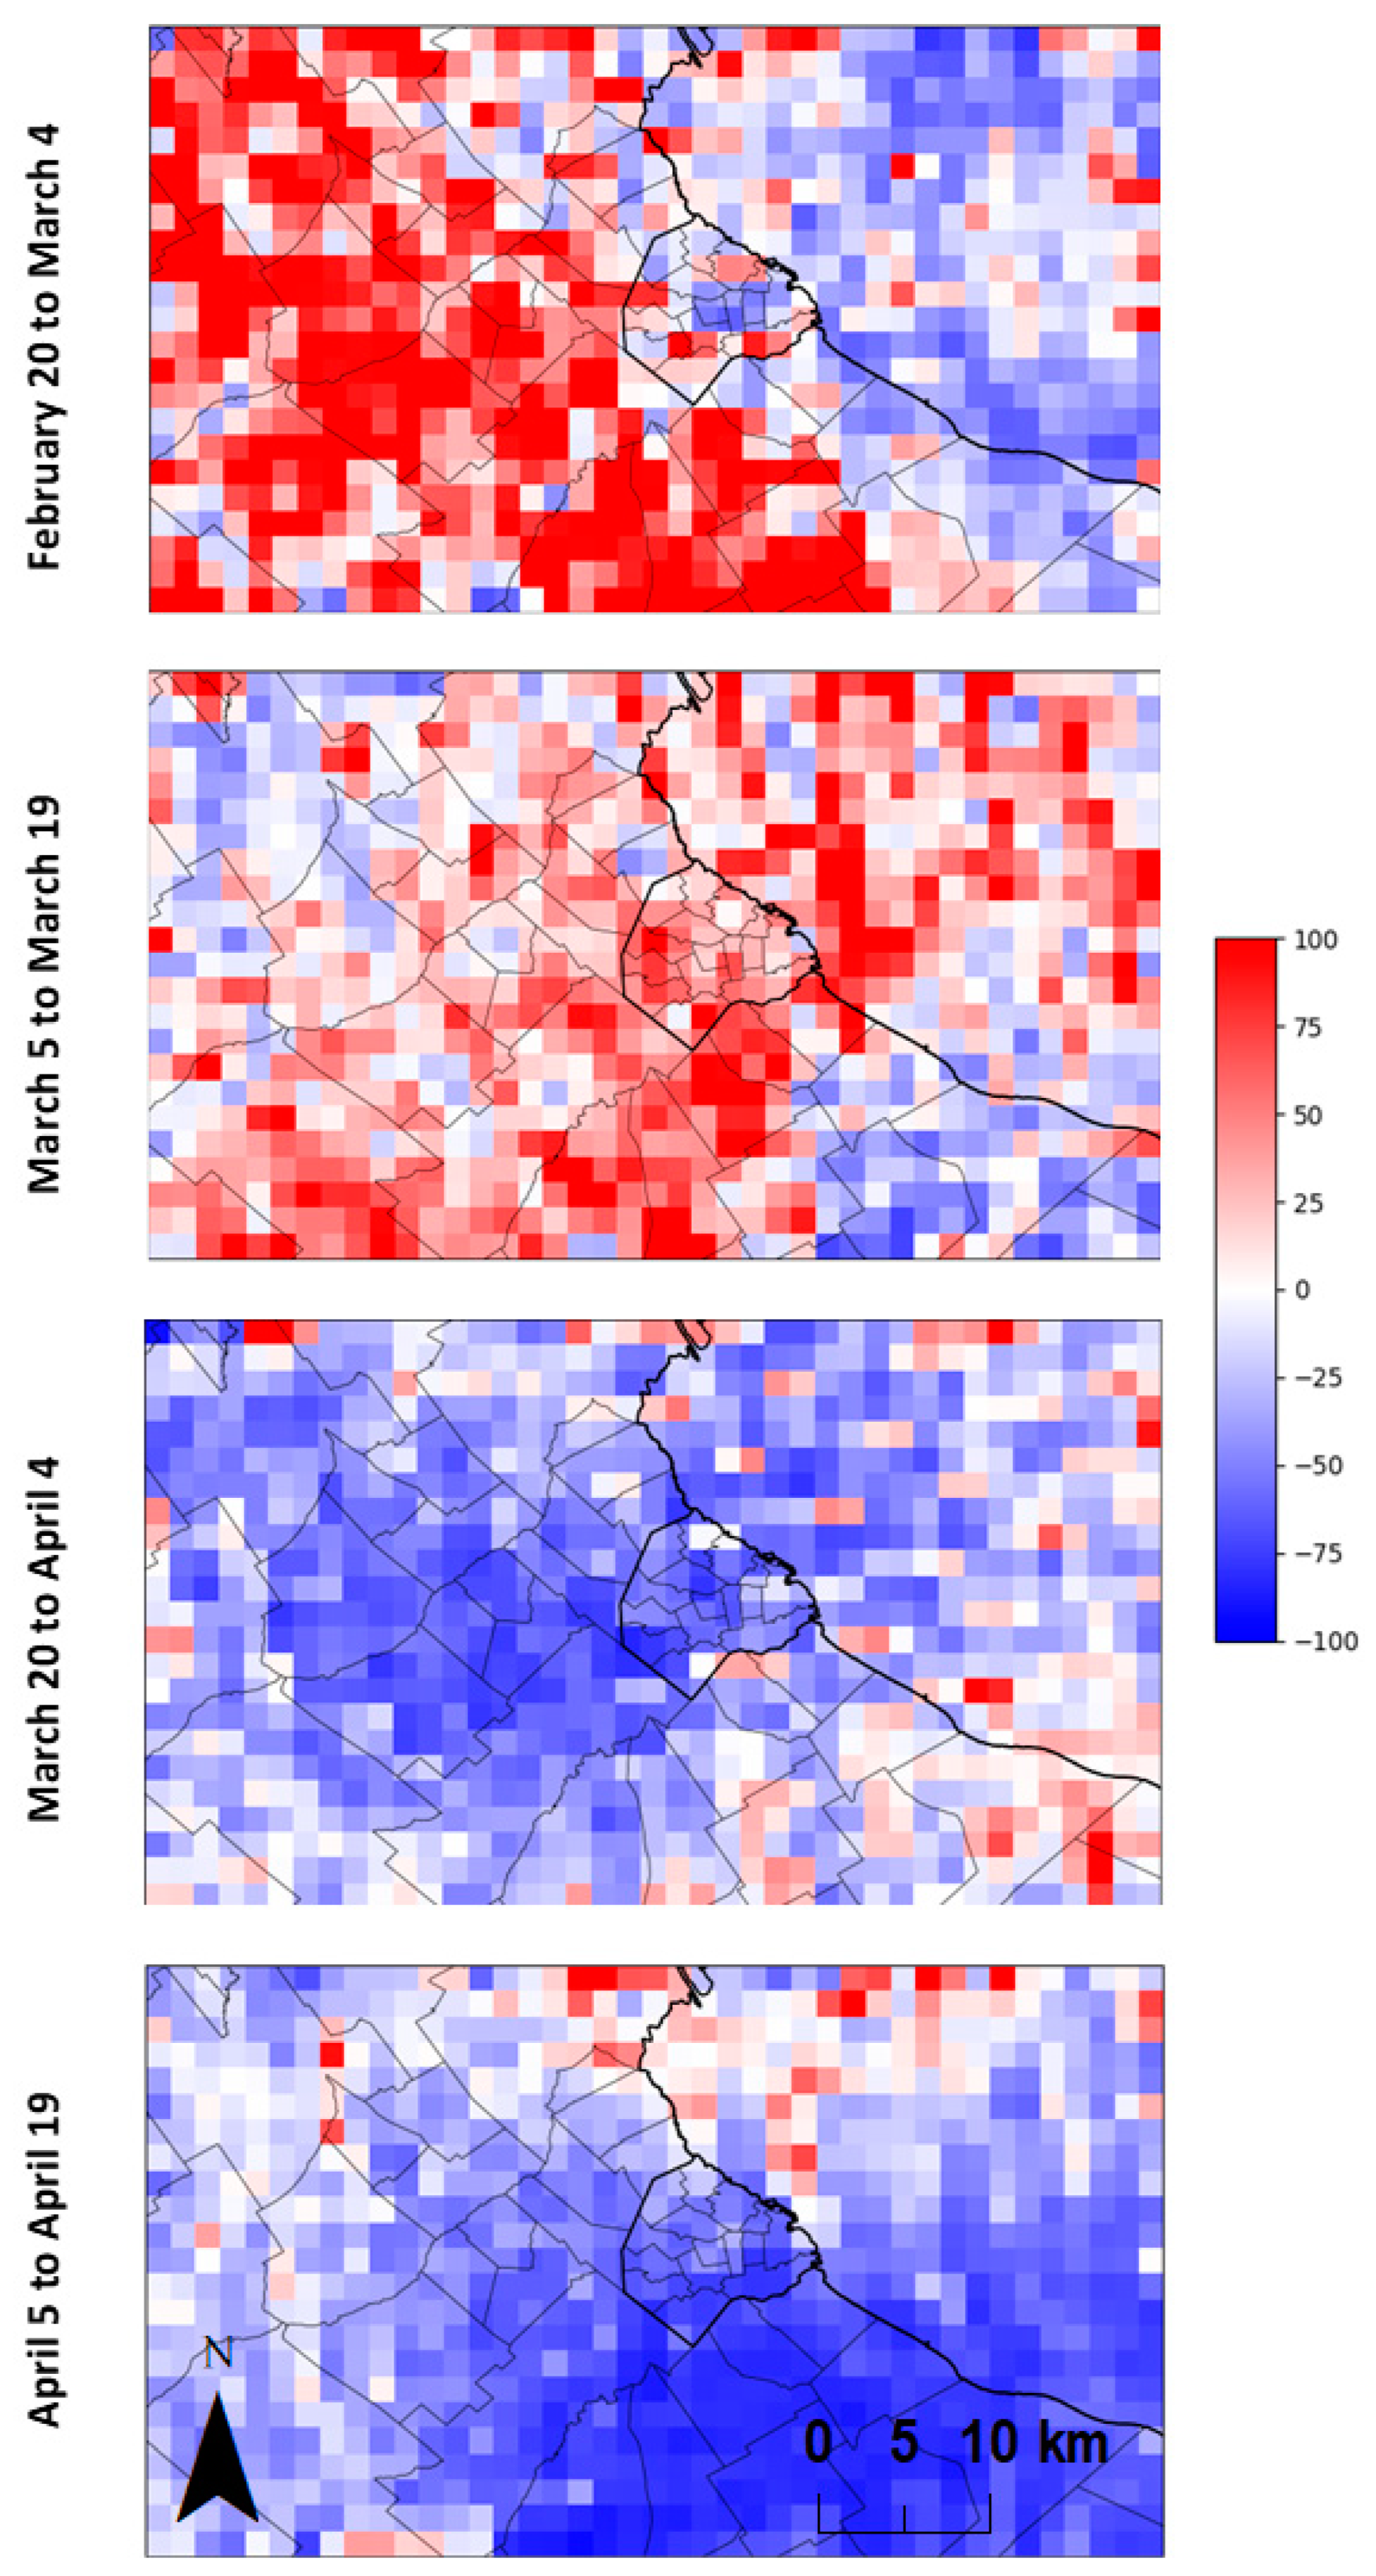
Additionally, Table 2 shows reductions in mean NO2 concentrations, according to the data from the air quality network of CABA and the S5p/TROPOMI-ESA satellite [30,31]. A decreasing trend in the data measured was observed from the S5p/TROPOMI-ESA satellite too. There was only an increase during the S1 and S2 situations (see S1/S2 definition in Table 2) as shown in Appendix A, (Figure A2), but it was considered as a regional effect also observed in other recent studies carried out in South America [3,9].
Situations S2, S3, and S4 provide insight into some measures that could be taken to control polluting emissions in the city. Studies conducted by Vrekoussisy et al. [59] in Athens, Greece, showed that the NO2 columns over Athens have been significantly reduced in the range of 30–40% during the economic crisis of 2008. They also found strong correlations between pollutant concentrations and economic indicators, showing that the economic recession resulted in proportionally lower levels of pollutants in large parts of Greece. In addition, Tong et al. [60] studied the implications for surface ozone levels to changes in NOx emissions in the United States during the 2008 global recession and they observed large national reductions in NOx emissions of up to 21%. Recent studies investigated 419 episodes of financial crises in more than 150 countries during the period 1970–2014, analyzing the impact of financial crises on air pollutant emissions. The results showed that, in the short term, as a consequence of the financial crises, emissions decrease for CO2, SO2 and NOx by 2.6, 1.8, and 1.7%, respectively, but, in the medium-term, financial crises have an insignificant effect on emissions, or in some cases lead to a 1–2% increase, cancelling out the initial benefit [61]. These studies showed that the decreases in pollutants are related to a financial crisis; similarly, in our study, it could be generated by the economic crisis of the COVID-19 pandemic. However, the reactivation after this pandemic and financial crisis should serve to establish more environmentally friendly measures, trying to transform the temporary reductions into permanent lower levels.
Our study shows that exposure to air pollution is significantly correlated with an increased risk of infection and death due to COVID-19 (as shown in Table 1). In addition, human mobility restriction measures provide the greatest benefit for COVID-19 mitigation [62,63], because prevention is actually more cost-effective than cure [64,65,66] or death [67]. Therefore, the results of this study show that air pollution in CABA can serve as one of the indicators to assess vulnerability to COVID-19. Moreover, strategies to restrict human mobility during the COVID-19 pandemic and future outbreaks of similar diseases seem to be adequate.
This study has delivered strong evidence regarding the association of COVID-19 expansion with various meteorological and pollutants indicators, and improvement in air quality in CABA. However, it has some limitations. Firstly, COVID-19 is an infectious disease that is related to additional variables that must be considered in a comprehensive study. Also, future research should include air pollutants such as PM2.5, SO2, black carbon and SARS-CoV-2 in PM2.5 particles. Moreover, socio-economic aspects such as measures of social distancing, full and partial shutdown, personal hygiene, among others, should be explored.
4. Conclusions

Meteorological and air quality variables were important factors in determining the incidence rate of COVID-19 in CABA. We also observed that air quality in terms of NO2 and PM10 improved during the most restrictive time of the COVID-19 pandemic lockdown in CABA. Our study shows that exposure to air pollution was significantly correlated with an increased risk of becoming infected and dying from COVID-19. Therefore, this study shows that air pollution in CABA can serve as one of the indicators to assess vulnerability to COVID-19. In addition, it can serve decision-makers for the adoption of strategies to restrict human mobility during the COVID-19 pandemic and future outbreaks of similar diseases.

Author Contributions

Conceptualization, T.R.B.-O. and S.E.P.; Data curation, T.R.B.-O., R.M.P.-F. and M.F.T.; Formal analysis, T.R.B.-O., R.M.P.-F., S.E.P., Y.C.-C., M.F.R., A.I.L.-N., M.F.T. and F.C.-B.; Funding acquisition, Y.C.-C.; Investigation, T.R.B.-O., R.M.P.-F., S.E.P., Y.C.-C., L.L.B.-P., M.F.R., A.I.L.-N. and F.C.-B.; Methodology, T.R.B.-O. and F.C.-B.; Project administration, S.E.P. and F.C.-B.; Resources, S.E.P.; Supervision, S.E.P. and F.C.-B.; Visualization, T.R.B.-O. and L.L.B.-P.; Writing—original draft, T.R.B.-O. and S.E.P. All authors have read and agreed to the published version of the manuscript.

Funding

This research was funded by Universidad del Magdalena, under call for APC Funding 2020.

Acknowledgments

We acknowledge the Consejo Nacional de Investigaciones Científicas y Técnicas (CONICET) (National Council for Scientific and Technical Investigations), and the National Agency of Scientific and Technological Promotion (ANPCyT) (Agencia Nacional de Promoción Científica y Tecnológica) under project PICT 2016 1115 and Universidad Tecnológica Nacional (UTN) (National Technological University). We thanks also the GORE-FNDR-V Región in Valparaíso, and Programa de Asignación Rápida de Recursos para Proyectos de Investigación Sobre el Coronavirus (COVID-19) (project COVID0581-2020), ANID, Ministerio de Ciencia, Tecnología, Conocimiento e Innovación, both in Chile. Y.C.C. thanks the Universidad del Magdalena for the grants and fund research (AA N° 014–2015, AA N° 031–2016, Res N° 0388–2017, Res N° 0709–2017, Res N° 0119–2018 and Res N° 0305–2018). We would like to thank Rafael P. Fernandez for proofreading our paper. We also would like to thank the S5p/TROPOMI-ESA scientific teams, and their associated personnel to produce data used in this research effort.

Conflicts of Interest

The authors declare no conflict of interest.

Abbreviations

The following abbreviations are used in this manuscript:
COVID-19Coronavirus disease 2019
SARS-CoV-2Severe acute respiratory syndrome novel coronavirus 2
WHOWorld Health Organization
CABACity of Buenos Aires
PMParticulate matter
PM10Particulate matter with a diameter of 10 microns or less
PM2.5Particulate matter with a diameter of 2.5 microns or less
NO2Nitrogen dioxide
NONitrogen monoxide
COCarbon monoxide
AODAerosol optical depth
O3Ozone
VOCVolatile organic compound
ESAEuropean Space Agency
S5pSentinel-5 Precursor
TROPOMITROPOspheric Monitoring Instrument

Appendix A

Table A1. Shapiro-Wilk normality test application. All p-values are less than 0.001 and 0.01 significance level respectively, thus the null hypothesis is rejected that the variables have a normal distribution.
Variable NameLengthNAsStatisticp-Value
New cases880W = 0.6920485<0.001
Total cases880W = 0.7331529<0.001
Mortality880W = 0.8394012<0.001
Humidity880W = 0.8498697<0.01
Temperature average880W = 0.8627348<0.001
Temperature minimum880W = 0.8279921<0.001
Temperature maximum880W = 0.8627783<0.01
Rainfall881W = 0.4064017<0.001
Wind speed880W = 0.935951<0.001
PM10880W = 0.920365<0.001
NO2880W = 0.9203248<0.001
Table A2. Empirical results through Spearman rank correlation test for new cases in CABA, from lag of 15 days prior to the confirmation date (lag 0). Number colors indicate stands for 1%, 5%, and 10% level of significance, respectively.
Lag DayTemperature AverageTemperature MinimumTemperature MaximumHumidityRainfallWind SpeedPM10NO2
−15−0.711−0.638−0.6850.1820.068−0.183−0.1540.003
−14−0.679−0.629−0.6180.1350.010−0.224−0.1240.020
−13−0.667−0.636−0.5470.1340.002−0.224−0.0870.029
−12−0.680−0.648−0.5520.157−0.012−0.250−0.0310.039
−11−0.701−0.672−0.5580.125−0.020−0.2270.0080.022
−10−0.707−0.685−0.5490.190−0.007−0.2800.0230.023
−9−0.730−0.725−0.5700.123−0.030−0.2670.0120.028
−8−0.744−0.738−0.5770.075−0.123−0.3140.0720.048
−7−0.737−0.743−0.5470.017−0.144−0.2710.106−0.020
−6−0.714−0.721−0.534−0.016−0.223−0.3160.094−0.006
−5−0.692−0.708−0.512−0.056−0.234−0.2520.1520.012
−4−0.687−0.697−0.5120.024−0.238−0.2670.129−0.043
−3−0.687−0.689−0.5100.007−0.241−0.2790.115−0.079
−2−0.699−0.704−0.5400.010−0.282−0.3290.151−0.059
−1−0.712−0.709−0.5440.000−0.303−0.2910.204−0.093
0−0.710−0.701−0.545−0.050−0.352−0.2440.197−0.166
Table A3. Empirical results through Spearman rank correlation test for total cases in CABA, from lag of 15 days prior to the confirmation date (lag 0). Number colors indicate stands for 1%, 5%, and 10% level of significance, respectively.
Lag DayTemperature AverageTemperature MinimumTemperature MaximumHumidityRainfallWind SpeedPM10NO2
−15−0.742−0.674−0.7040.1780.009−0.220−0.247−0.137
−14−0.731−0.678−0.6570.129−0.013−0.249−0.192−0.122
−13−0.740−0.695−0.6280.115−0.035−0.240−0.132−0.120
−12−0.757−0.720−0.6300.099−0.057−0.266−0.087−0.115
−11−0.787−0.751−0.6350.094−0.078−0.289−0.037−0.099
−10−0.795−0.775−0.6310.111−0.100−0.2950.017−0.114
−9−0.800−0.781−0.6330.104−0.122−0.2470.001−0.134
−8−0.807−0.791−0.6340.059−0.144−0.2670.027−0.137
−7−0.817−0.803−0.6460.013−0.165−0.2610.076−0.153
−6−0.819−0.812−0.649−0.047−0.187−0.2360.069−0.146
−5−0.819−0.818−0.649−0.055−0.209−0.2750.083−0.101
−4−0.821−0.820−0.648−0.026−0.231−0.2850.110−0.104
−3−0.817−0.819−0.646−0.017−0.253−0.3220.126−0.099
−2−0.814−0.812−0.644−0.007−0.274−0.3410.151−0.089
−1−0.813−0.806−0.6410.007−0.296−0.3440.155−0.109
0−0.813−0.806−0.641−0.031−0.318−0.3230.178−0.160
Table A4. Empirical results through Spearman rank correlation test for mortality in CABA, from lag of 15 days prior to the confirmation date (lag 0). Number colors indicate stands for 1%, 5%, and 10% level of significance, respectively.
Lag dayTemperature AverageTemperature MinimumTemperature MaximumHumidityRainfallWind SpeedPM10NO2
−15−0.563−0.495−0.5780.1520.009−0.147−0.254−0.195
−14−0.529−0.467−0.4860.1730.010−0.115−0.248−0.187
−13−0.520−0.469−0.4620.173−0.026−0.159−0.191−0.241
−12−0.549−0.515−0.4790.144−0.066−0.208−0.109−0.172
−11−0.602−0.575−0.4680.055−0.130−0.174−0.025−0.195
−10−0.602−0.585−0.5250.043−0.131−0.231−0.002−0.174
−9−0.643−0.644−0.5240.021−0.006−0.161−0.007−0.137
−8−0.672−0.635−0.567−0.005−0.090−0.162−0.013−0.210
−7−0.634−0.613−0.4910.016−0.158−0.1940.044−0.170
−6−0.617−0.616−0.496−0.023−0.094−0.2130.032−0.222
−5−0.601−0.608−0.470−0.022−0.155−0.202−0.061−0.228
−4−0.638−0.634−0.470−0.002−0.124−0.186−0.100−0.292
−3−0.639−0.636−0.521−0.172−0.196−0.251−0.020−0.238
−2−0.665−0.681−0.500−0.091−0.299−0.3220.125−0.109
−1−0.650−0.633−0.591−0.073−0.255−0.2140.139−0.144
0−0.675−0.654−0.538−0.093−0.243−0.3060.102−0.145
Figure A1. Satellite images obtained on 8 March, 20 March and 19 April (2018, 2019 and 2020), showing PM2.5 levels. The city of Buenos Aires is indicated within red circle. Source: Earth (CAMS/Copernicus/European Commission + ECMWF) [31,33].
Atmosphere 11 01045 g0a1
Figure A2. Differences (%) between the year 2019 and 2020 of tropospheric NO2 measured by the S5p/TROPOMI-ESA. Red and blue tones indicate greater/lesser concentration in 2019 and 2020 respectively.
Atmosphere 11 01045 g0a2

References

  1. WHO. Coronavirus Disease (COVID-2019) Situation Reports. Available online: https://www.who.int/emergencies/diseases/novel-coronavirus-2019/situation-reports (accessed on 31 May 2020).
  2. Wu, J.T.; Leung, K.; Bushman, M.; Kishore, N.; Niehus, R.; de Salazar, P.M.; Cowling, B.J.; Lipsitch, M.; Leung, G.M. Estimating clinical severity of COVID-19 from the transmission dynamics in Wuhan, China. Nat. Med. 2020, 26, 506–510. [Google Scholar] [CrossRef] [Green Version]
  3. Dantas, G.; Siciliano, B.; França, B.B.; da Silva, C.M.; Arbilla, G. The impact of COVID-19 partial lockdown on the air quality of the city of Rio de Janeiro, Brazil. Sci. Total Environ. 2020, 729, 139085. [Google Scholar] [CrossRef]
  4. Wang, C.; Horby, P.W.; Hayden, F.G.; Gao, G.F. A novel coronavirus outbreak of global health concern. Lancet 2020, 395, 470–473. [Google Scholar] [CrossRef] [Green Version]
  5. Gautam, S. The Influence of COVID-19 on Air Quality in India: A Boon or Inutile. Bull. Environ. Contam. Toxicol. 2020, 104. [Google Scholar] [CrossRef] [PubMed]
  6. Gautam, S.; Hens, L. COVID-19: Impact by and on the environment, health and economy. Environ. Dev. Sustain. 2020, 22, 1–2. [Google Scholar] [CrossRef] [PubMed]
  7. Bherwani, H.; Nair, M.; Musugu, K.; Gautam, S.; Gupta, A.; Kapley, A.; Kumar, R. Valuation of air pollution externalities: Comparative assessment of economic damage and emission reduction under COVID-19 lockdown. Air Qual. Atmos. Health 2020, 13, 1–12. [Google Scholar] [CrossRef]
  8. Wang, P.; Chen, K.; Zhu, S.; Wang, P.; Zhang, H. Severe air pollution events not avoided by reduced anthropogenic activities during COVID-19 outbreak. Resour. Conserv. Recycl. 2020, 158, 104814. [Google Scholar] [CrossRef] [PubMed]
  9. Nakada, L.Y.K.; Urban, R.C. COVID-19 pandemic: Impacts on the air quality during the partial lockdown in São Paulo state, Brazil. Sci. Total Environ. 2020, 730, 139087. [Google Scholar] [CrossRef]
  10. Muhammad, S.; Long, X.; Salman, M. COVID-19 pandemic and environmental pollution: A blessing in disguise? Sci. Total Environ. 2020, 728, 138820. [Google Scholar] [CrossRef]
  11. Sharma, S.; Zhang, M.; Anshika; Gao, J.; Zhang, H.; Kota, S.H. Effect of restricted emissions during COVID-19 on air quality in India. Sci. Total Environ. 2020, 728, 138878. [Google Scholar] [CrossRef]
  12. Mahato, S.; Pal, S.; Ghosh, K.G. Effect of lockdown amid COVID-19 pandemic on air quality of the megacity Delhi, India. Sci. Total Environ. 2020, 730, 139086. [Google Scholar] [CrossRef] [PubMed]
  13. Zambrano-Monserrate, M.A.; Ruano, M.A.; Sanchez-Alcalde, L. Indirect effects of COVID-19 on the environment. Sci. Total Environ. 2020, 728, 138813. [Google Scholar] [CrossRef] [PubMed]
  14. Chen, K.; Wang, M.; Huang, C.; Kinney, P.L.; Paul, A.T. Air Pollution Reduction and Mortality Benefit during the COVID-19 Outbreak in China. MedRxiv 2020, 4, e210–e212. [Google Scholar] [CrossRef]
  15. Tosepu, R.; Gunawan, J.; Effendy, D.S.; Ahmad, L.O.A.I.; Lestari, H.; Bahar, H.; Asfian, P. Correlation between weather and Covid-19 pandemic in Jakarta, Indonesia. Sci. Total Environ. 2020, 725, 138436. [Google Scholar] [CrossRef]
  16. Bashir, M.F.; Ma, B.; Bilal; Komal, B.; Bashir, M.A.; Tan, D.; Bashir, M. Correlation between climate indicators and COVID-19 pandemic in New York, USA. Sci. Total Environ. 2020, 728, 138835. [Google Scholar] [CrossRef]
  17. Bashir, M.F.; Bilal, B.M.A.; Komal, B. Correlation between environmental pollution indicators and COVID-19 pandemic: A brief study in Californian context. Environ. Res. 2020, 187, 109652. [Google Scholar] [CrossRef]
  18. Menebo, M.M. Temperature and precipitation associate with Covid-19 new daily cases: A correlation study between weather and Covid-19 pandemic in Oslo, Norway. Sci. Total Environ. 2020, 737, 139659. [Google Scholar] [CrossRef]
  19. Auler, A.C.; Cássaro, F.A.M.; da Silva, V.O.; Pires, L.F. Evidence that high temperatures and intermediate relative humidity might favor the spread of COVID-19 in tropical climate: A case study for the most affected Brazilian cities. Sci. Total Environ. 2020, 729, 139090. [Google Scholar] [CrossRef]
  20. Bolaño-Ortiz, T.R.; Camargo-Caicedo, Y.; Puliafito, S.E.; Ruggeri, M.F.; Bolaño-Diaz, S.; Pascual-Flores, R.; Saturno, J.; Ibarra-Espinosa, S.; Mayol-Bracero, O.L.; Torres-Delgado, E.; et al. Spread of SARS-CoV-2 through Latin America and the Caribbean region: A look from its economic conditions, climate and air pollution indicators. Environ. Res. 2020, 191, 109938. [Google Scholar] [CrossRef]
  21. MINSA CORONAVIRUS. Daily Report. Available online: https://www.argentina.gob.ar/coronavirus/informe-diario/ (accessed on 3 June 2020).
  22. BOEAR. Argentine Official Bulletin. Available online: https://www.boletinoficial.gob.ar/detalleAviso/primera/227042/20200320 (accessed on 28 April 2020).
  23. MIMEM. Datasets—Secretary of Energy, Argentina. Available online: http://datos.minem.gob.ar/dataset?groups=comercializacion-de-los-hidrocarburos (accessed on 27 July 2020).
  24. Bontempi, E. First data analysis about possible COVID-19 virus airborne diffusion due to air particulate matter (PM): The case of Lombardy (Italy). Environ. Res. 2020, 186, 109639. [Google Scholar] [CrossRef]
  25. Jüni, P.; Rothenbühler, M.; Bobos, P.; Thorpe, K.E.; da Costa, B.R.; Fisman, D.N.; Slutsky, A.S.; Gesink, D. Impact of climate and public health interventions on the COVID-19 pandemic: A prospective cohort study. Can. Med. Assoc. J. 2020, 192, E566–E573. [Google Scholar] [CrossRef]
  26. Coccia, M. Factors determining the diffusion of COVID-19 and suggested strategy to prevent future accelerated viral infectivity similar to COVID. Sci. Total Environ. 2020, 729, 138474. [Google Scholar] [CrossRef] [PubMed]
  27. INDEC. Population Projections by Province in Argentina. Available online: https://www.indec.gob.ar/indec/web/Nivel4-Tema-2-24-85 (accessed on 6 May 2020).
  28. SMN. Historical Meteorological Data of Argentina. Available online: https://www.smn.gob.ar/descarga-de-datos (accessed on 3 June 2020).
  29. CABA. Air Quality Network of city of Buenos Aires. Available online: https://www.buenosaires.gob.ar/areas/med_ambiente/apra/calidad_amb/red_monitoreo/index.php?contaminante=2&estacion=1&fecha_dia=01&fecha_mes=04&fecha_anio=2020&menu_id=34234&buscar=Buscar (accessed on 3 June 2020).
  30. Veefkind, J.P.; Aben, I.; McMullan, K.; Förster, H.; de Vries, J.; Otter, G.; Claas, J.; Eskes, H.J.; de Haan, J.F.; Kleipool, Q.; et al. TROPOMI on the ESA Sentinel-5 Precursor: A GMES mission for global observations of the atmospheric composition for climate, air quality and ozone layer applications. Remote Sens. Environ. 2012, 120, 70–83. [Google Scholar] [CrossRef]
  31. ESA TROPOMI. Level 2 Nitrogen Dioxide total column products. Copernic. Sentin. 2018. [Google Scholar] [CrossRef]
  32. Henk, E.; van Jos, G.; Folkert, B.; Kai-Uwe, E.; Arnoud, A.; Mattia, P.; Maarten, S.J.; Pepijn Veefkind, D.L. Sentinel-5 precursor/TROPOMI Level 2 Product User Manual Nitrogen Dioxide. 2019. Available online: https://sentinels.copernicus.eu/documents/247904/2474726/Sentinel-5P-Level-2-Product-User-Manual-Nitrogen-Dioxide (accessed on 28 July 2020).
  33. Copernicus Earth Earth (CAMS/Copernicus/European Commission + ECMWF). Available online: https://earth.nullschool.net/ (accessed on 28 July 2020).
  34. Ign Political Division, Surface and Population. Available online: https://www.ign.gob.ar/NuestrasActividades/Geografia/DatosArgentina/DivisionPolitica (accessed on 26 April 2020).
  35. Ahmadi, M.; Sharifi, A.; Dorosti, S.; Jafarzadeh Ghoushchi, S.; Ghanbari, N. Investigation of effective climatology parameters on COVID-19 outbreak in Iran. Sci. Total Environ. 2020, 729, 138705. [Google Scholar] [CrossRef] [PubMed]
  36. Arkouli, M.; Ulke, A.G.; Endlicher, W.; Baumbach, G.; Schultz, E.; Vogt, U.; Müller, M.; Dawidowski, L.; Faggi, A.; Wolf-Benning, U.; et al. Distribution and temporal behavior of particulate matter over the urban area of Buenos Aires. Atmos. Pollut. Res. 2010, 1, 1–8. [Google Scholar] [CrossRef] [Green Version]
  37. Berbery, E.H.; Ciappesoni, H.C.; Kalnay, E. The smoke episode in Buenos Aires, 15-20 April 2008. Geophys. Res. Lett. 2008, 35, 35. [Google Scholar] [CrossRef]
  38. Venegas, L.E.; Mazzeo, N.A. Modelling of urban background pollution in Buenos Aires City (Argentina). Environ. Model. Softw. 2006, 21, 577–586. [Google Scholar] [CrossRef]
  39. Wu, Y.; Jing, W.; Liu, J.; Ma, Q.; Yuan, J.; Wang, Y.; Du, M.; Liu, M. Effects of temperature and humidity on the daily new cases and new deaths of COVID-19 in 166 countries. Sci. Total Environ. 2020, 729, 139051. [Google Scholar] [CrossRef]
  40. Wang, P.; Goggins, W.B.; Chan, E.Y.Y. A time-series study of the association of rainfall, relative humidity and ambient temperature with hospitalizations for rotavirus and norovirus infection among children in Hong Kong. Sci. Total Environ. 2018, 643, 414–422. [Google Scholar] [CrossRef]
  41. Yuan, J.; Yun, H.; Lan, W.; Wang, W.; Sullivan, S.G.; Jia, S.; Bittles, A.H. A climatologic investigation of the SARS-CoV outbreak in Beijing, China. Am. J. Infect. Control 2006, 643, 414–422. [Google Scholar] [CrossRef] [PubMed]
  42. Ellwanger, J.H.; Chies, J.A.B. Wind: A neglected factor in the spread of infectious diseases. Lancet Planet. Heal. 2018, 2, e475. [Google Scholar] [CrossRef] [Green Version]
  43. Wu, X.; Nethery, R.C.; Sabath, M.B.; Braun, D.; Dominici, F. Exposure to air pollution and COVID-19 mortality in the United States: A nationwide cross-sectional study. J. Chem. Inf. Model. 2020. [Google Scholar] [CrossRef] [Green Version]
  44. Filippini, T.; Rothman, K.J.; Goffi, A.; Ferrari, F.; Maffeis, G.; Orsini, N.; Vinceti, M. Satellite-detected tropospheric nitrogen dioxide and spread of SARS-CoV-2 infection in Northern Italy. Sci. Total Environ. 2020, 739, 140278. [Google Scholar] [CrossRef] [PubMed]
  45. Saha, B.; Debnath, A.; Saha, B. Analysis and Finding the Correlation of Air Quality Parameters on the Spread and Deceased Case of COVID-19 Patients in India. 2020. Available online: https://assets.researchsquare.com/files/rs-34647/v1/d82c5de9-56a1-435b-a1e4-6ca206b8838f.pdf (accessed on 28 September 2020).
  46. Travaglio, M.; Popovic, R.; Yu, Y.; Leal, N.; Martins, L.M. Links between air pollution and COVID-19 in England. MedRxiv 2020. [Google Scholar] [CrossRef] [Green Version]
  47. Suhaimi, N.F.; Jalaludin, J.; Latif, M.T. Demystifying a Possible Relationship between COVID-19, Air Quality and Meteorological Factors: Evidence from Kuala Lumpur, Malaysia. Aerosol Air Qual. Res. 2020, 20, 1520–1529. [Google Scholar] [CrossRef]
  48. Ogen, Y. Assessing nitrogen dioxide (NO2) levels as a contributing factor to coronavirus (COVID-19) fatality. Sci. Total Environ. 2020, 726, 138605. [Google Scholar] [CrossRef]
  49. Azuma, K.; Kagi, N.; Kim, H.; Hayashi, M. Impact of climate and ambient air pollution on the epidemic growth during COVID-19 outbreak in Japan. Environ. Res. 2020, 190, 110042. [Google Scholar] [CrossRef]
  50. Gupta, A.; Bherwani, H.; Gautam, S.; Anjum, S.; Musugu, K.; Kumar, N.; Anshul, A.; Kumar, R. Air pollution aggravating COVID-19 lethality? Exploration in Asian cities using statistical models. Environ. Dev. Sustain. 2020. [Google Scholar] [CrossRef]
  51. Ghahremanloo, M.; Lops, Y.; Choi, Y.; Mousavinezhad, S. Impact of the COVID-19 outbreak on air pollution levels in East Asia. Sci. Total Environ. 2021, 754, 142226. [Google Scholar] [CrossRef]
  52. Kanniah, K.D.; Kamarul Zaman, N.A.F.; Kaskaoutis, D.G.; Latif, M.T. COVID-19′s impact on the atmospheric environment in the Southeast Asia region. Sci. Total Environ. 2020, 736, 139658. [Google Scholar] [CrossRef] [PubMed]
  53. Otmani, A.; Benchrif, A.; Tahri, M.; Bounakhla, M.; Chakir, E.M.; El Bouch, M.; Krombi, M. Impact of Covid-19 lockdown on PM10, SO2 and NO2 concentrations in Salé City (Morocco). Sci. Total Environ. 2020, 735, 139541. [Google Scholar] [CrossRef] [PubMed]
  54. Hashim, B.M.; Al-Naseri, S.K.; Al-Maliki, A.; Al-Ansari, N. Impact of COVID-19 lockdown on NO2, O3, PM2.5 and PM10 concentrations and assessing air quality changes in Baghdad, Iraq. Sci. Total Environ. 2021, 754, 141978. [Google Scholar] [CrossRef] [PubMed]
  55. Ropkins, K.; Tate, J. Early Observations on the impact of the COVID-19 Lockdown on Air Quality Trends across the UK. Sci. Total Environ. 2020, 754, 142374. [Google Scholar] [CrossRef]
  56. Berman, J.D.; Ebisu, K. Changes in U.S. air pollution during the COVID-19 pandemic. Sci. Total Environ. 2020, 739, 139864. [Google Scholar] [CrossRef] [PubMed]
  57. IPCC. Climate Change 2007: Impacts, Adaptation and Vulnerability: Contribution of Working Group II to the Fourth Assessment Report of the Intergovernmental Panel; Cambridge University Press: Cambridge, UK, 2007. [Google Scholar]
  58. IPCC. Fifth Assessment Report Climate Change 2013; Cambridge University Press: Cambridge, UK, 2013. [Google Scholar]
  59. Vrekoussis, M.; Richter, A.; Hilboll, A.; Burrows, J.P.; Gerasopoulos, E.; Lelieveld, J.; Barrie, L.; Zerefos, C.; Mihalopoulos, N. Economic crisis detected from space: Air quality observations over Athens/Greece. Geophys. Res. Lett. 2013, 40, 458–463. [Google Scholar] [CrossRef]
  60. Tong, D.; Pan, L.; Chen, W.; Lamsal, L.; Lee, P.; Tang, Y.; Kim, H.; Kondragunta, S.; Stajner, I. Impact of the 2008 Global Recession on air quality over the United States: Implications for surface ozone levels from changes in NOx emissions. Geophys. Res. Lett. 2016, 43, 9280–9288. [Google Scholar] [CrossRef] [Green Version]
  61. Pacca, L.; Antonarakis, A.; Schröder, P.; Antoniades, A. The effect of financial crises on air pollutant emissions: An assessment of the short vs. medium-term effects. Sci. Total Environ. 2020, 698, 133614. [Google Scholar] [CrossRef]
  62. Chinazzi, M.; Davis, J.T.; Ajelli, M.; Gioannini, C.; Litvinova, M.; Merler, S.; Pastore y Piontti, A.; Mu, K.; Rossi, L.; Sun, K.; et al. The effect of travel restrictions on the spread of the 2019 novel coronavirus (COVID-19) outbreak. Science 2020, 368, eaba9757. [Google Scholar] [CrossRef] [Green Version]
  63. Anderson, R.M.; Heesterbeek, H.; Klinkenberg, D.; Hollingsworth, T.D. How will country-based mitigation measures influence the course of the COVID-19 epidemic? Lancet 2020, 395, 931–934. [Google Scholar] [CrossRef]
  64. Goscé, L.; Johansson, A. Analysing the link between public transport use and airborne transmission: Mobility and contagion in the London underground. Environ. Health 2018, 17, 84. [Google Scholar] [CrossRef] [PubMed] [Green Version]
  65. Mankia, K.; Di Matteo, A.; Emery, P. Prevention and cure: The major unmet needs in the management of rheumatoid arthritis. J. Autoimmun. 2020, 110, 102399. [Google Scholar] [CrossRef] [PubMed]
  66. Brianti, M.; Magnani, M.; Menegatti, M. Optimal choice of prevention and cure under uncertainty on disease effect and cure effectiveness. Res. Econ. 2018, 72, 327–342. [Google Scholar] [CrossRef]
  67. Sasidharan, M.; Singh, A.; Torbaghan, M.E.; Parlikad, A.K. A vulnerability-based approach to human-mobility reduction for countering COVID-19 transmission in London while considering local air quality. Sci. Total Environ. 2020, 741, 140515. [Google Scholar] [CrossRef] [PubMed]
Figure 1. Location of CABA on the American continent and its air quality monitoring stations. Numbers indicate the locations of the monitoring stations: (1) Centenario; (2) La Boca and, (3) Cordoba.
Atmosphere 11 01045 g001
Figure 2. Daily (new) and total cases for infections (A) and deaths (B) due to COVID-19 in CABA, until the last week of May 2020. The black dotted line indicates the start of the pandemic lockdown (20 March 2020).
Atmosphere 11 01045 g002
Figure 3. The level of tropospheric NO2 (moles/m2) measured by the S5p/TROPOMI-ESA [30,31] both in the same day (23 March) and different years in CABA.
Atmosphere 11 01045 g003
Figure 4. Variation of meteorological conditions observed from 5 March to 31 May for temperature (A), wind speed (B), and humidity and rainfall (C) in CABA. The black dotted line indicates the start of the pandemic lockdown (20 March 2020).
Atmosphere 11 01045 g004
Figure 5. Variation of the Spearman coefficient for new cases (A), total cases (B), and mortality (C) with the meteorological variables in CABA. The lag day indicates up to 15 days prior to the confirmation date of cases and deaths. The values and their significance levels are also shown in Appendix A, Table A2, Table A3 and Table A4.
Atmosphere 11 01045 g005
Figure 6. Variation of the Spearman coefficient (bars) for new cases (A), total cases (B), and mortality (C) with the air quality variables in CABA. The lag day indicates up to 15 days prior to the confirmation date of cases and deaths.
Atmosphere 11 01045 g006
Figure 7. Average daily concentrations of PM10 (A) and NO2 (B) measured from March until May 2019 and 2020 in the air quality network of CABA. Black dotted line indicates the start of the pandemic lockdown (20 March 2020).
Atmosphere 11 01045 g007
Figure 8. Mean levels of tropospheric NO2 (moles/m2) measured by the S5p/TROPOMI-ESA in 2019 and 2020, both in the weeks corresponding to before, during, and in relaxation of the lockdown in CABA.
Atmosphere 11 01045 g008
Table 1. Literature review of studies displaying the relationship between COVID-19 infections and mortality with atmospheric pollutants.
Study AreaPollutant TypesKey ObservationsAuthors
New York city, USAAir QualityRelationship of up to −68% with the propagation of COVID-19Bashir et al. [16]
California state, USAPM2.5, PM10, SO2, NO2, Pb, VOC and COCOVID-19 has significant correlation with PM2.5, PM10, SO2, NO2, and CO Bashir et al. [17]
3000 cities in the United StatesPM2.5An 8% increase of COVID-19 mortality rate was explained by an increase of 1 μg/m3 of PM2.5Wu et al. [43]
28 provinces of Northern ItalyNO2COVID-19 spread was associated with high NO2 levelsFilippini et al. [44]
25 cities of IndiaPM2.5, PM10, NO2, SO2, CO, and O3COVID-19 deaths have significant correlation with poor air quality Saha et al. [45]
Countrywide, EnglandO3, NO and NO2COVID-19 deaths were significantly associated with ozone, nitrogen oxide and nitrogen dioxide Travaglio et al. [46]
Kuala Lumpur, MalaysiaPM2.5, PM10, SO2, NO2, CO and O3COVID-19 cases have been influenced by air pollutantSuhaimi et al. [47]
66 administrative regions of Italy, Spain, France and GermanyNO2COVID-19 deaths can be caused by prolonged exposure to NO2 Oren [48]
JapanPMShort-term exposure to PM might influence infections caused by the COVID-19Azuma et al. [49]
9 Asian citiesPM10 and PM2.5Increase in the COVID-19 death rate due to air pollution by PM10 and PM2.5Gupta et al. [50]
City of Buenos Aires, ArgentinaPM10 and NO2Total cases of COVID-19 were significantly correlated with PM10 days prior to reported infectionThis study
Table 2. Variation of NO2 mean concentrations measured (%) from 2019 to 2020 from the quality network and S5p/TROPOMI-ESA for CABA.
SituationDatesVariation of NO2 Mean Concentrations (%) from 2019 to 2020
Air Quality NetworkS5p/TROPOMI-ESA
S1: weeks prior to the identification of the first case of COVID−19 and the start of the lockdown.20 February to 4 March−20.42−13.83
S2: the government encourages the population to stay home and prohibits public events that gather many people.5 March to 19 March−18.2237.70
S3: the government establishes the full lockdown at the national level and closes the air, land and marine borders.20 March to 4 April−152.62−58.83
S4: The government begins to release some activities to minimize the economic impact of the full lockdown.5 April to 19 April−82.05−40.83