Abstract
Biomass burning related aerosol episodes are becoming a serious threat to the radiative balance of the Arctic region. Since early July 2017 intense wildfires were recorded between August and September in Canada and Greenland, covering an area up to 4674 km2 in size. This paper describes the impact of these biomass burning (BB) events measured over Svalbard, using an ensemble of ground-based, columnar, and vertically-resolved techniques. BB influenced the aerosol chemistry via nitrates and oxalates, which exhibited an increase in their concentrations in all of size fractions, indicating the BB origin of particles. The absorption coefficient data (530 nm) at ground reached values up to 0.6 Mm–1, highlighting the impact of these BB events when compared to average Arctic background values, which do not exceed 0.05 Mm–1. The absorption behavior is fundamental as implies a subsequent atmospheric heating. At the same time, the AERONET Aerosol Optical Depth (AOD) data showed high values at stations located close to or in Canada (AOD over 2.0). Similarly, increased values of AODs were then observed in Svalbard, e.g., in Hornsund (daily average AODs exceeded 0.14 and reached hourly values up to 0.5). Elevated values of AODs were then registered in Sodankylä and Andenes (daily average AODs exceeding 0.150) a few days after the Svalbard observation of the event highlighting the BB columnar magnitude, which is crucial for the radiative impact. All the reported data suggest to rank the summer 2017 plume of aerosols as one of the biggest atmosphere related environmental problems over Svalbard region in last 10 years.
1. Introduction
The ongoing climate change is leading to an increase in surface temperatures all over the globe [1] and as a consequence numbers of wild forest fires increase [2]. Biomass burning (BB) aerosols contribute to climate change causing a further increase in temperatures that affects the frequency of fires by triggering a feedback mechanism. According to Gillet et al. [3], the wildfire area burned in Canada, for example, is continuously increasing due to the human-induced climate change.
The chemical composition and the optical properties of BB aerosols depend not only on the type of forest burned, but also on the environmental conditions in which combustion takes place [4,5]. Generally, organics and black carbon are the two main BB aerosol components followed by sulphate, ammonium, nitrate and chloride [6,7,8,9].
Biomass burning aerosols are responsible for many environmental issues [1]. They have serious influence on human health and due to their optical properties and consequent impact on radiation budget, BB aerosols affect the planet climate [7,8,9,10,11,12,13,14,15,16]. These aerosol particles may both absorb and scatter solar radiation, thus play a key role both in modifying atmospheric visibility and photochemistry in the boundary layer [17,18] and they can act as cloud condensation nuclei [19,20,21]. Despite this climatic impact, estimations of the quantitative effects of BB aerosols on radiation balance are difficult to make and rather of a complex matter [22]. BB particles may cause short-term cooling, but their gases cause warming, the effect, which over the extended time, is of greater magnitude than the cooling effect. The subsequent IPCC reports provide information about the level of radiative forcing of BB aerosols, and they range from −0.2 W/m2 in the Second and Third Assessment Reports, through +0.03 W/m2 in the Fourth Assessment Report, to 0.0 (−0.2 to +0.2) W/m2 in the Fifth Assessment Report [1]. However, recently, Ferrero et al. [23] experimentally showed that the BB aerosol particles are 1.63 ± 0.03 times more efficient than pure black carbon, when heating of the atmosphere is considered. This proves that an increasing number of BB events is an emerging issue, which we will have to deal with in the near future.
In the most extreme cases, wildfires can produce aerosols and trace gases in large quantities. These can be transported and distributed across the globe very fast (days/weeks) and at long distances [24]. In some cases, aerosols produced from large wildfire activities can, via clouds, reach stratosphere. The impact of such particles on the radiative budget as well as chemistry of stratosphere has been discussed by Fromm et al. [25], however, it still needs further studies.
BB aerosols are constituted by a wide range of carbonaceous substances, which are abundant in carbon oxidation features, which in turn, have impact on optical properties (e.g., brown carbon) [26,27]. Black carbon (BC) is a main constituent of BB events, which is predominantly associated with absorption of solar radiation and is typically addressed as the most important optical absorbing fraction of aerosols. BC is typically a component of air pollutants, which are produced as a result of several events, e.g., boreal forest fires or shipping activities [28]. BB aerosols are usually internally mixed with other aerosol chemical components, such as ammonium nitrate and ammonium sulphate [29,30,31,32].
Due to its pristine environment, its remoteness and the consequent low anthropogenic influence, the Arctic atmosphere has been regarded as extremely clean, however, this view is being changed [33]. Airborne pollutants can be transported from lower latitudes into the Arctic region or directly emitted into the Arctic area from local sources.
Aerosol properties (chemical and optical) seasonally vary in the Arctic due to changes both in sources (outside or inside the Arctic region) and in meteorological conditions that may allow or inhibit the transport/local formation from source regions [34,35]. Stohl et al. [36] described the late winter/springtime period as affected by the Arctic haze: an inflow of air pollution dominated by accumulation mode aerosols that can be transported into the Arctic both at low-level, or with an uplift outside the Arctic. Conversely, during summer, the high continental pressure disappears and the transport from medium latitudes becomes less relevant.
Thus, during summer, any emission related to forest fires/biomass burning [37,38] or to local anthropogenic sources (e.g., increasing of shipping emissions/gas flaring) [35,39,40] becomes very important as far as the climate change is concerned.
So far, the Arctic haze has been regarded as the most important aerosol phenomenon in the Arctic. However, recent information on air pollution events in the Arctic, show that the BB episodes are possibly becoming a very important source of atmospheric pollution for the Arctic region, including Svalbard ([41,42,43,44,45,46,47]).
High levels of BB aerosols in summertime can be very problematic as far as the climate change is concerned, since interactions with solar radiation are at their maximum and BB aerosol particles are very effective in heating the atmosphere [23]. This is related to the fact that interactions with solar radiation are then at their maximum [23] contributing locally to an intensification of the Arctic amplification and globally to an average increase in temperatures that can trigger again higher frequency of forest fires [3]. BB aerosols contain a large amount of light-absorbing material, such as black carbon, and other organic matter, such as vanillic acid, isovanillic acid, homovanillic acid, syringic acid, syringaldehyde, ferulic acid, and p-coumaric acid [48] which, substantially, make up brown carbon particles (BrC).
In general, not only the BC, BrC, and BB aerosols interact with solar radiation directly in the atmosphere but settling on snow and ice reduce albedo and thus facilitate melting. Recent measurements have shown the noticeable increase of CO, ozone, and aerosol particles advected from wildfires in Eastern Europe into the European Arctic [49]. Warneke et al. [50] showed contribution of wildfires in central Asia and Russia to an increased pollution in Alaska. Additionally, in North America, a number of strong wildfire episodes, has been increasing due to anthropogenic related warming [42,44].
Moreover, from an optical point of view, during last ten years (2004, 2005, 2006, 2008, 2011, and 2015), AODs in the Arctic reached high values, ranging from 0.3 up to 1. Such high values resulted both from significant springtime Arctic haze events and, what is important for the aim of this study, transport of BB related aerosols during summertime BB events [37,38]. According to several reports from experimental measurements and models, the year 2017 was particularly important for atmospheric pollution events in the Arctic, with BB particles reaching different altitudes in the atmosphere, up to 20 km a.s.l. [51,52,53,54].
In this paper we present the results of comprehensive studies of aerosol properties during a long-range transport of biomass burning from Canada and Greenland to Svalbard region in summer 2017. The research team included researchers who carried out measurements at different locations on Spitsbergen and outside of the Svalbard Archipelago taking advantage of the Oceania research vessel (r/v Oceania) which enabled to perform measurements at sea. An ensemble of passive and active remote sensing methods, modeling of aerosol optical properties, simulations of variability of AOD, have been described in this work in order to properly evaluate impact of that Biomass Burning event on Svalbard.
2. Experiments
2.1. Period and Area of Investigation
The main event of BB aerosol transport under investigation in this study was observed between 28 July and 26 August 2017 in the Svalbard region. Later, a less pronounced event was also observed in the first half of September.
Measurements of several parameters related to the aerosol properties were carried out in two stations of the Spitsbergen Island: Ny-Ålesund and Hornsund.
Ny-Ålesund (78°55′25″ N, 11°55′21″ E) is a research town in the Oscar II Land on the island of Spitsbergen. The research stations are placed on the southern shore of Kongsfjorden [55]. Aerosol in situ measurements were made in the Gruvebadet laboratory (78.918° N, 11.895° E; 61 m a.s.l.), which is placed 800 m south-west of Ny-Ålesund.
The Polish Polar Station in Hornsund (77°0′0″ N, 15°33′0″ E) is located in Isbjørnhamna Bay, on the northern shore of the Hornsund Fjord. It is placed 10 m a.s.l., at the mouth of the fjord.
Additional measurements (optical properties of aerosols) were also planned and only partially made due to bad weather conditions (mostly clouded, foggy, and high swell) in the area west and south-west of Spitsbergen from board of r/v Oceania. Air masses, which move in the direction of Svalbard may be disturbed by local orographic conditions, related to the location of the Spitsbergen stations. Thus, the aerosol particle distribution is strongly related to the specific station. Additionally, water areas, which surround Svalbard archipelago have their own specific features in terms of aerosol production.
2.2. Instruments and Models
During the entire August 2017 event an ensemble of aerosol instruments were employed for measurements (Table S1). For the purpose of this paper we divided them into four groups: ground-based, columnar integrated, vertically resolved, and models.
2.2.1. Ground-Based Data
Aerosol properties were obtained at a ground from a large number of in-situ measurements, which were made at the Gruvebadet station in Ny-Ålesund. Bulk and size-segregated aerosol samples were collected. PM10 bulk aerosol was collected through two parallel TECORA SkyPost samplers (EN 12341; PM10 sampling head, flow 2.3 m3h–1; PTFE and Quarz fiber filters, Ø = 47 mm) in actual conditions. Size-segregated aerosol (<1, 1–2.5, 2.5–10, and >10 µm) was sampled by means of a DEKATI 4-stage impactor; polycarbonate membranes (25 mm diameter and 0.1 μm nominal porosity) were used as substrate for the first three stages (1–2.5, 2.5–10, and >10 µm), while a Teflon filter collected the sub-micrometric particles (<1 µm) in the last stage). The sampling flow rate was 1.7 m3h–1 and for all the samplings they were kept constant thanks to a continuous pressure and temperature monitoring.
The first TECORA SkyPost collected PM10 sampled for 24 h on Teflon filters (Pall R2PJ047). The PM10 collection efficiency is reported and described in Ferrero et al. [8]. Here, we briefly resume the concept and we refer to the above quoted publication. PM10, which is usually described as the mass concentration of PM having aerodynamic diameters below 10 µm, is more precisely defined as the mass concentration of the PM collected with a ~50% efficiency at 10 µm of aerodynamic diameter following the European/EPA regulations. As the collection efficiency represents the probability that a particle would be collected onto the filter, PM10 may contain particles larger than the ‘cut off’ aerodynamic diameter of 10 µm as reported in Ferrero et al. [8]. They were conditioned for 48 h (at 25 °C and 50% relative humidity) before and after the sampling. After conditioning, filters were weighted by a 5-digit microbalance (Sartorius ME235P) with a reproducibility error lower than 5% (experimentally evaluated) [40]. Those 24 h Teflon PM10 samples were analyzed to determine the water-soluble ionic fraction. Half of each filter was extracted for 20 min, by ultrasonic bath, in 10 mL of ultrapure water (Milli-Q, 18.3 MΩ cm resistivity). Inorganic and organic anions together with inorganic cations were measured by a triple Dionex ion-chromatography system, equipped with electrochemical-suppressed conductivity detectors. A Dionex AS4A-4 mm analytical column with a 1.8 mM Na2CO3/1.7 mM NaHCO3 eluent, was used for anions (Cl–, NO3–, SO42–, C2O42–) while a Dionex AS11 separation column with a gradient elution (0.075–2.5 mM Na2B4O7 eluent) was used for F- and some organic anions (acetate, glycolate, formate and methanesulfonate) [56,57]. Cations (Na+, NH4+, K+, Mg2+, Ca2+) have been determined by a Dionex CS12A-4 mm analytical column with 20 mM H2SO4 eluent.
The second TECORA SkyPost collected PM10 for 96 h on pre-fired Quartz microfiber filters (chm QF1 grade) to determine organic and elemental carbon. Then, the 96 h Quartz PM10 samples were analyzed to determine the organic carbon (OC) and elemental carbon (EC) by means of a thermo-optical transmission (TOT) method following the NIOSH protocol as reported by Ferrero et al. [40]. From the OC, the organic matter (OM) was determined multiplying the OC by 2.1 [58], typical for remote sites with a large fraction of secondary aerosols. All the filter treatments were carried out under a class-100 laminar-flow hood, in order to prevent any contamination risks.
In addition to the chemical measurements, aerosol optical properties were also determined using a particle soot absorption photometer (PSAP), that allowed the measurement of absorption coefficient (ba) at three wavelengths (440, 530, and 660 nm) [59], and a M903 Nephelometer, measuring the scattering coefficient (bs) at 530 nm, both from Radiance Research. The manufacturer declares a detection limit for the two instruments equal to 0.2 and 1 Mm–1, respectively, but both of them have demonstrated higher performances if specific precautions are taken [60,61]. The PSAP measurements have been corrected for multiple scattering and non-purely absorbing aerosol effects following Haywood and Osborne [62] and the three values at different wavelengths were used to calculate the Ångström absorption exponent (AAE). The combination of absorption and scattering properties allows the evaluation of the single scattering albedo (SSA) at 530 nm. Both these two quantities are intensive properties of the particles. The AAE is the slope of the absorption coefficient vs. wavelength on a log-log scale and is related both to size, age, and carbonaceous content of the particles [63]. SSA is evaluated as scattering over extinction (scattering plus absorption) and is related to the overall fraction of absorbing elements in the aerosols [64]. Being the two derived quantities, their accuracy strongly depends on the absolute ba and bs values. It is worth noting here that the measured aerosol properties should be considered to pertain to dry conditions, due to the exsiccation they experience entering the instruments. If the environmental original relative humidity is above about 60%, this leads to a decrease in the scattering coefficient and in turn affects also SSA.
2.2.2. Columnar Integrated Data
The AOD and related parameters were measured using sun photometers, which provide column integrated aerosol multi-wavelength extinction of the solar radiation through the atmosphere using the Langley method. These values are measured within the VIS and near-IR parts of the solar spectrum [65]. From sun photometer measurements several important aerosol optical parameters can be obtained, including: aerosol optical depth (AOD), Ångström exponent (AE), and the asymmetry parameter (g). AODs obtained from Hornsund and Ny-Ålesund were acquired with Cimel sun photometers: CE-318 and CE-318-T, respectively operated within the AERONET network. These sun and sky radiometers are equipped with spectral interference filters centered at the following wavelengths: 340, 380, 440, 500, 670, 870, 1020, and 1640 nm [66,67,68]. These instruments work in real time with a time-resolution of 15 min in free-cloud conditions [67]. The AOD measurement uncertainty at level 2.0 for the Cimel sun photometer is ±0.01–0.02 [68].
While sun photometers placed in Hornsund and Ny-Ålesund allowed to acquire continuous time-series of measurements at a fixed location, data obtained on board of r/v Oceania were supposed to complement the stationary measurements with data from different locations around Svalbard. Microtops II sun photometers were used due to their high accuracy and easy use (hand-held devices) for measurements of aerosol optical depth, irradiance (direct) at different wavelengths as well as water vapor column. The instruments provided AOD measurements at 5 channels: 440, 500, 675, 870, and 936 nm. AOD measurements obtained using Microtops II were taken as routines of 5 single measurements, which lasted around 1 min (~10 s for a single measurement run), that followed the AERONET procedures and the measurement uncertainty is less than ±0.02 [69]. In the described study 1.5 and 2.0 level data were considered and for analyses we used the lowest value out of these routine set of 5 measurements, connected to least error.
Finally, all of these parameters have been supported by the additional data, such as optical thickness of clouds, satellite AOD, cloud fraction from MODIS (moderate resolution imaging spectroradiometer), which widely used for analyzing the aerosol distributions from regional to global scales [70]. The MODIS sensors take ~5 min to collect a ~2300 km scene during the overpass [8,71] that, occurs two timed a day (~10.30 and ~13.30) above Svalbard region. MODIS data are gridded for aerosol particles to a 10 × 10 km resolution, while for clouds, to a 5 × 5 km resolution. We have used level 2.0 data [72,73,74,75].
2.2.3. Vertically Resolved Data
The Koldeway Aerosol Raman Lidar (KARL) was operating within the Atmosphere Observatory of the German Base in Ny-Ålesund. The lidar is managed by the Alfred Wegener Institute for Polar and Marine Research in Potsdam. KARL is a “3β+2α+2δ+2wv” Raman-lidar, which measures aerosols at 3 wavelengths (355, 32, and 1064 nm); backscatter coefficient (β) and extinction coefficient (α) are measured at 2 wavelengths (355 and 532 nm); the depolarization (δ) in another 2 colors (407 and 660 nm); and the water vapor (WV) [75]. Due to the high-level (~600 m) overlap of the Raman lidar also data from a CHM-15 Ceilometer (from Lufft), operating at 1064 nm, was also considered in this work. The Ceilometer has a resolution of 15 m, from 30 m to 15 km altitude (with vertical resolution of 15 m) [76]. Even though ceilometers are most often applied in cloud measurements, they have been used to study vertical distribution of aerosol optical properties and they can also be applied (using time integration techniques) to estimate total sky coverage and they can show the presence of aerosol plumes.
In addition to KARL and ceilometer measurements (continuous in time but at a fixed location), a set of additional data was acquired from the CALIPSO products—the Lidar Images, Version 4.10 [77,78]. These data include information about 532 nm total (parallel + perpendicular) attenuated backscatter, 532 nm perpendicular attenuated backscatter, depolarization ratio and aerosol subtype chosen based on the orbit tracks. The CALIPSO orbit tracks overpass the investigated region (Svalbard) from 2 to 3 times a day, while surrounding region—over 6 times a day, thus providing a complementary, spatially resolved information.
2.2.4. Preparation of Modelled Datasets
Climate models, such as NAAPS [79] or CAMS [80,81] were also used to simulate aerosol features in order to fulfill the spatial description of the BB events.
The Navy Aerosol Analysis and Prediction System (NAAPS) is a system used for the prediction of the distribution of aerosols in the troposphere. The modified version of the model is fed with global meteorological fields from the Navy Operational Global Atmospheric Prediction System (NOGAPS) [82] analyses and forecasts on a 1° × 1° degree grid. Results are provided at 6 h intervals and 24 vertical levels reaching 100 mb (12 levels for initial runs then 18 levels beginning 1998.06.24.12 and 24 levels beginning 2002.09.17.00.) Current features of the NAAPS model include [80]: the use of operational dynamics (e.g., ‘REAL’ weather), a forecast of 120 h, a near-real-time operation, global coverage, dust and smoke simulations.
Full information on meteorological data (wind speed and wind direction, precipitation, air pressure, cloudiness, including dominating cloud types, relative humidity, and horizontal visibility) were obtained from the World Meteorological Organization (WMO) stations in Hornsund (01003), Ny-Ålesund (01007) and Longyearbyen (01008). We separated wind directions into 16 classes (with a 22.5° step).
The FLEXPART (“FLEXible PARTicle dispersion model”) model has been applied to describe air mass paths (with a 1° × 1° grid) at vertical levels not exceeding 3000 m a.s.l. This was made in polar stereographic projection.
The Copernicus Atmosphere Monitoring Service (CAMS) model, which was used to simulate aerosol features has originated from the EU Global Earth-system Monitoring using Space and in-situ data (in short: GEMS) as well a series of Monitoring Atmospheric Composition and Climate (MACC) programs of the European Centre for Medium-Range Weather Forecast (ECMWF). The CAMS provides reanalysis of the AODs (550 nm) and atmospheric aerosol composition for 5 types of tropospheric aerosol particles: sea salt, sulphates, dust, black carbon, and organic matter.
3. Results
A detailed description of the obtained results begins here with a description of the biomass burning event (Section 3.1), which is followed by a description of the chemical tracers and related optical properties measured at ground in Ny-Ålesund (Section 3.2). Then the BB impact on aerosol optical properties in the atmospheric column is addressed (Section 3.3).
3.1. Biomass Burning Events
At the beginning of July 2017, the Canadian wildfire season started reaching just half of the intensity registered during the last 10 years of activity (Canadian Wildland Fire Information System) [83]. However, later in July those fires spread and 24 fires were recorded and the area burned increased rapidly. By mid-August, over 1000 separate fires had been recorded and the burned area grew to almost 9000 km2. In addition, no precipitation was observed (Canadian Wildland Fire Information System) [83]. On 21 August 2017, a large number of independent fires merged into a single large wildfire covering an area of 4674 km2 in size. By late August 2017, the fire activity begun to recede, however, its effects (smoke and dust) were still observed in September 2017 (Figure 1). Additionally, a wildfire in Greenland was spotted by satellites on 31 July 2017 and it was burning some 40 miles from the Greenland ice sheet (Figure 2) [84,85].
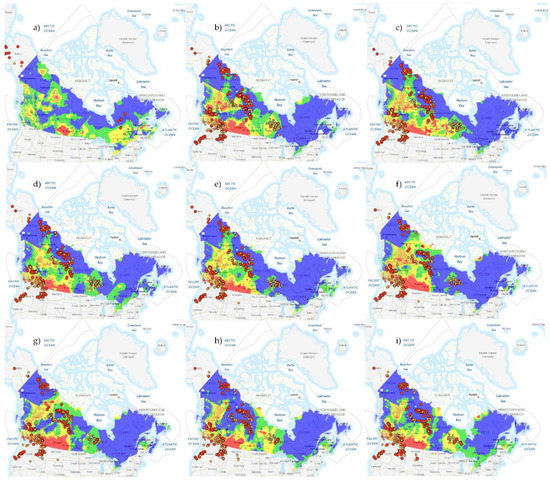
Figure 1.
Daily active fire and fire danger hotspots provided by the Canadian Wildland Fire Information System based on the AVHRR, MODIS and VIIRS satellite observations for 13 June (a), 19 August (b), 20 August (c), 21 August (d), 22 August (e), 23 August (f), 24 August (g), 25 August (h), and 26 August (i) of 2017. Active Fires: 0 to 100 Ha (small yellow dots), 101 to 1000 Ha (medium orange dots), >1000 Ha (big red dots). Fire Danger: Low (blue areas), Moderate (green areas), High (yellow areas), Very High (orange areas), Extreme (red areas).
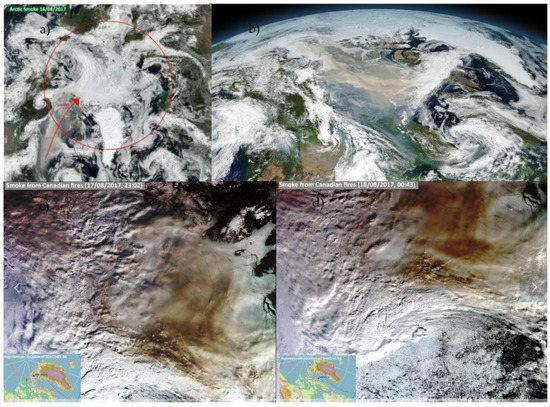
Figure 2.
Smoke from the Canadian wildfires being transported towards the Arctic (a) VIIRS instrument on Suom-NPP on 16 August 2017, (b) VIIRS instrument on Suom-NPP on 15 August 2017, and (c,d) OLCI instrument on Sentinel 3 17–18 August 2017.
These BB events generated huge quantities of aerosols, whose atmospheric transport was observed between 28 July and 26 August 2017 in the Arctic (Section 3.2 and Section 3.3). According to the NASA database, the Visible Infrared Imaging Radiometer Suite (VIIRS) on the Suomi NPP satellite captured particularly heavy smoke originating in northern Canada as of August 15 and 16, 2017, which was transported to the Arctic over Greenland (Figure 2).
In order to confirm the source regions of the aerosol particles transported over Svalbard during the BB events, air mass trajectories were calculated at altitudes of 500, 1000, and 1500 m a.s.l., using the FLEXPART model (Figure S1).
The trajectories have been calculated for a period between 18 and 26 August 2017. The results are presented in Figure S1 and they demonstrate that in August 2017, Greenland and Canada wildfires were the sources of aerosols whose evolution and properties are discussed hereinafter.
3.2. Chemical Speciation and Optical Properties at Ground-Level (Svalbard)
During the entire August 2017, an ensemble of aerosol in-situ chemical and optical measurements were carried out at the Gruvebadet station in Ny-Ålesund. These measurements are representative of the portion of the atmospheric aerosols that can reach the surface as demonstrated by vertical aerosol profiles measured at Gruvebadet station using a tethered balloon system since 2011 [8,37,86,87,88]. Atmospheric PM10 concentrations and the related chemical composition, measured at Gruvebadet are presented in Figure 3 and Figure 4.
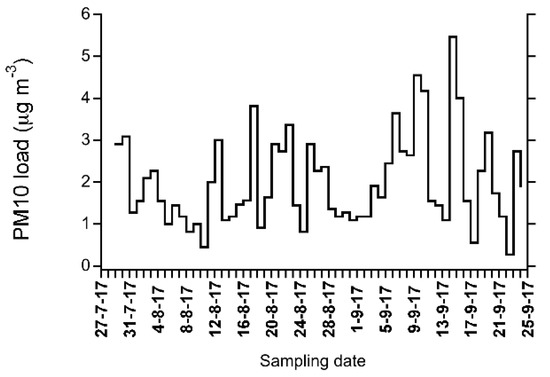
Figure 3.
Daily mean concentrations of PM10 concentration between 10 August and 15 September 2017 measured at the Gruvebadet station (Ny-Ålesund).
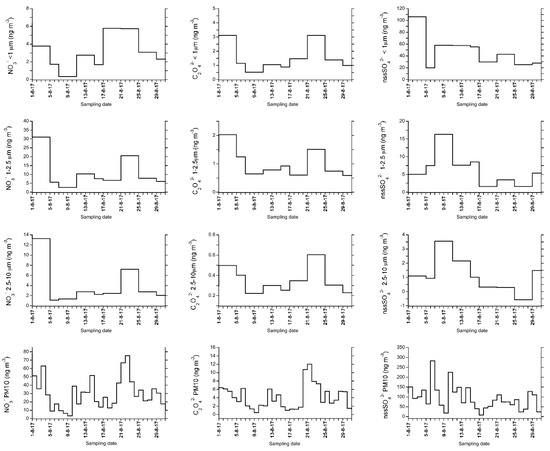
Figure 4.
Concentration vs. time profile of nitrate, oxalate, and non-sea salt sulphate in size-segregated and bulk PM10 aerosol at Gruvebadet in the period 28 July 2017–24 September 2017.
Figure 4 shows the temporal profile of PM10 concentrations measured at Gruvebadet with daily resolution [89] in the period from 28 July to 24 September 2017. While, a number of peaks can be observed in this period, none, especially that of 20–24 August, appears to be influenced by BB aerosol. In fact, the largest atmospheric load was measured between 5–9 September and 13–17 September and peaks of similar intensity can be also seen in previous and following days making this parameter not discriminating for possible BB events. However, these results suggest to investigate the aerosol chemical composition and the vertical aerosol structure to understand both the presence of chemical tracers of BB and the location of maximum concentrations of the transported plumes (see Section 3.3).
Focusing on the chemical composition, additional information appears. In this respect, Figure 4 reports the temporal behavior of three chemical species that can be used as markers of BB (nitrate and oxalate) and of transport from anthropic areas (non-sea salt sulphate, nssSO42–). They were analyzed both in bulk PM10 samples and size-segregated aerosols (<1, 10–2.5, and 2.5–1 µm; Section 2.2). Both nitrate and oxalate exhibit a peak in the 21–24 August period, in all the size fractions as well as in bulk PM10. This represents the second largest peak in August–September, with 6–9 September being characterized by the highest concentration of both markers in each class, except for the sub micrometric one, where the two peaks (20–24 August and 5–9 September) are comparable in intensity. Since the 21–24 August peak does not appear in the nssSO42– profile (while the 6–9 September increase is clearly visible), it is likely that the two concentration enhancements are related to two different transport events in terms of source region. Indeed, nssSO42- usually marks “haze” from lower latitude areas characterized by a higher anthropic impact while nitrates and oxalates are more closely linked to combustion processes and related chemical reactions during long-range transport [40,56,90].
Ratios between average concentration of each determined chemical species and PM10 load in bulk and size-segregated aerosol during the event are presented in Figure 5 below.
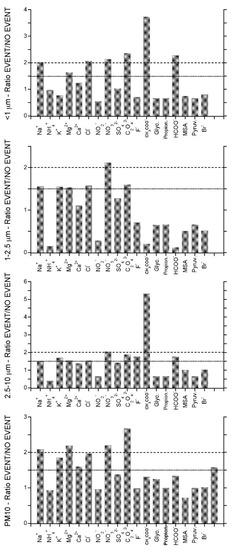
Figure 5.
Ratios between average concentration of each determined chemical species and PM10 load in bulk and size-segregated aerosol during the event (20–23 August 2017) and in the rest of the month. The dotted line marks increases of 50%, while the dashed line indicates 100% enhancements.
In order to highlight possible differences in chemical composition of aerosols collected during the event (20–23 August 2017) and in the previous and following days, here we show the ratio between corresponding averages for each of the measured species.
Figure 5 shows that, among all of the measured chemical markers, the ones more related to biomass burning processes show the highest ratios in the period 20–23 August, when compared with the rest of August. In particular, both nitrate and oxalate show the largest enhancements, with ratios above 2 for the submicrometric fraction and bulk PM10 and ratios above 1.5 for 1–2.5 and 2.5–10 μm for oxalate. Nitrate alone exhibit marked increases in all size classes. Interestingly, other components that can be associated with combustion processes as an intermediate product, acetates, and formate, show substantial enhancements in selected size classes. In particular formate shows an increase larger than 100% in the submicron size range and acetate show very high enhancements in two size classes, <1 μm (increase of about 350%) and 2.5–10 μm (increase of about 500%).
Among the analyzed ionic markers, K+ is often used as a proxy of biomass burning processes, and it actually shows an increase during the event, with respect to the rest of the month, in all the size classes, except for the submicrometric one. Except for this size fraction in fact, K+ concentration is more than 50% higher than the average of the rest of the month. Nevertheless, it is likely that in this case such an enhancement is due to the arrival of marine air masses, also delivering the products of the biomass burning event. Indeed, together with the markers of biomass burning, also typically primary marine components (Na+, Cl–, Mg2+, K+) show notable increases, with ratios above 1.5 and in a few cases also above 2 (Na+ and Cl– in submicrometric fraction, Na+ and Mg2+ in bulk PM10). This support the hypothesis that air masses supplying the products of biomass burning probably travelled at low altitudes over the ocean, for a relatively long time. It is likely that air masses delivering the products of biomass burning were enriched in primary marine aerosols, probably travelling at low altitudes over the ocean, for a relatively long time as also demonstrated by back trajectories reported in Figure 4.
As mentioned above, also PM10 load exhibits an increase during the event, with a ratio above 1.5. By this general look at the chemical composition “inside” and “outside” the event, we can conclude that aerosol chemistry studies in Ny-Ålesund can provide information on biomass burning events through concentration peaks of specific markers, especially nitrate and oxalate. Nevertheless, the chemical signature for this event cannot be completely defined at this stage, showing also a role of acetate and formate, in selected size classes. These results suggest that the biomass burning aerosols are quite inhomogeneous in terms of chemical composition.
All of the aforementioned data highlighted the impact of BB at ground level. Simultaneously, aerosol optical properties (i.e., scattering and absorption coefficients) were measured at ground in the same site. Their temporal behavior for the entire for the period between 27 July and 24 September 2017 is reported in Figure 6. It is particularly evident that the scattering and absorption coefficients were quite stable till the beginning of September (around 2 ± 1 Mm–1 for bs and lower than 0.05 Mm–1 for ba). Only narrow peaks of ba were detected during August, with the exception of the 10–12 August period, when it reached values above 0.4 Mm–1 for a relatively long period (almost one day). This corresponds well with the mid-August period when over 1000 separate fires had been recorded in Canada and the burned area grew to almost 9000 km2 (Section 3.1). Moreover, a second significant absorption peak (again up to 0.6 Mm−1) was recorded in the period between 21 and 23 August, which is in agreement with the Canadian fire development when a large number of independent fires merged into a single larger wildfire covering an area of 4674 km2 in size (Section 3.1). During neither of these episodes, the increasing of the aerosol absorption was concurrent with an increase in the scattering, indicating an increase of the fraction of radiation-absorbing particles, like BB ones. This is confirmed also by the SSA values, dropping down to values well below 0.9, from the average background value above 0.95. After the beginning of September, very high values of bs (up to 15 Mm–1 on 14–15 September) and ba (up to 0.4 Mm–1 for more than one day on the 5–6 September) were measured. Despite these high values, only the first one (5–6 September) should be partly associated with a BB event, showing a SSA value slightly below the usual one, while during the second period (14–15 September) SSA remained stable above 0.95. On the overall considered period, AAE didn’t give meaningful information on the relative contribution of different types carbonaceous particles, presenting very scattered values not correlated with the BB intrusions.
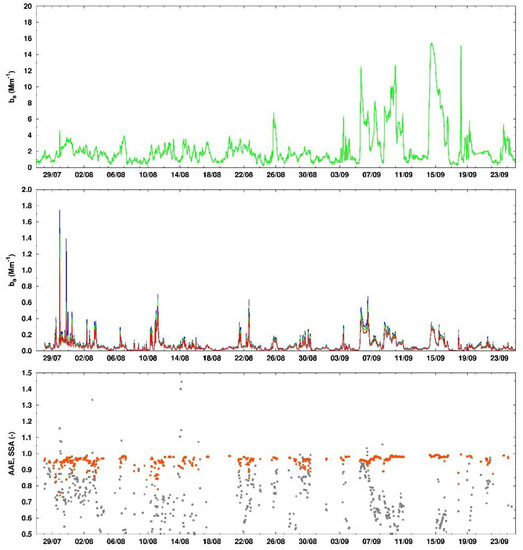
Figure 6.
Hourly values of scattering (upper panel) and absorption (middle panel, blue = 440 nm, green = 530 nm, red = 660 nm) coefficients measured between 27 July and 24 September 2017 at the Gruvebadet laboratory (Ny-Ålesund) from Nephelometer M903 and PSAP. The bottom panel shows Ångström absorption exponent (AAE) (green) and SSA (red) values obtained for ba greater than 0.05 Mm–1.
The ground-based data (chemical and optical) have been impacted by BB aerosols even though Ny-Ålesund is often affected by local micrometeorology [91]. It has been previously demonstrated that high altitude long range transport events may be driven to the ground trough atmospheric boundary layer dynamics [40]. However, as reported by Warneke et al. [92], layers of biomass burning aerosols are often present above the top of the inversion layer. Due to the magnitude of the Canadian and Greenland wildfires, the ground-based values suggested to also investigate the presence of aerosol layers aloft in the atmosphere, and the results are discussed below.
3.3. Optical Impact in the Arctic: Vertical and Columnar Measurements
In order to highlight the impact of BB events in the Arctic, summer background aerosol conditions are recalled first as a base-line level for comparison. Svalbard summers are usually characterized by long periods of high cloudiness and fairly common precipitation episodes [93]. Usual summer values of AOD should not exceed 0.1 at 500 nm [47]. Such situation was observed at the beginning of summer and until early August 2017 in the investigated region. Particularly, average daily AOD values (500 nm) measured onboard r/v Oceania between June and early August 2017 varied from 0.032 to 0.067. Unfortunately, due to long cloudiness periods over the ocean, only very few data could be acquired from sun photometer measurements from board of r/v Oceania in the study period. Lidar based measurements, carried out using the AWI KARL lidar (Ny-Ålesund—June 2017) also showed a small presence of aerosol particles in the air above Svalbard (Figure S2) confirming the representativeness of the investigated Arctic summer prior to the BB events (details in Supplementary Material).
Moving from the background conditions prior the Canadian/Greenland fires towards August (when the BB events were measured at ground, Section 3.2) both the columnar values of AOD and the vertical structure of aerosols appeared seriously impacted.
Looking at the distribution (both temporal and spatial) of AOD at 500 nm based on AERONET data it is clear what magnitude the biomass burning had in summer 2017 in the Arctic region. Table 1 shows AOD data for the investigated period, available from AERONET. All the reported values exceeded 0.15 and reached values up to 2.1 near the source region at Churchill underlying the spatial impact of such wildfires.

Table 1.
AERONET stations located near or beyond the polar circle with August 2017 daily average aerosol optical depth (AOD) data.
The AERONET based AODs for the period of early August up to the end of the month show that the AODs at stations located close to or in Canada present very high daily average values and some are clearly a few days ahead of the event observation in the Svalbard region. Increased values of AOD in Ny-Ålesund at all wavelengths started on 18/19 August 2017. Elevated values of AODs are then registered in Sodankylä and Andenes a few days after the Svalbard observation of the event. An interesting case is attributed to 19 August over r/v Oceania (not in the table), who was west of Spitsbergen. Very low values of AOD were registered using a Microtops II sun photometer during the entire day and the daily average AOD at 500 nm amounted to 0.075. The smoke plume was just outside the range of Oceania measurements while at the same time the AOD values at 500 nm in other locations showed significant increase starting 19 August.
Focusing on Ny-Ålesund and Hornsund AOD values, during transport events, two outbreaks occurred in August over the low aerosol background typical of the Arctic area (<0.05 at 550 nm). The first pronounced peak occurred between 20 and 22 August. The AOD values (at 500 nm) recorded in Hornsund exhibit a sharp increase on 21 August (Figure 7a), reaching the maximum close to 0.4. Unfortunately, cloudy conditions occurred during the BB event in Ny-Ålesund and thus only few measurements were made at that period (Figure 7b). However, they reached values up to 0.5 suggesting that the BB plume affected the whole archipelago. Later, in the middle of September (between 14 and 17), there is an increase in AOD levels at both sites. In this case, data from Hornsund are cloud contaminated until 17 September (Figure 7c), when the AOD (at 500 nm) is beyond 0.2. In Ny-Ålesund (see Figure 7d), there is a value increase on 14 September but clouds also appeared again. These later September peaks relate to the last BB events in Canada.
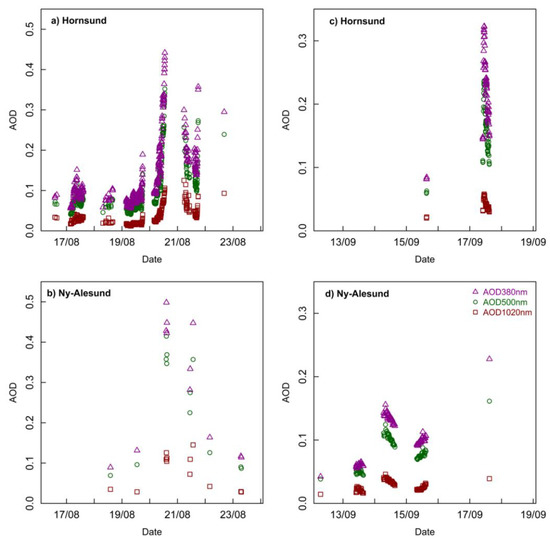
Figure 7.
AOD time series retrievals from Hybrid Sky Scan inversions [94] during the summer 2017 biomass burning (BB) events at two AERONET sites in Spitsbergen. (a,b) depict AOD values measured in August 2017 in Hornsund and Ny-Ålesund, respectively. (c,d) show AOD values measured in September 2017 in Hornsund and Ny-Ålesund, respectively.
The analysis of the Ångström Exponent together with AOD suggested the presence of very highly concentrated, tiny, particles in the atmosphere. Figure 8 reports the Ångström Exponent (α) vs AOD (500 nm) for both sites and for the two BB aerosol episodes identified in August 2017. The α-AOD scatter plot presents important features. First, the characteristics of the BB episode in August are similar at both sites, in spite of the low number of data in Ny-Ålesund. Most important, the largest AOD values occurred simultaneously with large α values (close to 1.5), thus indicating presence of small particles. With respect to the September episode, the data of the first two days (14–15 September) in Ny-Ålesund present α values between 1.3 and 1.6 meanwhile values in Hornsund two days after (17 September) show values around 1.8. This could be an indicator of two different intrusions occurring during the same days or a change in the aerosol properties.
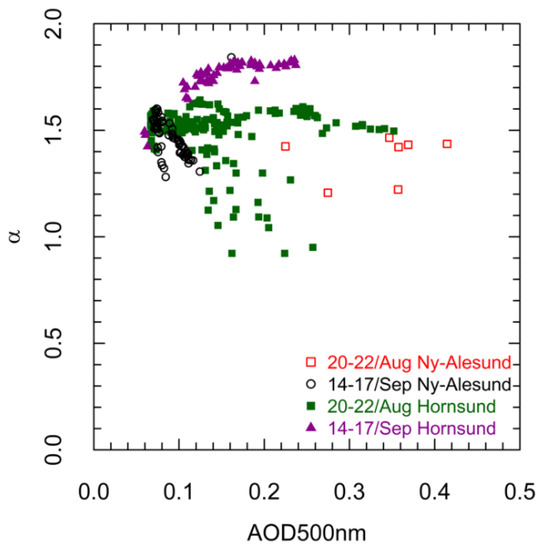
Figure 8.
Ångström exponent (α) vs. aerosol optical depth at 500 nm (AOD 500 nm) retrievals form Hybrid Sky Scan inversions [94] at two AERONET sites in Spitsbergen.
In addition, looking at the columnar size distribution of aerosol particles measured over Hornsund during the August event (Figure 9a), aerosol volume increased in the fine fraction along the day while the coarse mode was unaffected, which is in agreement with a BB signature, especially because the volume mode radius shifted from 0.15 to 0.26 µm along with aerosol size increasing due to both aging and condensation of organic material. Moreover, single scattering albedo (SSA; Figure 9b) decreased, especially in the infrared region (from 0.75 to 0.7) very sensible to an increase of the absorbing black carbon fraction generated by the event. The absolute values of SSA at different wavelengths were very low for the Arctic (below 0.85) stressing the absorbing nature of aerosols loaded along the atmospheric column and in agreement with ground-based observations reported in Figure 6. Finally, the asymmetry parameter (Figure 9c) increased along the day describing a situation in which the forward scattering was slightly enhanced by the volume mode radius increasing (Figure 9a).
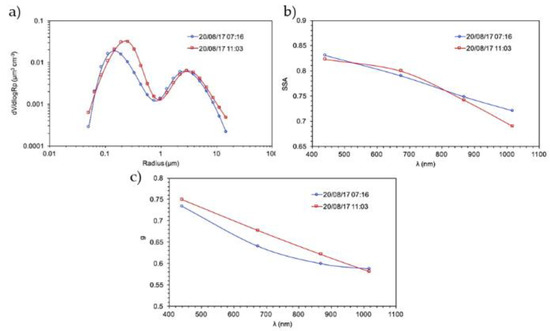
Figure 9.
AERONET based results of particle size distribution (a), single scattering albedo (b) and asymmetry parameter (c) obtained from Cimel sun photometer during the aerosol event over Hornsund.
Due to the weather related relatively small number of sun photometer data, we have run both NAAPS and CAMS models to obtain results to describe spatial distribution of the BB plume over the Arctic. Figure 10 reports simulations from the NAAPS aerosol transport model for selected days in August 2017. The results confirm that the sources of aerosols detected over Svalbard were located in Canada and Greenland but, most important, the BB smoke plume (blue color) was spreading from over Canada and/or Greenland towards Svalbard region on each of the investigated days. Air mass transport from Canada and Greenland towards Svalbard was observed during the entire BB event in July and August 2017 at all altitudes a.s.l. (Figure 10). Moreover, the CAMS model provided optical property results for the entire August and for all locations. The results clearly show a plume of aerosols generated around Canada and spreading towards the Arctic region, including Svalbard on 18 August 2017 (Figure 11).
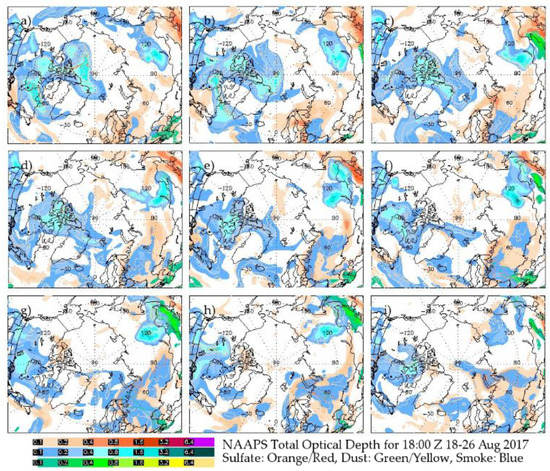
Figure 10.
NAAPS Total Optical Depth, aerosol smoke over Spitsbergen in (a) 18:00 UTC 18 August, (b) 18:00 UTC 19 August, (c) 18:00 UTC 20 August, (d) 18:00 UTC 21 August, (e) 18:00 UTC 22 August, (f) 18:00 UTC 23 August, (g) 18:00 UTC 24 August, (h) 18:00 UTC 25 August, and (i) 18:00 UTC 26 August 2017.
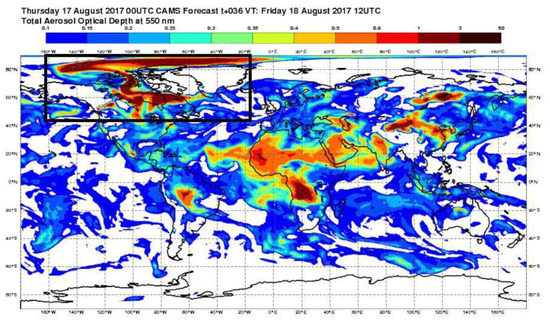
Figure 11.
CAMS forecast of Total Aerosol Optical Depth at 550 nm for 18 August 2017.
Values of aerosol optical depth presented in Figure 12 and calculated for Ny-Ålesund and Hornsund between 16 and 27 August 2017 (550 nm) show relatively low values between 17 and 19 August (below 0.1) at both locations and then a dramatic increase between 19/20 and 26 August 2017 (up to 1). There is a distinct shift in time, which is obvious due to the location of both stations, Ny-Ålesund is further north, thus an aerosol event started there earlier than in the southern station of Hornsund (Figure 12). The AOD values reached their peak at c. 0.9 (550 nm) on 22/23 August (Figure 12). Comparison with chemical components from the CAMS model shows that during events parameters connected to the BB episodes, especially BC and OM were showing increasingly higher values simultaneously with increasing AOD, while non-anthropogenic component—SS gets lower. The dust component associated with small particles confirms changes in chemistry of atmosphere during the BB event. Domination of OM component (up to 65%) is simultaneous with decreasing participation of SS between 22 and 27 August (1%–3%) at both locations (Figure 13 and Figure 14).
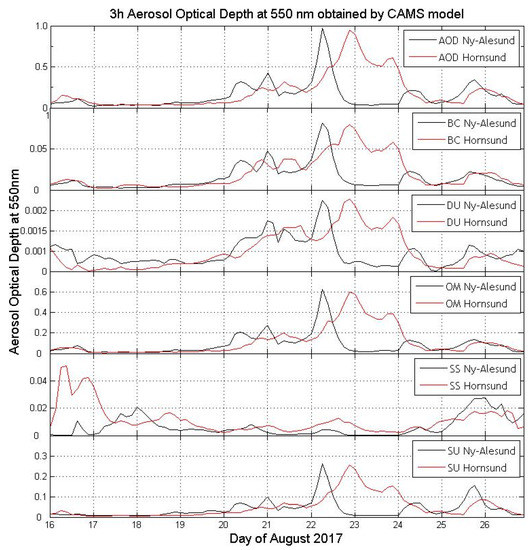
Figure 12.
3 h Aerosol Optical Depth at 550 nm and 5 chemical components of Aerosol Optical Depth at 550 nm: black Carbon (BC), dust (DU), organic matter (OM), sea salt (SS), and sulphate (SU) in Hornsund (red lines) and Ny-Ålesund (black lines) between 16 and 27 August 2017.
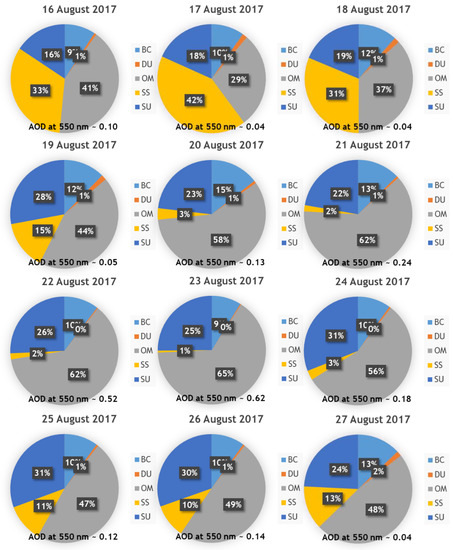
Figure 13.
Daily percentage of each chemical component at 550 nm aerosol optical depth in Hornsund between 16 and 27 August 2017 compared with aerosol optical depth at 550 nm.
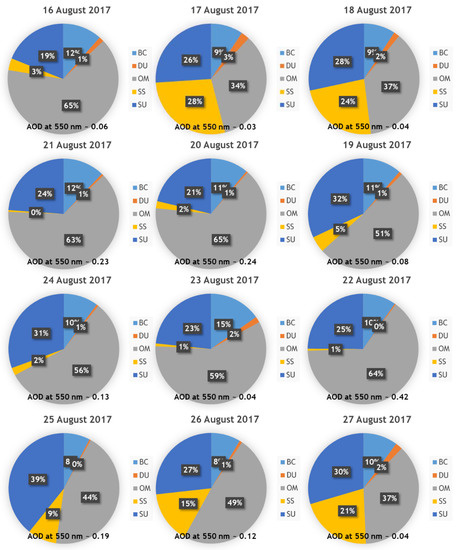
Figure 14.
Daily percentage of each chemical component at 550 nm Aerosol Optical Depth in Ny-Ålesund between 16 and 27 August 2017 compared with Aerosol Optical Depth at 550 nm.
The CAMS model provides AOD values every three hours. As AERONET instantaneous data cannot match with that time resolution, the modelled values have been temporally interpolated with the two closest model points. A simple linear evolution is assumed in the 3 h step. In this way, all the experimental points recorded by AERONET can be used in the assessment of the model. This improves the statistics and the significance of the results obtained. To assess model calculations, the statistical methods explained by Willmot [95] are considered.
The CAMS modeling AOD results with distinction to 5 aerosol chemical components are presented in Figure 13 and Figure 14.
Results presented in Figure 14 clearly show an increasing role of organic matter in the composition of aerosols between 16 and 27 August in Hornsund. On 16 and 17 August sea salt was still a dominating component (33% to 42%) and starting on 18 August it was organic matter that took over in the aerosol composition and on 18 August its percentage was 37 and it reached its peak on 21 August with 65% which related to a very high AOD (500 nm) of 0.62. Also, the role of sulphate and black carbon was increasing starting 18 August and it peaked around 21 August. This indicates the presence of BB aerosols over the region. The same pattern is clear in Figure 14, where the same data are presented for Ny-Ålesund.
The European Arctic presents very low AOD values which can be a major source of discrepancies between model and experimental data. Conditions of AOD (550 nm) <0.10 are well characterized by the two techniques. When the aerosol load increases in experimental values model data increase too. In most of the cases, the slope of the increase is close to the 1:1 line. The largest discrepancy occurs in Hornsund when AERONET data notably increase until 0.3 meanwhile modelled values are still below 0.1.
A comparison of AOD values (550 nm) from CAMS model vs. AOD (550 nm) experimental data from AERONET (level 2.0) is presented in Figure 15. The value for AERONET at that wavelength is calculated using as input the measured AOD value at 500 nm and the Ångström coefficient. The 1:1 line is also given in the plot. In general, the CAMS model compares quite well to the observational data if the sparse meteorological information in the Arctic is considered. Only for a few cases for Hornsund, the model underestimates the air pollution. The mean bias error (MBE) and mean absolute bias error (MABE) present values below 0.03 and 0.05, respectively. The root mean square error (RMSE) also shows low values below 0.06 at both sites. The index of agreement (d) between both variables is very high, >0.95. There is a good agreement between measurements and model using 1154 and 182 points in the evaluations for Hornsund and Ny-Ålesund, respectively. Further evaluations with a larger number of points in a longer time should improve the statistics of this comparison.
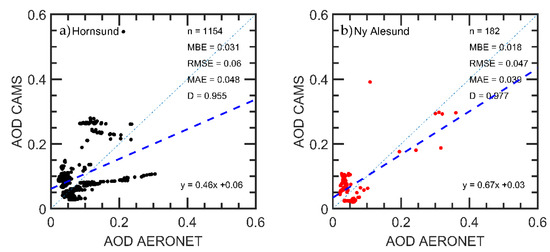
Figure 15.
Scatterplot of AOD by CAMS models vs. AOD by AERONET level 2.0 data in two sites: (a) Hornsund and (b) Ny-Ålesund. Dashed blue lines are the linear fits.
Moving from the columnar properties to the vertical aerosol structure, during the BB event, ceilometer (Lufft CHM-15k) measurements were made between 19 and 21 August 2017. Results are presented in Figure 16. The plot shows multiple aerosol layers at altitudes up to 8 km a.s.l. These layers are mostly pronounced on 20/21 August, which is in agreement with AOD values measured by sun photometers in Hornsund.
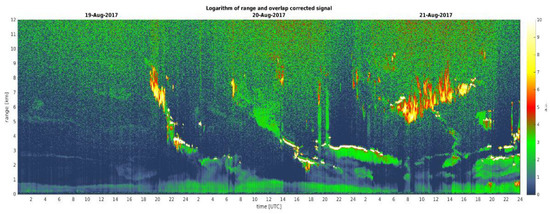
Figure 16.
Logarithm of range and overlap corrected signal obtained from ceilometer measurements in Hornsund between 19 and 21 August 2017.
This result is very important when considering that the same type of aerosols can produce different climatic effects (warming or cooling) and local feedbacks (snow/ice albedo, clouds) depending on its vertical location [95,96,97,98,99,100,101]. For example, even counterintuitive, if BC is located in the free troposphere it may reduce the surface air temperature and promote the increase in the sea-ice fraction. However, it may potentially warm the Arctic if it is located immediately close to the ground, [98,100,101] as described in Section 3.2.
4. Discussion and Conclusions
In this paper, the authors present the results of aerosol studies over the European part of the Arctic, with special emphasis on the Svalbard region. The results refer to the summer 2017 (July-September) biomass burning episode which took place in Canada and Greenland. Special attention is given to the middle August, when the episode had the greatest strength, however, we provide some hints that the September part of the episode could have been also very significant.
The peak of the BB event, in case of the Svalbard region, took place around 18–21 August 2017. The analyses of air mass back trajectories show that in this period air masses were blown to Svalbard from over Canada and Greenland. This is also supported by the analyses made with the NAAPS aerosol transport model.
Measurements made with an ensemble of various instruments reveled that this aerosol episode was one of the worst cases in last decade [45,46,51,52,53,54]. Daily averages of level 2.0 aerosol optical depth (500 nm) were as high as over 2.0 (AERONET Churchill station), with values high above 0.2 over Greenland (AERONET stations Narsarsuaq and Kangerlussuaq) while in Spitsbergen they reached values of 0.147 (AERONET Hornsund station). However, momentary values (500 nm) were much higher and could be exceeded e.g., 0.3 in Kangerlussuaq, 0.4 in Ny-Ålesund, or 0.3 in Hornsund. The Ångström Exponent values indicate presence of small particles, presumably of BB origin. This statement is also supported by the absorption, scattering, SSA, and asymmetry parameter analyses for the Spitsbergen studies. These results are also presented for a September period, however, due to not complete analyses the authors leave the potential discussion for a future paper.
The BB aerosol plumes were observed over Hornsund at altitudes up to 8 km a.s.l., with their peak on 20/21 August, which is in agreement with AOD values measured by sunphotometers.
Aerosol analyses of aerosols made at the Gruvebadet laboratory in Ny-Ålesund show that the scattering values are quite homogeneous during August 2017, however, absorption data show several significant peaks throughout August 2017, including the period between 19 and 23 August, associated with absorbing aerosols such as those from biomass burning.
Temporal profiles of PM10 load at Gruvebadet with daily resolution in the period 28 July–24 September 2017 show a number of peaks. Even though an increase in concentration appears in 20–24 August, peaks of similar intensity can be seen also in previous and following days making this parameter not discriminating for possible biomass burning events. However, temporal behavior of two main chemical species that can be used as markers of biomass burning (nitrate and oxalate) show a peak between 21 and 24 August in all the size fractions and in bulk PM10.
Based on the analyses we realize that it is non-trivial to bring ground-based in situ and remote sensing data together, e.g., the pollution pathways in the boundary layer and in the free troposphere may differ. Therefore, we need dedicated campaigns to understand this. A ship, such as e.g., r/v Oceania in situ and with at least Microtops II measurements can be of great help since the boundary layer over the ocean is less disrupted than that in the fjords due to mountain orography, as it is e.g., in Ny-Ålesund.
This biomass burning event was among two worst aerosol events recently reported for Svalbard region (previous in 2015) and the climatic results need further investigations. However, the authors, who were also involved in the 2015 study and previous events, see that the summer biomass burning related aerosol episodes over Svalbard may be becoming a serious threat to the radiative balance of the region, hence may have a serious impact on the strength of the so-called Arctic amplification effect [47].
Supplementary Materials
The following are available online at https://www.mdpi.com/2073-4433/11/1/84/s1, Table S1: List of Instruments used during the study.
Author Contributions
Conceptualization, T.Z., L.F., P.P., C.R., and R.T.; methodology, M.C., S.G., D.M., M.M., M.P., M.S., P.S., and C.V.-M.; validation, M.C., L.F., S.G., G.H., D.M., M.M., P.P., M.P., C.R., M.S., R.T., and C.V.-M.; formal analysis, T.Z., L.F., P.P., and C.R.; investigation, M.C., L.F., S.G., G.H., D.M., M.M., P.P., C.R., M.S., and R.T.; resources, T.Z., E.B., M.C., L.F., S.G., G.H., D.M., M.M., R.N., P.P., M.P., C.R., M.S., P.S., R.T., and C.V.-M.; data curation, T.Z., L.F., G.H., D.M., M.M., P.P., C.R., and R.T.; writing—original draft preparation, T.Z.; writing—review and editing, T.Z., L.F., D.M., P.P., C.R., and R.T.; visualization, T.Z., E.B., M.C., L.F., S.G., G.H., D.M., M.M., R.N., P.P., M.P., C.R., M.S., P.S., R.T., and C.V.-M.; supervision, T.Z., L.F., P.P., and C.R.; project administration, T.Z. and P.P. All authors have read and agreed to the published version of the manuscript.
Funding
This research received no external funding.
Acknowledgments
We gratefully acknowledge the GEMMA Center input in the framework of Project MIUR – Dipartimenti di Eccellenza 2018–2022.We are grateful to AERONET PIs and we acknowledge Brent Holben, Piotr Sobolewski and Norm O’Neill for the use of the data from AERONET station. We acknowledge the MAN PIs: Brent Holben, Larysa Istomina, Carlos Duarte, Andreas Macke and Patricia Quinn. The authors thank the PIs of the Maritime Aerosol Network.The authors thank for support provided by the AWIPEV station personnel.The authors would like to acknowledge personnel of the Polish Polar Station Hornsund for maintenance of equipment.We acknowledge CAMS project, funded under the Regulation (EU) No 377/2014 of the European Parliament and of the Council of 3 April 2014 establishing the Copernicus Programme (“the Copernicus Regulation”), and operated by ECMWF under an agreement with the European Commission dated 11 November 2014 (“ECMWF Agreement”) for provided data. The authors would like to acknowledge the MODIS mission scientists and associated NASA personnel for the production of the data used in this research effort. The authors would also like to thank D. Westphal from the Naval Research Laboratory in Monterey for providing the NAAPS model input (http://www.nrlmry.navy.mil/aerosol/). Logistic assistance of the Polar Support Unit of the CNR (Italian National Research Council) Department of Earth and Environment (POLARNET) in coordinating the activities based at the Dirigibile Italia Arctic station at Ny-Ålesund is acknowledged.
Conflicts of Interest
The authors declare no conflict of interest. The funders had no role in the design of the study; in the collection, analyses, or interpretation of data; in the writing of the manuscript, or in the decision to publish the results.
References
- Global Warming of 1.5 ºC. Available online: https://www.ipcc.ch/sr15/ (accessed on 7 January 2020).
- Moritz, M.A.; Parisien, M.A.; Batllori, E.; Krawchuk, M.A.; Van Dorn, J.; Ganz, D.J.; Hayhoe, K. Climate change and disruptions to global fire activity. Ecosphere 2012, 3, 1–22. [Google Scholar] [CrossRef]
- Gillett, N.P.; Weaver, A.J.; Zwiers, F.W.; Flannigan, M.D. Detecting the effect of climate change on Canadian forest fires. Geophys. Res. Lett. 2004, 31, L18211. [Google Scholar] [CrossRef]
- Alonso-Blanco, E.; Calvo, A.I.; Pont, V.; Mallet, M.; Fraile, R.; Castro, A. Impact of Biomass Burning on Aerosol Size Distribution, Aerosol Optical Properties and Associated Radiative Forcing. Aerosol Air Qual. Res. 2014, 14, 708–724. [Google Scholar] [CrossRef]
- Xinghua, L.; Junzan, H.; Hopke, P.K.; Hu, J.; Shu, Q.; Chang, Q.; Ying, Q. Quantifying primary and secondary humic-like substances in urbanaerosol based on emission source characterization and asource-oriented air quality model. Atmos. Chem. Phys. 2013, 19, 2327–2341. [Google Scholar]
- Andreae, M.O.; Merlet, P. Emission of trace gases and aerosols from biomass burning. Glob. Biogeochem. Cycles 2001, 15, 955–966. [Google Scholar] [CrossRef]
- Eck, T.F.; Holben, B.N.; Ward, D.E.; Dubovik, O.; Reid, J.S.; Smirnov, A.; Mukelabai, M.M.; Hsu, N.C.; O’Neill, N.T.; Slutsker, I. Characterization of the optical properties of biomass burning aerosols in Zambia during the 1997 ZIBBEE field campaign. J. Geophys. Res. Atmos. 2001, 106, 3425–3448. [Google Scholar] [CrossRef]
- Ferrero, L.; Riccio, A.; Ferrini, B.S.; D’Angelo, L.; Rovelli, G.; Casati, M.; Angelini, F.; Barnaba, F.; Gobbi, G.P.; Cataldi, M.; et al. Satellite AOD conversion into ground PM10, PM2.5 and PM1 over the Po Valley (Milan, Italy) exploiting information on aerosol vertical profiles, chemistry, hygroscopicity and meteorology. Atmos. Pollut. Res. 2019, 10, 1895–1912. [Google Scholar] [CrossRef]
- Ferrero, L.; Ritter, C.; Cappelletti, D.; Moroni, B.; Močnik, G.; Mazzola, M.; Lupi, A.; Becagli, S.; Traversi, R.; Cataldi, M.; et al. Aerosol optical properties in the Arctic: The role of aerosol chemistry and dust composition in a closure experiment between Lidar and tethered balloon vertical profiles. Sci. Total. Environ. 2019, 686, 452–467. [Google Scholar] [CrossRef]
- Crutzen, P.J.; Heidt, L.E.; Krasnec, J.P.; Pollock, W.H.; Seiler, W. Biomass burning as a source of atmospheric gases CO, H2, N2O, NO, CH3Cl and COS. Nature 1979, 282, 253–256. [Google Scholar] [CrossRef]
- Torres, O.; Bhartia, P.K.; Herman, J.R.; Ahmad, Z.; Gleason, J. Derivation of aerosol properties from satellite measurements of backscattered ultraviolet radiation: Theoretical basis. J. Geophys. Res. Atmos. 1998, 103, 17099–17110. [Google Scholar] [CrossRef]
- Torres, O.; Tanskanen, A.; Veihelmann, B.; Ahn, C.; Braak, R.; Bhartia, P.; Veefkind, P.; Levelt, P. Aerosols and surface UV products from Ozone Monitoring Instrument observations: An overview. J. Geophys. Res. Atmos. 2007, 112. [Google Scholar] [CrossRef]
- Langenfelds, R.L.; Francey, R.J.; Pak, B.C.; Steele, L.P.; Lloyd, J.; Trudinger, C.M.; Allison, C.E. Interannual growth rate variations of atmospheric CO2 and its δ13C, H2, CH4, and CO between 1992 and 1999 linked to biomass burning. Glob. Biogeochem. Cycles 2002, 16, 1048. [Google Scholar] [CrossRef]
- Page, S.E.; Siegert, F.; Rieley, J.O.; Boehm, H.D.V.; Jaya, A.; Limin, S. The amount of carbon released from peat and forest fires in Indonesia during 1997. Nature 2002, 420, 61–65. [Google Scholar] [CrossRef] [PubMed]
- Beringer, J.; Hutley, L.B.; Tapper, N.J.; Coutts, A.; Kerley, A.; O’Grady, A.P. Fire impacts on surface heat, moisture and carbon fluxes from a tropical savanna in northern Australia. Int. J. Wildland Fire 2003, 12, 333–340. [Google Scholar] [CrossRef]
- Pakszys, P.; Zieliński, T. Aerosol optical properties over Svalbard: A comparison between Ny-Ålesund and Hornsund. Oceanologia 2017, 59, 431–444. [Google Scholar] [CrossRef]
- Graber, E.R.; Rudich, Y. Atmospheric HULIS: How humic-like are they? A comprehensive and critical review. Atmos. Chem. Phys. 2006, 6, 729–753. [Google Scholar] [CrossRef]
- Kirchstetter, T.W.; Novakov, T.; Hobbs, P.V. Evidence that the spectral dependence of light absorption by aerosols is affected by organic carbon. J. Geophys. Res. 2004, 109. [Google Scholar] [CrossRef]
- Crutzen, P.J.; Andreae, M.O. Biomass burning in the tropics: Impact on atmospheric chemistry and biogeochemical cycles. Science 1990, 250, 1669–1678. [Google Scholar] [CrossRef]
- Jacobson, M.Z. Effects of biomass burning on climate, accounting for heat and moisture fluxes, black and brown carbon, and cloud absorption effects. J. Geophys. Res. 2014, 119, 8980–9002. [Google Scholar] [CrossRef]
- Bougiatioti, A.; Argyrouli, A.; Solomos, S.; Vratolis, S.; Eleftheriadis, K.; Papayannis, A.; Nenes, A. CCN Activity, Variability and Influence on Droplet Formation during the HygrA-Cd Campaign in Athens. Atmosphere 2017, 8, 108. [Google Scholar] [CrossRef]
- Wang, C. Impact of direct radiative forcing of black carbon aerosols on tropical convective precipitation. Geophys. Res. Lett. 2007, 34. [Google Scholar] [CrossRef]
- Ferrero, L.; Močnik, G.; Cogliati, S.; Gregorič, A.; Colombo, R.; Bolzacchini, E. Heating rate of light absorbing aerosols: Time-resolved measurements and source-identification. Environ. Sci. Technol. 2018, 52, 3546–3555. [Google Scholar] [CrossRef] [PubMed]
- Martins, L.D.; Hallak, R.; Alves, R.C.; de Almeida, D.S.; Squizzato, R.; Moreira, C.A.; Beal, A.; da Silvia, I.; Rudke, A.; Martins, J.A. Long-range transport of aerosols from biomass burning over southeastern south America and their implications on air quality. AAQR 2018, 18, 1734–1745. [Google Scholar] [CrossRef]
- Fromm, M.; Torres, O.; Diner, D.; Lindsey, D.; Vant Hull, B.; Servranckx, R.; Shettle, E.P.; Li, Z. Stratospheric impact of the Chisholm pyrocumulonimbus eruption: 1. Earth-viewing satellite perspective. J. Geophys. Res. 2008, 113. [Google Scholar] [CrossRef]
- Deboudt, K.; Flament, P.; Choel, M.; Gloter, A.; Sobanska, S.; Colliex, C. Mixing state of aerosols and direct observation of carbonaceous and marine coatings on African dust by individual particle analysis. J. Geophys. Res. 2010, 115. [Google Scholar] [CrossRef]
- Pratt, K.A.; Prather, K.A. Aircraft measurements of vertical profiles of aerosol mixing states. J. Geophys. Res. 2010, 115. [Google Scholar] [CrossRef]
- Bond, T.C.; Doherty, S.J.; Fahey, D.W.; Forster, P.M.; Berntsen, T.; DeAngelo, B.J.; Flanner, M.G.; Ghan, S.; Kärcher, B.; Koch, D.; et al. Bounding the role of black carbon in the climate system: A scientific assessment. J. Geophys. Res. Atmos. 2013, 118, 5380–5552. [Google Scholar] [CrossRef]
- Hara, K.; Yamagata, S.; Yamanouchi, T.; Sato, K.; Herber, A.; Iwasaka, Y.; Nagatani, M.; Nakada, A. Mixing states of individual aerosol particles in spring Arctic troposphere during ASTAR 2000 campaign. J. Geophys. Res. 2003, 108. [Google Scholar] [CrossRef]
- Schwarz, J.P.; Gao, R.S.; Spackman, J.R.; Watts, L.A.; Thomson, D.S.; Fahey, D.W.; Ryerson, T.B.; Peischl, J.; Holloway, J.S.; Trainer, M.; et al. Measurement of the mixing state, mass, and optical size of individual black carbon particles in urban and biomass burning emissions. Geophys. Res. Lett. 2008, 35. [Google Scholar] [CrossRef]
- Twohy, C.H.; Anderson, J.R. Droplet nuclei in non-precipitating clouds: Composition and size matter. Environ. Res. Lett. 2008, 3, 045002. [Google Scholar] [CrossRef]
- Kondo, Y. Effects of black carbon on climate: Advances in measurement and modelling. Monographs on Environment. Earth Planets 2015, 3, 1–85. [Google Scholar] [CrossRef]
- Koo, J.H.; Choi, T.; Cho, Y.; Lee, H.; Kim, J.; Ahn, D.H.; Kim, J.; Lee, Y.G. The Variation in Aerosol Optical Depth over the Polar Stations of Korea. AAQR 2018, 18, 3202–3210. [Google Scholar] [CrossRef]
- Quinn, P.K.; Bates, T.S.; Baum, E.; Doubleday, N.; Fiore, M.; Flanner, M.; Fridlind, A.; Garrett, T.J.; Koch, D.; Menon, S.; et al. Short-lived pollutants in the Arctic: Their climate impact and possible mitigation strategies. Atmos. Chem. Phys. 2008, 8, 1723–1735. [Google Scholar] [CrossRef]
- Eckhardt, S.; Hermansen, O.; Grythe, H.; Fiebig, M.; Stebel, K.; Cassiani, M.; Baecklund, A.; Stohl, A. The influence of cruise ship emissions on air pollution in Svalbard—A harbinger of a more polluted Arctic? Atmos. Chem. Phys. 2013, 13, 8401–8409. [Google Scholar] [CrossRef]
- Stohl, A. Characteristics of atmospheric transport into the Arctic troposphere. J. Geophys. Res. 2006, 111. [Google Scholar] [CrossRef]
- Zielinski, T.; Petelski, T.; Strzałkowska, A.; Pakszys, P.; Makuch, P. Impact of wild forest fires in Eastern Europe on aerosol composition and particle optical properties. Oceanologia 2016, 58, 13–24. [Google Scholar] [CrossRef]
- Pakszys, P.; Zieliński, T.; Markowicz, K.; Petelski, T.; Makuch, P.; Lisok, J.; Chiliński, M.; Rozwadowska, A.; Ritter, C.; Neuber, R.; et al. Annual Changes of Aerosol Optical Depth and Ångström Exponent over Spitsbergen. In Impact of Climate Changes on Marine Environments; Springer: Cham, Switzerland, 2015; pp. 23–36. [Google Scholar]
- Corbett, J.J.; Lack, D.A.; Winebrake, J.J.; Harder, S.; Silberman, J.A.; Gold, M. Arctic shipping emissions inventories and future scenarios. Atmos. Chem. Phys. 2010, 10, 9689–9704. [Google Scholar] [CrossRef]
- Ferrero, L.; Cappelletti, D.; Busetto, M.; Mazzola, M.; Lupi, A.; Lanconelli, C.; Becagli, S.; Traversi, R.; Caiazzo, L.; Giardi, F.; et al. Vertical profiles of aerosol and black carbon in the Arctic: A seasonal phenomenology along 2 years (2011–2012) of field campaigns. Atmos. Chem. Phys. 2016, 16, 12601–12629. [Google Scholar] [CrossRef]
- Mtetwa, L.; McCormick, M.P. Development of BB Gaseous and Particulate Emissions Database for Assimilation into Air Quality Forecast Systems. In Proceedings of the AGU, Washington, DC, USA, December 2003. A22B-1062. [Google Scholar]
- Westerling, A.L.; Hidalgo, H.G.; Cayan, D.R.; Swetnam, T.W. Warming and earlier spring increase western U.S. forest wildfire activity. Science 2006, 313, 940–943. [Google Scholar] [CrossRef]
- Brönnimann, S.; Ewen, T.; Luterbacher, J.; Diaz, H.F.; Stolarski, R.S.; Neu, U. A Focus on Climate During the Past 100 Years. In Climate Variability and Extremes During the Past 100 Years; Springer: Dordrecht, The Netherlands, 2008; Volume 100, pp. 1–25. [Google Scholar] [CrossRef]
- Turetsky, M.R.; Kane, E.S.; Harden, J.W.; Ottmar, R.D.; Manies, K.L. Recent acceleration of BB and carbon losses in Alaskan forests and peatlands. Nat. Geosci. 2011, 4, 27–31. [Google Scholar] [CrossRef]
- Markowicz, K.M.; Chilinski, M.; Lisok, J.; Zawadzka, O.; Janicka, L.; Stachlewska, I.; Makuch, P.; Pakszys, P.; Rozwadowska, A.; Petelski, T.; et al. Study of aerosol optical properties during long-range transport of biomass burning from Canada to Central Europe in July 2013. J. Aerosol Sci. 2016, 101, 156–173. [Google Scholar] [CrossRef]
- Markowicz, K.M.; Pakszys, P.; Ritter, C.; Zielinski, T.; Udisti, R.; Cappelletti, D.; Mazolla, M.; Shiobara, M.; Xian, P.; Zawadzka, O.; et al. Impact of North American intense fires on aerosol optical properties measured over the European Arctic in July 2015. J. Geophys. Res. Atmos. 2016, 121, 14487–14512. [Google Scholar] [CrossRef]
- Pakszys, P. Horizontal Variability of Aerosol Optical Properties over the European Arctic. Ph.D. Thesis, Institute of Oceanology Polish Academy of Sciences, Sopot, Poland, 2018. [Google Scholar]
- Zangrando, R.; Barbaro, E.; Zennaro, P.; Rossi, S.; Kehrwald, N.M.; Gabrieli, J.; Barbante, C.; Gambaro, A. Molecular markers of biomass burning in Arctic aerosols. Environ. Sci. Technol. 2013, 47, 8565–8574. [Google Scholar] [CrossRef] [PubMed]
- Stohl, A.; Berg, T.; Burkhart, J.F.; Fjǽraa, A.M.; Forster, C.; Herber, A.; Hov, Ø.; Lunder, C.; McMillan, W.W.; Oltmans, S.; et al. Arctic smoke–record high air pollution levels in the European Arctic due to agricultural fires in Eastern Europe in spring 2006. Atmos. Chem. Phys. 2007, 7, 511–534. [Google Scholar] [CrossRef]
- Warneke, C.; Bahreini, R.; Brioude, J.; Brock, C.A.; De Gouw, J.A.; Fahey, D.W.; Froyd, K.D.; Holloway, J.S.; Middlebrook, A.; Miller, L.; et al. Biomass burning in Siberia and Kazakhstan as an important source for haze over the Alaskan Arctic in April 2008. Geophys. Res. Lett. 2009, 36. [Google Scholar] [CrossRef]
- Markowicz, K.M.; Zielinski, T.; Pietruczuk, A.; Posyniak, M.; Zawadzka, O.; Makuch, P.; Stachlewska, I.; Jagodnicka, A.K.; Petelski, T.; Kumala, W.; et al. Remote sensing measurements of the volcanic ash plume over Poland in April 2010. Atmos. Environ. 2012, 48, 66–75. [Google Scholar] [CrossRef]
- Markowicz, K.M.; Zielinski, T.; Blindheim, S.; Gausa, M.; Jagodnicka, A.K.; Kardaś, A.; Kumala, W.; Malinowski, S.P.; Petelski, T.; Posyniak, M.; et al. Study of vertical structure of aerosol optical properties with sun photometers and ceilometer during the MACRON campaign in 2007. Acta Geophys. 2012, 60, 1308–1337. [Google Scholar] [CrossRef]
- Marelle, L.; Raut, J.-C.; Thomas, J.; Law, K.S.; Quennehen, B.; Ancellet, G.; Pelon, J.; Schwarzenboeck, A.; Fast, J.D. Transport of anthropogenic and biomass burning aerosols from Europe to the Arctic during spring 2008. Atmos. Chem. Phys. 2015, 15, 3831–3850. [Google Scholar] [CrossRef]
- Ansmann, A.; Baars, H.; Chudnovsky, A.; Mattis, I.; Veselovskii, I.; Haarig, M.; Seifert, P.; Engelmann, R.; Wandinger, U. Extreme levels of Canadian wildfire smoke in the stratosphere over central Europe on 21–22 August 2017. Atmos. Chem. Phys. 2018, 18, 11831–11845. [Google Scholar] [CrossRef]
- Lisok, J.; Markowicz, K.M.; Ritter, C.; Makuch, P.; Petelski, T.; Chilinski, M.; Kaminski, J.W.; Becagli, S.; Traversi, R.; Udisti, R.; et al. 2014 iAREA campaign on aerosol in Spitsbergen–Part 1: Study of physical and chemical properties. Atmos. Environ. 2016, 140, 150–166. [Google Scholar] [CrossRef]
- Udisti, R.; Bazzano, A.; Becagli, S.; Bolzacchini, E.; Caiazzo, L.; Cappelletti, D.; Ferrero, L.; Frosini, D.; Giardi, F.; Grotti, M.; et al. Sulfate source apportionment in the Ny-Ålesund (Svalbard Islands) Arctic aerosol. Rendiconti Lincei 2016, 27, 85–94. [Google Scholar] [CrossRef]
- Becagli, S.; Ghedini, C.; Peeters, S.; Rottiers, A.; Traversi, R.; Udisti, R.; Chiari, M.; Jalba, A.; Despiau, S.; Dayan, U.; et al. MBAS (Methylene Blue Active Substances) and LAS (Linear Alkylbenzene Sulphonates) in Mediterranean coastal aerosols: Sources and transport processes. Atmos. Environ. 2011, 45, 6788–6801. [Google Scholar] [CrossRef]
- Turpin, B.J.; Lim, H.J. Species contributions to PM2.5 mass concentrations: Revisiting common assumptions for estimating organic mass. AST 2001, 35, 602–610. [Google Scholar] [CrossRef]
- Lack, D.A.; Lovejoy, E.R.; Baynard, T.; Pettersson, A.; Ravishankara, A.R. Aerosol absorption measurement using photoacoustic spectroscopy: Sensitivity, calibration, and uncertainty developments. Aerosol Sci. Technol. 2006, 40, 697–708. [Google Scholar] [CrossRef]
- Müller, T.; Nowak, A.; Wiedensohler, A.; Sheridan, P.; Laborde, M.; Covert, D.S.; Marinoni, A.; Imre, K.; Henzing, B.; Roger, J.-C.; et al. Angular illumination and truncation of three different integrating nephelometers: Implications for empirical, size-based corrections. Aerosol Sci. Technol. 2009, 43, 581–586. [Google Scholar] [CrossRef]
- Müller, T.; Henzing, J.S.; de Leeuw, G.; Wiedensohler, A.; Alastuey, A.; Angelov, H.; Bizjak, M.; Collaud Coen, M.; Engström, J.E.; Gruening, C.; et al. Characterization and intercomparison of aerosol absorption photometers: Result of two intercomparison workshops. Atmos. Meas. Tech. 2011, 4, 245–268. [Google Scholar] [CrossRef]
- Haywood, J.M.; Osborne, S.R. Corrections to be Applied to the Psap and Nephelometer for Accurate Determination of the Absorption Coefficient, Scattering Coefficient and Single Scattering Albedo. In MRF Technical Note, 31; Meteorological Office: Hampshire, UK, 2000. [Google Scholar]
- Qin, Y.M.; Tan, H.B.; Li, Y.J.; Li, Z.J.; Schurman, M.I.; Liu, L.; Wu, C.; Chan, C.K. Chemical characteristics of brown carbon in atmospheric particles at a suburban site near Guangzhou, China. Atmos. Chem. Phys. 2018, 18, 16409–16418. [Google Scholar] [CrossRef]
- Ealo, M.; Alastuey, A.; Ripoll, A.; Pérez, N.; Minguillón, M.C.; Querol, X.; Pandolfi, M. Detection of Saharan dust and biomass burning events using near-real-time intensive aerosol optical properties in the north-western Mediterranean. Atmos. Chem. Phys. 2016, 16, 12567–12586. [Google Scholar] [CrossRef]
- Mazzola, M.; Stone, R.; Herber, A.; Tomasi, C.; Lupi, A.; Vitale, V.; Lanconelli, L.; Toledano, C.; Cachorro, V.; O’Neill, N.; et al. Evaluation of sun photometer capabilities for retrievals of aerosol optical depth at high latitudes: The POLAR-AOD intercomparison campaigns. Atmos. Environ. 2012, 52, 4–17. [Google Scholar] [CrossRef]
- Aerosol Robotic Network (AERONET) Homepage—Nasa. Available online: https://aeronet.gsfc.nasa.gov/ (accessed on 20 July 2018).
- Holben, B.N.; Eck, T.F.; Slutsker, I.; Tanre, D.; Buis, J.P.; Setzer, A.; Vermote, E.; Reagan, J.A.; Kaufman, Y.; Nakajima, T.; et al. AERONET—A federated instrument network and data archive for aerosol characterization. Remote. Sens. Environ. 1998, 66, 1–16. [Google Scholar] [CrossRef]
- Eck, T.F.; Holben, B.N.; Reid, J.S.; Dubovik, O.; Smirnov, A.; O’Neill, N.T.; Slutsker, I.; Kinne, S. Wavelength dependence of the optical depth of biomass burning, urban, and desert dust aerosols. J. Geophys. Res. Atmos. 1999, 104, 31333–31349. [Google Scholar] [CrossRef]
- Knobelspiesse, K.D.; Pietras, C.; Fargion, G.S.; Wang, M.H.; Frouin, R.; Miller, M.A.; Subramaniam, S.; Balch, W.M. Maritime aerosol optical thickness measured by handheld sunphotometers. Remote Sens. Environ. 2004, 93, 87–106. [Google Scholar] [CrossRef]
- Alam, K.; Khan, R.; Sorooshian, A.; Blaschke, T.; Bibi, S.; Bibi, H. Analysis of Aerosol Optical Properties due to a Haze Episode in the Himalayan Foothills: Implications for Climate Forcing. Aerosol Air Qual. Res. 2018, 18, 1331–1350. [Google Scholar] [CrossRef]
- Di Nicolantonio, W.; Cacciari, A.; Petritoli, A.; Carnevale, C.; Pisoni, E.; Volta, M.L.; Stocchi, P.; Curci, G.; Bolzacchini, E.; Ferrero, L.; et al. MODIS and OMI satellite observations supporting air quality monitoring. Radiat. Prot. Dosim. 2009, 137, 280–287. [Google Scholar] [CrossRef] [PubMed]
- Algorithm for Remote Sensing of Tropospheric Aerosol over Dark Targets from MODIS: Collections 005 and 051: Revision 2. February 2009. Available online: https://pdfs.semanticscholar.org/e5f8/fa50577584a2ef9d2ed6417b4156fb9b474b.pdf (accessed on 9 January 2020).
- Levy, R.C.; Remer, L.A.; Kleidman, R.G.; Mattoo, S.; Ichoku, C.; Kahn, R.; Eck, T.F. Global evaluation of the Collection 5 MODIS dark-target aerosol products over land. Atmos. Chem. Phys. 2010, 10, 10399–10420. [Google Scholar] [CrossRef]
- Levy, R.C.; Mattoo, S.; Munchak, L.A.; Remer, L.A.; Sayer, A.M.; Patadia, F.; Hsu, N.C. The Collection 6 MODIS aerosol products over land and ocean. Atmos. Meas. Tech. 2013, 6, 2989. [Google Scholar] [CrossRef]
- Hoffmann, A.; Osterloh, L.; Stone, R.; Lamperta, A.; Ritter, C.; Stock, M.; Tunved, P.; Hennig, T.; Böckmann, C.; Li, S.-M.; et al. Remote sensing and in-situ measurements of tropospheric aerosol, a PAMARCMiP case study. Atmos. Environ. 2012, 52, 56–66. [Google Scholar] [CrossRef]
- Hoffman, A. Comparative Aerosol Studies Based on Multi-Wavelength Raman LIDAR at Ny-Ålesund. Spitsbergen. Ph.D. Thesis, University of Potsdam, Potsdam, Germany, 2011. Available online: http://epic.awi.de/29932/1/Hof2011g.pdf (accessed on 26 July 2018).
- CALIPSO Dataset Quideline. Available online: https://www-calipso.larc.nasa.gov/resources/calipso_users_guide/data_summaries/l1b/CAL_LID_L1-Standard-V4-10.php (accessed on 20 July 2018).
- Kim, M.H.; Omar, A.H.; Tackett, J.L.; Vaughan, M.A.; Winker, D.M.; Trepte, C.R.; Hu, Y.; Liu, Z.; Poole, L.R.; Pitts, M.C.; et al. The CALIPSO version 4 automated aerosol classification and lidar ratio selection algorithm. Atmos. Meas. Tech. 2018, 11, 6107. [Google Scholar] [CrossRef]
- NRL—Naval Research Laboratory—Navy.mil. Available online: http://www.nrlmry.navy.mil (accessed on 20 July 2018).
- Inness, A.; Baier, F.; Benedetti, A.; Bouarar, I.; Chabrillat, S.; Clark, H.; Clerbaux, C.; Coheur, P.; Engelen, R.J.; Errera, Q.; et al. The MACC reanalysis: An 8 yr data set of atmospheric composition. Atmos. Chem. Phys. 2013, 13, 4073–4109. [Google Scholar] [CrossRef]
- Panareda, A.; Remy, S.; Huijnen, V.; Morcrette, J.-J.; Stein, O.; Arteta, J.; Chabrillat, S.; Flemming, J.; Benedetti, A.; Innes, A.; et al. All Contributors to IFS and C-IFS. C-IFS: How Are Developments Integrated? CAMS 1st; General Assembly: Athens, Greece, 2016; pp. 14–16. [Google Scholar]
- Rosmond, T. The Design and Testing of NOGAPS. Weather. Forecast. 1992, 7, 2. [Google Scholar]
- Cwfis—Canadian Wildland Fire Information System. Available online: https://cwfis.cfs.nrcan.gc.ca/home (accessed on 22 July 2018).
- NCEO, The 2017 Canadian Wildfires: A Satellite Perspective. Available online: https://www.nceo.ac.uk/article/the-2017-canadian-wildfires-a-satellite-perspective (accessed on 22 July 2018).
- Mashable, Canada’s Forests are on Fire, and the Smoke is so Thick it’s Breaking Records. Available online: http://mashable.com/2017/08/17/canada-is-on-fire-smoke-record-arctic/#eWPL6lpyPqqn (accessed on 22 July 2018).
- Moroni, B.; Becagli, S.; Bolzacchini, E.; Busetto, M.; Cappelletti, D.; Crocchianti, S.; Ferrero, L.; Frosini, D.; Lanconelli, C.; Lupi, A.; et al. Vertical Profiles and Chemical Properties of Aerosol Particles upon Ny-Ålesund (Svalbard Islands). Adv. Meteorol. 2015, 2015, 1–11. [Google Scholar] [CrossRef]
- Moroni, B.; Cappelletti, D.; Ferrero, L.; Crocchianti, S.; Busetto, M.; Mazzola, M.; Becagli, S.; Traversi, R.; Udisti, R. Local vs. long-range sources of aerosol particles upon Ny-Ålesund (Svalbard Islands): Mineral chemistry and geochemical records. Rendiconti Lincei. Scienze Fisiche e Naturali 2016, 27, 115–127. [Google Scholar] [CrossRef]
- Mazzola, M.; Busetto, M.; Ferrero, L.; Viola, A.; Cappelletti, D. AGAP: An atmospheric gondola for aerosol profiling. Rendiconti Lincei. Scienze Fisiche e Naturali 2016, 27, 105–113. [Google Scholar] [CrossRef]
- Becagli, S.; Lazzara, L.; Marchese, C.; Dayan, U.; Ascanius, S.E.; Cacciani, M.; Caiazzo, L.; Di Biagio, C.; Di Iorio, T.; di Sarra, A.; et al. Relationships linking primary production, sea ice melting, and biogenic aerosol in the Arctic. Atmos. Environ. 2016, 136, 1–15. [Google Scholar] [CrossRef]
- Ferrero, L.; Sangiorgi, G.; Perrone, M.G.; Rizzi, C.; Cataldi, M.; Markuszewski, P.; Pakszys, P.; Makuch, P.; Petelski, T.; Becagli, S.; et al. Chemical Composition of Aerosol over the Arctic Ocean from Summer ARctic EXpedition (AREX) 2011–2012 Cruises: Ions, Amines, Elemental Carbon, Organic Matter, Polycyclic Aromatic Hydrocarbons, n-Alkanes, Metals, and Rare Earth Elements. Atmosphere 2019, 10, 54. [Google Scholar] [CrossRef]
- Vihma, T.; Kilpeläinen, T.; Manninen, M.; Sjöblom, A.; Jakobson, E.; Palo, T.; Jaagus, J.; Maturilli, M. Characteristics of Temperature and Humidity Inversions and Low-Level Jets over Svalbard Fjords in Spring. Adv. Meteorol. 2011, 2011, 1–14. [Google Scholar] [CrossRef]
- Warneke, C.; Froyd, K.D.; Brioude, J.; Bahreini, R.; Brock, C.A.; Cozic, J.; De Gouw, J.A.; Fahey, D.W.; Ferrare, R.; Hol-loway, J.S.; et al. An important contribution to springtime Arctic aerosol from biomass burning in Russia. Geophys. Res. Lett. 2010, 37. [Google Scholar] [CrossRef]
- Maturilli, M.; Ebell, K. Twenty-five years of cloud base height measurements by ceilometer in Ny-Ålesund, Svalbard. Earth Syst. Sci. Data 2018, 10, 1451–1456. [Google Scholar] [CrossRef]
- Dubovik, O.; King, M.D. A flexible inversion algorithm for retrieval of aerosol optical properties from Sun and sky radiance measurements. J. Geophys. Res. Atmos. 2000, 105, 20673–20696. [Google Scholar] [CrossRef]
- Willmott, C.J. Some comments on the evaluation of model performance. Bull. Am. Meteorol. Soc. 1982, 63, 1309–1313. [Google Scholar] [CrossRef]
- Shindell, D.; Faluvegi, G. Climate response to regional radiative forcing during the twentieth century. Nat. Geosci. 2009, 2, 294–300. [Google Scholar] [CrossRef]
- Ban-Weiss, G.A.; Cao, L.; Bala, G.; Caldeira, K. Dependence of climate forcing and response on the altitude of black carbon aerosols. Clim. Dyn. 2011, 38, 897–911. [Google Scholar] [CrossRef]
- Flanner, M.G. Arctic climate sensitivity to local black carbon. J. Geophys. Res. Atmos. 2013, 118, 1840–1851. [Google Scholar] [CrossRef]
- Sand, M.; Berntsen, T.K.; Kay, J.E.; Lamarque, J.F.; Seland, Ø.; Kirkevåg, A. The Arctic response to remote and local forcing of black carbon. Atmos. Chem. Phys. 2013, 13, 211–224. [Google Scholar] [CrossRef]
- Hansen, J.; Nazarenko, L. Soot Climate Forcing via Snow and Ice Albedo. Proc. Natl. Acad. Sci. USA 2004, 101, 423–428. [Google Scholar] [CrossRef]
- Brock, C.A.; Cozic, J.; Bahreini, R.; Froyd, K.D.; Middlebrook, A.M.; McComiskey, A.; Brioude, J.; Cooper, O.R.; Stohl, A.; Aikin, K.C.; et al. Characteristics, sources, and transport of aerosols measured in spring 2008 during the aerosol, radiation, and cloud processes affecting Arctic Climate (ARCPAC) Project. Atmos. Chem. Phys. 2011, 11, 2423–2453. [Google Scholar] [CrossRef]
© 2020 by the authors. Licensee MDPI, Basel, Switzerland. This article is an open access article distributed under the terms and conditions of the Creative Commons Attribution (CC BY) license (http://creativecommons.org/licenses/by/4.0/).