Article

Molecular Distributions and Compound-Specific Stable Carbon Isotopic Compositions of Plant Wax n-Alkanes in Marine Aerosols along a North–South Transect in the Arctic–Northwest Pacific Region

1
Korea Polar Research Institute (KOPRI), 26 Songdomirae-ro, Yeonsu-gu, Incheon 21990, Korea
2
Department of Marine Sciences and Convergent Technology, Hanyang University, 55 Hanyangdaehak-ro, Sangnok-gu, Ansan 15588, Korea
*
Author to whom correspondence should be addressed.
Atmosphere 2020, 11(5), 499; https://doi.org/10.3390/atmos11050499
Submission received: 7 April 2020 / Revised: 29 April 2020 / Accepted: 8 May 2020 / Published: 13 May 2020

Abstract

:
A geographical source of n-alkanes in marine aerosols was assessed along a North–South transect in the Arctic–Northwest Pacific region. Marine aerosol samples were collected during the ARA08 cruise with the R/V Araon between 28 August and 28 September 2017. We investigated molecular distributions of n-alkanes (homologous series of C16 to C34) and compound-specific stable carbon isotopes (δ13C) of n-C27, n-C29, and n-C31. Unresolved complex mixtures (UCM) showed a latitudinal trend from the Arctic Ocean to the northwest Pacific Ocean, highlighting an increasing influence of the plume of polluted air exported from East Asian countries. The anthropogenic input was further evidenced by high U/R ratios (>5) and low CPI17–23 (0.6–1.4). The occurrence of high molecular weight (HMW) n-alkanes with high CPI27–31 (>3) indicated the biogenic input of terrestrial higher plant leaf waxes in all studied samples. The δ13C of HMW n-alkanes was influenced by both the relative contributions from the C3/C4 plant sources and from fossil fuel combustions. The back-trajectory analyses provided evidence that changes in molecular distributions and δ13C of n-alkanes were due to the long-range atmospheric transport of anthropogenic and biogenic organic materials from North American and East Asian countries to the Arctic Ocean and the remote northwest Pacific Ocean, respectively.

1. Introduction

The n-alkanes originate from both anthropogenic and biogenic sources, including petroleum residue [1], biomass burning [2], and terrestrial plant wax, fungi, bacteria, algae, and plankton [3]. High molecular weight (HMW) n-alkanes (>n-C25) are typical land-derived lipid biomarkers which can be carried from adjacent continents to remote oceanic settings by long-range atmospheric transport [4,5,6,7]. Investigations of HMW n-alkanes in marine aerosols have been widely conducted in the Atlantic Ocean [5,8,9], the Pacific Ocean [10,11,12], and the Southern Ocean [11]. HMW n-alkanes are also often found in marine surface sediments close to continental land in the Atlantic Ocean [13,14,15], the Pacific Ocean [16,17], and the Southern Ocean [18], reflecting latitudinal vegetation changes on the continent. Hence, the distributions and isotopic signatures of HMW n-alkanes extracted from marine sediment cores have successfully been used to reconstruct changes in terrestrial vegetation as part of paleoclimatological reconstructions [19,20,21,22,23]. Although long-range atmospheric transport is an important pathway for the land-derived HMW n-alkanes over the Arctic Ocean, there have been very few marine aerosols observed in the Arctic Ocean [24]. In particular, no studies have examined isotopic signatures of HMW n-alkanes in marine aerosols in the Arctic Ocean. Hence, our knowledge of the sources and transport pathways of HMW n-alkanes in marine aerosols is still limited in this body of water.
In this study, we collected marine aerosol samples along a North–South transect in the Arctic–Northwest Pacific region in August and September 2017. This study compares variations in molecular distributions and carbon isotope compositions of HMW n-alkanes in marine aerosols over the Arctic Ocean and the northwest Pacific Ocean by using air-mass back trajectories. This study provides an insight into the potential sources of marine aerosols and the atmospheric transport pathways of land-derived HMW n-alkanes over the Arctic Ocean and the remote northwest Pacific Ocean.

2. Experiments

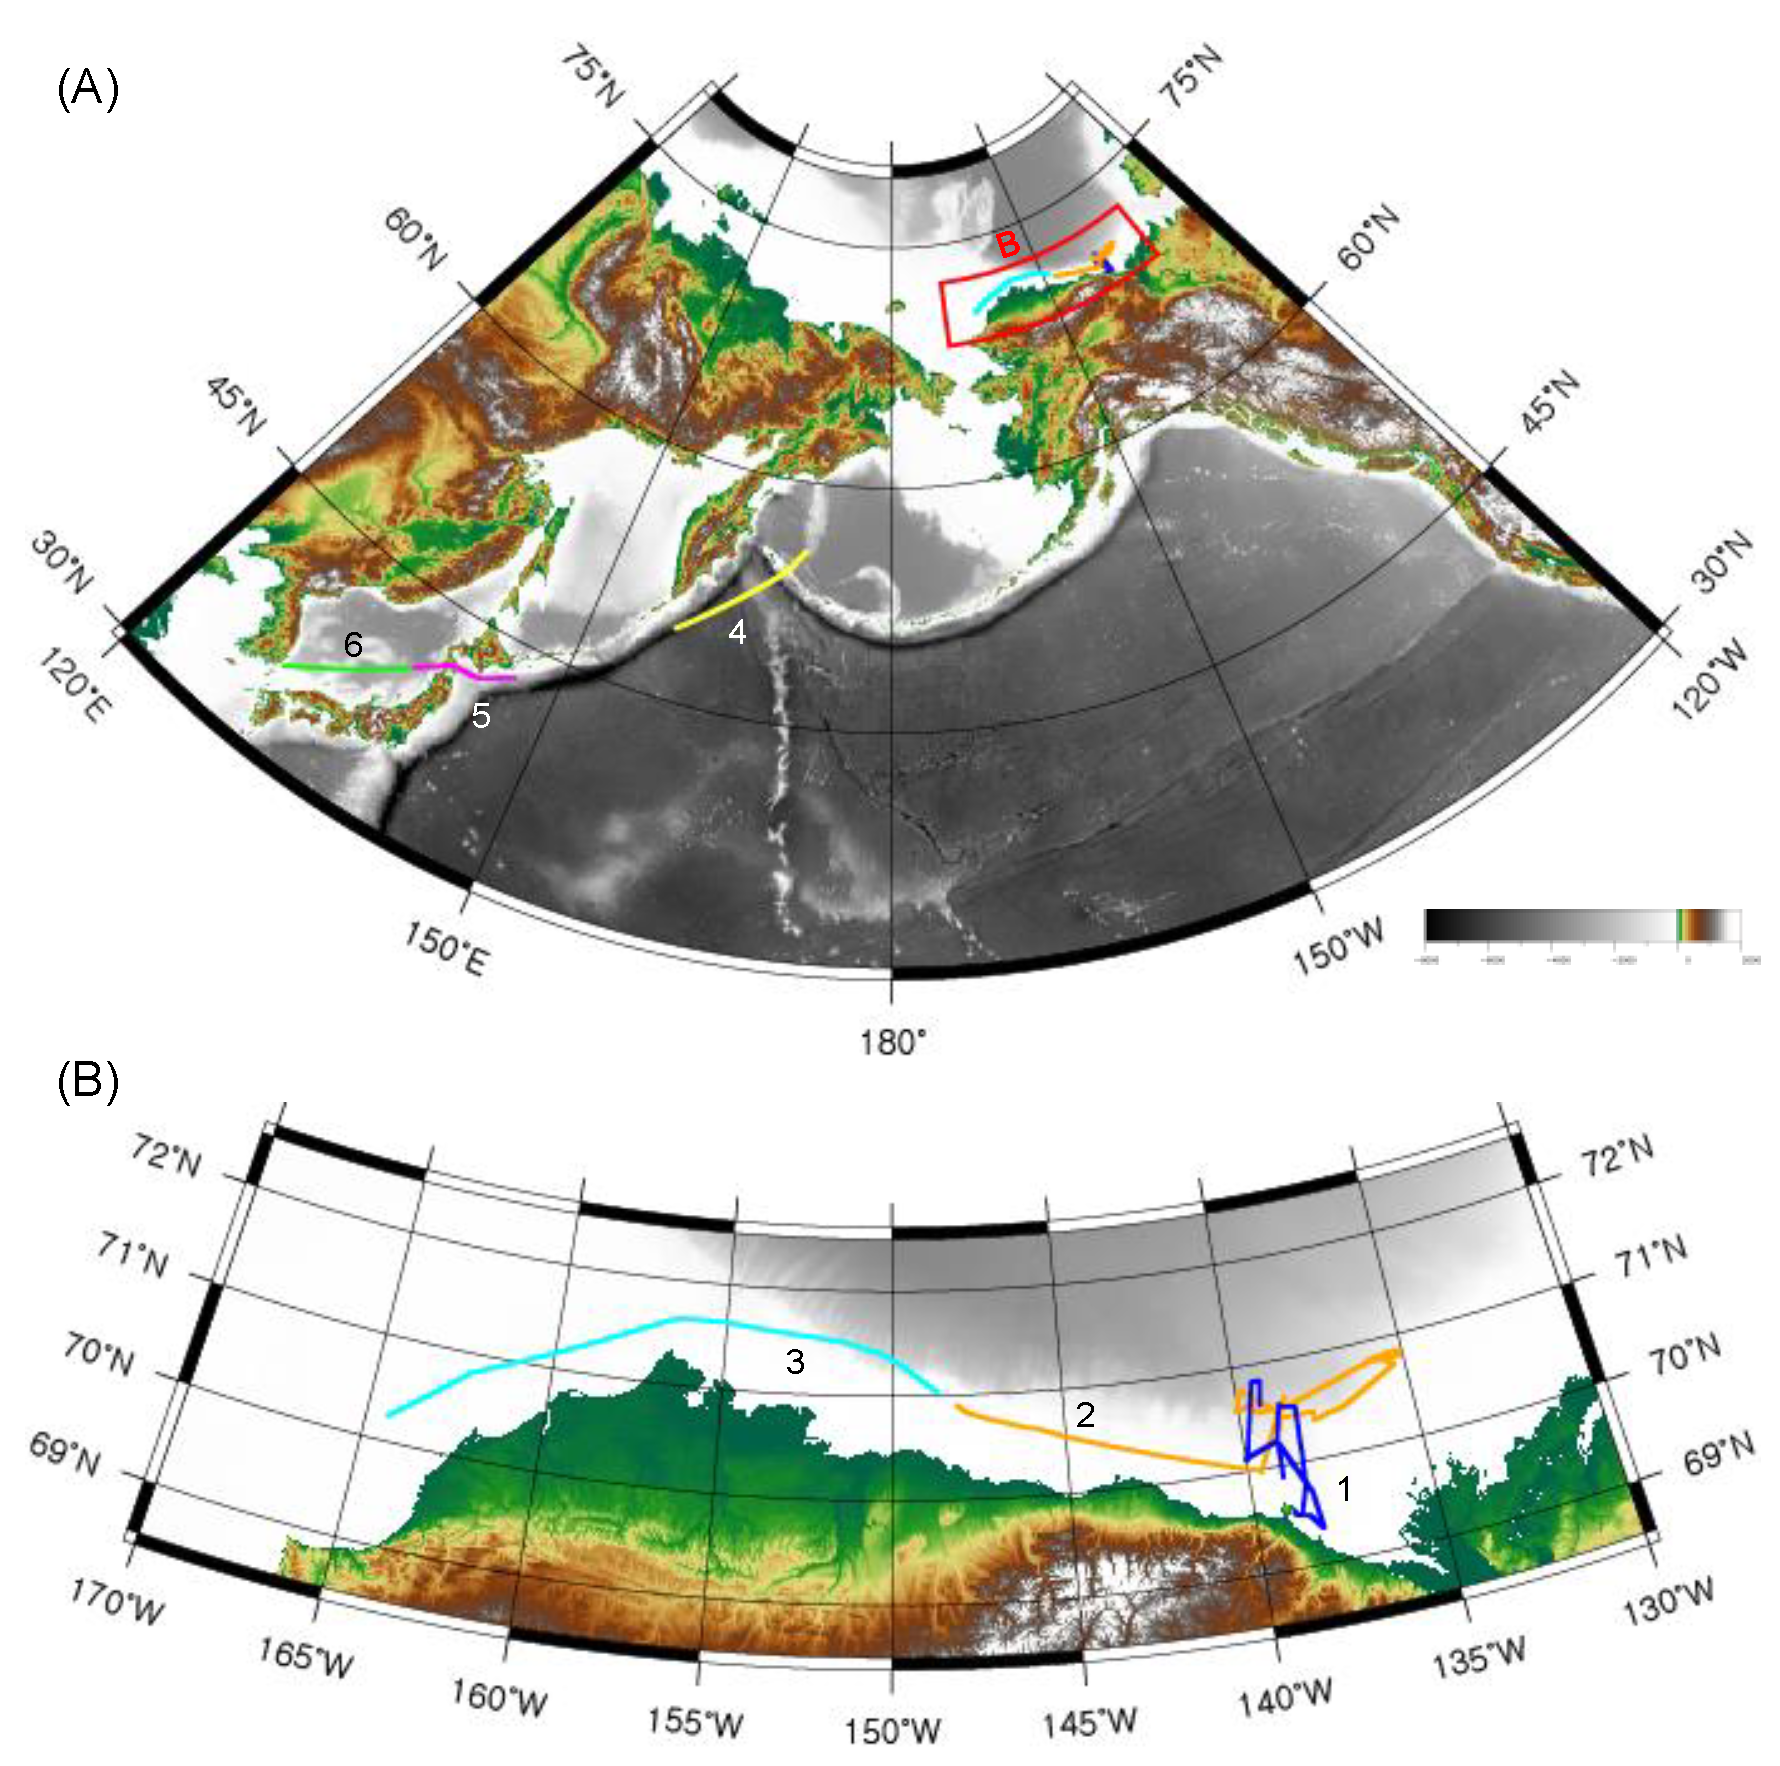
2.1. Aerosol Sample Collection

Six aerosol samples were collected along a North–South transect in the Arctic–Northwest Pacific region during the ARA08 cruise with the R/V Araon between 28 August and 28 September 2017 (Table 1, Figure 1). The sampling conditions were almost homogeneous without any severe weather heterogeneity [25]. Air sampling was performed on a Pallflex quartz fiber filter (20 cm × 25 cm) using a high-volume air sampler (HV-1000R, Sibata Scientific Technology Ltd., Soka, Japan). The aerosol sampling inlet was placed on the front deck of the ship (13 m above sea level), ahead of the ship’s engines, and a wind controller was used to avoid contamination from ship-engine exhaust during the cruise. In addition, kitchen ventilation systems were connected by a plastic cylindrical pipe (~15 m length) and moved back on the deck (far away from the sampling inlet) to minimize the potential effects of cooking emissions on the atmospheric measurements during the sampling periods. Similar to another study [9], the aerosol collector was connected to a wind vane programmed to have the unit switched on when wind was from a predetermined arc of 100 degrees to each side from the front of the ship with relative wind speed higher than 2 m s−1, and off at other times to prevent contamination from the ship’s chimney. The sampling flow rate was 1000 lpm and the total sampling time was 2–3 days. After sampling, the sample filters were stored on board at −20 °C until analysis in the laboratory.

2.2. Backward Air-Mass Trajectory Analysis

The geographical source areas of tropospheric air that arrived at the ship during sampling periods for each aerosol sample were estimated from air-mass back-trajectory analyses using version 4 of the Hybrid Single-Particle Lagrangian Integrated Trajectory (HYSPLIT) model [26]. The 2-day air-mass back trajectories (48 h) were determined at hourly intervals from the ship’s position at an arrival height of 50 m to estimate the transport history of the air masses arriving at the observation site [25,27]. The potential origins of the aerosols were divided into four categories based on the residence time of the 2-day back trajectories over the three major domains: Arctic Ocean (including the Beaufort Sea, the Chukchi Sea, and sea-ice region), Pacific Ocean (including the Bering Sea and the Sea of Okhotsk), East Asia (including China and the eastern part of Siberia), and North America (including Alaska and Canada). Geographical information about the ocean, land, and sea-ice was obtained from the sea-ice index, which was provided by the National Snow and Ice Data Center (NSIDC). The sea-ice extent was defined as the area having an ice concentration of ≥15% [28].

2.3. Analysis of n-Alkanes

All six quartz fiber filters were freeze-dried, cut into small (1 cm × 1 cm) pieces, and ultrasonically extracted (5×) with a mixture of dichloromethane (DCM):methanol (MeOH) (2:1, v:v) for 20 min. The total lipid extracts were concentrated under a gentle N2 stream and passed over a small Na2SO4 Pasteur pipette column. The extracts were separated into apolar and polar fractions on an activated Al2O3 column using hexane:DCM (9:1, v:v) and DCM:MeOH (1:1, v:v), respectively. The apolar fraction containing n-alkanes was dried and further purified over an Ag+ impregnated silica pipette column to separate aliphatic and aromatic hydrocarbons using hexane as eluent.
The apolar fractions were analyzed with an Agilent 7890A gas chromatograph (GC, Agilent Technologies, Santa Clara, CA, USA) equipped with a flame ionization detector (FID) using a DB–5 column fused silica capillary column (30 m length, 0.25 mm internal diameter, and 0.25 µm film thickness, Agilent). The samples were injected under constant flow at an initial oven temperature of 70 °C in a splitless mode with helium as a carrier gas. The GC oven temperature was subsequently raised to 130 °C at a rate of 20 °C/min, and then to 320 °C at 4 °C/min, with a final hold time of 45 min. Quantification of chromatographically resolved aliphatic hydrocarbons was made by using external standards (solution of n-alkanes from C8 to C40, pristane, and phytane; Supelco 502065, AccuStandard, New Haven, CT, USA). The concentration of unresolved complex mixtures (UCM) was calculated with the mean response factors of n-alkanes. The apolar fractions were also analyzed with an Agilent 7820A GC coupled to an Agilent 5977E MSD mass spectrometer (MS, Agilent Technologies, Santa Clara, CA, USA) operated at 70 eV with a mass range of m/z 50–800. The samples were subjected to the same temperature conditions and capillary column described for GC analysis. Compound identifications were based on a comparison of relative GC retention times and mass spectra of the n-alkane mixture (C8–C40) analytical standards (Supelco 502065).
The average chain length (ACL) [29], the carbon preference index (CPI) [30], the percentage of wax n-alkanes (%Wax) [31], and the percentage of petrogenic n-alkanes (%PNA) [32] were calculated as follows:
ACL   = [ 27 × C 27 + 29 × C 29 + 31 × C 31 ] [ C 27 + C 29 + C 31 ]
CPI   = 1 2 × [ (   C 27 + C 29 + C 31   C 26 + C 28 + C 30 ) + ( C 27 + C 29 + C 31 C 28 + C 30 + C 32 ) ]
Wax Cn   = [ Cn ] [ Cn + 1 +   Cn 1 2 ]
% Wax = Σ Wax Cn Σ NA × 100
% PNA = 100 % Wax
where Cn is the concentration of the n-alkane containing n carbon atoms, ΣWax-Cn is the concentration sum of wax n-alkane contribution arising from all odd n-alkanes, and ΣNA is the concentration sum of total n-alkanes in the range of C26 to C32.

2.4. Compound-Specific Stable Carbon Isotope Analysis

The δ13C values of n-alkanes were determined using an isotope ratio mass spectrometer (IsoPrime GV Instruments, Manchester, UK) connected with a GC (Hewlett Packard 6890 N series, Agilent Technologies, Santa Clara, CA, USA) via a combustion interface (glass tube packed with copper oxide–CuO, operated at 850 °C) [17]. The samples were subjected to the same temperature conditions and capillary column described for the GC and GC-MS analyses. Isotopic values are expressed as δ13C values in per mil relative to the Vienna-Pee Dee Belemnite (VPDB). Isotope values of the dominant C27, C29, and C31 homologues reported were determined by averaging duplicate analyses whenever concentrations were sufficient. Standard deviations of carbon isotope measurements were generally better than ±0.4‰, as determined by repeated injections of the standard.

2.5. Statistical Analysis
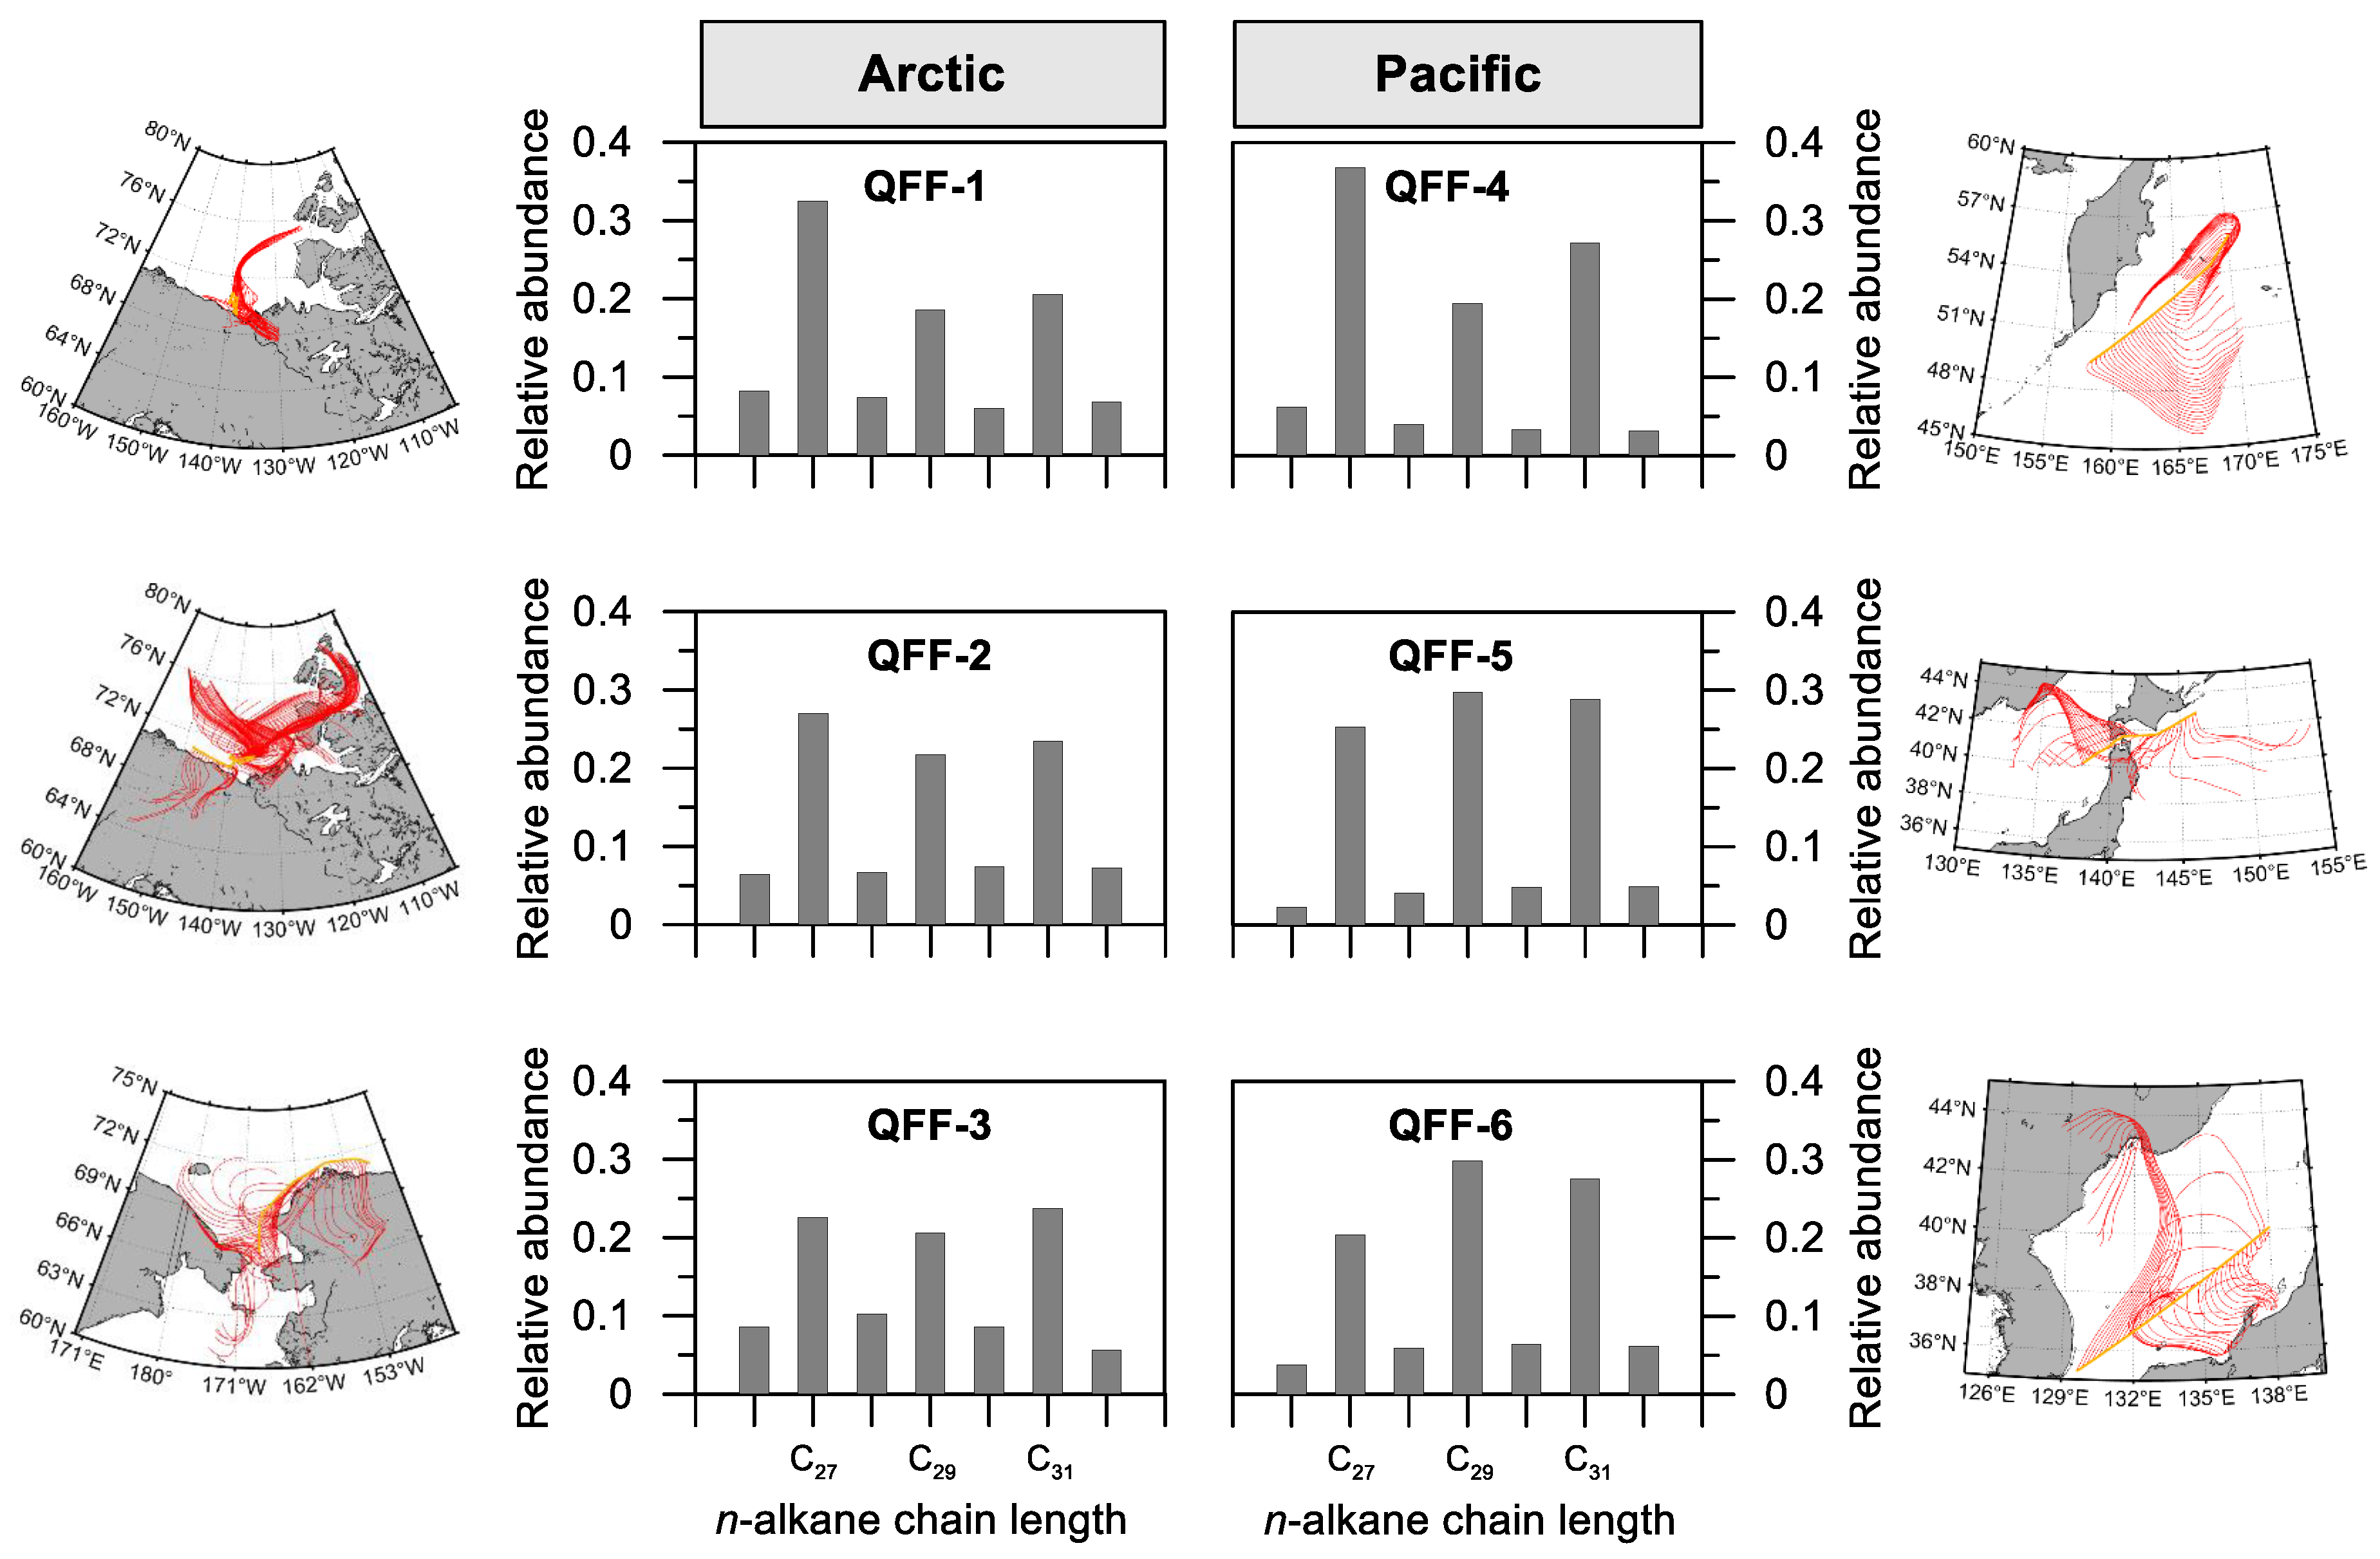
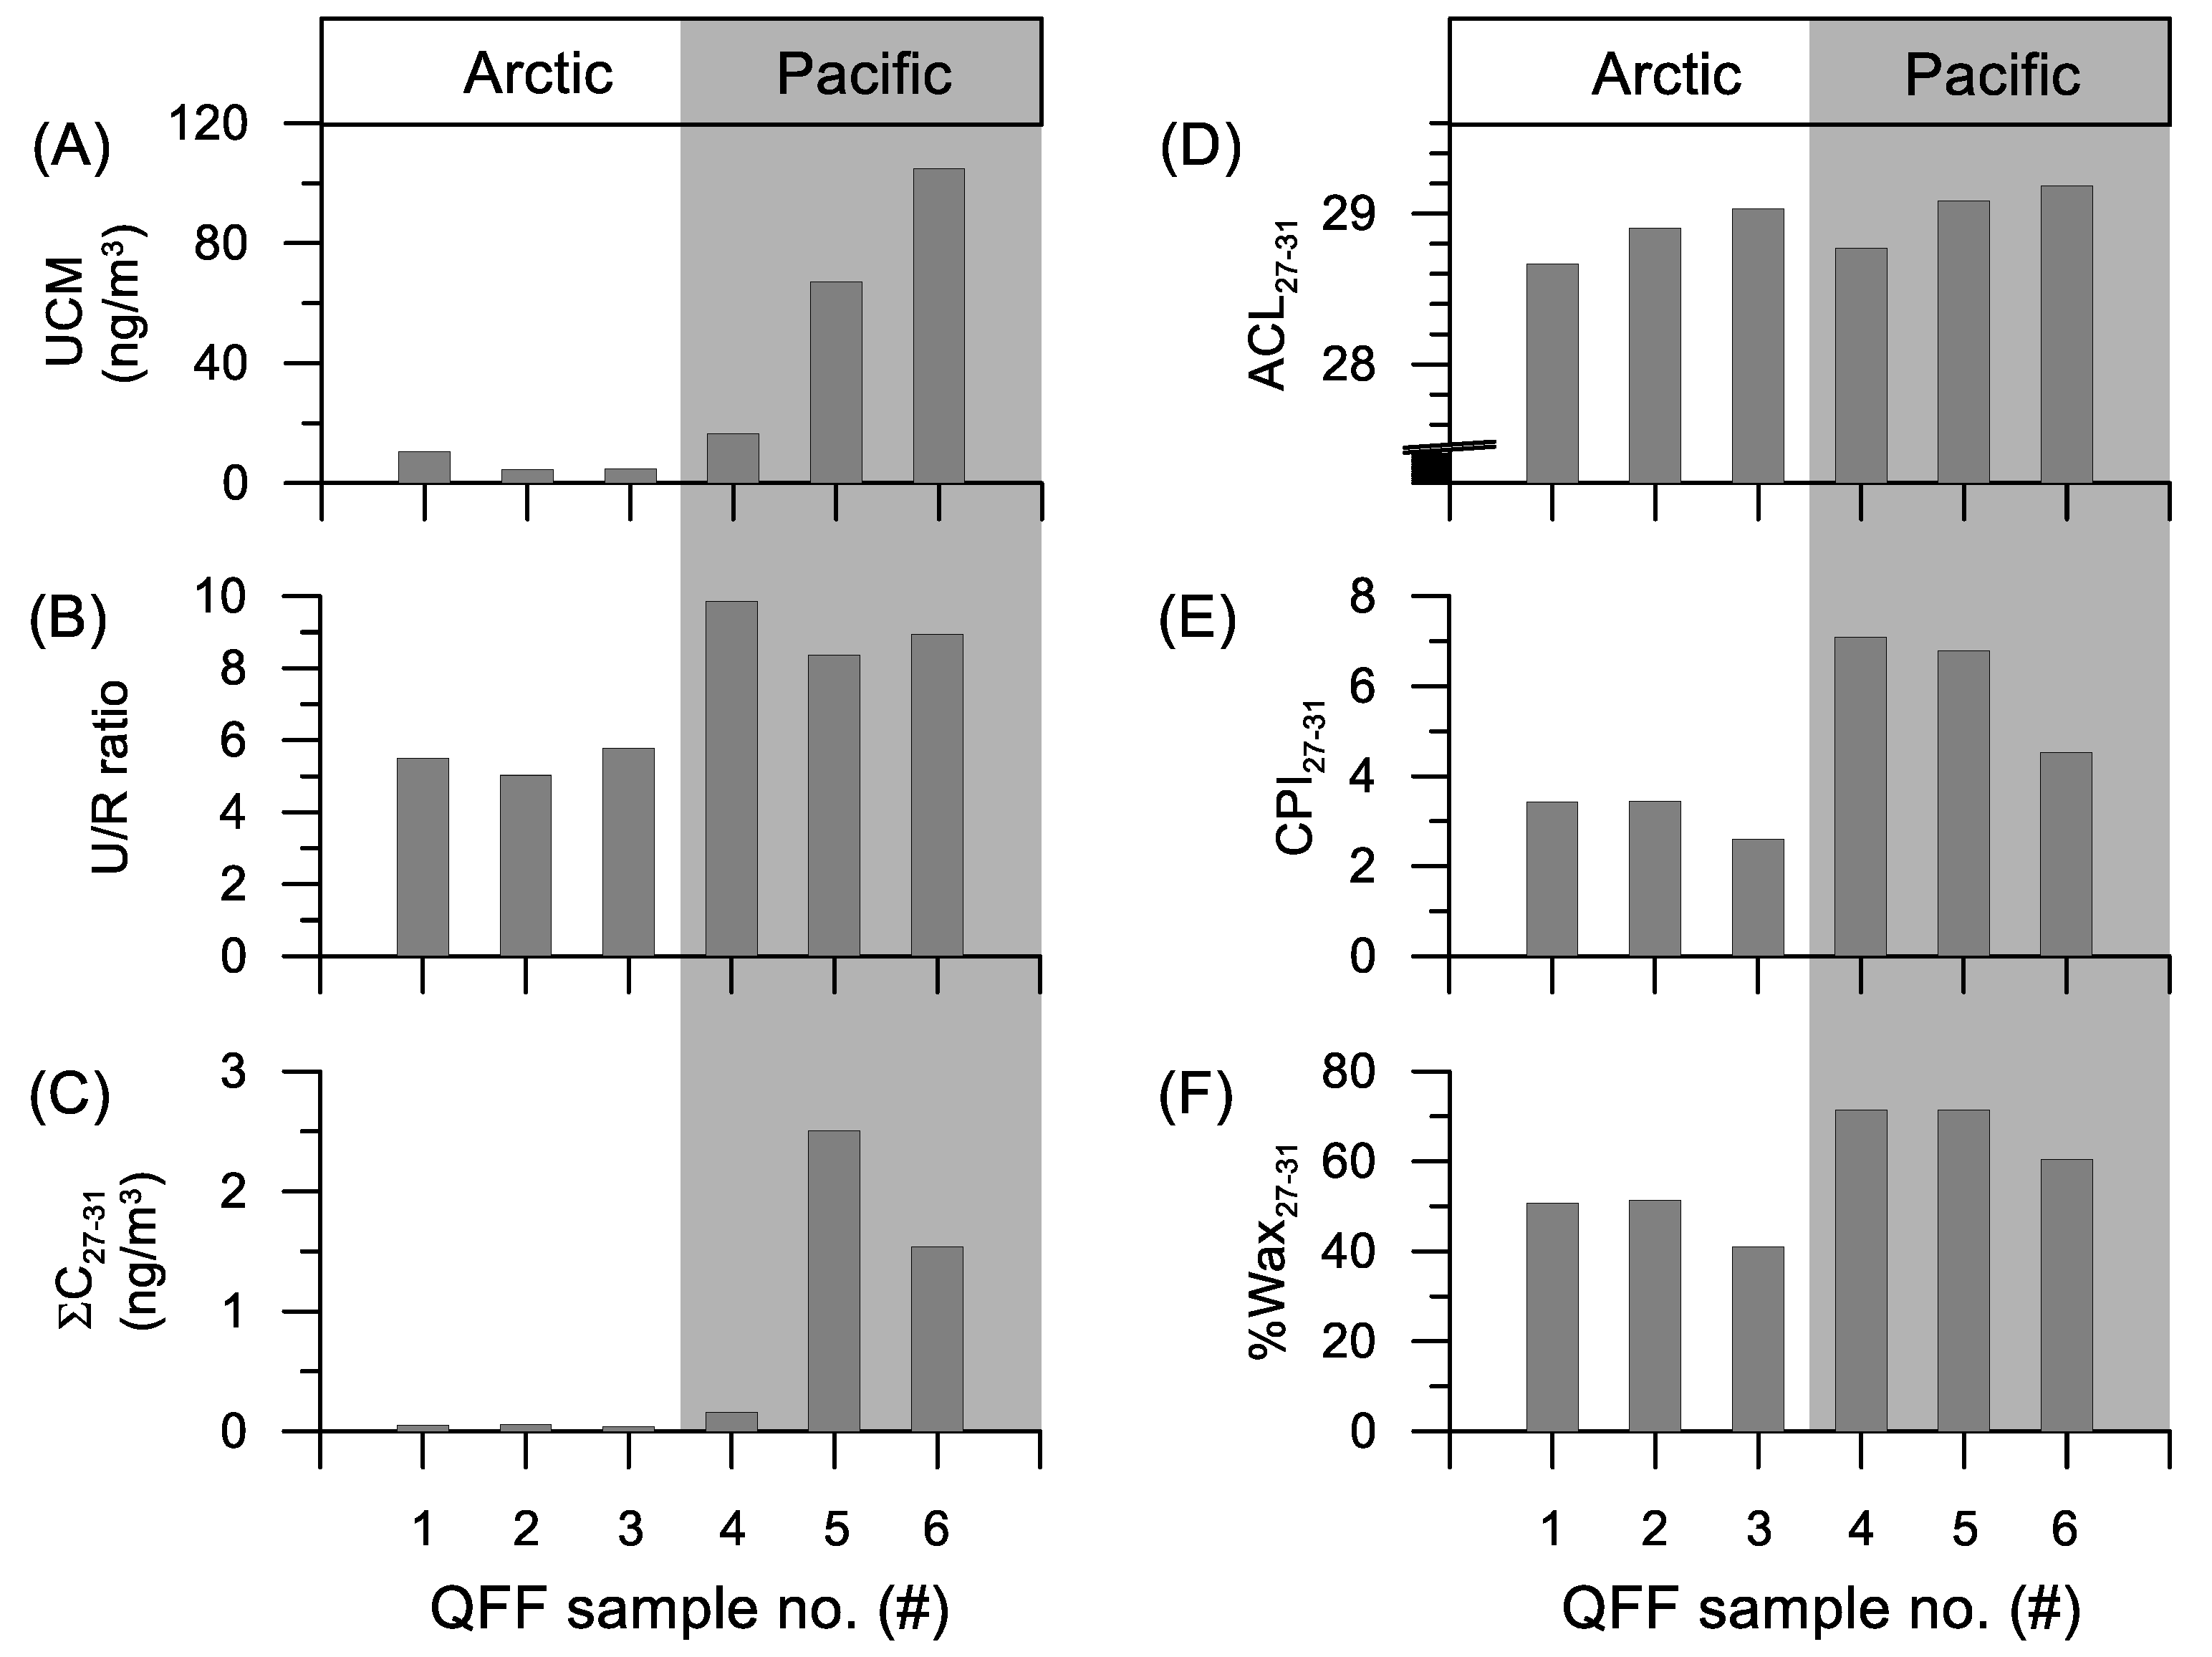
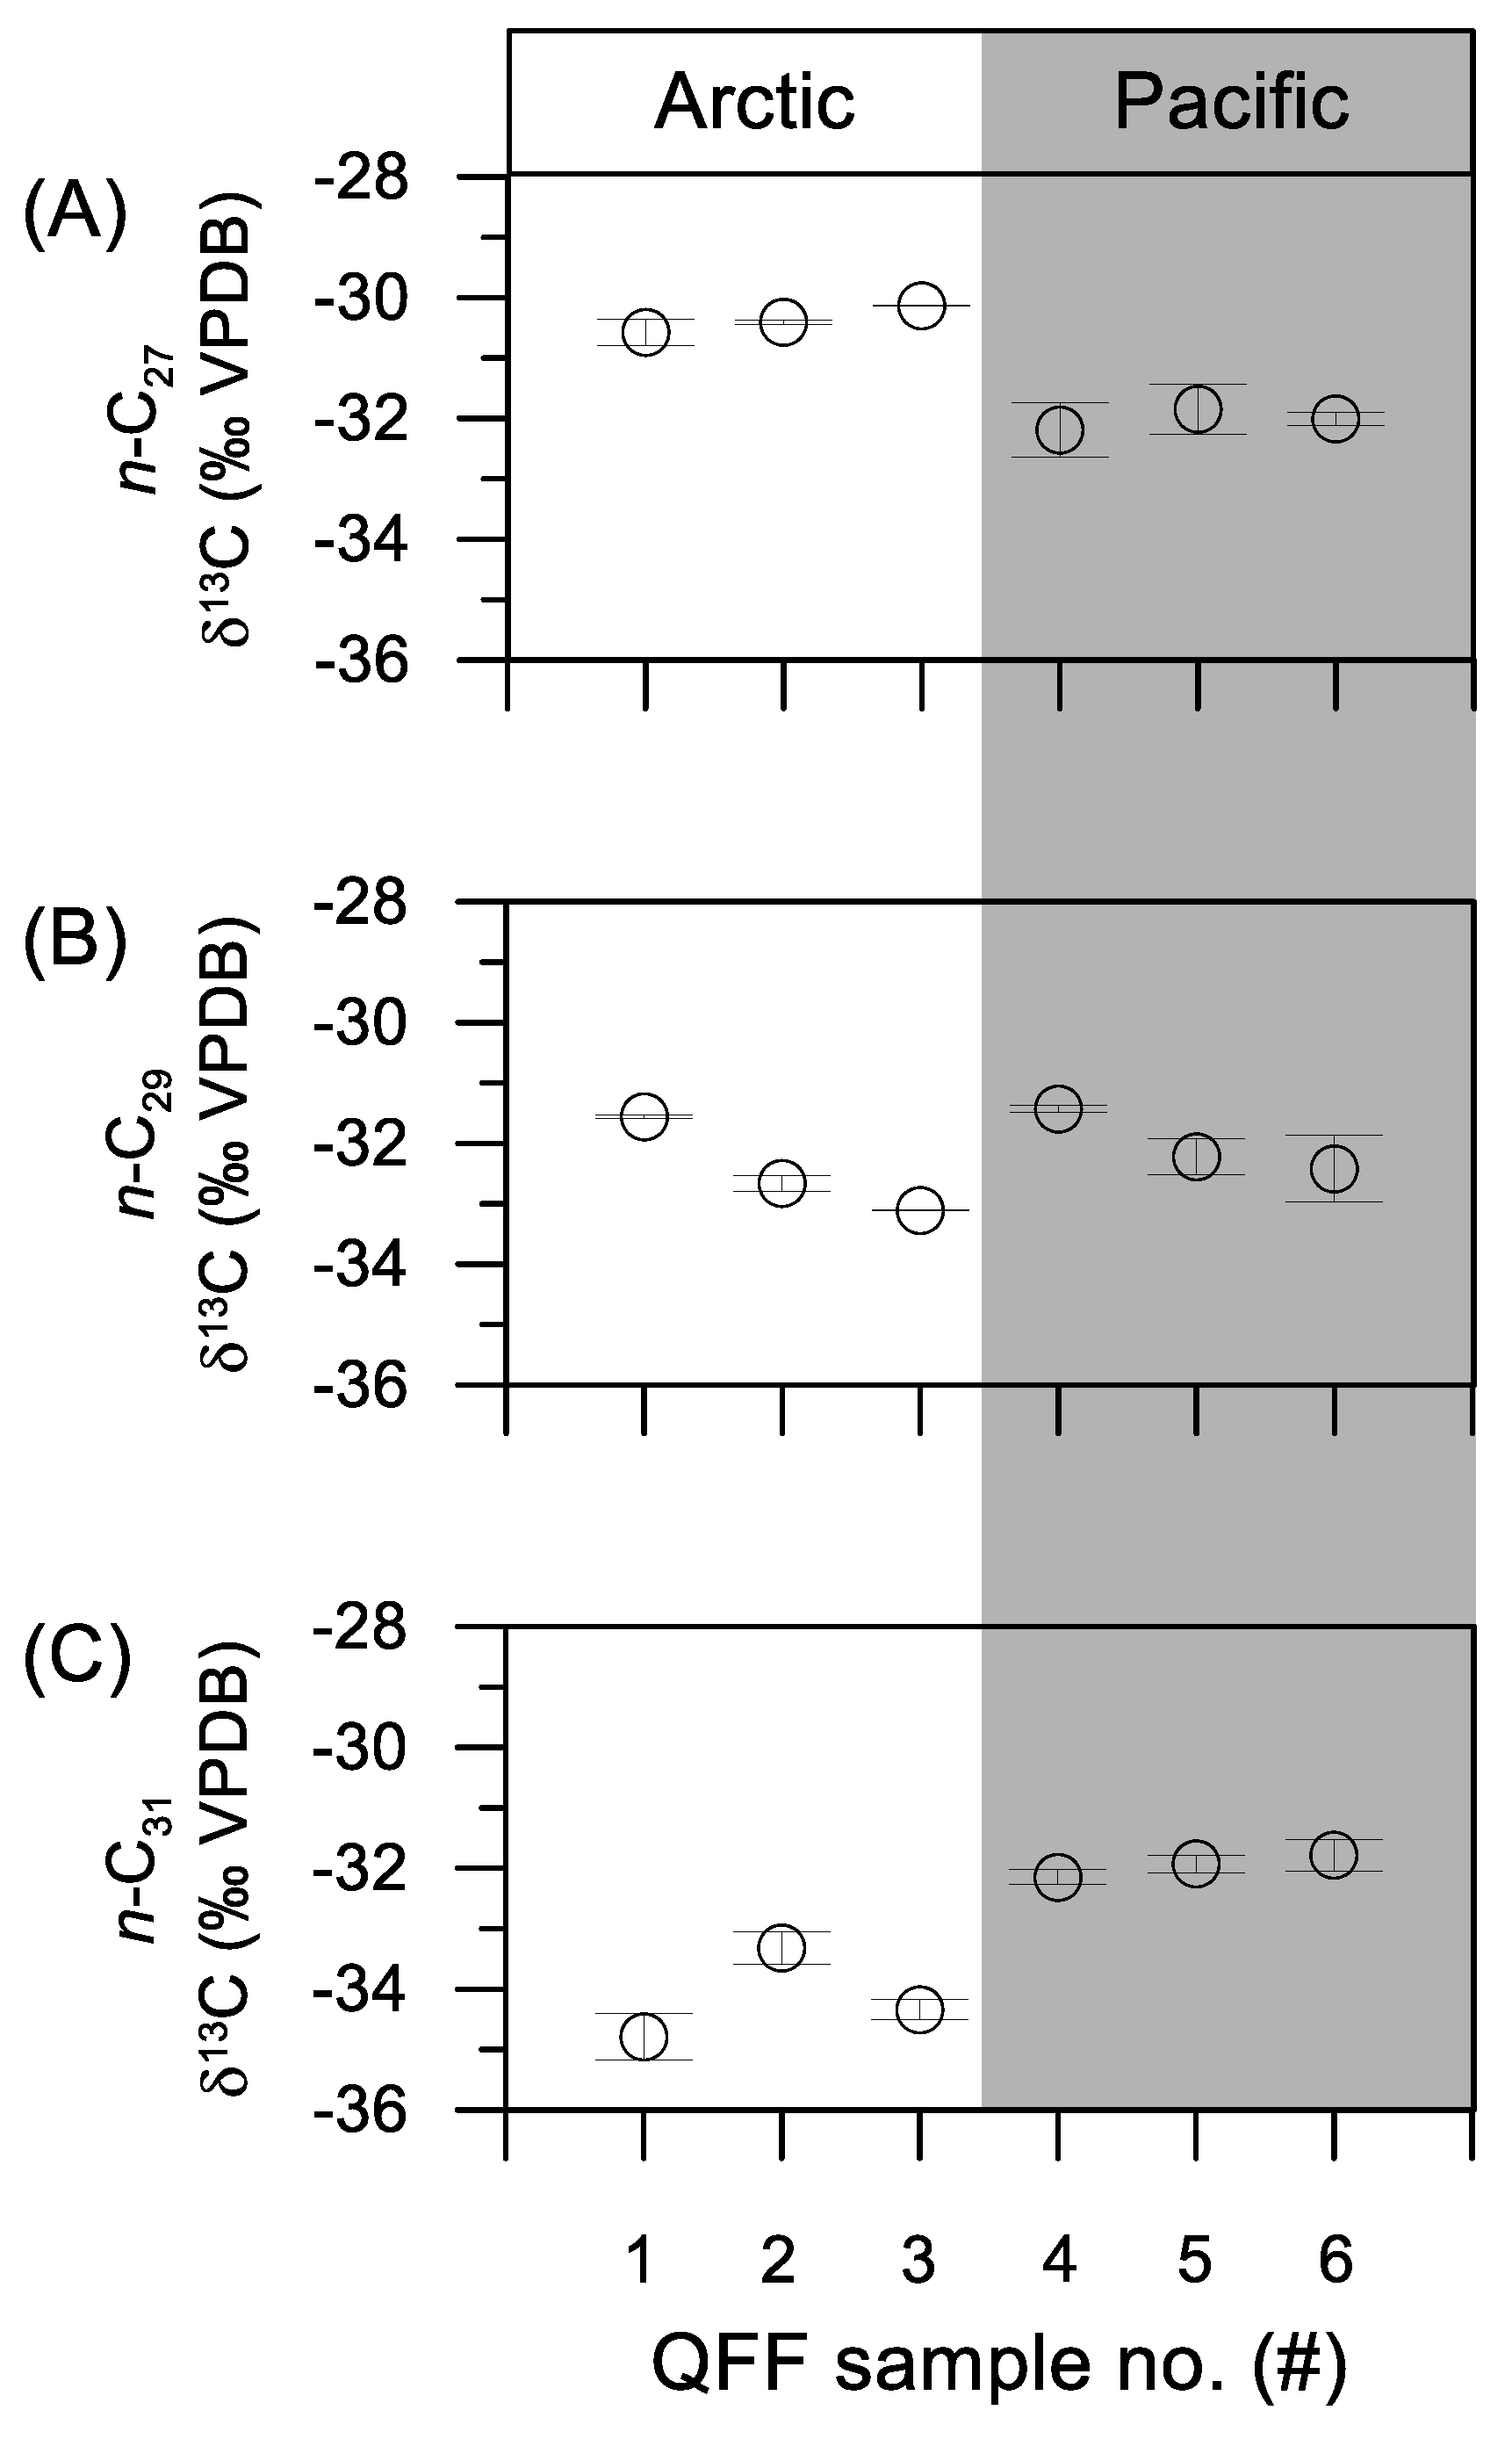
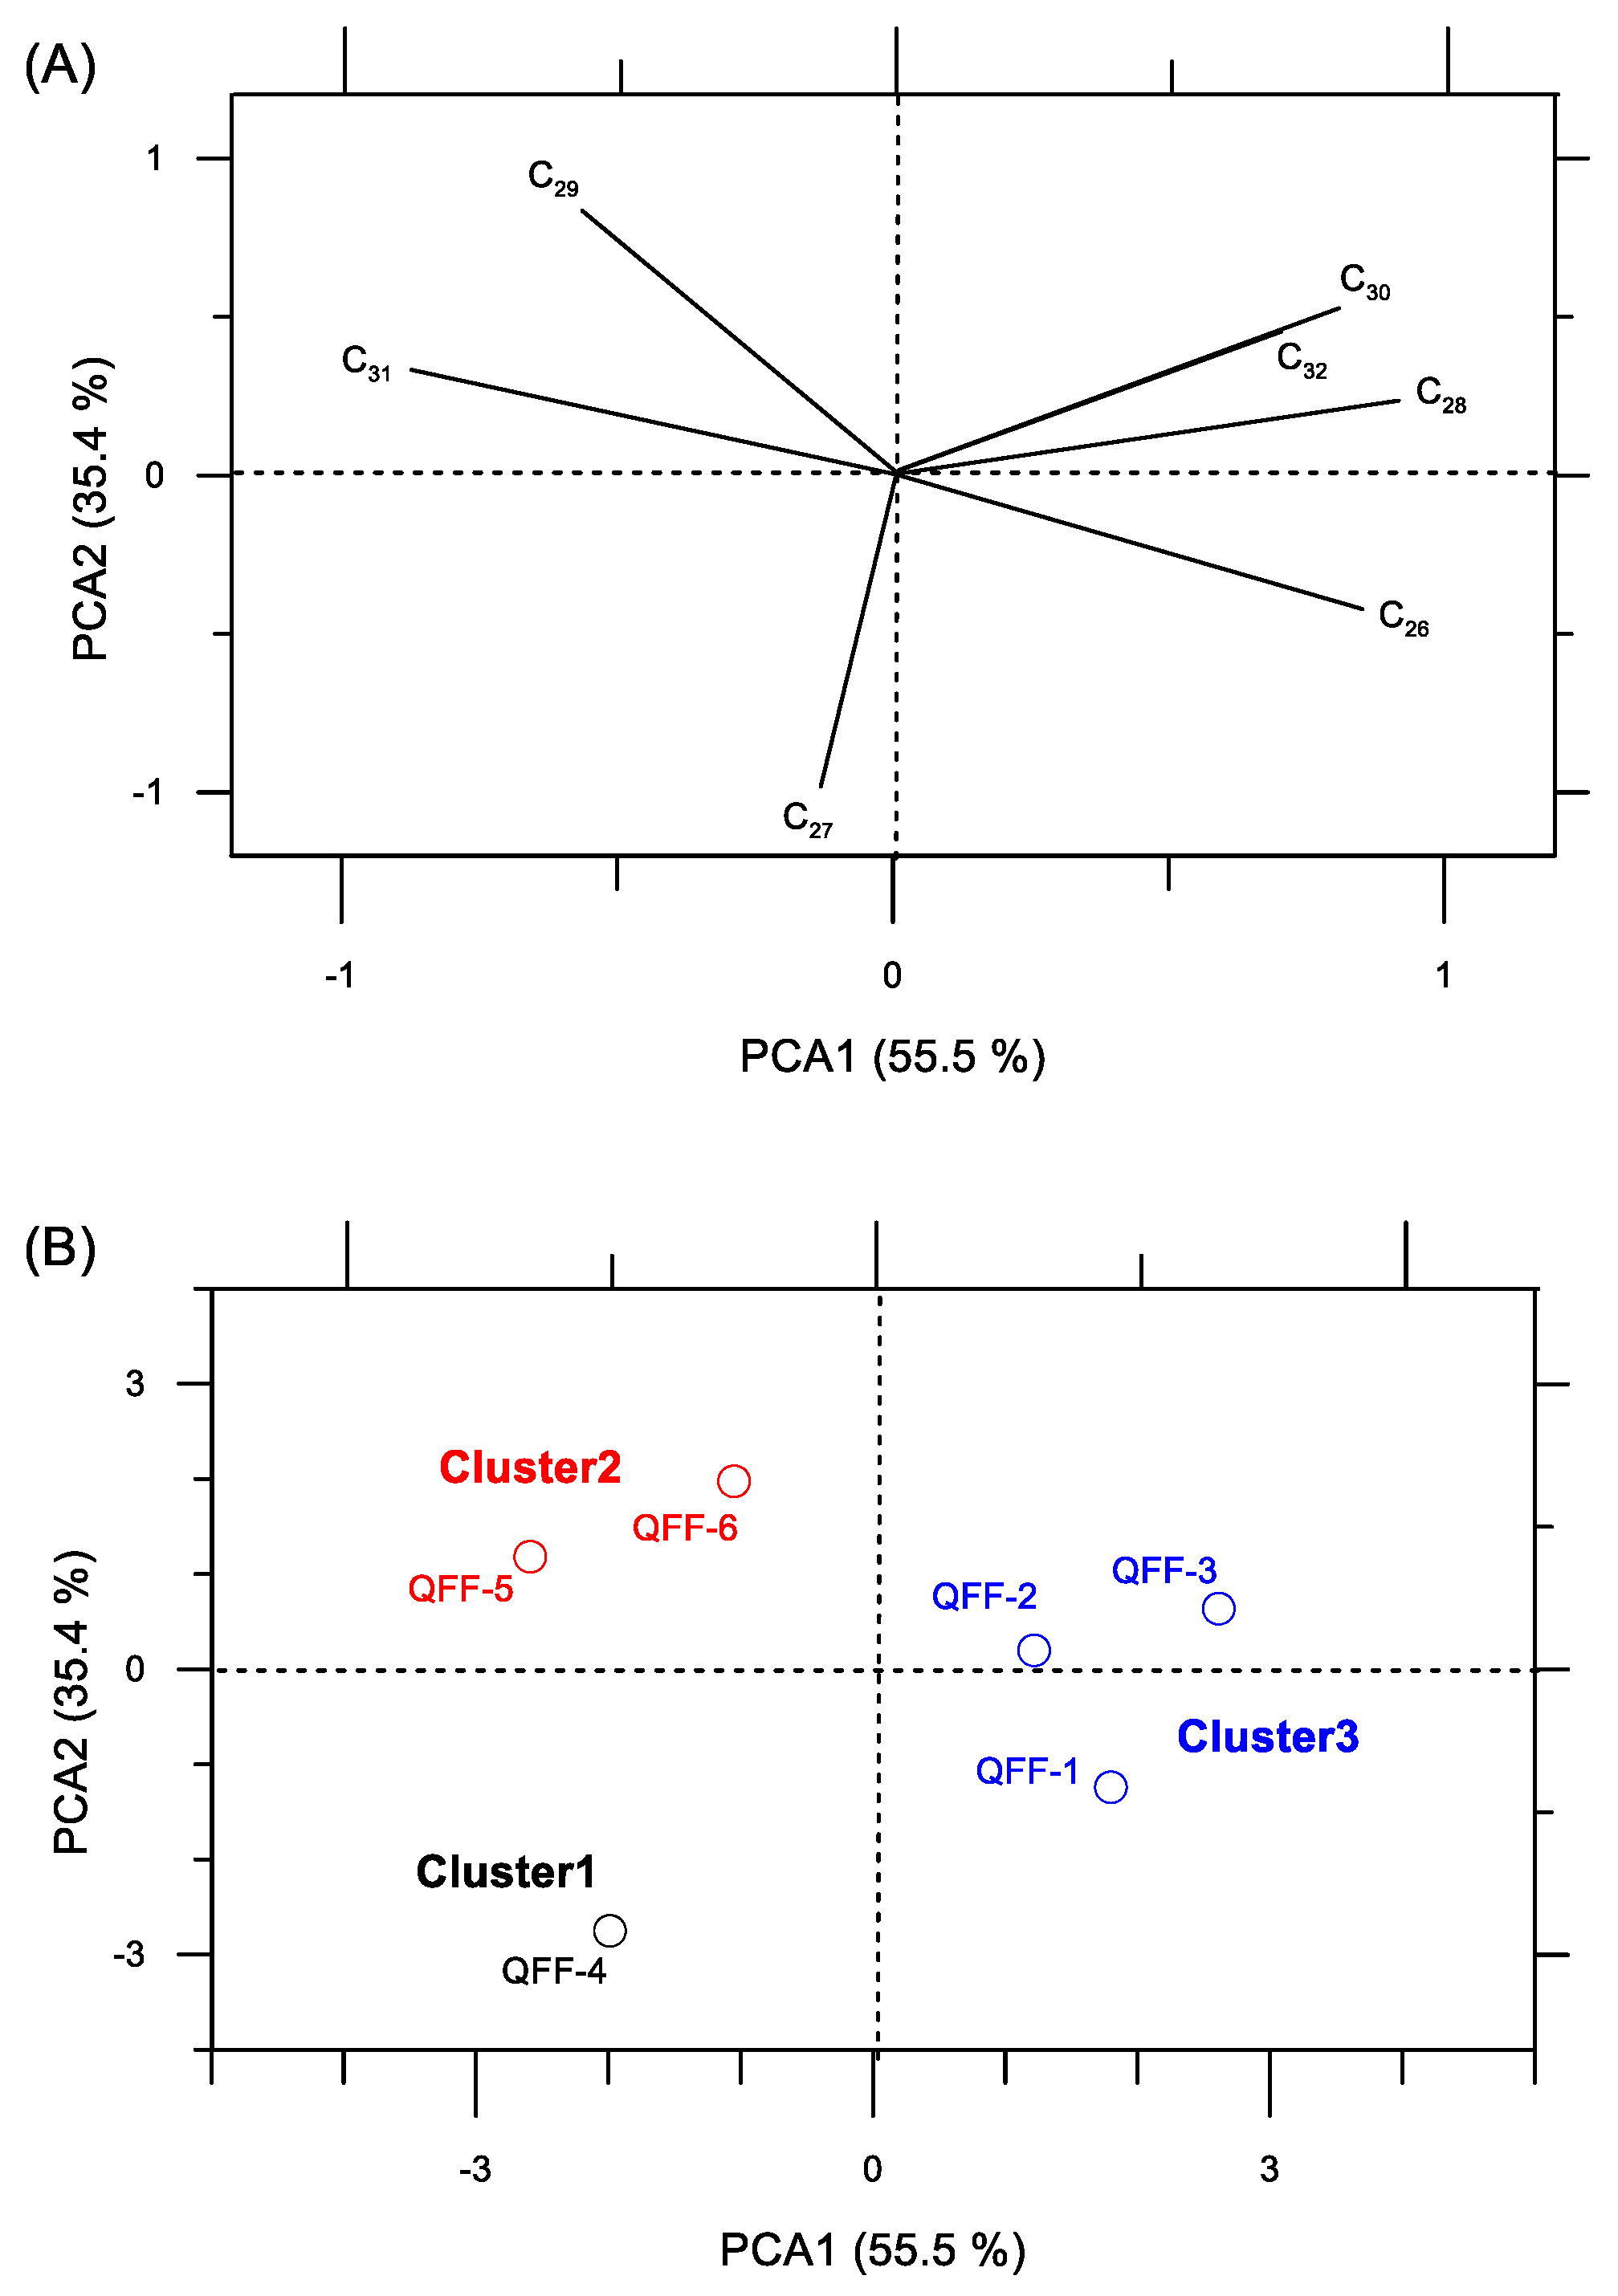
The fractional abundances of each n-alkane component were obtained by normalizing each n-alkane concentration to the summed concentration of n-alkane compounds (C26–C32) considered. To provide a general view of the variability of the distribution of n-alkanes, principal component analysis (PCA) was performed on the fractional abundances of n-alkanes using the R program [33]. We also performed hierarchical clustering of principal components (HCPC) on the PCA results to cluster samples with similar n-alkane distributions.

3. Results

The ship track during sample acquisitions is indicated in Figure 1, and the beginning and ending coordinates are given in Table 1. The air masses mainly came from the north and then passed over the Arctic Ocean to the ship when the marine aerosol samples of QFF-1 and QFF-2 were collected (Figure 2). The back trajectories were different when QFF-3 was collected, showing increased contributions from the Pacific Ocean and the eastern part of Siberia. The air masses mainly originated from the Pacific Ocean, with a minor portion of East Asia, when QFF-4 was collected. The air masses from East Asia increased during the QFF-5 and GFF-6 sample collection.
The resolved n-alkanes were detected in a series of C16 to C34 with a predominance of n-C27, n-C29, and n-C31 homologues (Figure 2). All aerosol samples studied showed a broad and unimodal UCM of hydrocarbons eluting between n-C15 and n-C25. The UCM concentrations varied between 4 and 105 ng/m3 (Figure 3A). The ratios of unresolved to resolved hydrocarbon components (U/R) were in the range of 5.0 to 9.9 (Figure 3B). The concentration of odd-carbon-numbered long-chain n-alkanes in C27–C31 (ΣC2731) ranged from 0.04 to 2.5 ng/m3, with higher values close to the East Asian continent (Figure 3C). The ACL27–31 (Equation (1)) was relatively stable along the North–South transect, with an average of 28.9 ± 0.2 (Figure 3D). The odd to even predominance of the n-alkanes, expressed as CPI27–31 (Equation (2)), was between 3 and 7 (Figure 3E). The %Wax27–31 (Equations (3) and (4)) was in the range of 41–71% (Figure 3F). All n-alkane compounds except for n-C27, n-C29, and n-C31 were not present in sufficient concentrations to be measurable by GC-IRMS. The δ13C values of the dominant HMW n-alkanes (n-C27, n-C29, and n-C31) fell in the range of −32.2‰ to −30.1‰, −33.1‰ to −31.4‰, and −34.8‰ to −31.8‰, respectively (Figure 4).
The PCA results based on the fractional abundances of HMW n-alkanes (C26–C32) showed that the PC1 (55.5%) was closely related to odd-carbon-numbered long-chain n-alkanes (C27 to C31) with a negative loading and a positive loading of all even-carbon-numbered n-alkanes (C26 to C32) (Figure 5). The PC2 (35.4%) predominantly reflected the presence of C28 to C32 with a positive loading and C26 to C27 with a negative loading. The subsequent HCPC results showed that all Arctic marine aerosol samples were grouped as one cluster, associated with even-carbon-numbered long-chain n-alkanes. The Pacific marine aerosol samples were separately clustered into odd-carbon-numbered long-chain n-alkanes.

4. Discussion

4.1. Anthropogenic Hydrocarbons in Marine Aerosols

Unresolved complex mixtures of hydrocarbons are composed of positional isomers of linear, branched, and/or cyclic alkanes with different carbon numbers and emitted to the atmosphere by incomplete fossil-fuel combustion [34,35,36]. The UCM hydrocarbons were detected in all marine aerosol samples investigated and showed a latitudinal trend of increasing values towards the south with a maximum value in GFF-6 in the northwest Pacific Ocean (Figure 3A). Our results are in good agreement with previous studies which showed the presence of UCM hydrocarbons in marine aerosol samples collected over the northwest Pacific Ocean, the East China Sea, and the East Sea of Korea [10,11,12]. The presence of UCM hydrocarbons was also reported in aerosol samples collected from ground stations on Jeju Island in South Korea, on Hokkaido Island, and Chichi-Jima Island in Japan [10,37,38], and in a southeastern coastal city of China (Xiamen) [39]. In general, the UCM concentrations of marine aerosol samples collected over the Northwest Pacific were one order of magnitude higher than those of aerosol samples collected at the Chichi-Jima station located in the remote northwest Pacific Ocean [10,37]. The concentrations of UCM hydrocarbons were three orders of magnitude higher in aerosol samples collected at Alert (82.5° N, 62.3° W) in the Canadian high Arctic [40] than those of the marine aerosol samples collected over the Beaufort Sea. Thus, our results indicate a generally increasing input of anthropogenic pollution from the Arctic Ocean to the northwest Pacific Ocean.
The ratio of unresolved to resolved hydrocarbon components (U/R) >4 can be another sign of a substantial input of fossil-fuel combustion to marine aerosols [41,42,43]. In our samples, the U/R was on average 5 ± 0.3 in the Arctic Ocean and 9 ± 0.6 in the northwest Pacific Ocean (Figure 3B), providing additional evidence that the marine aerosols investigated were affected by long-range transport of fossil-fuel combustion aerosols. The CPI of n-alkanes can be another measure of petroleum inputs. Petroleum-derived n-alkanes have a regular distribution with a CPI of 1 [1,44], whereas epicuticular waxes derived from higher land plants generally have CPI values of >4 [41]. The CPI values for the whole range of C17–C33 were 1.2–1.6 in the Arctic Ocean and 3.1–5.0 in the northwest Pacific Ocean. The CPI for the low molecular weight n-alkanes (i.e., C17–C23), where the UCM hump occurred, were lower, with values of 0.6–0.7 in the Arctic Ocean and 0.7–1.4 in the northwest Pacific Ocean, confirming anthropogenic inputs from fossil-fuel combustion in the marine aerosols studied.
The back trajectories calculated for the periods of the samples collected in the Arctic Ocean showed that the air masses mainly originated from the Arctic Ocean and North America (Table 2). On the contrary, the air-mass trajectory analyses generally showed that most of the air masses came from the East Asian countries over the northwest Pacific Ocean through the atmosphere under the influence of strong westerly and northerly winds. Accordingly, our results show that the Arctic Ocean and the northwest Pacific Ocean were influenced by the plume of polluted aerosols exported from North American and East Asian countries during the sampling periods, respectively.

4.2. HMW n-Alkanes in Marine Aerosols

The HMW n-alkanes (C27–C31) were detected in all marine aerosol samples investigated, suggesting an input of terrestrial higher plant leaf waxes [4]. The ΣC27–31 was higher in the northwest Pacific Ocean (1.4 ± 1.0 ng/m3) than in the Arctic Ocean (0.05 ± 0.01 ng/m3), especially close to the East Asian countries (Figure 3C). The carbon number maxima (Cmax) in the C27–C31 range can also give an indication of a significant incorporation of higher land plant waxes [31]. The Cmax at n-C27 and n-C29 (Figure 2) with the ACL27–31 of ~29 (Figure 3D) are thus evidence for an origin of epicuticular leaf waxes of higher land plants. Our results are in line with previous studies that reported a Cmax at n-C27 in the Arctic marine aerosols [24] and a Cmax at n-C29 or n-C31 in the Pacific marine aerosols [10,11]. The HMW n-alkanes showed CPI27-31 of 3.2 ± 0.4 in the Arctic Ocean and of 6.1 ± 1.1 in the northwest Pacific Ocean (Figure 3E). Hence, CPI27-31 values (>3) demonstrate that the marine aerosols investigated were affected by higher plant waxes. Furthermore, %Wax27-31, with values of 48 ± 5% in the Arctic Ocean and of 68 ± 5% in the Northwest Pacific (Figure 3F), provides evidence of an influence of higher plant leaf waxes in the marine aerosols. Our results demonstrate that the marine aerosols studied were influenced by petroleum residues, as shown by the %PNA, with a value of 52 ± 5% in the Arctic Ocean and 32 ± 5% in the northwest Pacific Ocean. Thus, the relative contribution of fossil-fuel combustion to the resolved HWM n-alkanes was higher in the Arctic aerosols than in the Pacific aerosols, contrary to that of UCM (see Figure 3A).
The carbon isotopic signatures of n-alkanes are a useful means to distinguish between sources [45,46]. The n-alkane δ13C values of higher land plants that use the Calvin–Benson cycle of carbon fixation (i.e., C3 plants) were centred at −34.6 ± 2.9‰ for n-C27, −35.1 ± 2.3‰ for n-C29, and −35.4 ± 2.6‰ for n-C31 [38,47,48,49,50]. On the other hand, C4 plants that use the Hatch–Slack cycle of carbon fixation exhibit the n-alkane δ13C values of −20.8 ± 2.9‰ for n-C27, −20.0 ± 2.3‰ for n-C29, and −20.1 ± 2.5‰ for n-C31 [38,47,48,49,50]. The δ13C signatures in the Pacific marine aerosols were within a narrow range of −32.0 ± 0.1‰ for n-C27, −32.0 ± 0.4‰ for n-C29, and −32.0 ± 0.2‰ for n-C31 (Figure 4). In contrast, the Arctic marine aerosols showed relatively larger variations in δ13C for n-C29 (−32.4 ± 0.7‰) and n-C31 (−34.2 ± 0.6‰), except for n-C27 (−30.4 ± 0.2‰) (Figure 4). The difference in the same n-alkanes between the samples may reflect atmospheric transport pathways and hence differential source areas. However, QFF-1 and QFF-2 collected in the Arctic Ocean showed similar back trajectories with the main sources from the Arctic Ocean and North American countries (Table 2, see also Figure 2) but revealed differences in δ13C of n-C29 and n-C31 (see Figure 4). Hence, the relatively high deviation of δ13C values among the Arctic aerosol samples seems to be related to the diversity of the wind directions and thus the source regions.
The relative contributions to the HMW n-alkanes from terrestrial C3 and C4 plants were estimated by using a simple two-endmember mixing model [51], based on the δ13C values of n-C27: C3 plant n-alkanes = −34.6‰ and C4 plant n-alkanes = −20.8‰. Use of the mixing model resulted in estimates of C4 plant contribution varying from 29% to 32% for the Arctic marine aerosols and 17% to 20% for the Pacific marine aerosols. Accordingly, the mixing model results suggest a higher input of C4 plants to the Arctic marine aerosols than to the Pacific marine aerosols during the time of sampling. However, it should be noted that there was a negative correlation between δ13C ratios of n-C27 against CPI27–31 (R2 > 0.78, p < 0.0001) but a positive correlation between δ13C ratios of n-C27 against %PNA27–31 (R2 > 0.85, p < 0.0001). Notably, the Arctic marine aerosol samples were separately clustered from the Pacific marine aerosol samples in association with even-carbon-numbered long-chain n-alkanes (Figure 5). Hence, this line of evidence in addition to lower CPI27–31 and higher %PNA27-31 suggests that the contribution of fossil-fuel combustion influenced more strongly the δ13C ratios of n-C27 in the Arctic marine aerosols than in the Pacific marine aerosols. Accordingly, it appears that the δ13C signatures of HMW n-alkanes contained in the marine aerosols analyzed were affected by the contribution of both C3/C4 plants and fossil-fuel combustions.

5. Conclusions

We investigated molecular distributions and δ13C of n-alkanes in marine aerosols collected along a transect from the Arctic Ocean to the northwest Pacific Ocean. In all studied samples, the anthropogenic input was evidenced by the presence of UCM, high U/R ratios, and low CPI values for low molecular weight n-alkanes. The biogenic input of terrestrial higher plant leaf waxes was predominant for HMW n-alkanes in all studied samples, with high CPI values. The δ13C of HMW n-alkanes was as a function of the relative contributions from the C3/C4 plant sources in addition to the anthropogenic inputs from fossil-fuel combustions. Accordingly, n-alkanes in the studied marine aerosol samples originated from mixed sources. The back-trajectory results provided evidence that the atmospheric transport of anthropogenic and biogenic organic materials from North American and East Asian countries contributed to marine aerosols in the Arctic Ocean and the northwest Pacific Ocean, respectively. Accordingly, our results show that changes in molecular distributions and δ13C of n-alkanes of marine aerosols were a function of changes in the prevailing wind and hence source regions. Furthermore, our study provides a basis for future paleoclimatological work for understanding the link between land-derived HMW n-alkanes in the atmosphere and those in the marine sediments in the Arctic Ocean.

Author Contributions

Conceptualization, J.-H.K. and J.P.; methodology, S.-B.K.; trajectory analysis, Y.G.; writing—original draft preparation, J.-H.K.; writing—review and editing, J.P. and K.-H.S.; visualization, J.-H.K. and S.K. All authors have read and agreed to the published version of the manuscript.

Funding

This research received no external funding.

Acknowledgments

We thank two anonymous reviewers for their careful reading of our manuscript. We would like to thank the captain and crew of R/V ARAON for their safe and skillful operation of the ship during the cruise. We thank Dahae Kim at KOPRI and Dong-Hun Lee at HYU for their analytical support in the lab. This research was supported by the National Research Foundation of Korea (NRF) grants funded by the Ministry of Science and ICT (MSIT)—South Korea (NRF-2015M1A5A1037243, KOPRI-PN19090 and NRF-2016M1A5A1901769, KOPRI-PN20081).

Conflicts of Interest

The authors declare no conflict of interest. The funders had no role in the design of the study; in the collection, analyses, or interpretation of data; in the writing of the manuscript, or in the decision to publish the results.

References

  1. Simoneit, B.R.T. Organic matter of the troposphere: III. Characterization and sources of petroleum and pyrogenic residues in aerosols over the western United States. Atmos. Environ. 1984, 18, 51–67. [Google Scholar] [CrossRef]
  2. Simoneit, B.R.T. Biomass burning-a review of organic tracers for smoke from incomplete combustion. Appl. Geochem. 2002, 17, 129–162. [Google Scholar] [CrossRef]
  3. Bush, R.T.; McInerney, F.A. Leaf wax n-alkane distributions in and across modern plants: Implications for paleoecology and chemotaxonomy. Geochim. Cosmochim. Acta 2013, 117, 161–179. [Google Scholar] [CrossRef]
  4. Eglinton, G.; Hamilton, R.J. Leaf epicuticular waxes. Science 1967, 156, 1322–1335. [Google Scholar] [CrossRef] [PubMed]
  5. Simoneit, B.R.T.; Chester, R.; Eglinton, G. Biogenic lipids in particulates from the lower atmosphere over the eastern Atlantic. Nature 1977, 267, 682–685. [Google Scholar] [CrossRef]
  6. Gagosian, R.B.; Peltzer, E.T.; Zafiriou, O.C. Atmospheric transport of continentally derived lipids to the tropical North Pacific. Nature 1981, 291, 312–314. [Google Scholar] [CrossRef]
  7. Gagosian, R.B.; Peltzer, E.T.; Merrill, J.T. Long-range transport of terrestrially derived lipids in aerosols from the South Pacific. Nature 1987, 325, 800–803. [Google Scholar] [CrossRef]
  8. Schefuß, E.; Ratmeyer, V.; Stuut, J.-B.W.; Jansen, J.F.; Sinninghe Damsté, J.S. Carbon isotope analyses of n-alkanes in dust from the lower atmosphere over the central eastern Atlantic. Geochim. Cosmochim. Acta 2003, 67, 1757–1767. [Google Scholar] [CrossRef]
  9. Schreuder, L.T.; Stuut, J.-B.W.; Korte, L.F.; Sinninghe Damsté, J.S.; Schouten, S. Aeolian transport and deposition of plant wax n-alkanes across the tropical North Atlantic Ocean. Org. Geochem. 2018, 115, 113–123. [Google Scholar] [CrossRef]
  10. Simoneit, B.R.T.; Kobayashi, M.; Mochida, M.; Kawamura, K.; Lee, M.; Lim, H.-J.; Turpin, B.J.; Komazaki, Y. Composition and major sources of organic compounds of aerosol particulate matter sampled during the ACE-Asia campaign. J. Geophys. Res. 2004, 109, D19S10. [Google Scholar] [CrossRef] [Green Version]
  11. Bendle, J.; Kawamura, K.; Yamazaki, K.; Niwai, T. Latitudinal distribution of terrestrial lipid biomarkers and n-alkane compound-specific stable carbon isotope ratios in the atmosphere over the western Pacific and Southern Ocean. Geochim. Cosmochim. Acta 2007, 71, 5934–5955. [Google Scholar] [CrossRef]
  12. Fu, P.Q.; Kawamura, K.; Miura, K. Molecular characterization of marine organic aerosols collected during a round-the-world cruise. J. Geophys. Res. 2011, 116, D13302. [Google Scholar] [CrossRef] [Green Version]
  13. Westerhausen, L.; Poynter, J.; Eglinton, G.; Erlenkeuser, H.; Sarnthein, M. Marine and terrigenous origin of organic matter in modern sediments of the equatorial East Atlantic: The δ13C and molecular record. Deep-Sea Res. I 1993, 40, 1087–1121. [Google Scholar] [CrossRef]
  14. Huang, Y.; Dupont, L.; Sarnthein, M.; Hayes, J.M.; Eglinton, G. Mapping of C4 plant input from North West Africa into North East Atlantic sediments. Geochim. Cosmochim. Acta 2000, 64, 3505–3513. [Google Scholar] [CrossRef]
  15. Schefuß, E.; Versteegh, G.J.; Jansen, J.; Sinninghe Damsté, J.S. Lipid biomarkers as major source and preservation indicators in SE Atlantic surface sediments. Deep-Sea Res. I 2004, 51, 1199–1228. [Google Scholar] [CrossRef]
  16. Ohkouchi, N.; Kawamura, K.; Kawahata, H.; Taira, A. Latitudinal distributions of terrestrial biomarkers in the sediments from the Central Pacific. Geochim. Cosmochim. Acta 1997, 61, 1911–1918. [Google Scholar] [CrossRef]
  17. Kim, J.-H.; Lee, D.-H.; Yoon, S.-H.; Jeong, K.-S.; Choi, B.; Shin, K.-H. Contribution of petroleum-derived organic carbon to sedimentary organic carbon pool in the eastern Yellow Sea (the northwestern Pacific). Chemosphere 2017, 168, 1389–1399. [Google Scholar] [CrossRef]
  18. Ohkouchi, N.; Kawamura, K.; Takemoto, N.; Ikehara, M.; Nakatsuka, T. Implications of carbon isotope ratios of C27–C33 alkanes and C37 alkenes for the sources of organic matter in the Southern Ocean surface sediments. Geophys. Res. Lett. 2000, 27, 233–236. [Google Scholar] [CrossRef]
  19. Bird, M.I.; Summons, R.E.; Gagan, M.K.; Roksandic, Z.; Dowling, L.; Head, J.; Fifield, L.K.; Cresswell, R.G.; Johnson, D.P. Terrestrial vegetation change inferred from n-alkane δ13C analysis in the marine environment. Geochim. Cosmochim. Acta 1995, 59, 2853–2857. [Google Scholar] [CrossRef]
  20. Madureira, L.A.S.; van Kreveld, S.A.; Eglinton, G.; Conte, M.H.; Ganssen, G.; van Hinte, J.E.; Ottens, J.J. Late Quaternary high-resolution biomarker and other sedimentary climate proxies in a Northeast Atlantic core. Paleoceanography 1997, 12, 255–269. [Google Scholar] [CrossRef]
  21. Schefuß, E.; Schouten, S.; Jansen, J.H.F.; Sinninghe Damsté, J.S. African vegetation controlled by tropical sea surface temperatures in the mid-Pleistocene period. Nature 2003, 422, 418–421. [Google Scholar] [CrossRef] [PubMed]
  22. Hughen, K.A.; Eglinton, T.I.; Xu, L.; Makou, M. Abrupt tropical vegetation response to rapid climate changes. Science 2004, 304, 1955–1959. [Google Scholar] [CrossRef] [PubMed] [Green Version]
  23. Uno, K.T.; Polissar, P.J.; Jackson, K.E.; deMenocal, P.B. Neogene biomarker record of vegetation change in eastern Africa. Proc. Natl. Acad. Sci. USA 2016, 113, 6355–6363. [Google Scholar] [CrossRef] [PubMed] [Green Version]
  24. Fu, P.Q.; Kawamura, K.; Chen, J.; Charrière, B.; Sempéré, R. Organic molecular composition of marine aerosols over the Arctic Ocean in summer: Contributions of primary emission and secondary aerosol formation. Biogeosciences 2013, 10, 653–667. [Google Scholar] [CrossRef] [Green Version]
  25. Park, J.; Dall’Osto, M.; Park, K.; Gim, Y.; Kang, H.J.; Jang, E.; Park, K.-T.; Park, M.; Yum, S.S.; Jung, J.; et al. Shipborne observations reveal contrasting Arctic marine, Arctic terrestrial and Pacific marine aerosol properties. Atmos. Chem. Phys. Discuss. 2019. [Google Scholar] [CrossRef] [Green Version]
  26. Rolph, G.; Stein, A.; Stunder, B. Real-time Environmental Applications and Display sYstem: READY. Environ. Modell. Softw. 2017, 95, 210–228. [Google Scholar] [CrossRef]
  27. Dall’Osto, M.; Park, J.; Kim, J.-H.; Kang, S.-H.; Park, K.; Bessows, D.C.S.; Harrison, R.M.; Yoon, Y.J. Arctic ship-based evidence of new particle formation events in the Chukchi and East Siberian Seas. Atmos. Environ. 2020, 223, 117232. [Google Scholar] [CrossRef]
  28. Pang, X.; Pu, J.; Zhao, X.; Ji, Q.; Qu, M.; Cheng, Z. Comparison between AMSR2 sea ice concentration products and pseudo-ship observations of the Arctic and Antarctic sea ice edge on cloud-free days. Remote Sens. 2018, 10, 317. [Google Scholar] [CrossRef] [Green Version]
  29. Cranwell, P.A.; Eglinton, G.; Robinson, N. Lipids of aquatic organisms as potential contributors to lacustrine sediments–II. Org. Geochem. 1987, 11, 513–527. [Google Scholar] [CrossRef]
  30. Bray, E.E.; Evans, E.D. Distribution of n-paraffins as a clue to recognition of source beds. Geochim. Cosmochim. Acta 1961, 22, 2–15. [Google Scholar] [CrossRef]
  31. Simoneit, B.R.T.; Cardoso, J.N.; Robinson, N. An assessment of terrestrial higher molecular weight lipid compounds in aerosol particulate matter over the South Atlantic from about 30–70°S. Chemosphere 1991, 23, 447–465. [Google Scholar] [CrossRef]
  32. Yadav, S.; Tandon, A.; Attri, A.K. Monthly and seasonal variations in aerosol associated n-alkane profiles in relation to meteorological parameters in New Delhi, India. Aerosol Air Qual. Res. 2013, 13, 287–300. [Google Scholar] [CrossRef]
  33. R Development Core Team. R: A Language and Environment for Statistical Computing; R Foundation for Statistical Computing: Vienna, Austria, 2015; Available online: http://www.R-project.org (accessed on 17 July 2018).
  34. Boyer, K.K.; Laitinen, H.A. Automobile exhaust particles: Properties of environmental significance. Environ. Sci. Technol. 1975, 9, 457–459. [Google Scholar] [CrossRef]
  35. Simoneit, B.R.T.; Mazurek, M.A. Air pollution: The organic components. Crit. Rev. Environ. Control. 1981, 11, 219–276. [Google Scholar] [CrossRef]
  36. Gough, M.A.; Rowland, S.J. Characterization of unresolved complex mixtures of hydrocarbons in petroleum. Nature 1990, 344, 648–650. [Google Scholar] [CrossRef]
  37. Kawamura, K.; Ishimura, Y.; Yamazaki, K. Four years observations of terrestrial lipid class compounds in marine aerosols from the western North Pacific. Global Biogeochem. Cycles 2003, 17, 1003. [Google Scholar] [CrossRef]
  38. Bendle, J.A.; Kawamura, K.; Yamazaki, K. Seasonal changes in stable carbon isotopic composition of n-alkanes in the marine aerosols from the western North Pacific: Implications for the source and atmospheric transport. Geochim. Cosmochim. Acta 2006, 70, 13–26. [Google Scholar] [CrossRef] [Green Version]
  39. Tao, S.; Yin, X.; Jiao, L.; Zhao, S.; Chen, L. Temporal variability of source-specific solvent-extractable organic compounds in coastal aerosols over Xiamen, China. Atmosphere 2017, 8, 33. [Google Scholar] [CrossRef] [Green Version]
  40. Fu, P.Q.; Kawamura, K.; Barrie, L.A. Photochemical and other sources of organic compounds in the Canadian high Arctic aerosol pollution during winter-spring. Environ. Sci. Technol. 2009, 43, 286–292. [Google Scholar] [CrossRef]
  41. Mazurek, M.A.; Simoneit, B.R.T. Characterization of biogenic and petroleum-derived organic matter in aerosols over remote, rural and urban areas. In Identification and Analysis of Organic Pollutants in Air; Keith, L.H., Ed.; Ann Arbor Science/Butterworth: Boston, MA, USA, 1984; pp. 353–370. [Google Scholar]
  42. Azevedo, D.A.; Moreira, L.S.; Siqueira, D.S. Composition of extractable organic matter in aerosols from urban areas of Rio de Janeiro city, Brazil. Atmos. Environ. 1999, 33, 4987–5001. [Google Scholar] [CrossRef]
  43. Tang, X.L.; Bi, X.H.; Sheng, G.Y.; Tan, J.H.; Fu, J.M. Seasonal variation of particle size distribution of n-alkanes and polycyclic aromatic hydrocarbons (PAHs) in urban aerosol of Guangzhou, China. Environ. Monit. Assess. 2006, 117, 193–213. [Google Scholar] [CrossRef] [PubMed]
  44. Tissot, B.P.; Welte, D.H. Petroleum Formation and Occurrence: A New Approach to Oil and Gas Exploration, 2nd ed.; Springer: Berlin, Germany, 1984; pp. 1–702. [Google Scholar] [CrossRef]
  45. Freeman, K.H.; Hayes, J.M.; Trendel, J.M.; Albrecht, P. Evidence from carbon isotope measurements for diverse origins of sedimentary hydrocarbons. Nature 1990, 343, 254–256. [Google Scholar] [CrossRef] [PubMed]
  46. Collister, J.W.; Summons, R.E.; Lichtfouse, E.; Hayes, J.M. An isotopic biogeochemical study of the Green River oil shale. Org. Geochem. 1992, 19, 265–276. [Google Scholar] [CrossRef]
  47. Collister, J.W.; Rieley, G.; Stern, B.; Eglinton, G.; Fry, B. Compound-specific δ13C analyses of leaf lipids from plants with differing carbon dioxide metabolisms. Org. Geochem. 1994, 21, 619–627. [Google Scholar] [CrossRef]
  48. Huang, Y.; Eglinton, G.; Ineson, P.; Latter, P.M.; Bol, R.; Harkness, D.D. Absence of carbon isotope fractionation of individual n-alkanes in a 23-year field decomposition experiment with Calluna vulgaris. Org. Geochem. 1997, 26, 497–501. [Google Scholar] [CrossRef]
  49. Lockheart, M.J.; VanBergen, P.F.; Evershed, R.P. Variations in the stable carbon isotope compositions of individual lipids from the leaves of modern angiosperms: Implications for the study of higher land plant-derived sedimentary organic matter. Org. Geochem. 1997, 26, 137–153. [Google Scholar] [CrossRef]
  50. Chikaraishi, Y.; Naraoka, H. Compound-specific δD–δ13C analyses of n-alkanes extracted from terrestrial and aquatic plants. Phytochemistry 2003, 63, 361–371. [Google Scholar] [CrossRef]
  51. Chesselet, R.; Fontugne, M.; Buat-Ménard, P.; Ezat, U.; Lambert, C.E. The origin of particulate organic carbon in the marine atmosphere as indicated by its stable carbon isotopic composition. Geophys. Res. Lett. 1981, 8, 345–348. [Google Scholar] [CrossRef]
Figure 1. (A) Cruise tracks of the ARA08 cruise corresponding to each sample with the quartz fiber filter identification numbers used. (B) Detailed cruise tracks for the Arctic samples with the quartz fiber filter identification numbers used.
Atmosphere 11 00499 g001
Figure 2. Backward air-mass trajectories at 50 m above ground level for each sample and fractional abundances of high molecular weight (HMW) n-alkanes for the range of C26–C32. The yellow lines indicate the ship track lines.
Atmosphere 11 00499 g002
Figure 3. (A) Concentration of unresolved complex mix (UCM) hydrocarbons, (B) ratio of unresolved to resolved hydrocarbon components (U/R), (C) odd-carbon-numbered long-chain n-alkanes in the range of C27–C31 (ΣC27–31), (D) average chain length (ACL27–31), (E) carbon preference index (CPI27–31), and (F) the percentage of wax n-alkanes (%Wax27–31).
Atmosphere 11 00499 g003
Figure 4. Average δ13C values of each sample for (A) n-C27, (B) n-C29, and (C) n-C31.
Atmosphere 11 00499 g004
Figure 5. (A) Results of the Principal Component Analysis (PCA), and (B) the Hierarchical Clustering on Principal Components (HCPC) of the fractional abundances of HMW n-alkanes for the marine aerosol samples investigated.
Atmosphere 11 00499 g005
Table 1. Information on marine aerosol sampling.
Sample No.Starting PointEnd PointVolume
(m3)
LatitudeLongitudeDateTimeLatitudeLongitudeDate (yyyy.mm.dd)Time
(UTC)
(yyyy.mm.dd)(UTC)
ARA08 QFF-170.60 −139.30 2017.09.0316:0069.88−139.10 2017.09.0515:022632
ARA08 QFF-270.50 −139.00 2017.09.0716:1871.00−148.50 2017.09.1316:123051
ARA08 QFF-371.00 −148.70 2017.09.1317:1066.77−168.40 2017.09.1516:452755
ARA08 QFF-455.86 170.17 2017.09.2020:2049.43158.14 2017.09.2220:212686
ARA08 QFF-542.88 146.19 2017.09.2420:5940.16138.14 2017.09.269:302107
ARA08 QFF-640.09 138.01 2017.09.2610:2334.90127.70 2017.09.281:002267
Table 2. Percentages of dominant back trajectories found within each sampling period.
Sample No.Geographical Source Sectors for Air-Mass Trajectories
Pacific Ocean Arctic OceanEast AsiaNorth America
ARA08 QFF-116.553.9029.6
ARA08 QFF-21.575.2023.3
ARA08 QFF-349.312.010.628.1
ARA08 QFF-499.700.30
ARA08 QFF-579.70.120.20
ARA08 QFF-671.5028.50

