Article

Transient Characterization of Automotive Exhaust Emission from Different Vehicle Types Based on On-Road Measurements

Center for Urban Transport Emission Research, College of Environmental Science and Engineering, Nankai University, Tianjin 300071, China
*
Authors to whom correspondence should be addressed.
Atmosphere 2020, 11(1), 64; https://doi.org/10.3390/atmos11010064
Submission received: 11 November 2019 / Revised: 18 December 2019 / Accepted: 30 December 2019 / Published: 3 January 2020
(This article belongs to the Special Issue Roadside Air Pollution)

Abstract

:
Previous works on real-world vehicle emission characteristics have mainly focused on the influences of fuel, speed, vehicle type, elevation, and other factors on vehicle emission quantity and components. However, few studies have investigated the transient trend of automotive exhaust emissions through on-road measurements. The key objective of the present paper was to examine the transient characteristics of exhaust emissions from different vehicle types on the roads of Tianjin. To achieve the goal, a portable emission measurement system (PEMS) was employed to monitor emissions from selected test vehicles—private cars, passenger vehicles, and cargo vehicles. It was found that the high-emission points of test vehicles were mainly distributed in two regions: the high-speed region (speed > 70–90 km/h, vehicle-specific power (VSP) > 0 kW/t) and the medium-speed–acceleration region (20–30 km/h < speed < 60–90 km/h, 0 kW/t <VSP < 12 kW/t). The CO, hydrocarbon (HC), NOx, and particulate number (PN) average emission rates in the high-emission points could be 3.15–14.93 times, 1.93–24.89 times, 3.23–6.03 times, and 3.22–30.27 times of those of average emission rates. The HC, NOx, and PN average emission rates of China IV vehicles in the high-emission points were 2.46–4.92 times, 3.56–6.03 times, and 3.22–13.21 times of those of average emission rates, not less than those of China III (1.93–2.52 times, 2.75–3.90 times, and 9.98–22.34 times). Test vehicles mainly emitted nucleation-mode and Aitken-mode particles, and the increase of the PN concentration emission rate in low-speed and high-speed regions was higher than that in the medium-speed region. The exhaust gas recirculation (EGR) + diesel particulate filter (DPF) could effectively inhibit the Aitken output caused by turbocharged intercooler (CIC). The selective catalytic reduction (SCR) might cause more nucleation-mode particles.

1. Introduction

Air quality control at an urban scale is one of the biggest challenges for many countries at present, and one of the primary sources is automotive exhaust emission [1]. In developed countries, such as Europe, with the successful implementation of effluent standard and exhaust after-treatment techniques, the discharge from automobiles has been significantly reduced [2]. However, road transport still contributes about 20% of PM2.5 and 39% NOx in Europe [1,3]. In developing countries including China, the road transport is also one of the primary sources of air pollutants in the big cities, due to frequent traffic jams, poor vehicle maintenance, low fuel quality, trickery in production conformity, and unreliable retrofit programs [4,5]. For example, the vehicles in major metropolitan cities of India are estimated to account for 70% of CO, 50% of HC, 30–40% of NOx, and 30% of PM2.5 of the total pollution loads [6]. In China, the number of vehicles has increased dramatically over the past two decades because of rapid socioeconomic development and urbanization. Hence, traffic-related emissions have become one of the primary sources of urban air pollution in metropolitan areas (Beijing, Guangzhou, Shanghai, and Tianjin) of China [7,8,9,10]. For emission inventories, results have indicated that vehicles contributed 10.0–38.0%, 19.8–36.1%, 7.9–39.4%, and 9.0–67.2% of total PM2.5, NOx, VOCs, and CO emissions in some metropolitan areas of China, respectively [11,12,13,14,15]. Motor vehicle pollution poses substantial challenges to urban air quality [16].
Emission compliance has been determined since 1970 by the certified testing of selected emissions from representative vehicles during standard driving cycles using chassis dynamometers, to reduce vehicle emissions. The European Commission (EC) introduced the New European Driving Cycle (NEDC) in 2000. Then the United Nations world forum for the harmonization of vehicle regulations (UN/WP29) developed the Worldwide harmonized Light-duty Test Cycle (WLTC) in 2015. However, they are not sufficient to represent real-world operations of vehicles [17,18]. The driving characteristics proposed by NEDC and WLTC deviate noticeably from those experienced during real-world driving conditions [19]. The reduced range of acceleration-speed conditions offered by NEDC leads to much lower NOx emission than that under real-world conditions [20]. Moreover, WLTC lacks some driving characteristics for real-world driving factors, such as driving at low velocities, ambient conditions, driving behavior, and road congestion, thus resulting in much lower emission levels than those under real-world conditions [21,22,23,24]. Moreover, the disorder in traffic management causes frequent lane changing and stop-and-go conditions, and these factors lead to complex driving conditions that are difficult to capture in laboratory tests using existing standard driving cycles in China [25].
To assess the real-world emission rates, lots of researchers have begun to study vehicular emissions using the portable emission measurement system (PEMS) in recent years [26]. This method has advantages over traditional laboratory measurements, which can collect the data of second-by-second emissions and speed variation of the vehicle under real-world conditions at any location traveled by the vehicle [27]. O’Driscoll et al. expressed that the variability in NOx emission detected by PEMS measurements was significant and could exceed the type-approval limit by 22 times [26]. Wyatt, Li, and Tate used a PEMS to record CO2 emissions from passenger cars in an urban road network [28]. Luján et al. measured the emission level of a Euro 6 light-duty diesel vehicle in a real-world driving route using a PEMS [24]. They found that the NOx emission level at lower speeds with more accelerations and decelerations was noticeably higher than that at constant high speeds, and 60% of the total HC and CO emissions was emitted in the motorway section [24]. Cha et al. used a PEMS to test the emission level of Euro 6 vehicles in Korea and found that the average NOx emissions from most test vehicles in real driving conditions exceeded the emission limit on test routes by approximately 6.6 times [29]. PEMS studies have also been carried out in Chinese cities. Liu et al. measured on-road emission factors of diesel buses in Beijing using a PEMS and ELPI [30]. They found that nanoscale particulate matters made a significant contribution to the particle number distribution [30]. Cheng et al. studied the emission of ultrafine particles from gasoline and diesel vehicles [31]. They noticed that the maximum particle emissions from gasoline buses and diesel cars appeared in the high vehicle-specific power (VSP)-low-speed bin and the high VSP-medium speed bin, respectively [31]. However, previous works on real-world vehicle emission characteristics have mainly focused on the influences of fuel, speed, vehicle type, altitude, and other factors on vehicle emission quantity and components. However, few studies have investigated the transient trend of automotive exhaust emissions through on-road measurements.
Most of the previous works limit the scope of other factors to discuss the relationship between vehicle emission characteristics and a single element. For example, they study the relationship between vehicle emission and speed by limiting the acceleration range. However, the acceleration and speed of a vehicle are continually changing with time under transient conditions. The emission characteristics under temporary conditions are emission characteristics of vehicles under the combined action of multiple factors, such as speed, acceleration, grade, and so on. In addition, these factors change over time in the real world. Therefore, it is necessary to carry out the transient characterization for automotive exhaust emissions in Tianjin.
The objective of this paper was to study the transient characteristics of exhaust emissions from different vehicle types in Tianjin. To achieve the desired goal, a PEMS was used to monitor emissions from selected test vehicles-private cars, passenger vehicles, and cargo vehicles (fueled with gasoline, diesel, and liquefied natural gas). In total, nine vehicles with China III and China IV emission control standards were tested. The obtained data included vehicle type, emission standards, mileage traveled, and fuel type. They were used to comprehensively understand the emission characteristics of different test vehicles in the real-road environment. Therefore, the obtained results from the current study could improve the control technology of vehicle emissions in China.

2. Experiments

2.1. Sampling Equipment

The system primarily consisted of an ECOSTAR (Sensor, Saline, MI, USA) gaseous analyzer and a high-temperature ELPI+TM (Dekati, Kangasala, Finland). The test setup configuration of PEMS in this present paper is shown in Figure 1.
The ECOSTAR analyzer could collect instantaneous data of gaseous pollutant emissions (CO2 (carbon dioxide), CO, HC (hydrocarbon), and NOx) at a 1-s resolution. This device measured CO2 and CO emissions by the infrared absorption technology, NOx emission by the ultraviolet absorption technology, and HC emission by a flame ionization detector. Also, an ECOSTAR emission flow meter (ECOSTAR_EFM), a temperature and humidity indicator, and a GPS device were connected to the ECOSTAR analyzer to be conjunction with the ECOSTAR analyzer for collecting vehicles exhaust and measurement of speed and emission flow. To ensure the accuracy of test results, the ECOSTAR gaseous analyzer was purged with pure nitrogen for 180 s. It was also calibrated with NO2 standard gas and mixed standard gases of CO2, CO, NO, and dimethyl methane (C3H8) before and after each experiment.
The high-temperature ELPI+TM was used to perform online real-time measurements of particle size-resolved distributions, PN, and quantity concentrations. The high-temperature ELPI+TM consisted of an ELPI+TM and a high-temperature ELPI+TM heating unit. The high-temperature ELPI+TM heating unit enables sampling of vehicle exhaust (10–180 °C, humidity < 90%) straight to the impactor without using any dilution. It is difficult for conventional particulate monitoring equipment to directly measure vehicle exhaust due to the high temperature and humidity of it. Therefore, EPA provided for the dilution sampling of particulate matter to reduce the temperature and humidity of vehicle exhaust previous, and China accepted this method. In the GB 17691–2018 of China [32], the vehicle exhaust was first diluted by a full-flow dilution system or partial-flow dilution system. The dilution gas was filtered by high-efficiency particulate filtration (HEPA) or activated carbon. After dilution, the temperature of exhaust gas was controlled at 42–52 °C. The measurement size range was 0.023–10 μm. However, due to the presence of unburned gaseous organic compounds in the vehicle exhaust, new particles may condense and grow to form during the dilution process, which may interfere with the measurement results. High-temperature ELPI+TM heating unit can avoid the interference to measurement results due to dilution and have improved sensitivity as no dilution systems. Meanwhile, the temperature control function of the high-temperature ELPI+TM heating unit can reduce the effect of temperature on the calibration of ELPI+TM (D50% values). The high-temperature ELPI+TM is insensitivity to variations in sample pressure. The ELPI+TM measurement is based on the charging of particles and electrical detection of charged particles in a low-pressure impactor. It was capable of measuring emission particles with aerodynamic diameters between 6 nm and 10 μm and classified them into 14 stages according to their sizes through particle charging and inertial classification mechanisms. The 50% of aerodynamic particle diameter (D50%) and the geometric mean aerodynamic diameter (Di) for each stage of ELPI+TM are presented in Table A1.
To avoid the condensation during the process of sampling, there was a heating sampling line between the high-temperature ELPI+TM and the sample line. The temperature of the heating sampling line was set to 195 °C. The temperature of the high-temperature ELPI+TM heating unit was set to 180 °C. Keep the pressure under the 1st stage was 40 mbar. Then, zero the instrument and start testing when the temperature of the heating kit reaching 180 °C. Due to the limited interior space, ELPI samples were not installed on gasoline vehicles.

2.2. Test Vehicles

Road emission measurement tests were conducted in 2017 in Tianjin, China. Two gasoline cars (Vehicle brand: DONGFENG-NISSAN), two diesel trucks (Vehicle brand: FAW-JIEFANG), two diesel middle bus (Vehicle brand: JIANGLING), two diesel buses (Vehicle brand: YUTONG) and one liquefied natural gas (LNG) bus (Vehicle brand: FAW-BUS (WUXI)) were selected in the present study. The engine type of LNG bus was CA6SM2-35E4N (NG), a stoichiometric spark-ignition engine. Its engine capacity and maximum power were 11.04 L and 261 kw. The stoichiometric air-fuel ratio (mass ratio) was 17.2 at 1000-rpm full-load condition. The specifications of these test vehicles are depicted in Table 1. The fuel composition are depicted in Table A2.

2.3. Testing Route

Driving courses for on-board measurements were designed to simulate real traffic conditions in Tianjin. The test routes of medium buses and cars were mainly located in the central urban area. Trucks were tested in suburban areas between Jinnan and Dongli Districts, whereas buses ran on urban areas and suburban areas around Jinnan District and primary urban areas. The total distance of the urban area route was approximately 38–49 km, the length of the suburban areas between Jinnan and Dongli Districts was 42–66 km and the length of the suburban areas around Jinnan District and central urban areas was 26–47 km. Trucks were mainly tested in suburban areas as they were not permitted to enter the central city of Tianjin. Drivers followed other vehicles on driving routes, and the driving cycle reflected actual driving conditions. Due to speed-limited sections and traffic jams, the average speed of test vehicles was below 40 km/h. The time duration for one test route was between 3000 s and 6000 s, and the length proportions of urban areas, suburbs, and expressways were approximately 20%, 70%, and 10%, respectively. Moreover, operating conditions, including rapid acceleration and fast braking, reflected real-road traffic conditions (crowded and chaotic) in Tianjin. Test routes consisted of elevated roads, highways, arterial roads, and residential roads. Driving condition parameters for each test vehicle are presented in Table A3.

2.4. Data Processing

A PEMS measured the emission rates (g/s) of gaseous contaminants (CO2, CO, HC, NOx, PN, and PM2.5). Subsequently, pollutant concentrations, exhaust mass flow rates, and GPS data were synchronized to emission rates and speeds.
As a function of vehicle speed, acceleration/deceleration, and road slope, VSP (unit: kW/ton) is a practical measure of real-world driving emissions [33] and accounts for changes in kinetic and potential energies associated with hill climbing, rolling resistance, and aerodynamic drag. The mathematical expression of VSP is presented in Equation (1) [34].
VSP   =   ( Fa   +   F ω   +   Fr   +   Fs ) · v / m   =   av ( 1 + ε ) + ρ a i r C d A v 3 2 m + f v g c o s θ + g v s i n θ
where Fa, Fω, Fr, and Fs are the resistances induced by vehicle acceleration, wind, rolling, and road slope, respectively, v is vehicle speed (units: km/h in Equation (1) and m/s in Equations (2) and (3)), a is acceleration or deceleration (m/s2), m is the actual mass of the vehicle (kg), ε is the moment of inertia of rotational parts, such as bent axle and flywheels, ρair is the density of air (kg/m3), Cd is the wind resistance coefficient, A is the frontal area of the vehicle (m2), f is the rolling resistance coefficient, g is gravitational acceleration (m/s2), and θ is the angle of the gradient.
The VSP for light-duty vehicles, such as LDGCs, can be calculated by Equation (2) [35]. In the MOVES model developed by USEPA, the VSP for medium- and heavy-duty diesel vehicles is calculated by Equation (3).
VSP = v (1.1a + 9.81tanθ + 0.132) + 0.000302v3
VSP = 0.064v + 0.000265v3 + av + gvsinθ
Depending on the vehicle state (deceleration, acceleration, idling, and cruising), the speed (low-speed, medium-speed, and high-speed segments), and the range of VSP, 68 operation mode bins were constructed, and the developed bins are presented in Table A4. The mean emission rate of gaseous pollutants and particulate matters for every operation mode bin was first calculated, and the summation of the obtained average values was then executed according to the probability value of each operation mode bin. The average emission factor was calculated by the average value of the emission rate and speed. The mean emission factor and rate for gaseous pollutants and particulate matters for each test vehicle were estimated by Equations (4) and (5), respectively [36].
E F i , j ¯ = 3600 E R i , j ¯ 1000 v i ¯
E R i , j ¯ = k = 0 68 T k T n ( 1 T k 1 T k E R i , j , k )
where E F i , j ¯ is the average emission factor of pollutant j for test vehicle i (g/km), v i ¯ is the average speed of test vehicle i during the driving cycle (km/h), E R i , j ¯ is the average emission rate of pollutant j for test vehicle i (g/s), T k is the number of second-by-second data points for each vehicle in operating mode bin k (s), T n is the number of second-by-second data points for each vehicle in the entire driving cycle (s), and E R i , j , k is the instantaneous emission rate of pollutant j for test vehicle i in operation mode bin k (g/s).
Surfer 8.0 software (Golden Software, Golden, CO, USA) was used to establish the grid file with pollutant emission rates at the Z-axis, speed at the X-axis, and VSP at the Y-axis based on the kriging method. The grid file of Surfer 8.0 software (Golden Software, the United States) provided the data that displayed the relationship between pollutant emission rates and speed-VSP of each test vehicle. The pollutant emission rate for each grid node was calculated based on all test data of the test vehicle adjacent to the node.

3. Results and Discussion

3.1. On-Road Driving-Based Emission Factors

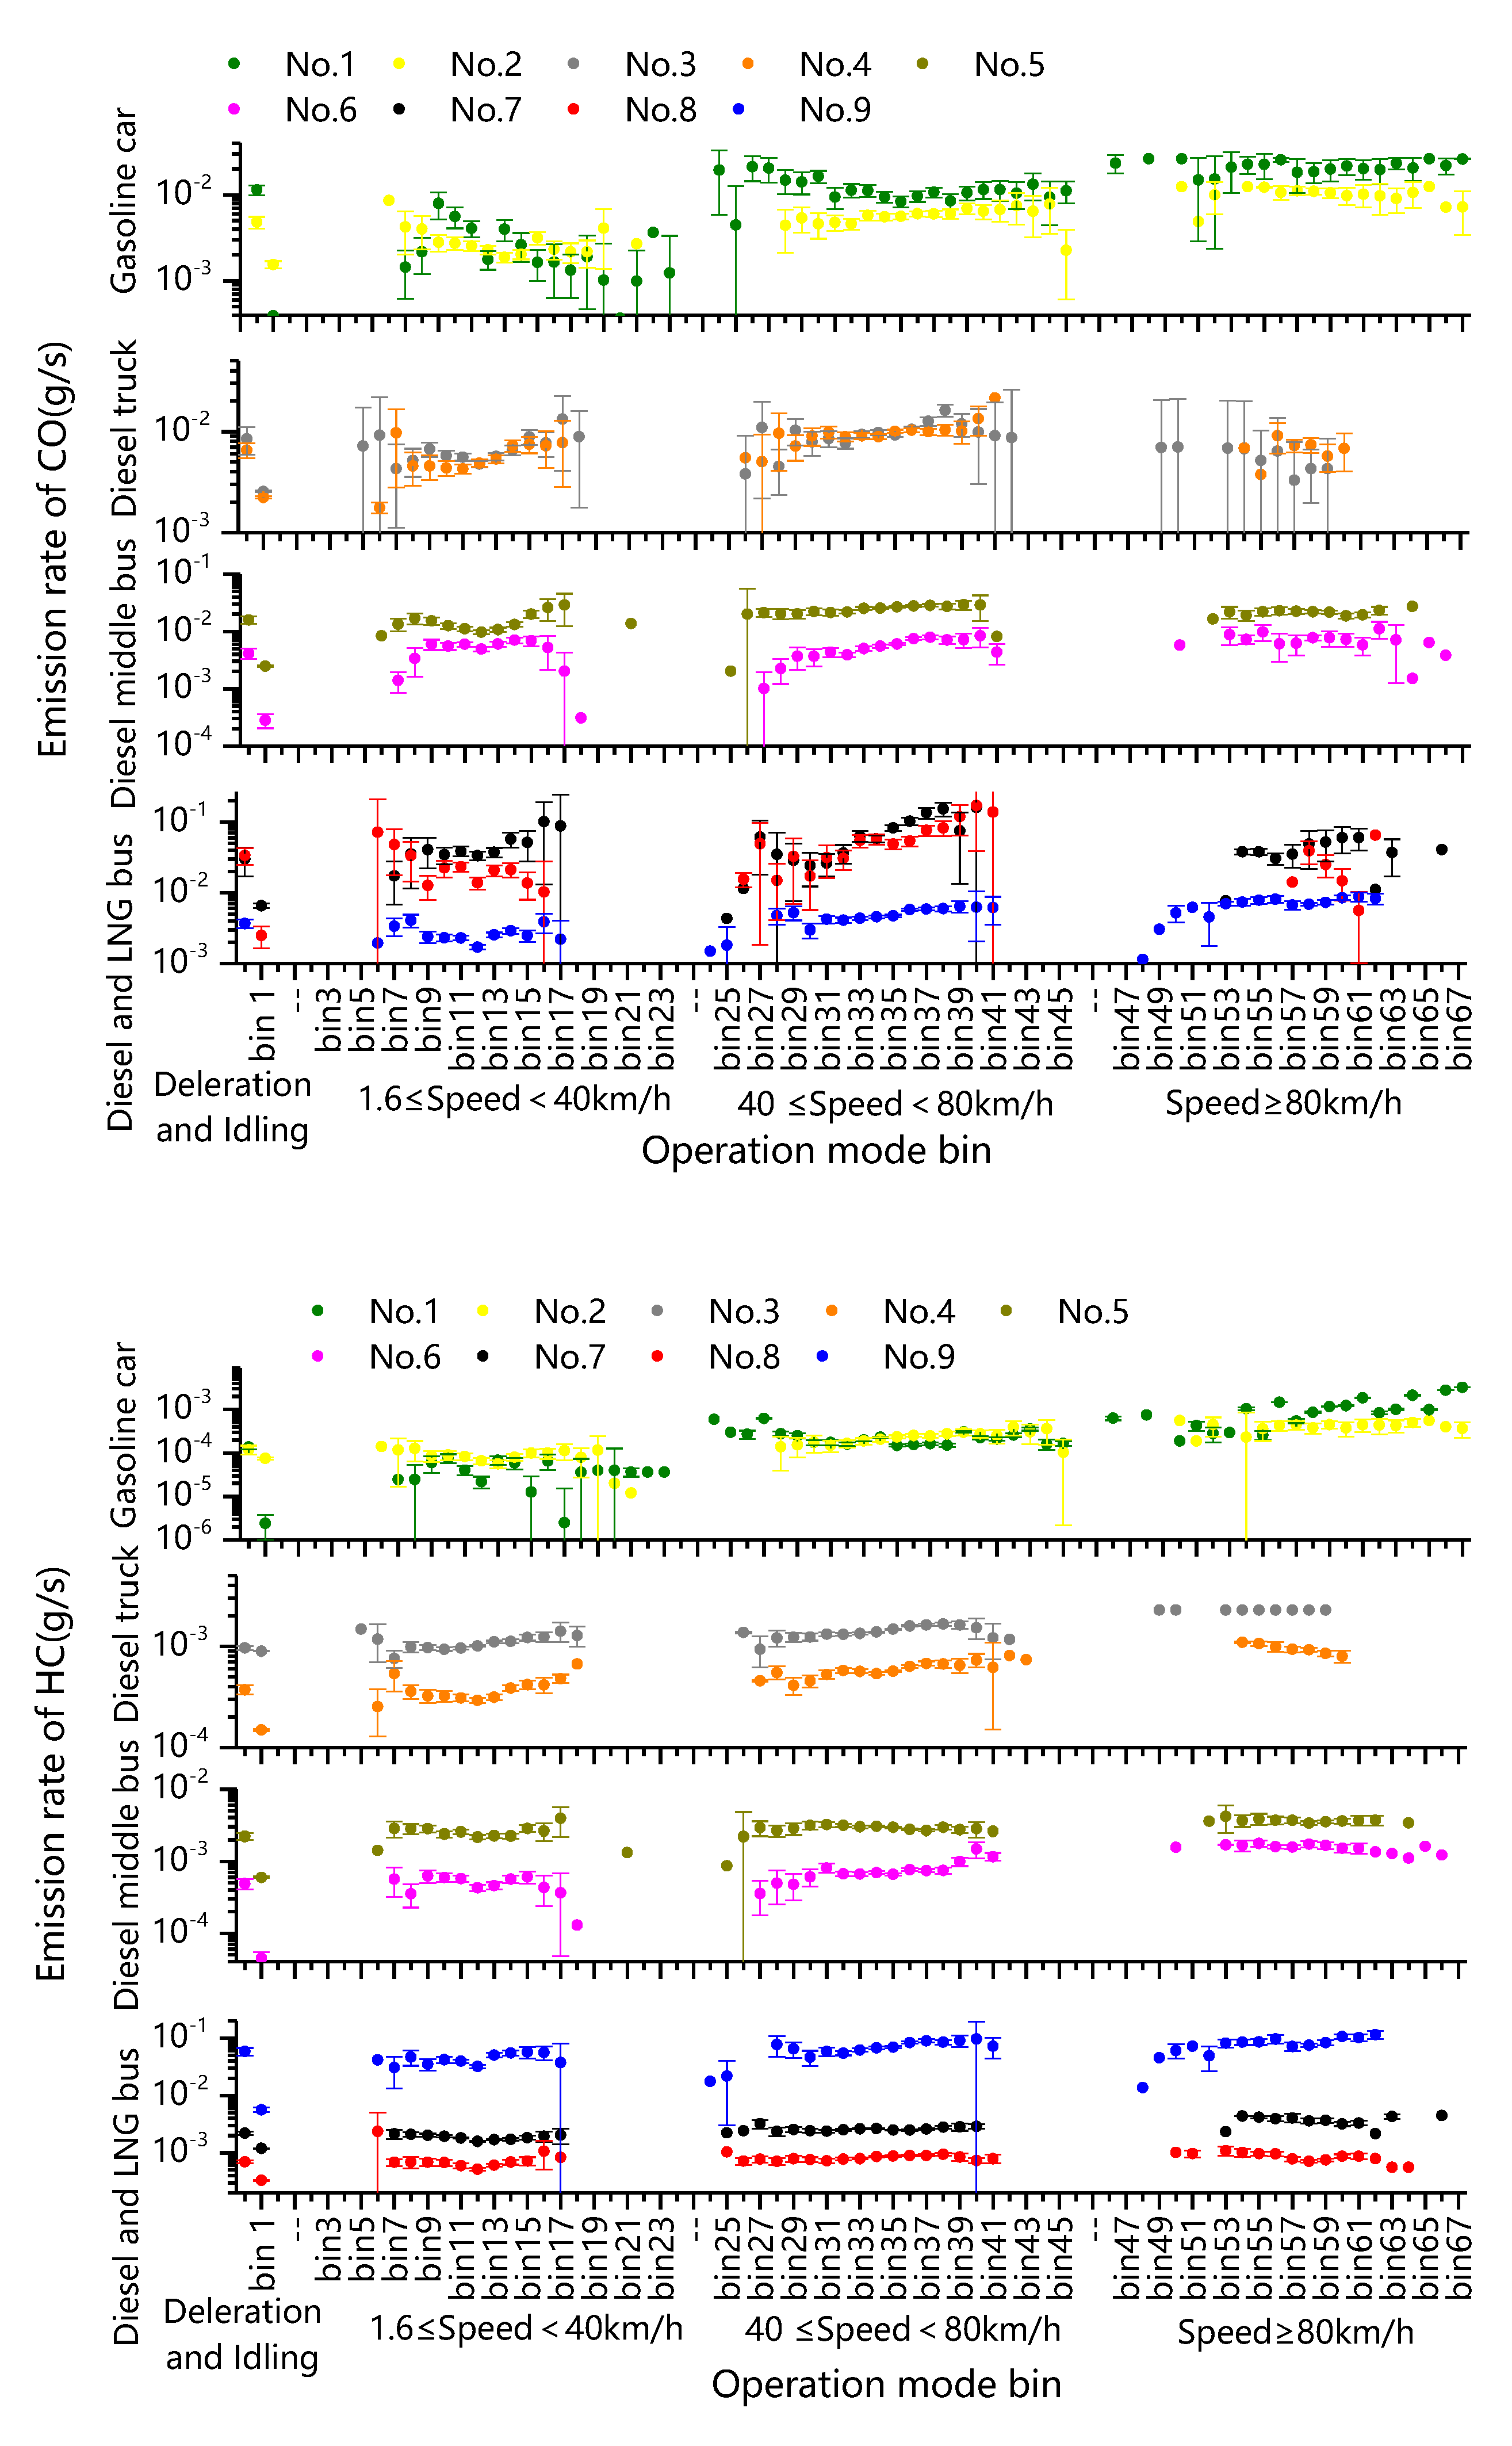
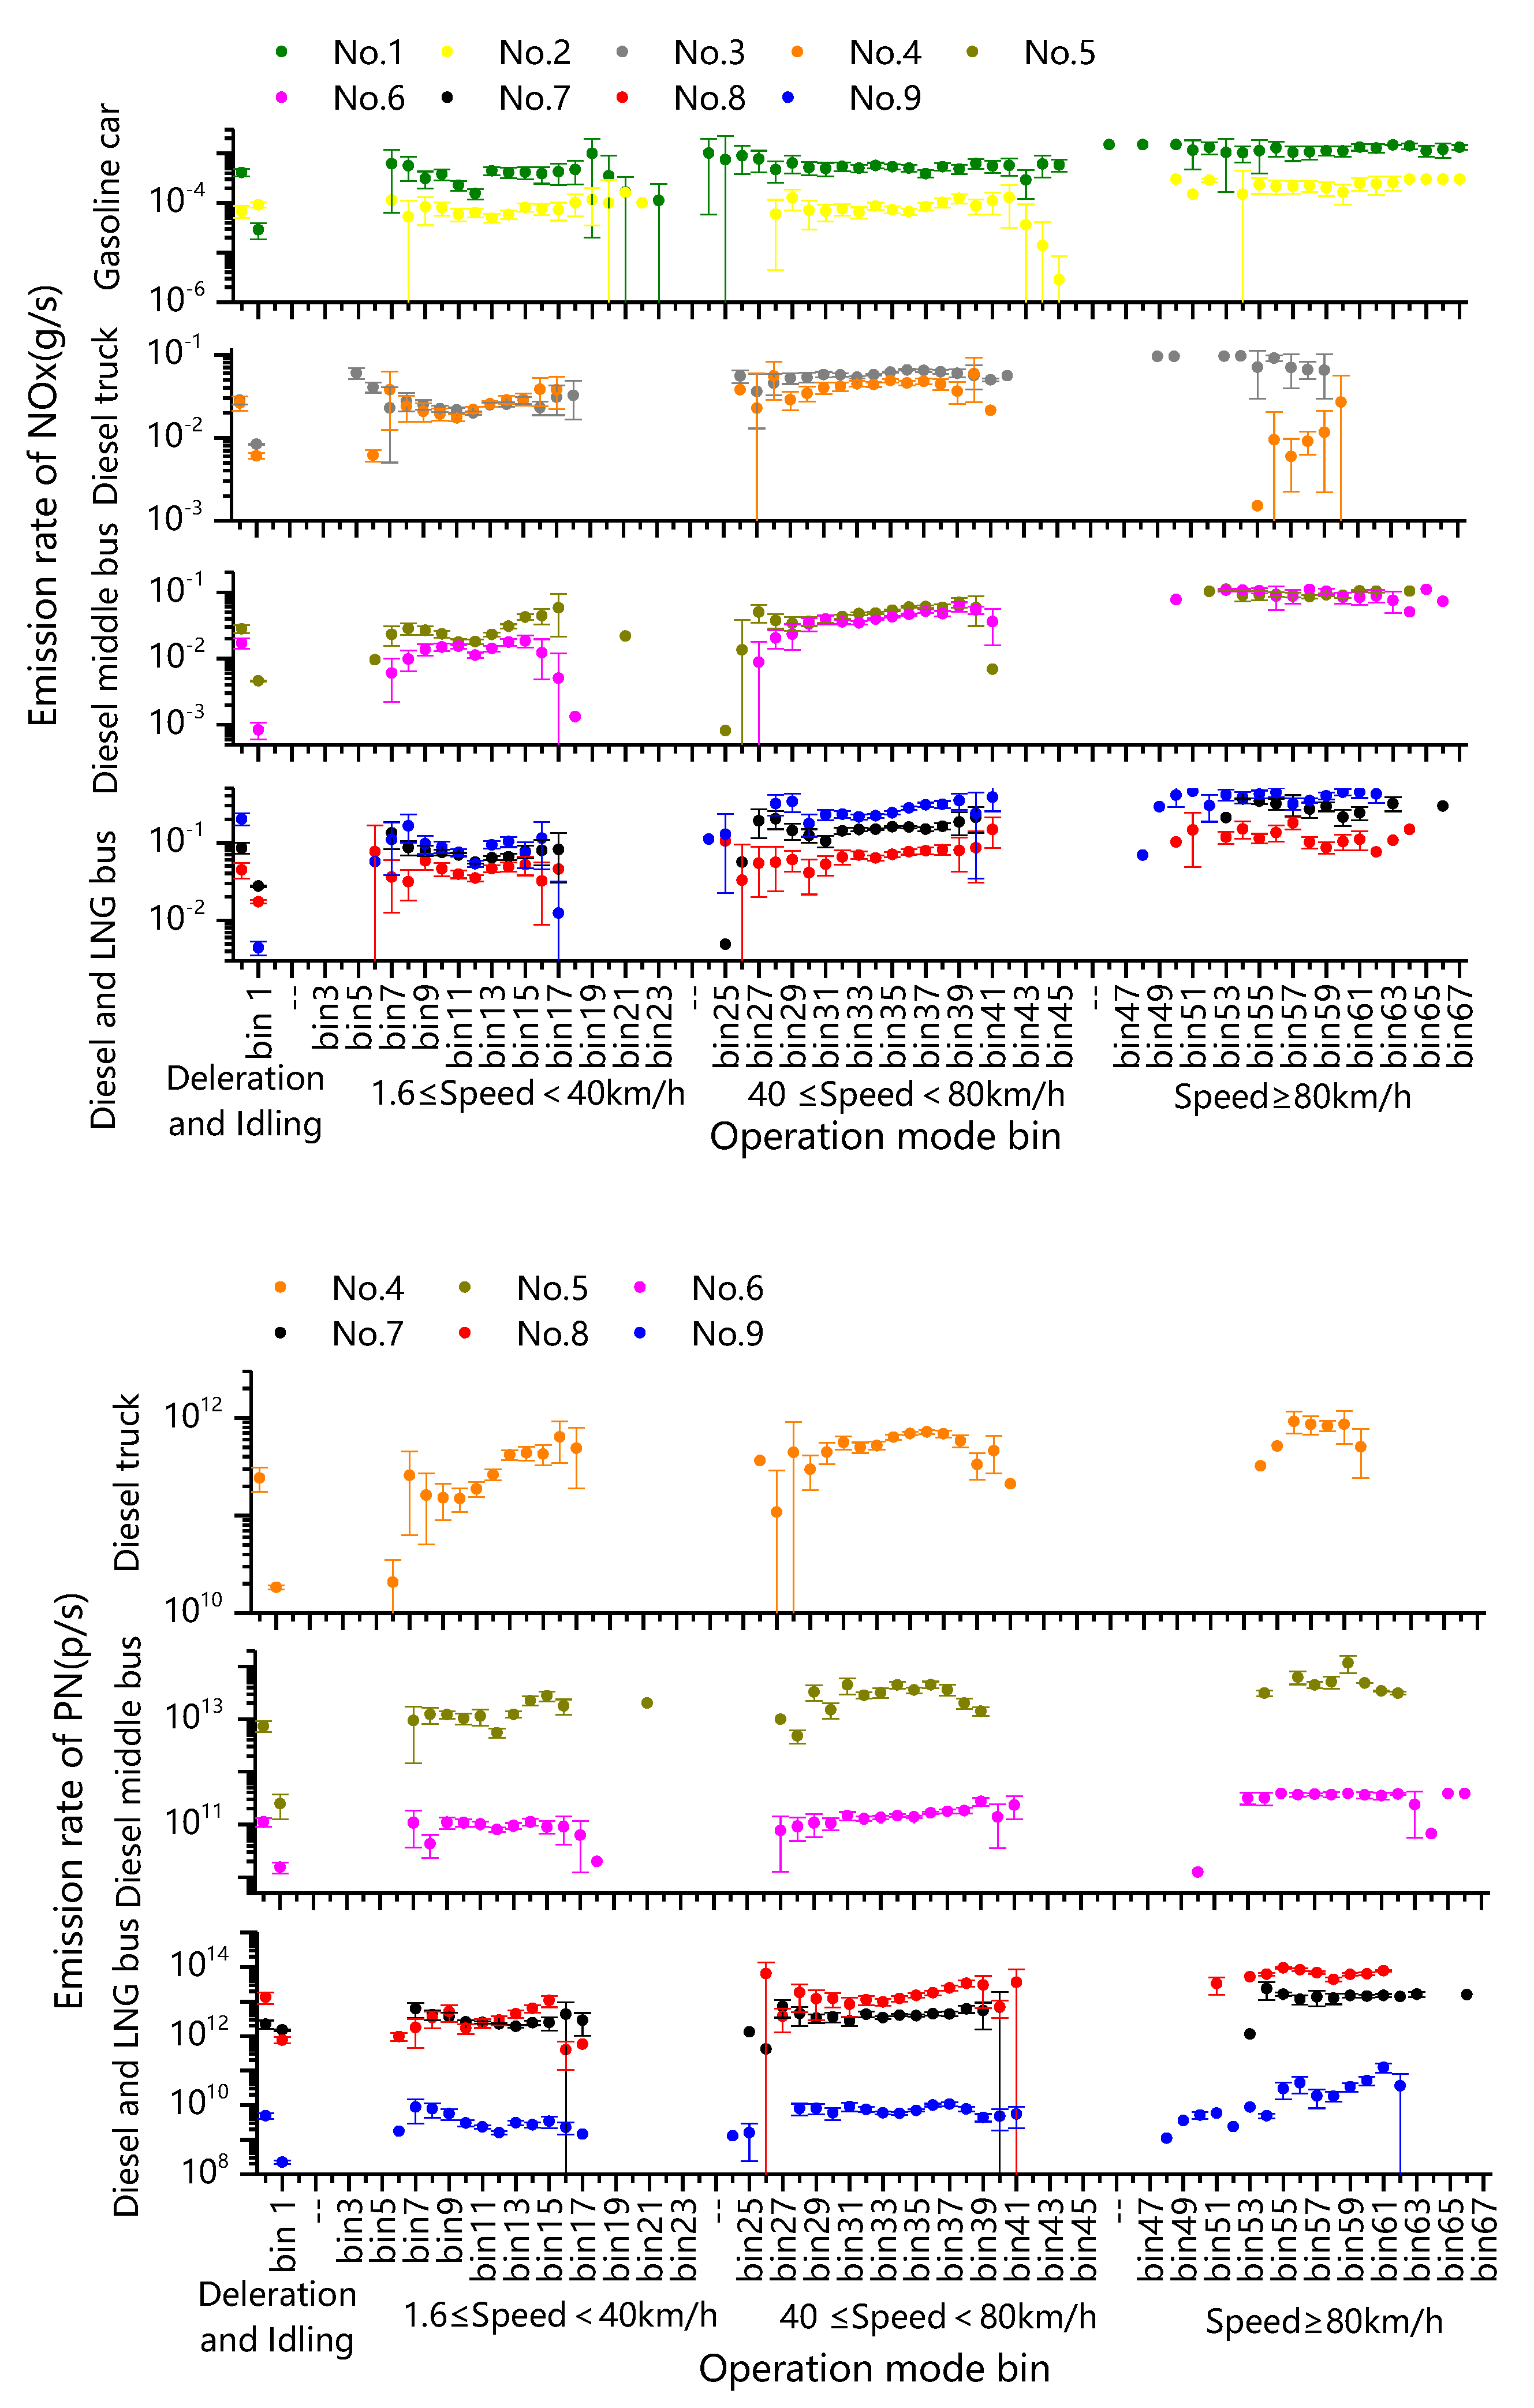
Figure A1 (Appendix A) present the emission rates of CO, HC, NOx, and PN for each test vehicle according to the operation mode bins in Table A4. The average CO, HC, NOx, PN, and PM2.5 emission factors and their 95% confidence intervals are presented in Table 2. Due to abnormal measurement data, the PN and PM2.5 emission factors of No. 3 (diesel truck, China III) are not applicable.
As presented in Table 2, the CO, HC, and NOx emission factors of No. 1 (gasoline car, China IV) were 74.4%, 14.3%, and 300% higher than those of No. 2 (gasoline car, China IV). No. 1 gasoline car, China IV) and No. 2 (gasoline car, China IV) have a similar vehicle brand, vehicle type, model year, and emission standards. However, the mileage traveled by No. 1 (gasoline car, China IV) was approximately 2.8 times that of No. 2 (gasoline car, China IV). Therefore, the emission factors were influenced significantly by the mileage traveled factor of the test vehicles because older or higher-mileage vehicles present significant deterioration in their engine performance, vehicle parts, or catalytic efficiency, which has been associated with higher emissions [37,38].
To diesel vehicles, the gaseous pollutant and particulate matter emission factors of China IV test vehicles (No. 4 (diesel truck, China IV), No. 6 (diesel middle bus, China IV), and No. 8 (diesel bus, China IV)) were observed to be lower than those of the China III test vehicles (No. 3 (diesel truck, China III), No. 5 (diesel middle bus, China III) and No. 7 (diesel bus, China III)). The PN emission factors of diesel buses were the only exception. The CO, HC, and NOx emission factors of China IV test vehicles were approximate 27.9–86.3%, 22.8–30.9%, and 48.0–74.1%, respectively, of those of China III test vehicles. The PM2.5 emission factor of No. 6 (diesel middle bus, China IV) was 50.0% of that of No. 5 (diesel middle bus, China III), and the PM2.5 emission factor of No. 8 (diesel bus, China IV) was 9.1% of that of No. 7 (diesel bus, China III). On the other hand, the PN emission factor of No. 8 (diesel bus, China IV) was 232.4% higher than that of No. 7 (diesel bus, China III). This abnormal increase of PN in comparison to No. 8 (diesel bus, China IV) might have been caused by the direct interaction of NH3 with the catalyst material and the exhaust gas in SCR [39]. As a result, SCR could lead to the emission of nanoparticles in high numbers, and it would not be possible to control the discharge of these ultrafine particles using the currently available after-treatment system [39].
Moreover, the emission factors were also observed to have been significantly affected by the type of fuel used in the test vehicles. The primary pollutant of the gasoline vehicles was CO, while the primary pollutants for diesel vehicles were NOx and particulate matter. CO is a typical pollutant of gasoline vehicles, while high emission of NOx and particulate matter could be considered to represent the emission characteristics of diesel engine [40]. The primary pollutants of the LNG bus were NOx and HC. LNG buses had significantly higher HC emissions because it is difficult for LNG pressed into the crevice during the compression stroke to burn due to the high auto-ignition temperature of methane [41]. It resulted in a large amount of unburned methane in the crack of the combustion chamber. Therefore, vast quantities of unburned methane were released from the combustor crevices [36]. LNG buses had significantly higher NOx emissions because the two major factors for NO production were combustion temperature and oxygen content, and the engine of LNG buses had higher combustion temperature and oxygen content than those of diesel buses [36,42,43]. Among the diesel vehicles, diesel buses, whose engine power was 1.5–2 times that of diesel trucks and diesel middle bus, presented the highest gaseous pollutant emission factors. Despite having the same emission standards, the CO, HC, and NOx emission factors of diesel buses were approximately 3.3–7.5 times, 1.03–1.83 times, and 1.8–3.2 times, respectively, of those of diesel trucks and diesel middle bus. It was demonstrating consistency with the findings of a previous study [16]. No. 5 (diesel middle bus, China III) presented the highest PN emission factors, while No. 4 (diesel middle bus, China III) registered the highest PM2.5 emission factors. Different after-treatment systems, vehicle maintenance, or driving conditions might have caused the PN and PM2.5 emission factor of No. 4 (diesel truck, China IV) and No. 5 (diesel middle bus, China III) to be larger than those of the other vehicles. The other deviations might have risen from fuel quality, dilution method, accuracy of the PEMS, engine type, after-treatment system, and the driving behavior.
Table 2 presents the data of average emission factors for different vehicle types from previous literature. It is noticeable that the obtained values in the present paper are very close to the available literature data. Hence, it indicates that the measurement data in the present study are true and effective. For gasoline test vehicles, the calculated average emission factors (CO = 0.39–0.68 g/km, HC = 0.014–0.016 g/km, NOx = 0.01–0.04 g/km) in this study are close to the previous studies in Table 2 (CO = 0.81 ± 0.35 g/km, HC = 0.046 ± 0.30 g/km, NOx = 0.05 ± 0.02 g/km). For diesel test vehicles, the calculated average emission factors (CO = 0.46–5.45 g/km, HC = 0.038–0.225 g/km, NOx = 2.54–10.90 g/km, PM2.5 = 0.03–1.52 g/km) in this study are also very close to the previous studies in Table 2 (CO = 3.35 ± 1.38 g/km, HC = 0.189 ± 0.110 g/km, NOx = 9.65 ± 2.62 g/km, PM2.5 = 0.83 ± 0.65 g/km). However, LNG test vehicles in this study had more HC and NOx emissions, and fewer CO and PM2.5 emissions than those in previous studies. It can be attributed to different factors including sampling equipment (SEMTECH-DS used by Zhang et al. and Aijuan et al. [36,49]), fuel type (compressed natural gas bus tested by Aijuan et al. [49]), emission standards, mileage traveled, after-treatment device (SCR used by Zhang et al. [36], and oxidation catalyst (Aijuan et al. [49])).

3.2. Transient Characterization of Pollutant Emission Rates

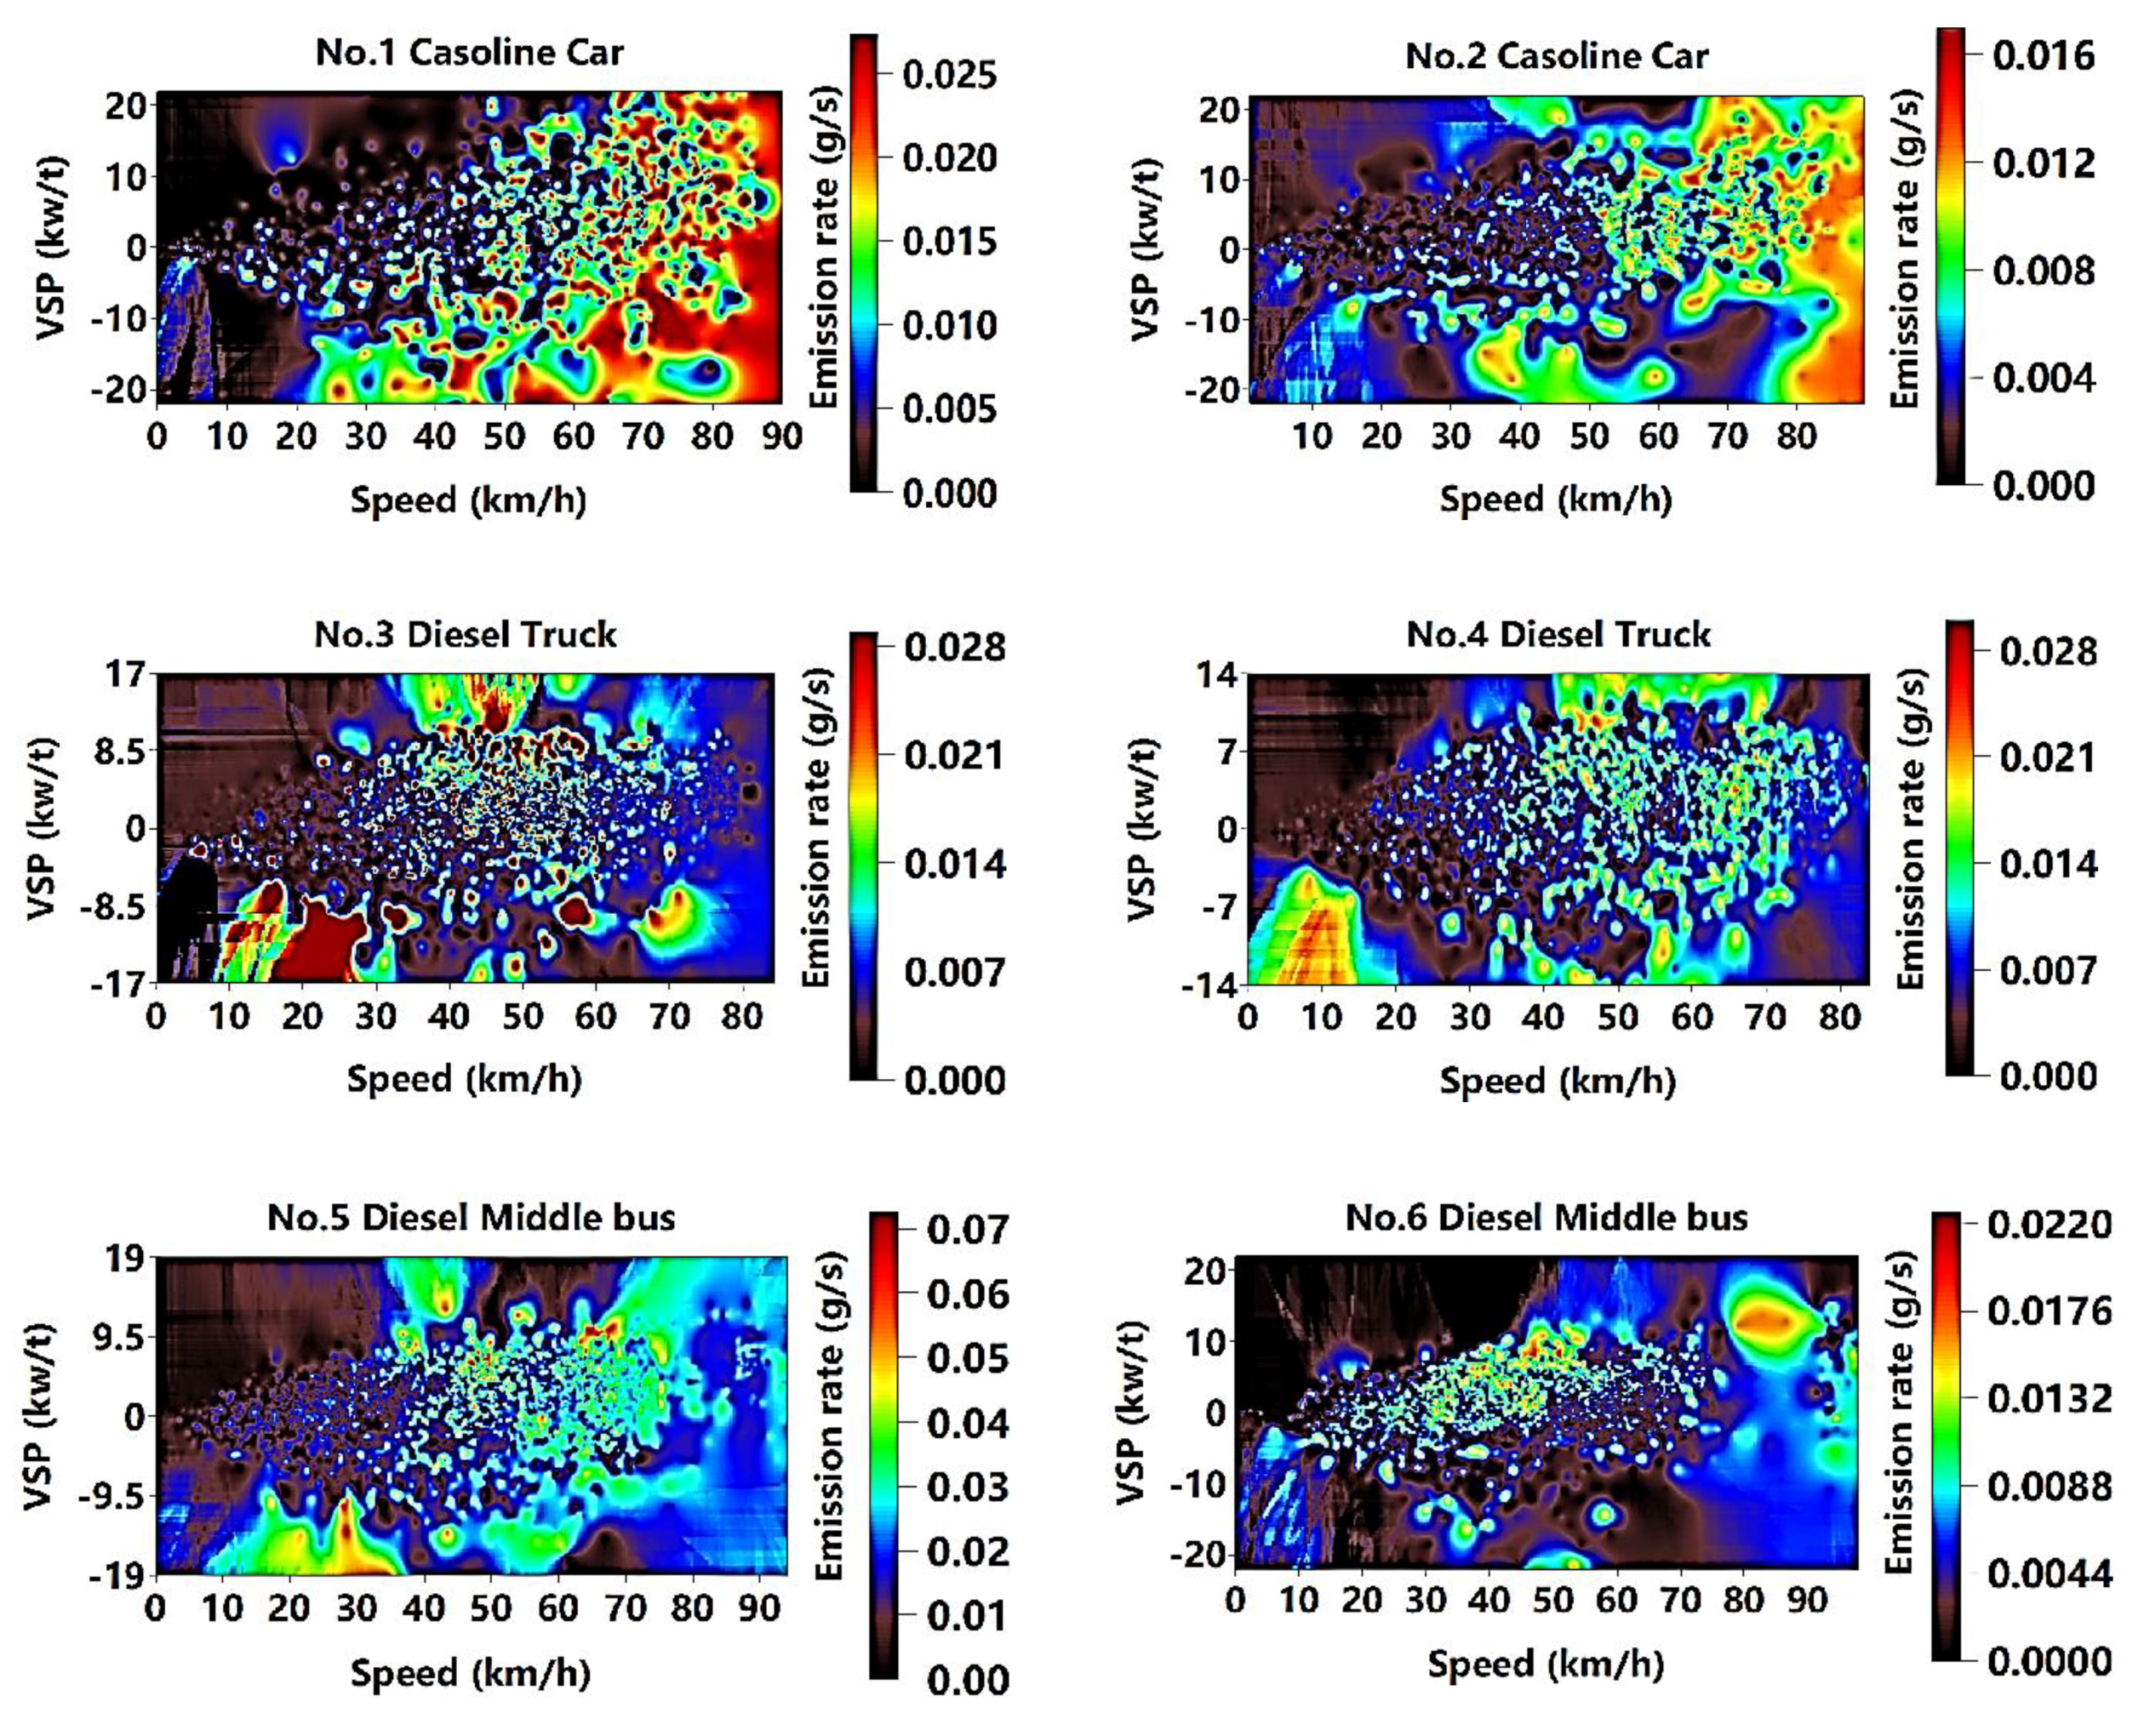
Figure A1 (Appendix A) presents the complicated relationship between the pollutant (CO, HC, NOx, and PN) emission rates and the speed-VSP for each test vehicle. To describe the transient emission characteristics, temporary test data of pollutant emission rates, speed, and VSP from each test vehicle were collected. The speed and VSP from each test vehicle all changed over time in the real world. Surfer 8.0 software (Golden Software, Golden, CO, USA) was used to obtain the image maps that displayed the relationship between pollutant emission rates and speed-VSP of each test vehicle.

3.2.1. The Distribution of High-Emission Points

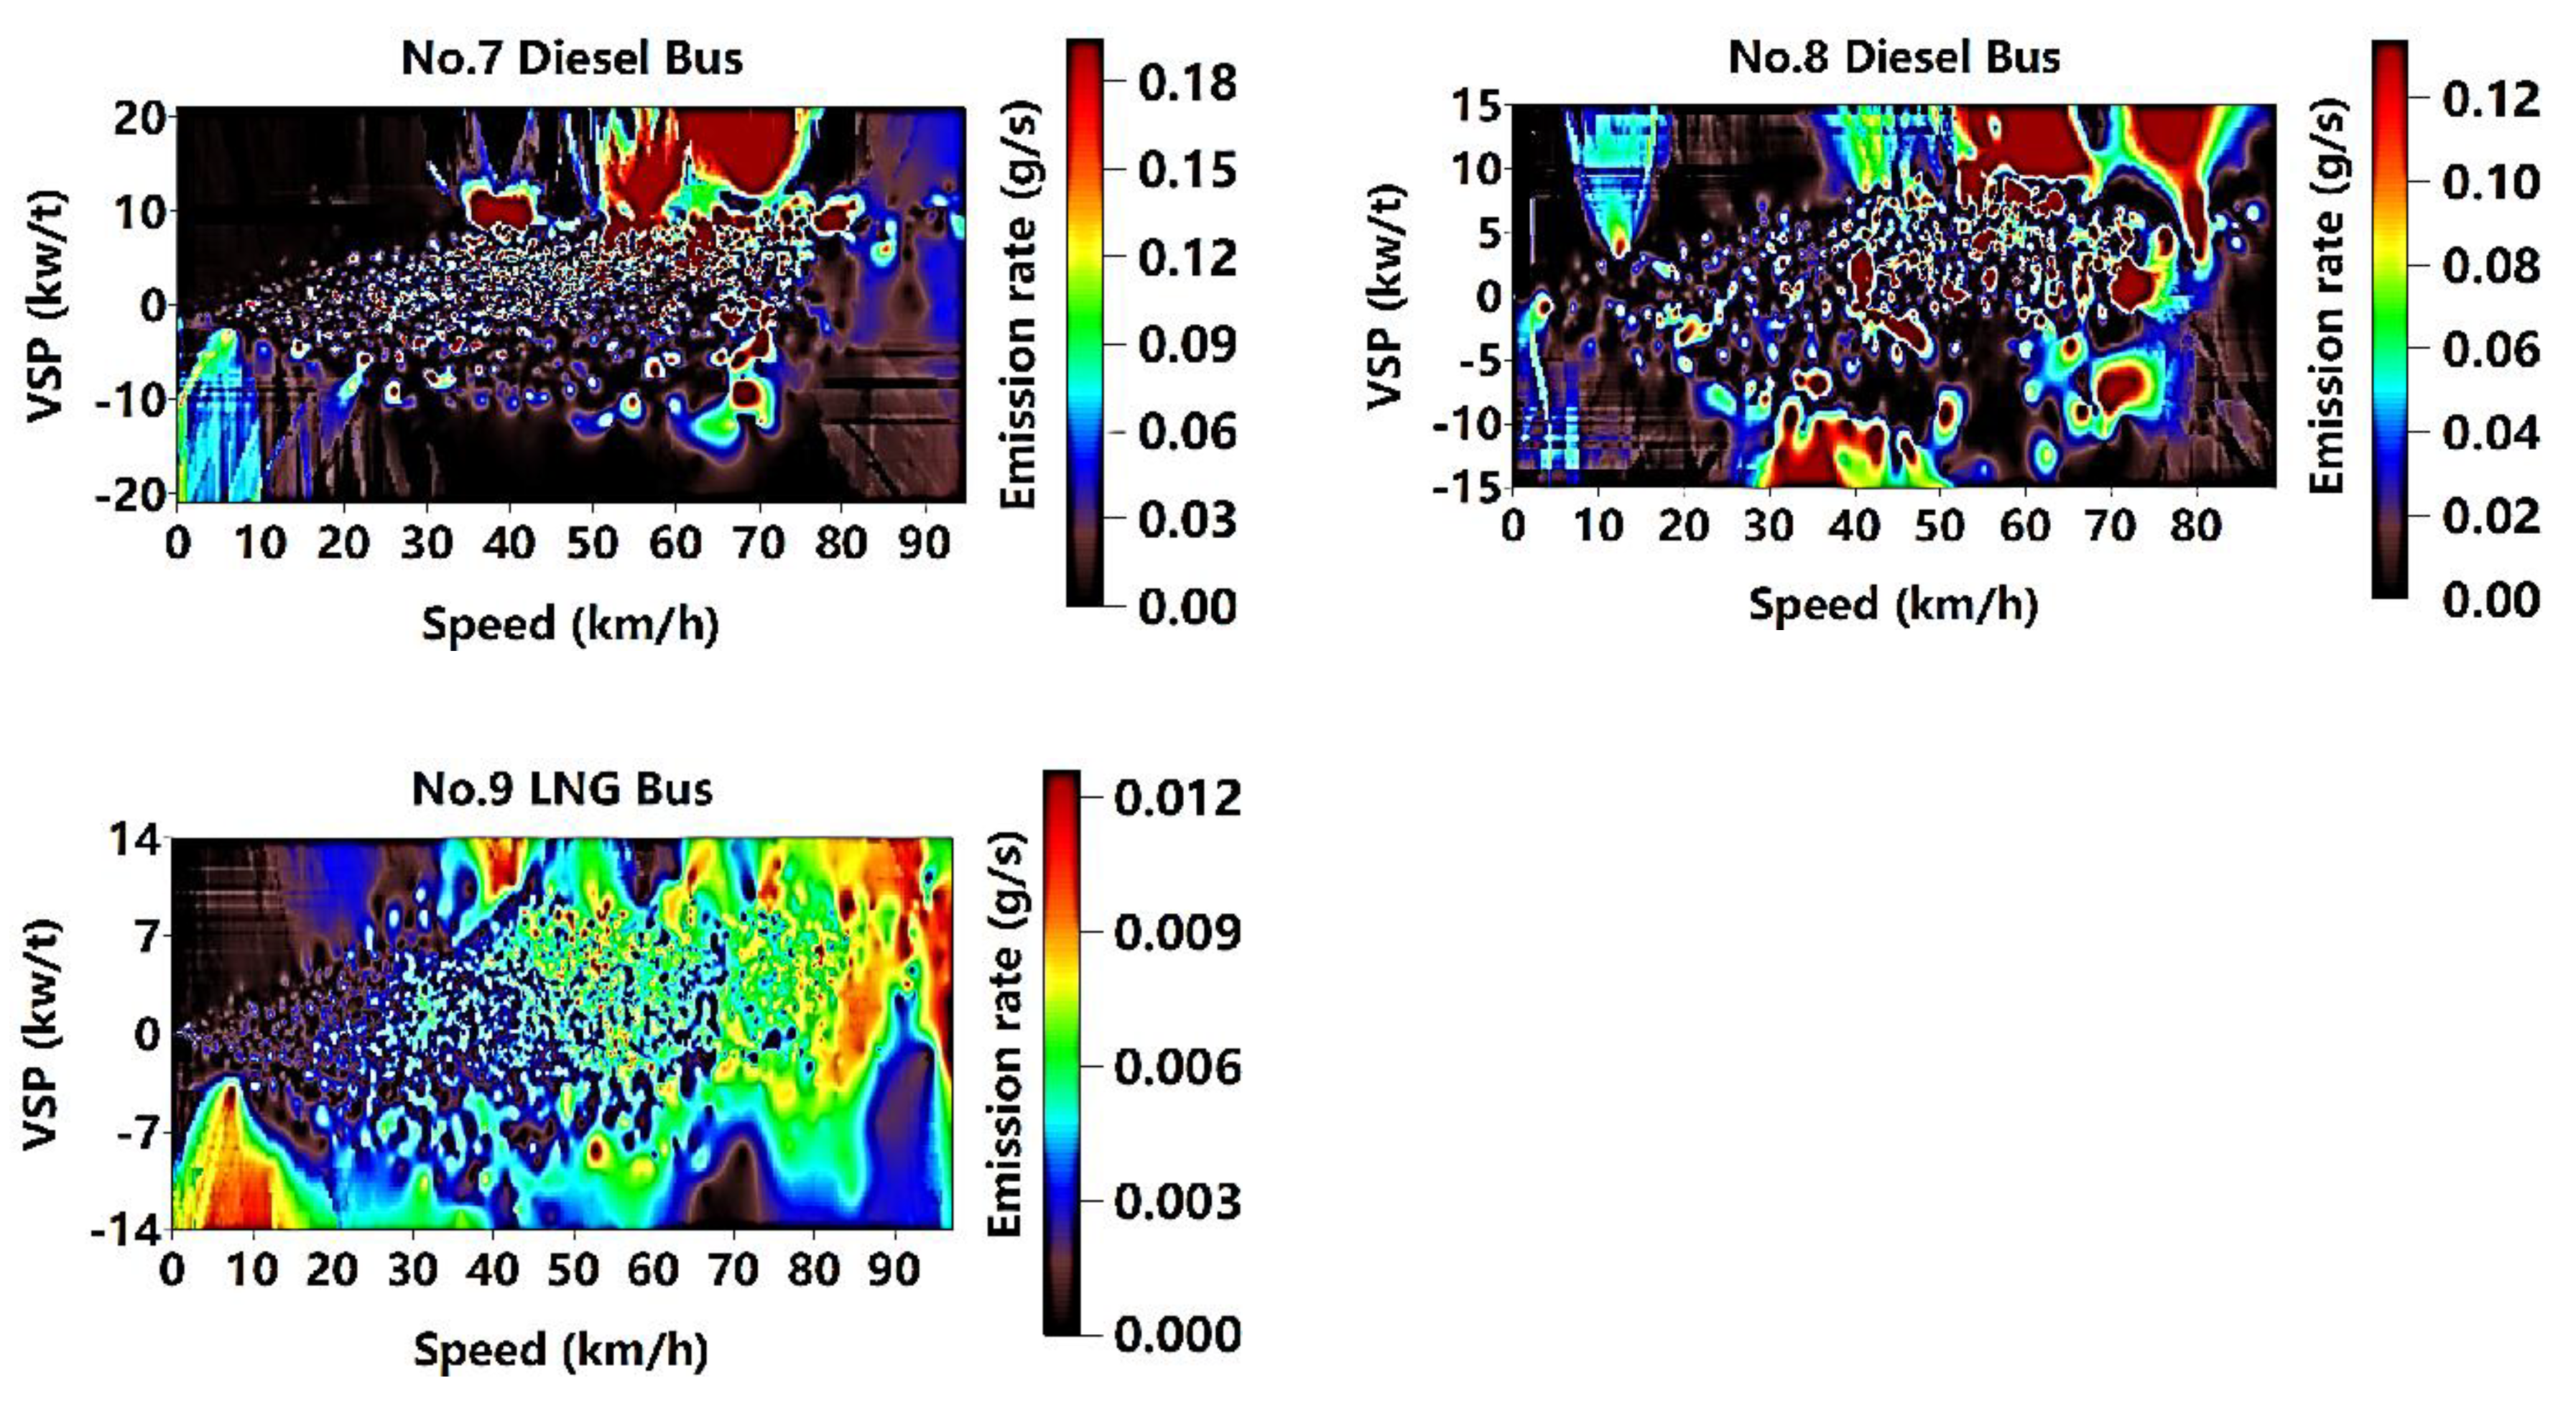
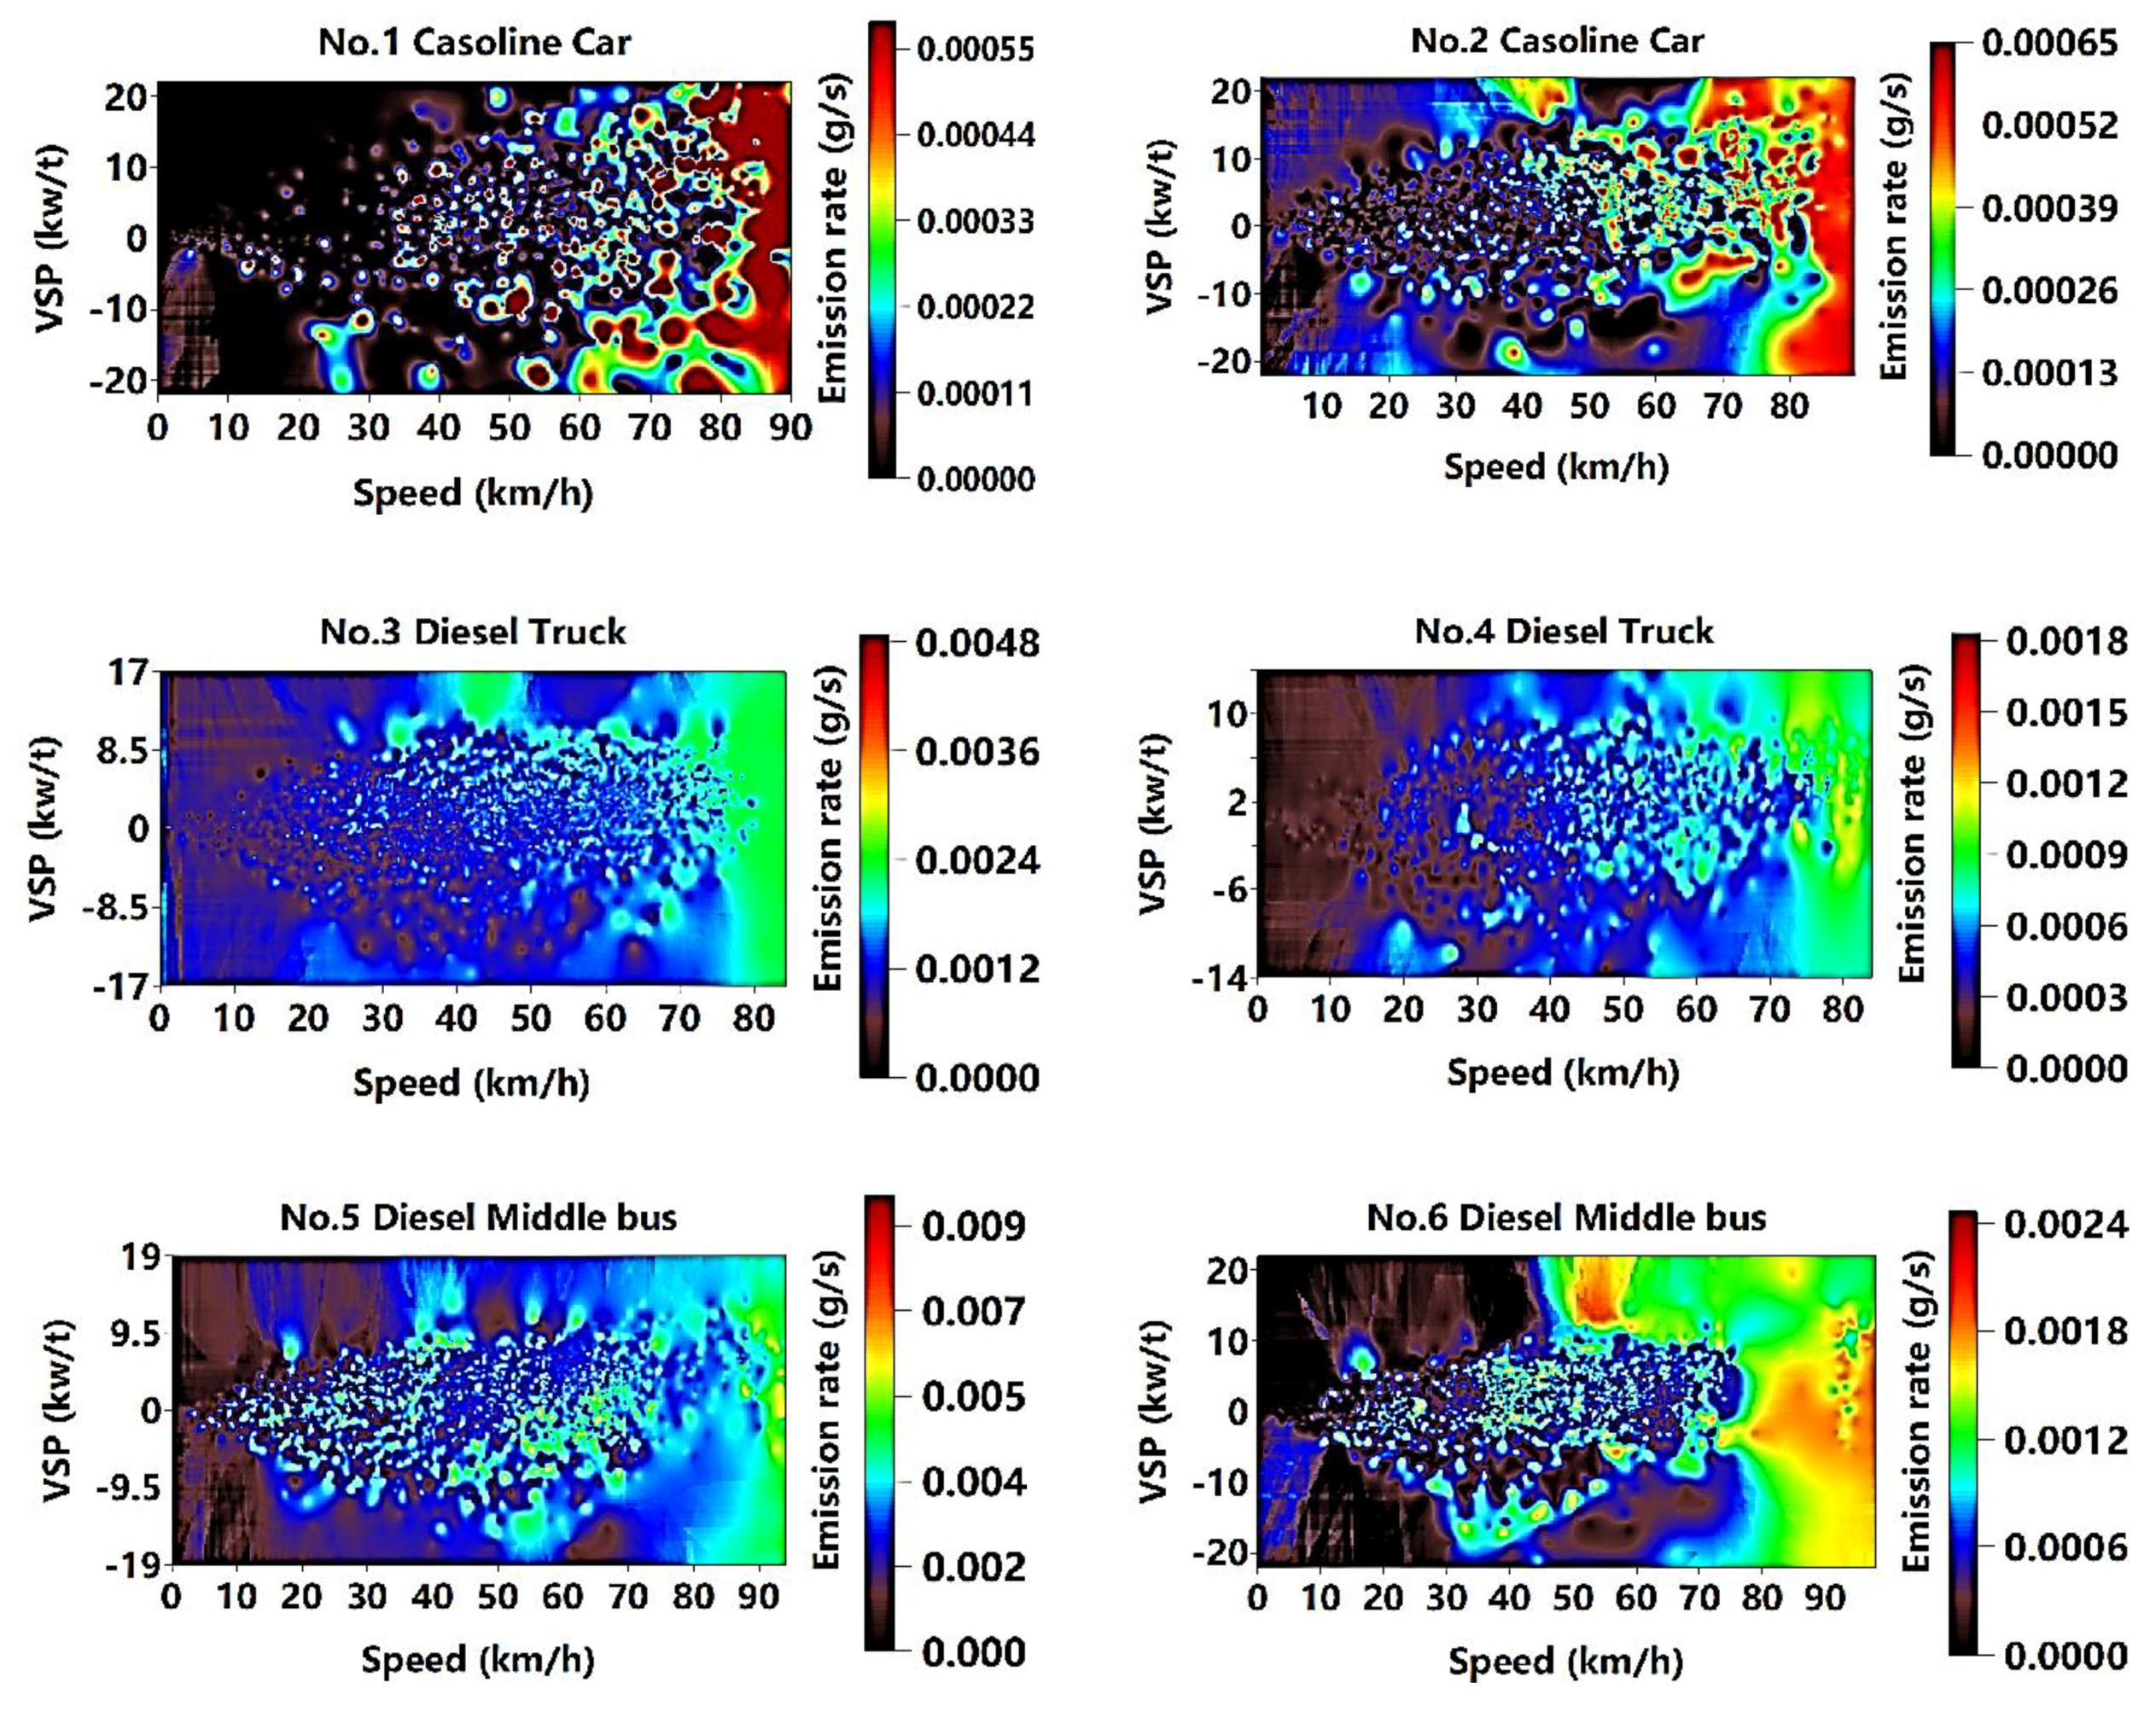
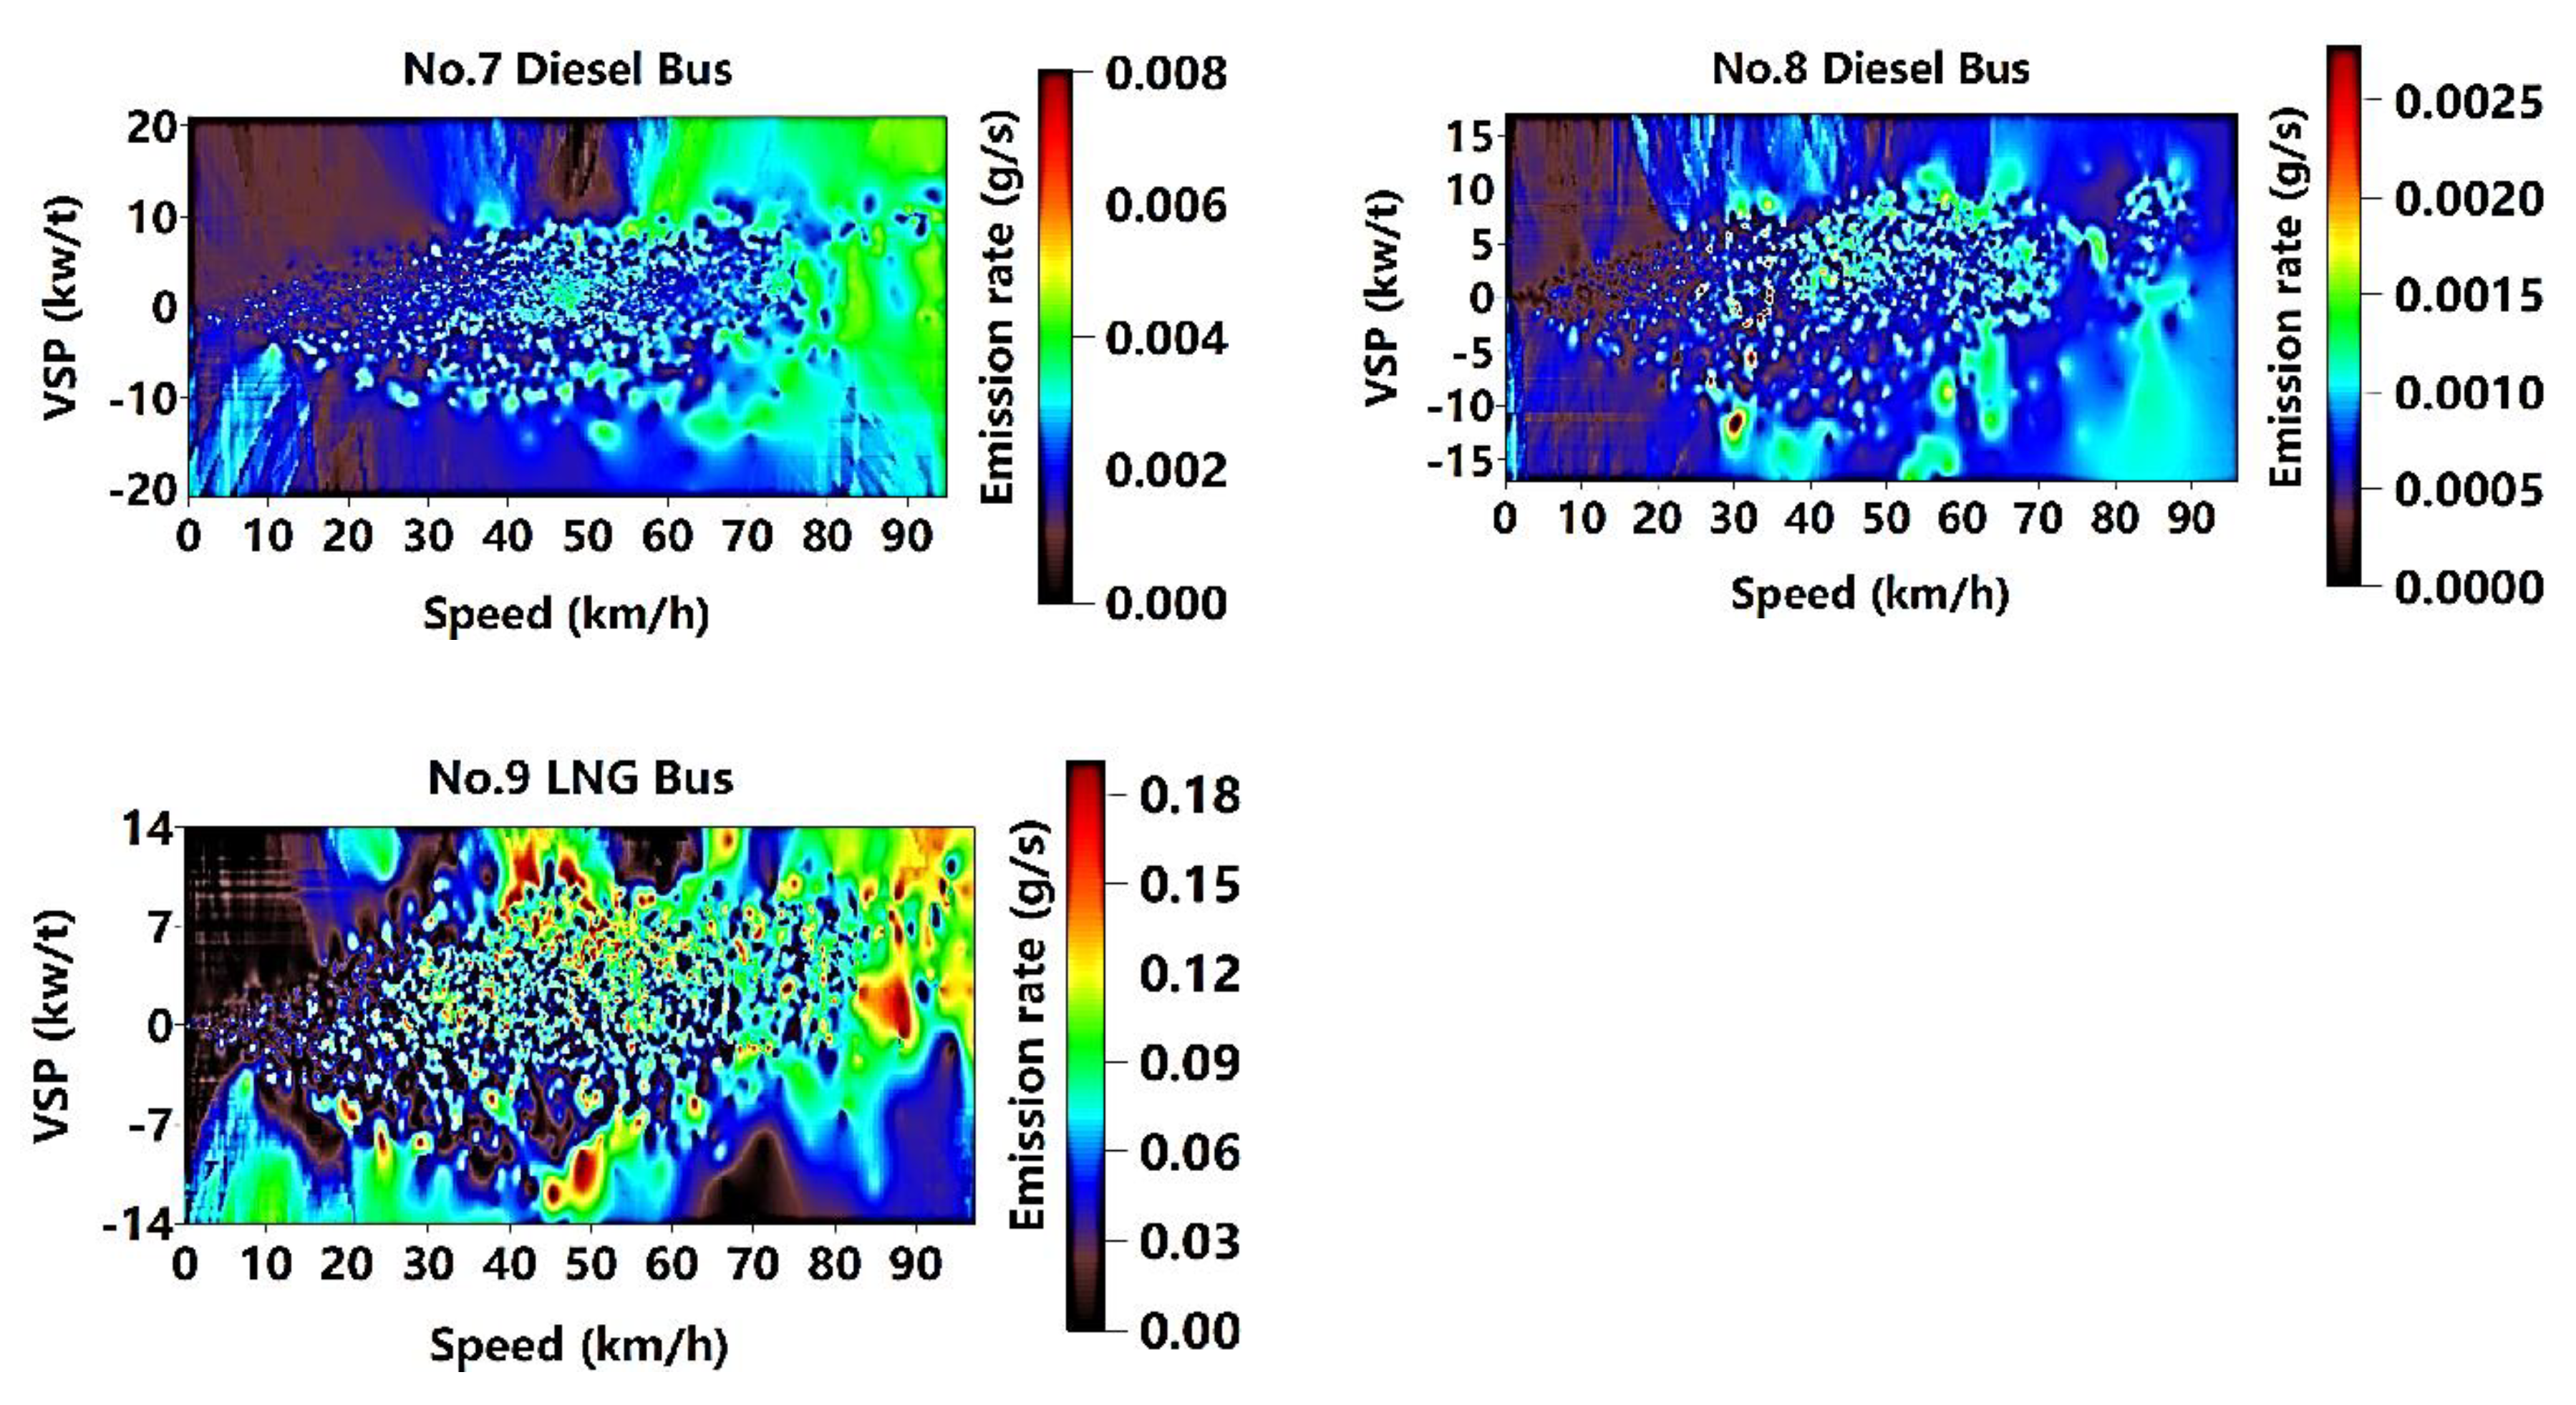
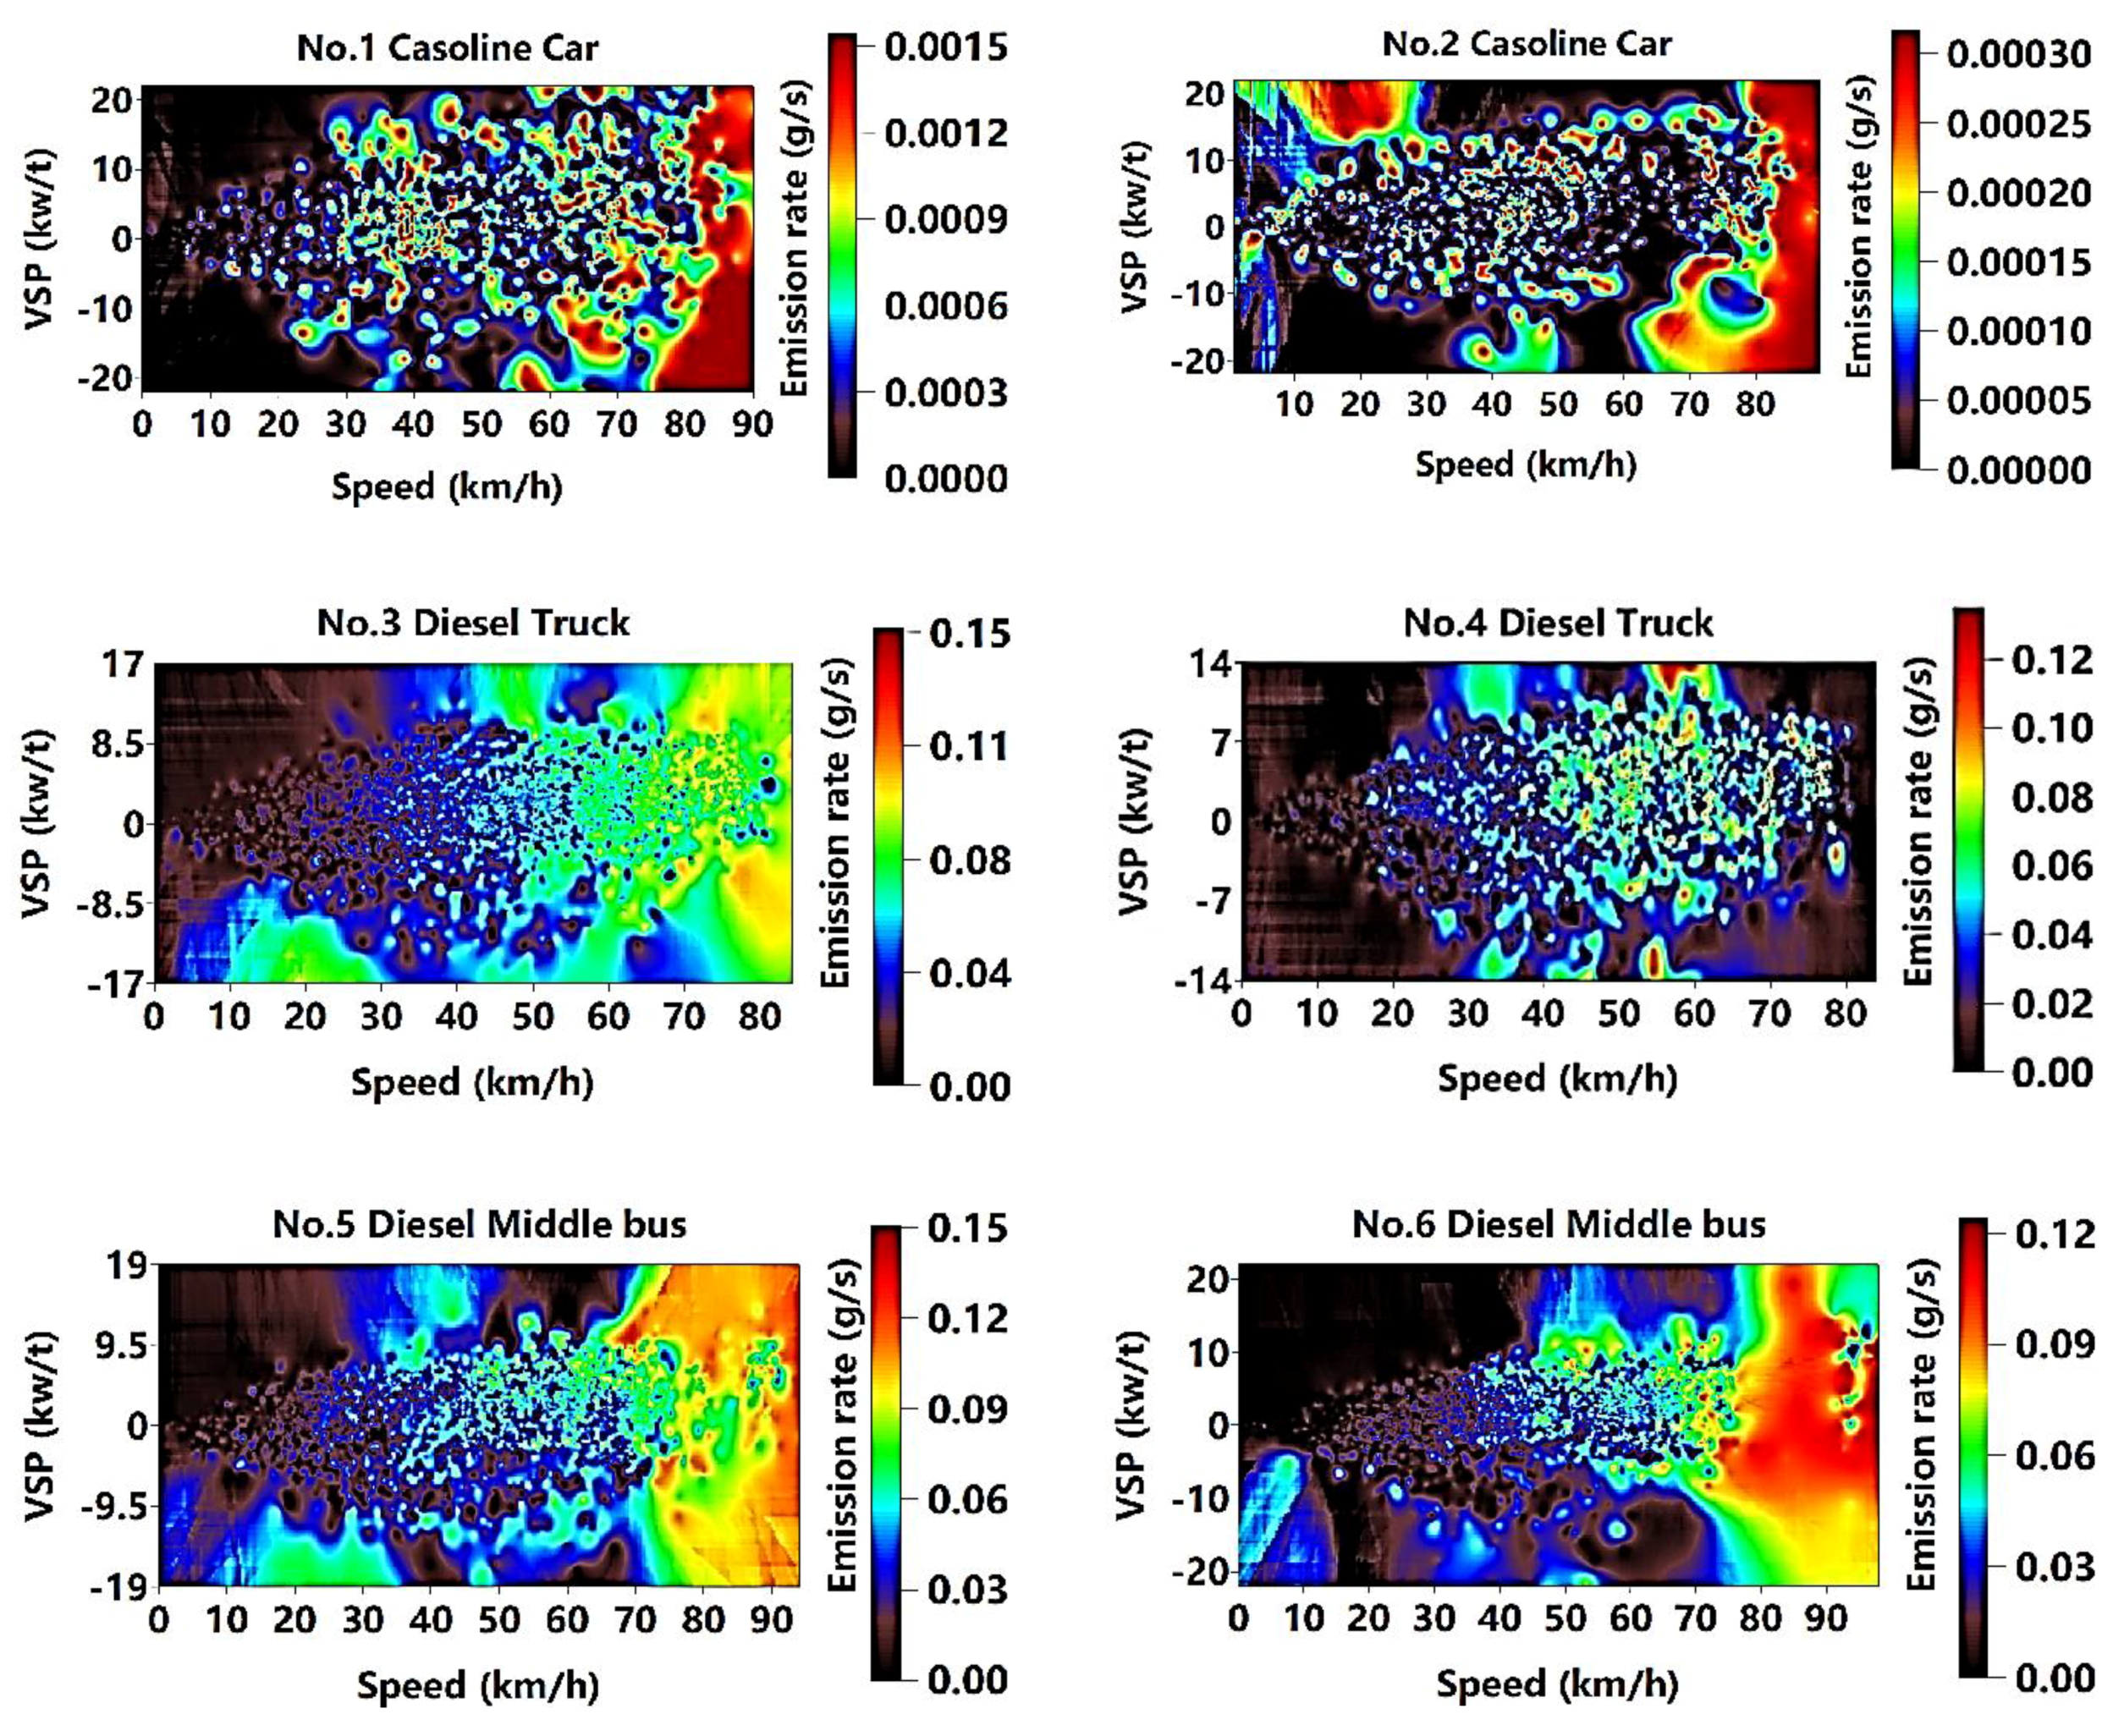
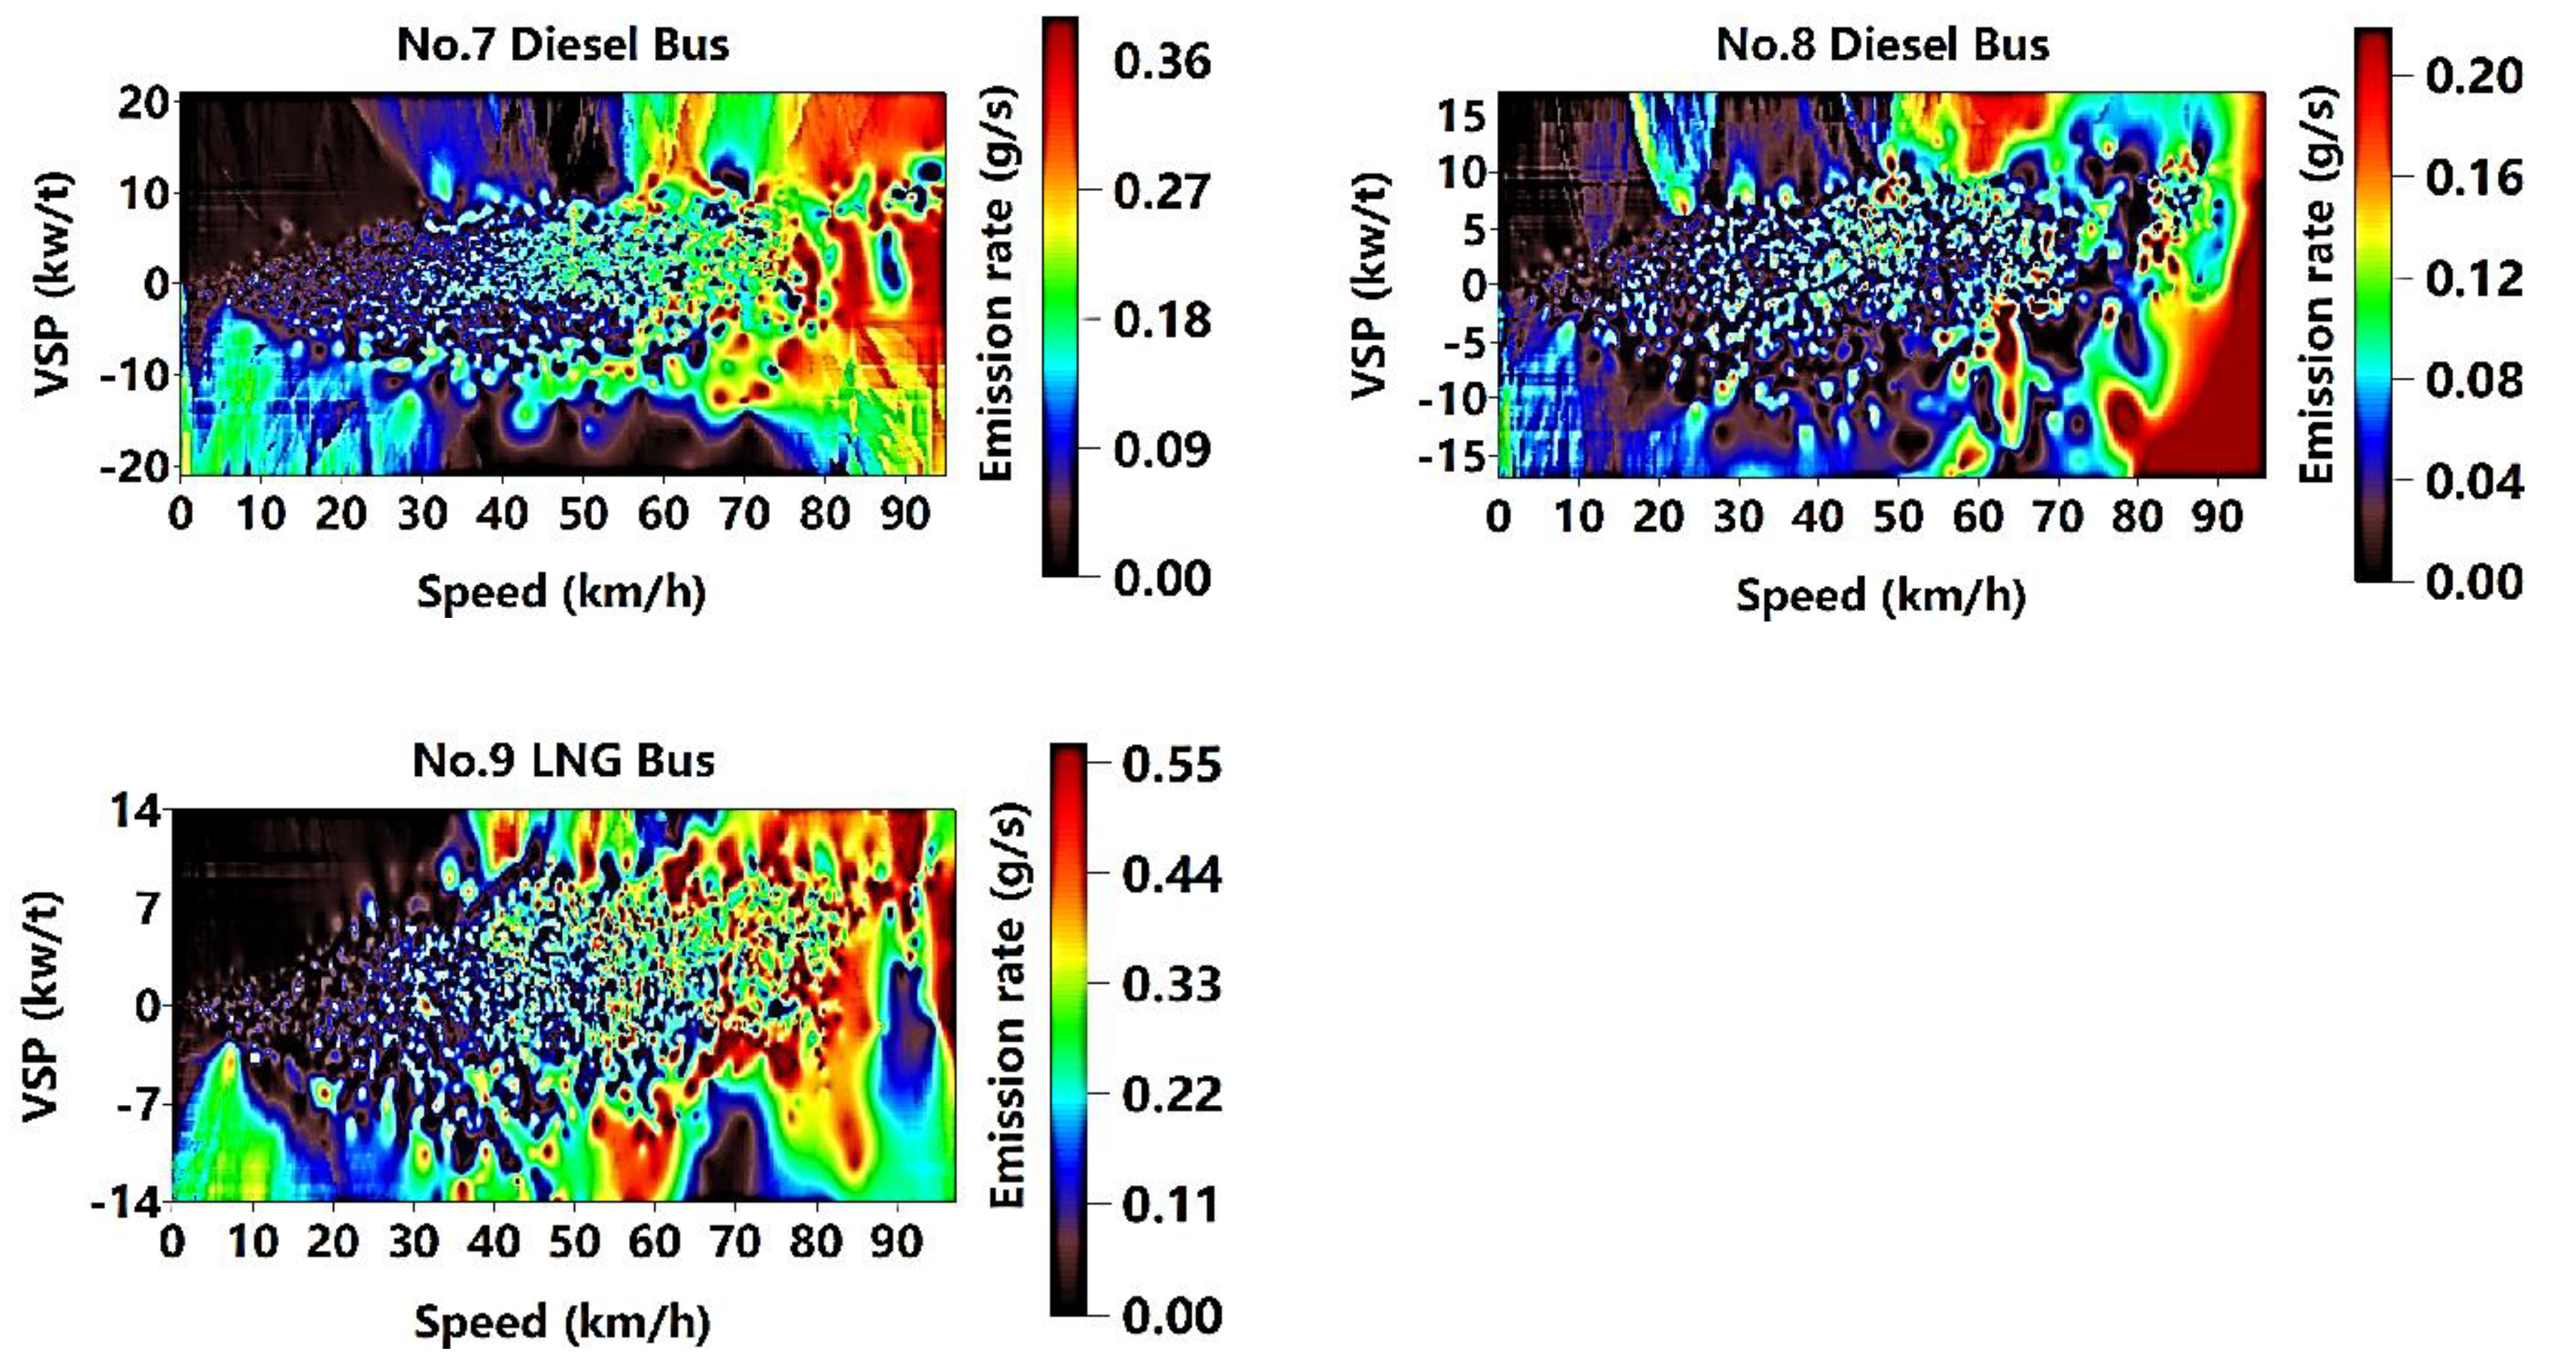
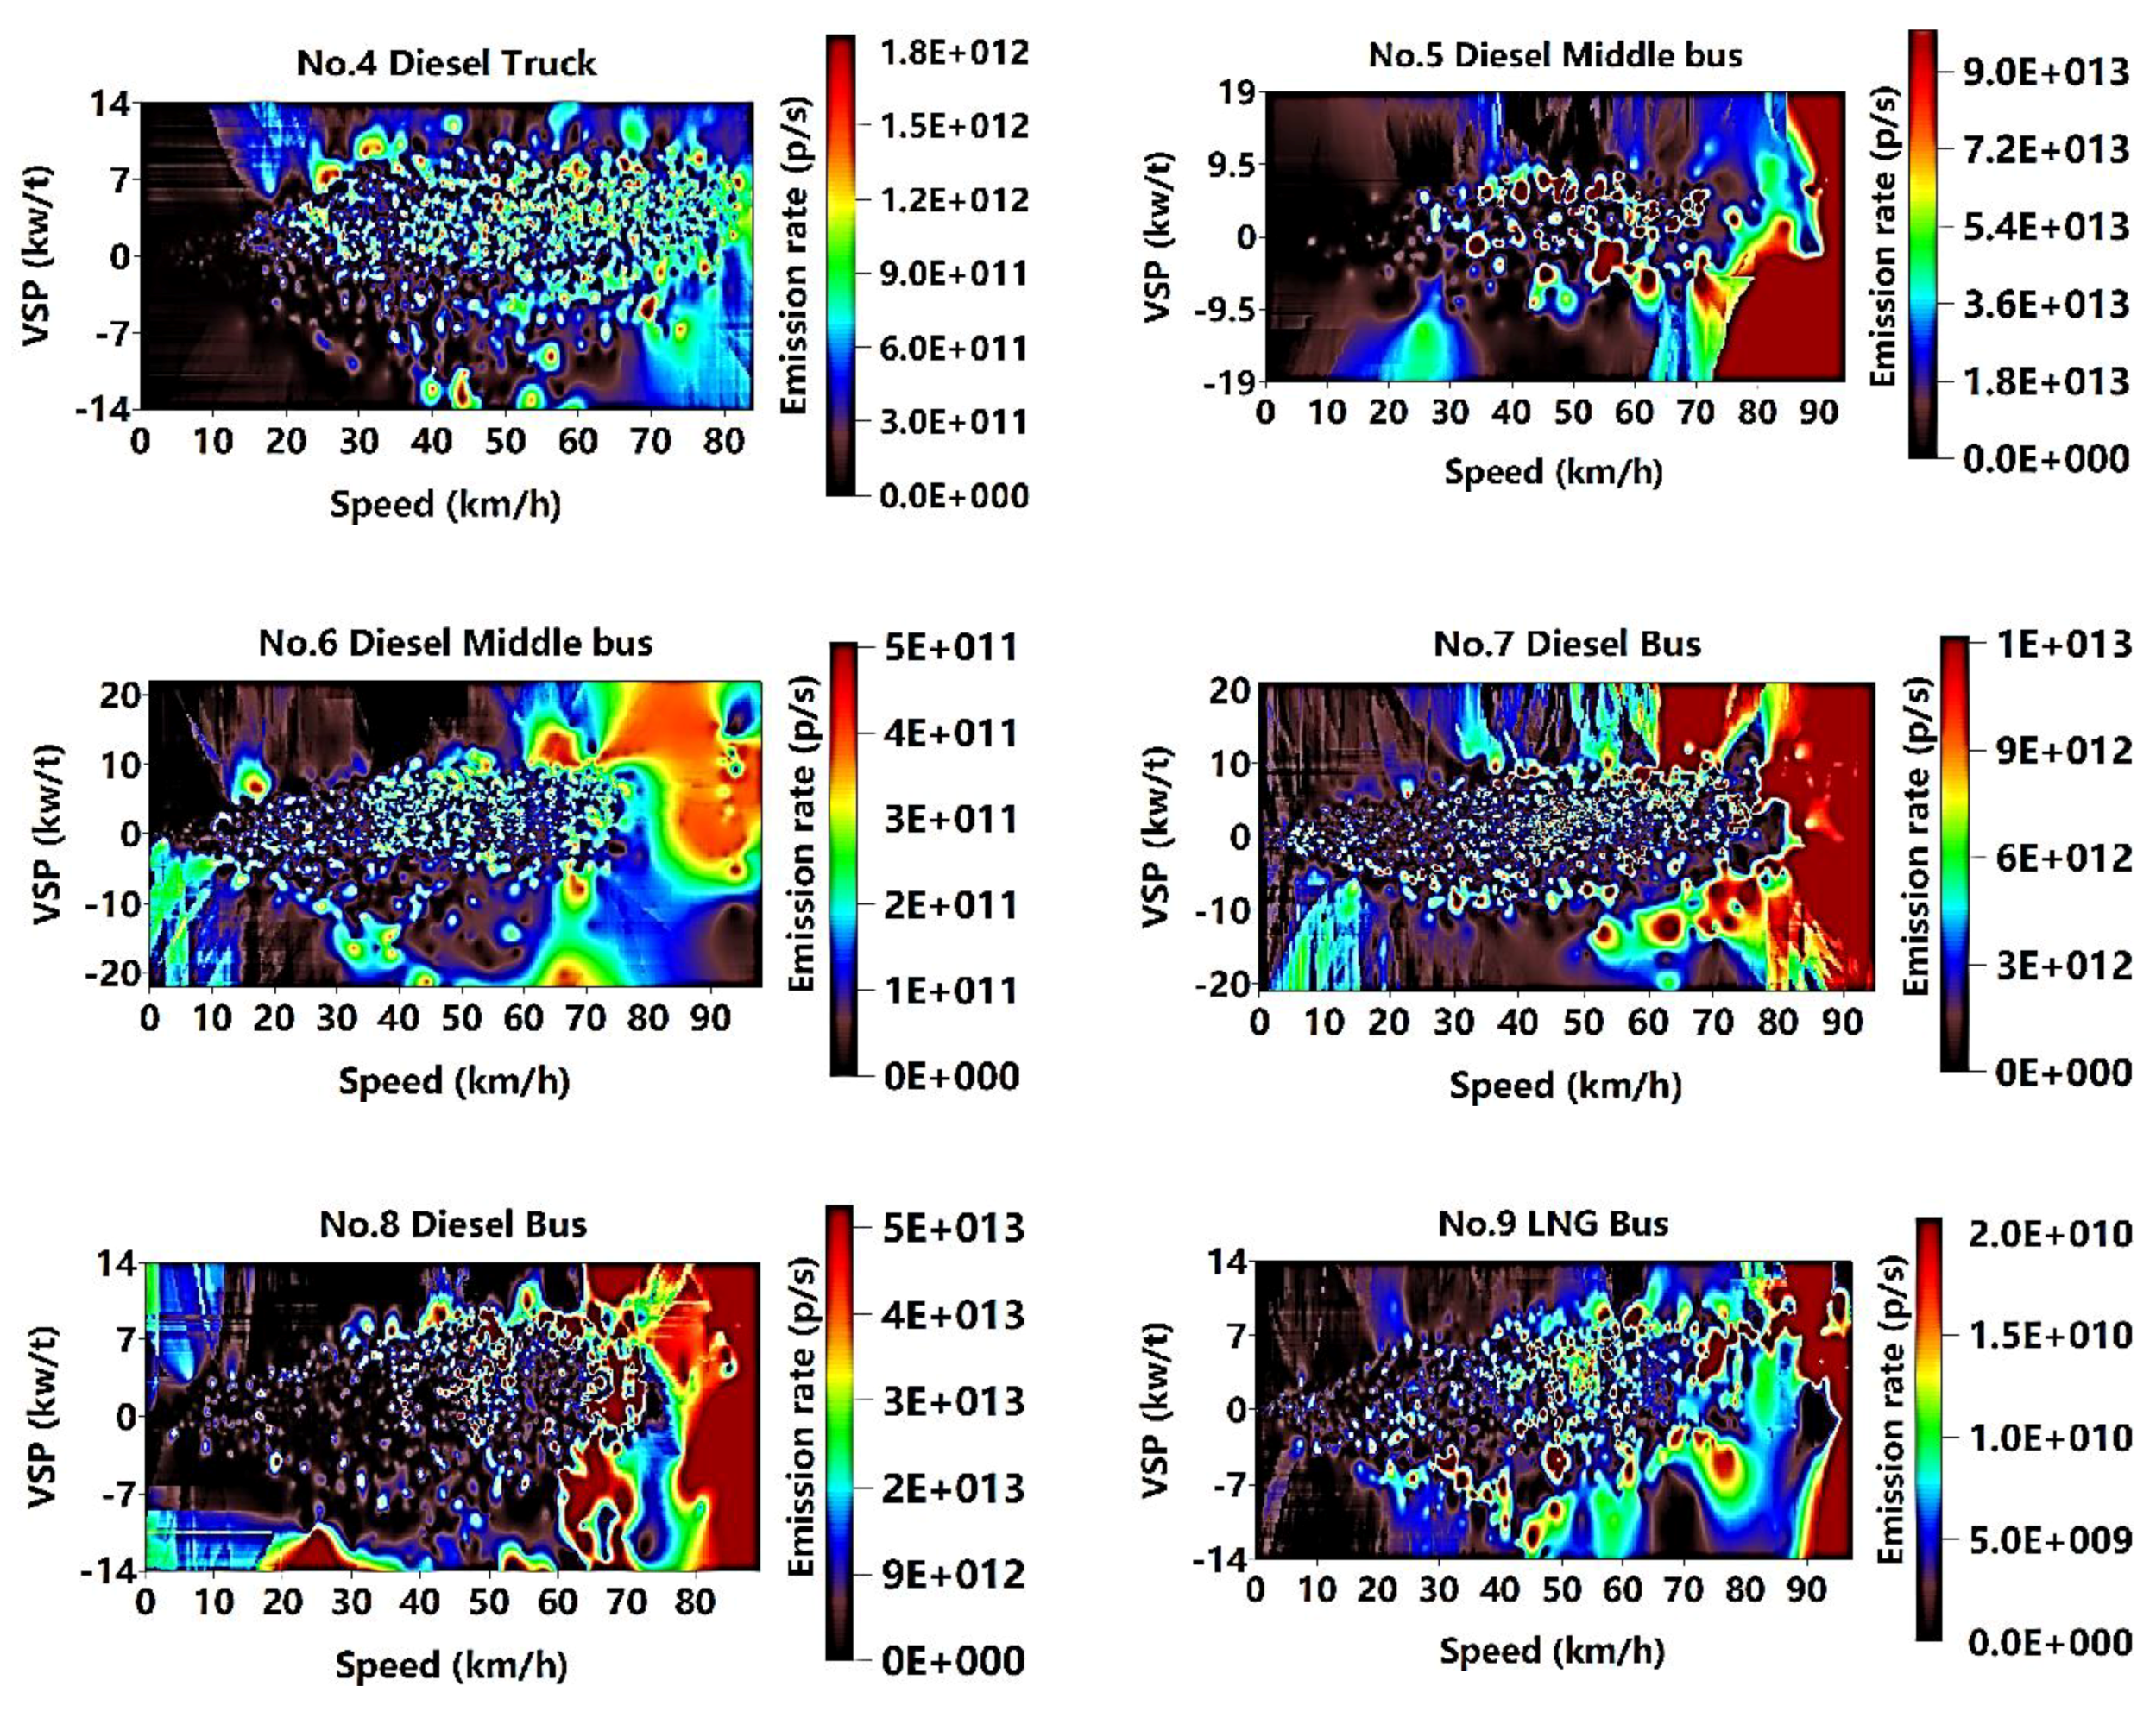
Figure 2, Figure 3, Figure 4 and Figure 5 depict the image maps displaying the relationship between the pollutant (CO, HC, NOx, and PN) emission rates and the speed-VSP for each test vehicle. Owing to the abnormal measurement data, the PN image maps of No. 3 (Truck, China III) have not been presented. The emission rates in the image maps have been indicated by using different colors. The black area indicates that the emission rates were close to zero, the brown area indicates that the emission rates were equal to half of the average emission rate ( E R i , j ¯ in Equation (4)) of the test vehicles, the blue area indicates that the emission rates were equal to the average emission rate of the test vehicles, and the cyan, green, yellow, orange, red, and ruby red areas indicate that the emission rates were approximately 1.5, 2, 2.5, 3, 3.5, and over 4 times the average emission rate, respectively.
Figure 2, Figure 3, Figure 4 and Figure 5 depict the relationship between speed-VSP and CO, HC, NOx, and PN emission rates. It demonstrated that the emission rates of the test vehicles did not increase or decrease monotonously with their speed and VSP. In other words, the emission rates of the test vehicle reached its peak in certain discontinuous speed-VSP intervals, and the emission rates here could be higher than those in the surrounding speed-VSP intervals, even being 2–4 times higher than the average emission rate. These intervals were known as the high-emission regions.
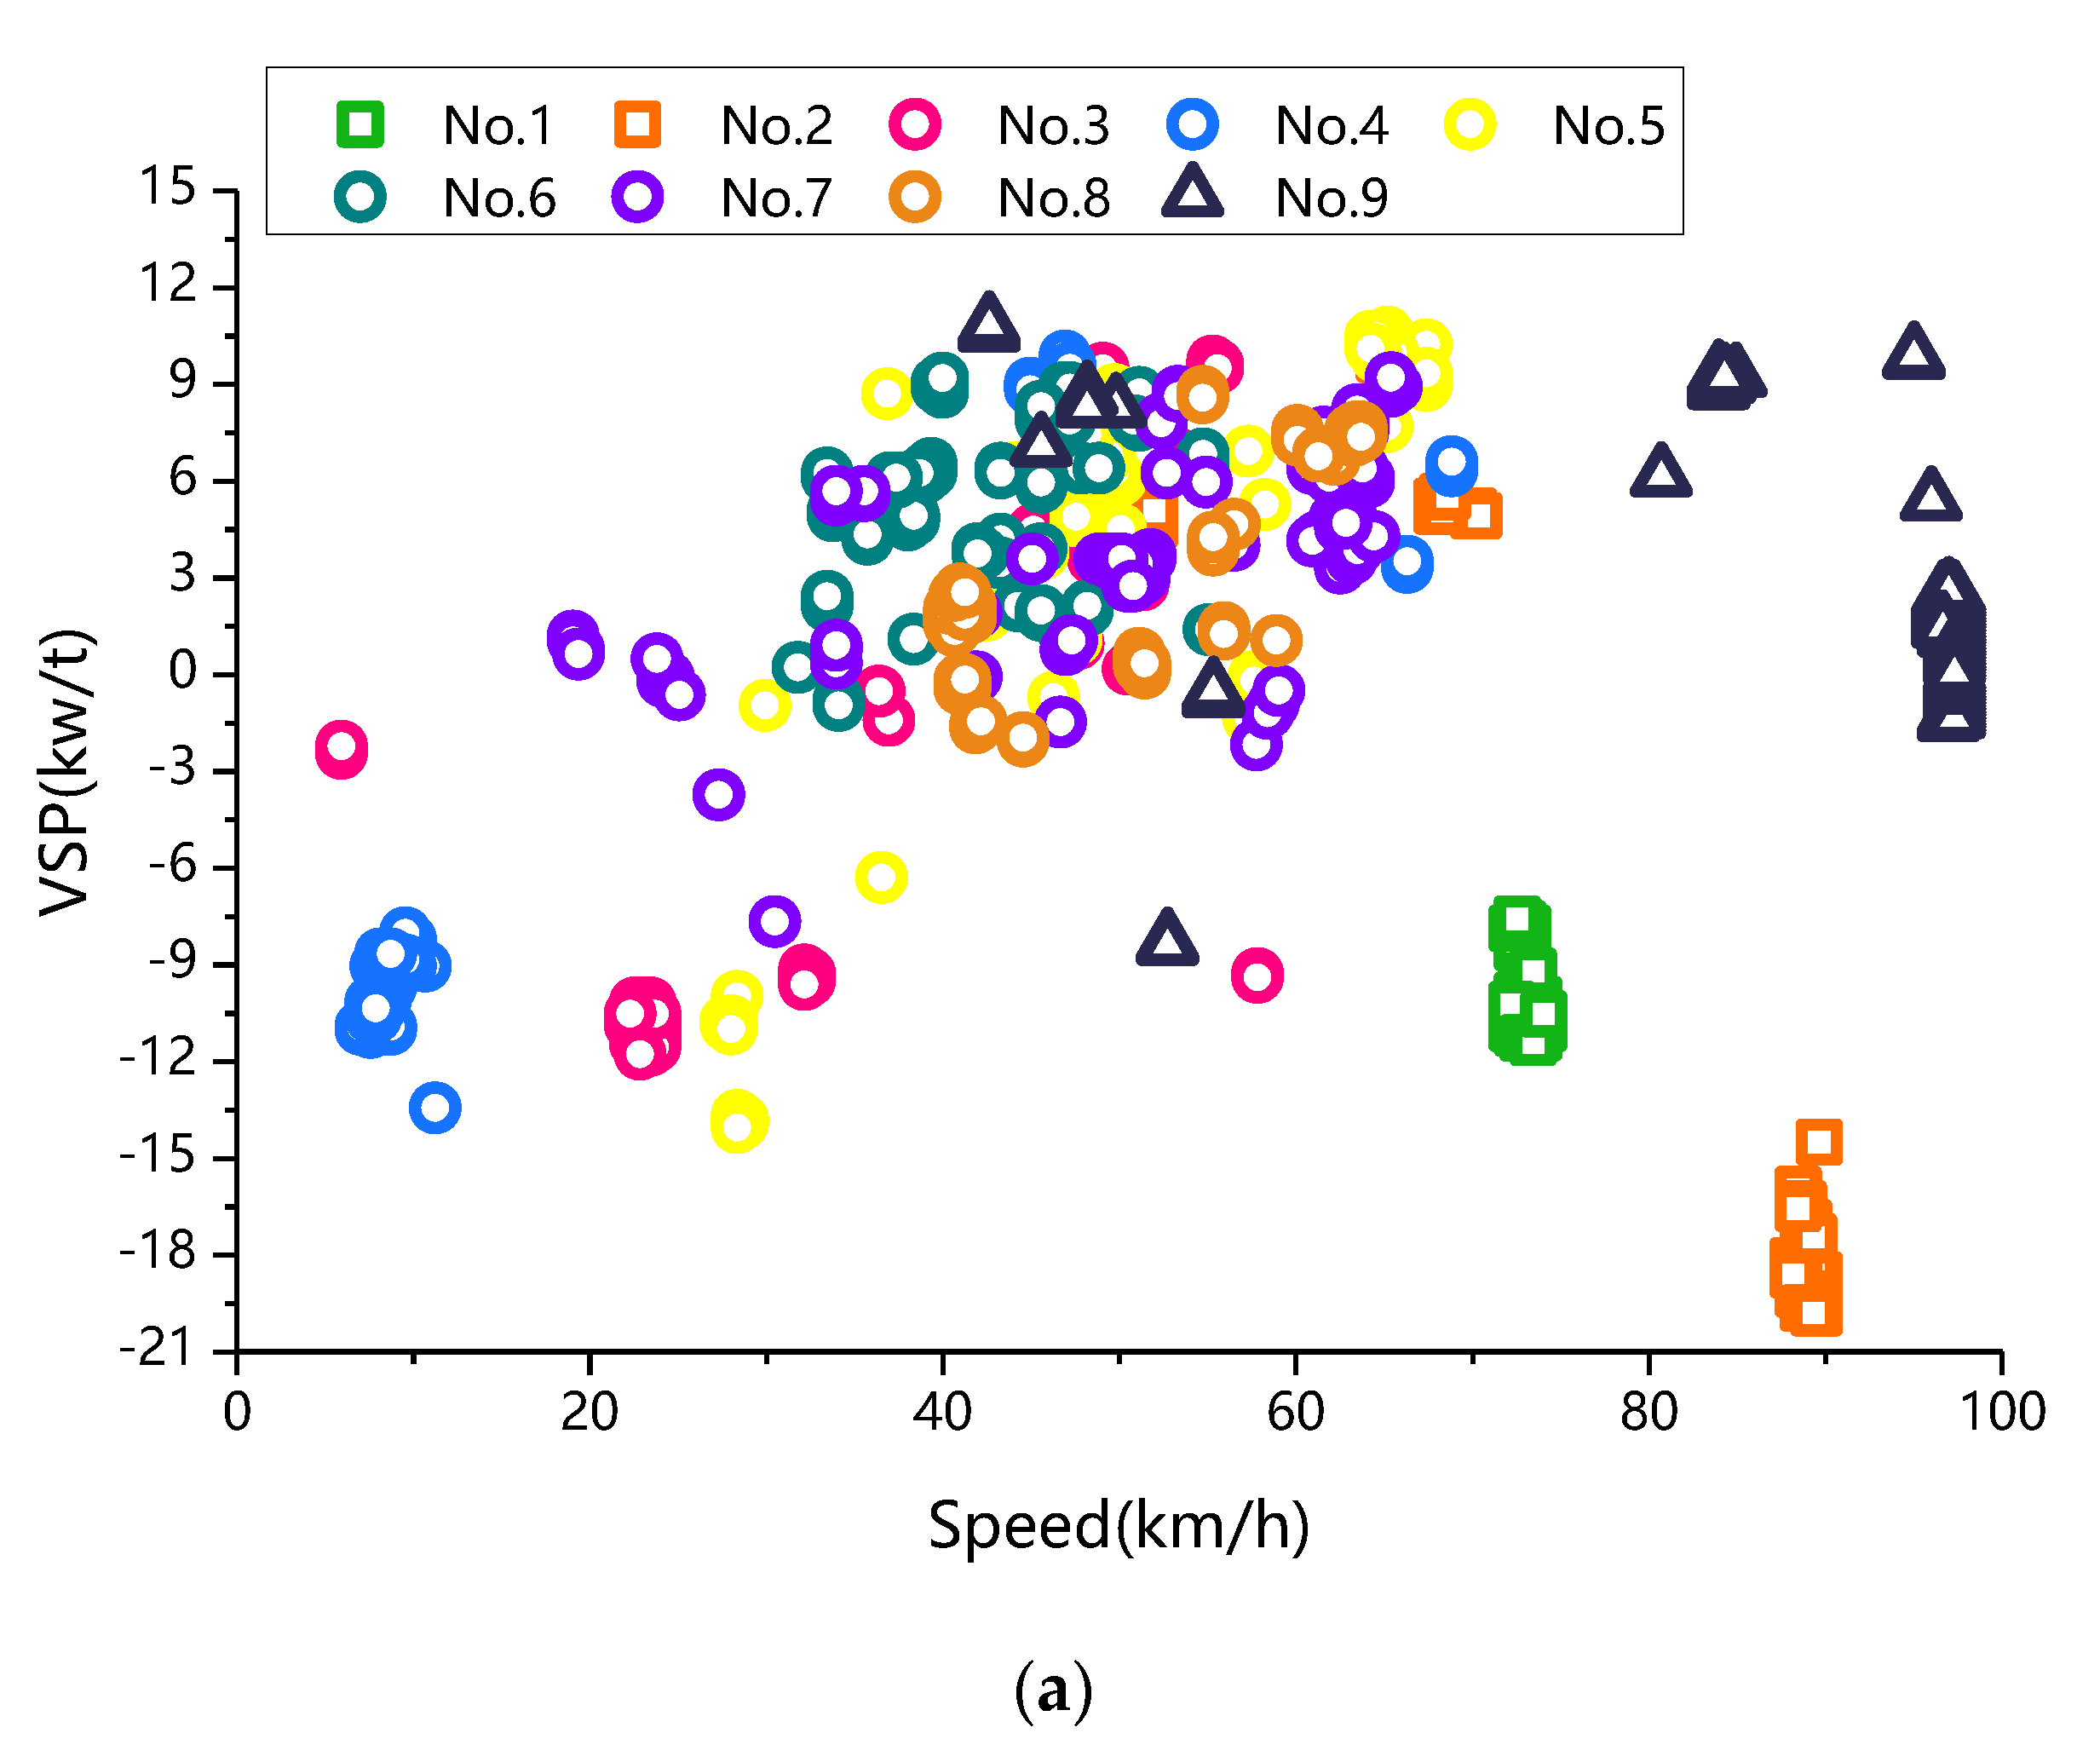
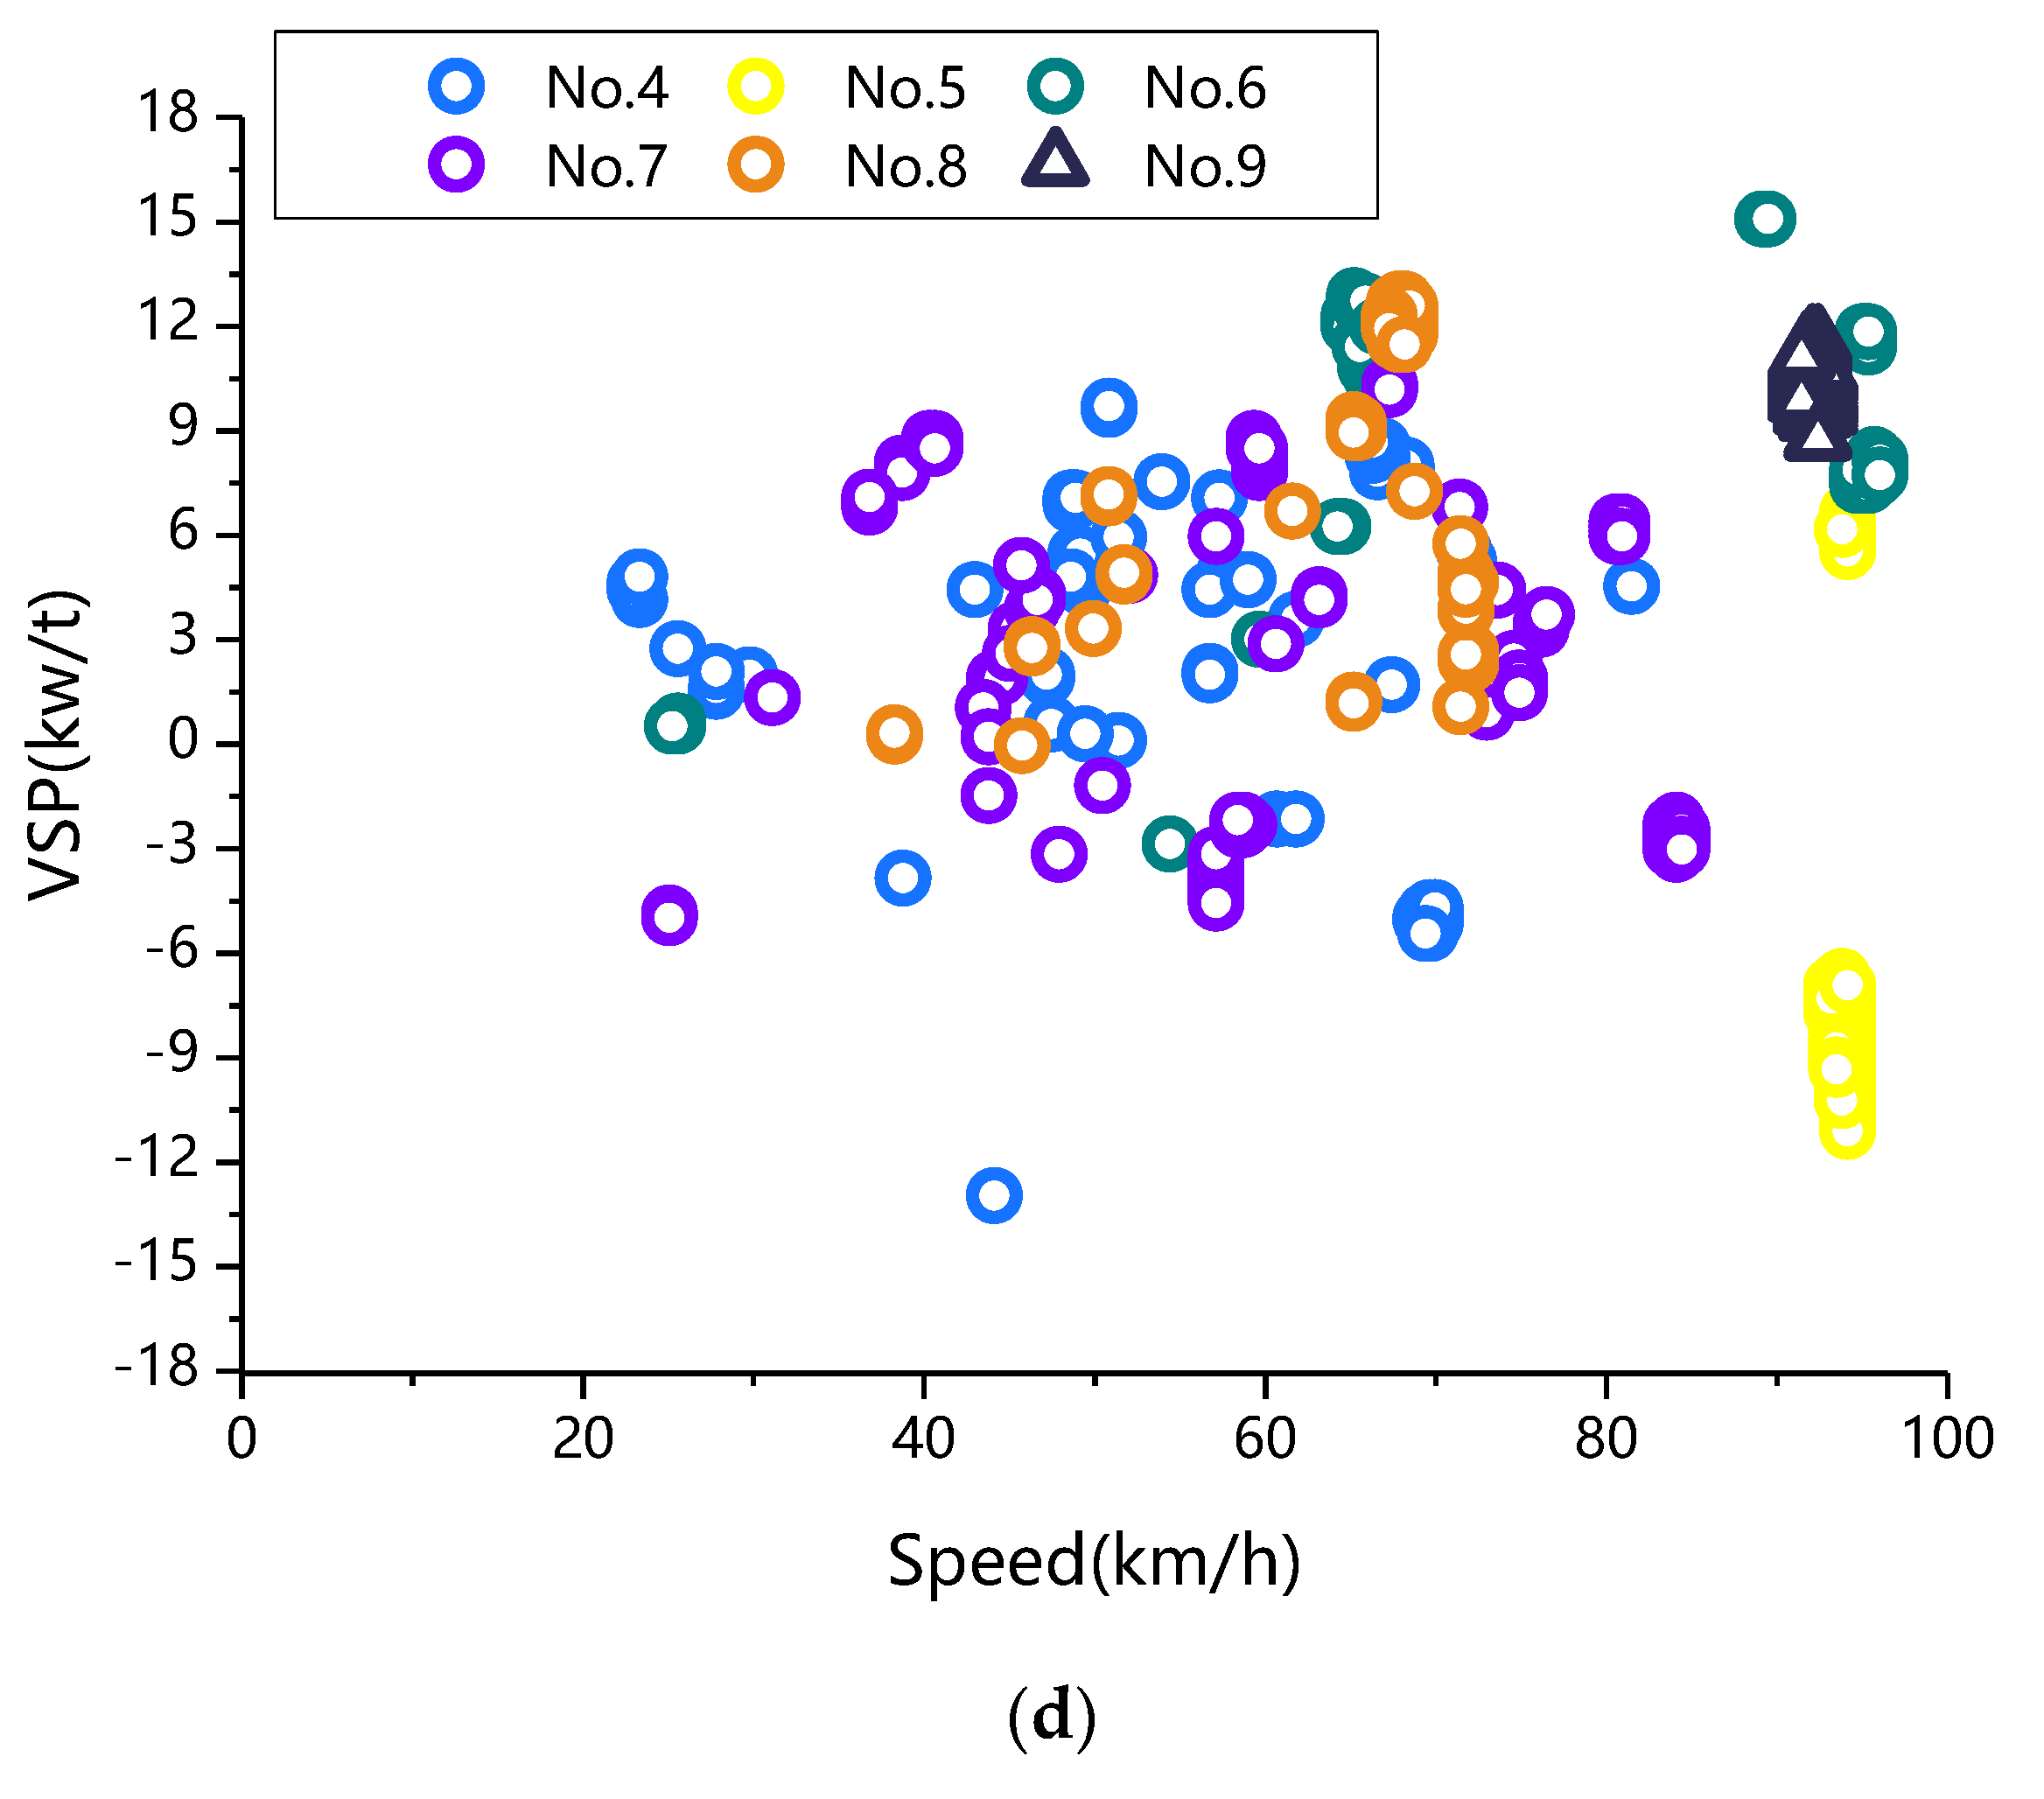
To further study the distribution characteristics of high-emission regions, we selected the 100 high-emission points from the high-emission regions, according to the data provided by the grid file of each pollutant for each test vehicle. The emission rates of the 100 high-emission points were the highest in the grid file of each pollutant for each test vehicle. Figure 6 illustrates the distribution of these 100 high-emission points in the speed-VSP interval.
In the case of gasoline vehicles, their high-emission points of CO, HC, and NOx were mainly in the region where the speed was greater than 70 km/h and VSP was below 0 kW/t. In the case of diesel vehicles, their high-emission points of CO, HC and PN were mainly in the region where the speed range was 20–80 km/h and VSP range was 0–12 kW/t. Some CO high-emission points of diesel vehicles were distributed in the region where the speed range was 0–20 km/h and VSP was below −7 kW/t. Their high-emission points of NOx were mainly in two regions. The first one was mainly in the region where speed was greater than 90 km/h, and the VSP range was 0–18 kW/t. The second one was mainly in the region where the speed range was 60–80 km/h and VSP range was 0–12 kW/t. In the case of LNG vehicle, their high-emission points of CO and PN were mainly in the region where the speed was greater than 80 km/h and the VSP range was above 0 kW/t. Their high-emission points of HC were mainly in the region where the speed range was 20–60 km/h and VSP range was 0–9 kW/t. Their high-emission points of NOx were mainly in two regions. The first one was mainly in the region where speed was greater than 90 km/h, and the VSP range was 9–15 kW/t. The second one was mainly in the region where the speed range was 60–80 km/h and VSP range was 0–9 kW/t.
As stated earlier, the image maps depicted that the test vehicles could achieve the peak of CO, HC, NOx, and PN emission rates in certain high-emission regions. This was consistent with the results of the studies conducted by Chong et al. [50]. They evaluated the relationship between emission and the vehicle speed and acceleration rates of gaseous emissions, and the diagram obtained demonstrated similar discontinuous speed-acceleration intervals in which the gaseous pollutant emission rates were higher than those in the surrounding areas. In regards to their distributions as depicted in Figure 6, the high-emission points of test vehicles were mainly distributed mainly in two regions: the high-speed region (speed > 70–90 km/h, VSP > 0 kW/t), the medium speed-acceleration region (20–30 km/h < speed < 60–90 km/h, 0 kW/t < VSP < 12 kW/t). However, some CO high-emission points of diesel vehicles were distributed in the low-speed region (0 km/h < speed < 20 km/h, VSP < −6 kW/t), and the high-emission points of gasoline were mainly in the high-speed–deceleration region (speed > 70 km/h, VSP < 0 kW/t).
In the case of gasoline vehicles, their CO, HC, and NOx high-emission points were mainly distributed in the high-speed region. Owing to the high load of the gasoline engines at high speed, the engine temperature increases, and the air-fuel ratio decreases. The fuel-rich operation results in oxygen starvation and incomplete combustion, which is the main reason for a significant increase in the CO and HC emissions. According to the extended Zeldovich mechanism, three NOx formation paths exist, namely thermal NO, amidogen (NNH), and N2O routes [51]. Although the reaction of thermal NO is blocked at low oxygen levels, the chemical reactivity of NO obtained from NNH and N2O might increase at higher temperatures. Furthermore, the presence of HC and CO in the high-speed (>80 km/h) interval could inhibit the oxidation of NO [52]. Their high-emission points of CO, HC and NOx were mainly in the region where the VSP was below 0 kW/t. Because the fuel injection of engine is cut off under the sharp deceleration conditions. Thus, the excess air coefficient of engine increases and the indicated mean effective pressure of engine decreases [53] rapidly. Under the condition of very low indicated mean effective pressure of the engine, the in-cylinder burning temperature is very low [53]. This led to a sharp increase in CO and HC emission. The reason for the rise of NOx is not clear, but it may be that the increase of excess air coefficient leads to the production of thermal NO before the cylinder temperature drops.
The diesel test vehicles had a different distribution of the high-emission points compared to the gasoline test vehicles. Their high-emission points of CO, HC, NOx and PN all were distributed in the medium-speed region (20–30 km/h < speed < 70–90 km/h, 0 kW/t < VSP < 12 kW/t). Because the diesel engine changes its load by adjusting the amount of the fuel injection, while the amount of intake air is basically maintained constant. Therefore, the concentration of the fuel in the mixture increases with the increase in the engine load. A sudden acceleration of the engines at medium speed would cause more amount of diesel to be injected into the engines, thereby increasing the concentration of the air-fuel mixture [54]. In comparison to the gasoline engines, diesel engines operate by injecting diesel into compressed air with a higher compression ratio and temperature, mixing rapidly, and igniting spontaneously. As a result, the diesel engine has a higher air-fuel ratio and temperature of combustion chamber and richer or leaner combustion regions than those of the gasoline engines. The air-fuel ratio of engines decreased at the beginning of the acceleration process. The richer combustion regions of engines are expanded and facilitate the production of unburnt CO, HC, and PN [50]. Subsequently, the increase in the engine speed results in high peak flame temperatures in the O2-rich regions [55], in the latter part of the acceleration process. The leaner combustion regions of engines are expanded and lead to an increase in the thermal NO emissions [56]. Some CO high-emission points of diesel vehicles were distributed in the region where the speed range was 0–20 km/h and VSP was below −7 kW/t. Because the temperature of the combustion chambers was less than that in the medium/high-speed regions, and the fuel was not supplied to the engine during deceleration, during which the air-fuel ratio increases significantly [54]. The lean concentration of the fuel in the mixture and the cooling of the engine lead to further incomplete combustion of CO [50,57,58]. Some high-emission points of NOx were distributed in the high-speed region (speed > 90 km/h, 0 kW/t < VSP < 18 kW/t). Because the increase in the diesel engine load led to the higher temperature of the combustion chamber compared to those in the medium speed regions, in the high-speed region. The increase in the combustion chamber temperature also increased the emission rate of NO [55].
The engine of the LNG bus applied a similar combustion method and higher thermal efficiency as compared to those of the diesel engine. Therefore, the distribution of high-emission points for the LNG bus was similar to those of diesel engine test vehicles. Its high-emission points of CO, NOx and PN were mainly in the high-speed region (speed > 80 km/h, 0 kW/t < VSP < 15 kW/t). Because the temperature of combustion chambers and the concentration of the air-fuel mixture were higher as compared to the other speed regions. As a result, there could exist an amount of CO, NOx, and PN. Some high-emission points of HC were distributed in the medium speed-acceleration region (20 km/h < speed < 60 km/h, 0 kW/t < VSP < 9 kW/t). The emissions of unburned methane were considered to be the source of HC [36]. Because the concentration of the LNG in the mixture increases with the increase in the engine load, and it is difficult for methane pressed into the crevice during compression stroke to burn due to the high auto-ignition temperature of methane [41]. At high speeds, the high emissions points of HC begin to decrease due to the higher combustion temperature. Some high-emission points of NOx were distributed in the high-speed region (speed > 90 km/h, 9 kW/t < VSP < 15 kW/t), because of the higher combustion temperature in the high-emission region.

3.2.2. The Relationship between the Average Emission Rates and the Average Emission Rates of High-Emission Points

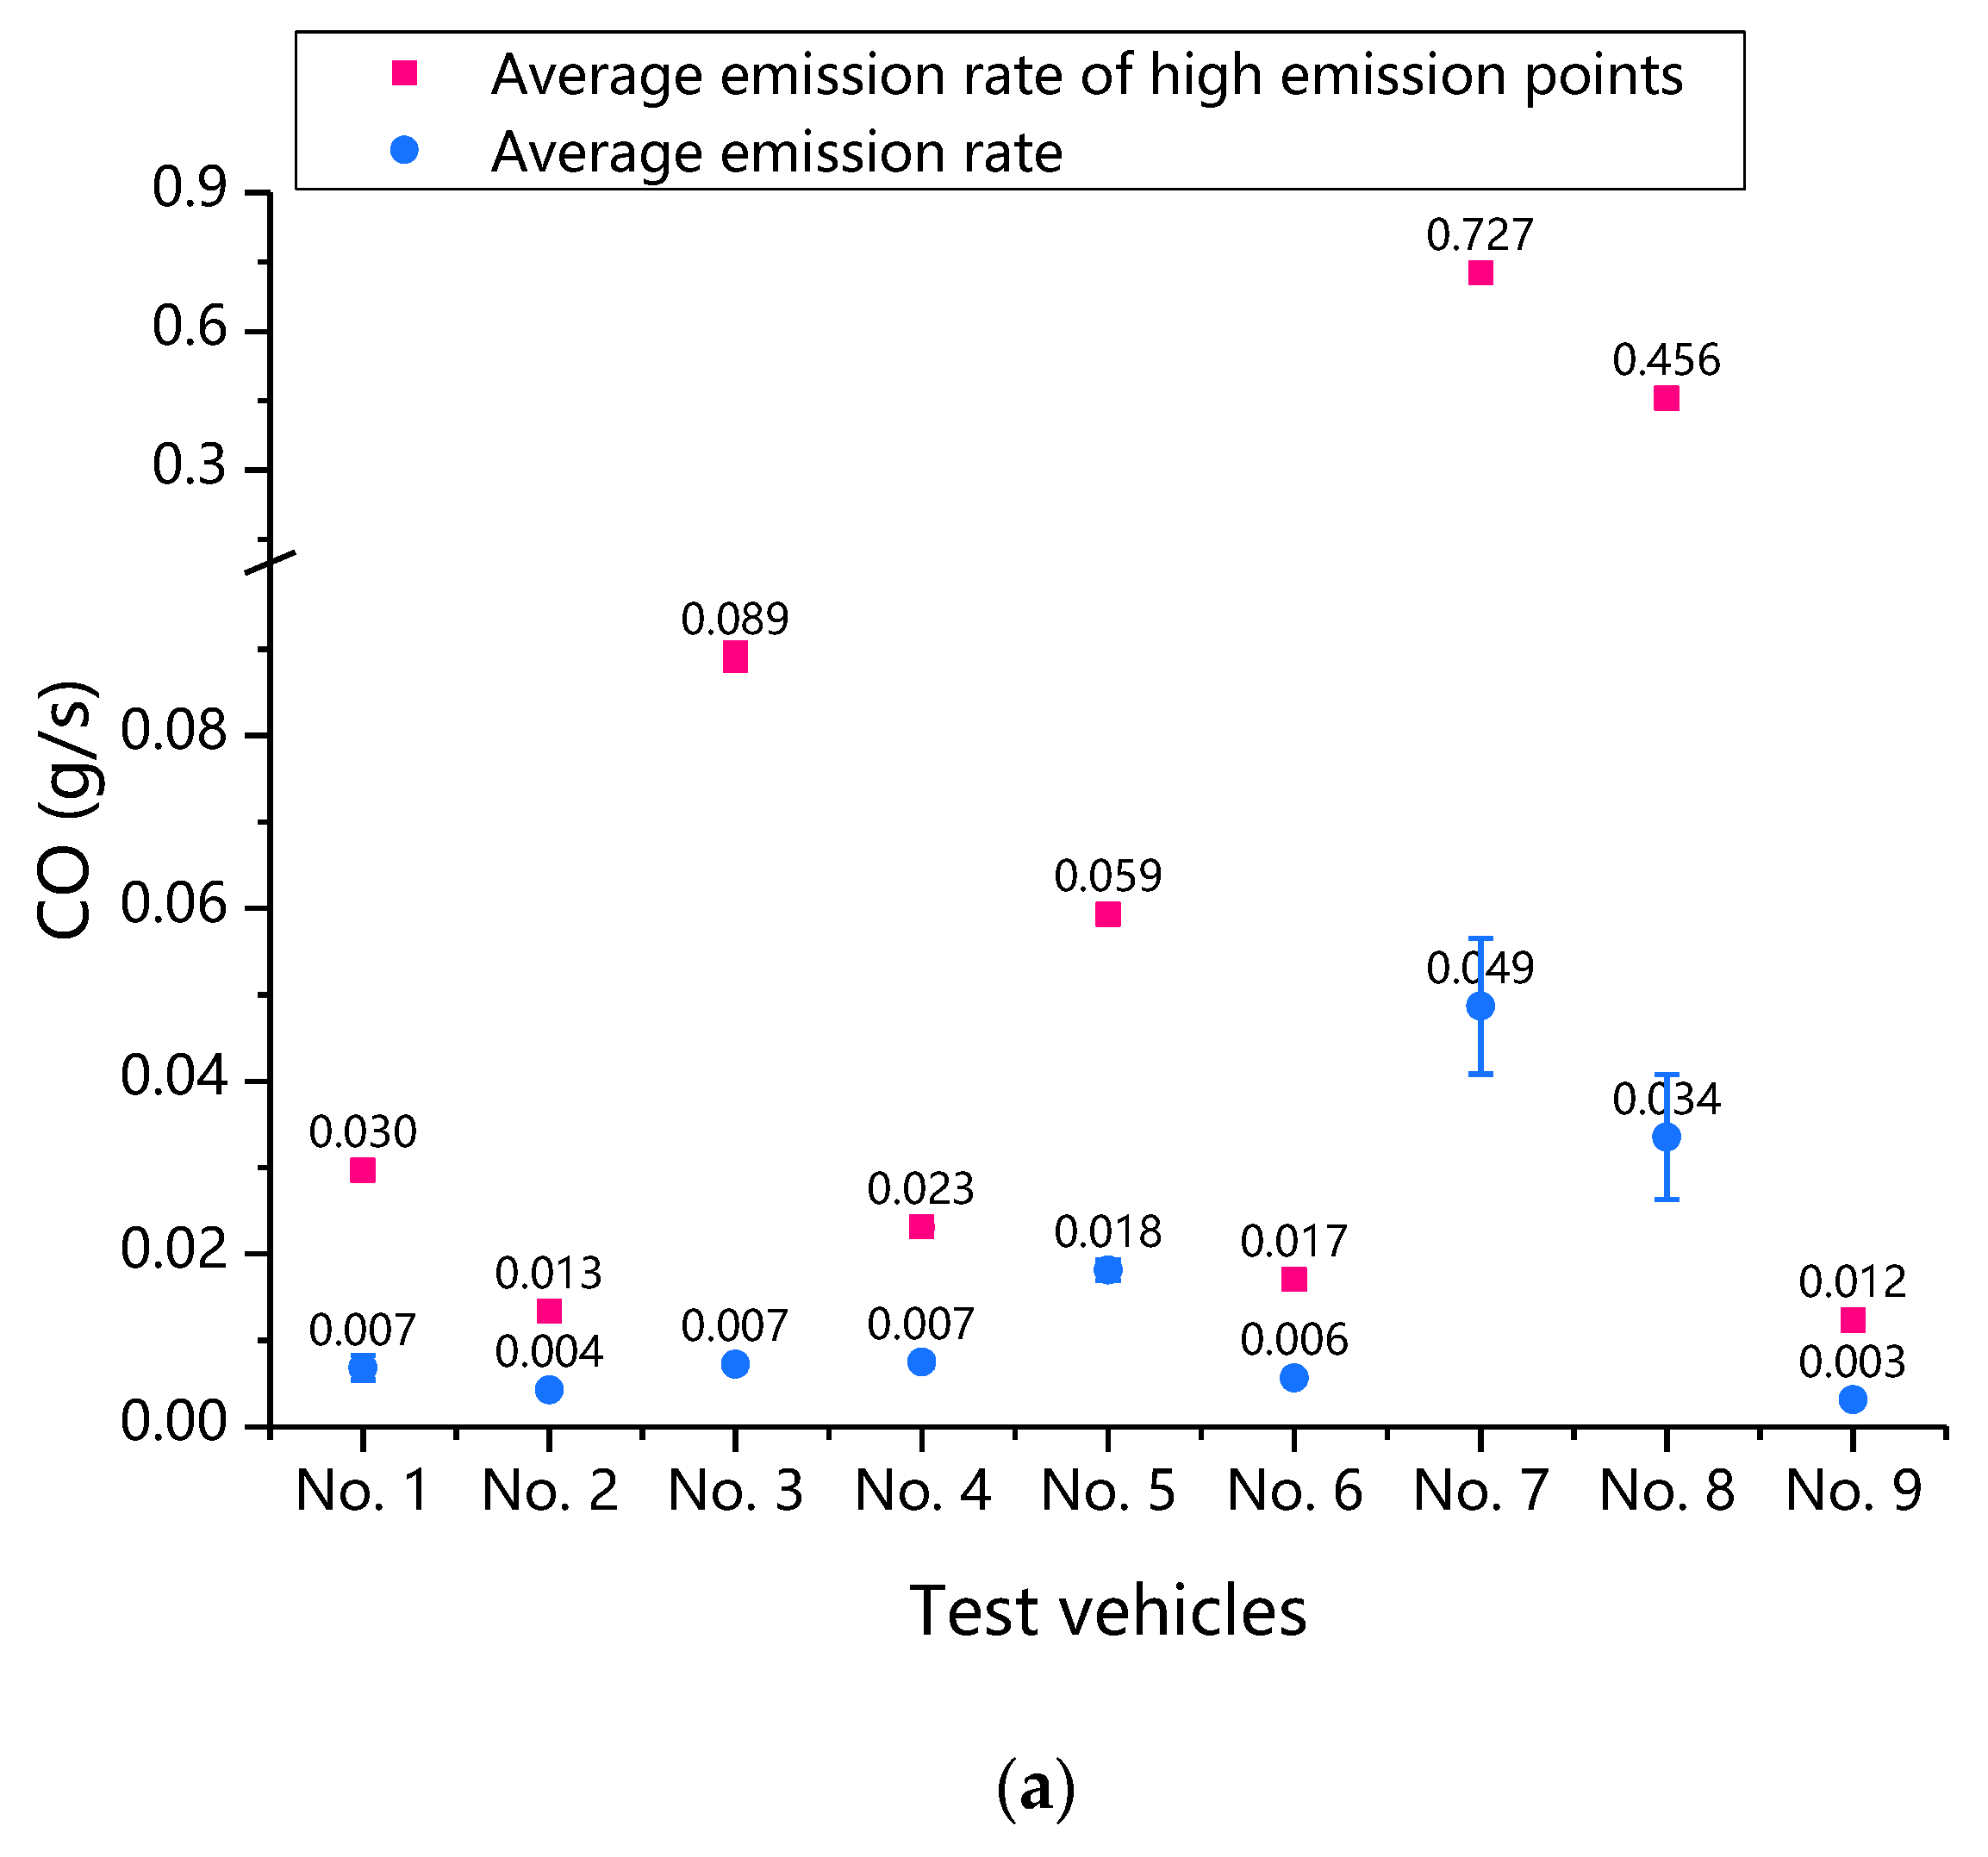
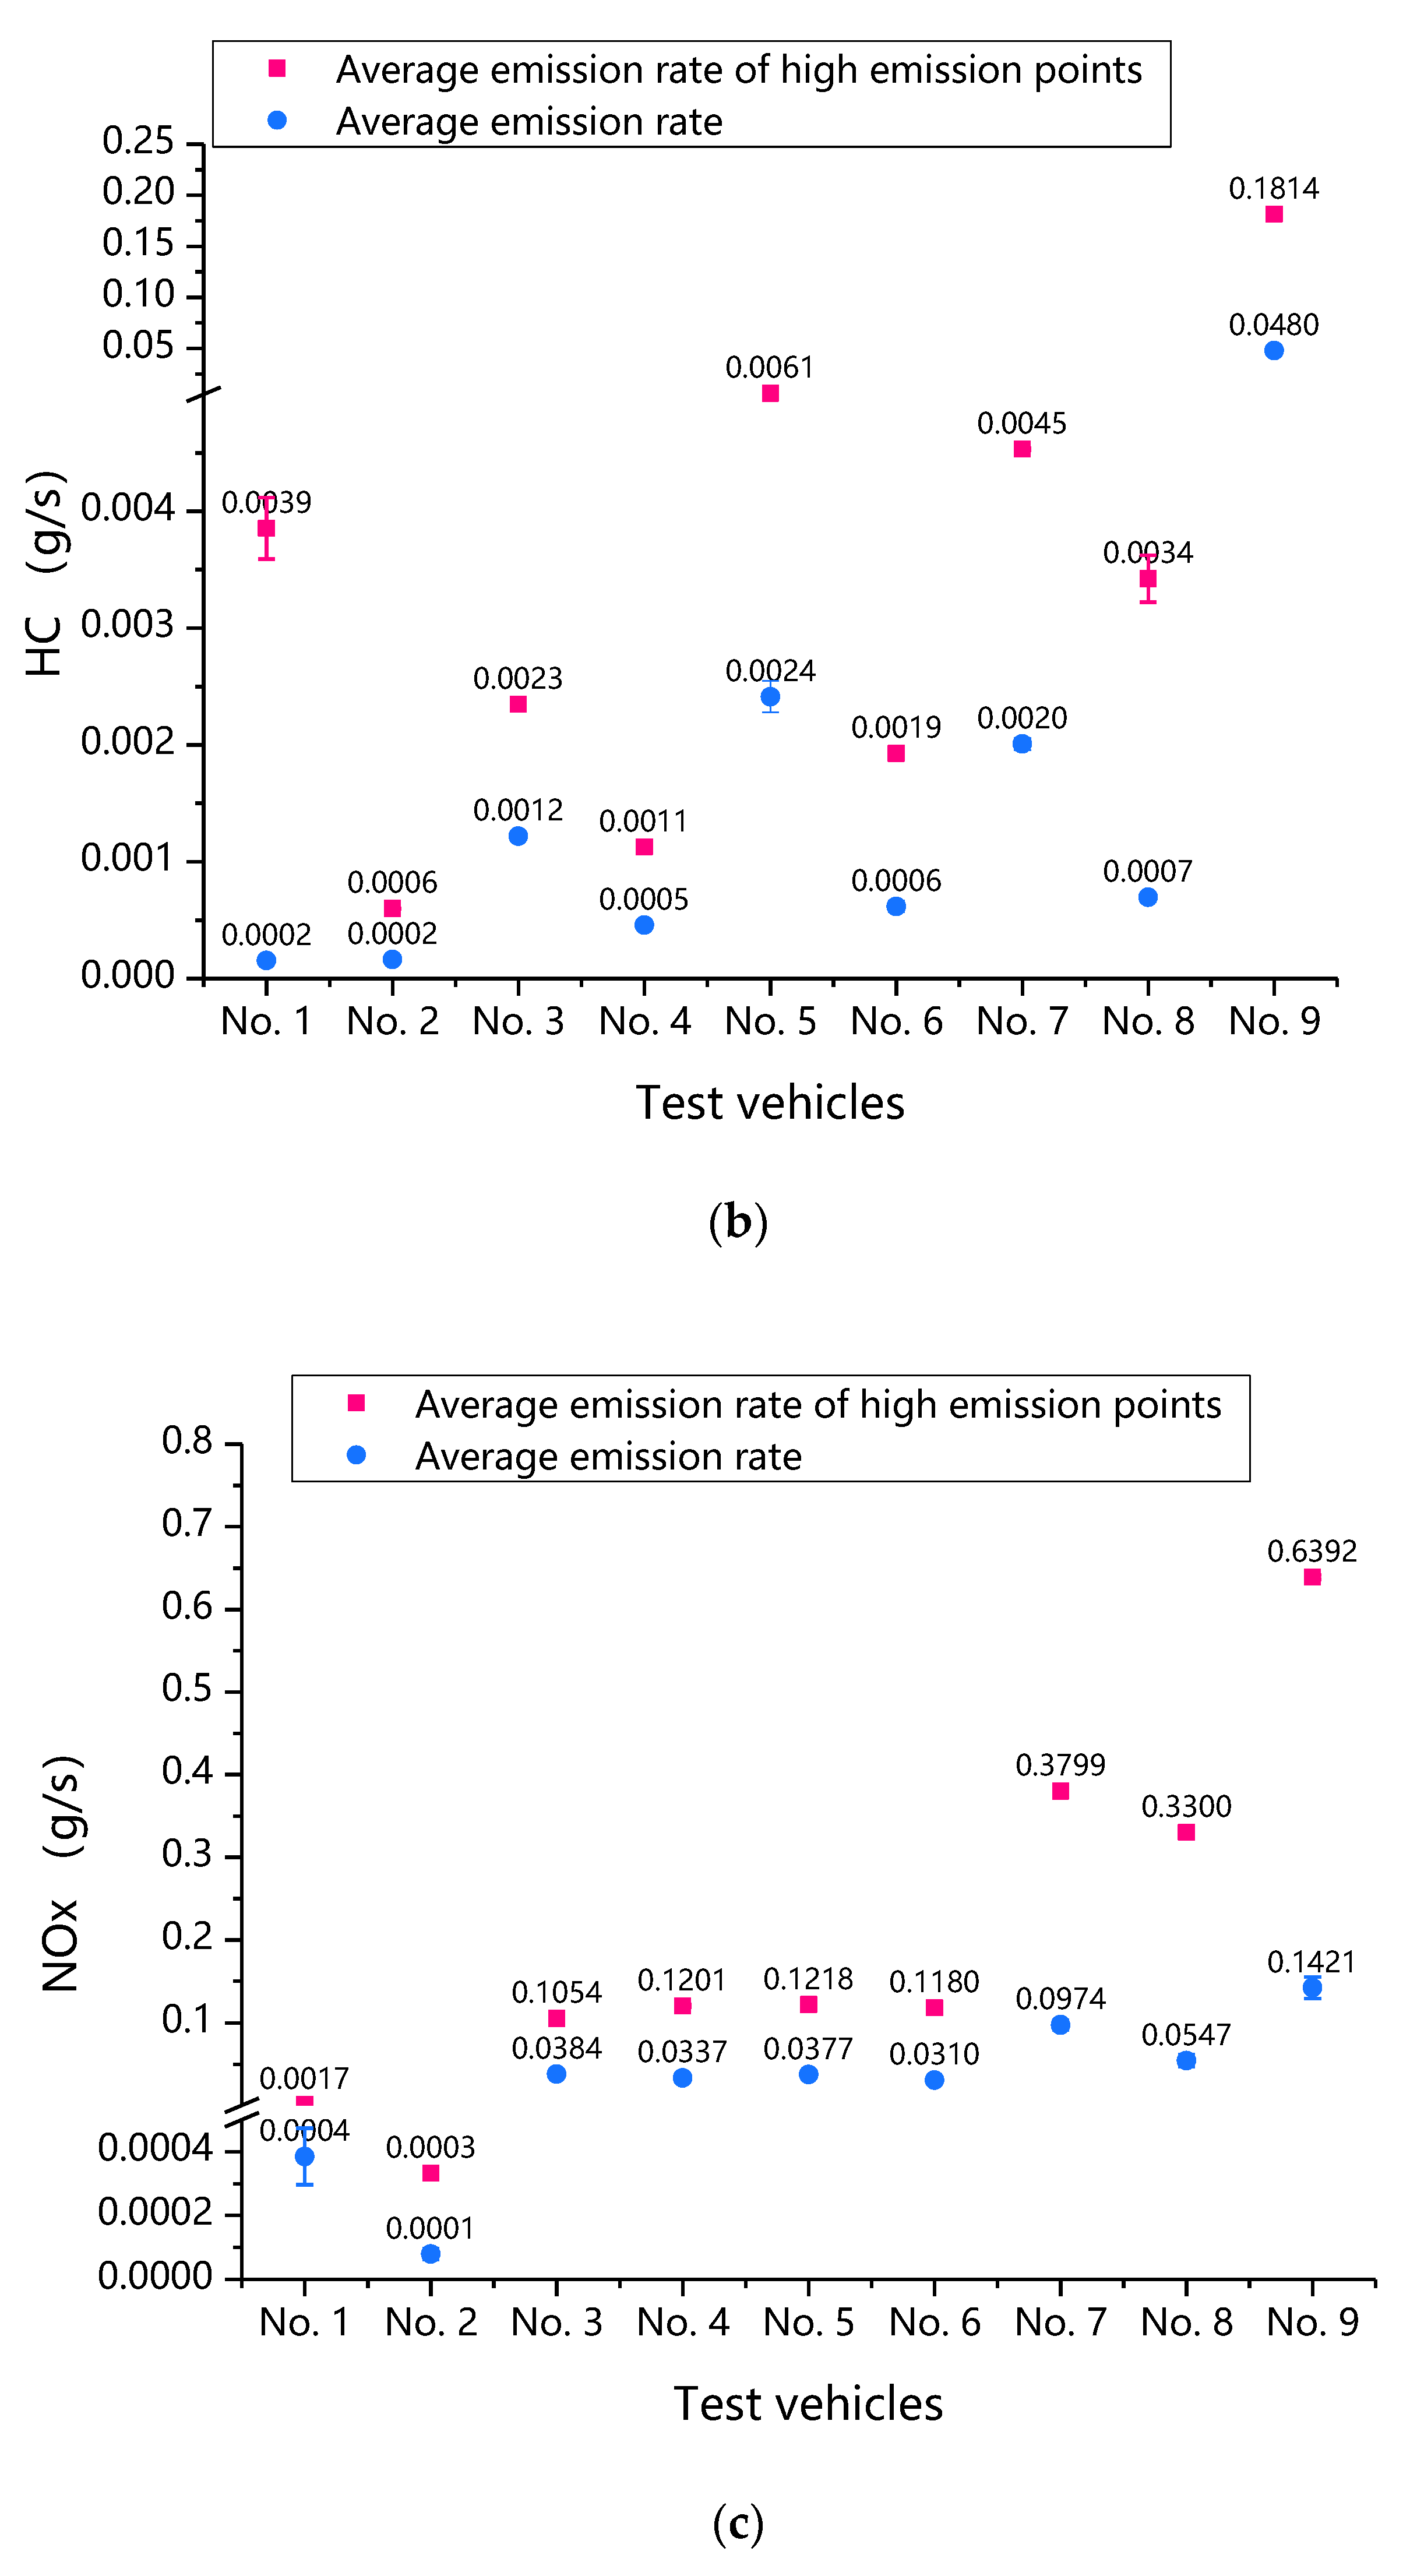
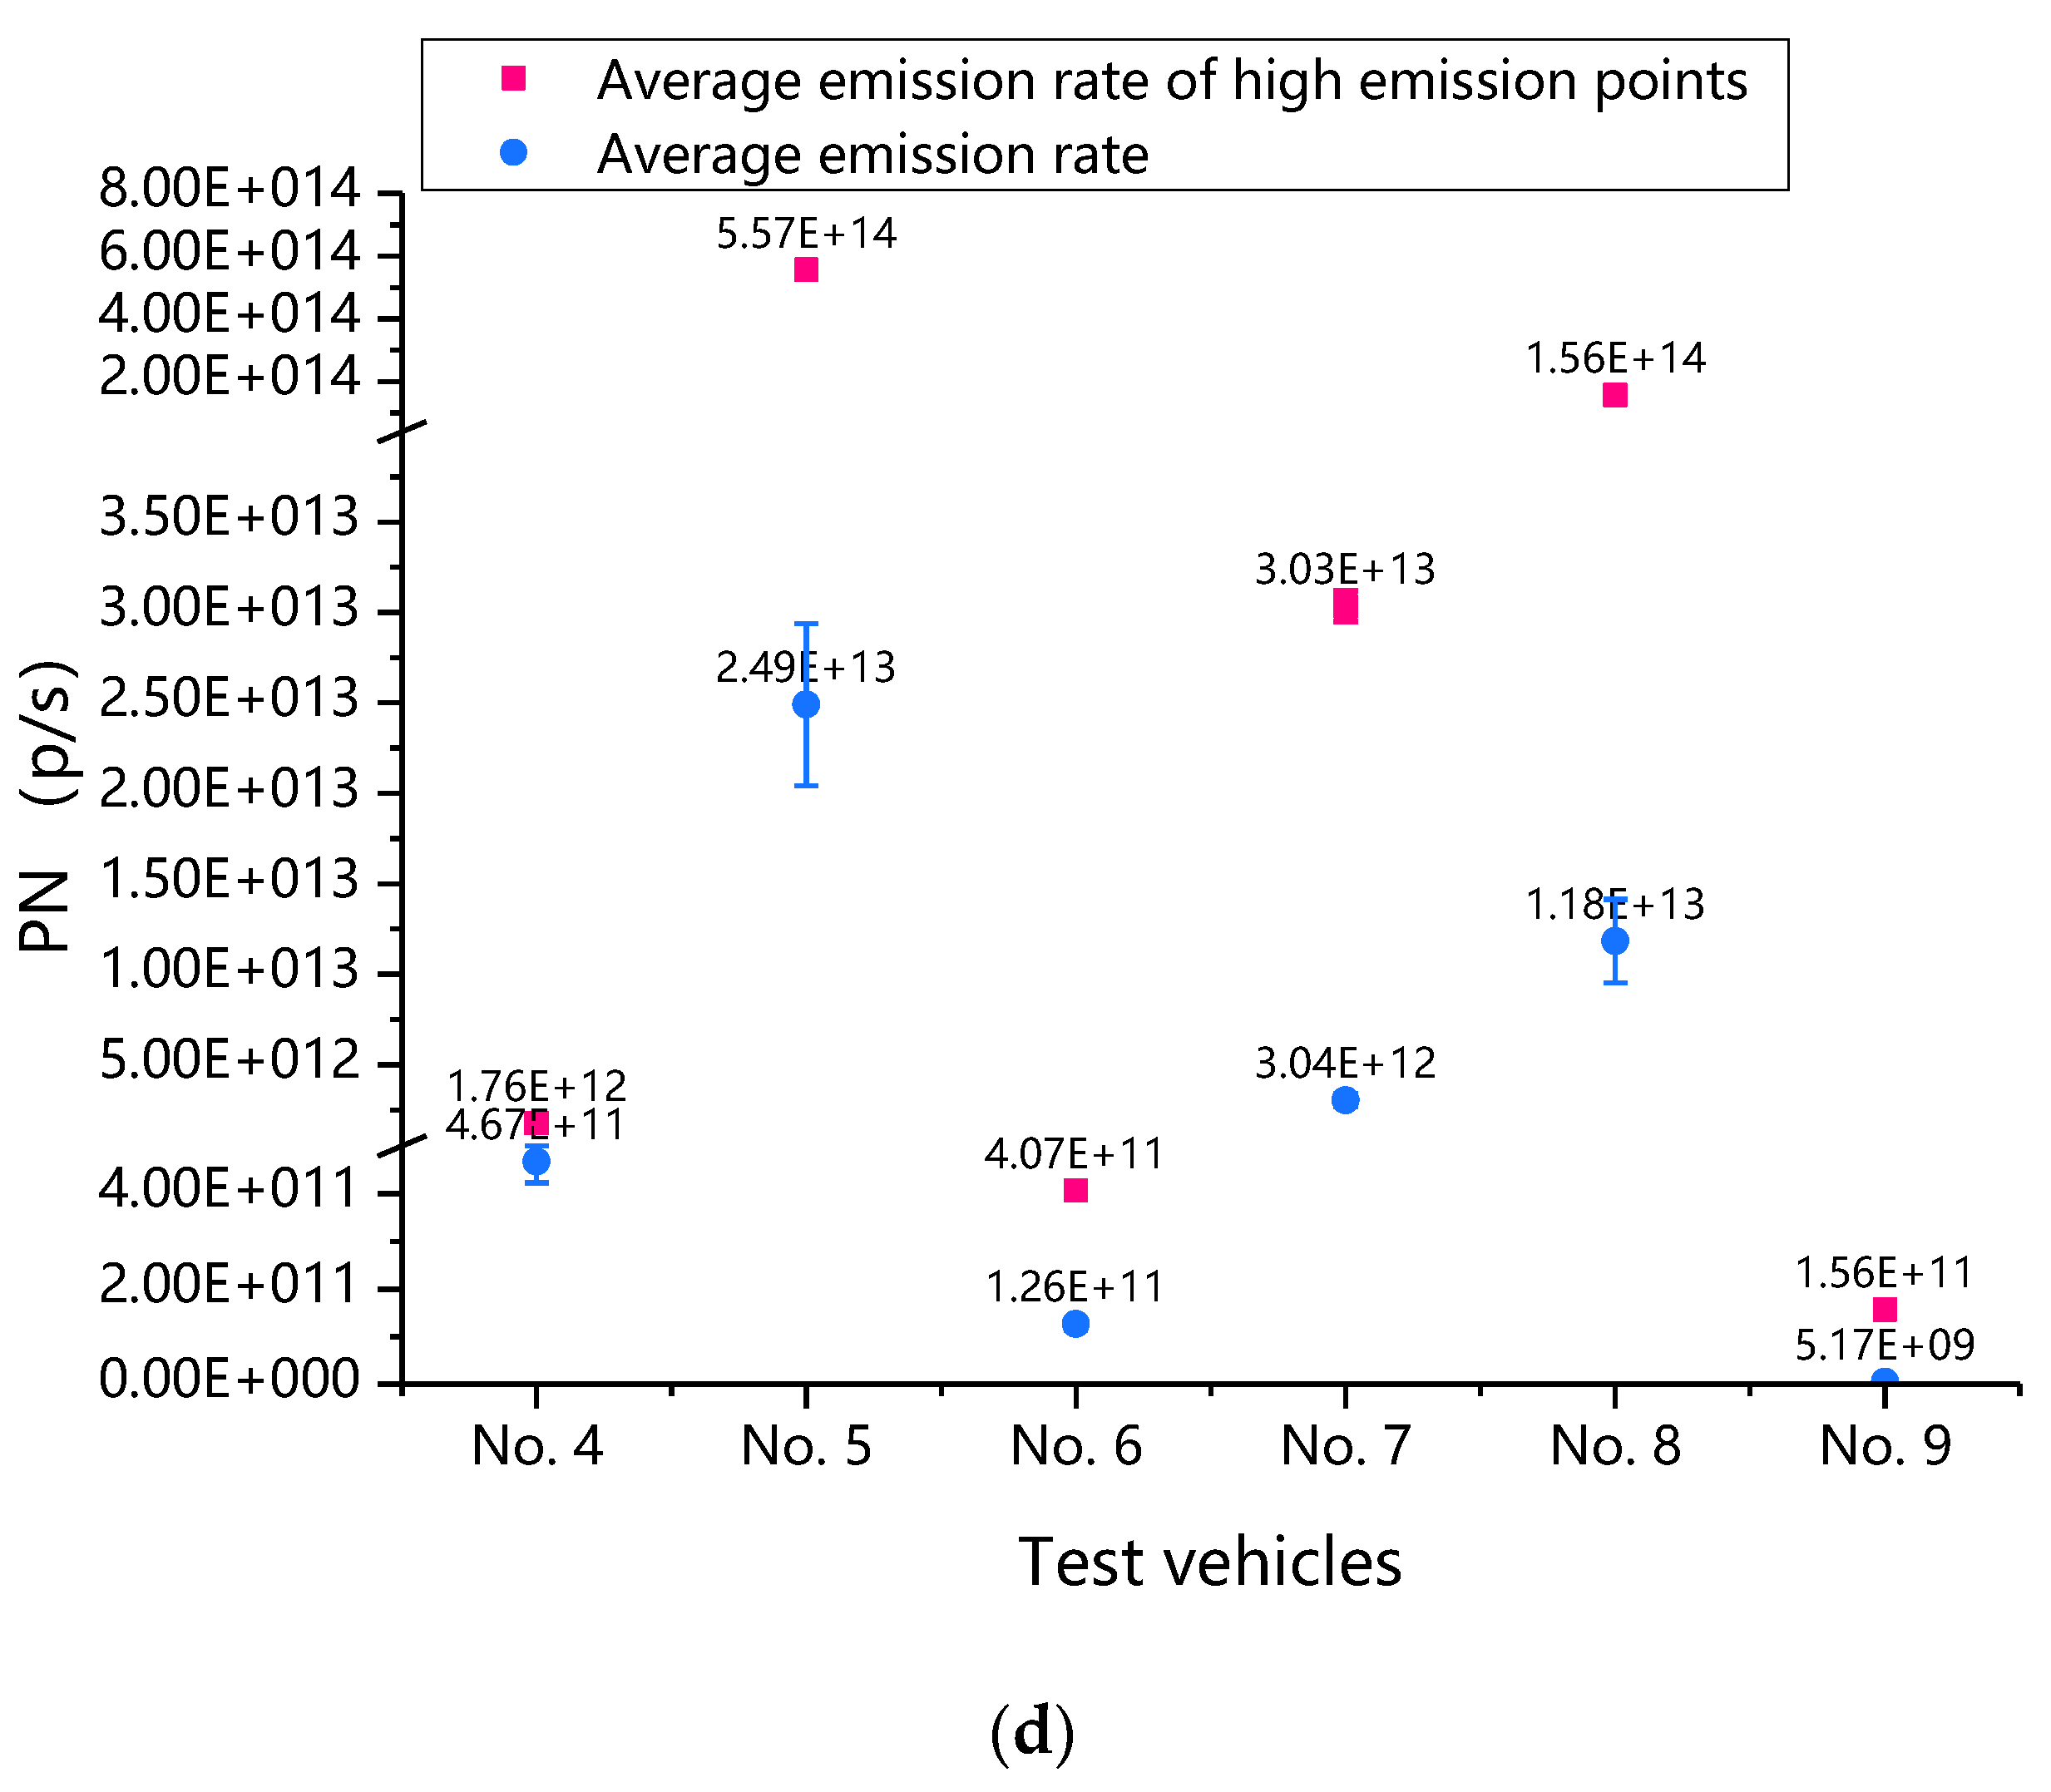
The comparison of the average emission rates and the average emission rates of high-emission points per test vehicles is shown in Figure 7.
In the case of gasoline vehicles, the CO, HC, and NOx average emission rates of No. 1 (gasoline car, China IV) in the high-emission points were 4.35, 24.89, and 4.34 times of those of average emission rates. The CO, HC, and NOx average emission rates of No. 2 (gasoline car, China IV) in the high-emission points were 3.16, 3.69 and 4.20 times of those of average emission rates. The CO, HC, and NOx average emission rates of No. 1 (gasoline car, China IV) were 1.61, 0.95 and 4.86 times of those of No. 2 (gasoline car, China IV). The CO, HC, and NOx average emission rates of No. 1 (gasoline car, China IV) in the high-emission points were 2.22, 6.43 and 5.01 times of those of No. 2 (gasoline car, China IV). In the case of diesel vehicles, the CO, HC, NOx, and PN average emission rates of China III vehicles in the high-emission points were 3.27–14.94, 1.92–2.56, 2.75–3.90 and 9.98–22.35 times of those of average emission rates. The CO, HC, and NOx average emission rates of China IV vehicles in the high-emission points were 3.02–13.56, 2.46–4.92, 3.56–6.03 and 3.22–13.21 times of those of average emission rates. The CO, HC, and NOx average emission rates of No. 3 (diesel truck, China III) were 0.96, 2.66 and 1.13 times of those of No. 4 (diesel truck, China IV). The CO, HC, NOx, and PN average emission rates of No. 5 (diesel middle bus, China III) were 3.22, 3.91, 1.22 and 197.38 times of those of No. 6 (diesel middle bus, China IV). The CO, HC, NOx, and PN average emission rates of No. 7 (diesel bus, China III) were 31.16, 2.89, 1.78 and 0.26 times of those of No. 8 (diesel bus, China IV). By comparison, the CO, HC, and NOx average emission rates of No. 3 (diesel truck, China III) in the high-emission points were 3.84, 2.09 and 0.87 times of those of No. 4 (diesel truck, China IV). The CO, HC, NOx, and PN average emission rates of No. 5 (diesel middle bus, China III) in the high-emission points were 3.47, 3.15, 1.03 and 1368.16 times of those of No. 6 (diesel middle bus, China IV). The CO, HC, NOx, and PN average emission rates of No. 7 (diesel bus, China III) in the high-emission points were 37.34, 1.32, 1.51 and 0.19 times of those of No. 8 (diesel bus, China IV). In the case of LNG vehicle, the CO, HC, NOx, and PN average emission rates in the high-emission points were 3.91, 3.78, 4.50 and 30.27 times of those of average emission rates.
In comparison, we found that the emission rates of test vehicles in high-emission points were significantly higher than their average emission rates. The CO, HC, NOx, and PN average emission rates in the high-emission points could be 3.15–14.93 times, 1.93–24.89 times, 3.23–6.03 times and 3.22–30.27 times of those of average emission rates. In addition, the test vehicles with the highest multiple were as follows. The CO average emission rate of No. 7 (diesel bus, China III) in the high-emission points could be 14.94 times of that of the average emission rate. The HC average emission rate of No. 1 (gasoline car, China IV) in the high-emission points could be 24.89 times of that of the average emission rate. The NOx average emission rate of No. 8 (diesel bus, China IV) in the high-emission points was 6.03 times of that of the average emission rate. The PN average emission rate of No. 9 (LNG bus, China IV) in the high-emission points was 30.27 times of that of the average emission rate. The fuel, mileage traveled vehicle type and emission standard significantly influenced the relationship between the average emission rates and the average emission rates of high-emission points.
At first, mileage traveled demonstrated a significant influence. As shown in Table 1, the mileage traveled by No. 1 (gasoline car, China IV) is approximately 2.8 times that of No. 2 (gasoline car, China IV). The CO, HC, and NOx average emission rates of No. 1 (gasoline car, China IV) were 0.0026 g/s, -0.000008 g/s, and 0.0031 more than those of No. 2 (gasoline car, China IV). By contrast, the CO, HC, and NOx average emission rates of No. 1 (gasoline car, China IV) in the high-emission points were 0.016 g/s, 0.003 g/s and 0.001 g/s more than those of No. 2 (gasoline car, China IV). Therefore, the vehicles with higher mileage had higher emission rates in high-emission points and the increase of average emission rates in the high-emission points was more than 4 times of that of average emission rates. Moreover, the increase of HC average emission rates in the high-emission points was the most significant.
The fuel of test vehicles was a significant influence, too. The CO average emission rates of diesel vehicles in the high-emission points were 3.02–14.94 times of those of average emission rates, higher than those of gasoline vehicles (3.16–4.35 times) and LNG vehicle (3.91 times). The HC average emission rates of gasoline vehicles in the high-emission points were 3.69–24.89 times of those of average emission rates, higher than those of diesel vehicles (1.93–4.92 times) and LNG vehicle (3.78 times). The NOx average emission rates of gasoline, diesel, and LNG vehicles in the high-emission points were 4.20–4.34 times, 2.75–6.03 times and 4.50 times of those of average emission rates. They were relatively close. The PN average emission rates of LNG vehicle in the high-emission points was 30.27 times of those of average emission rates, higher than those of diesel vehicles (3.22–22.35 times). Therefore, the improvement of emission standards did not significantly reduce the emissions at high-emission points.
Finally, the emission standard and vehicle type also influenced the relationship between the average emission rates and the average emission rates of high-emission points. The CO average emission rates of China III diesel vehicles in the high-emission points were 3.27–14.94 times of those of average emission rates, higher than those of China IV diesel vehicles (3.02–13.60 times). However, their HC and NOx average emission rates in the high-emission points were 1.93–2.52 times and 2.75–3.90 times of those of average emission rates, less than those of China IV diesel vehicles (2.46–4.92 times and 3.56–6.03 times). The PN average emission rates of No.6 (diesel middle bus, China IV) in the high-emission points were 3.22 times of those of average emission rates, less than those of No.5 (diesel middle bus, China III) (22.34 times). On the contrary, the PN average emission rates of No.8 (diesel bus, China IV) in the high-emission points were 13.21 times of those of average emission rates, more than those of No.7 (diesel bus, China III) (9.98 times). The CO and HC average emission rates in the high-emission points of No.4 (diesel truck, China IV) and No.6 (diesel middle bus, China IV) was 52.06–74.02% and 68.30–71.22% less than that of No.3 (diesel truck, China III) and No.5 (diesel middle bus, China III). That of No.8 (diesel bus, China IV) was 24.48–37.34% less than that of No.7 (diesel bus, China III). Furthermore, the PN average emission rates in the high-emission points of No.6 (diesel middle bus, China IV) was 99.93% less than that of No.5 (diesel middle bus, China III), due to the removal of particulate matter by DPF [59]. That of No.8 (diesel bus, China IV) was 415.21% more than that of No.7 (diesel bus, China III), due to the direct interaction of NH3 with the catalyst material and the exhaust gas in SCR [39]. However, the NOx average emission rates in the high-emission points of No.8 (diesel bus, China IV) was 13.13% less than that of No.7 (diesel bus, China III), due to the removal of NOx by SCR [60]. That of No.4 (diesel truck, China IV) was 13.99% more than that of No.3 (diesel truck, China III), and that of No.6 (diesel middle bus, China IV) was 3.14% more than that of No.5 (diesel middle bus, China III).

3.3. The Number Distribution of Particulate Matter

3.3.1. The Average PN Size and Particle Mode Distribution

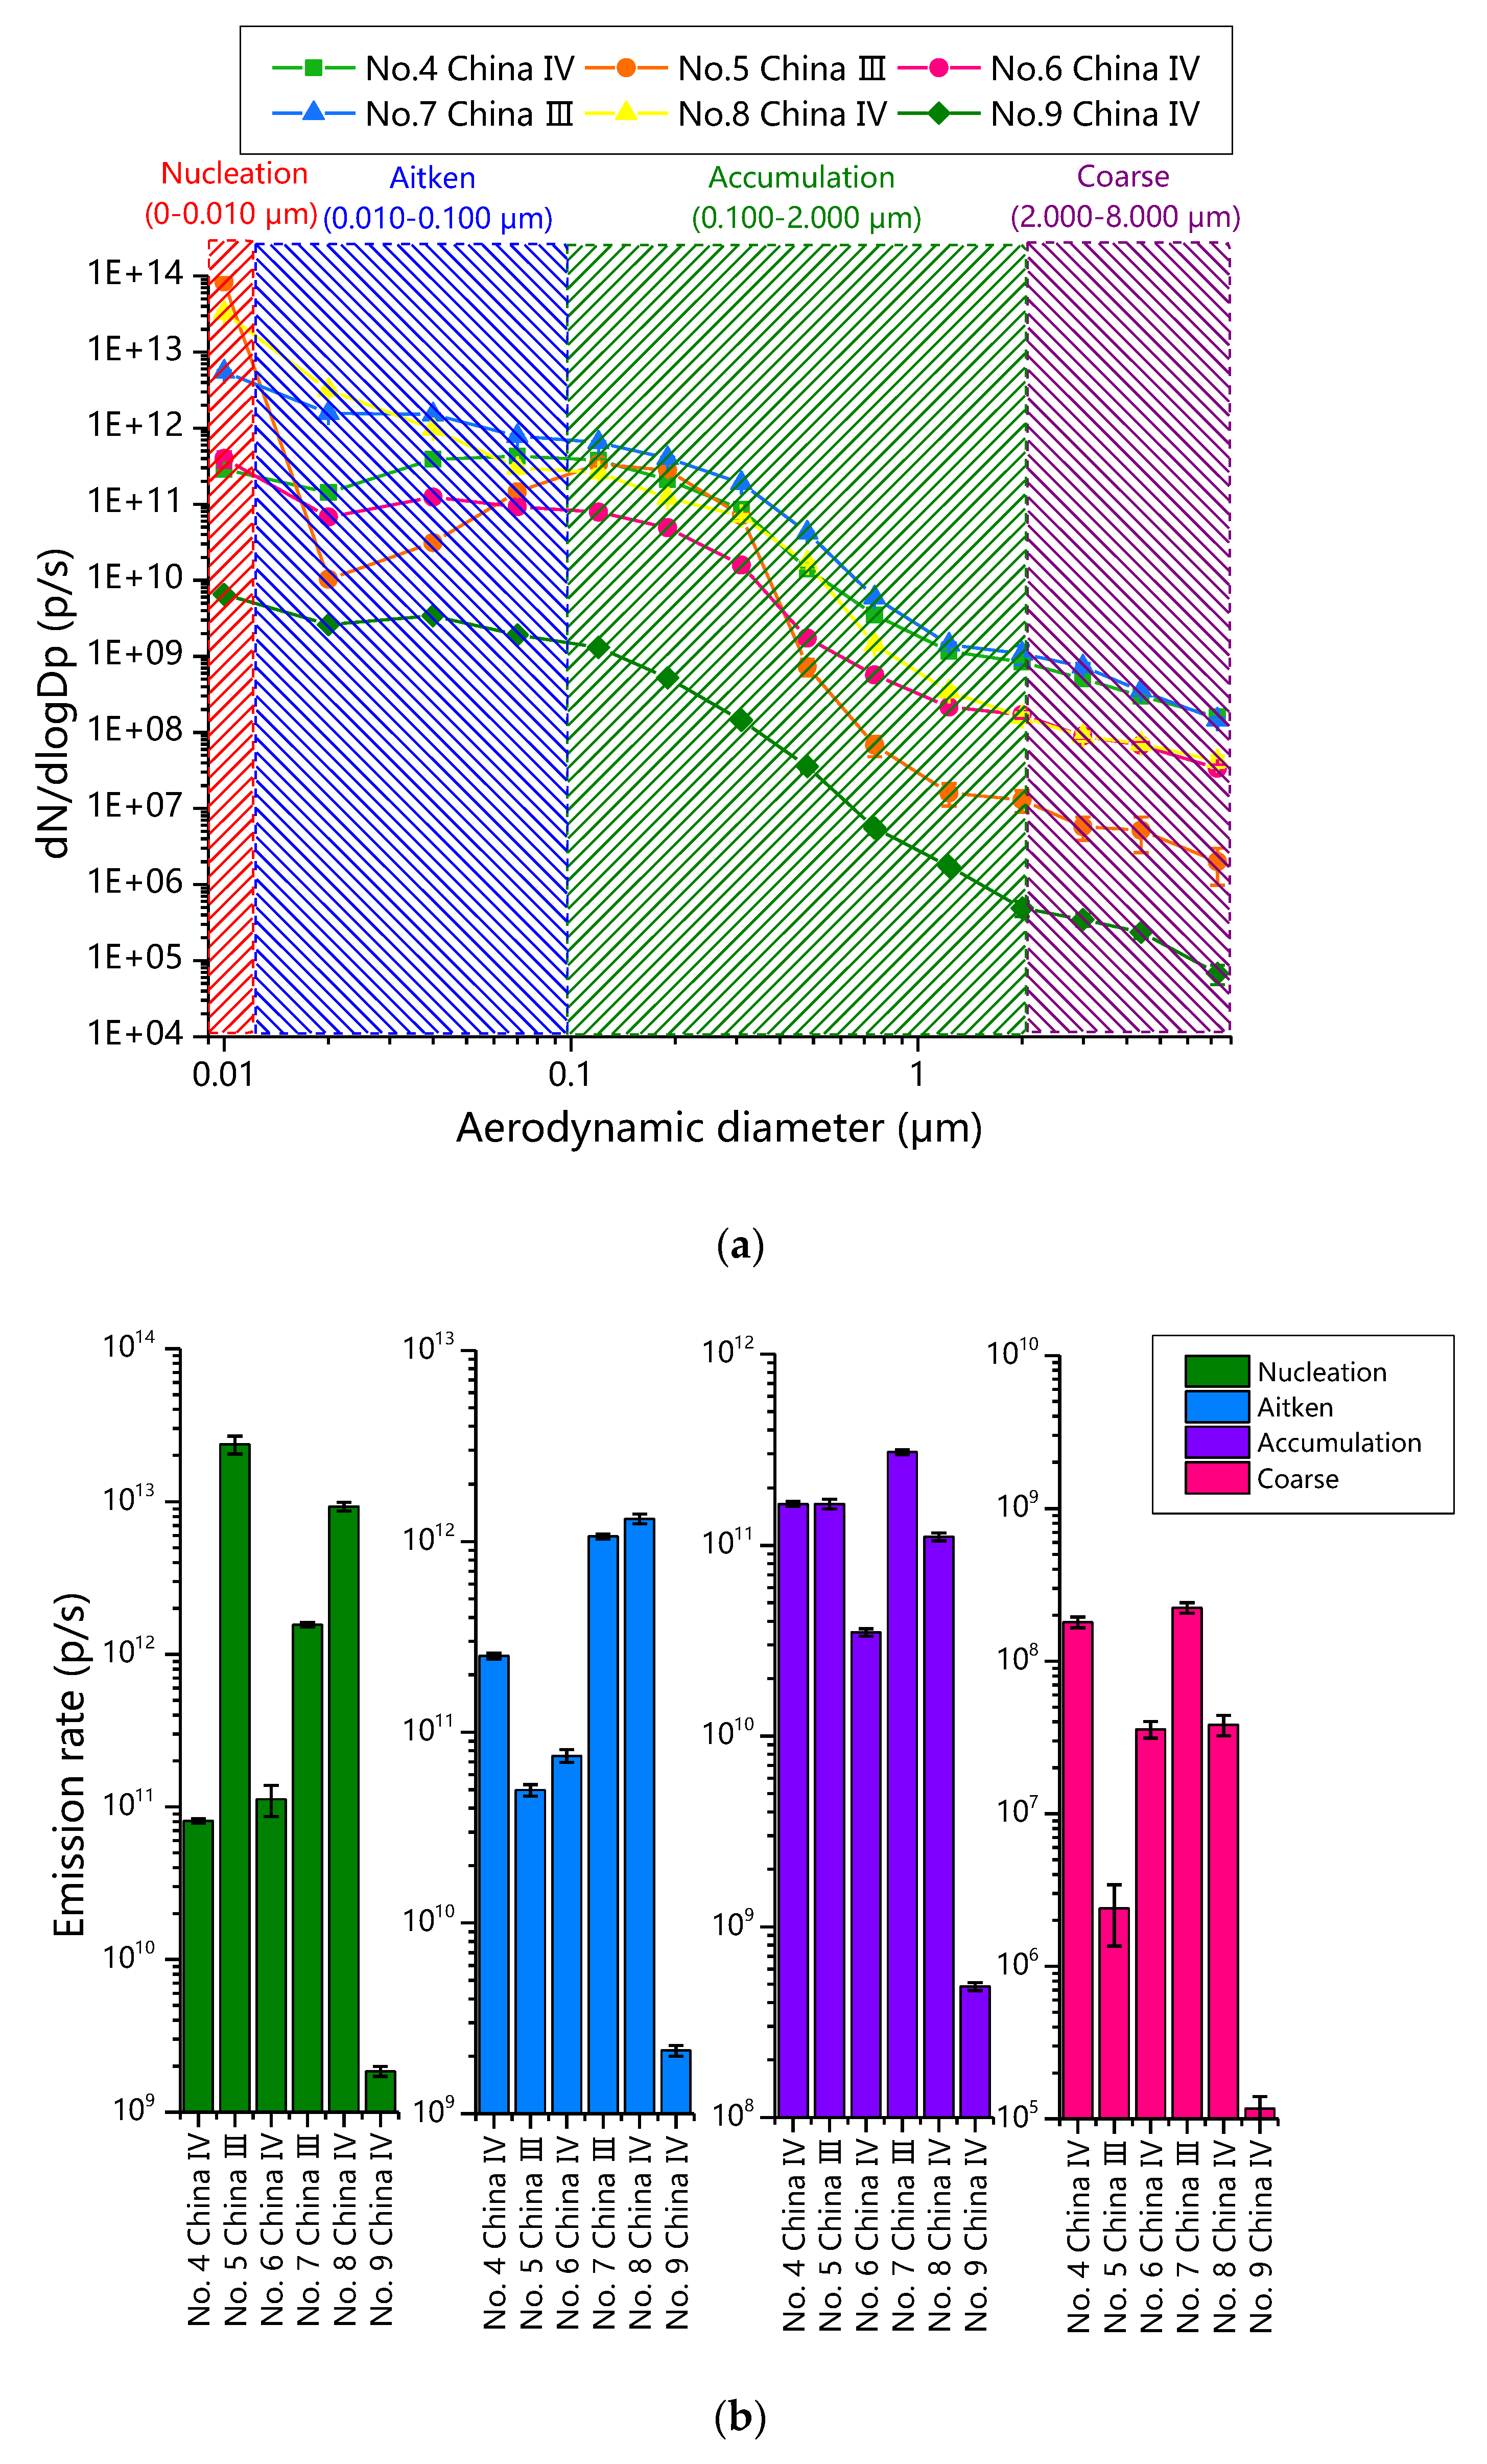
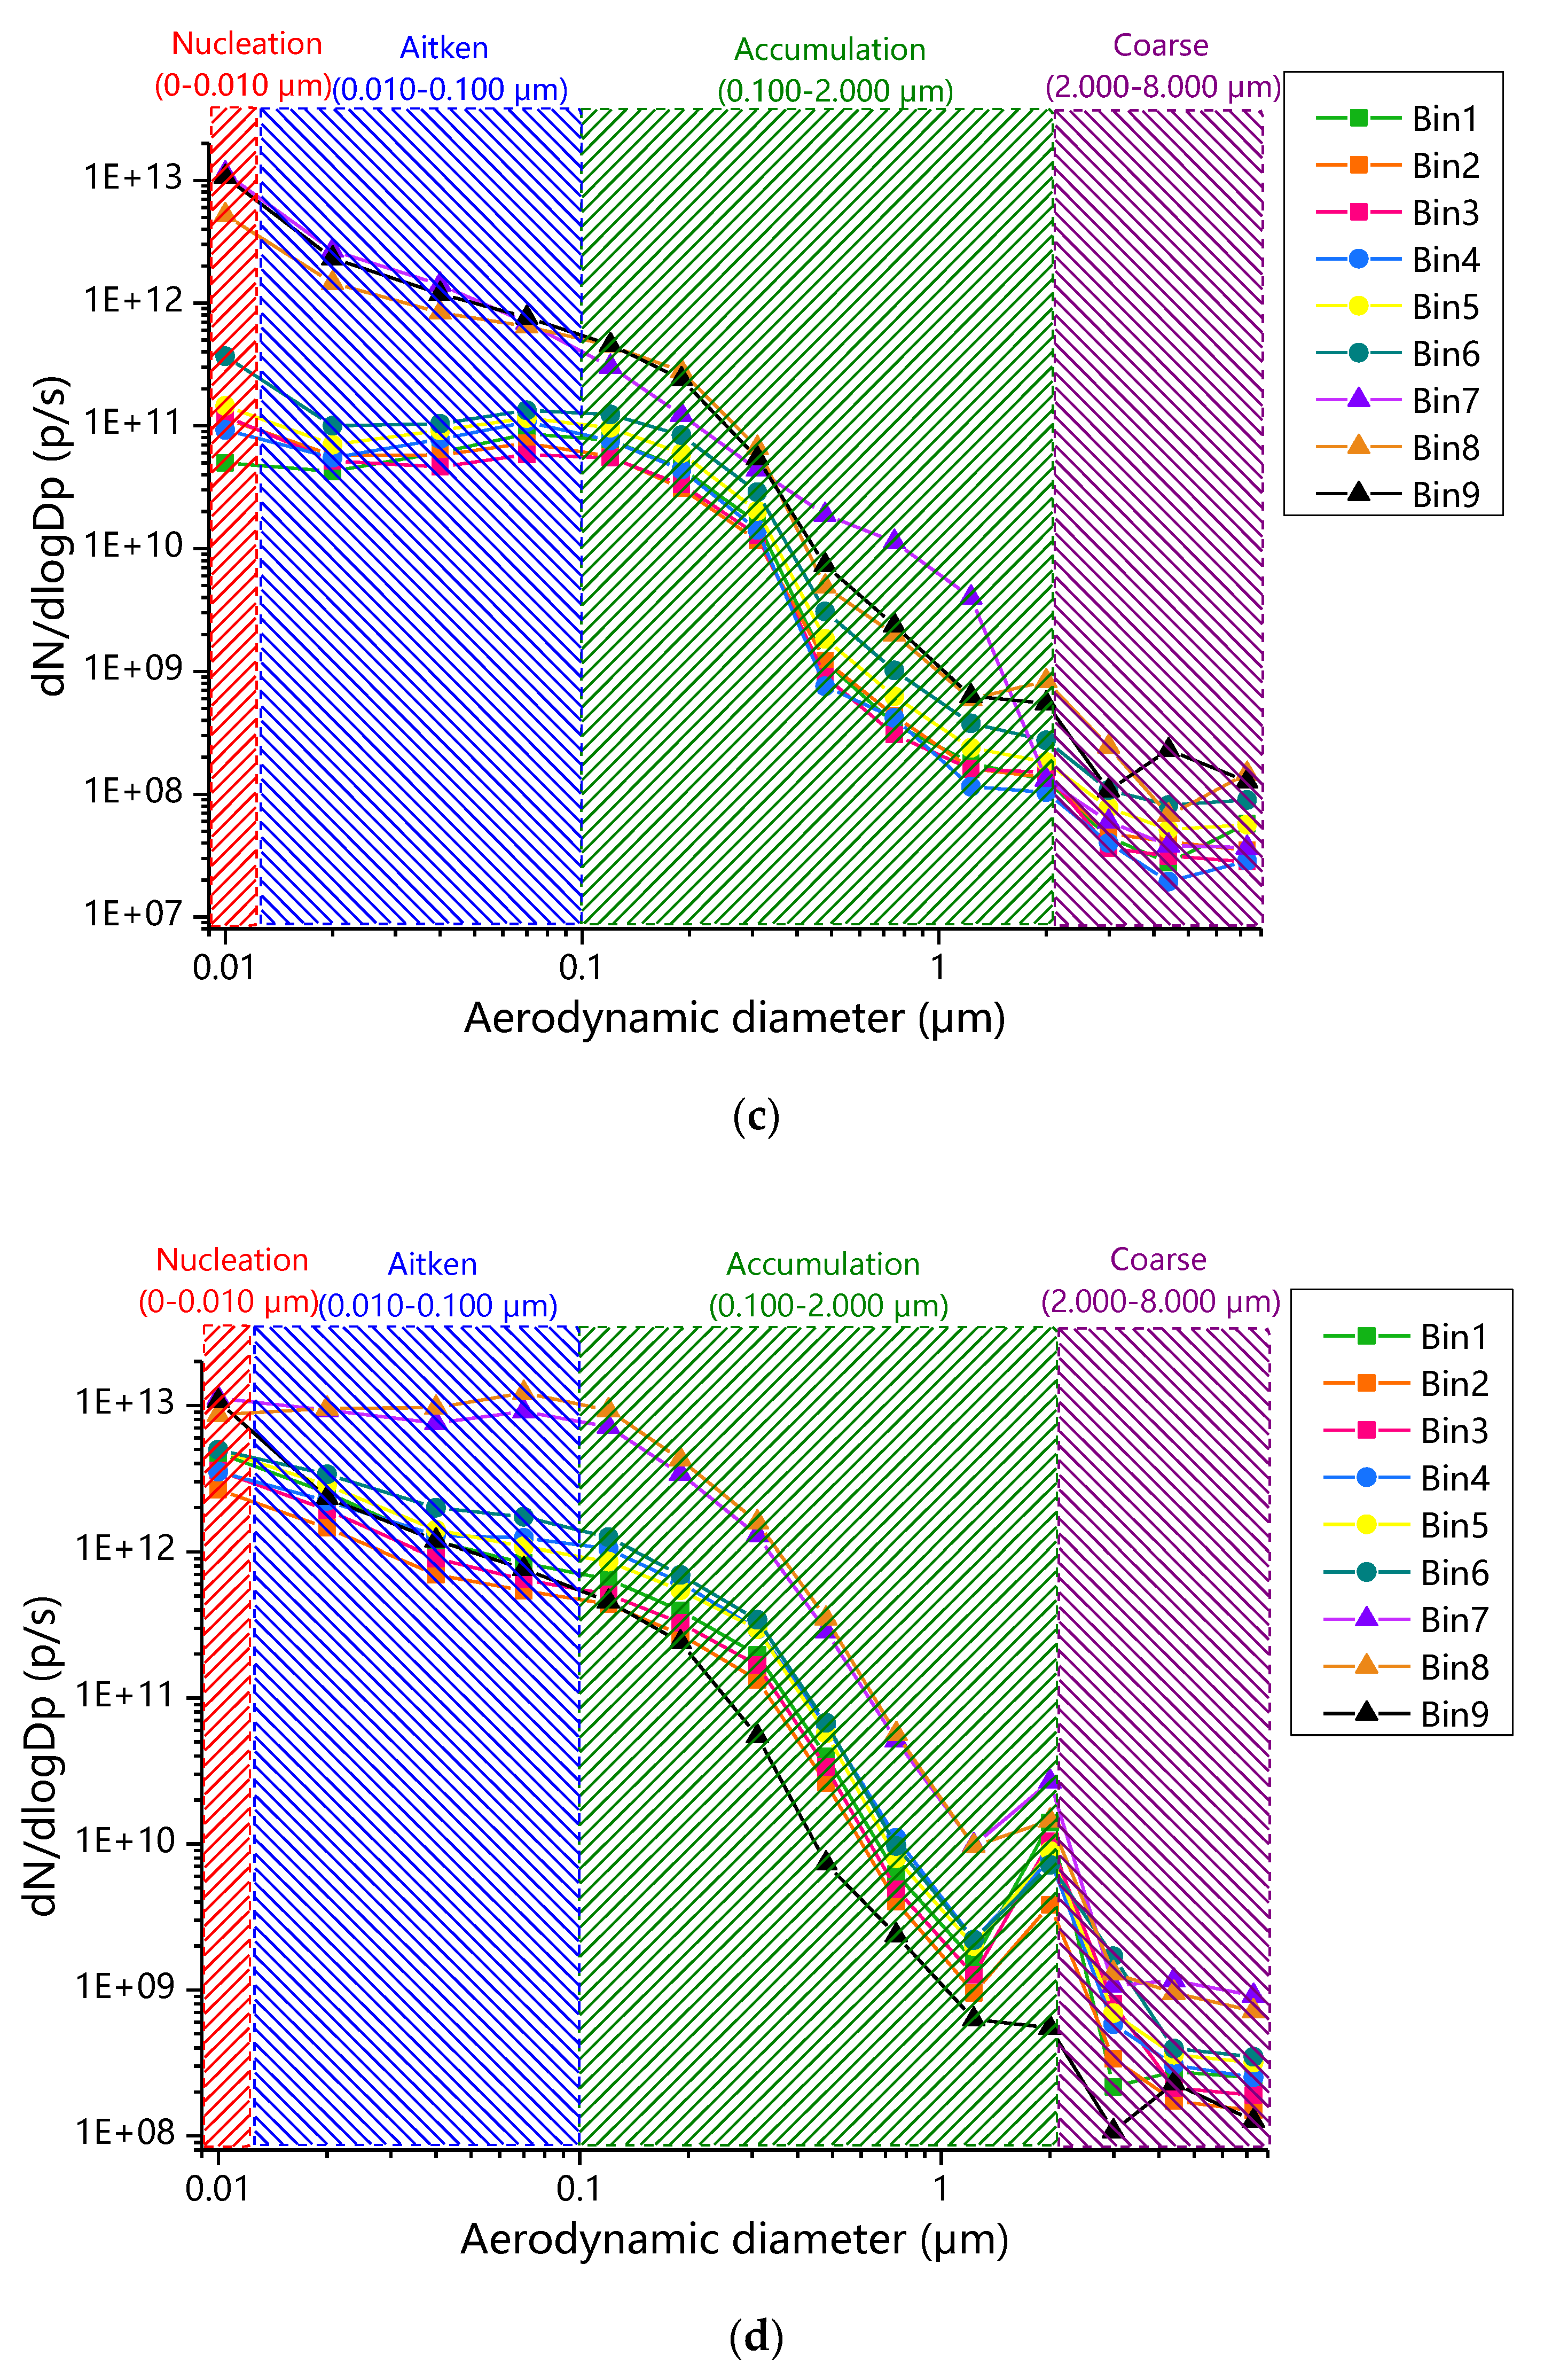
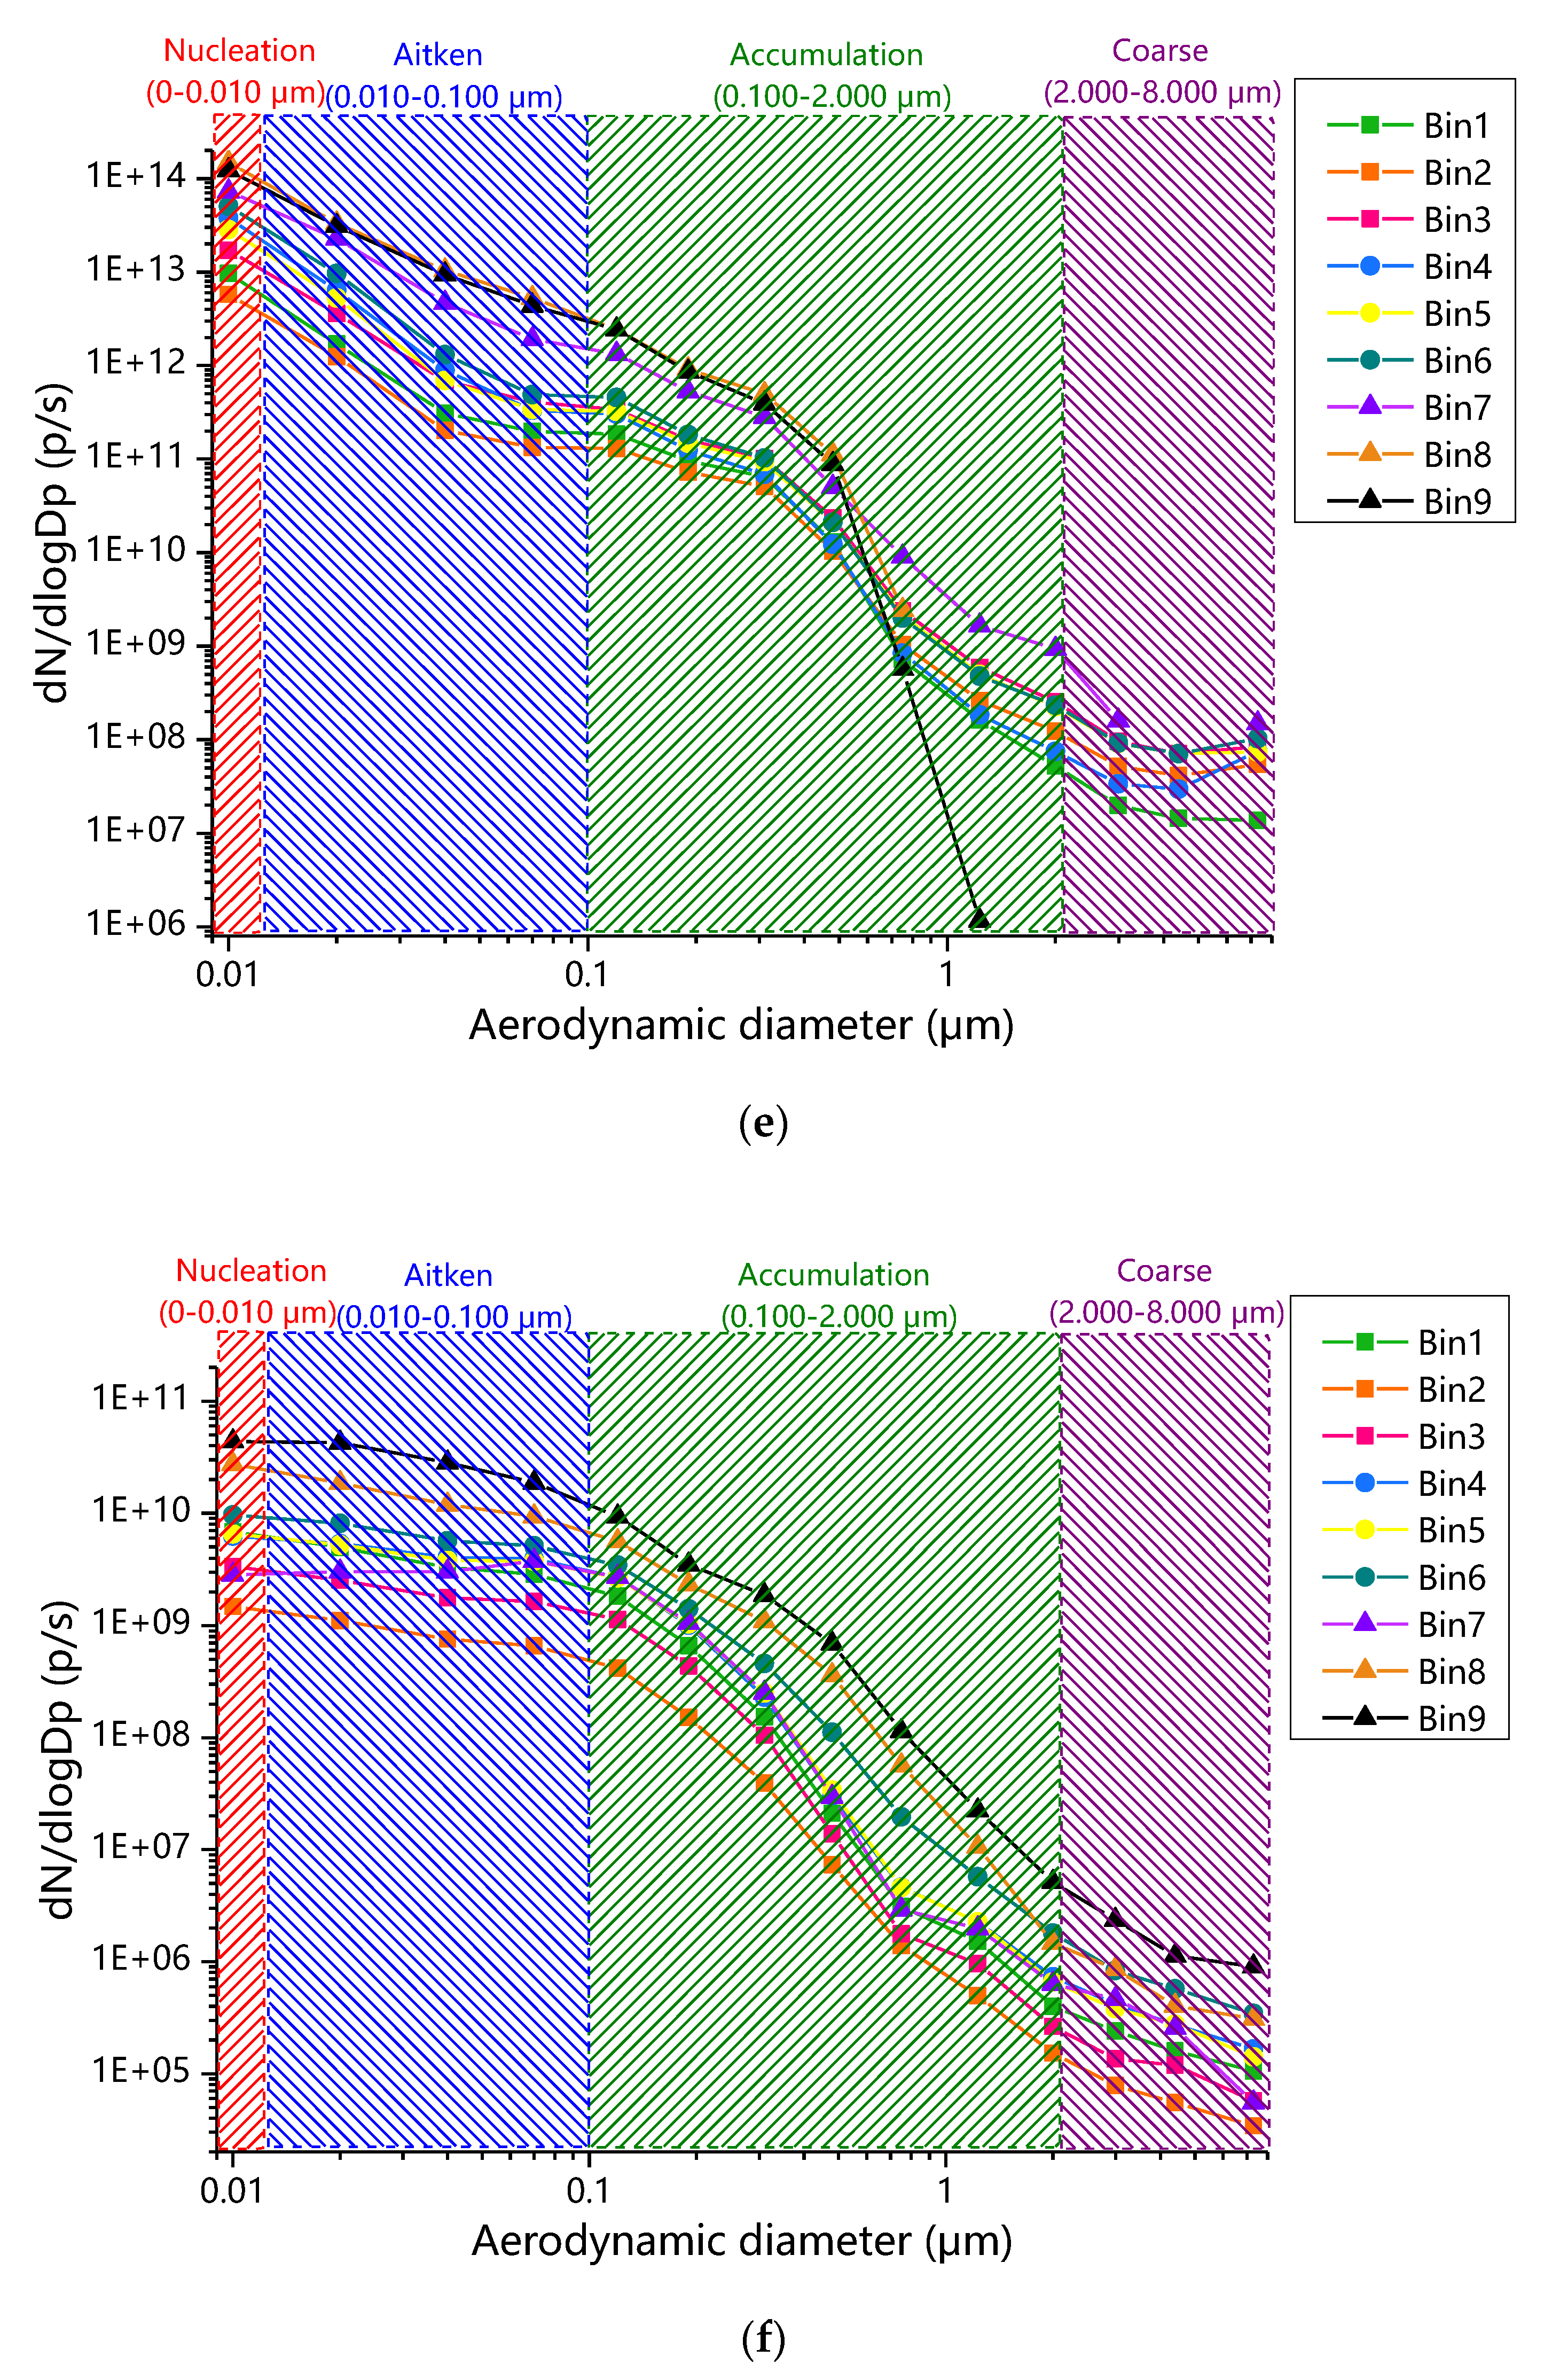
Figure 8 illustrate the difference in PN average emission characteristics among test vehicles. Based on the geometric mean aerodynamic diameter of each stage, the PN emission rates were classified into 14 diameter segments. Moreover, the particles were divided as follows: nucleation-mode particles (Nucleation), Aitken-mode particles (Aitken), accumulation-mode particles (Accumulation), and coarse mode particles (Coarse). Figure 6 shows the average PN size and particle mode distribution of each test vehicle. Generally, No. 5 (diesel middle bus, China III) demonstrated the highest emission rates of nucleation (2.36 × 10¹³ p/s). No. 7 (diesel bus, China III) showed the highest emission rates of accumulation (3.06 × 10¹¹ p/s) and coarse (2.24 × 10⁸ p/s). No. 8 (diesel bus, China IV) demonstrated the highest emission rates of Aitken (1.32 × 10¹² p/s). Among them, the nucleation (1.85 × 10⁹ p/s), Aitken (2.15 × 10⁹ p/s), accumulation (4.86 × 10⁸ p/s), and coarse (1.17 × 10⁵ p/s) of No. 9 (LNG bus, China IV) were the lowest. For the same vehicle type of diesel buses, the China IV vehicle demonstrated higher PN emission rates in stage 1–2 particles (aerodynamic diameter < 30 nm). It was the reason that the nucleation and Aitken of the China IV vehicle were more abundant as compared to those of the China III vehicle. For diesel middle bus, the China IV vehicle showed higher PN emission rates in stage 2–3 particles (6 nm < aerodynamic diameter < 54 nm) and stage 8–14 particles (aerodynamic diameter > 250 nm). Therefore, the Aitken and Coarse of the China IV vehicle were higher as compared to those of the China III vehicle.
In summary, most of the particles emitted from the diesel and LNG test vehicles focused on nucleation-mode particles and Aitken-mode particles. Figure 8 shows the mode particle of each test vehicle with different control technologies of engine and exhaust emissions after the treatment. The highest PN emission rate and nucleation proportion were displayed by No. 5 (diesel middle bus, China III), without CIC (turbocharged intercooler), DPF (diesel particulate), or SCR. The PN emission rate and nucleation of No. 7 (diesel bus, China III) with CIC was 87.68% and 93.38% less than those of No. 5 (diesel middle bus, China III), respectively. It was because the higher combustion temperature and the air-fuel ratio of the engine with CIC [61] led to the complete burning of semivolatile organic compounds (SVOC), which inhibited the formation of nucleation. On the contrary, the PN emission rate and the nucleation of No. 6 (diesel middle bus, China IV) with EGR + DPF were 99.06% and 99.52% less than those of No. 5 (diesel middle bus, China III), respectively, which were found to be consistent with the reported studies [62,63,64]. Simultaneously, the EGR significantly decreased the average temperature of in-cylinder and inhibited the oxidation of S (elemental sulfur) into SO2 (sulfur dioxide), thus reducing the formation of nucleation-mode particles [65]. Similarly, the PN emission rate and the nucleation of No. 4 (diesel truck, China IV) with CIC and EGR + DPF was 97.91% and 99.66% less than those of No. 5 (diesel middle bus, China III), respectively. Moreover, No. 9 (LNG bus, China IV) with CIC displayed similar nucleation, Aitken, accumulation, and coarse proportions to those of No. 7 (diesel bus, China III) and No. 6 (diesel middle bus, China IV). However, as compared to No. 7 (diesel bus, China III), the PN emission rate and the nucleation of No. 8 (diesel bus, China IV) with CIC and SCR increased by 266.13% and 496.20%, respectively. No. 8 (diesel bus, China IV) displayed higher PN emission rates in stage 1–2 particles (aerodynamic diameter < 30 nm), which were observed to be consistent with the previous studies. In many studies, in SCR operations, an increase in PM [66,67], the total number of particles [68,69], and the number solid particles of > 23 nm [66] up to three times [39] has been reported. The reason for this was that SCR devices could form new nonvolatile particles in the exhaust pipe of diesel vehicles because of the direct interaction of NH3 with the catalyst material and the exhaust gas. On the other hand, No. 6 (diesel middle bus, China IV) showed higher Aitken and accumulation proportions as compared to other test vehicles without EGR. It was because the use of EGR inhibits the oxidation of large particles, thus resulting in an increased number concentration of Aitken and accumulation [65], which are caused primarily by the collision, agglomeration, and adsorption of nitrates, sulfate, organics, or soot particles [70]. In other words, part of nucleation might be prompted by EGR to convert into Aitken or accumulation. No. 7 (diesel bus, China III) and No. 9 (LNG bus, China IV) showed a higher Aitken proportion than other test vehicles without CIC. Because the use of CIC increases the combustion temperature of the engine which is considered to be beneficial for the formation of Aitken originating from the cracking of diesel at higher temperatures [71]. No. 4 (diesel truck, China IV) with both CIC and EGR and DPF showed higher Aitken and accumulation as compared to No. 6 (diesel middle bus, China IV) and No. 7 (diesel bus, China III).

3.3.2. The Relationship between Speed, VSP, and the PN Size Distribution

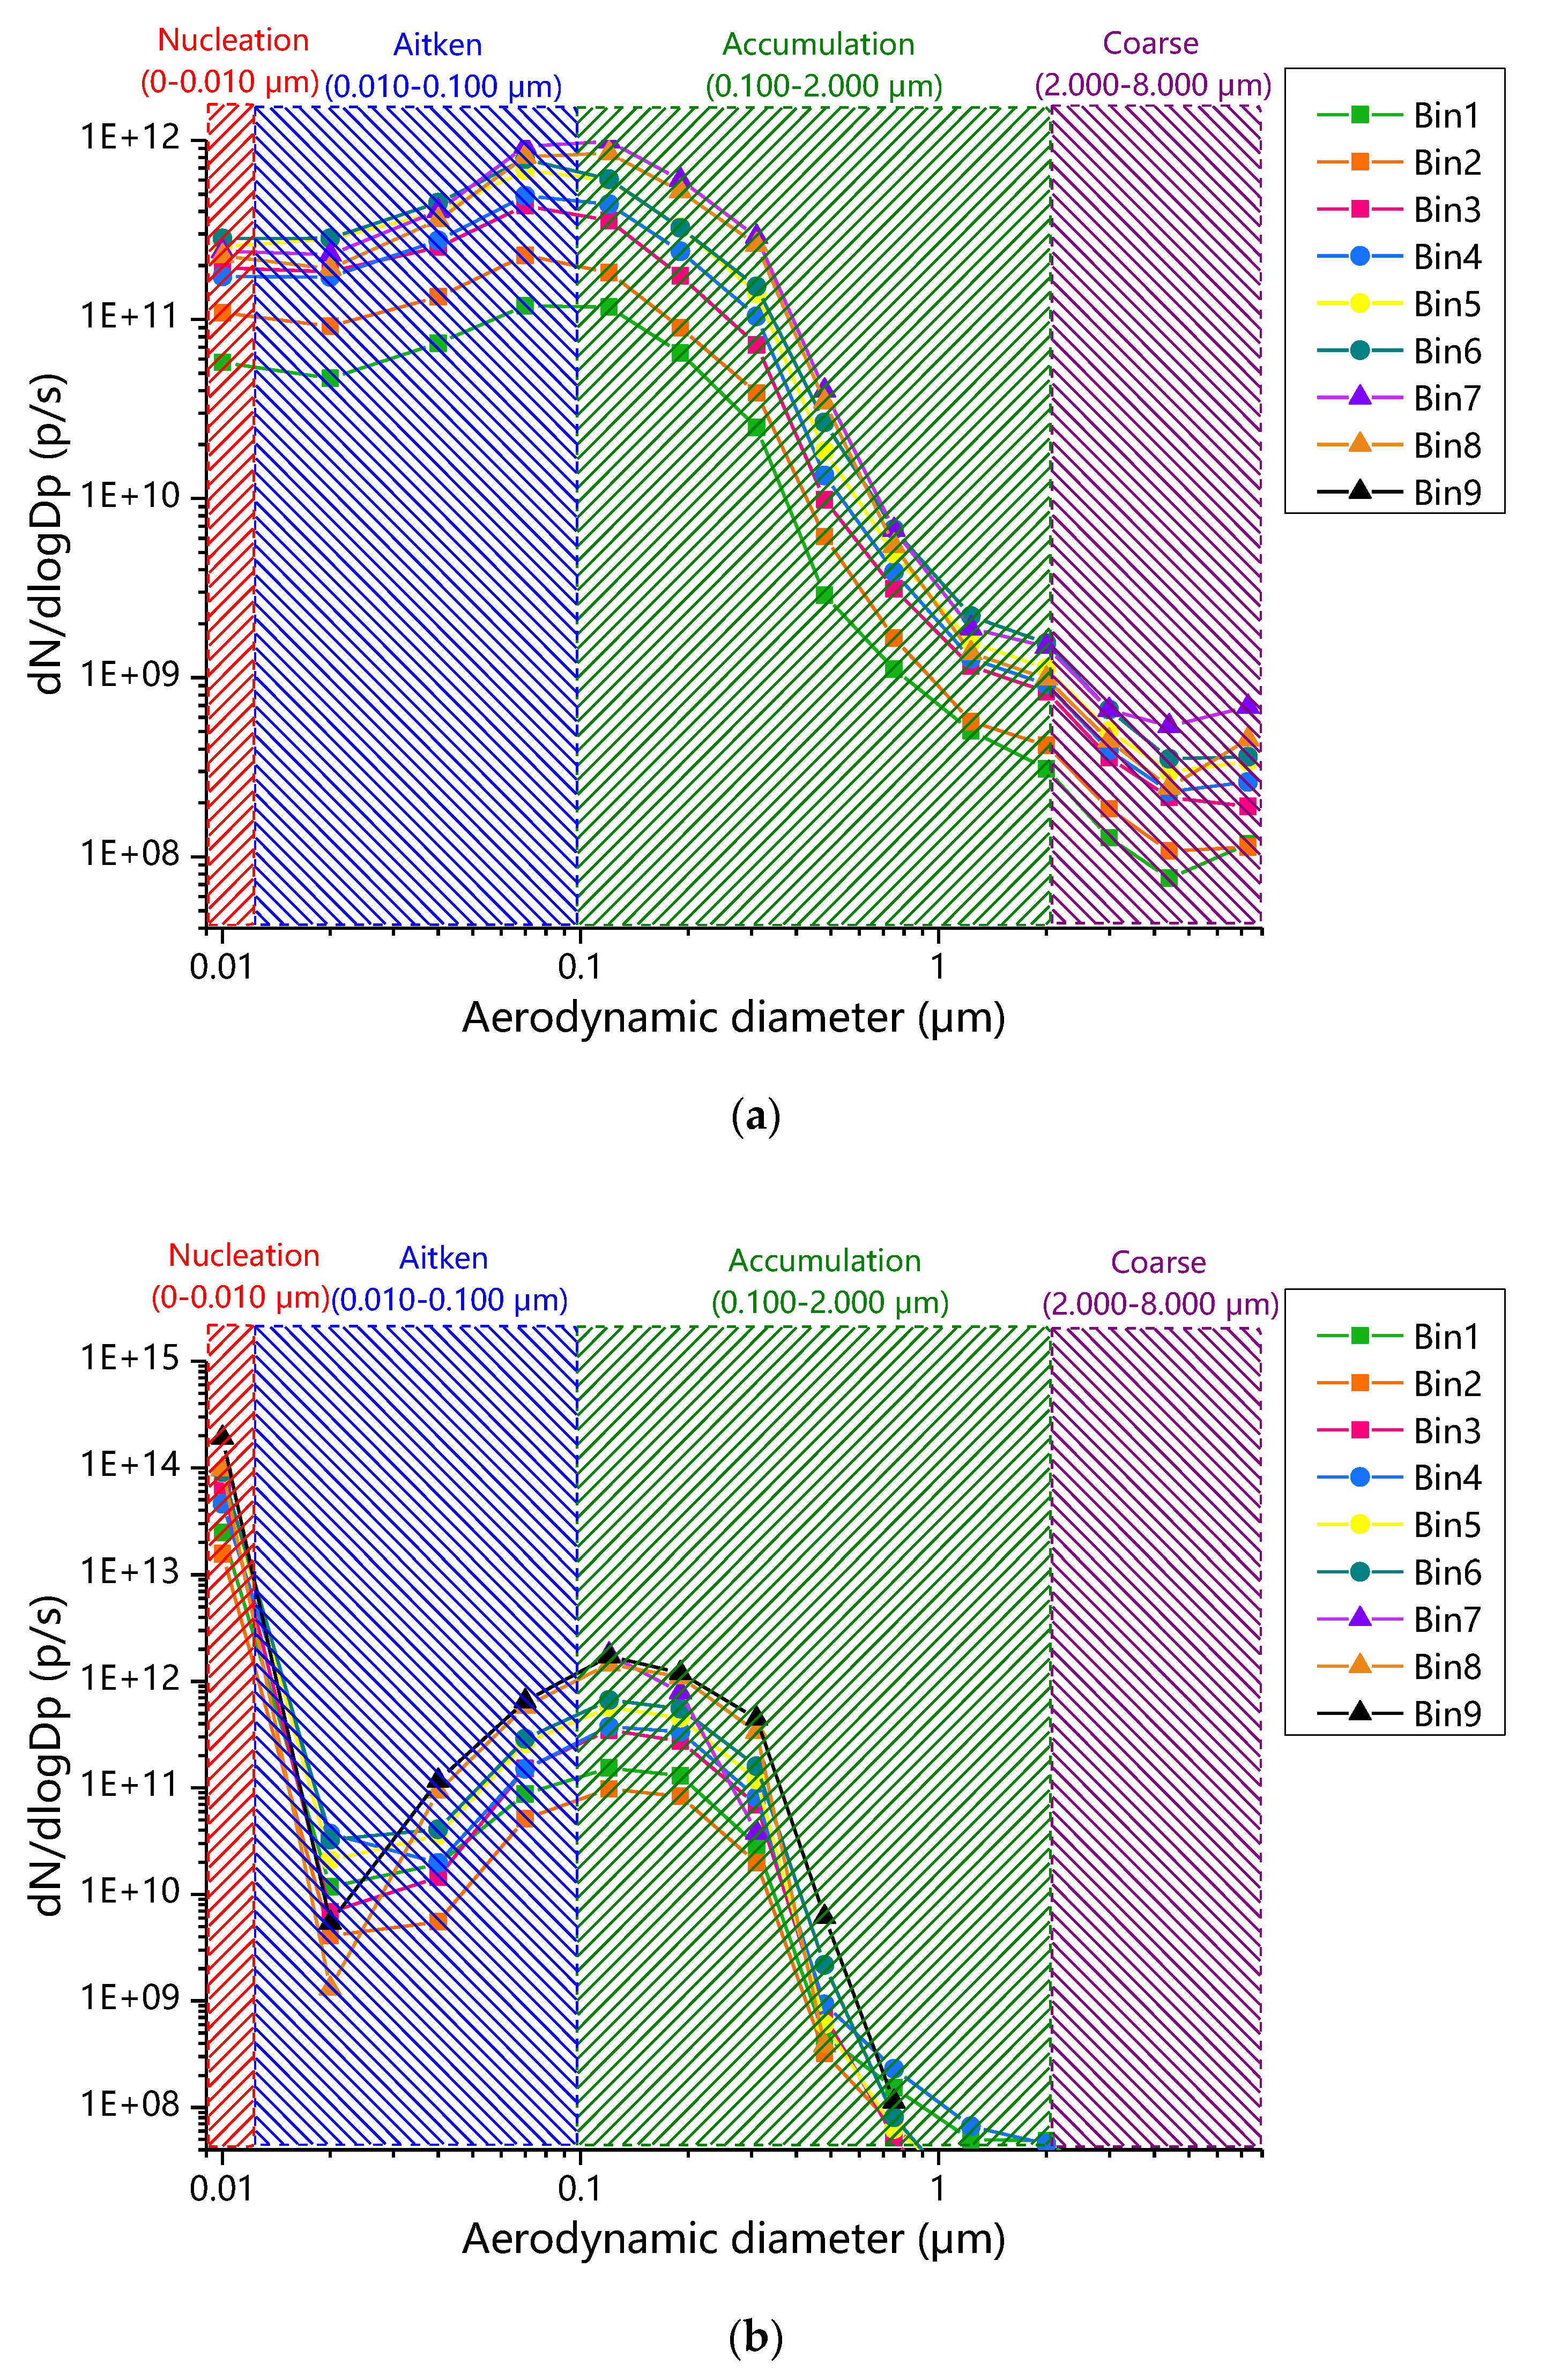
To describe the transient characteristics of PN size distribution, we compared the PN size distribution in 9 speed-VSP Bins. The 9 speed-VSP Bins displayed several typical driving conditions. They were as follow: Bin1: Speed ≤ 40 km/h, VSP ≤ −5 kW/t; Bin2: Speed ≤ 40 km/h, −5 kW/t < VSP < 5 kW/t; Bin3: Speed ≤ 40 km/h, VSP ≥ 5 kW/t; Bin4: 40 km/h < Speed ≤ 80 km/h, VSP ≤ −5 kW/t; Bin5: 40 km/h < Speed ≤ 80 km/h, −5 kW/t < VSP < 5 kW/t; Bin6: 40 km/h < Speed ≤ 80 km/h, VSP ≥ 5 kW/t; Bin7: Speed > 80 km/h, VSP ≤ −5 kW/t; Bin8: Speed > 80 km/h, −5 kW/t < VSP < 5 kW/t; Bin9: Speed > 80 km/h, VSP ≥ 5 kW/t. Figure 9 shows the PN size distribution in different speed-VSP bins.
In summary, the particles emitted from the diesel and LNG test vehicles were mainly distributed in nucleation and Aitken. The PN emission rates of the diesel and LNG test vehicles increased with speed and VSP. The PN size distribution of No.4 (diesel truck, China IV), No. 5 (diesel middle bus, China III) and No.9 (LNG bus, China IV) changed little with the change of speed-VSP bins. The nucleation and Aitken of No.6 (diesel middle bus, China IV) increased more than 10 times with the Bin7–Bin9 (speed > 80 km/h); bin1–bin6 (speed ≤ 80 km/h), and their accumulation-mode particles (stage 8–10, 0.48–1.23 μm) increased significantly in Bin7 (Speed > 80 km/h, VSP ≥ 5 kW/t). By contrast, the Aitken and accumulation of No.7 (diesel bus, China III) increased significantly with the Bin7–Bin9 (speed > 80 km/h).
Figure 9 shows that the PN emission rates of the diesel and LNG test vehicles increased with speed and VSP, but their PN size distribution are less affected by the speed-VSP bins, in general. The nucleation and Aitken of No.6 (diesel middle bus, China IV) increased significantly in Bin7–Bin9 (speed > 80 km/h). Figure 3, Figure 4 and Figure 5 shows the high-emission regions of HC, NOx, and PN are similar in the high-speed region (speed > 80 km/h). Therefore, the increasing nucleation and Aitken were likely to be derived mainly from the formed through the nucleation of organic, nitrate or sulfur compounds during the dilution and cooling processes [72,73,74,75]. In addition, their accumulation (stage 8–10, 0.48–1.23 μm) increased significantly in Bin7 (Speed > 80 km/h, VSP ≥ 5 kW/t), because of the cooling of the engine led to more incomplete combustion PN [50,57,58], during sudden deceleration [53]. The Aitken and accumulation of No.7 (diesel bus, China III) increased significantly when its speed was above 80 km/h). The reason for this result requires further study.

3.3.3. The Relationship between Speed, PN Emission Rates, and Each Particle Mode

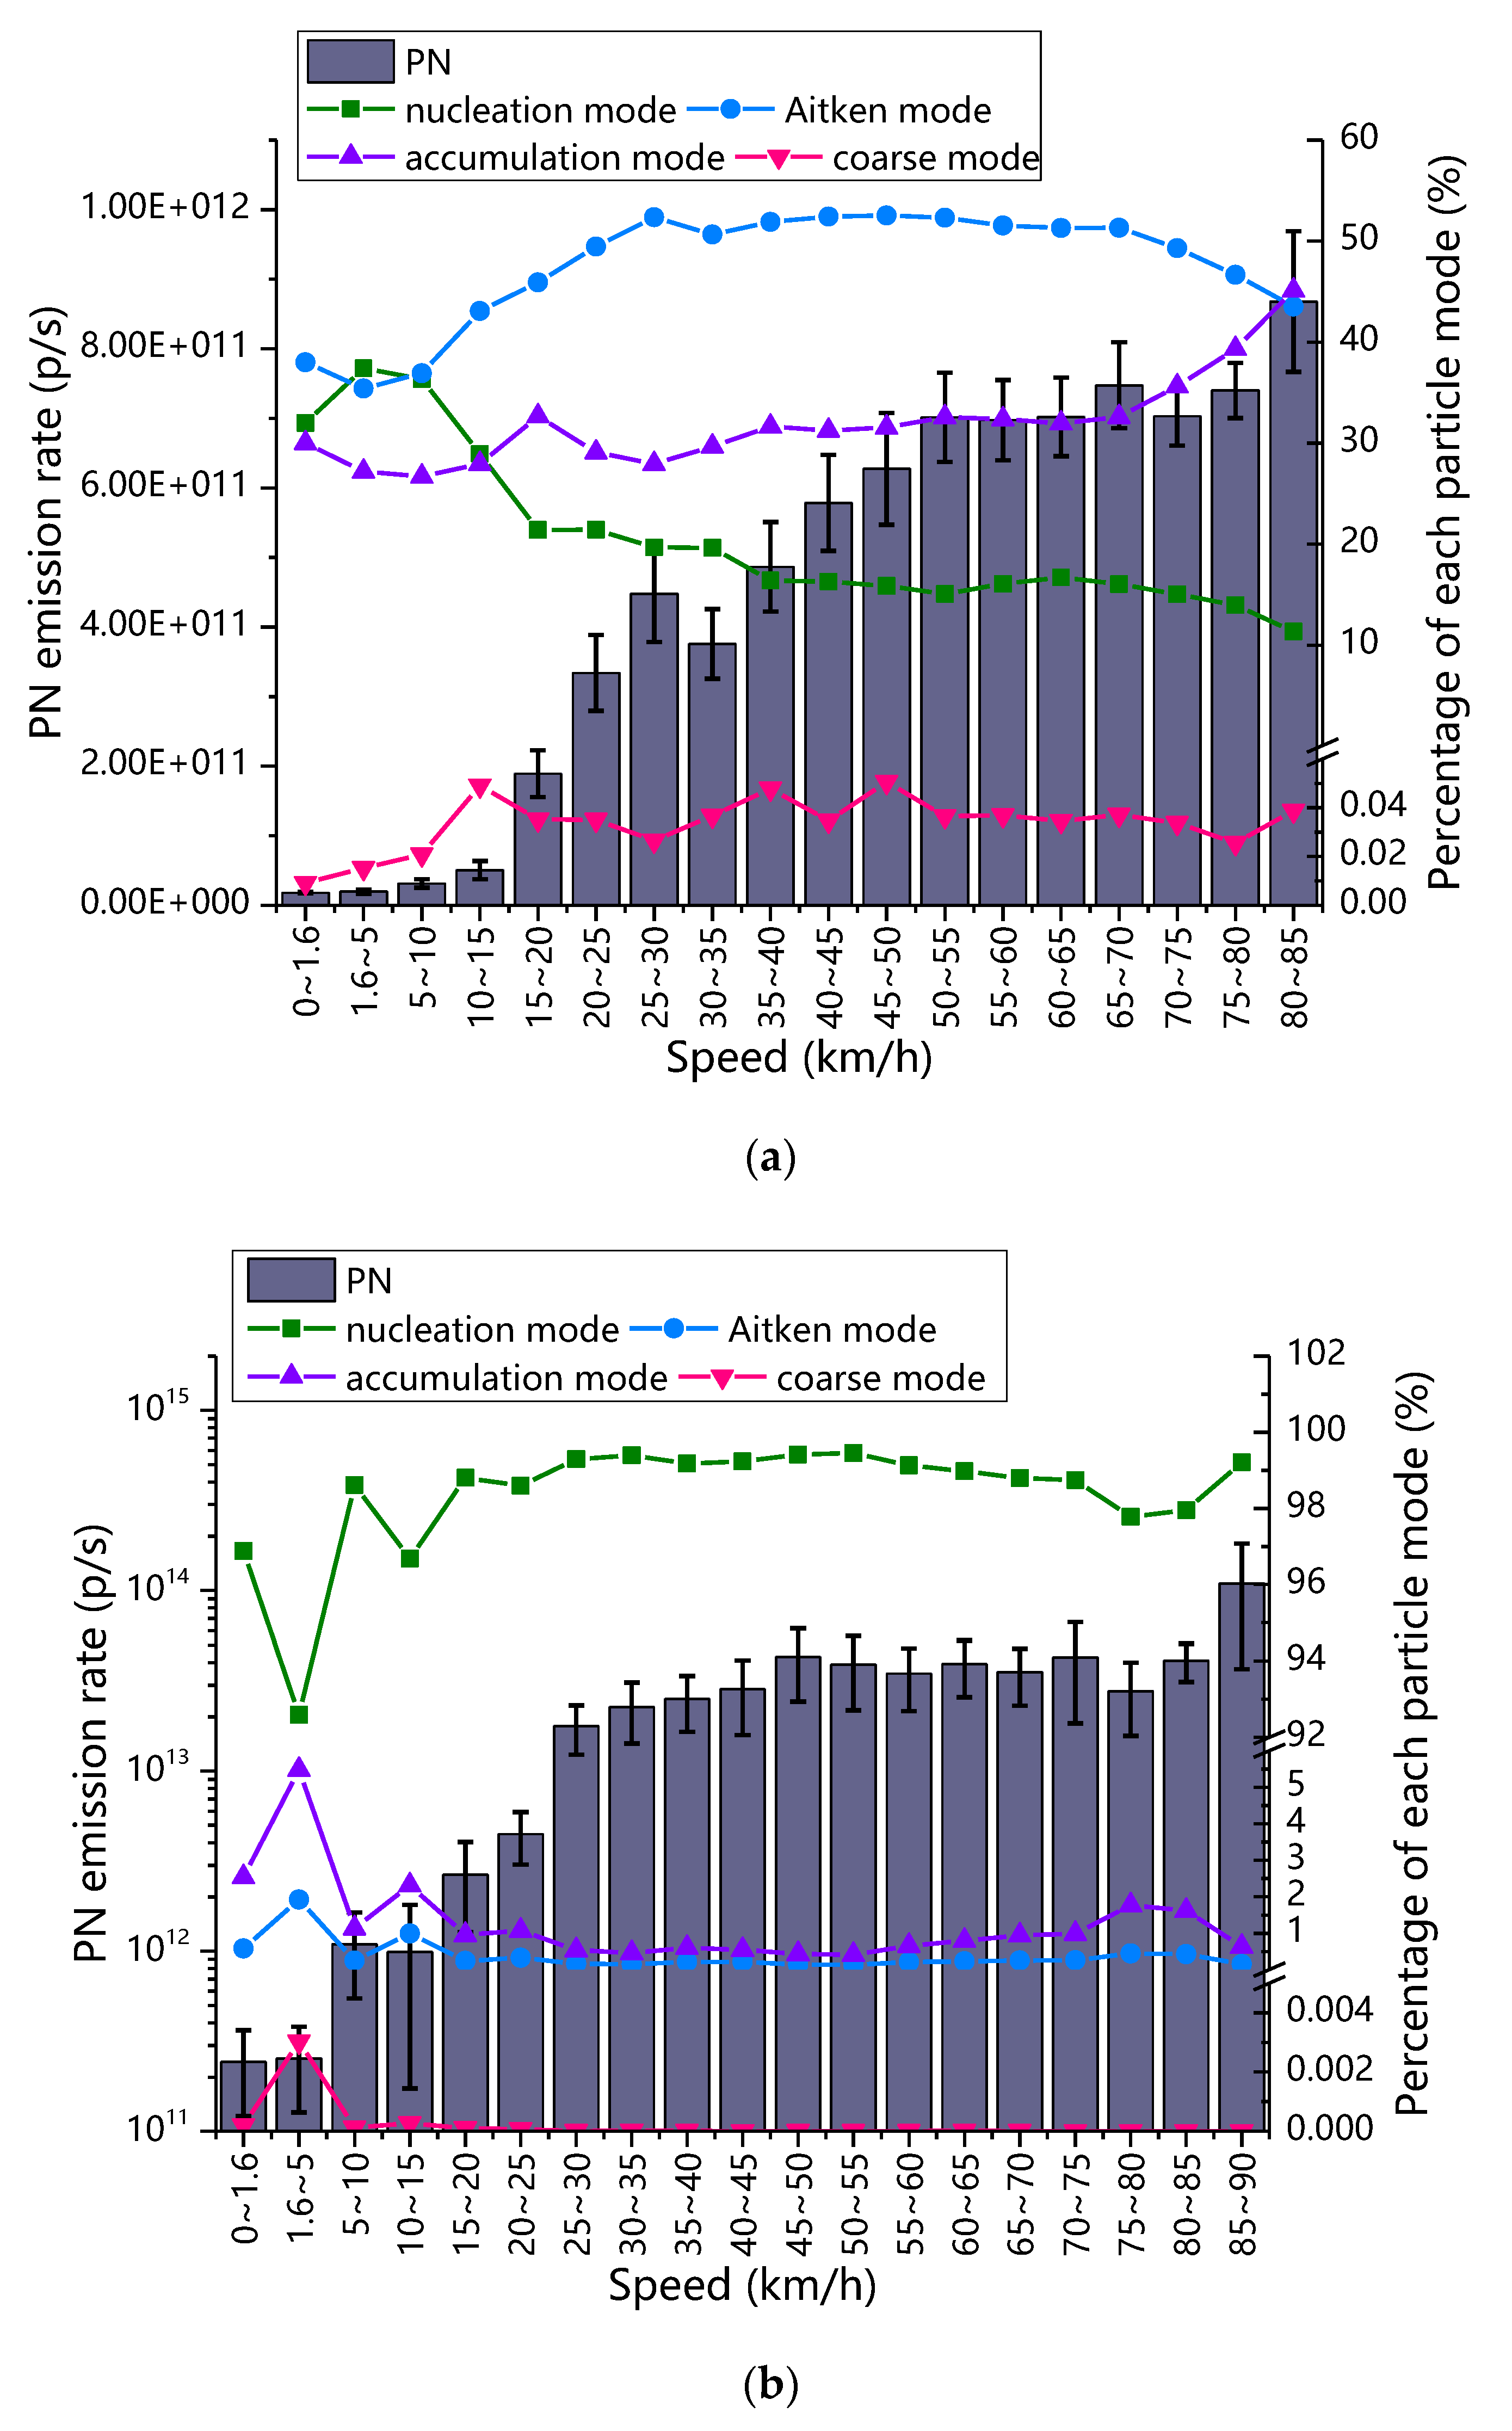
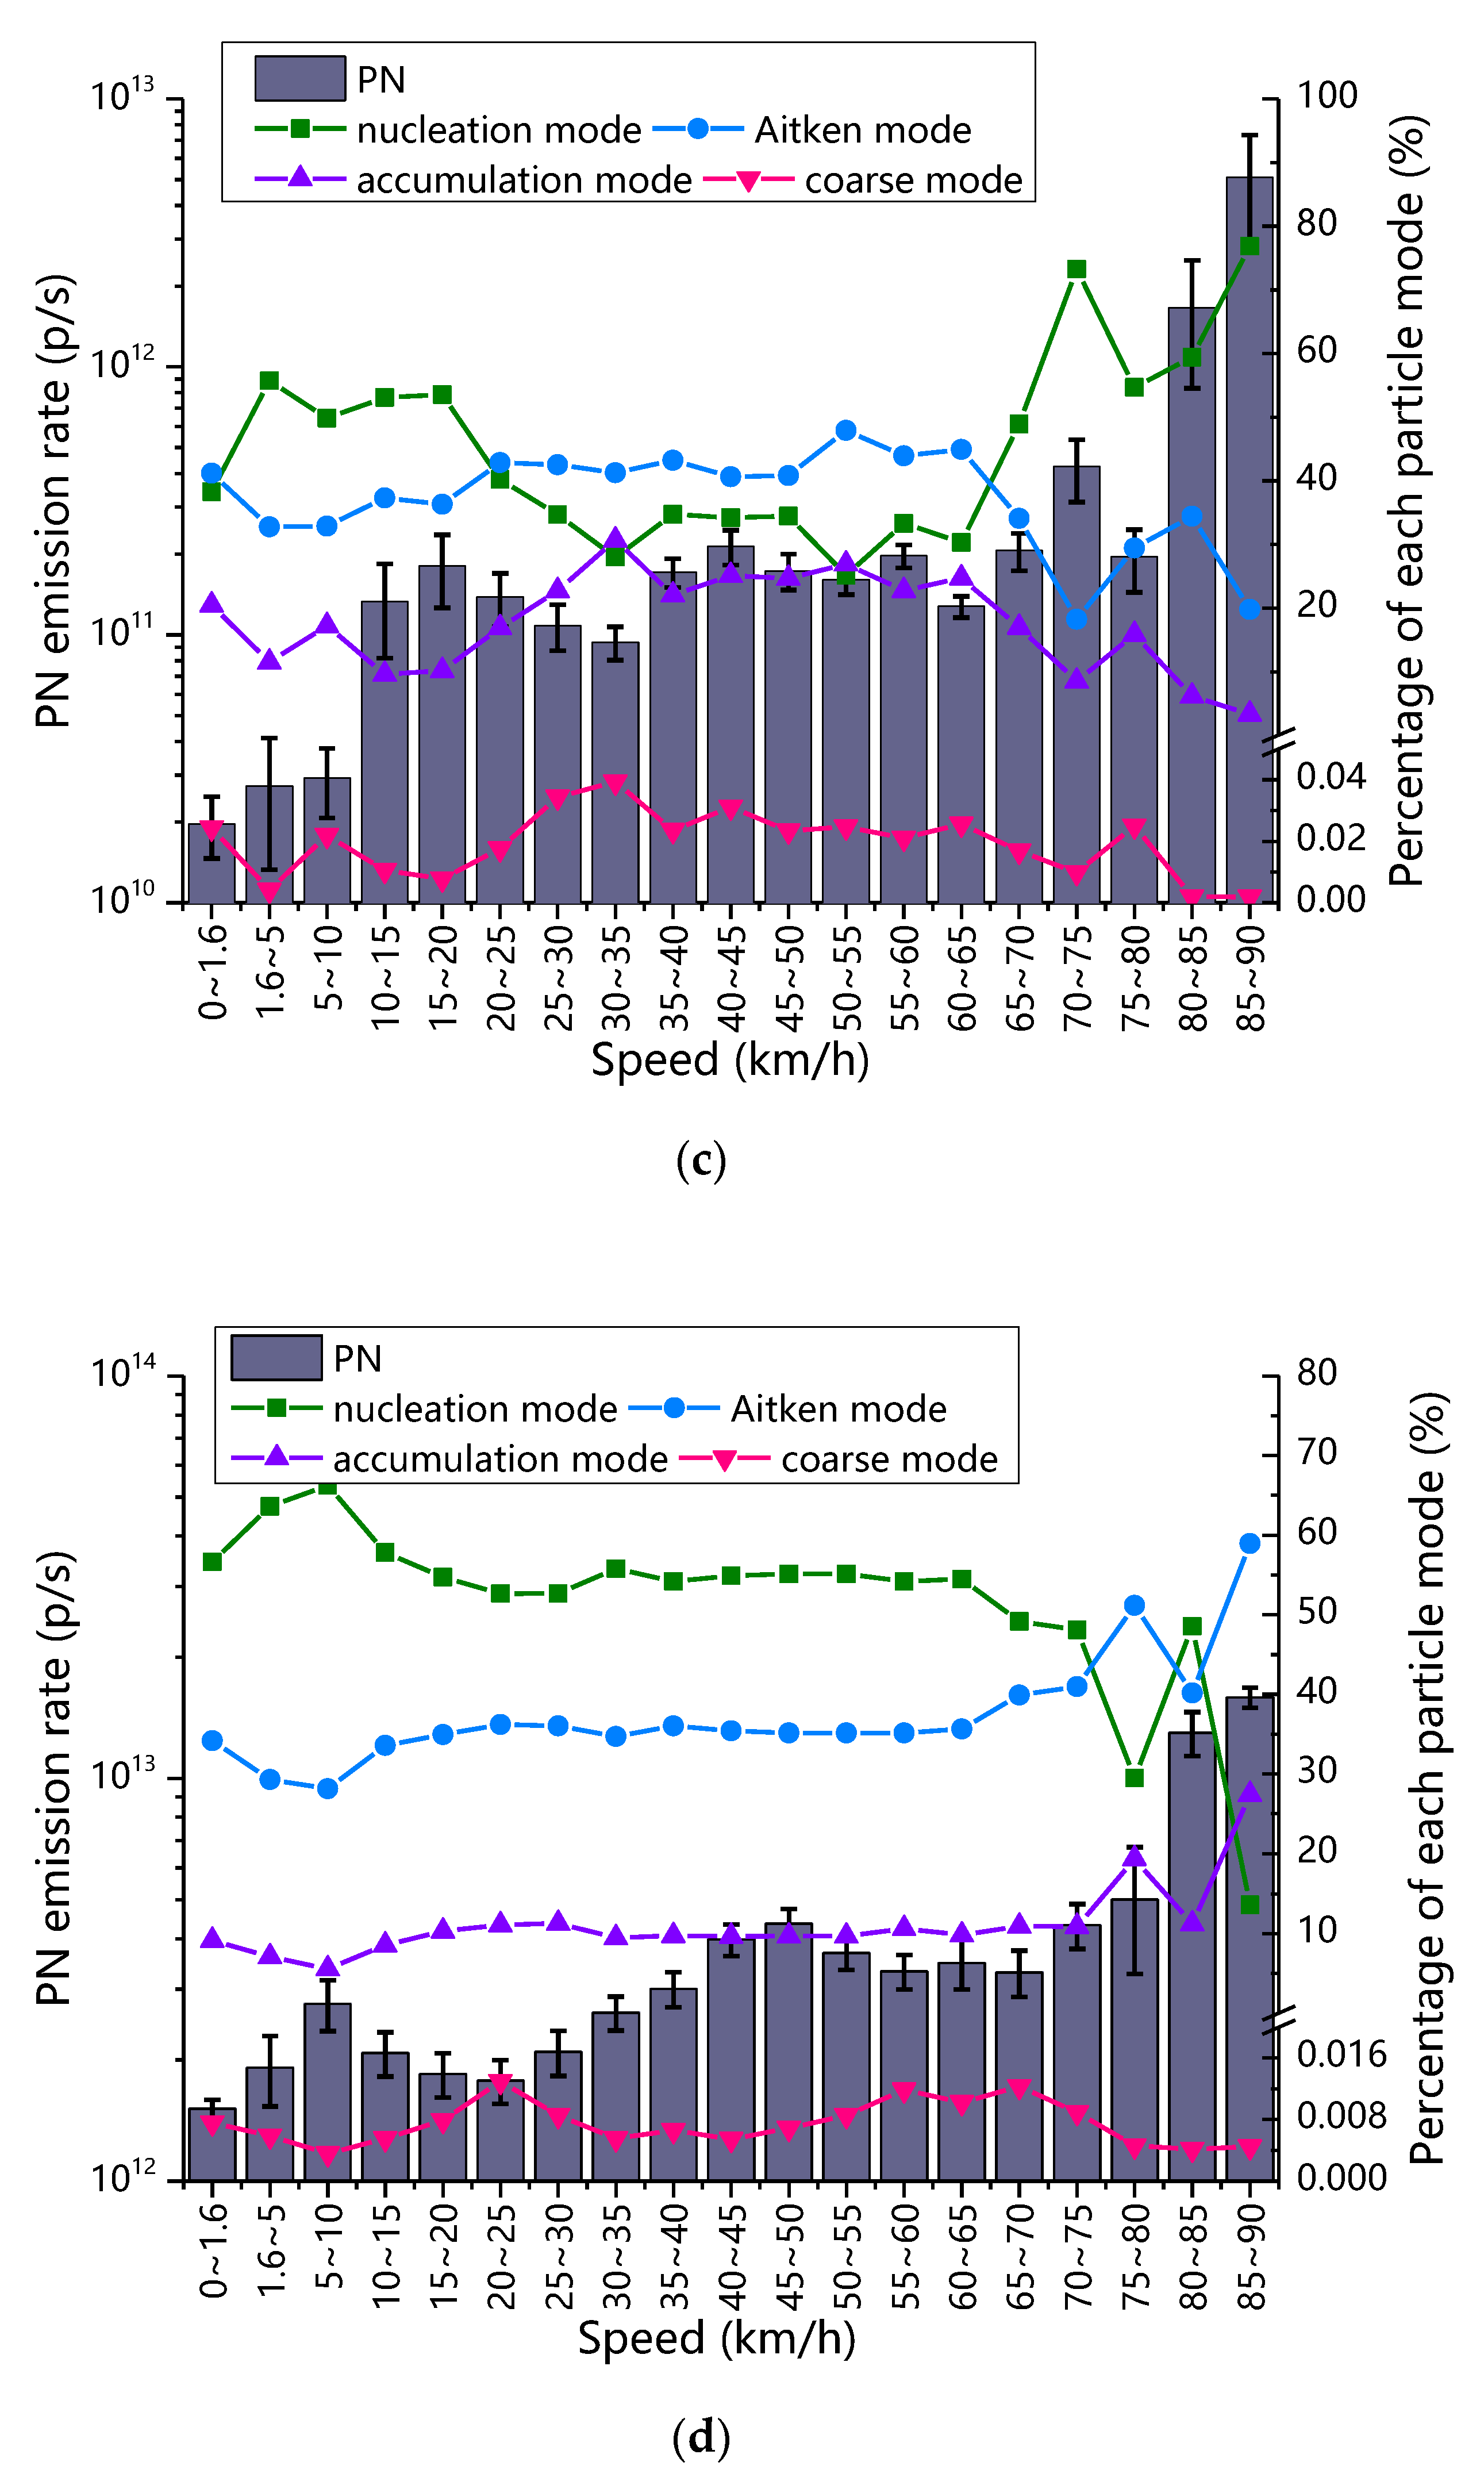
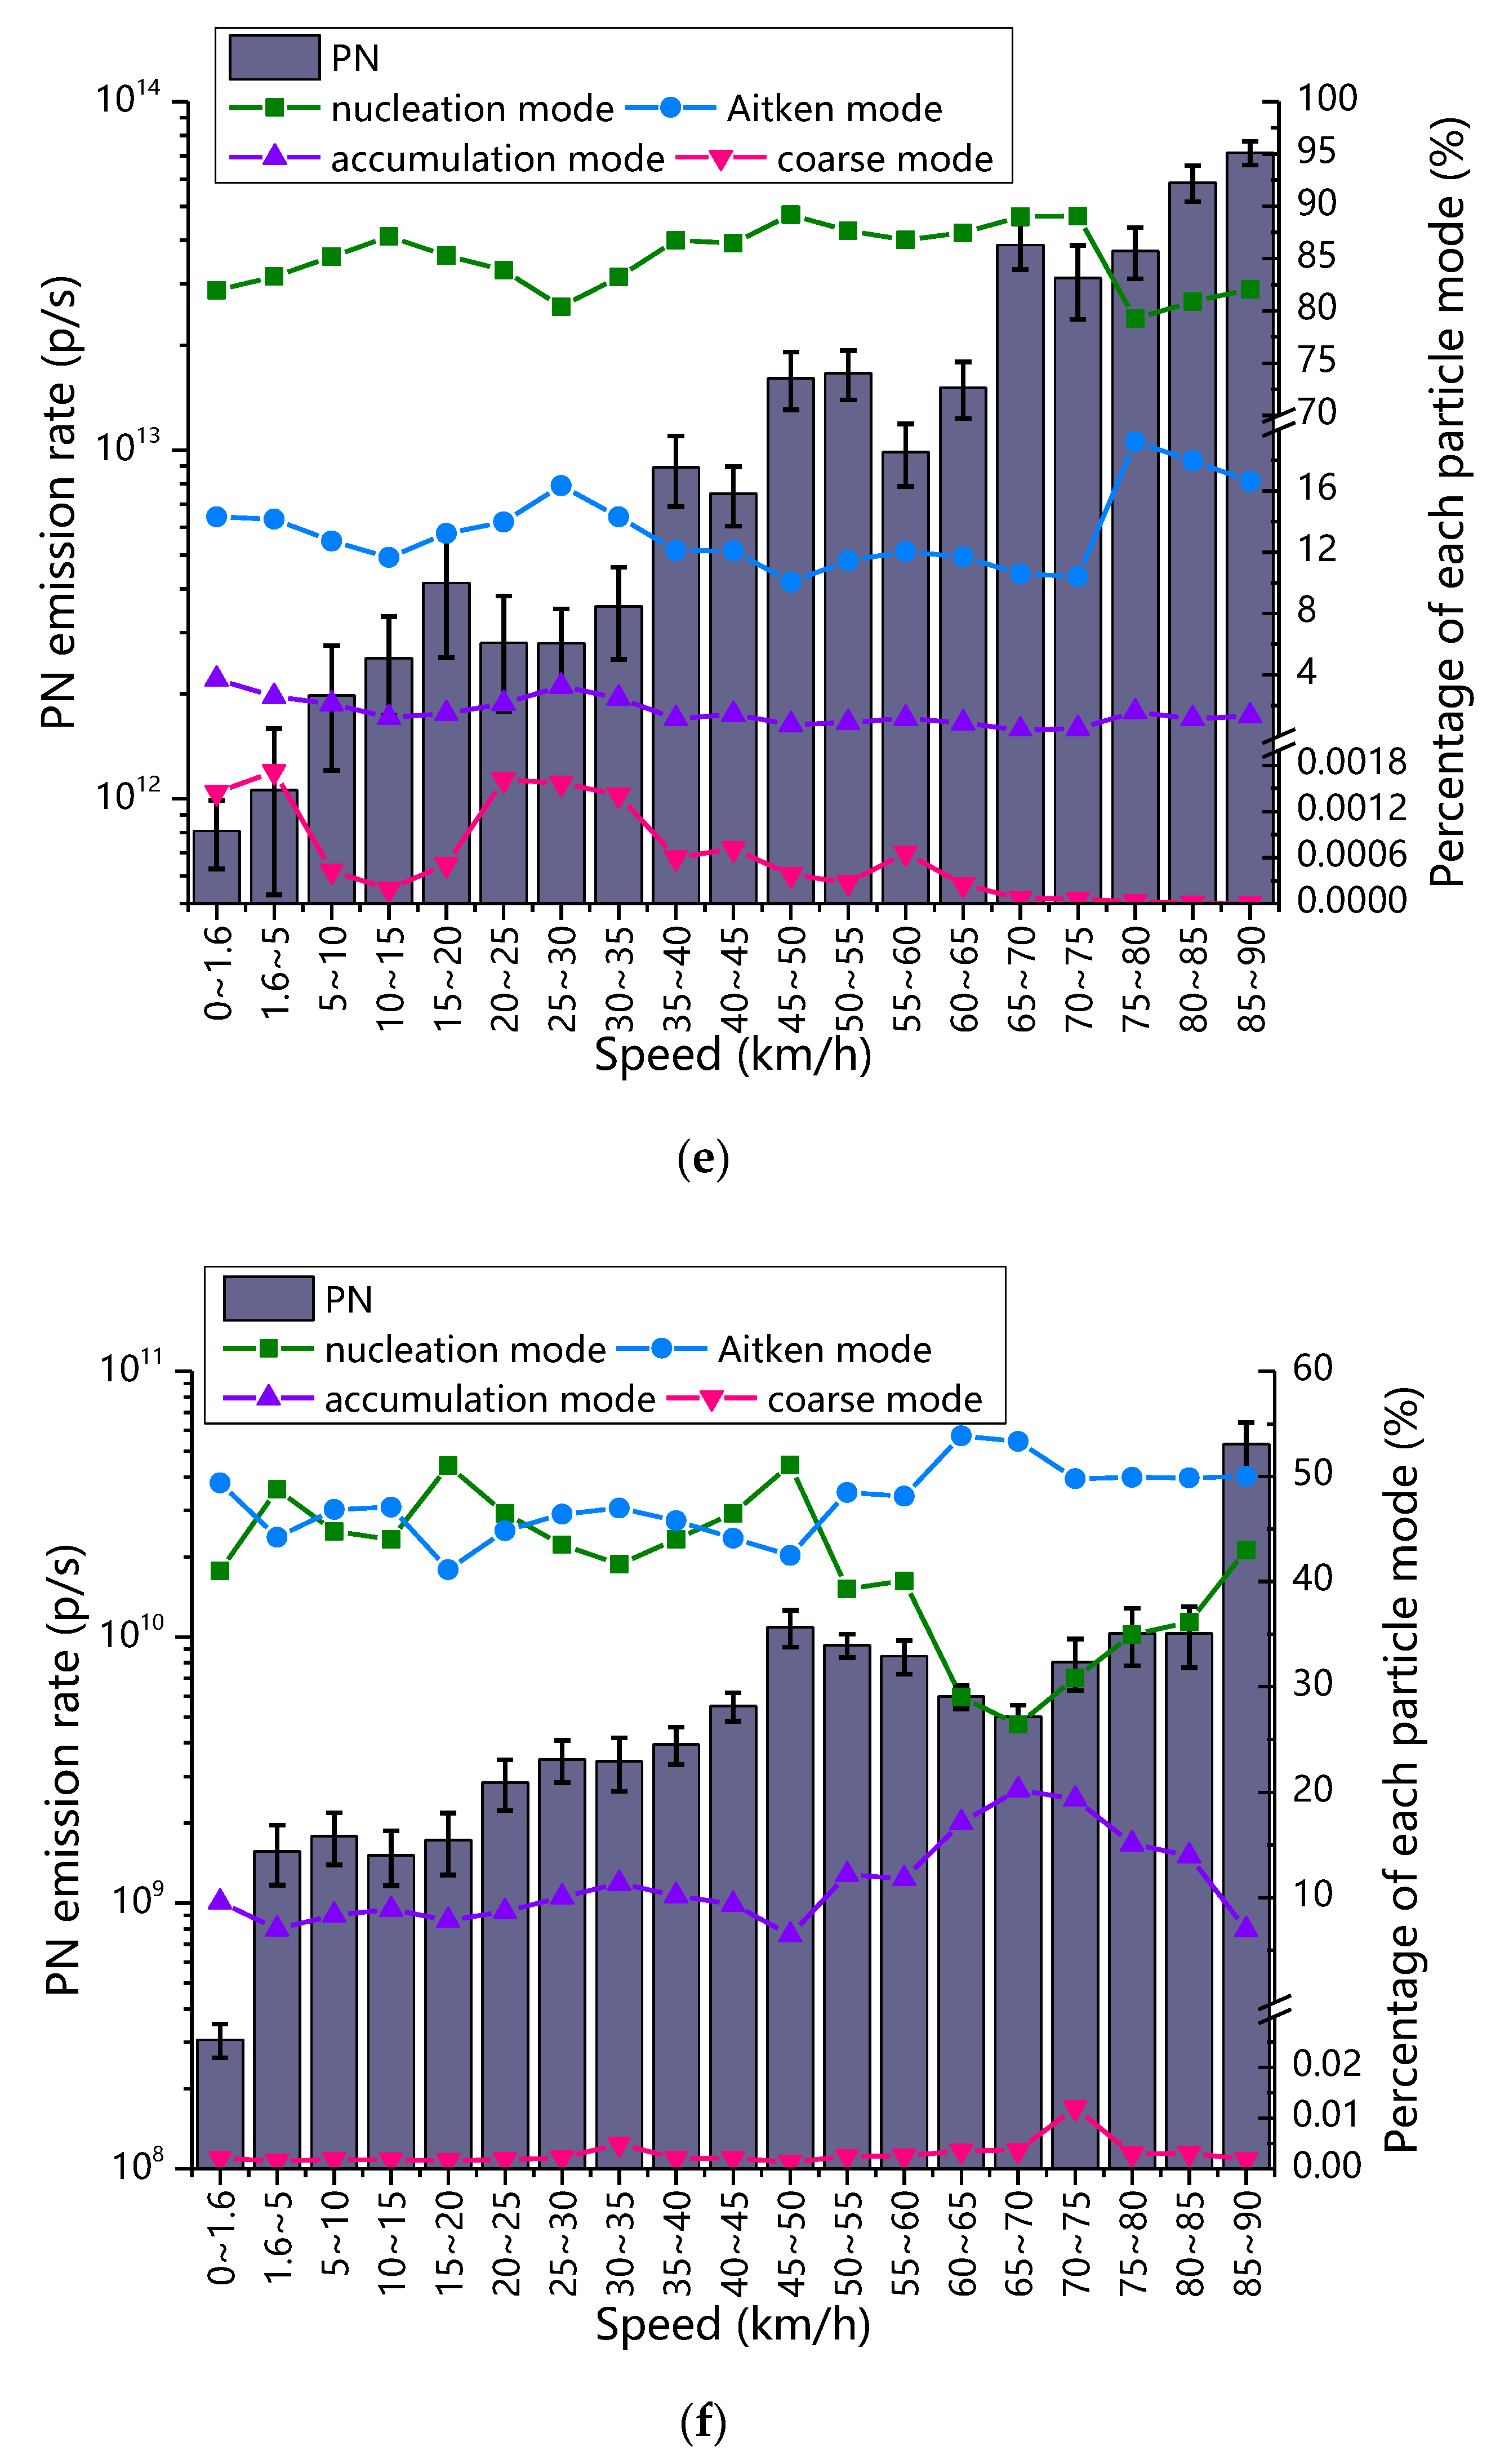
The average nucleation, Aitken, accumulation, and coarse proportions of test vehicles are shown in Figure 10. The figure illustrates that most of the particles emitted from the diesel and LNG test vehicles are observed to be concentrated on nucleation-mode particles and Aitken-mode particles, which is found to be similar to the result of Ge Yunshan et al. [30]. In most of the test vehicles, generally, the change of PN emission rates was divided into three stages, with an increase in the speed, except No. 8 (diesel bus, China IV) that had two stages. In the first stage, the PN emission rates increased rapidly in the low-speed range (0 km/h < speed < 10–50 km/h). For No. 8 (diesel bus, China IV), the first stage was found to be in the speed range of <70 km/h. In this stage, the PN emission rates could increase by 35.28–109.09% per speed interval with an increase in the speed. During this stage, the nucleation proportions increased rapidly, except for No. 4 (diesel truck, China IV) whose proportions of Aitken increased rapidly. Therefore, the elevated rate of PN emission rates decreased in the medium speed range (10–50 km/h < speed < 65–85 km/h). For No. 8 (diesel bus, China IV), the second stage was found in the speed range of 70 km/h < speed < 90 km/h. In the second stage, the PN emission rates might increase by 1.13–19.73% per speed interval and they even might decrease with an increase in the speed in some speed range. The nucleation proportions decreased whereas the Aitken and accumulation rates increased in the second stage. The PN emission rates began to increase rapidly again in the high-speed range (65–85 km/h < speed < 85–90 km/h) in the third stage. The PN emission rate increased by 11.24–213.92% per speed interval in this stage. For most of the test vehicles, nucleation proportions quickly increased again, as in the first stage, except for No. 4 (diesel truck, China IV) and No. 7 (diesel bus, China III). The accumulation of No. 4 (diesel truck, China IV), as well as the Aitken and accumulation of No. 7 (diesel bus, China III), increased in the third stage. Finally, the nucleation-mode particles of each test vehicle previously had a negative correlation with the Aitken and accumulation.
To sum up, the proportions of nucleation, Aitken, and accumulation varied significantly with different speed intervals. For most of the test vehicles, the rapid increase in PN emission rates is primarily caused by nucleation in the low-speed stage and high-speed stage (speed < 10–50 km/h or speed > 65–85 km/h). The heat release rate is observed to be very fast at low engine load, which indicates that the temperature combustion is low [65]. In contrast, more fuel is injected into the combustion chamber with an increase in the engine load, which increases the degree of incomplete combustion [76]. These factors inhibited the oxidation of particles at low- and high-speed stages, which directly affect the increase in the nucleation rate. In the medium speed stage (10–50 km/h < speed < 65–85 km/h), the increase of the PN emission rate was lower as compared to that in the low- and high-speed stages and the proportions of Aitken and accumulation increased. In the medium-speed stage under better combustion conditions, it was quite evident that the small increase in PN emission rates was due to the reduction of nucleation. For No. 7 (HDDB, China III), the increased Aitken and accumulation increased the PN emission rates in the high-speed stage. This phenomenon showed that the CIC prompted more Aitken to be produced with an increase in speed. For No. 4 (HDDT, China IV), the increased Aitken led to an increase in the PN emission rate in the low-speed stage, and the rapid increase in accumulation caused the PN emission rates to increase in the high-speed stage. This phenomenon indicated that EGR might change nucleation to Aitken in the low-speed stage, and in the meantime, the CIC produced Aitken. As the speed increased, the EGR caused more nucleation into accumulation instead of Aitken. The EGR inhibits the cracking of diesel by reducing the combustion temperature, and consequently, it reduces the emission of Aitken in the high-speed stage. For No. 8 (HDDB, China IV), more urea is expected to be injected, which results in higher nucleation emissions [39]. However, the growth rate of Aitken starts to exceed that of nucleation when the speed is more than 70 km/h.

4. Conclusions

This study was conducted to investigate the transient characterization of automotive exhaust emissions of different vehicle types on the real-world emission of Tianjin. To estimate the emissions of nine test vehicles, including heavy-duty diesel trucks, heavy-duty diesel buses, medium-duty diesel buses, light-duty gasoline cars, and a heavy-duty LNG bus, a PEMS was applied. The conclusions of this study are primarily summarized as follows:
  • The emission factors were influenced significantly by the mileage traveled, emission standard, and fuel factor of the test vehicles. The primary pollutant of the gasoline vehicles was CO, those of diesel vehicles were NOx and particulate matter, and those of the LNG bus were NOx and HC. The emission factors of gasoline vehicles whose mileage traveled were 140,000 km were 14.3–300% higher than those of gasoline vehicles whose mileage traveled was 50,000 km. The emission factors of China IV diesel vehicles were approximately 9.1–86.3% of those of China III diesel vehicles.
  • Under transient conditions on the road, the test vehicles probably peaked their CO, HC, NOx, and PN emission rates in some speed-VSP intervals. Here, the emission peak could be far more than those in the surrounding speed-VSP intervals. Selected the 100 high-emission points whose emission rates were the highest from the high-emission regions. The high-emission points of test vehicles were mainly distributed mainly in two regions: the high-speed region (speed > 70–90 km/h, VSP > 0 kW/t), the medium speed-acceleration region (20–30 km/h < speed < 60–90 km/h, 0 kW/t < VSP < 12 kW/t).
  • In high-emission points, the emission rates of vehicles rose several times. The CO, HC, NOx, and PN average emission rates in the high-emission points could be 3.15–14.93 times, 1.93–24.89 times, 3.23–6.03 times and 3.22–30.27 times of those of average emission rates. The CO average emission rate of diesel bus (China III) in the high-emission points could be 14.94 times of that of the average emission rate. The HC average emission rate of gasoline car (China IV, mileage traveled: 140,000 km) in the high-emission points could be 24.89 times of that of the average emission rate. The NOx average emission rate of diesel bus (China IV) in the high-emission points was 6.03 times of that of the average emission rate. The PN average emission rate of LNG bus (China IV) in the high-emission points was 30.27 times of that of the average emission rate.
  • Furthermore, the improvement of emission standards did not significantly reduce the emissions at high-emission points. The CO average emission rates of China III diesel vehicles in the high-emission points were 3.27–14.94 times of those of average emission rates, higher than those of China IV diesel vehicles (3.02–13.60 times). However, their HC and NOx average emission rates in the high-emission points were 1.93–2.52 times and 2.75–3.90 times of those of average emission rates, less than those of China IV diesel vehicles (2.46–4.92 times and 3.56–6.03 times). The PN average emission rates of diesel bus (China IV) in the high-emission points were 13.21 times of those of average emission rates, more than those of diesel bus (China III) (9.98 times).
  • Fuel, mileage traveled vehicle type, and emission standard significantly influenced the relationship between the average emission rates and the average emission rates of high-emission points. For example, the gasoline vehicles (China IV, mileage traveled: 140,000 km) had higher emission rates in high-emission points and the increase of average emission rates in the high-emission points was more than 4 times of that of average emission rates.
  • According to the particle size distribution, it can be observed that most of the particles emitted from the diesel and LNG test vehicles were nucleation-mode particles and Aitken-mode particles. The PN emission rates showed higher growth at low speeds. Finally, their growth decreased at medium speeds and then again increased at high speeds. During this period, the increased PN of most diesel and LNG vehicles was primarily caused by nucleation. When the speed was above 80 km/h, the nucleation-mode particles and Aitken-mode particles of diesel middle bus (China IV) increased more than 10 times, and the Aitken-mode and accumulation-mode particles of diesel bus (China III) increased significantly, too.
  • The EGR + DPF could effectively inhibit the Aitken output caused by CIC. The SCR might produce more nucleation-mode particles.
Under some urban driving conditions, the above results may explain an underestimation of vehicle emissions. The characterization of automotive exhaust emission from different vehicle types could not be extensively analyzed due to the limitations of the number and types of test vehicles that could be tested in our study. Finally, we suggest further study with more samples to obtain greater insight.

Author Contributions

Conceptualization, H.-j.M.; Investigation, C.M., X.-z.F., N.W., J.-s.Z., Z.-w.Y., Y.-j.Z., Z.-y.L., and L.Y.; Writing—original draft, C.M.; Writing—review & editing, L.W. All authors have read and agreed to the published version of the manuscript.

Funding

This work is funded by the National Natural Science Foundation of China (21607081) and the National key research and development program of China (2017YFC0212105, Ministry of Science and Technology of the People’s Republic of China).

Acknowledgments

The authors are grateful for the data and the technical support provided by Center for Urban Transport Emission Research, Nankai University.

Conflicts of Interest

No conflict of interest exists in the submission of this manuscript, and the manuscript is approved by all authors for publication. I want to declare on behalf of my co-authors that the work described was original research that has not been published previously, and not under consideration for publication elsewhere, in whole or in part. All the authors listed have approved the manuscript that is enclosed.

Appendix A

Figure A1 present the emission rates of CO, HC, NOx, and PN for each test vehicle according to the operation mode bins in Table A4. It shows that the pollutant emission rates of each test vehicles all fluctuates with the operation mode bins of VSP and there are two or three peaks in VSP bins of bin3 to bin23, bin25 to bin45 and bin47 to bin67, no matter in Urban, Suburb, or Express way Cruising. Error bars correspond to 95% confidence interval.
Figure A1. The emission rates of pollutants for each test vehicle according to the operation mode bins.
Atmosphere 11 00064 g0a1aAtmosphere 11 00064 g0a1b

Appendix B

Table A1 present the particle size classification of ELPI+TM. It includes D50% and Di for each stage of ELPI+TM, the particle size classification of nucleation mode, Aitken mode, accumulation mode, and coarse mode and the particle size classification of PM2.5 and PM10.
Table A1. The particle size classification of ELPI+TM.
Stage #D50%
(μm)
Di
(μm)
Definition by ModeDefinition by PNDefinition by PM
10.0060.010Nucleation modePN0.01PM2.5
20.0160.020Aitken modePN0.01–0.1
30.0300.040
40.0540.070
50.0940.120Accumulation modePN0.1–2
60.1500.190
70.2500.310
80.3800.480
90.6000.750
100.9401.230
111.6202.000
122.4602.990Coarse modePN2–8PM2.5–10
133.6304.400
145.3407.310
The calibration of ELPI+TM can be found in [77]; Definition by mode: refer to [34,70].
Table A2 present the fuel composition of test vehicles in this paper.
Table A2. The fuel composition of Gasoline,92#, Diesel,0# and LNG.
Fuel CompositionGasoline,92#Diesel,0#LNG
Density (20 °C, kg/m3)733.5833.00.714 (Gas)
Vapor pressure (kPa)58.6NANA
10% evaporation temperature (°C)59.5205.2NA
50% evaporation temperature (°C)100.0252.0NA
90% evaporation temperature (°C)163.5330.0NA
Figure Octane number92.6NA130
Cetane numberNA52.6<10
Sulfur (mg/kg)6.36.1NA
Olefin (V/V, %)9.1NANA
Benzene (V/V, %)0.6NANA
Methane (V/V, %)NANA>99
Aromatic hydrocarbon (V/V, %)23NANA
Fatty Acid Methyl Ester (V/V, %)NA<0.01NA
Oxygen (m/m, %)1.9NANA
Methyl alcohol (m/m, %)0.1NANA
PAHs (m/m, %)NA2.7NA
Ash (m/m, %)NA0.001NA
Undissolved substance (mg/100 mL)NA0.9NA
Table A3 present the length, proportion of each driving condition, average value (AVG) and numerical range (NV) of VSP, average value, and numerical range of speed and duration of the test vehicles.
Table A3. Driving condition parameters of the test vehicles.
NumberLength
(km)
Proportion of Urban Areas (%)
(V < 40 km/h)
Proportion of Suburbs (%)
(40 ≤ V < 80 km/h)
Proportion of Express Ways (%)
(V ≥ 80 km/h)
NV of VSP
(kW/t)
AVG and NV of Speed
(km/h)
Duration (s)
139.7219.6670.459.891.34 (−52.55 to 36.50)35.37 (0 to 112.49)4042
249.3924.5669.416.031.18 (−47.67 to 26.22)38.56 (0 to 89.64)4610
3/166.4218.7080.281.021.36 (−38.67 to 17.82)37.01 (0 to 84.33)6459
3/242.0621.8978.110.001.09 (−38.64 to 20.97)32.65 (0 to 79.82)4637
4/162.3517.8878.114.011.61 (−37.43 to 16.22)43.06 (0 to 84.81)5212
4/242.0720.0575.154.801.25 (−25.64 to 21.13)39.86 (0 to 83.85)3799
5/143.1920.3473.695.971.23 (−21.66 to 19.76)38.83 (0 to 93.66)4004
5/243.2918.1774.377.451.39 (−38.12 to 18.63)39.45 (0 to 94.15)3950
6/141.7720.9273.705.381.35 (−103.76 to 18.63)37.64 (0 to 98.01)3994
6/246.3121.3278.680.001.41 (−22.19 to 16.53)42.68 (0 to 76.12)3905
7/138.9627.6666.485.860.99 (−17.91 to 21.42)33.79 (0 to 94.90)4150
7/246.5826.4571.202.351.08 (−23.11 to 17.00)32.51 (0 to 84.45)5157
8/139.7423.0470.336.631.50 (−26.79 to 18.55)38.95 (0 to 89.40)3672
8/227.8329.1053.3517.551.19 (−25.36 to 20.19)33.04 (0 to 96.00)3031
9/138.8324.5466.039.430.69 (−18.15 to 15.81)19.75 (0 to 97.30)7079
9/245.5018.6270.0911.291.59 (−22.81 to 16.15)42.40 (0 to 86.99)3862
V: Speed of vehicle during the test; AVG: average value; NV: numerical range; No. X/Y: X is the test number of vehicles in Table 1 and Y represents the number of test routes.
Table A4 present the interval division of 68 operation mode bins depending on the acceleration, speed, and VSP of the test vehicles.
Table A4. The interval division of 68 operation mode bins depending on the acceleration, speed, and VSP of the test vehicles.
DecelerationBin0 (Acceleration < −1 m/s2)
IdlingBin1 (0 ≤ Speed < 1.6 km/h, Acceleration = 0 m/s2)
VSP (kW/t)Urban Cruising
(0 ≤ Speed < 40 km/h, Acceleration ≠ 0 m/s2)
Suburb Cruising
(40 ≤ Speed < 80 km/h)
Expressway Cruising
(Speed ≥ 80 km/h)
(−∞,−18)bin2bin24bin46
[−18,−16)bin3bin25bin47
[−16,−14)bin4bin26bin48
[−14,−12)bin5bin27bin49
[−12,−10)bin6bin28bin50
[−10,−8)bin7bin29bin51
[−8,−6)bin8bin30bin52
[−6,−4)bin9bin31bin53
[−4,−2)bin10bin32bin54
[−2,0)bin11bin33bin55
[0,2)bin12bin34bin56
[2,4)bin13bin35bin57
[4,6)bin14bin36bin58
[6,8)bin15bin37bin59
[8,10)bin16bin38bin60
[10,12)bin17bin39bin61
[12,14)bin18bin40bin62
[14,16)bin19bin41bin63
[16,18)bin20bin42bin64
[18,20)bin21bin43bin65
[20,22)bin22bin44bin66
[22,+∞)bin23bin45bin67

References

  1. Varella, R.A.; Giechaskiel, B.; Sousa, L.; Duarte, G. Comparison of Portable Emissions Measurement Systems (PEMS) with Laboratory Grade Equipment. Appl. Sci. 2018, 8, 1633. [Google Scholar] [CrossRef] [Green Version]
  2. Zhang, W.; Lu, J.; Xu, P.; Zhang, Y. Moving towards Sustainability: Road Grades and On-Road Emissions of Heavy-Duty Vehicles—A Case Study. Sustainability 2015, 7, 12644–12671. [Google Scholar] [CrossRef] [Green Version]
  3. Liu, Y.; Martinet, S.; Louis, C.; Pasquier, A.; Tassel, P.; Perret, P. Emission Characterization of In-Use Diesel and Gasoline Euro 4 to Euro 6 Passenger Cars Tested on Chassis Dynamometer Bench and Emission Model Assessment. Aerosol Air Qual. Res. 2017, 17, 2289–2299. [Google Scholar] [CrossRef] [Green Version]
  4. Nghiem, T.-D.; Nguyen, Y.-L.T.; Le, A.-T.; Bui, N.-D.; Pham, H.-T. Development of the specific emission factors for buses in Hanoi, Vietnam. Environ. Sci. Pollut. Res. 2019, 26, 24176–24189. [Google Scholar] [CrossRef] [PubMed]
  5. Wu, Y.; Zhang, S.; Hao, J.; Liu, H.; Wu, X.; Hu, J.; Walsh, M.P.; Wallington, T.J.; Zhang, K.M.; Stevanovic, S. On-road vehicle emissions and their control in China: A review and outlook. Sci. Total Environ. 2017, 574, 332–349. [Google Scholar] [CrossRef]
  6. Mishra, S.; Kushwaha, A.; Aggrawal, D.; Gupta, A. Comparative emission study by real-time congestion monitoring for stable pollution policy on temporal and meso-spatial regions in Delhi. J. Clean. Prod. 2019, 224, 465–478. [Google Scholar] [CrossRef]
  7. Cen, X.; Hong, K.L.; Li, L. A framework for estimating traffic emissions: The development of Passenger Car Emission Unit. Transp. Res. Part D 2016, 44, 78–92. [Google Scholar] [CrossRef]
  8. Cui, H.; Chen, W.; Dai, W.; Liu, H.; Wang, X.; He, K. Source apportionment of PM2.5 in Guangzhou combining observation data analysis and chemical transport model simulation. Atmos. Environ. 2015, 116, 262–271. [Google Scholar] [CrossRef]
  9. Wang, Y.; Li, L.; Chen, C.; Huang, H.; Feng, J.; Wang, S.; Wang, H.; Zhang, G.; Zhou, M.; Cheng, P. Source apportionment of fine particulate matter during autumn haze episodes in Shanghai, China. J. Geophys. Res.: Atmos. 2014, 119, 1903–1914. [Google Scholar] [CrossRef]
  10. Yang, F.; Tan, J.; Zhao, Q.; Du, Z.; He, K.; Ma, Y.; Duan, F.; Chen, G.; Zhao, Q. Characteristics of PM2.5 speciation in representative megacities and across China. Atmos. Chem. Phys. 2011, 11, 1025–1051. [Google Scholar] [CrossRef]
  11. Gu, X.; Yin, S.; Lu, X.; Zhang, H.; Wang, L.; Bai, L.; Wang, C.; Zhang, R.; Yuan, M. Recent development of a refined multiple air pollutant emission inventory of vehicles in the Central Plains of China. J. Environ. Sci. (Beijing, China) 2019, 84, 80–96. [Google Scholar] [CrossRef] [PubMed]
  12. Ji, D.; Cui, Y.; Li, L.; He, J.; Wang, L.; Zhang, H.; Wang, W.; Zhou, L.; Maenhaut, W.; Wen, T. Characterization and source identification of fine particulate matter in urban Beijing during the 2015 Spring Festival. Sci. Total Environ. 2018, 628–629, 430–440. [Google Scholar] [CrossRef] [PubMed]
  13. Geng, N.; Wang, Y.; Zhang, W.; Chen, C.; Zhang, R. PM2.5 in an industrial district of Zhengzhou, China: Chemical composition and source apportionment. Particuology 2013, 11, 99–109. [Google Scholar] [CrossRef]
  14. Cheng, Y.; Lee, S.; Gu, Z.; Ho, K.; Zhang, Y.; Huang, Y.; Chow, J.C. PM2.5 and PM10-2.5 chemical composition and source apportionment near a Hong Kong roadway. Particuology 2015, 18, 1–9. [Google Scholar] [CrossRef]
  15. Wang, P.; Cao, J.J.; Shen, Z.X.; Han, Y.M.; Lee, S.C.; Huang, Y.; Zhu, C.S.; Wang, Q.Y.; Xu, H.M.; Huang, R.J. Spatial and seasonal variations of PM2.5 mass and species during 2010 in Xi’an, China. Sci. Total Environ. 2015, 508, 477–487. [Google Scholar] [CrossRef]
  16. Wu, X.; Zhang, S.; Wu, Y.; Li, Z.; Zhou, Y.; Fu, L.; Hao, J. Real-world emissions and fuel consumption of diesel buses and trucks in Macao: From on-road measurement to policy implications. Atmos. Environ. 2015, 120, 393–403. [Google Scholar] [CrossRef]
  17. Khan, T.; Frey, H.C. Comparison of real-world and certification emission rates for light duty gasoline vehicles. Sci. Total Environ. 2018, 622–623, 790–800. [Google Scholar] [CrossRef]
  18. Mahesh, S.; Ramadurai, G.; Nagendra, S.M.S. Real-world emissions of gaseous pollutants from diesel passenger cars using portable emission measurement systems. Sustain. Cities Soc. 2018, 41, 104–113. [Google Scholar] [CrossRef]
  19. Sileghem, L.; Bosteels, D.; May, J.; Favre, C.; Verhelst, S. Analysis of vehicle emission measurements on the new WLTC, the NEDC and the CADC. Transp. Res. Part D 2014, 32, 70–85. [Google Scholar] [CrossRef] [Green Version]
  20. Degraeuwe, B.; Weiss, M. Does the New European Driving Cycle (NEDC) really fail to capture the NOx emissions of diesel cars in Europe? Environ. Pollut. (Oxford, U.K.) 2017, 222, 234–241. [Google Scholar] [CrossRef]
  21. Fontaras, G.; Franco, V.; Dilara, P.; Martini, G.; Manfredi, U. Development and review of Euro 5 passenger car emission factors based on experimental results over various driving cycles. Sci. Total Environ. 2014, 468–469, 1034–1042. [Google Scholar] [CrossRef] [PubMed]
  22. Fu, M.; Ge, Y.; Wang, X.; Tan, J.; Yu, L.; Liang, B. NOx emissions from Euro IV busses with SCR systems associated with urban, suburban and freeway driving patterns. Sci. Total Environ. 2013, 452–453, 222–226. [Google Scholar] [CrossRef] [PubMed]
  23. Pathak, S.K.; Sood, V.; Singh, Y.; Channiwala, S.A. Real world vehicle emissions: Their correlation with driving parameters. Transp. Res. Part D 2016, 44, 157–176. [Google Scholar] [CrossRef]
  24. Luján, J.M.; Bermúdez, V.; Dolz, V.; Monsalve-Serrano, J. An assessment of the real-world driving gaseous emissions from a Euro 6 light-duty diesel vehicle using a portable emissions measurement system (PEMS). Atmos. Environ. 2018, 174, 112–121. [Google Scholar] [CrossRef]
  25. Arun, N.H.; Mahesh, S.; Ramadurai, G.; Nagendra, S.M.S. Development of driving cycles for passenger cars and motorcycles in Chennai, India. Sustain. Cities Soc. 2017, 32, 508–512. [Google Scholar] [CrossRef]
  26. Yao, Z.; Cao, X.; Shen, X.; Zhang, Y.; Wang, X.; He, K. On-road emission characteristics of CNG-fueled bi-fuel taxis. Atmos. Environ. 2014, 94, 198–204. [Google Scholar] [CrossRef]
  27. Cicero-Fernândez, P.; Long, J.R.; Winer, A.M. Effects of grades and other loads on on-road emissions of hydrocarbons and carbon monoxide. J. Air Waste Manag. Assoc. 1997, 47, 898–904. [Google Scholar] [CrossRef] [Green Version]
  28. Wyatt, D.W.; Li, H.; Tate, J.E. The impact of road grade on carbon dioxide (CO2) emission of a passenger vehicle in real-world driving. Transp. Res. Part D 2014, 32, 160–170. [Google Scholar] [CrossRef] [Green Version]
  29. Cha, J.; Lee, J.; Chon, M.S. Evaluation of real driving emissions for Euro 6 light-duty diesel vehicles equipped with LNT and SCR on domestic sales in Korea. Atmos. Environ. 2018, 196, 133–142. [Google Scholar] [CrossRef]
  30. Liu, Z.; Ge, Y.; Johnson, K.C.; Shah, A.N.; Tan, J.; Wang, C.; Yu, L. Real-world operation conditions and on-road emissions of Beijing diesel buses measured by using portable emission measurement system and electric low-pressure impactor. Sci. Total Environ. 2011, 409, 1476–1480. [Google Scholar] [CrossRef]
  31. Cheng, H.; Lou, D.; Hu, Z.; Qian, F.; Chen, Y.; Chen, C.; Tan, P.; Di, Y. A PEMS study of the emissions of gaseous pollutants and ultrafine particles from gasoline- and diesel-fueled vehicles. Atmos. Environ. 2013, 77, 703–710. [Google Scholar] [CrossRef]
  32. National Standard of the People’s Republic of China. Limits and Measurement Methods for Emissions from Diesel Fuelled Heavy-Duty Vehicles (CHINA VI); Ministry of Ecology and Environment of the People’s Republic of China: Beijing, China; State Administration for Market Supervision and Administration of the People’s Republic of China: Beijing, China, 2018; Volume GB 17691-2018. [Google Scholar]
  33. Frey, H.C.; Zhang, K.; Rouphail, N.M. Vehicle-Specific Emissions Modeling Based upon on-Road Measurements. Environ. Sci. Technol. 2010, 44, 3594–3600. [Google Scholar] [CrossRef]
  34. Liu, J.; Ge, Y.; Wang, X.; Hao, L.; Tan, J.; Peng, Z.; Zhang, C.; Gong, H.; Huang, Y. On-board measurement of particle numbers and their size distribution from a light-duty diesel vehicle: Influences of VSP and altitude. J. Environ. Sci. (Beijing, China) 2017, 57, 238–248. [Google Scholar] [CrossRef]
  35. Sandhu, G.; Frey, H. Effects of Errors on Vehicle Emission Rates from Portable Emissions Measurement Systems. Transp. Res. Rec. 2013, 2340, 10–19. [Google Scholar] [CrossRef]
  36. Zhang, S.; Wu, Y.; Hu, J.; Huang, R.; Zhou, Y.; Bao, X.; Fu, L.; Hao, J. Can Euro V heavy-duty diesel engines, diesel hybrid and alternative fuel technologies mitigate NOx emissions? New evidence from on-road tests of buses in China. Appl. Energy 2014, 132, 118–126. [Google Scholar] [CrossRef]
  37. Beydoun, M.; Guldmann, J.M. Vehicle characteristics and emissions: Logit and regression analyses of I/M data from Massachusetts, Maryland, and Illinois. Transp. Res. Part D 2006, 11, 59–76. [Google Scholar] [CrossRef]
  38. Chiang, H.L.; Tsai, J.H.; Yao, Y.C.; Ho, W.Y. Deterioration of gasoline vehicle emissions and effectiveness of tune-up for high-polluted vehicles. Transp. Res. Part D 2008, 13, 47–53. [Google Scholar] [CrossRef]
  39. Amanatidis, S.; Ntziachristos, L.; Giechaskiel, B.; Bergmann, A.; Samaras, Z. Impact of selective catalytic reduction on exhaust particle formation over excess ammonia events. Environ. Sci. Technol. 2014, 48, 11527–11534. [Google Scholar] [CrossRef]
  40. Wen, Y.; Wang, H.; Larson, T.; Kelp, M.; Zhang, S.; Wu, Y.; Marshallb, J.D. On-highway vehicle emission factors, and spatial patterns, based on mobile monitoring and absolute principal component score. Sci. Total Environ. 2019, 676, 242–251. [Google Scholar] [CrossRef]
  41. Zhang, C.H.; Song, J.T. Experimental study of co-combustion ratio on fuel consumption and emissions of NG–diesel dual-fuel heavy-duty engine equipped with a common rail injection system. J. Energy Inst. 2016, 89, 578–585. [Google Scholar] [CrossRef]
  42. Meng, X.; Tian, H.; Zhou, Y.; Tian, J.; Long, W.; Bi, M. Comparative study of pilot fuel property and intake air boost on combustion and performance in the CNG dual-fuel engine. Fuel 2019, 256, 1–8. [Google Scholar] [CrossRef]
  43. Lather, R.S.; Das, L.M. Performance and emission assessment of a multi-cylinder S.I engine using CNG & HCNG as fuels. Int. J. Hydrog. Energy 2019, 44, 21181–21192. [Google Scholar] [CrossRef]
  44. Cheng, H.; Tao, S.; Lou, S.; Hu, Q.; Zhou, L. Evaluation of emission factors for light-duty gasoline vehicles based on chassis dynamometer and tunnel studies in Shanghai, China. Atmos. Environ. 2017, 169, 193–203. [Google Scholar] [CrossRef]
  45. Huo, H.; Yao, Z.; Zhang, Y.; Shen, X.; Zhang, Q.; Ding, Y.; He, K. On-board measurements of emissions from light-duty gasoline vehicles in three mega-cities of China. Atmos. Environ. 2012, 49, 371–377. [Google Scholar] [CrossRef]
  46. Gao, J.H.; Wei, L.I.; Gao, J.D.; Liu, S.X.; Qin, K.J. Characteristics of particulate emissions from gasoline vehicles. J. Jilin Univ. 2010, 40, 947–952. [Google Scholar] [CrossRef]
  47. Wang, M.; Liu, X.; Feng, X.; Cao, H.; Guo, D. An Investigation into the Emission of In-Use Light Gasoline Vehicles in Beijing. Automot. Eng. 2014, 36, 74–76. [Google Scholar] [CrossRef]
  48. Zheng, X.; Wu, Y.; Zhang, S.; He, L.; Hao, J. Evaluating real-world emissions of light-duty gasoline vehicles with deactivated three-way catalyst converters. Atmos. Pollut. Res. 2017, 9, 126–132. [Google Scholar] [CrossRef]
  49. Wang, A.; Yun, S.; Tan, J.; Fu, M.; Naeem, A. On-road pollutant emission and fuel consumption characteristics of buses in Beijing. J. Environ. Sci. (Beijing, China) 2011, 23, 419–426. [Google Scholar] [CrossRef]
  50. Chong, H.S.; Park, Y.; Kwon, S.; Hong, Y. Analysis of real driving gaseous emissions from light-duty diesel vehicles. Transp. Res. Part D 2018, 65, 485–499. [Google Scholar] [CrossRef]
  51. Kosmadakis, G.M.; Rakopoulos, C.D. Computational fluid dynamics investigation of alternative nitric oxide emission mechanisms in a hydrogen-fueled spark-ignition engine. Int. J. Hydrog. Energy 2014, 39, 11774–11791. [Google Scholar] [CrossRef]
  52. Derrouiche, S.; Bianchi, D. Modifications of the elementary steps involved in the O2-oxidation of the adsorbed CO species over Pt/Al2O3 by co-adsorbed NO species. J. Catal. 2006, 242, 172–183. [Google Scholar] [CrossRef]
  53. Zhu, G.; Liu, J.; Fu, J.; Xua, Z.; Guo, Q.; Zhao, H. Experimental study on combustion and emission characteristics of turbocharged gasoline direct injection (GDI) engine under cold start new European driving cycle (NEDC). Fuel 2018, 215, 272–284. [Google Scholar] [CrossRef]
  54. Park, C.; Kim, C.; Lee, S.; Lee, S.; Lee, J. Comparative evaluation of performance and emissions of CNG engine for heavy-duty vehicles fueled with various caloric natural gases. Energy (Oxford, U.K.) 2019, 174, 1–9. [Google Scholar] [CrossRef]
  55. Li, W.; Liu, Z.; Wang, Z.; Dou, H.; Wang, C.; Li, J. Experimental and theoretical analysis of effects of equivalence ratio on mixture properties, combustion, thermal efficiency and exhaust emissions of a pilot-ignited NG engine at low loads. Fuel 2016, 171, 125–135. [Google Scholar] [CrossRef]
  56. Wei, L.; Yao, C.; Wang, Q.; Wang, P.; Han, G. Combustion and emission characteristics of a turbocharged diesel engine using high premixed ratio of methanol and diesel fuel. Fuel 2015, 140, 156–163. [Google Scholar] [CrossRef]
  57. Grigoratos, T.; Fontaras, G.; Giechaskiel, B.; Zacharof, N. Real world emissions performance of heavy-duty Euro VI diesel vehicles. Atmos. Environ. 2019, 201, 348–359. [Google Scholar] [CrossRef]
  58. Sakthivel, P.; Subramanian, K.A.; Mathai, R. Comparative studies on combustion, performance and emission characteristics of a two-wheeler with gasoline and 30% ethanol-gasoline blend using chassis dynamometer. Appl. Therm. Eng. 2019, 146, 726–737. [Google Scholar] [CrossRef]
  59. Fleischman, R.; Amiel, R.; Czerwinski, J.; Mayer, A.; Tartakovsky, L. Busses retrofitting with diesel particle filters: Real-world fuel economy and roadworthiness test considerations. J. Environ. Sci. (Beijing, China) 2017, 67, 1–14. [Google Scholar] [CrossRef]
  60. Misra, C.; Ruehl, C.; Collins, J.; Chernich, D.; Herner, J. In-Use NOx Emissions from Diesel and Liquefied Natural Gas Refuse Trucks Equipped with SCR and TWC, Respectively. Environ. Sci. Technol. 2017, 51, 6981–6989. [Google Scholar] [CrossRef]
  61. Wang, Z.; Zhao, Z.; Wang, D.; Tan, M.; Han, Y.; Liu, Z.; Dou, H. Impact of pilot diesel ignition mode on combustion and emissions characteristics of a diesel/natural gas dual fuel heavy-duty engine. Fuel 2016, 167, 248–256. [Google Scholar] [CrossRef]
  62. Jia, F.; Meng, Z.; Jian, L.; Pu, Y.; Du, Y.; Li, J.; Jin, Z.; Chao, C.; Chase, G.G. The influence of ash on soot deposition and regeneration processes in diesel particular filter. Appl. Therm. Eng. 2017, 124, 633–640. [Google Scholar] [CrossRef]
  63. Tandon, P.; Heibel, A.; Whitmore, J.; Kekre, N.; Chithapragada, K. Measurement and prediction of filtration efficiency evolution of soot loaded diesel particulate filters. Chem. Eng. Sci. 2010, 65, 4751–4760. [Google Scholar] [CrossRef]
  64. Zhao, H.; Ge, Y.; Zhang, T.; Zhang, J.; Tan, J.; Zhang, H. Unregulated emissions from diesel engine with particulate filter using Fe-based fuel borne catalyst. J. Environ. Sci. (Beijing, China) 2014, 26, 2027–2033. [Google Scholar] [CrossRef] [PubMed]
  65. Wu, B.Y.; Zhan, Q.; Zhang, S.K.; Nie, X.K.; Li, Y.H.; Su, W. Effect of heavy-duty diesel engine operating parameters on particle number and size distribution at low speed condition. Int. J. Automot. Technol. 2018, 19, 623–633. [Google Scholar] [CrossRef]
  66. Lee, S.; Cho, Y.; Song, M.; Kim, H.; Park, J.; Baik, D. Experimental study on the characteristics of nano-particle emissions from a heavy-duty diesel engine using a urea-SCR system. Int. J. Automot. Technol. 2012, 13, 355–363. [Google Scholar] [CrossRef]
  67. Herner, J.D.; Hu, S.; Robertson, W.H.; Tao, H.; Collins, J.F.; Dwyer, H.; Ayala, A.A. Effect of Advanced Aftertreatment for PM and NOx Control on Heavy-Duty Diesel Truck Emissions. Environ. Sci. Technol. 2009, 43, 5928–5933. [Google Scholar] [CrossRef]
  68. Herner, J.D.; Hu, S.; Robertson, W.H.; Tao, H.; Chang, M.C.O.; Rieger, P.; Ayala, A. Effect of Advanced Aftertreatment for PM and NOx Reduction on Heavy-Duty Diesel Engine Ultrafine Particle Emissions. Environ. Sci. Technol. 2011, 45, 2413–2419. [Google Scholar] [CrossRef]
  69. Biswas, S.; Verma, H.V.; Herner, J.D.; Robertson, W.H.; Ayala, A.; Sioutas, C. Physical properties of particulate matter (PM) from late model heavy-duty diesel vehicles operating with advanced PM and NOx emission control technologies. Atmos. Environ. 2008, 42, 5622–5634. [Google Scholar] [CrossRef]
  70. Noone, K. Atmospheric Chemistry and Physics: From Air Pollution to Climate Change, by John H. Seinfeld and Spyros N. Pandis. Environ. Sci. Policy Sustain. Dev. 1998, 40, 26. [Google Scholar] [CrossRef]
  71. Yu, L. Research of Combustion and Emission Characteristics of Heavy-duty Diesel Engine at Different Altitudes; Beijing Institute of Technology Beijing: Beijing, China, 2014. [Google Scholar]
  72. Wong, C.P.; Leung, T.L.C.W. Characterisation of diesel exhaust particle number and size distributions using mini-dilution tunnel and ejector-diluter measurement techniques. Atmos. Environ. 2003, 37, 4435–4446. [Google Scholar] [CrossRef]
  73. Giechaskiel, B.; Ntziachristos, L.; Samaras, Z.; Scheer, V.; Casati, R.; Vogt, R. Formation potential of vehicle exhaust nucleation mode particles on-road and in the laboratory. Atmos. Environ. 2005, 39, 3191–3198. [Google Scholar] [CrossRef]
  74. Rönkkö, T.; Virtanen, A.; Vaaraslahti, K.; Keskinen, J.; Pirjola, L.; Lappi, M. Effect of dilution conditions and driving parameters on nucleation mode particles in diesel exhaust: Laboratory and on-road study. Atmos. Environ. 2006, 40, 2893–2901. [Google Scholar] [CrossRef]
  75. Sakurai, H.; Tobias, H.J.; Park, K.; Zarling, D.; Docherty, K.S.; Kittelson, D.B.; Mcmurry, P.H.; Ziemann, P.J. On-line measurements of diesel nanoparticle composition and volatility. Atmos. Environ. 2003, 37, 1199–1210. [Google Scholar] [CrossRef]
  76. Zhang, Y.; Lou, D.; Tan, P.; Hu, Z. Experimental study on the particulate matter and nitrogenous compounds from diesel engine retrofitted with DOC+CDPF+SCR. Atmos. Environ. 2018, 177, 45–53. [Google Scholar] [CrossRef]
  77. Järvinen, A.; Aitomaa, M.; Rostedt, A.; Keskinen, J.; Yli-Ojanperä, J. Calibration of the new electrical low pressure impactor (ELPI+). J. Aerosol Sci. 2014, 69, 150–159. [Google Scholar] [CrossRef] [Green Version]
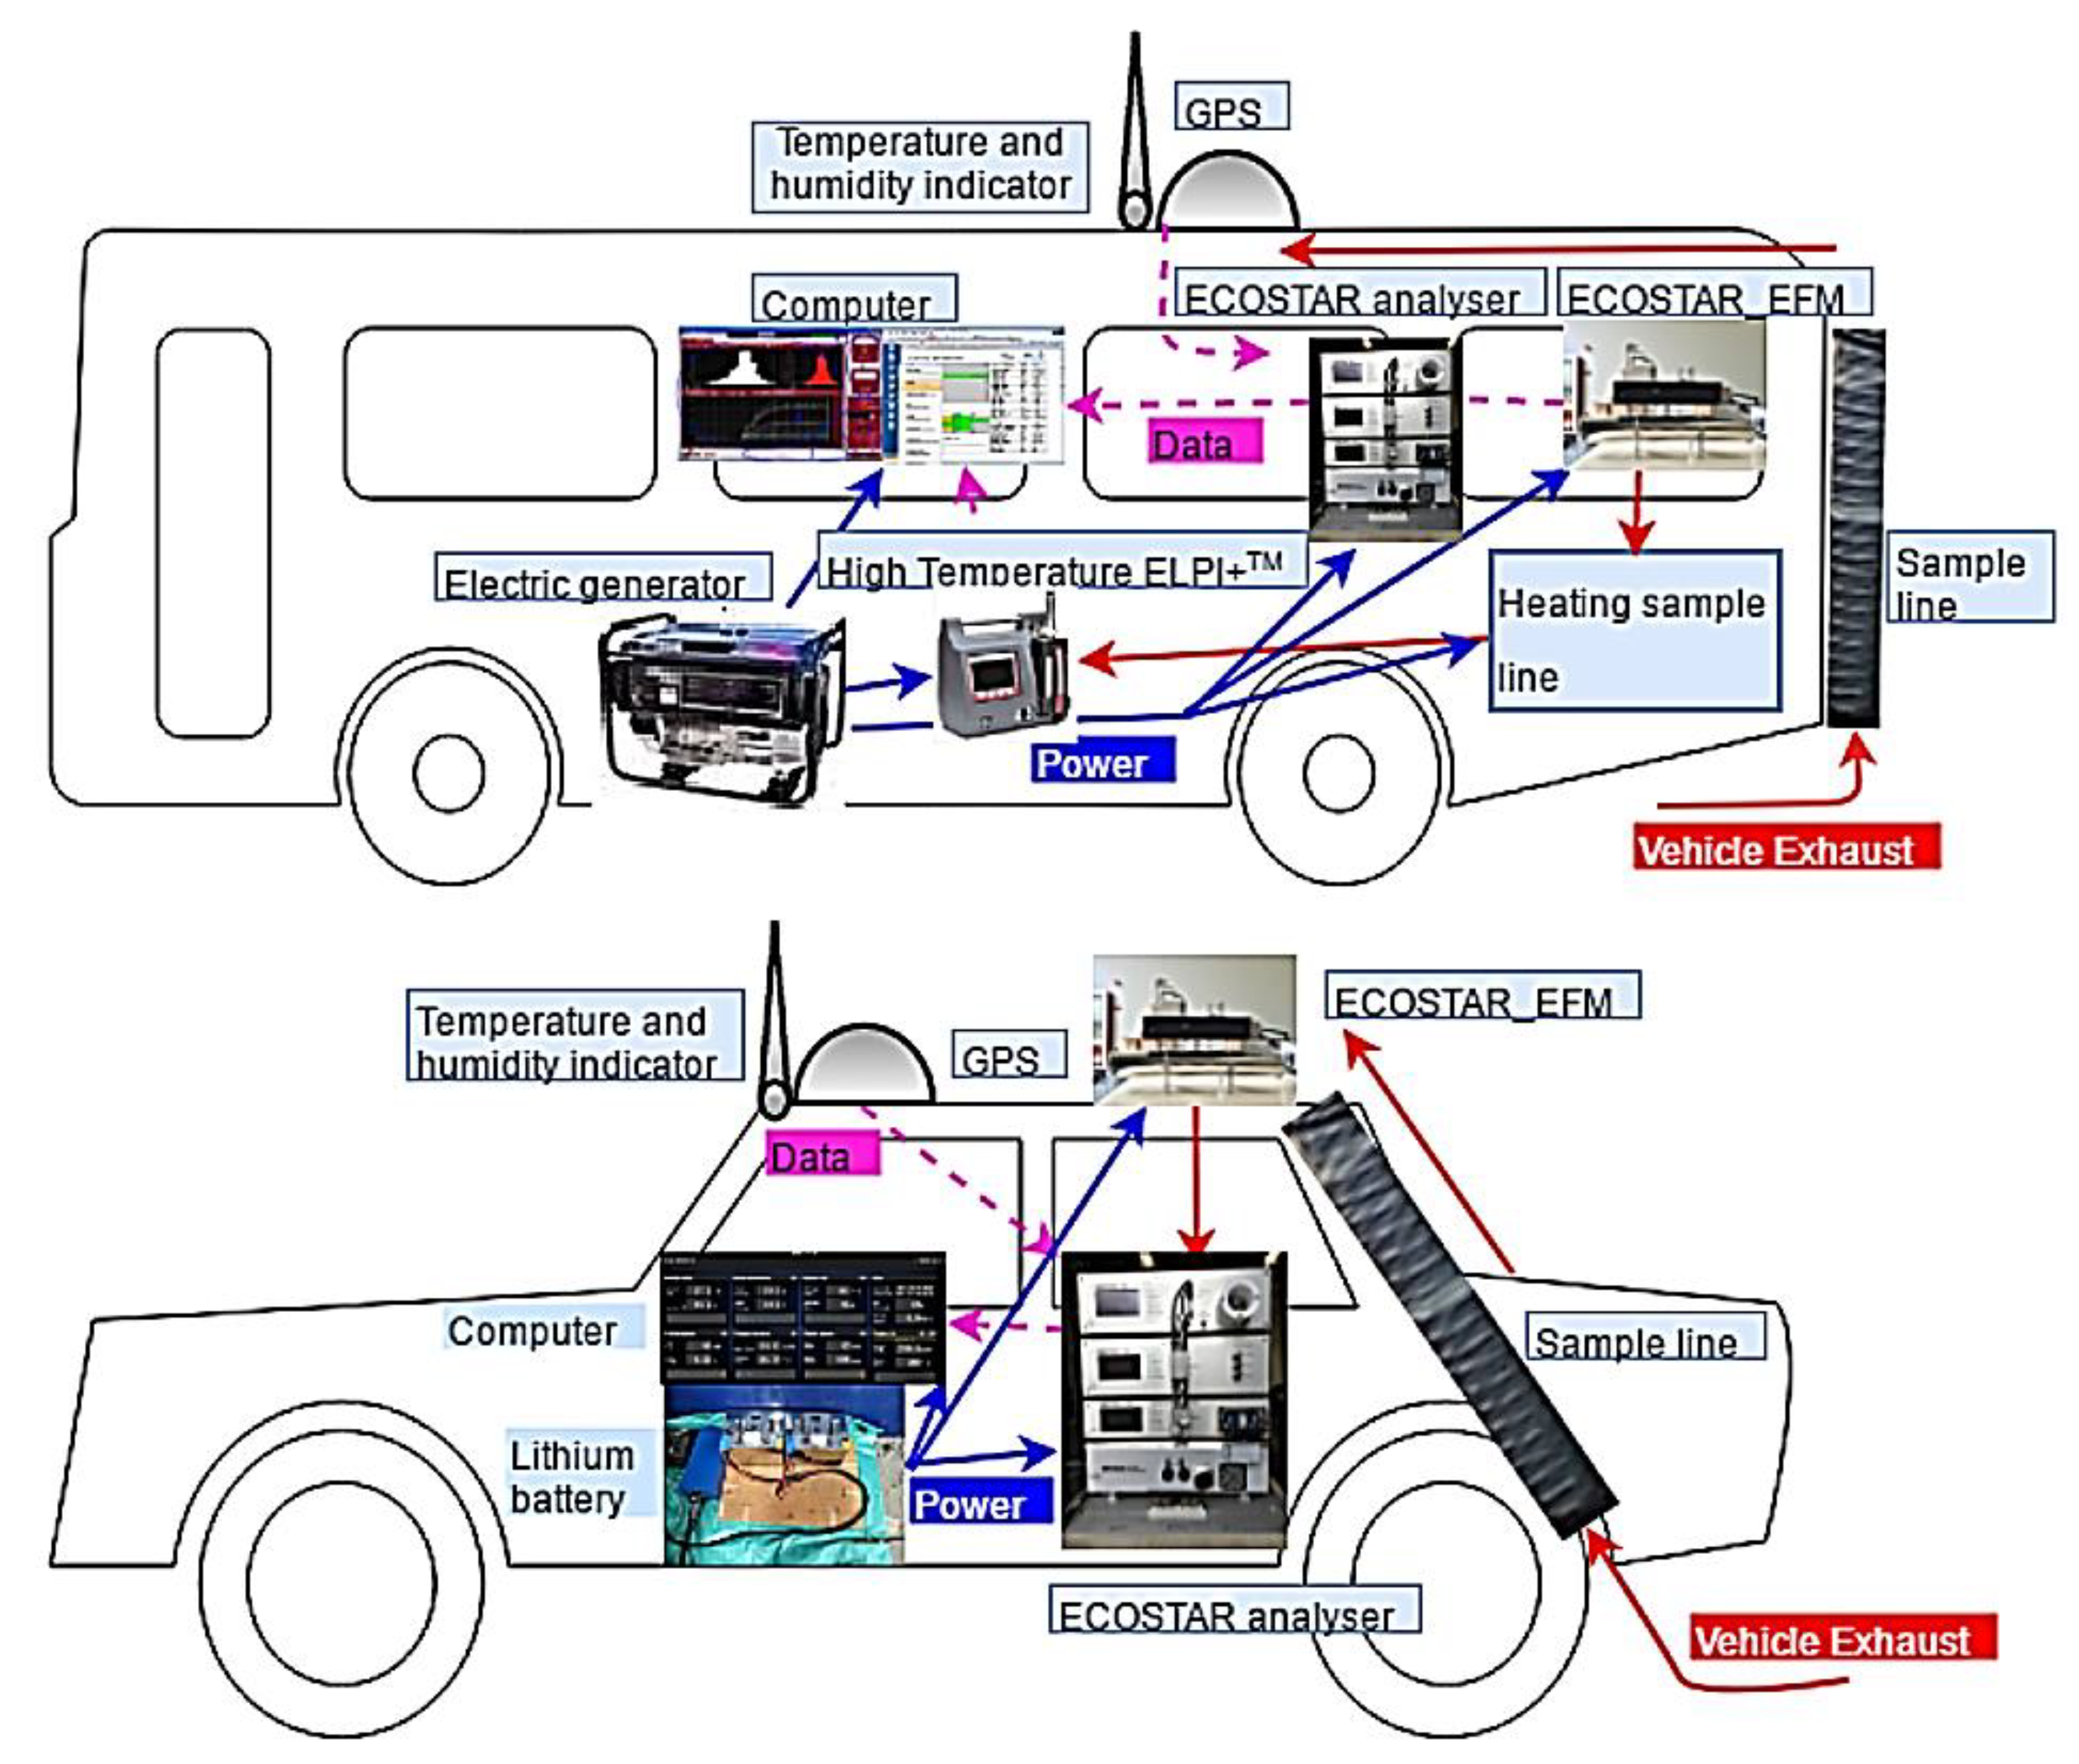
Figure 1. The layout diagram of the PEMS equipment in vehicle tests.
Atmosphere 11 00064 g001
Figure 2. The image maps of the relationship between speed-VSP and CO emission rates. CO emission rates are represented by the colors. The black, brown, blue, cyan, green, yellow, orange, red, and ruby red areas indicate that the emission rates are approximately 0, 0.5, 1, 1.5, 2, 2.5, 3, 3.5, and over 4 times the average emission rate, respectively. Speed is at the X-axis, and VSP is at the Y-axis.
Atmosphere 11 00064 g002aAtmosphere 11 00064 g002b
Figure 3. The image maps of the relationship between speed-VSP and HC emission rates. HC emission rates are represented by the colors. The black, brown, blue, cyan, green, yellow, orange, red, and ruby red areas indicate that the emission rates are approximately 0, 0.5, 1, 1.5, 2, 2.5, 3, 3.5, and over 4 times the average emission rate, respectively. Speed is at the X-axis, and VSP is at the Y-axis.
Atmosphere 11 00064 g003aAtmosphere 11 00064 g003b
Figure 4. The image maps of the relationship between speed-VSP and NOx emission rates. NOx emission rates are represented by the colors. The black, brown, blue, cyan, green, yellow, orange, red, and ruby red areas indicate that the emission rates are approximately 0, 0.5, 1, 1.5, 2, 2.5, 3, 3.5, and over 4 times the average emission rate, respectively. Speed is at the X-axis, and VSP is at the Y-axis.
Atmosphere 11 00064 g004aAtmosphere 11 00064 g004b
Figure 5. The image maps of the relationship between speed-VSP and PN emission rates. PN emission rates are represented by the colors. The black, brown, blue, cyan, green, yellow, orange, red, and ruby red areas indicate that the emission rates are approximately 0, 0.5, 1, 1.5, 2, 2.5, 3, 3.5, and over 4 times the average emission rate, respectively. Speed is at the X-axis, and VSP is on the Y-axis.
Atmosphere 11 00064 g005
Figure 6. The distribution of these 100 high-emission points in the speed-VSP interval of each pollutant for each test vehicle. (a) The high-emission points of CO; (b) The high-emission points of HC; (c) The high-emission points of NOx; (d) The high-emission points of PN.
Atmosphere 11 00064 g006aAtmosphere 11 00064 g006bAtmosphere 11 00064 g006c
Figure 7. Comparison of the average emission rates (average ± 95% confidence interval) and the average emission rate of high-emission points per test vehicles. (a) The comparison of CO; (b) The comparison of HC; (c) The comparison of NOx; (d) The comparison of PN.
Atmosphere 11 00064 g007aAtmosphere 11 00064 g007bAtmosphere 11 00064 g007c
Figure 8. The PN average emission characteristics of test vehicles. (a) The average PN size distribution (average ± 95% confidence interval) of each particle mode; (b) The average emission rates (average ± 95% confidence interval) of each particle mode.
Atmosphere 11 00064 g008
Figure 9. Comparison of the PN size distribution in 9 speed-VSP bins. The speed-VSP intervals: Bin1: Speed ≤ 40 km/h, VSP ≤ −5 kW/t; Bin2: Speed ≤ 40 km/h, −5 kW/t < VSP < 5 kW/t; Bin3: Speed ≤ 40 km/h, VSP ≥ 5 kW/t; Bin4: 40 km/h < Speed ≤ 80 km/h, VSP ≤ −5 kW/t; Bin5: 40 km/h < Speed ≤ 80 km/h, −5 kW/t < VSP < 5 kW/t; Bin6: 40 km/h < Speed ≤ 80 km/h, VSP ≥ 5 kW/t; Bin7: Speed > 80 km/h, VSP ≤ −5 kW/t; Bin8: Speed > 80 km/h, −5 kW/t < VSP < 5 kW/t; Bin9: Speed > 80 km/h, VSP ≥ 5 kW/t. (a) No. 4 (diesel truck, China IV); (b) No. 5 (diesel middle bus, China III); (c) No. 6 (diesel middle bus, China IV); (d) No. 7 (diesel bus, China III); (e) No. 8 (diesel bus, China IV); (f) No. 9 (LNG bus, China IV).
Atmosphere 11 00064 g009aAtmosphere 11 00064 g009bAtmosphere 11 00064 g009c
Figure 10. The relationship between speed, PN emission rates (average ± 95% confidence interval), and each particle mode of each test vehicle. (a) No. 4 (diesel truck, China IV); (b) No. 5 (diesel middle bus, China III); (c) No. 6 (diesel middle bus, China IV); (d) No. 7 (diesel bus, China III); (e) No. 8 (diesel bus, China IV); (f) No. 9 (LNG bus, China IV).
Atmosphere 11 00064 g010aAtmosphere 11 00064 g010bAtmosphere 11 00064 g010c
Table 1. Information on the on-road tested vehicle.
Test No.Vehicle TypeFuel TypeMode YearEmission StandardMileage (103 km)Power (kw)After-TreatmentCurb Weight (kg)
1CarGasoline,92# (China V)2011.3China IV140106MPI,TWC1610
2Car2011.11China IV50106MPI,TWC1595
3TruckDiesel,0#
(China V)
2014.4China III120118CIC,ECR,5800
4Truck2015.5China IV90118CIC,ECR,CRT5800
5Middle bus2012.11.China III29085HPCR3450
6Middle bus2014.6China IV20095HPCR,CRT4100
7Bus2012.4China III240180CIC,ECR10,890
8Bus2016.7China IV120160CIC,CRDI,SCR9560
9BusLNG2015.1China IV160187CIC11,490
After-treatment: MPI: Multipoint efi; TWC: three-way catalytic converter; CIC: turbocharged intercooler; ECR: electronic controlled common rail; HPCR: high-pressure common rail; CRDI: electrically controlled direct injection common rail; CRT: EGR (exhaust gas recirculation) + DPF (diesel particulate filter); SCR: selective catalytic reduction, in this paper represented by DOC (Diesel catalytic oxidation) + SCR.
Table 2. Emission factors (average ± 95% confidence interval) of test vehicles and comparison with previous studies.
Vehicle TypeEmission StandardsModel YearMileage (103 km)Fuel TypeCOHCNOxPMPNSource
(g/km)(g/km)(g/km)(g/km)(p/km)
Gasoline carChina IV (No.1)2011140Gasoline,92#
(China V)
0.68 ± 0.140.016 ± 0.0010.04 ± 0.009N/AN/AThis study
China IV (No.2)201150Gasoline,92#
(China V)
0.39 ± 0.050.014 ± 0.0020.01 ± 0.002N/AN/AThis study
Euro IV2008139.7Gasoline
(Euro V)
1.770.120.090.004N/A[44]
Euro IV200865.3Gasoline
(Euro V)
0.70.030.070.002N/A[44]
Euro IV201248.7Gasoline
(Euro V)
0.410.040.020.009N/A[44]
Euro IV2008–2010N/AGasoline
(Euro V)
0.40 ± 0.210.02 ± 0.010.05 ± 0.03N/AN/A[45]
Euro IV20093.3–3.8Gasoline,93#
(China IV)
0.59 ± 0.840.02 ± 0.010.02 ± 0.010.004 ± 0.001N/A[46]
China IV201115–90Gasoline,93#
(China IV)
0.90.080.08N/AN/A[47]
China IV2010–2012195Gasoline,92#
(China V)
0.9 ± 0.80.01 ± 0.000.03 ± 0.02N/AN/A[48]
Diesel truckChina III (No.3)2014120Diesel,0#
(China V)
0.73 ± 0.070.123 ± 0.0033.88 ± 0.157N/AN/AThis study
China IV (No.4)201590Diesel,0#
(China V)
0.63 ± 0.050.038 ± 0.0022.82 ± 0.2521.52 ± 0.030(3.91 ± 0.38) × 1013This study
Before JE V1997111Ultra-low sulfur diesel1.540.673.7N/AN/A[16]
JE V20085.4Ultra-low sulfur diesel0.490.0082.64N/AN/A[16]
JE V20101.6Ultra-low sulfur diesel0.980.072.49N/AN/A[16]
Diesel middle busChina III (No.5)2012.11290Diesel,0#
(China V)
1.65 ± 0.110.219 ± 0.0123.43 ± 0.2080.06 ± 0.004(2.27 ± 0.41) × 1015This study
China IV (No.6)2014.6200Diesel,0#
(China V)
0.46 ± 0.050.050 ± 0.0042.54 ± 0.1720.03 ± 0.009(1.03 ± 0.99) × 1013This study
Before JE V200353.9Ultra-low sulfur diesel1.660.58.160.11N/A[16]
JE V200533.2Ultra-low sulfur diesel1.460.376.450.055N/A[16]
Diesel busChina III (No.7)2012240Diesel,0#
(China V)
5.45 ± 0.880.225 ± 0.00610.90 ± 0.5920.77 ± 0.108(3.40 ± 0.37) × 1014This study
China IV (No.8)2016120Diesel,0#
(China V)
3.20 ± 0.690.067 ± 0.0045.23 ± 0.6900.07 ± 0.016(1.13 ± 0.22) × 1015This study
Euro III200532Ultra-low sulfur diesel4.640.1514.20.066N/A[16]
Euro IIIN/A78.3Diesel
(China III)
6.70.1412.12.955N/A[49]
Euro IIIN/A81.6Diesel
(China III)
4.780.1912.773.086N/A[49]
China III2008124Ultra-low sulfur diesel5.970.0914.10.053N/A[16]
China IV200972Ultra-low sulfur diesel4.210.1617.90.00045N/A[16]
Euro IV201053.6Diesel
(Euro IV)
8.280.028.860.67N/A[31]
Euro IVN/A59.2Diesel
(China III)
1.3110.0511.970.409N/A[49]
Euro IVN/A42.9Diesel
(China III)
1.5330.0410.060.853N/A[49]
LNG busChina IV (No.9)2015160LNG0.34 ± 0.025.275 ± 0.42115.63 ± 1.4300.0004 ± 0.00008(5.68 ± 0.10) × 1011This study
Euro IVN/A40.3CNG4.140.253.220.006N/A[49]
Euro IVN/A39.9CNG12.721.012.950.218N/A[49]
Euro V2012N/ALNG1.21.53.16N/AN/A[36]
Euro V2012N/ALNG0.7N/A3.3N/AN/A[36]
p/km: p represents the number of particles; CNG: compressed natural gas; Emission Standard: The China III vehicles in China is equivalent to the Euro III vehicles. The China IV vehicles in China are equivalent to the Euro IV vehicles; Ultra-low sulfur diesel: the sulfur content is 10–20 ppm.