Article

East Asian Summer Atmospheric Moisture Transport and Its Response to Interannual Variability of the West Pacific Subtropical High: An Evaluation of the Met Office Unified Model

by
José M. Rodríguez
* and
Sean F. Milton
Met Office, Exeter EX1 3PB, UK
*
Author to whom correspondence should be addressed.
Atmosphere 2019, 10(8), 457; https://doi.org/10.3390/atmos10080457
Submission received: 20 June 2019 / Revised: 24 July 2019 / Accepted: 6 August 2019 / Published: 10 August 2019
(This article belongs to the Special Issue Analysis of Oceanic and Terrestrial Atmospheric Moisture Sources)

Abstract

:
In this study, the atmospheric moisture transport involved in the East Asian summer monsoon (EASM) water cycle is examined. Observational estimates are contrasted with the Met Office Unified Model (MetUM) climate simulations to evaluate the model’s ability to capture this transport. We explore the role of large circulation in determining the regional water cycle by analyzing key systematic errors in the model. MetUM exhibits robust errors in its representation of the summer Asian-Pacific monsoon system, including dry biases in the Indian peninsula and wet biases in the tropical Indian Ocean and tropical West Pacific. Such errors are consistent with errors in the atmospheric moisture convergence in the area. Diabatic heating biases in the Maritime Continent domain are shown, via nudging sensitivity experiments, to play a crucial role in remotely forcing the model circulation and moisture transport errors in the East Asian area. We also examine changes in the regional water cycle in response to interannual variability of the West Pacific subtropical high (WPSH). It is shown by water budget analysis that, although the model in general is not able to faithfully reproduce the response on a month to month basis, it gives comparable seasonal trends in regional moisture convergence and precipitation associated with shifts of the WPSH.

1. Introduction

The East Asian boreal summer climate is dominated by the East Asian summer monsoon (EASM), which brings southwesterly surface winds to the region, accompanied by heavy rain, and a generally hot and humid climate [1]. The EASM is thought to have three main components that are highly coupled, the East Asian Meiyu (China), Changma (Korea), Baiu (Japan) rain front, the western Pacific subtropical high (WPSH), and the western Pacific intertropical convergence zone [2,3,4,5]. The rain belt of the East Asian summer monsoon undergoes two northward jumps. From May to June, the precipitation advances from southern China to the Yangtze River valley and, from June to July, the rainband jumps farther to the northern parts of East Asia. The rain belt brings an important water resource to highly populated economic centres in the world. For instance, the Meiyu rainfall provides nearly 45 % of summer precipitation over the Yangtze River valley [6,7,8]. Droughts and floods associated with the monsoon variability have cause extensive social and economic impacts on the region [1]. Moreover, global warming is expected to alter the global hydrological cycle and affect the patterns of regional precipitation [9].
The location and intensity of the WPSH modulate the monsoon seasonal evolution [10]. The northwestern edge transports large amounts of water vapour northwards into East Asia [11]. The northward shifts of the WPSH are closely associated with the onset and retreat of the East Asian summer monsoon and the intensity of the WPSH controls the Meiyu/Changma/Baiu frontal zones [12]. The zonal shifts also play an important role, and they have been associated with more rainfall in the East Asian monsoon region [12]. The variability of the WPSH has been demonstrated to represent faithfully fluctuations of the East Asian summer monsoon strength, and the total number of tropical storms impacting the East Asian coasts [13].
Moisture transport may be considered the main component of the atmospheric branch of the water cycle, establishing the links between evaporation from the ocean and precipitation over the continents [14]. Atmospheric moisture transport is an important component of the EASM, as a large amount of water vapour is moved from the adjacent oceans to the East Asian monsoon region by the large-scale monsoon circulation [8,15]. Understanding the physical processes behind this transport can lead to improved rainfall forecasts in the region. To make these predictions at different time scales from weather, seasonal and multiannual predictions to climate change projections, dynamical global circulation models (GCMs) are an indispensable tool. Reliable GCMs are essential to improve our understanding and prediction of monsoon circulation and regional water cycle. Significant systematic biases in seasonal mean monsoon rainfall are common in GCMs. In the case of the Asian monsoon, while most GCMs capture the seasonal migration of rainfall, they are less successful in representing details of its spatial, interannual and intraseasonal variability [16,17,18].
We study the moisture sources and atmospheric moisture transport involved in the EASM water cycle. We examine their characteristics in observations and reanalysis and contrast them with performance in the latest generation Met Office Unified Model (MetUM). Our main goal is to evaluate the ability of MetUM to capture this transport at annual and multi-decadal timescales. The paper is split into two parts. In the first part, the long-term mean atmospheric transport is studied. We explore the role of large-scale circulation in determining the regional precipitation by analyzing key systematic errors in model simulations. In MetUM, many errors exhibited in long-term climate simulations also appear at short times in numerical weather prediction (NWP) forecasts, suggesting that deficiencies in the parameterization of sub-grid scale processes may be the underlying cause of the atmospheric biases [16,19]. We combine the use of NWP forecasts and climate simulations to study the evolution of biases in the model’s mean state, and to examine how systematic errors in the tropics remotely force errors in EASM circulation and moisture transport. While mean-state metrics are very useful indicators of model performance, ultimately we are interested in changes, natural or man-made that can affect the regional water cycle. In the second part, we investigate the effects that the interannual variability of the WPSH, one of the main components of the EASM, has in the East Asian water cycle. We evaluate the capability of MetUM to represent the response of the atmospheric moisture transport to this variability.
The remainder of this paper is as follows: Section 2 describes the configurations of the MetUM and the observation data sets used. The main results are presented in Section 3, followed by conclusions and a brief discussion in Section 4.

2. Models and Data

2.1. Model Simulations

The general circulation model (GCM) used in this work is the MetUM Global Atmosphere model, which has been run in two configurations. To study the mean-state large scale circulation and moisture transports in the Asian summer monsoon region, a climate configuration was used. This model configuration includes the submodels UM Global Atmosphere 7.0 and JULES Global Land 7.0 (GA7 and GL7.0, respectively) [20]. The climate model is run at horizontal resolution N96 (181 km × 139 km at 30 ), with a vertical resolution of 85 levels (top at 85 km), and four soil levels. The integrations were produced with the same surface temperature, sea-ice fractions and other external forcings as in the Atmospheric Model Intercomparison Project (AMIP) framework of the Coupled Model Intercomparison Project Phase 5, CMIP5 [21]. These simulations cover the period 1988–2007, a subset of the AMIP period on which we applied Reynolds sea surface temperatures [22] to force the model. The simulations will be referred to hereafter as AMIP-N96.
A set of NWP hindcasts has been produced [23] to determine which long-term mean errors in climate simulations appear at short times initialised simulations and how they develop in time. The NWP hindcasts are initialised at 0Z from the Met Office operational global atmospheric analysis. Each hindcast has run for 15 days. For this work, we have produced a hindcast on each day in the June–August 2016 season (92 hindcasts). The hindcasts correspond to the Global Atmosphere 6.0 (GA6) model [24], run at N216 horizontal resolution (80 km × 62 km at 30 ). Although GA6 and GA7 are different model versions, and GA7 has a number of incremental improvements over GA6, particularly in cloud performance, the key systematic biases over East Asia are very similar in both versions [15] and can be considered equivalent for the purpose of this study. The NWP hindcasts will be referred to hereafter as NWP-N216.

2.2. Observations

ERA Interim reanalysis datasets, produced by the European Centre for Medium Range Weather Forecasts (ECMWF) [25], were used to evaluate the mean-state moisture transport in the Asian summer monsoon region. They were also used to study the climatology and variability of atmospheric circulation associated with the WPSH, as well as the corresponding regional water cycle, and to assess model simulations in the region. They will be referred to hereafter as ERA-I. MetUM analysis [26] datasets were used to study the development of model errors in circulation and moisture transport in the area. Global analyses are particularly useful to assess model water budgets. The alternative of using hybrid observations of precipitation, evaporation and moisture fluxes tends to give larger uncertainties and suffers from large errors in closing the budget [27]. The Global Precipitation Climatology Project (GPCP), version 2.2 monthly 1 precipitation product, was also used to evaluate the MetUM precipitation. The version 2.2 data used cover the period 1979–2010 and combine precipitation estimates from Special Sensor Microwave Imager emission and scattering algorithms, GOES Precipitation Index, Outgoing Longwave precipitation Index, rain gauges, and TIROS Operational Vertical Sounder on NOAA polar-orbiting satellites, following the procedures described in [28].
In order to explore the potential role of specific tropical processes on the East Asian monsoon circulation and moisture transports, we have also carried out a series of atmospheric nudging experiments using both NWP-N216 and AMIP-N96 configurations. In these simulations, the free-running model simulation is relaxed back to analysis over the globe or subdomains where there might be significant systematic errors impacting the East Asian water cycle through remote forcing of the circulation. The AMIP-N96 (NWP-N216) simulations are nudged back to ERA-I (MetUM analysis) temperatures and winds with a 6-hourly relaxation time scale at all model levels. In addition, a 10 buffer zone around the relaxation subdomain is introduced in which the nudging increments are exponentially damped to zero to ensure a smooth transition between the nudged and free-running parts of the simulation.

3. Results

As an indicator of the summer atmospheric water cycle over East Asia, we first consider the seasonal regional precipitation in the wider context of the Asian-Pacific summer monsoon system. The GPCP June–August 1988–2007 mean precipitation in the region is displayed in 
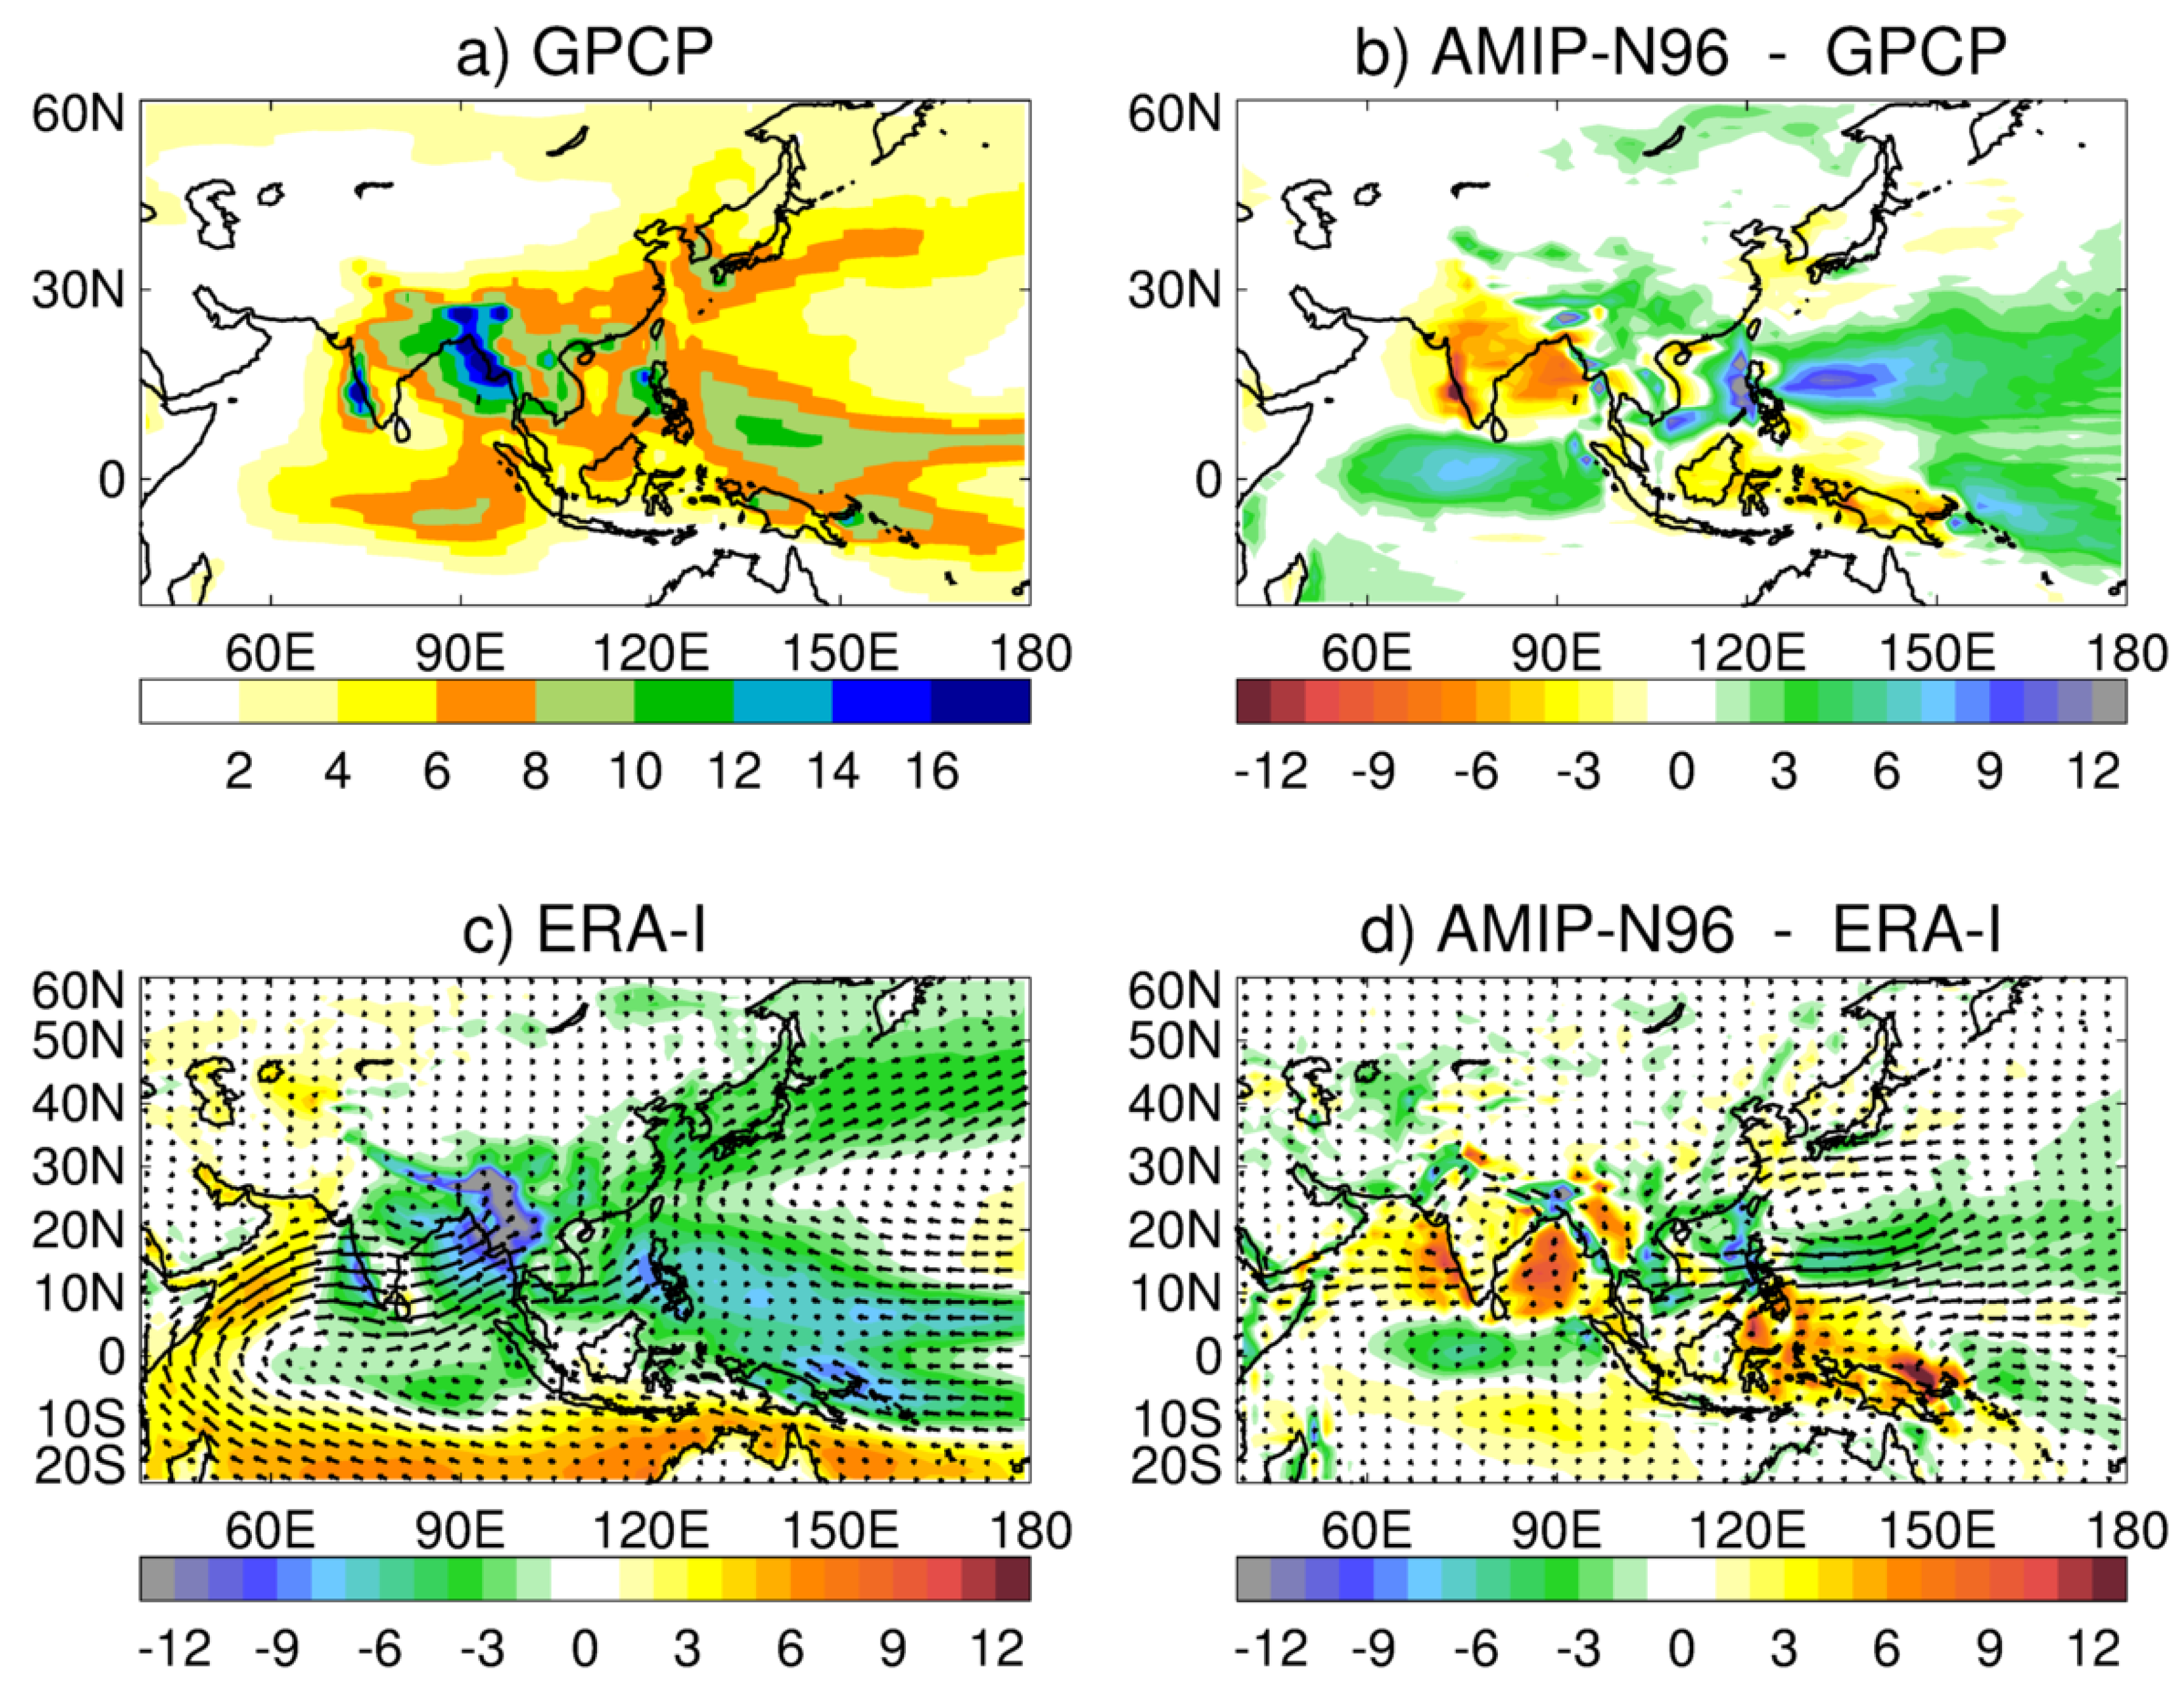
Figure 1a, and it shows the main characteristics associated with the summer Asian monsoon rainfall, with areas of high precipitation over the west coast of India, and the Bay of Bengal, extending over continental Southeast Asia and Southern China. Other centers of high precipitation are found in the Philippines, tropical West Pacific, Southern Japan and the Korean peninsula. Seasonal regional precipitation errors in AMIP-N96 simulations are displayed in Figure 1b, which shows dry biases in the Indian peninsula and Bay of Bengal, as well as in regions in East Asia and the Western Pacific north of 30 N. The model simulations also show distinct wet biases in the tropical Indian Ocean, southern China and the tropical West Pacific.
The regional patterns of precipitation and the corresponding model simulation biases can be understood in terms of moisture sources and the atmospheric general circulation, by studying the associated moisture transport. To make that connection, here we use an approach based on water conservation. Atmospheric water conservation can be expressed in terms of an equation that involves vertically-integrated quantities [29,30]:
W t + H · Q = E P ,
where W and Q are respectively the total amount of water and the total horizontal moisture flux in a unit area column. The first term on the left-hand side of expression (1) represents the precipitable water tendency, the second term depicts the horizontal moisture flux divergence, E is the evaporation from the surface and P, the precipitation at the surface. If we consider averaged quantities over timescales larger than one month, changes in the water content column are very small compared to E P fluxes. In this case, the water balance equation simplifies to:
H · Q ¯ = E ¯ P ¯ ,
where the bars denote averaging in time. Conservation equations like the one above have been used before to estimate quantities like surface moisture, energy and momentum fluxes [27,31]. Atmospheric moisture divergence connects sources and sinks of moisture to evaporation and precipitation. Equation (2) shows that moisture divergent regions (positive term on left-hand side) are predominantly evaporative ( E ¯ > P ¯ ), whereas moisture convergent areas (negative term on left-hand side) are places of precipitation predominance ( E ¯ < P ¯ ). Moreover, since atmospheric moisture is concentrated in the lower troposphere, patterns of moisture transport, expressed by the Q vector, closely reflect the atmospheric lower tropospheric circulation. In the following results, Q has been produced by integrating the horizontal moisture flux over the full set of model vertical levels (60 in the case of ERA-I and 85 in the MetUM case).
June–August 1988–2007 mean moisture transport depicted in Figure 1c shows vertically-integrated moisture flux, Q , and moisture divergence for ERA-I. In the East Asian monsoon region, zones of moisture convergence can be seen in the tropics (including the South China Sea and the tropical West Pacific up to 180 longitude) and the extra-tropics (from Japan to the central North Pacific). Moisture into the East Asian area comes from four sources: moisture from the Arabian Sea and Bay of Bengal, transported by the Indian Monsoon; moisture from the western tropical Pacific, transported by the Southeast Asian monsoon; moisture crossing the equator in the 100 150 E area; and a small westerly moisture flux at midlatitudes.
Atmospheric moisture transport and divergence errors in AMIP-N96 are displayed in Figure 1d. They show an excessive westerly moisture flux at about 10 N in the South China Sea and the tropical West Pacific that penetrates deep into the Pacific Ocean and becomes part of an erroneous cyclonic circulation, extending up to 30 N that brings excessive moisture convergence into the Philippine Sea and reduces the transport of moisture from East Asia to the North West Pacific. Another distinctive error in AMIP-N96 is characterised by an erroneous anticyclonic flow with excessive westward moisture flux crossing the Indian Peninsula and combines with an erroneous easterly flow in the equatorial Indian Ocean and leads to a convergent error in the equatorial Indian Ocean and a moisture divergence error in the Arabian Sea, Indian Peninsula and the Bay of Bengal.
AMIP-N96 errors in moisture divergence are strongly connected to the model mean precipitation biases in the region. As it is expressed in Equation (2), a negative seasonal mean moisture divergence can be approximated as a predominant seasonal precipitation. This is the case in the regions where the main errors mentioned above develop (see Figure 1c). This means that the moisture divergence errors can be approximated as precipitation errors. That is, the error patterns of moisture divergence in Figure 1d can be interpreted as dry biases in the Arabian Sea west of the Indian Peninsula as well as in the Bay of Bengal and the islands of the Maritime Continent, and wet biases in the tropical Indian Ocean, the South China Sea and the tropical West Pacific, which correspond to the precipitation bias patterns shown in Figure 1b. It is difficult to disentangle whether errors in the time-mean precipitation are a consequence of errors introduced in the way we choose to parametrize key processes such as tropical convection as a “local physics” response, or whether “remote forcing” of errors in the divergent circulation causes errors in moisture convergence leading to precipitation errors through erroneous inputs to the convection parametrization (see [32] for a detailed discussion of local physics vs. remote forcing of model errors). In the following sections, we attempt analyze the remote vs. local sources of errors affecting the atmospheric moisture transports in the region through a combination of relaxation/nudging experiments and short-range NWP experiments.

3.1. Teleconnections and Remotely Forced Model Systematic Errors—Role of the Tropics

In order to explore possible mechanisms linking model systematic biases with the large-scale circulation and moisture transport errors mentioned above, we have carried out a series of both NWP-N216 and AMIP-N96 sensitivity experiments using the nudging/relaxation methodology first described in [33] and used subsequently by others [15,34,35]. The nudging methodology requires relaxing the free-running model simulation back to an analysis both over the whole globe and over specific sub-domains chosen as areas where model systematic errors may have their source and have a remote influence on the regions of interest in this study (see Figure 2 top right panel). Our focus is on the role of the tropics in forcing errors in the sub-tropics and in particular in the WPSH as a crucial component of the East Asian Summer Monsoon.
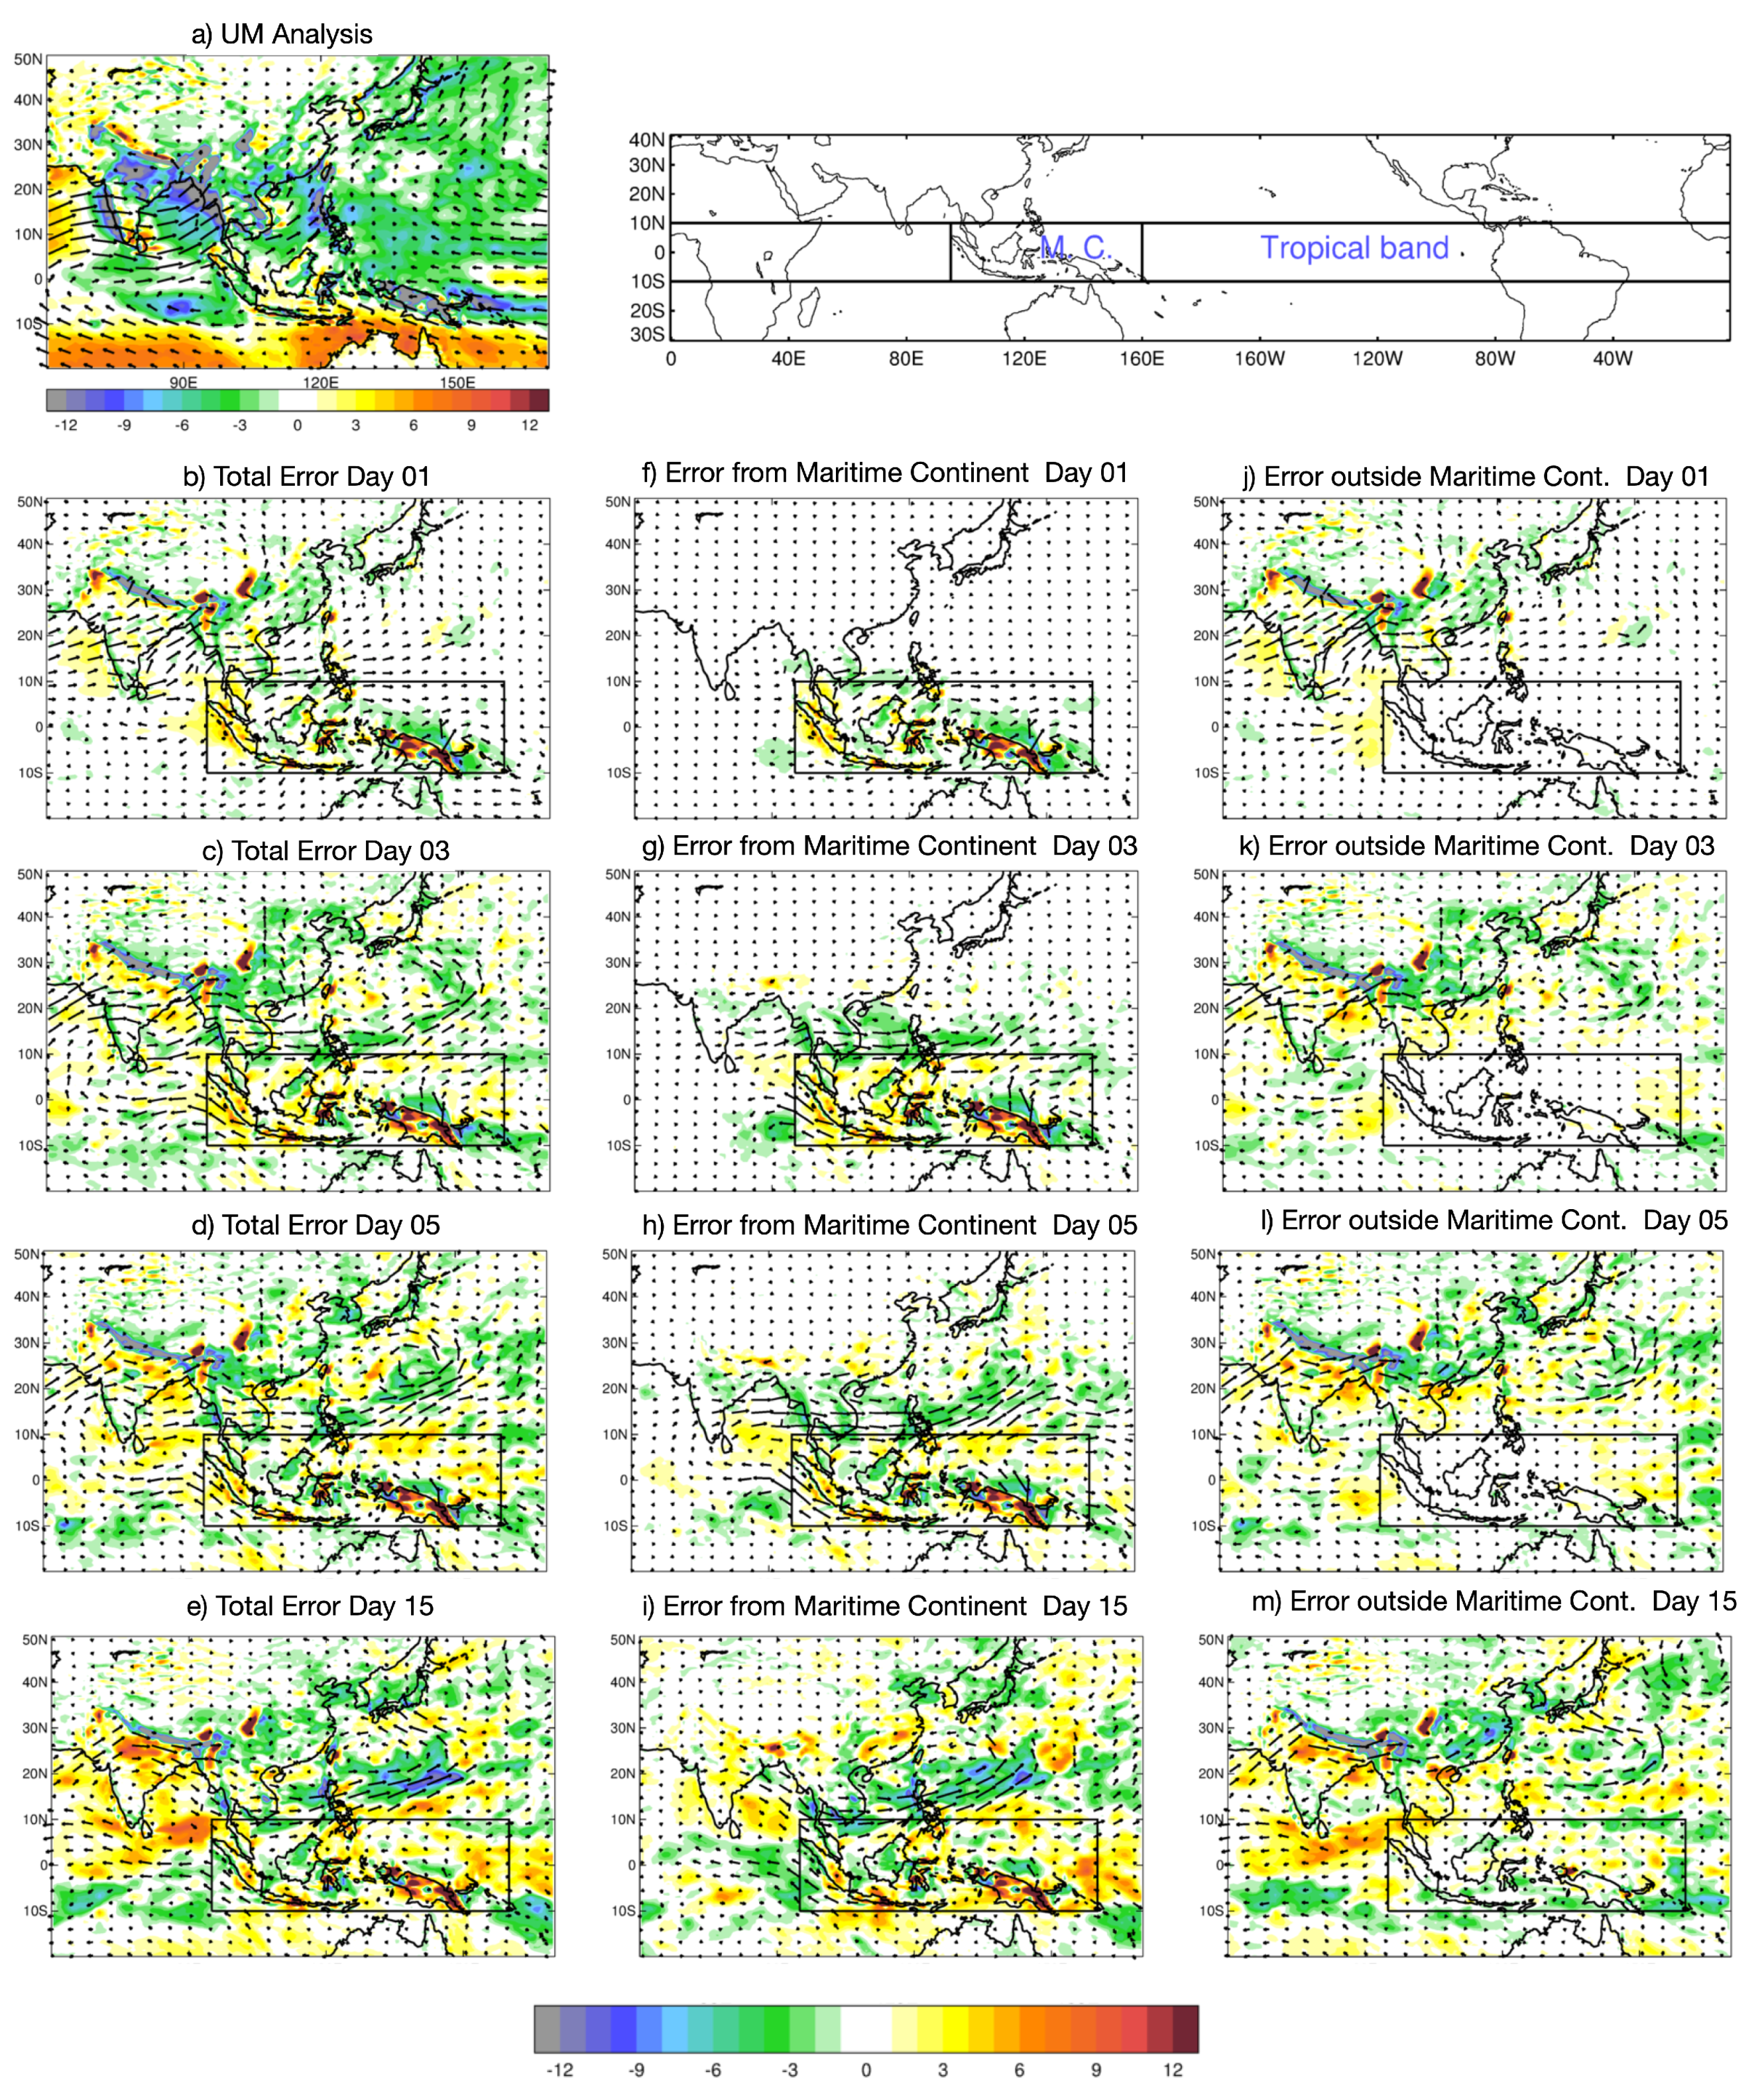
We begin with an example of the influence of the Maritime Continent (MC) on the growth of remotely forced model systematic errors over China, the western Pacific and the Indian Ocean over the first 15-days of simulation of the NWP-N216 nudging experiments conducted during June–August 2016 (Figure 2). The total mean error (forecast-analysis) in the moisture transport and divergence for forecast days 1, 3, 5, and 15 (Figure 2b–e) shows the gradual emergence of key systematic errors seen in the moisture transport/divergence for AMIP-N96 simulations vs. ERA-I (Figure 1d). This includes the cyclonic circulation in the western Pacific sub-tropics and the erroneous extension of the Asian Monsoon low level flow into this region with associated convergence of moisture. The anti-cyclonic circulation and moisture divergence over India also appear early on (days 3–5) and is well established by day 15. We can also see significant local errors in moisture divergence/convergence over the MC itself. The island of New Guinea is dominated by erroneous moisture divergence tied to the island’s topography, while the adjacent ocean to the north shows too much convergence of moisture. These errors are large even at day 1 suggesting that errors in local parameterised physics are the key drivers rather than remote forcing errors of the circulation. The most likely source of these errors is in the large uncertainties in parameterising tropical convection (see [16] for the study of sensitivity of model errors to details of MetUM convective parametrization).
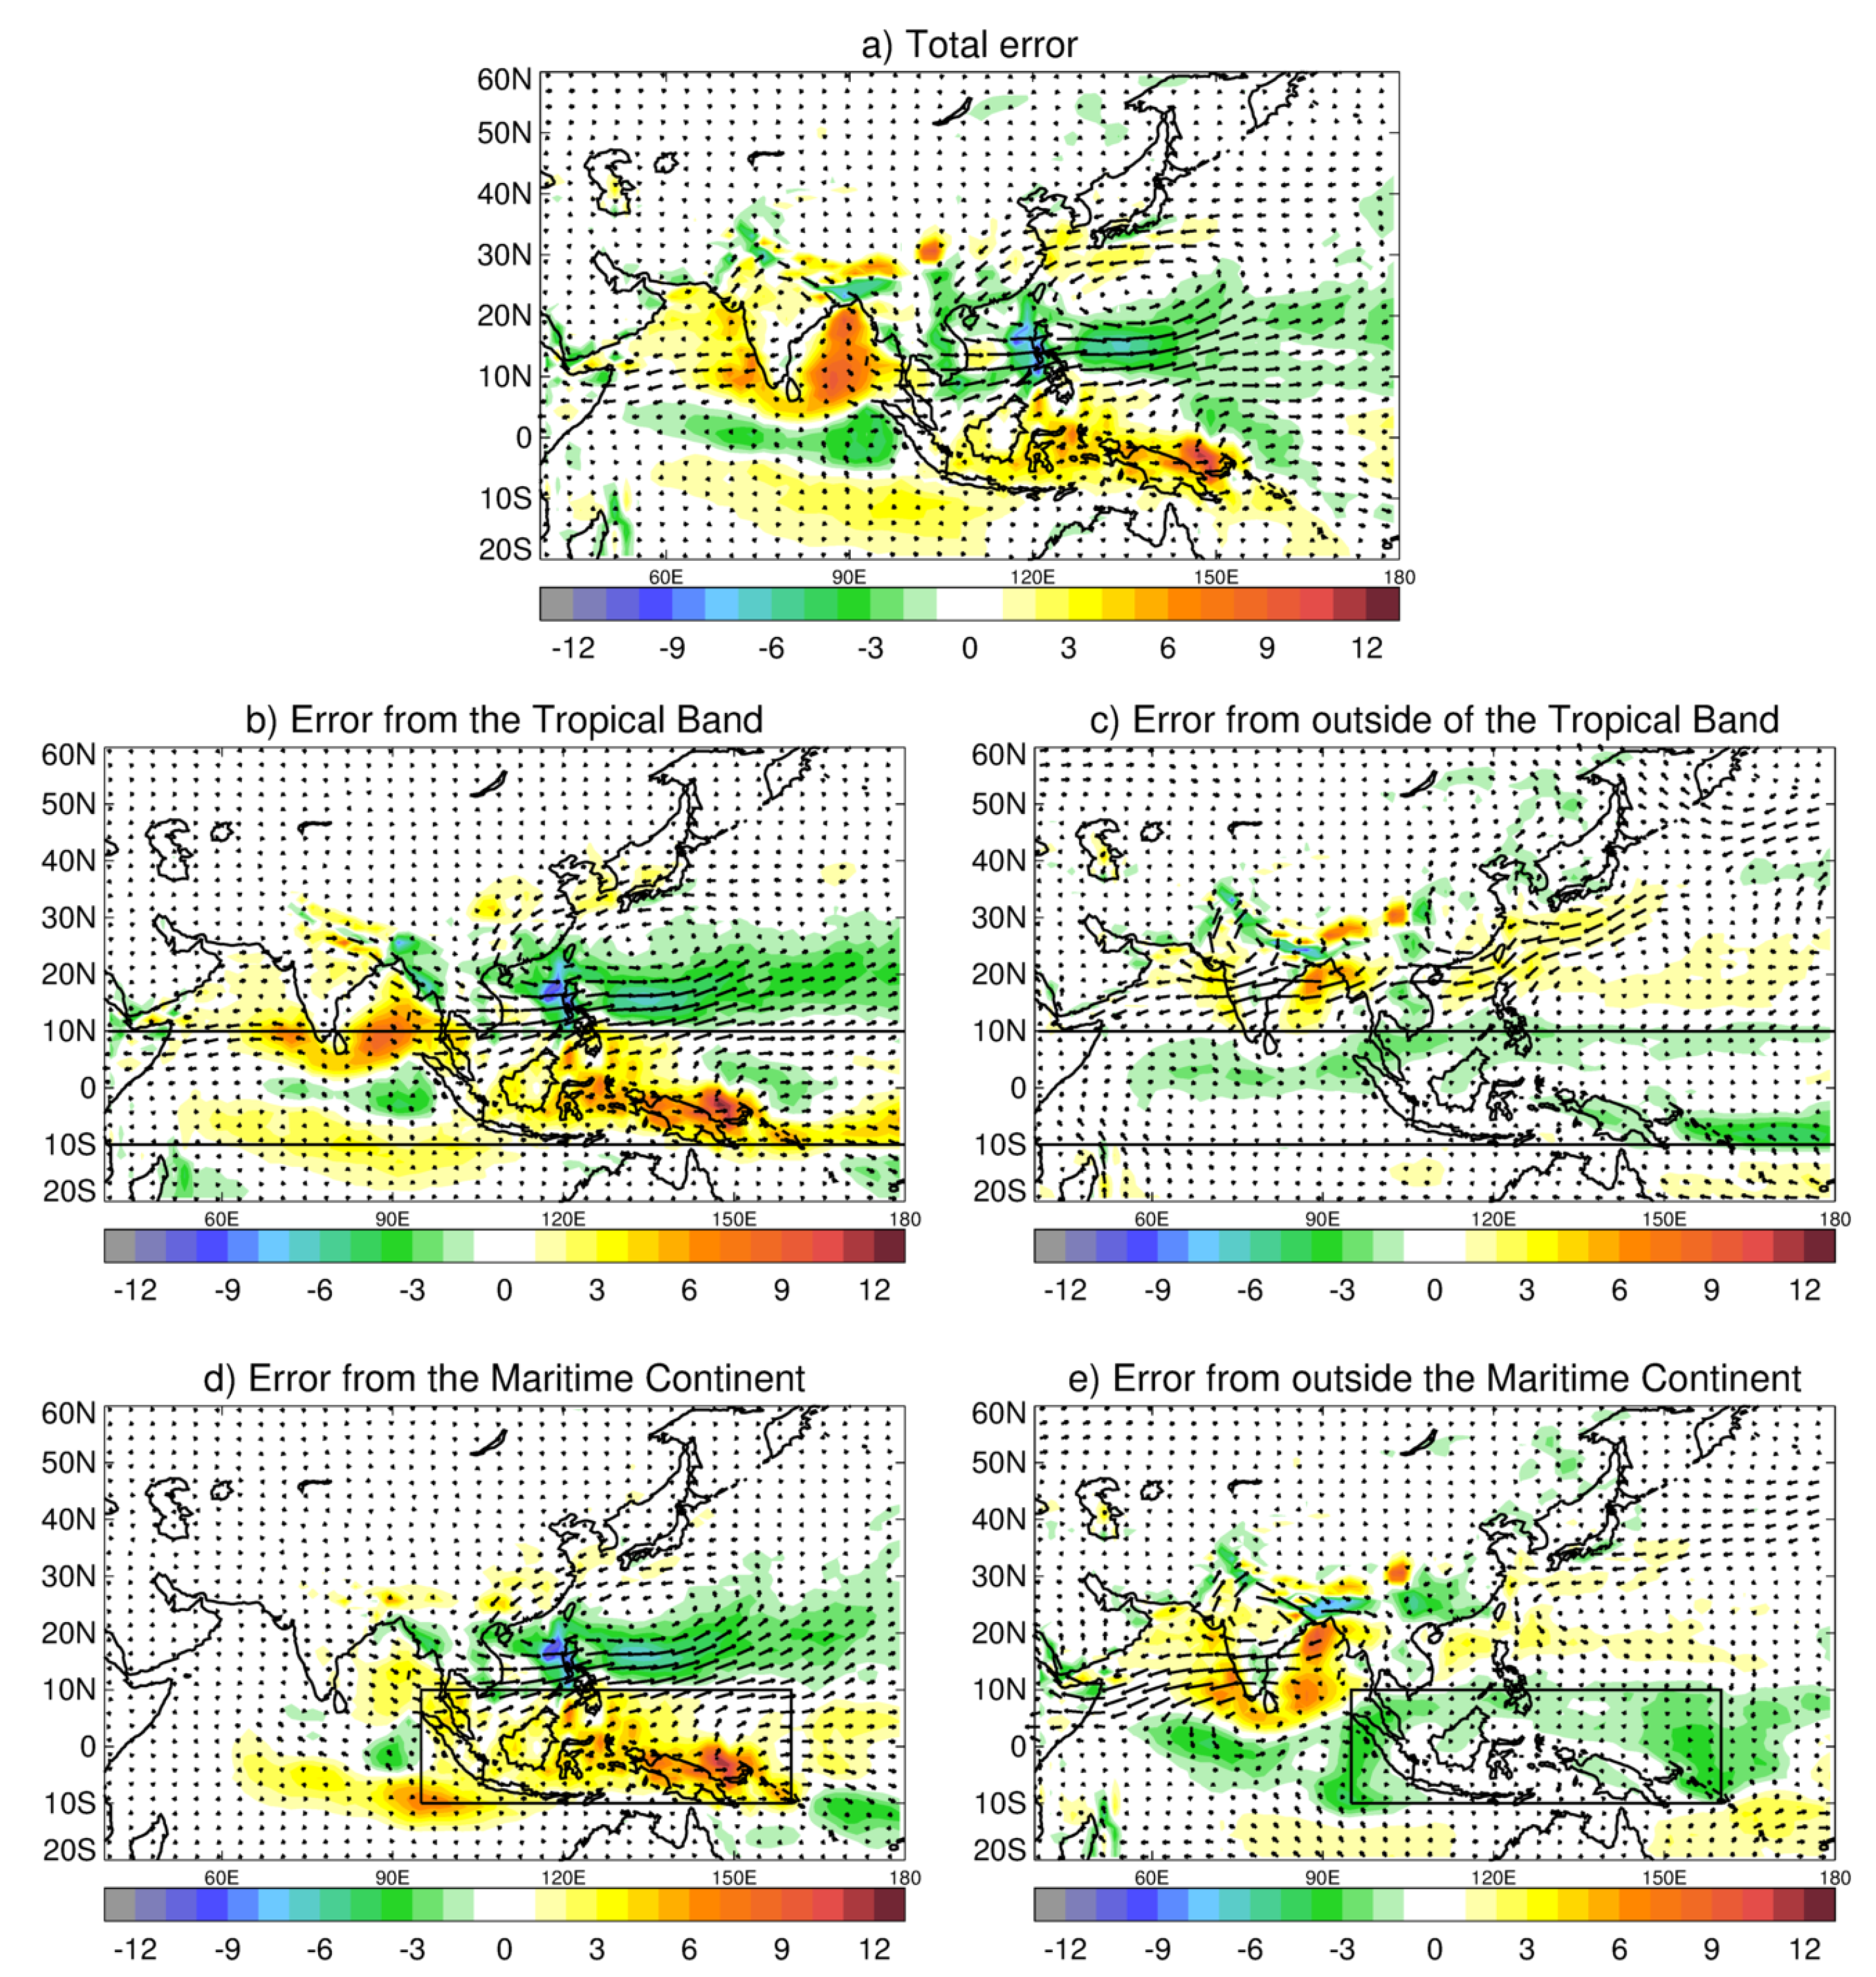
The combination of the free run (A), globally nudged (B) and MC nudged runs (C) allows us to split the total mean error into contributions from the Maritime Continent and everywhere else following [33]:
  • Total Mean Error = A − B,
  • Mean error originating from MC = A − C,
  • Mean error originating from outside MC = C − B.
On day 1, the contribution of the MC to the total error is mostly confined to the MC region as expected, but even by day 3 of the NWP forecasts the MC errors are responsible for forcing mean errors beyond the nudged region, such as the excessive westerly monsoon flow across the bay of Bengal, Southeast Asia, South China Sea and out into the western Pacific (Figure 2f–i). On day 5, a northward component to the flow develops and, by day 15, there is a distinct cyclonic circulation in the west Pacific that explains a large proportion of the total mean error. For completeness, we also show the contribution to the total error from the areas outside the MC nudging domain (Figure 2j–m). A smaller area of erroneous cyclonic circulation in the Pacific occurs just south of Japan and appears by day 3, contributing to the overall cyclonic circulation errors. However, this non-MC error doesn’t grow much in later forecast ranges (days 5 and 15) where it is a smaller contribution to the total cyclonic error in the Pacific. In contrast, the anti-cyclonic errors over India and the Arabian Sea are not really forced from the MC and are probably more local to the India region or possibly forced from other regions than the MC.
A similar set of nudging experiments has been carried out in the AMIP-N96 simulations relaxing back to ERA-I re-analyses in this case rather than the MetUM analyses and also covering multi-annual periods from 1989 to 2007. The total error bears a strong resemblance to the day 15 NWP-N216 total error (Figure A1a vs. Figure 2e). The AMIP nudged runs also show the key contribution of the MC in forcing the excessive westerly Asian Monsoon flow out into the Pacific and the southern part of the cyclonic bias in the western Pacific. Again, the MC plays little role in forcing the mean errors over the India region and even nudging the full tropical band ( 10 N– 10 S—Figure A1b,c) shows that a large proportion of the biases over India are forced from outside the deep tropics and are either local in origin or forced remotely from the extra-tropics.
Finally, we consider the vertical structure of the model systematic errors in circulation and how they evolve with forecast range in height(pressure)-latitude cross sections (Figure 3) over the longitude region from 100 160 E (see Figure 2b for domain). MetUM analyses for 2016 (and ERA-I for 1989–2007—not shown) have the baroclinic structure of tropical easterlies aloft and westerlies in the lower troposphere ( 25 N– 15 S) flanked by the subtropical-jets in both hemispheres. The wind vectors are the mean meridional circulation traced by the v- ω winds and show the broad region of rising air from the 5 S to 30 N and descent over 20 S– 30 S associated with the thermally direct Hadley circulation over these longitudes.
The evolution of the mean errors in these circulation features from days 1–5, 6–10 and 11–15 of the NWP-N216 forecast runs is shown in Figure 3b–d. On days 1–5, the largest error is a region of erroneous descent over the equator and large easterly biases in the upper troposphere above 200 hPa, a westerly bias in the tropical mid-troposphere and easterly bias in the tropical boundary layer. The excessive descent is due to the rapid collapse of precipitation, diabatic heating, and vertical ascent over the MC region in the very earliest stages of the NWP forecasts, which can also be inferred from the excessive erroneous moisture divergence over the MC islands in Figure 2. In addition, it is evident that a westerly bias centred at 15 N and peaking between 850 hPa and 600 hPa and correlates with the excessive westerly Asian Monsoon in the western Pacific region. On days 6–10, these errors have evolved and the region of descent has broadened to reach 15 S and, by days 11–15, we also have erroneous ascent at 20 N, which is connected to the equatorial descent as a large thermally direct circulation error. The AMIP-N96 error from the climate simulations bears a striking resemblance to the day 1–15 error, suggesting that the essential ingredients in forcing these errors are set up very early in the forecasts. The appearance of the largest errors over the equatorial MC region in the early forecast stages, and subsequent northward propagation suggests the MC is a key player in these circulation errors at both NWP and climate timescales. This is confirmed for the NWP timescale by using the nudged runs to compare the total mean error at days 11–15 (Figure 3b) to the contribution that comes solely from the MC (Figure 3f). Clearly out to 20 N, the forcing of the erroneous direct Hadley circulation with ascent at 20 N and descent at the equator can largely be explained by errors originating from the MC.
Thus far, in trying to study the growth of zonal-mean wind errors, we have shown mean circulation biases (as in Figure 3), but clearly a more detailed examination of the time-mean zonal-momentum budget is required. Such budget includes, in addition to mean circulations (Hadley and Walker), contributions from the longitudinal pressure gradient, the Coriolis term, transports by transient eddies, transport by stationary eddies and frictional dissipation [36,37]. This will be the topic of a future paper. Having analyzed the mean-state circulation and atmospheric moisture transports associated with the EASM, we present, in the next section. their response to changes in one of the main components of the EASM, the WPSH.

3.2. Interannual Variability of the WPSH

The location and intensity of the WPSH are crucial components of the East Asian summer monsoon and act to modulate the monsoon seasonal evolution [10,38]. In AMIP-N96, as in many models, the seasonal mean WPSH is too weak and located too far east [39], and we have shown, using nudging methodology, that some of this mean-state bias is forced by tropical biases originating over the MC, possibly in insufficient diabatic heating. To be more specific, we can use the 850 hPa geopotential height, Z 850 as a measure of the location and intensity of the WPSH [12]. 
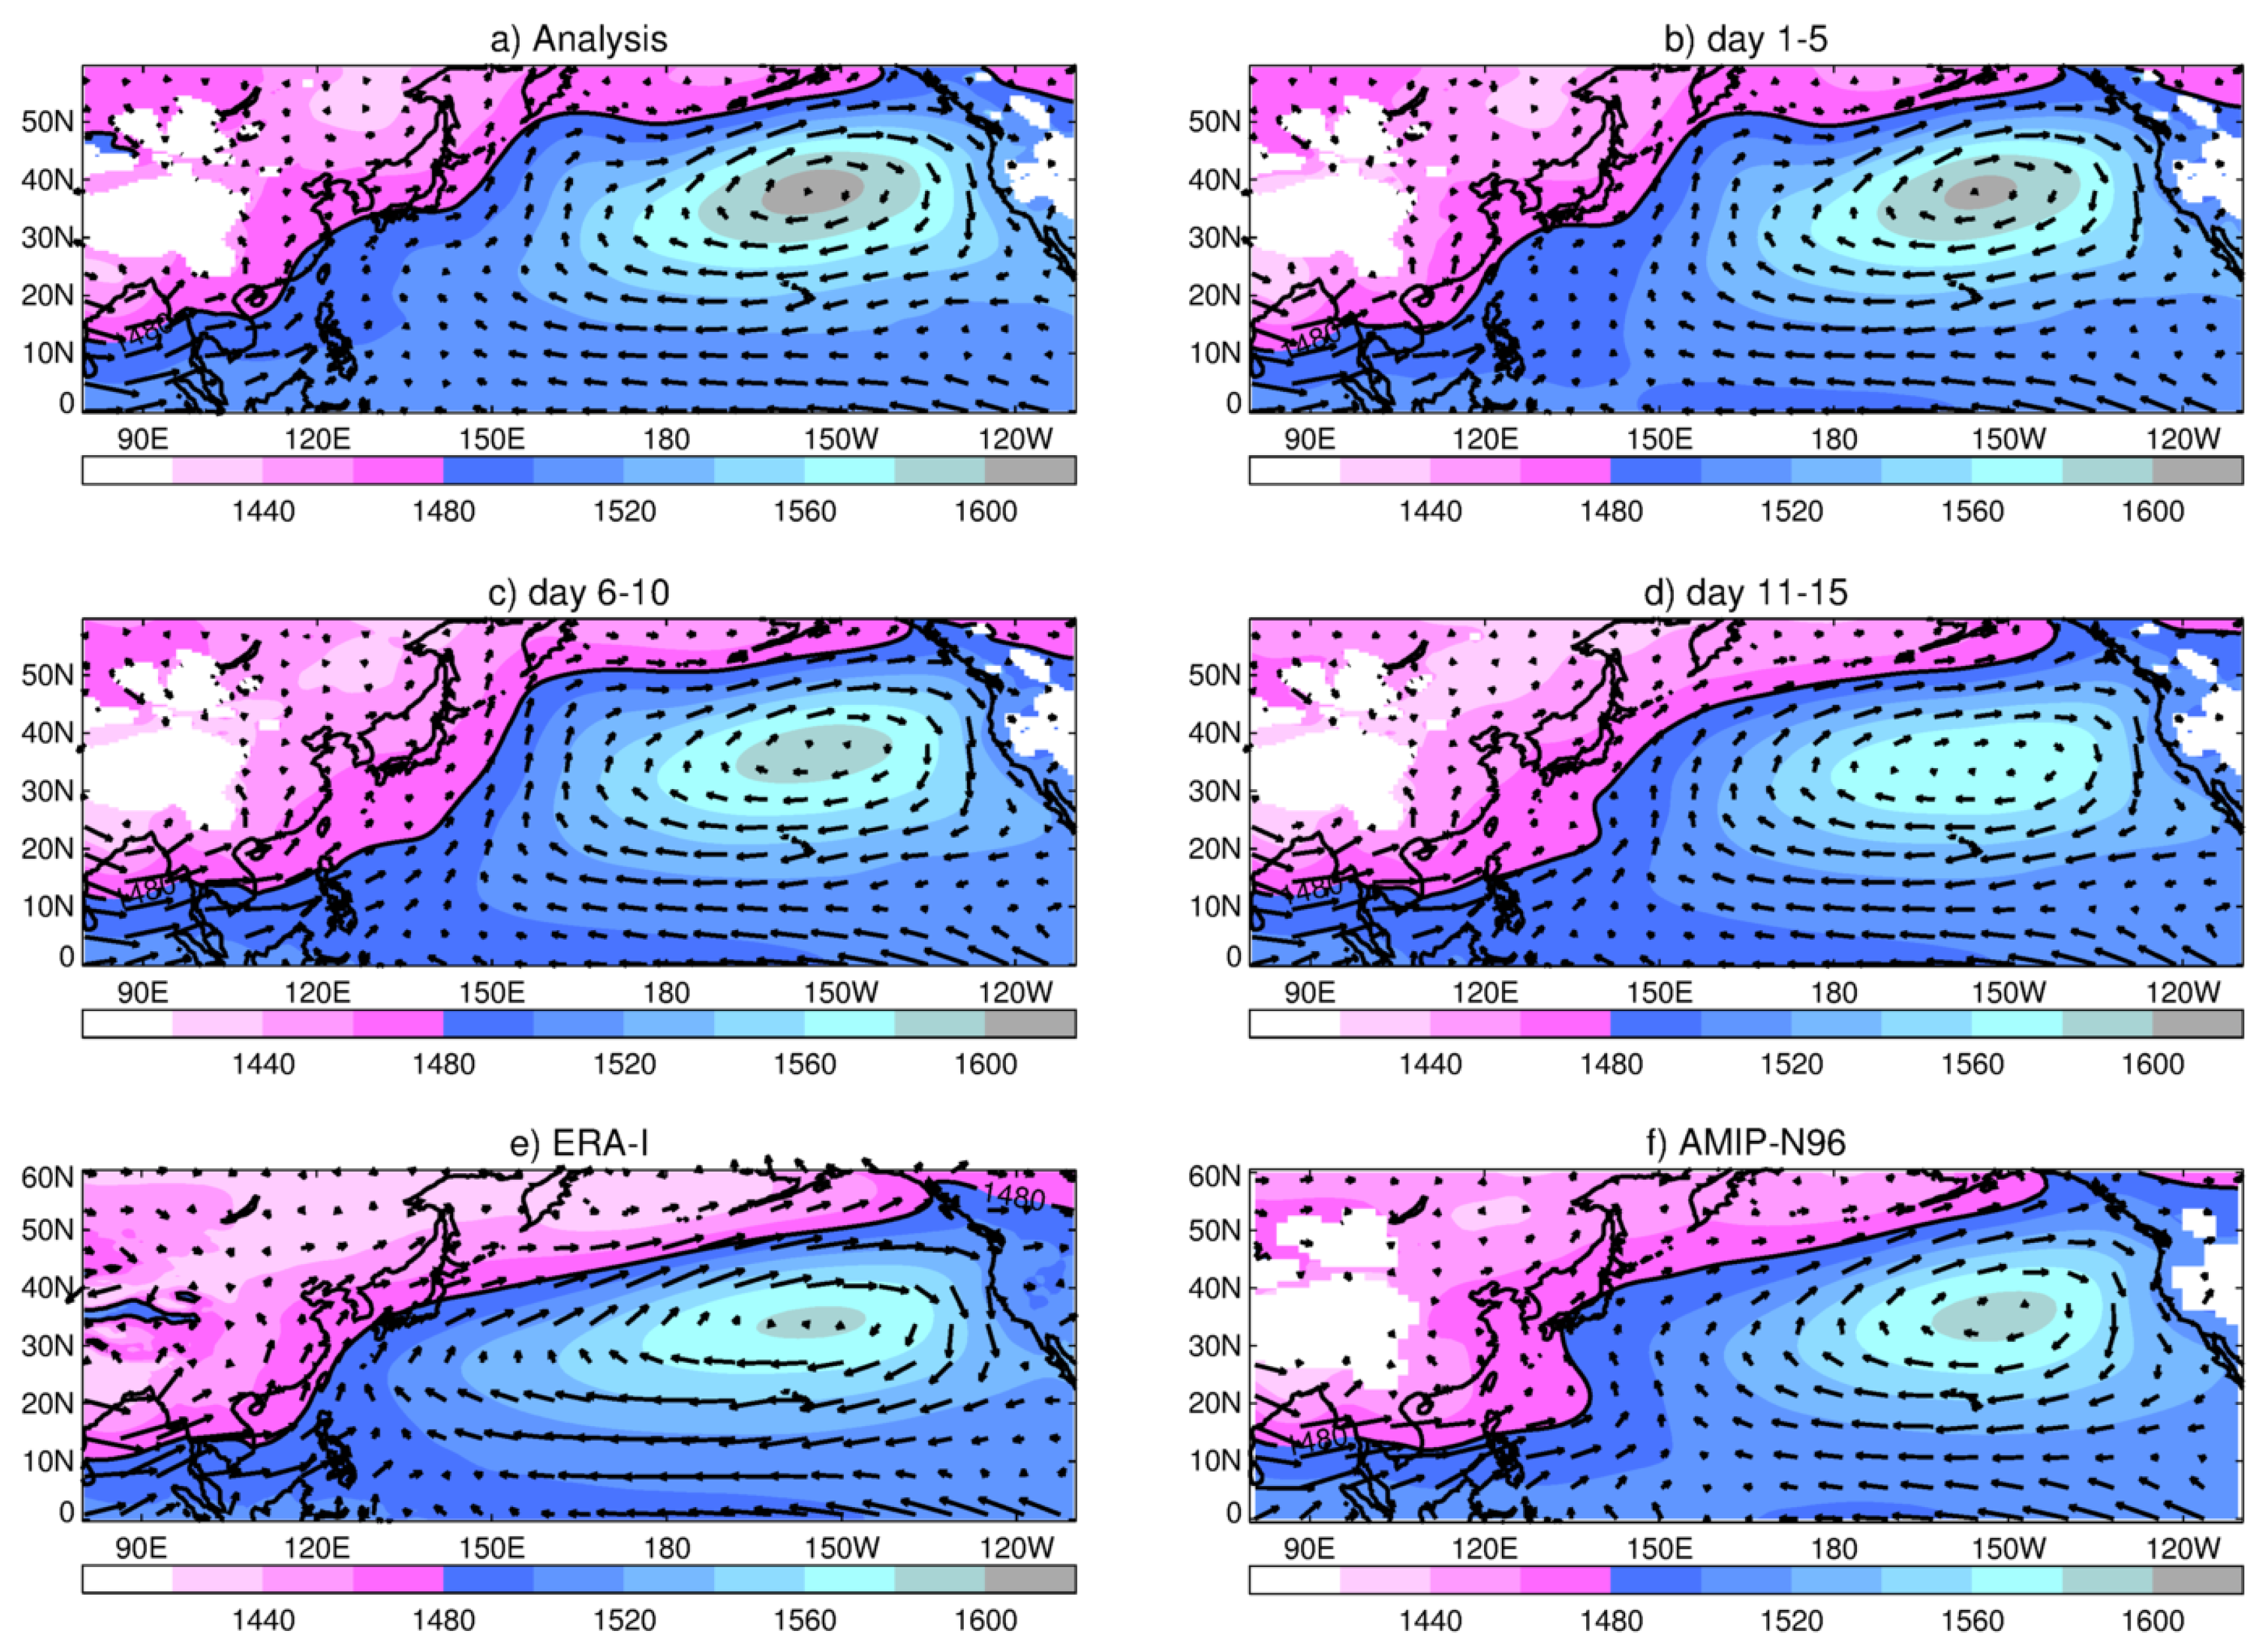
Figure 4a shows mean June–August 2016 Z 850 over East Asia and the West and Central Pacific in MetUM analysis. The centre of the climatological anticyclone is located at approximately 150 W, 40 N. In MetUM hindcasts, as the forecast lead time increases from 1 to 15 days (Figure 4b–d), the position of the high centre stays almost in the same place. However, the value of Z 850 at that central place (a measure of its intensity) decreases monotonically. That is, the WPSH becomes weaker. Using the 1480 m contour line between 180 E and 135 W as a measure of the WPSH northern extent [12], we see how, in the hindcasts, it moves south as the forecast lead time increases. Simultaneously, the westward extent moves east (see, for example, the 1480 m contour line in the region 120–150 E). This is most noticeable in the tropical Pacific, where a strong westerly wind pushes the Z 850 1480 m border deep into the West Pacific (Figure 4d). These errors are consistent with the long-time systematic error seen in the AMIP-N96 model (Figure 4f). For comparison, the long-term mean Z 850 for ERA-I is shown in Figure 4e. This shows a significant northward flow over China on the westward flank of the WPSH, which becomes much weaker in NWP hindcasts as lead forecast time increases, and in the AMIP simulation.
To objectively compare the representation of WPSH in analysis and model simulations, we use three indices, I IN , I W and I N , following [4] and [12]. They represent, respectively, the intensity, the westward extension and northern edge of the WPSH. The indices defined in the above references have been modified slightly in this work, to accommodate to model simulation biases in their representation of the WPSH. I IN is defined as the regional average value of geopotential height at 850 hPa on points where it is greater than 1480 m, over the target region 115 –170 E, 15 –25 N. To measure I W , the geopotential height values over the target region are subtracted by I IN . Then, I W is defined as the longitude of the westward extension of 0 contours of the subtracted field. The north extension, I N , is defined as the latitude of the WPSH ridge position, where the ridge is defined by points on which the zonal wind, u, at middle level (500 hPa) satisfies u = 0 , and u y > 0 , over the region 107 –140 E, 10 –40 N.
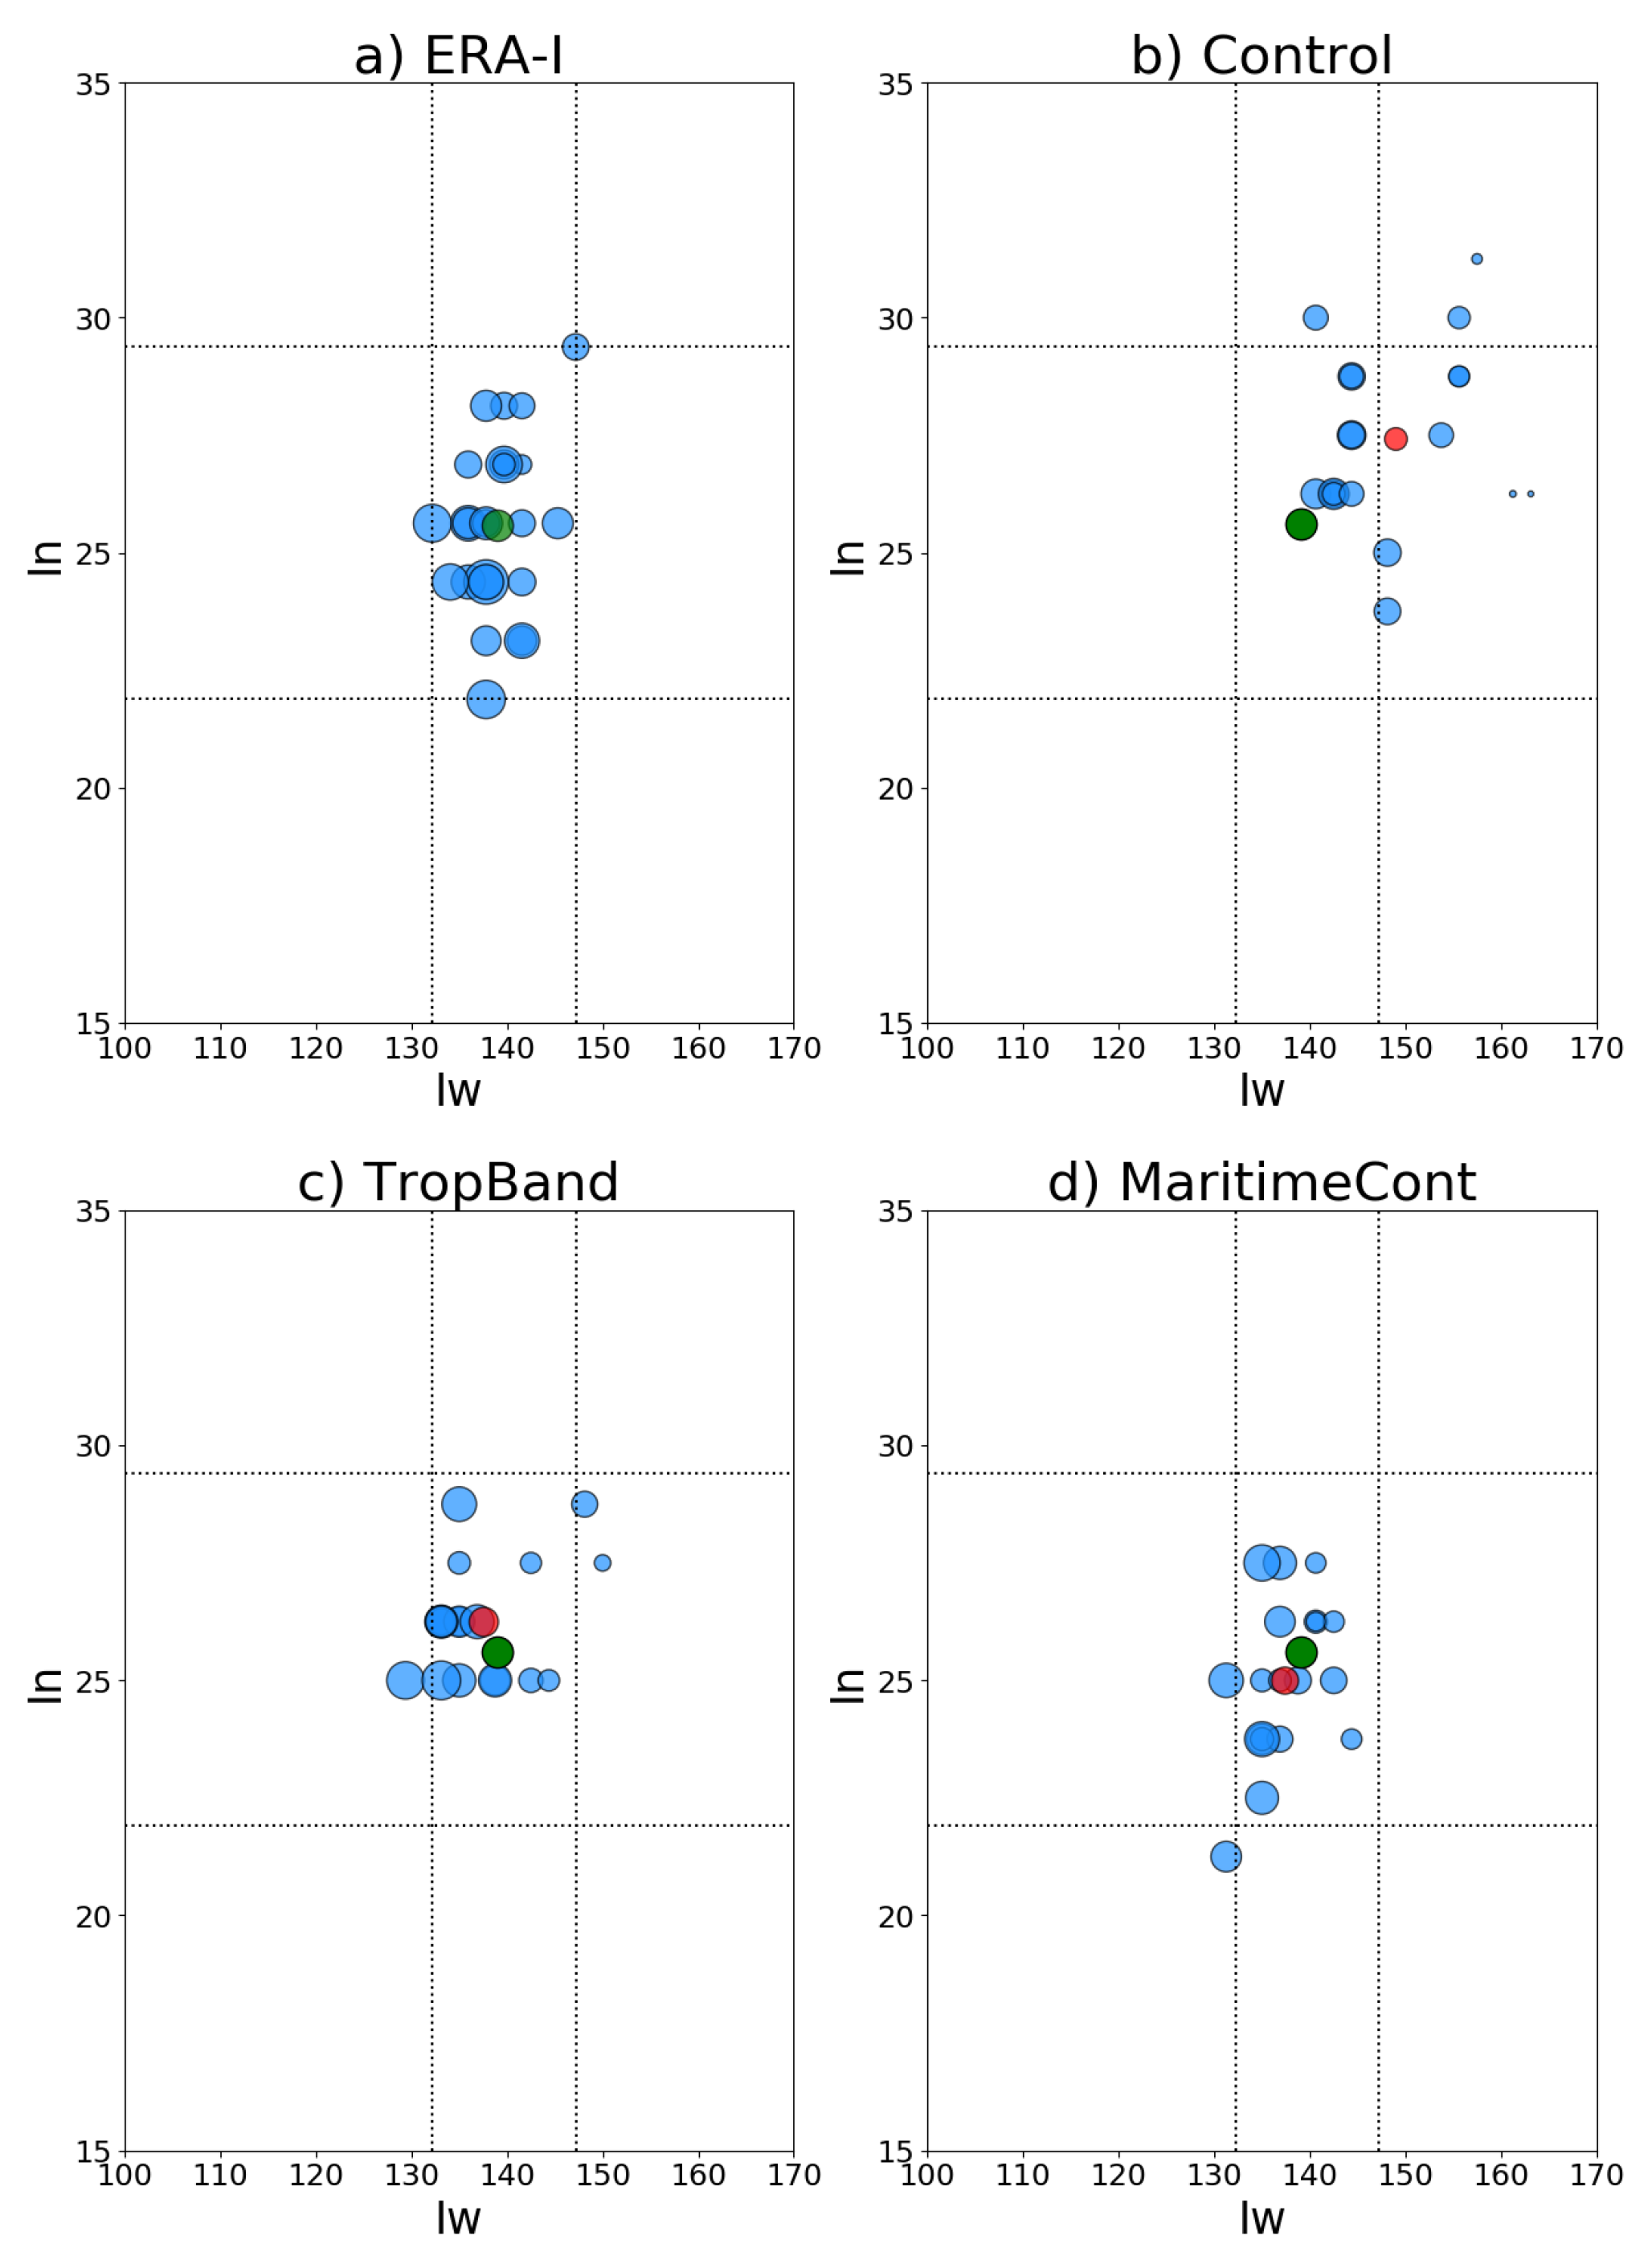
Figure 5 displays the interannual variability of summer WPSH intensity, its westward extension and northern edge, measured as scatter plots of the corresponding indices for ERA-I, AMIP-N96 and several nudging simulations. In ERA-I (Figure 5a), the westward extension of the WPSH is confined to the region between 132 E and 147 E, while the northern edge is restricted to the region between 22 N and 29 N (this is indicated by the dotted lines in all panels of Figure 5). Compared to ERA-I, the WPSH interannual variability in AMIP-N96 (Figure 5b) shows a different structure. It is weaker, tends to be located further east and north, and its location varies more year on year. The differences between model simulations and observations can be summarized by their climatological (1982–2007) means, represented in Figure 5b–d by the red (AMIP-N96) and green (ERA-I) dots.
Figure 5 also shows WPSH variability for two nudging experiments, the tropical band region and the Maritime Continent domain (Figure 5c,d). A better representation of the WPSH variability is achieved when each of those regions are nudged (Figure 5c,d. The WPSH tends in those cases to be weaker than in ERA-I, but its location and variability are in better agreement with their ERA-I’s counterparts. Improvements in the representation of the WPSH when the Maritime Continent region is nudged suggest that such region also plays a role remotely forcing the model circulation errors associated with the WPSH.

3.2.1. Moisture Transport Response to the WPSH Variability

To study the effect of summer WPSH variability in the East Asian regional hydrological cycle, we analyse atmospheric moisture fluxes in the region and perform land water budgets. We consider the impact of the WPSH intensity, westward extension and northward edge interannual variability using composites of moisture flux fields, Q , and water cycle components. The composites have been created by collecting and meaning field values over years on which positive and negative WPSH index anomalies exceed the 30th percentile. Those composites are denoted hereafter by I IN , I IN + , I N , I N + , I W and I W + , where the subindices indicate the WPSH index they are associated with. Table 1 shows the years used in making up the various composites. In general, WPSH shifts in AMIP-N96 do not occur in the same years as in ERA-I case. This is expected for long-term free-run climate simulations, and suggests that the changes in the WPSH are not entirely driven by sea surface temperatures.
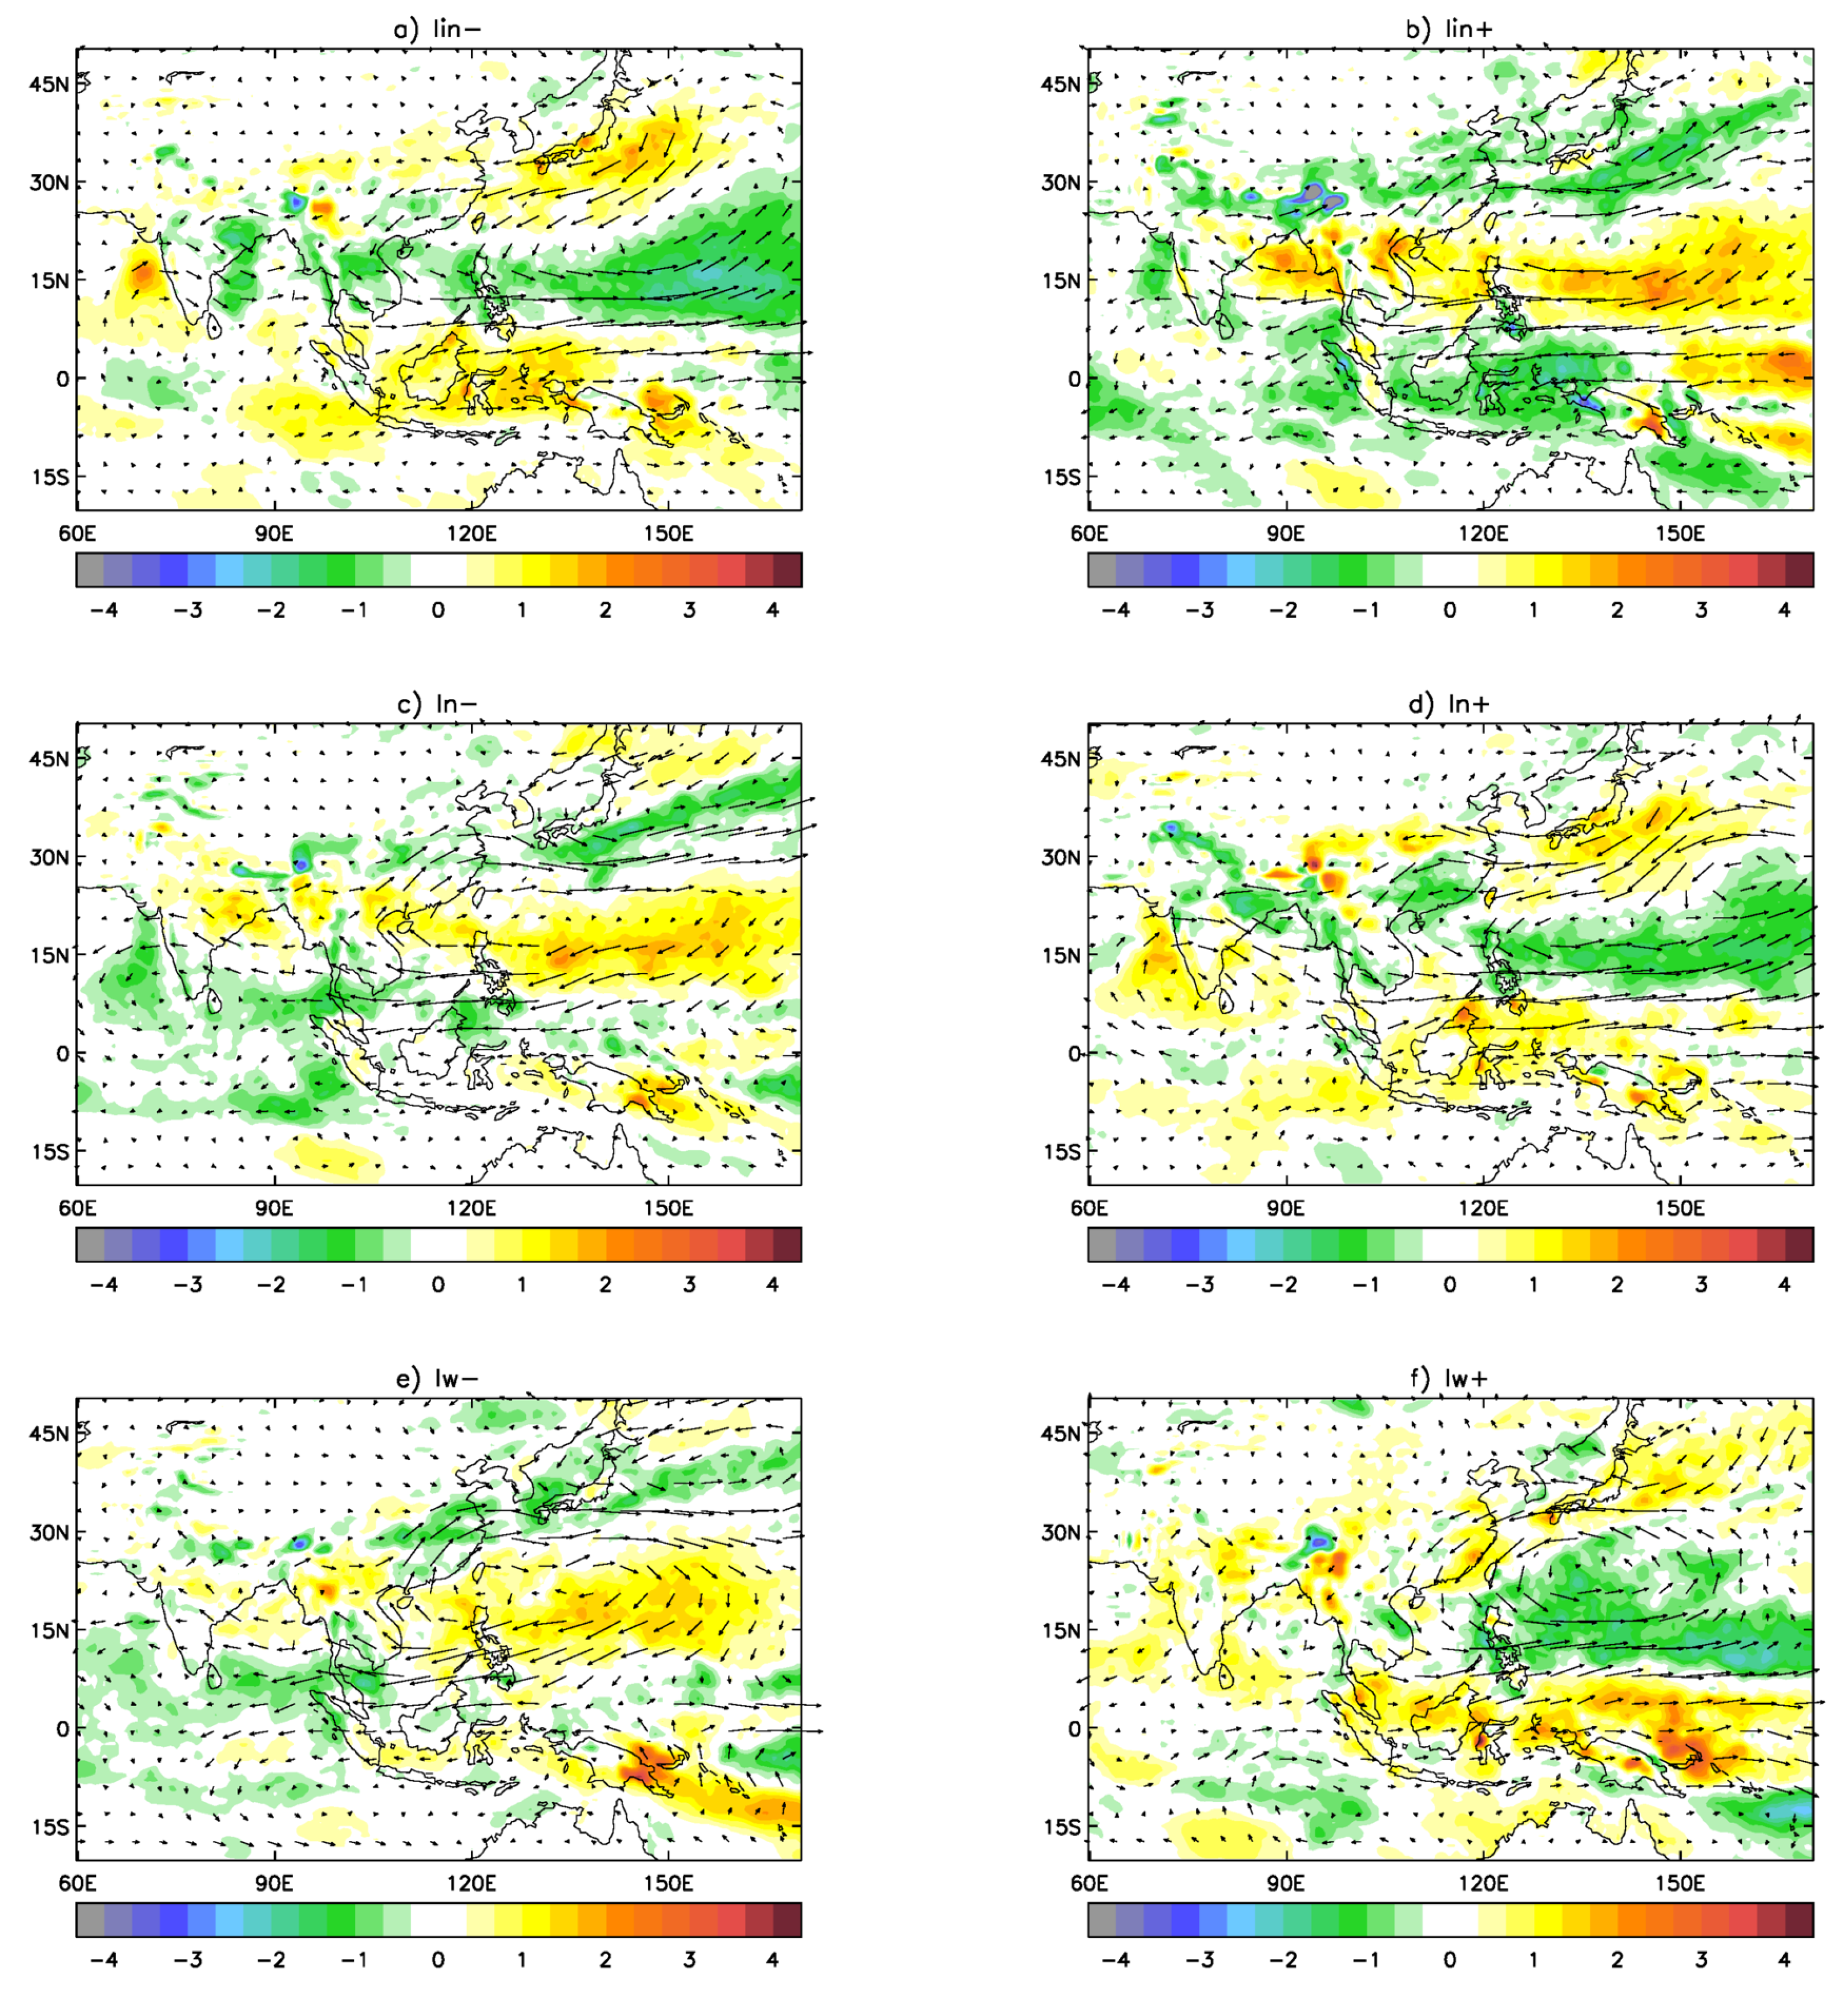
Changes in moisture transport and moisture convergence (relative to the mean state), associated with various ERA-I composites are shown in Figure 6. The intensification of the WPSH ( I IN + composites, Figure 6b), is manifested as an anomalous flow that enhances moisture convergence in a band centred at about 30 N that includes the Yangtze River basin in China and continues in the Western Pacific, South of Japan, to the international date line. It also causes a reduction of moisture convergence in a similar band, south of the previous band (especially in the West Pacific from 130 E to 160 E). On the other hand, a weakening of the WPSH (Figure 6a) causes similar bands of increasing and decreasing moisture convergence, but, in reverse positions, bringing an increase of moisture convergence in Southern China and a reduction in North East China, Japan and its neighbouring seas.
When the WPSH moves south of its climatological value ( I N composites, Figure 6c), it produces an anticyclonic anomalous moisture flow centred in the South China Sea, which is analogous to the case of intensification of the WPSH and, together with a northeasterly moisture flow from the North Pacific, causes similar bands of increased and reduced moisture convergence. The similarities in the moisture transport response to intensity and North–South shifts of the WPSH suggests that they are not independent. This is indeed the case; the timeseries of intensity and northern edge indices, I IN and I N , are strongly anticorrelated in ERA-I (Pearson’s coefficient of −0.64).
A westward displacement of the WPSH ( I W composites, Figure 6e) produces an anomalous anticyclonic moisture transport which increases the northward moisture flux at South China Sea and creates moisture convergence in South and East China, the Korean Peninsula, Japan and the North Pacific. It also decreases moisture convergence in the West Pacific (in a band from 10 N to 20 N). Conversely, when the WPSH moves eastwards (Figure 6f), an anomalous cyclonic moisture transport in the area occurs, which drastically increases moisture convergence in the West Pacific. This response to an eastward shift of the WPSH, as expected, looks similar to the long-term mean moisture transport error in AMIP simulations.
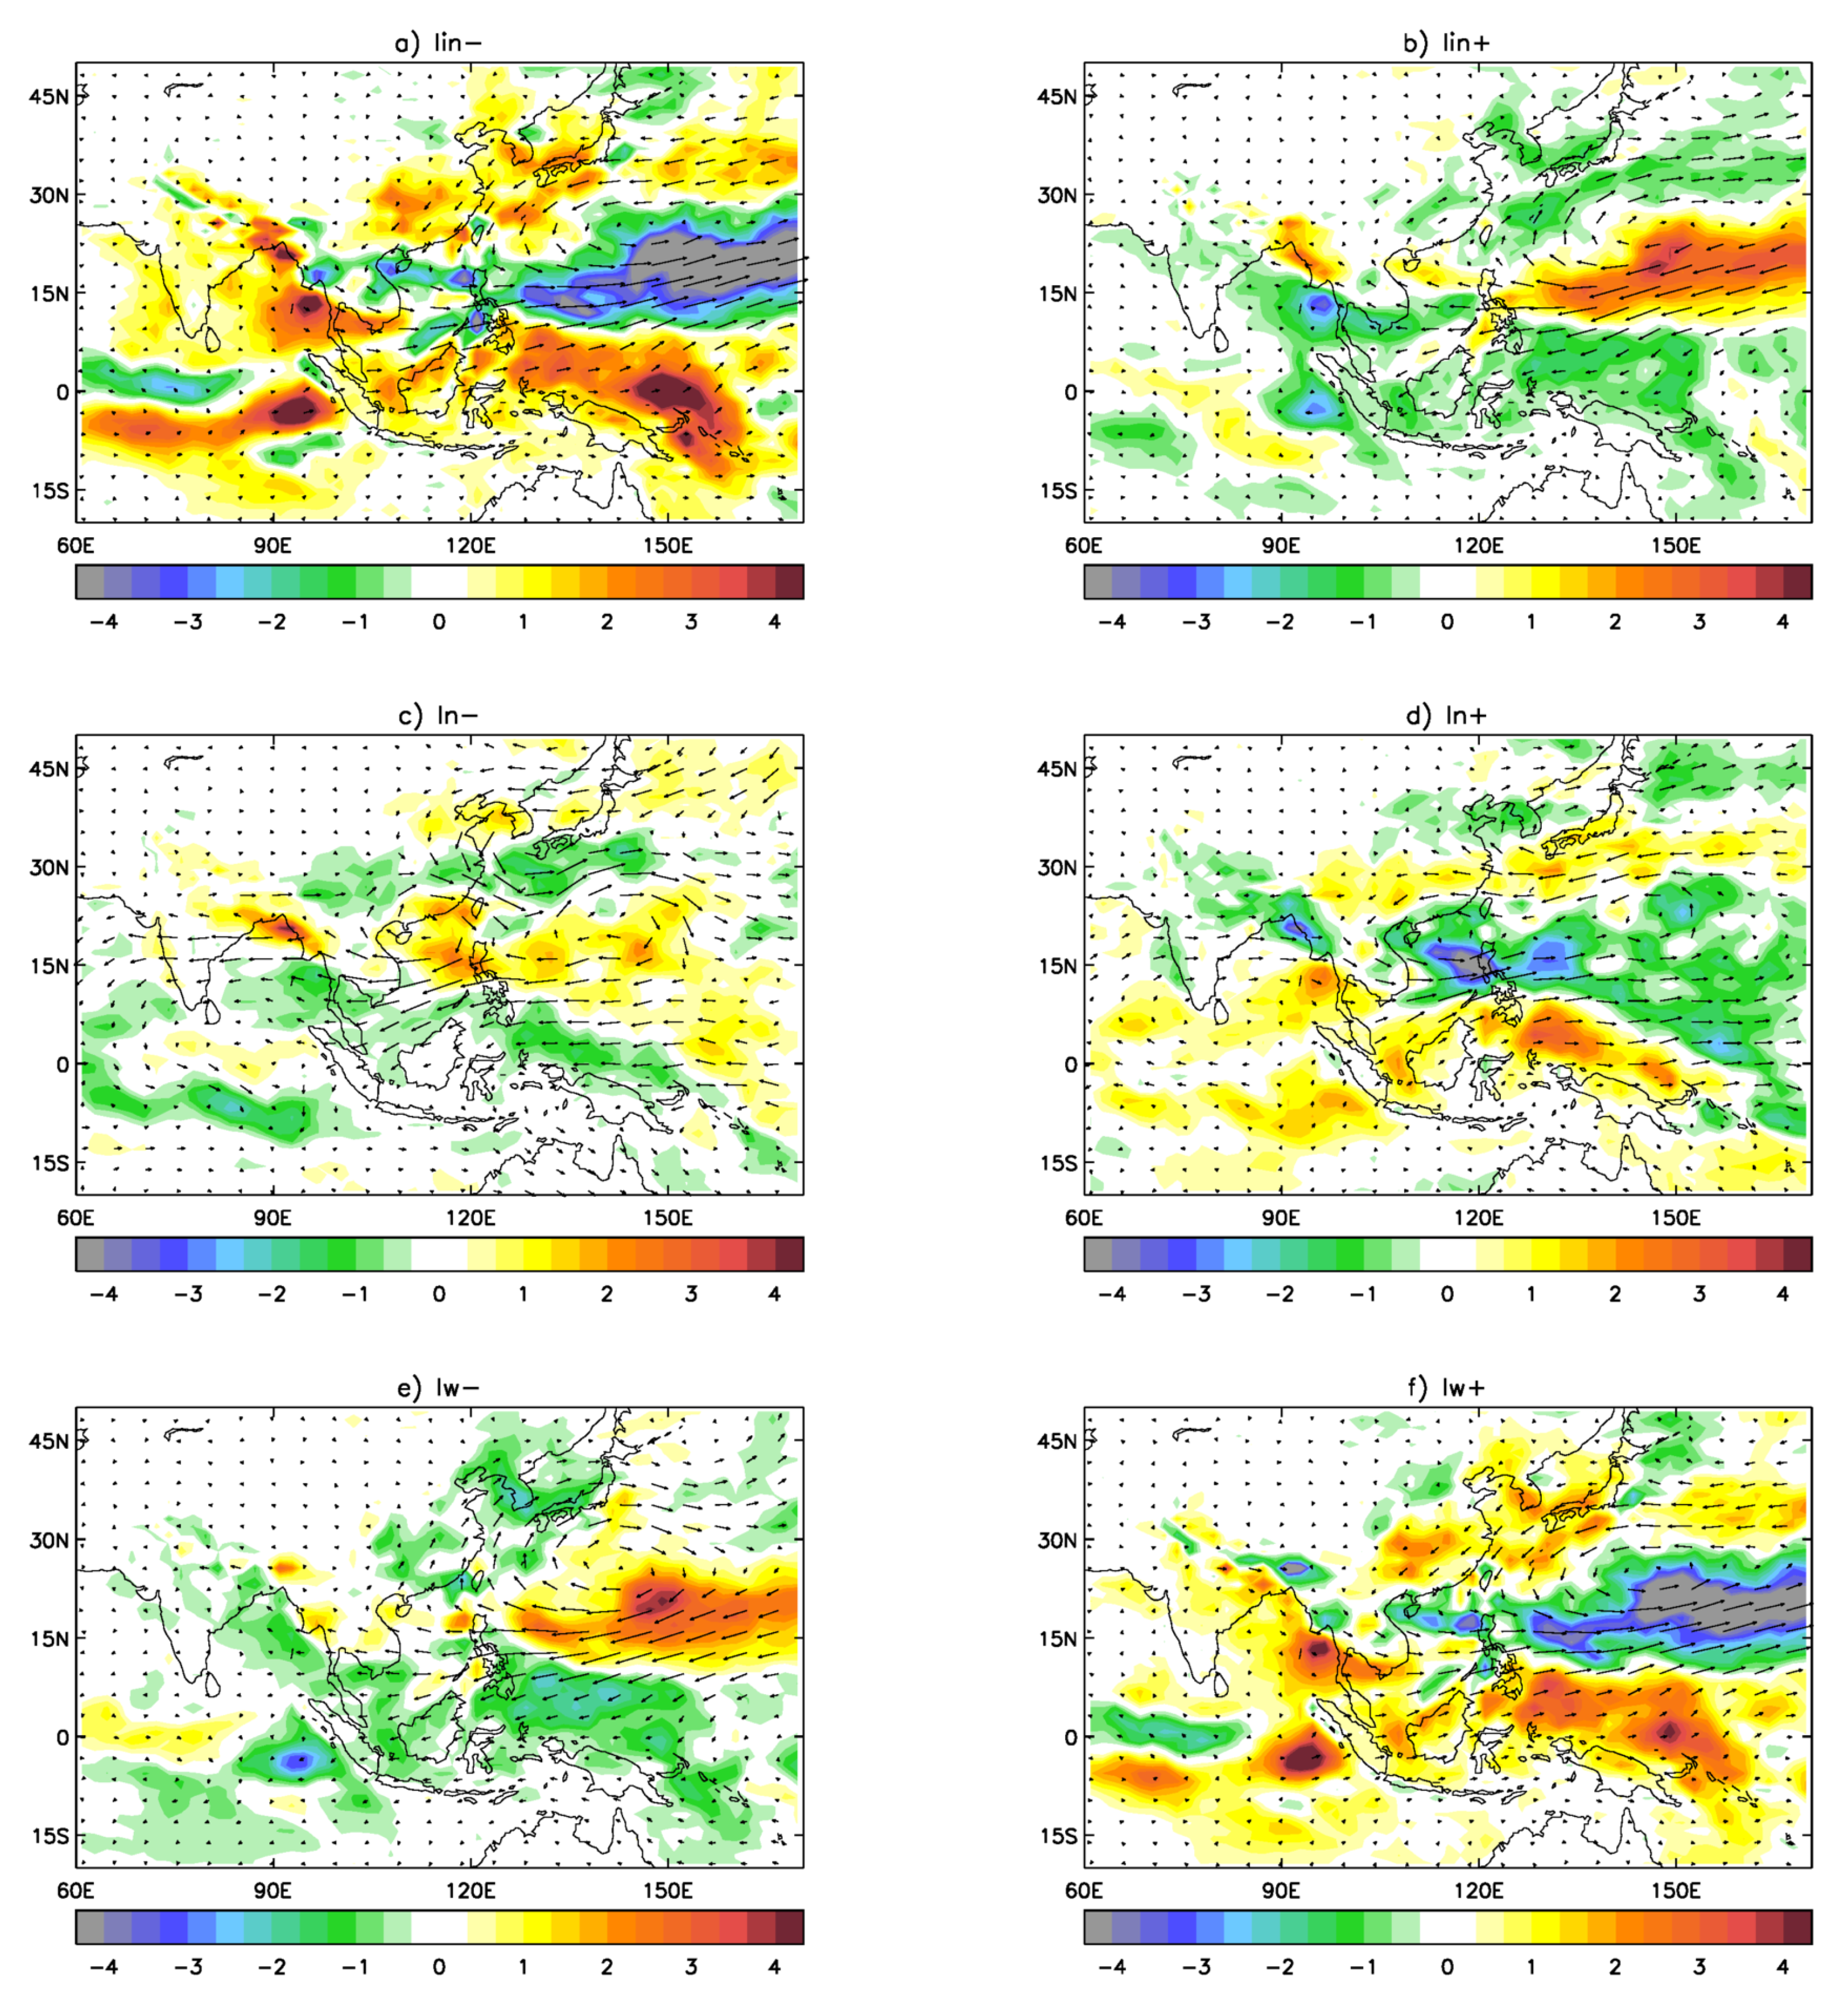
We now analyse changes in atmospheric moisture transports in AMIP-N96 as a response to shifts in the WPSH. The anomalous anticyclonic moisture flux associated with the intensification of the WPSH (Figure 7b) is located further east, compared with the equivalent in ERA-I. It still produces contiguous bands of enhancement and decrease in moisture convergence with some similarity to the ones in ERA-I. However, the band of enhancement in moisture convergence is weaker in Easter China and stronger in the West Pacific. Moisture convergence decreases drastically in the West Pacific, south of 30 N. Differences between model simulations and ERA-I are more noticeable in the case of weakening of the WPSH (Figure 7a). In this case, AMIP-N96 shows a very strong increase of moisture divergence (drier conditions) in Southeast China, the Korean Peninsula, Japan and its surrounding seas, and an excessive enhancement of moisture convergence in the West Pacific, south of 30 N.
A southward displacement of the WPSH in AMIP-N96 (Figure 7c) brings changes in moisture convergence, which are similar to the ERA-I case. However, the further displacement east of the anomalous cyclonic moisture flux produces a stronger enhancement of moisture convergence in the Yangtze River basin and the West Pacific south of Japan.
In AMIP-N96, an anomalous anticyclonic moisture flux, similar to the one in the ERA-I case, is produced in the case of a westward shift of the WPSH (Figure 7e). However, its extension is smaller and it is located further east and north. This brings an increase of moisture convergence in East China, the Korean Peninsula and Japan similar to the one in ERA-I case, although somehow stronger and an enhancement of moisture divergence in the West Pacific, which is too excessive. What do these changes in atmospheric moisture transport mean for summer rainfall in specific areas in the East Asian region? To answer this question, we analyse changes in regional water budgets in the next section.

3.2.2. Changes in Regional Precipitation

Precipitation over a land region comes from three sources: moisture already present in the atmosphere, convergence of moisture transported into the region by atmospheric circulation and moisture supplied by local evaporation from the land surface (recycling of fallen precipitation). To study how these sources of East Asian precipitation are modified by changes in the WPSH, we calculate regional water budget components in three domains shown in Figure 8. We consider here the cases of intensification and westward displacement.
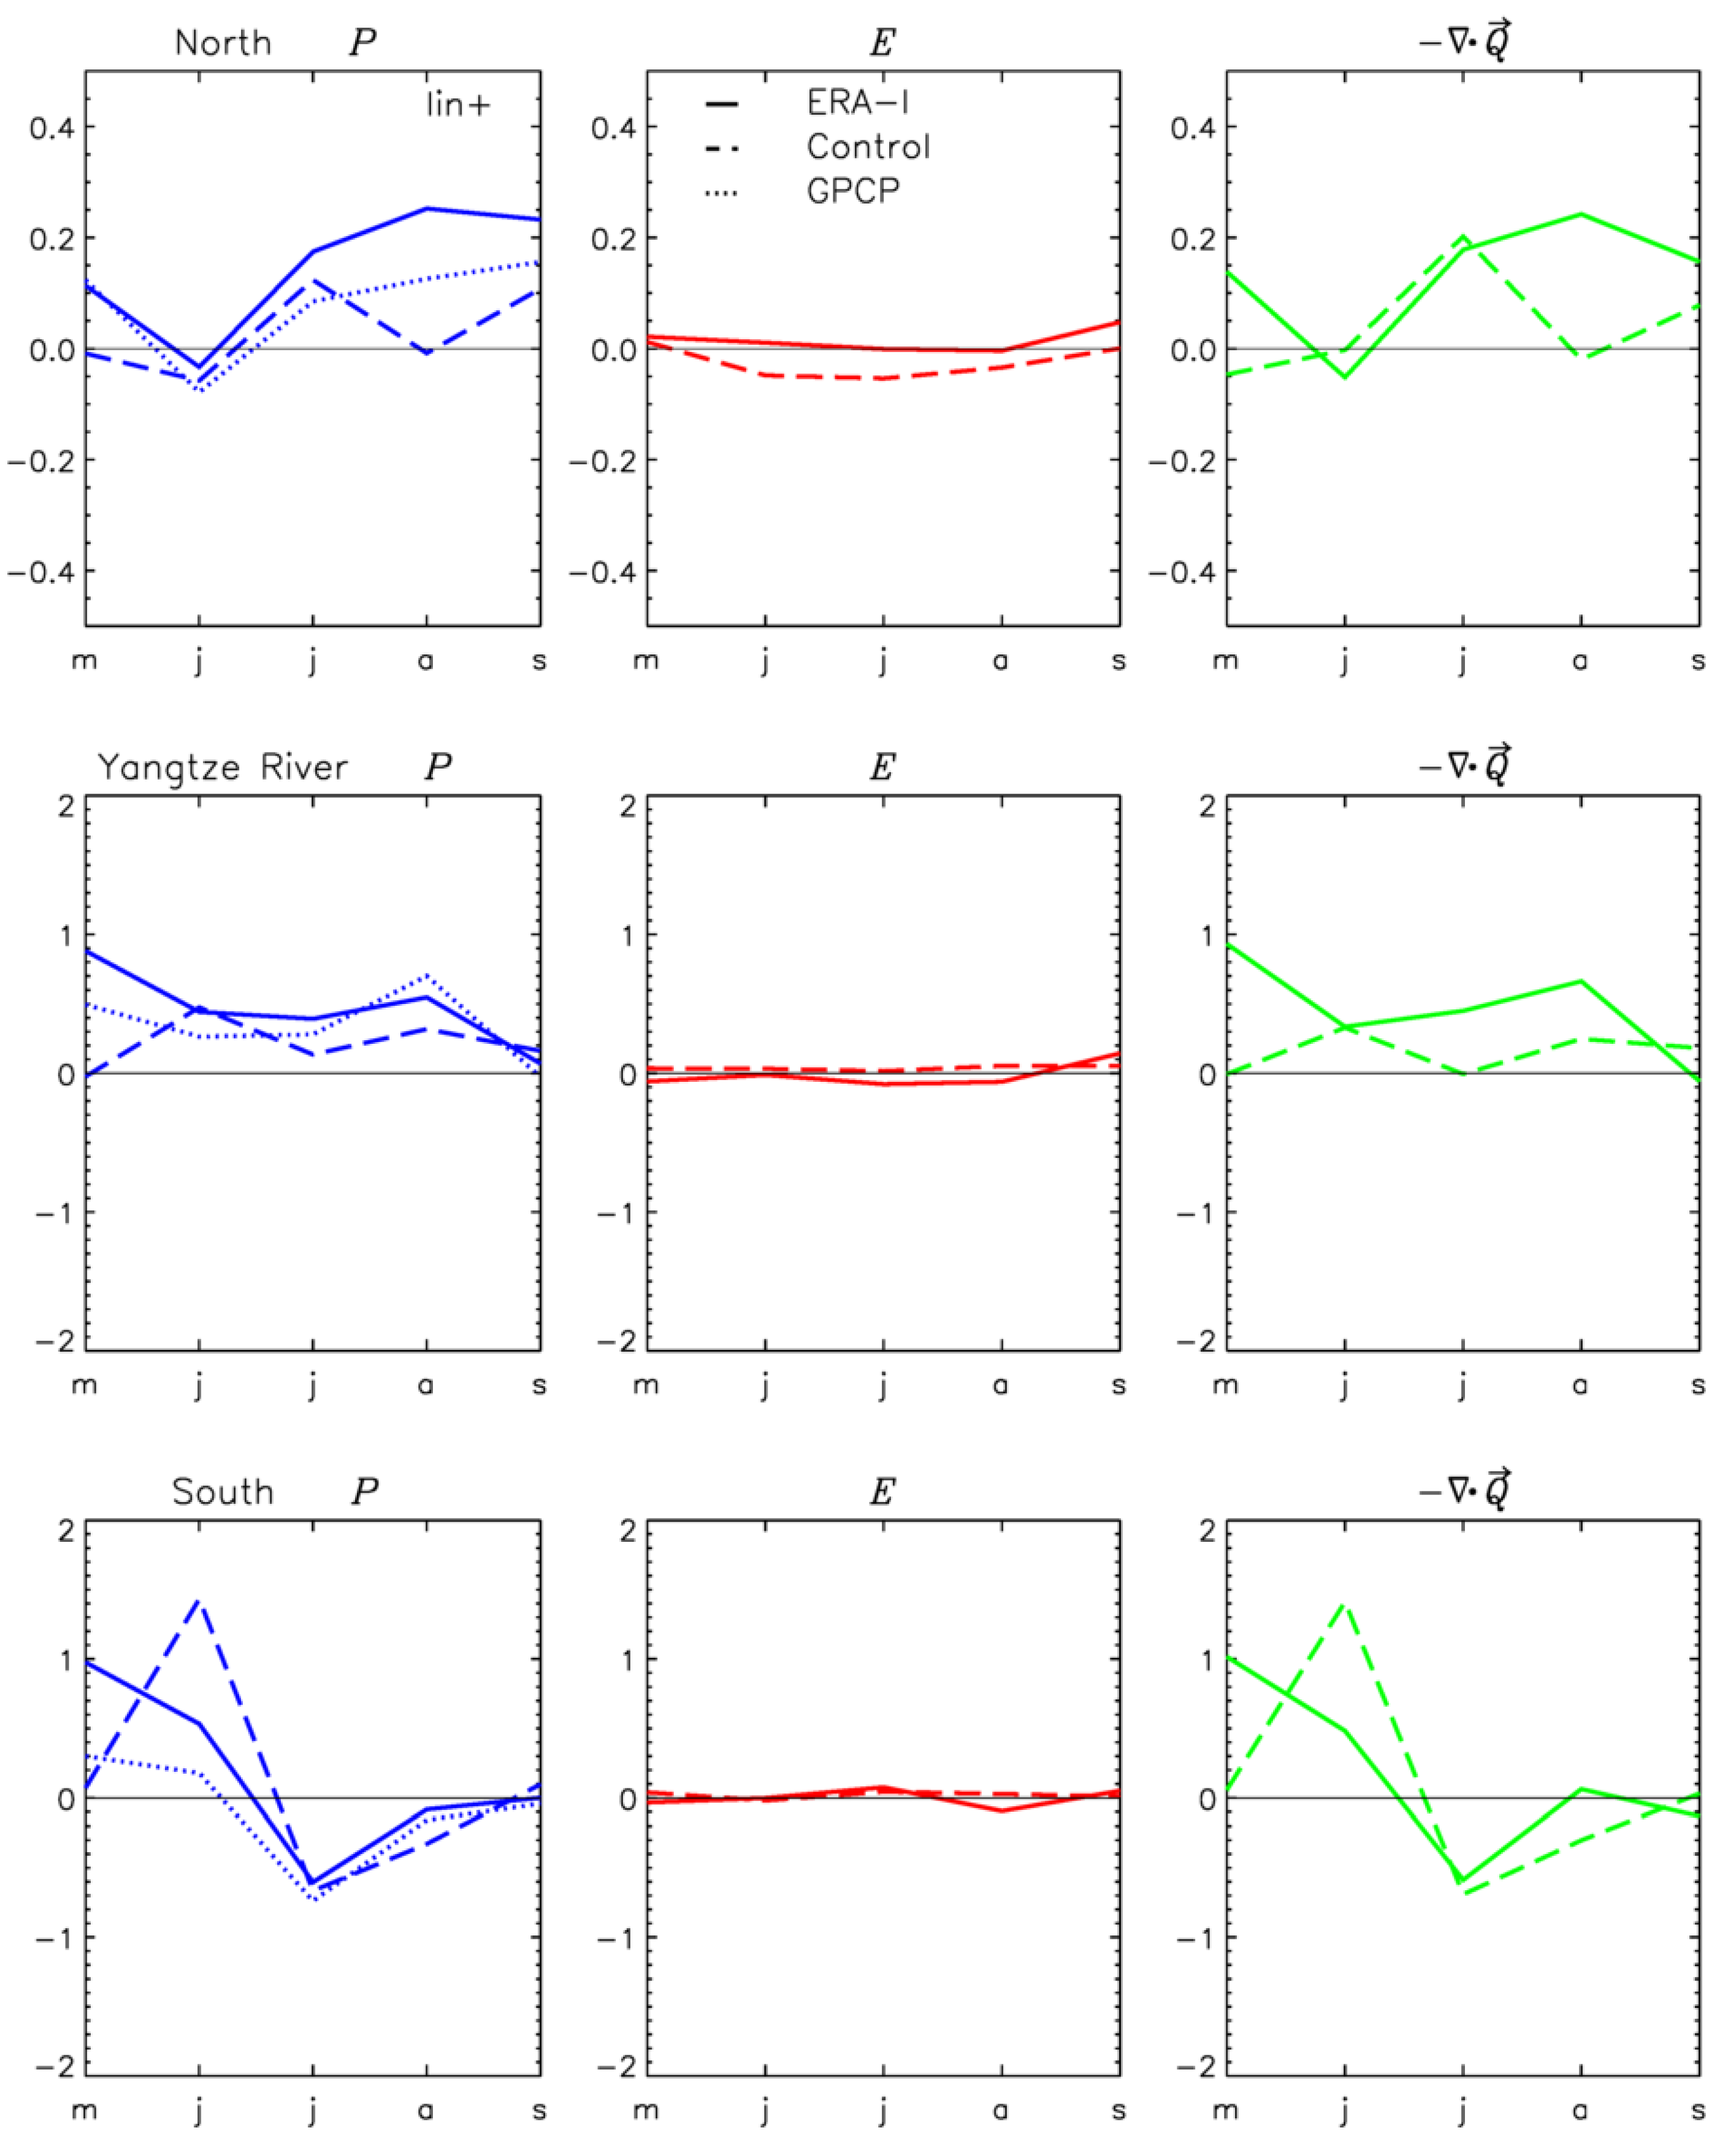
Figure 9 shows monthly changes in precipitation, evaporation and moisture convergence during the May–September season for composites associated with an intensification of the WPSH for ERA-I and AMIP-N96. Overall, moisture convergence is the dominant component and drives the monthly variability of precipitation. Intensification of the WPSH increases precipitation over the three domains and produces the following specific changes in ERA-I’s water budget components:
  • North domain (Figure 9, top panels): an increase in moisture convergence, which peaks in August and brings an increase in seasonal precipitation. There is only a small contribution from evaporation to the changes in rainfall. AMIP-N96 also shows an enhancement of moisture, but it peaks too early (July). In AMIP-N96, the contribution from local evaporation to the precipitation change is negative (reducing the increase in precipitation).
  • Yangtze River (Figure 9, middle panels): a seasonal-long enhancement of moisture convergence which increases summer precipitation. AMIP-N96 also shows the increase in moisture convergence, but it is smaller and generates less precipitation.
  • South domain: An increase of rainfall from May to mid June, followed by a rainfall reduction from mid-June to September, driven by similar changes in moisture convergence. This seasonal change in rainfall is relatively well represented in AMIP-N96, although the increase of precipitation in the first part of the season is too large in the model.
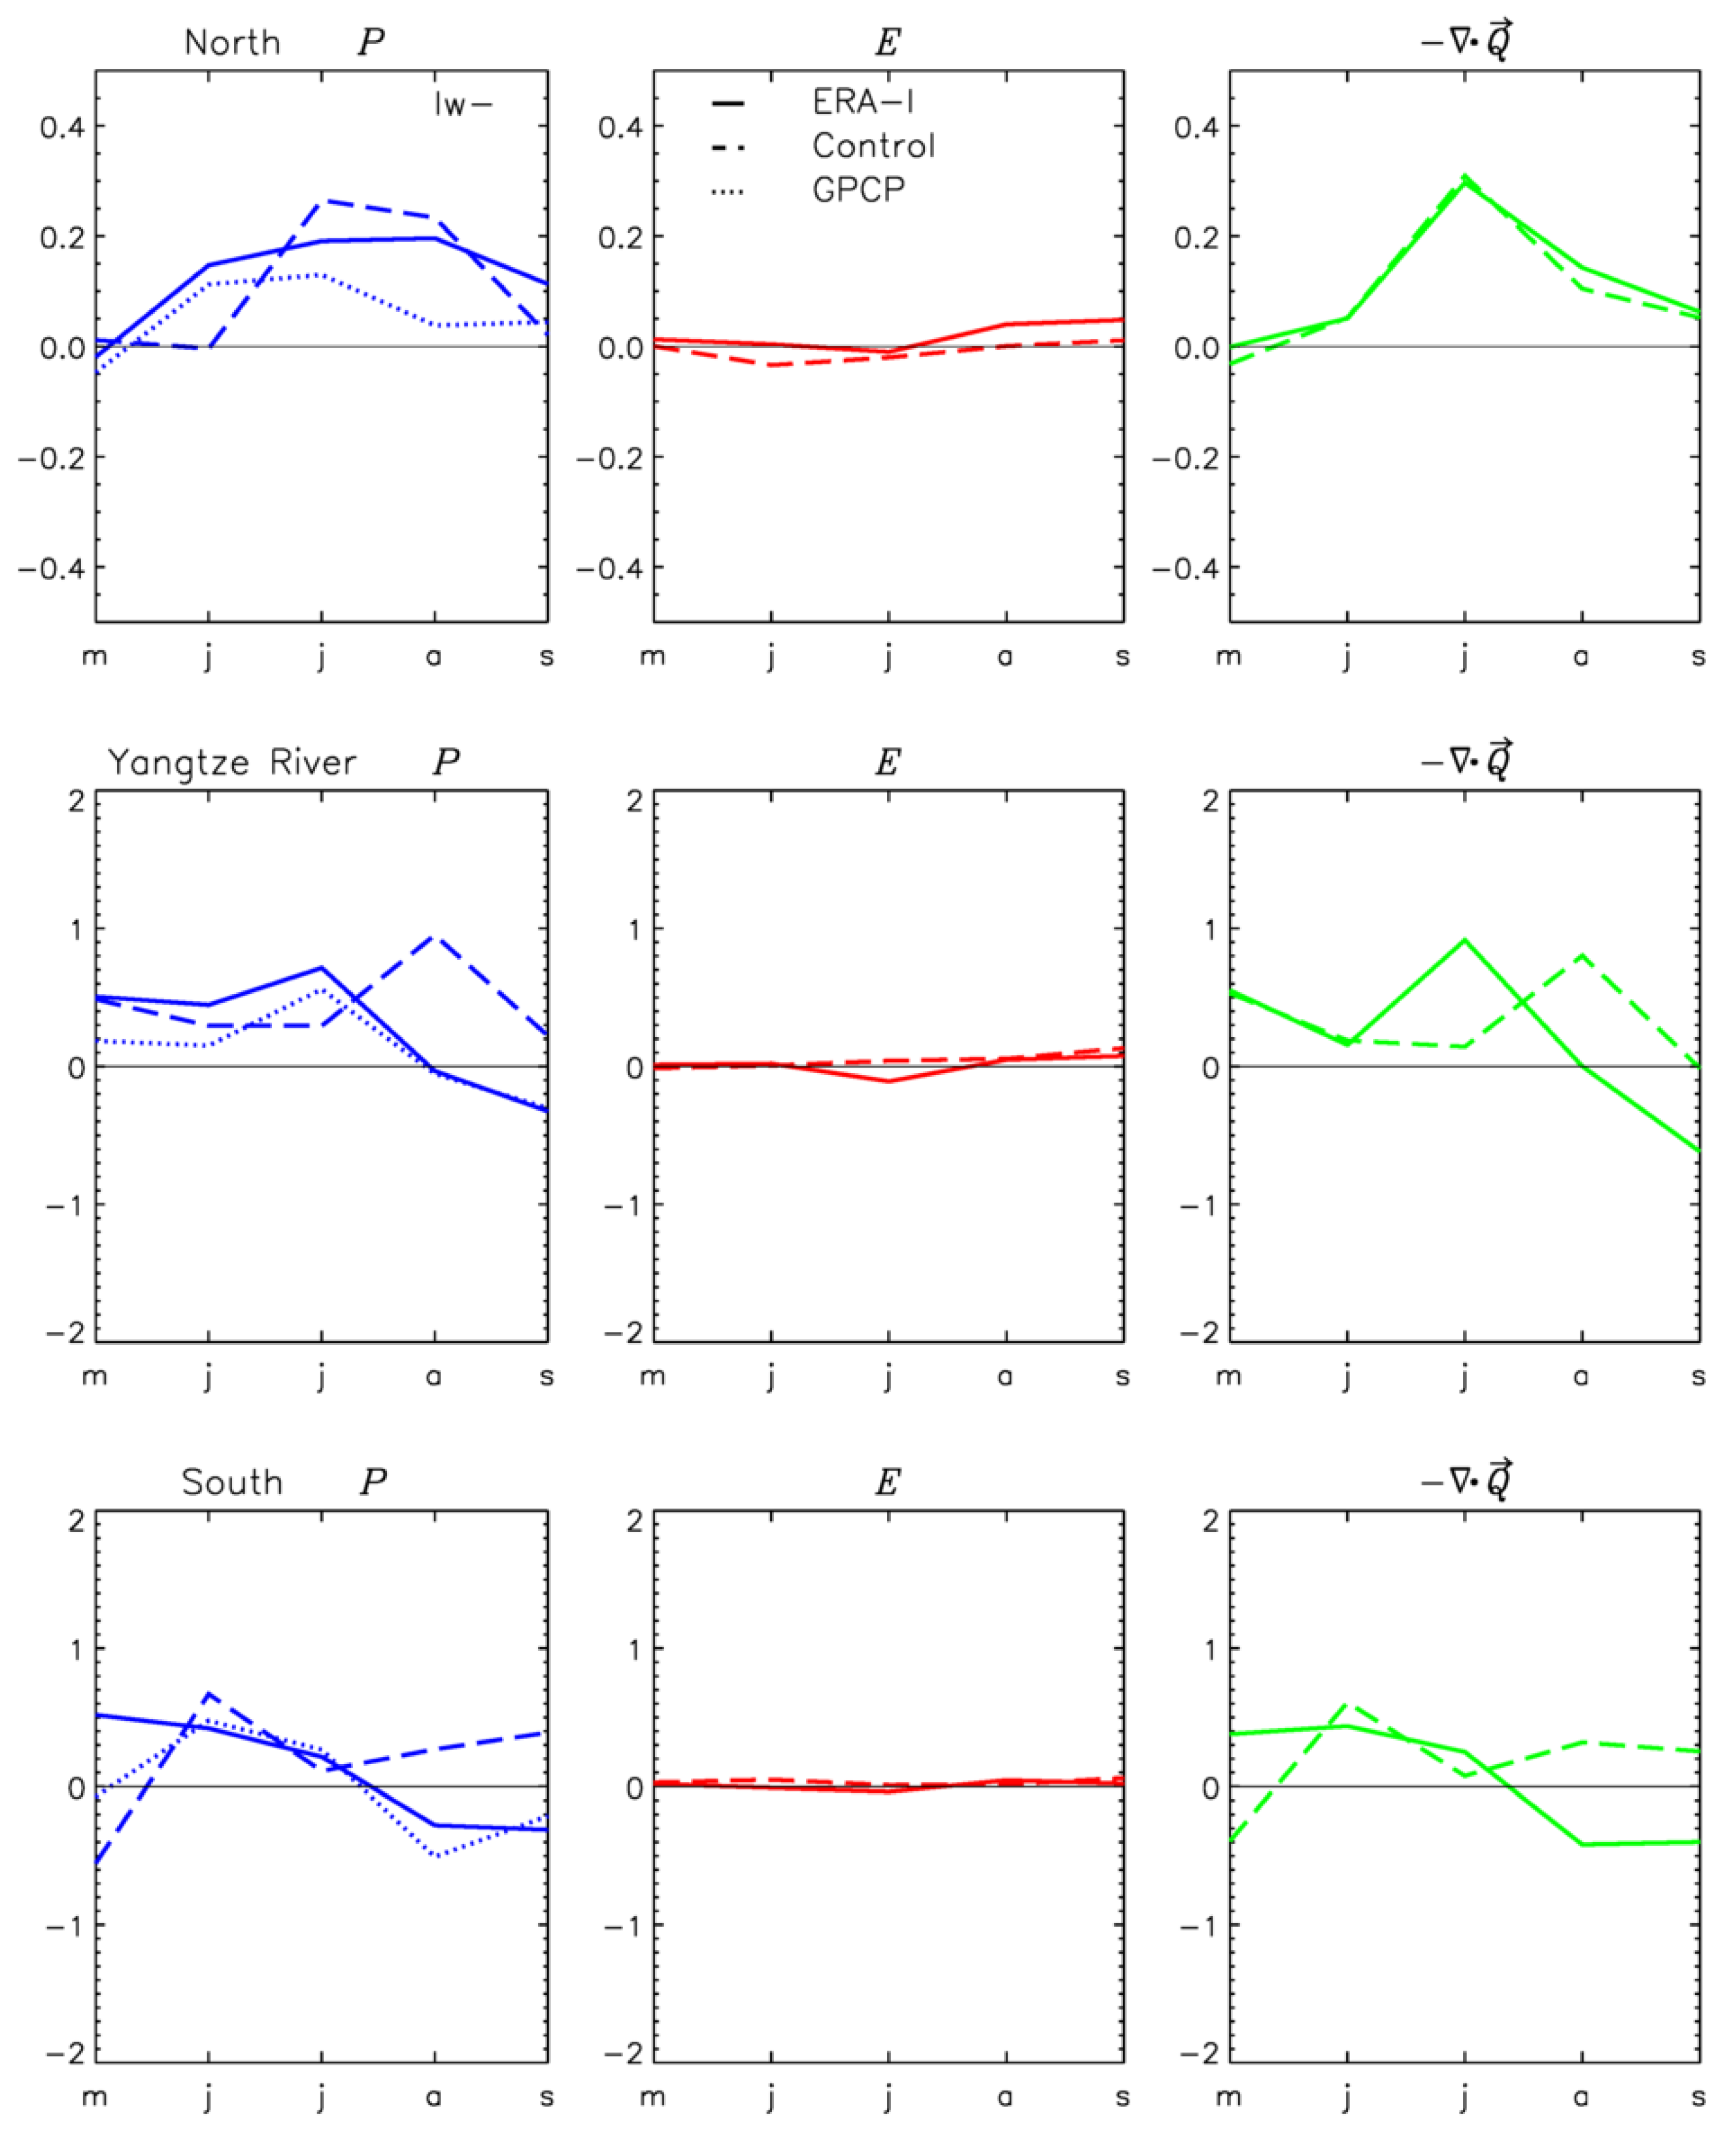
A westward shift of the WPSH increases seasonal precipitation in the North and Yangtze River domains, driven by an increase in moisture convergence. The changes in ERA-I budget components associated with such a displacement are the following (see Figure 10):
  • North domain: a seasonal increase in moisture convergence, peaking in July. A good representation by AMIP-N96 of the change in seasonal moisture convergence does not bring the same increase in regional precipitation. This deficit, more noticeable in May and June, suggests that model local physics (parameterizations) are at play in the model error.
  • Yangtze River: increase of moisture convergence from May to August followed by a decrease from August to September. The positive anomaly is replicated in AMIP-N96, but it peaks later during the season (August, instead of July). In AMIP-N96, there is a small negative contribution from local evaporation that reduces the precipitation anomaly during the first months of the season.
  • South: a small increase in moisture convergence from May to the end of June, followed by a similar reduction of moisture convergence from July to September drives similar changes in the seasonal rainfall. In AMIP-N96, the WPSH displacement produces instead a season-long increase of moisture convergence. Since the changes in evaporation are negligible, these changes are replicated in the model’s regional precipitation.
To give a measure of uncertainty in the precipitation response to shifts in the WPSH, the left panels in Figure 9 and Figure 10 show changes in precipitation for the GPCP dataset (dotted lines) in addition to the ones for ERA-I. GPCP and ERA-I show differences in the size of the monthly anomalies associated with those shifts. On the other hand, AMIP-N96 anomaly errors (with respect to both sets of observations) are in general larger than the differences between ERA-I and GPCP responses.

4. Conclusions

In this paper, we have studied the summer atmospheric moisture transport relevant to the water cycle in the east Asian region, within the broader context of the summer Asian-Pacific monsoon system. The main goal of this work was to evaluate the ability of the latest generation of Met Office Unified Model (MetUM) to capture this transport and to study potential links of its deficiencies to systematic model errors in the tropics.
The MetUM has robust errors in precipitation, which include dry biases in the Indian peninsula, Bay of Bengal and the northwestern Pacific, and wet biases in the tropical Indian Ocean and the tropical West Pacific. These errors are also seen across the CMIP3 and CMIP5 models. Sperber et al. [17] show that the CMIP multi-model ensemble (MME) and individual models show similar precipitation biases of drying over India and Maritime Continent and too much precipitation over the tropical Indian and west Pacific Oceans (see their Figure 1). The MME also shows an erroneous cyclonic circulation at 850hPa over the west Pacific consistent with the errors seen in MetUM (see their Figure 2).
The model biases in MetUM are strongly connected to errors in atmospheric moisture convergence in the region. To explore possible mechanisms linking those errors with model systematic biases in the tropics, we carried out a series of sensitivity experiments employing the nudging methodology. Using an ensemble of NWP hindcasts, we examined the influence of the Maritime Continent on the growth of moisture transport errors over China, the western Pacific and the Indian Ocean. The nudging methodology allows us to split the total error into contributions from the Maritime Continent (MC) and everywhere else. On day 1, the contribution of MC to the total error is mostly restricted to the MC region, but, as forecast lead time increases, it is responsible for forcing mean errors beyond the nudged region, such as the excessive westerly monsoon flow that crosses Southeast Asia, the South China Sea and into the western Pacific, which by day 15 develops into the distinct erroneous cyclonic circulation in the West Pacific. On the other hand, the anticyclonic errors over India and the Arabian Sea are not forced from MC but are probably more a combination of local errors and errors originated in other regions. Hindcast errors in moisture transport on day 15 bear a strong resemblance to the long-time mean errors in the climate simulations.
Analysis of the vertical structure of model regional circulation shows the development of an erroneous Hadley circulation connecting the lower tropospheric convergence error in the tropical West Pacific with the lower tropospheric divergence error in the MC region. The appearance of these errors over the equatorial MC in the early forecast stages and the subsequent northward propagation suggests the MC as a key player in these circulation errors. Errors in the vertical wind structure from climate simulations bear a striking resemblance with day 11–15 hindcast errors, suggesting that the essential elements forcing the errors are set up early in the forecasts. The information from the nudging and NWP experiments has highlighted a key role for deficiencies in tropical convection over the Maritime Continent. For MetUM, this information is fed back directly into the model development process. For example, a revised convection parametrization scheme, CoMorph, is currently under development and a focus of attention is to improve the representation of the diurnal cycle of convection and improve land sea contrasts for precipitation over regions such as the Maritime Continent. The expectation is that these core model improvements will then feedback onto the large-scale WPSH and Asian Monsoon circulation via the mechanisms discussed in this paper.
We analysed changes of the atmospheric water cycle over the East Asian region in response to the interannual variability of the summer WPSH and evaluated the ability of the MetUM to represent the summer WPSH and the effects of its variability. There are robust systematic biases in MetUM large-scale circulation, which affect its representation of the mean summer WPSH, including a weakening of the WPSH and a location too far east, which leads to an underestimation of the southwesterly monsoon flow over China.
To measure the year to year variability of the WPSH, we have used three indices that represent its June–August mean intensity, westward extension and northern edge. In ERA-I, the northern edge variability is confined to the 22 29 N region and the westward extension to 132 147 E. In AMIP-N96, the location of the WPSH varies more year on year, especially its northern extension. A better variability is achieved in simulations where the Maritime Continent region is nudged, pointing to this region’s importance in producing correct WPSH variability.
Changes in regional rainfall associated with the variability of the WPSH can be explained by changes in atmospheric moisture transport. An intensification of the WPSH brings an enhancement of precipitation in a long band, between 20 and 35 N that encompasses the Yangtze River basin in China and continues in the Western Pacific, south of Japan, to the international date line. It also causes a significant reduction of precipitation in band, located between 10 and 20 N that includes South China, the South China Sea and the West Pacific. A southward displacement of the summer WPSH is associated with almost identical regional precipitation changes to the changes brought by its intensification. A westward displacement of the climatological anticyclone induces an enhancement of precipitation in South and East China, the Korean Peninsula, Japan and the North Pacific, and deficient rainfall in the West Pacific (in a 10 20 N band).
Analysis of summer water budget components over three land domains shows that the precipitation response to changes in the WPSH are driven essentially by moisture convergence, with a very small contribution from local evaporation. An intensification of the WPSH and, equivalently, a southern displacement of it, brings an increase of summer moisture convergence in all domains. A western displacement of the WPSH brings an enhancement of seasonal moisture convergence in the North and Yangtze River domains and a very small change in the South China domain. Climate simulations are able to reproduce the seasonal trends relatively well in the North and Yangtze River domains but suffer from an excessive increase of moisture convergence in the South China domain.

Author Contributions

J.M.R. and S.F.M. conceived and designed the experiments; J.M.R. performed the experiments; J.M.R. and S.F.M. contributed to the analysis and wrote the paper.

Funding

This work and its contributors (José M. Rodríguez and Sean F. Milton) were supported by the UK-China Research and Innovation Parnertship Fund through the Met Office Climate Science for Service Partnership (CSSP) China, as part of the Newton Fund.

Acknowledgments

The authors would like to thank the anonymous reviewers for insightful comments that have made this a better paper.

Conflicts of Interest

The authors declare no conflict of interest.

Appendix A

Figure A1. June–August 1982–2007 moisture flux (arrows) and moisture divergence (shaded, mmday 1 ) for: (a) AMIP-N96 free run − global nudging, showing the model bias; (b) AMIP-N96 free run − nudging over the tropics, showing the error forced from the tropics; (c) tropical nudging − global nudging, showing the errors of extratropical origin; (d) as Figure A1(b) but showing errors from the Maritime Continent; and (f) as Figure A1(c) but displaying errors from outside the Maritime Continent region. The Tropical band and Maritime Continent nudging regions have been drawn in (b,c) and (d,e), respectively.
Atmosphere 10 00457 g0a1

References

  1. Zhou, T.J.; Yu, R.C. Atmospheric water vapor transport associated with typical anomalous summer rainfall patterns in China. J. Geophys. Res. Atmos. 2005, 110, D08104. [Google Scholar] [CrossRef]
  2. Liu, J.; Wang, B.; Yang, J. Forced and internal modes of variability of the East Asian summer monsoon. Clim. Past Discuss. 2008, 4, 225–233. [Google Scholar] [CrossRef] [Green Version]
  3. Wang, B. Rainy season of the Asian–Pacific summer monsoon. J. Clim. 2002, 15, 386–398. [Google Scholar] [CrossRef]
  4. Chen, H.; Zhou, T.; Neale, R.B.; Wu, X.; Zhang, G.J. Performance of the new NCAR CAM3. 5 in East Asian summer monsoon simulations: Sensitivity to modifications of the convection scheme. J. Clim. 2010, 23, 3657–3675. [Google Scholar] [CrossRef]
  5. Ronghui, H.; Yifang, W. The influence of ENSO on the summer climate change in China and its mechanism. Adv. Atmos. Sci. 1989, 6, 21–32. [Google Scholar] [CrossRef]
  6. Chen, X.; Wu, P.; Roberts, M.J.; Zhou, T. Potential Underestimation of Future Mei-Yu Rainfall with Coarse-Resolution Climate Models. J. Clim. 2018, 31, 6711–6727. [Google Scholar] [CrossRef]
  7. Ding, Y.H.; Liu, J.J.; Sun, Y.; Liu, Y.; He, J.; Song, Y. A study of the synoptic-climatology of the Meiyu system in East Asia. Chin. J. Atmos. Sci. -Chin. Ed. 2007, 31, 1082. [Google Scholar]
  8. Zhou, T.; Gong, D.; Li, J.; Li, B. Detecting and understanding the multi-decadal variability of the East Asian Summer Monsoon—Recent progress and state of affairs. Meteorol. Z. 2009, 18, 455–467. [Google Scholar] [CrossRef]
  9. Wu, P.; Christidis, N.; Stott, P. Anthropogenic impact on Earth’s hydrological cycle. Nat. Clim. Chang. 2013, 3, 807. [Google Scholar] [CrossRef]
  10. Yihui, D.; Chan, J.C. The East Asian summer monsoon: An overview. Meteorol. Atmos. Phys. 2005, 89, 117–142. [Google Scholar] [CrossRef]
  11. Ninomiya, K. Moisture balance over China and the South China Sea during the summer monsoon in 1991 in relation to the intense rainfalls over China. J. Meteorol. Soc. Jpn. Ser. II 1999, 77, 737–751. [Google Scholar] [CrossRef]
  12. Lu, R.; Dong, B. Westward extension of North Pacific subtropical high in summer. J. Meteorol. Soc. Jpn. Ser. II 2001, 79, 1229–1241. [Google Scholar] [CrossRef]
  13. Wang, B.; Xiang, B.; Lee, J.Y. Subtropical high predictability establishes a promising way for monsoon and tropical storm predictions. Proc. Natl Acad. Sci. USA 2013, 110, 2718–2722. [Google Scholar] [CrossRef] [PubMed]
  14. Gimeno, L.; Dominguez, F.; Nieto, R.; Trigo, R.; Drumond, A.; Reason, C.J.; Taschetto, A.S.; Ramos, A.M.; Kumar, R.; Marengo, J. Major mechanisms of atmospheric moisture transport and their role in extreme precipitation events. Annu. Rev. Environ. Resour. 2016, 41, 117–141. [Google Scholar] [CrossRef]
  15. Rodríguez, J.M.; Milton, S.F.; Marzin, C. The East Asian atmospheric water cycle and monsoon circulation in the Met Office Unified Model. J. Geophys. Res. Atmos. 2017, 122, 10–246. [Google Scholar] [CrossRef]
  16. Bush, S.J.; Turner, A.G.; Woolnough, S.J.; Martin, G.M.; Klingaman, N.P. The effect of increased convective entrainment on Asian monsoon biases in the MetUM general circulation model. Q. J. R. Meteorol. Soc. 2015, 141, 311–326. [Google Scholar] [CrossRef]
  17. Sperber, K.R.; Annamalai, H.; Kang, I.S.; Kitoh, A.; Moise, A.; Turner, A.; Wang, B.; Zhou, T. The Asian summer monsoon: An intercomparison of CMIP5 vs. CMIP3 simulations of the late 20th century. Clim. Dyn. 2013, 41, 2711–2744. [Google Scholar] [CrossRef]
  18. Boo, K.O.; Martin, G.; Sellar, A.; Senior, C.; Byun, Y.H. Evaluating the East Asian monsoon simulation in climate models. J. Geophys. Res. Atmos. 2011, 116, D01109. [Google Scholar] [CrossRef]
  19. Martin, G.; Milton, S.; Senior, C.; Brooks, M.; Ineson, S.; Reichler, T.; Kim, J. Analysis and reduction of systematic errors through a seamless approach to modeling weather and climate. J. Clim. 2010, 23, 5933–5957. [Google Scholar] [CrossRef]
  20. Walters, D.; Baran, A.J.; Boutle, I.; Brooks, M.; Earnshaw, P.; Edwards, J.; Furtado, K.; Hill, P.; Lock, A.; Manners, J.; et al. The Met Office Unified Model Global Atmosphere 7.0/7.1 and JULES Global Land 7.0 configurations. Geosci. Model Dev. 2019, 12, 1909–1963. [Google Scholar] [CrossRef] [Green Version]
  21. Taylor, K.E.; Stouffer, R.J.; Meehl, G.A. An overview of CMIP5 and the experiment design. Bull. Am. Meteorol. Soc. 2012, 93, 485–498. [Google Scholar] [CrossRef]
  22. Reynolds, R.W.; Smith, T.M.; Liu, C.; Chelton, D.B.; Casey, K.S.; Schlax, M.G. Daily high-resolution-blended analyses for sea surface temperature. J. Clim. 2007, 20, 5473–5496. [Google Scholar] [CrossRef]
  23. Shelly, A.; Xavier, P.; Copsey, D.; Johns, T.; Rodríguez, J.M.; Milton, S.; Klingaman, N. Coupled versus uncoupled hindcast simulations of the Madden-Julian Oscillation in the Year of Tropical Convection. Geophys. Res. Lett. 2014, 41, 5670–5677. [Google Scholar] [CrossRef] [Green Version]
  24. Walters, D.; Brooks, M.; Boutle, I.; Melvin, T.; Stratton, R.; Vosper, S.; Wells, H.; Williams, K.; Wood, N.; Allen, T.; et al. The Met Office unified model global atmosphere 6.0/6.1 and JULES global land 6.0/6.1 configurations. Geosci. Model Dev. 2017, 10, 1487–1520. [Google Scholar] [CrossRef]
  25. Dee, D.P.; Uppala, S.; Simmons, A.; Berrisford, P.; Poli, P.; Kobayashi, S.; Andrae, U.; Balmaseda, M.; Balsamo, G.; Bauer, D.P.; et al. The ERA-Interim reanalysis: Configuration and performance of the data assimilation system. Q. J. R. Meteorol. Soc. 2011, 137, 553–597. [Google Scholar] [CrossRef]
  26. Clayton, A.M.; Lorenc, A.C.; Barker, D.M. Operational implementation of a hybrid ensemble/4D-Var global data assimilation system at the Met Office. Q. J. R. Meteorol. Soc. 2013, 139, 1445–1461. [Google Scholar] [CrossRef]
  27. Rodríguez, J.; Johns, T.; Thorpe, R.; Wiltshire, A. Using moisture conservation to evaluate oceanic surface freshwater fluxes in climate models. Clim. Dyn. 2011, 37, 205–219. [Google Scholar] [CrossRef]
  28. Adler, R.F.; Huffman, G.J.; Chang, A.; Ferraro, R.; Xie, P.P.; Janowiak, J.; Rudolf, B.; Schneider, U.; Curtis, S.; Bolvin, D.; et al. The version-2 global precipitation climatology project (GPCP) monthly precipitation analysis (1979–present). J. Hydrometeorol. 2003, 4, 1147–1167. [Google Scholar] [CrossRef]
  29. Peixoto, J.P.; Oort, A.H. Physics of Climate; American Institute of Physics: New York, NY, USA, 1992. [Google Scholar]
  30. Oki, T. The global water cycle. Global Energy and Water Cycles; Browning, K.A., Gurney, R.J., Eds.; Cambridge University Press: Cambridge, UK, 1999; p. 304. [Google Scholar]
  31. Trenberth, K.E. Using atmospheric budgets as a constraint on surface fluxes. J. Clim. 1997, 10, 2796–2809. [Google Scholar] [CrossRef]
  32. Rodwell, M.J.; Jung, T. Understanding the local and global impacts of model physics changes: An aerosol example. Quart. J. R. Meteorol. Soc. 2008, 134, 1479–1497. [Google Scholar] [CrossRef]
  33. Klinker, E. Investigation of systematic errors by relaxation experiments. Quart. J. R. Meteorol. Soc. 1990, 116, 573–594. [Google Scholar] [CrossRef]
  34. Douville, H.; Bielli, S.; Cassou, C.; Déqué, M.; Hall, N.M.; Tyteca, S.; Voldoire, A. Tropical influence on boreal summer mid-latitude stationary waves. Clim. Dyn. 2011, 37, 1783–1798. [Google Scholar] [CrossRef]
  35. Hall, N.M.; Douville, H.; Li, L. Extratropical summertime response to tropical interannual variability in an idealized GCM. J. Clim. 2013, 26, 7060–7079. [Google Scholar] [CrossRef]
  36. Grotjahn, R. Global Atmospheric Circulations—Observations and Theories; Oxford University Press: New York, NY, USA, 1993. [Google Scholar]
  37. Yang, W.; Seager, R.; Cane, M.A. Zonal momentum balance in the tropical atmospheric circulation during the global monsoon mature months. J. Atmos. Sci. 2013, 70, 583–599. [Google Scholar] [CrossRef]
  38. Song, F.; Zhou, T. The climatology and interannual variability of East Asian summer monsoon in CMIP5 coupled models: Does air–sea coupling improve the simulations? J. Clim. 2014, 27, 8761–8777. [Google Scholar] [CrossRef]
  39. Feng, J.; Wei, T.; Dong, W.; Wu, Q.; Wang, Y. CMIP5/AMIP GCM simulations of East Asian summer monsoon. Adv. Atmos. Sci. 2014, 31, 836–850. [Google Scholar] [CrossRef]
Figure 1. June–August 1988–2007 mean values of: (a) GPCP precipitation; (b) AMIP-N96 precipitation error with respect to GPCP; (c) ERA-I atmospheric moisture divergence (shaded) superimposed to moisture flux vector (arrows); (d) AMIP-N96 moisture flux and divergence errors with respect to ERA-I. All values are expressed in mmday 1 .
Atmosphere 10 00457 g001
Figure 2. (a) June–August 2016 mean atmospheric moisture divergence (shaded, mmday 1 superimposed to moisture flux vector (arrows) in MetUM analysis; (be) NWP-N216 total errors of the same quantities, with respect to MetUM analysis, for forecast lead times of 1, 3, 5 and 15 days; (fi) NWP-N216 free run − Maritime Continent nudging, showing errors forced from the Maritime Continent for forecast lead times of 1, 3, 5 and 15 days; (jm) Maritime Continent nudging − global nudging, showing errors forced outside of the Maritime Continent for forecast lead times of 1, 3, 5 and 15 days. To illustrate local versus remote error forcing, the Maritime Continent nudging domain has been drawn in (fm).
Atmosphere 10 00457 g002
Figure 3. (a) June–August 2016 zonal wind (u, contours) and mean meridional circulation (v- ω —wind vectors, arrows) averaged over 100 E– 160 E for NWP-N216 globally nudged run; (be) NWP-N216 errors, with respect to the globally nudged run, for smoothed forecast lead times of 1–5, 6–10 and 11–15 days; (e) June–August 1982–2007 AMIP-N96 mean error; (f) NWP-N216 forecast error forced from the Maritime Continent. Winds are expressed in ms 1 .
Atmosphere 10 00457 g003
Figure 4. June–August 2016 mean 850 hPa geopotential height and horizontal wind over East Asia and the Pacific regions for (a) MetUM analysis and smoothed forecasts at lead times of (b) 1–5 days; (c) 6–10 days; (d) 10–15 days. Climatological June–August mean (1988–2007) is also shown for (e) ERA-I and (f) AMIP-N96. Geopotential is in metres and wind in ms 1 . The 1480 contour is shown in bold.
Atmosphere 10 00457 g004
Figure 5. 1982–2007 interannual variability of June–August WPSH intensity, west extension and northern edge indices in ERA-I and AMIP-N96 nudging sensitivity experiments. Axes in the scatter plots are as follows: abscissae show values of the west extension index, I W ( E) and ordinates show values of the northern edge index, I N ( N). The radii of scatter circles are proportional to the intensity index, I IN .To facilitate comparisons between ERA-I and climate simulations, the following attributes have been added: dotted lines that indicate maximum and minimum values of I N and I W for ERA-I, and green and red dots that show, respectively, the 1982–2007 mean index value for ERA-I and for each climate simulation. Indices are shown for (a): ERA-I; (b): AMIP-N96; (c): tropical band and (d): Maritime Continent. (See top right panel in Figure 2a for definitions of the nudging domains.)
Atmosphere 10 00457 g005
Figure 6. ERA-I June–August anomalous (composite—1982–2007 mean) water vapour divergence (shaded, 10 5 Kgm 2 s 1 ) and anomalous water vapour flux transport (arrows) for composites associated with WPSH indices: I IN (a,b); I N (c,d) and I W (e,f).
Atmosphere 10 00457 g006
Figure 7. Same as Figure 6 but for control simulations.
Atmosphere 10 00457 g007
Figure 8. Domains used for regional water budget analysis.
Atmosphere 10 00457 g008
Figure 9. Impact of the WPSH intensity variability in the main atmosphere water budget components over the north (top), Yangtze River (middle) and south (bottom) domains. Anomalies (composites − mean state) of precipitation (left panels), evaporation (middle panels) and moisture convergence (right panels) are calculated for May–September I IN + composites for ERA-I (solid lines) and AMIP-N96 Control (dashed lines). Left panels also show precipitation anomalies for GPCP (dotted lines). All values are expressed in mmday 1 .
Atmosphere 10 00457 g009
Figure 10. Same as in Figure 9, but for I W composites.
Atmosphere 10 00457 g010
Table 1. Years used to create moisture flux composites. Columns indicate the WPSH indices the composites are associated with. For each data set (ERA-I and AMIP-N96), there are two rows. The top (bottom) row shows years of positive (negative) index anomalies and corresponds to the + (−) sign used in the text.
I IN I N I W
ERA-I95, 98, 99, 03, 0590, 94, 96, 97, 99, 01, 04, 0689, 02, 04
89, 90, 91, 94, 97, 01, 02, 04, 0791, 92, 93, 95, 98, 05, 0791, 92, 93, 95, 96, 97, 98, 03, 06
AMIP-N9689, 91, 92, 93, 95, 98, 00, 02, 06, 0794, 95, 96, 02, 03, 04, 0594, 96, 97, 01, 03, 04
94, 96, 97, 01, 0489, 91, 92, 93, 97, 99, 00, 01, 0789, 92, 93, 95, 98, 99, 00, 02, 05, 06

