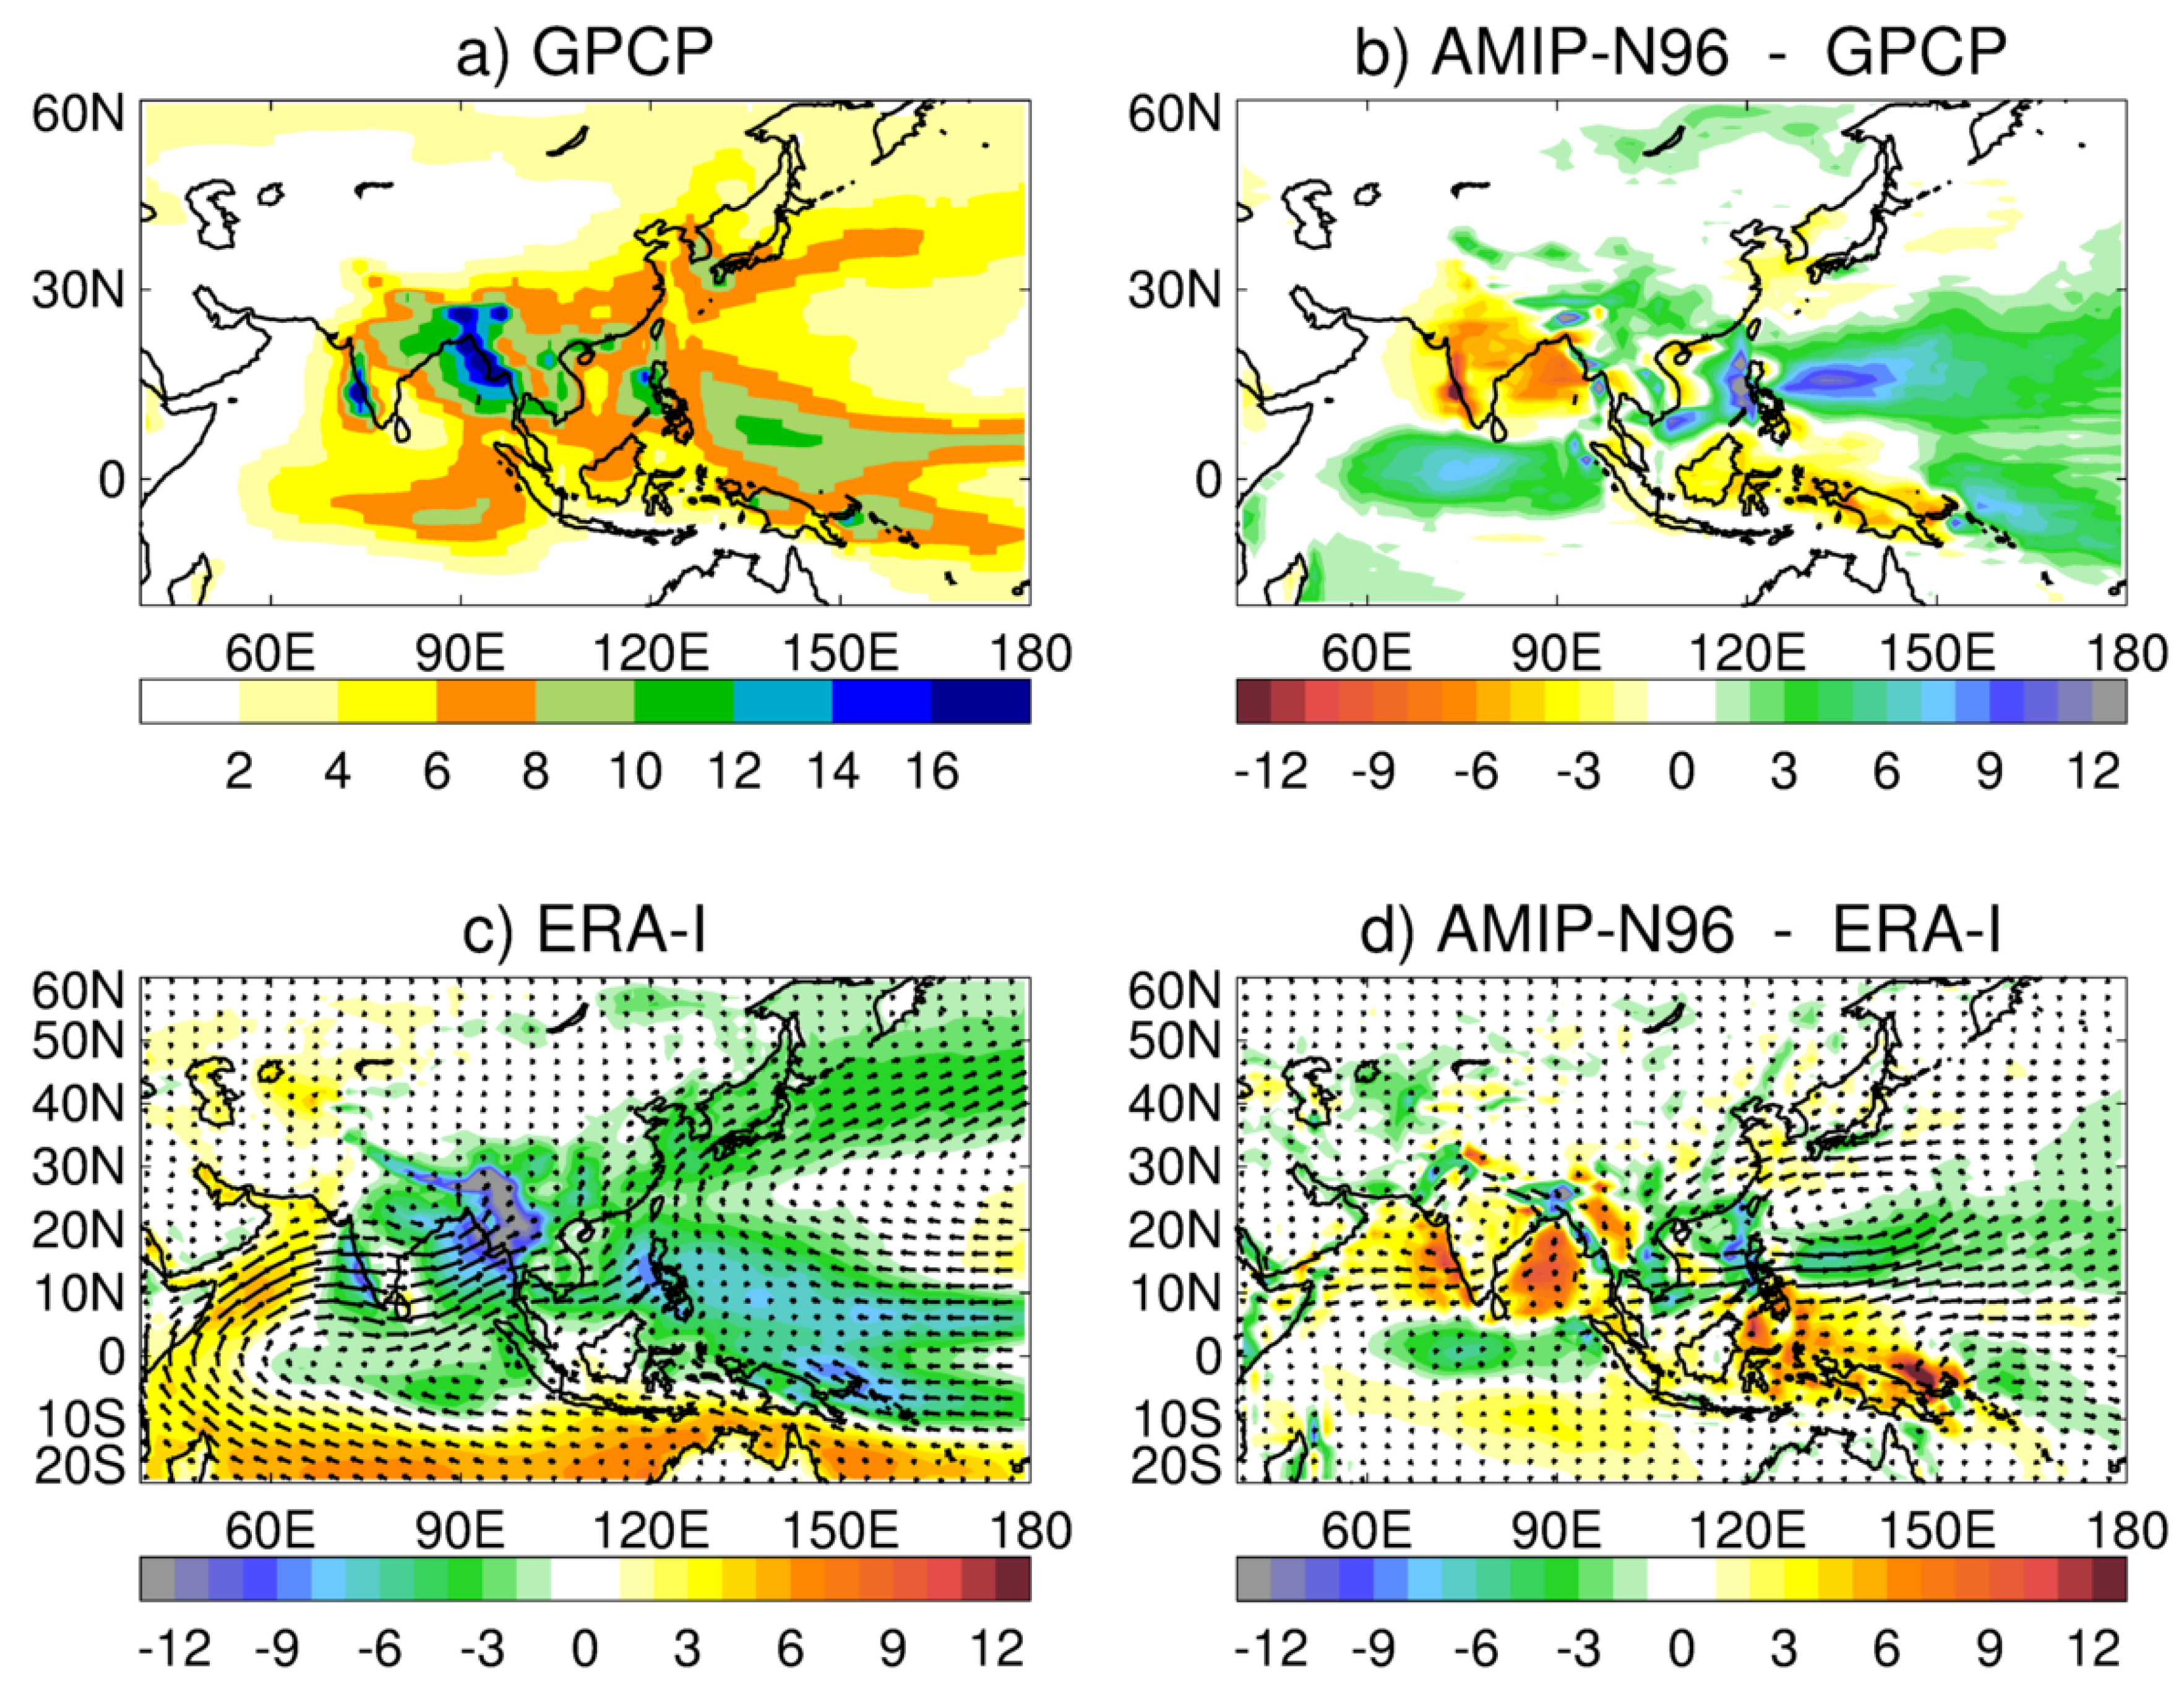
As an indicator of the summer atmospheric water cycle over East Asia, we first consider the seasonal regional precipitation in the wider context of the Asian-Pacific summer monsoon system. The GPCP June–August 1988–2007 mean precipitation in the region is displayed in
Figure 1a, and it shows the main characteristics associated with the summer Asian monsoon rainfall, with areas of high precipitation over the west coast of India, and the Bay of Bengal, extending over continental Southeast Asia and Southern China. Other centers of high precipitation are found in the Philippines, tropical West Pacific, Southern Japan and the Korean peninsula. Seasonal regional precipitation errors in AMIP-N96 simulations are displayed in
Figure 1b, which shows dry biases in the Indian peninsula and Bay of Bengal, as well as in regions in East Asia and the Western Pacific north of
N. The model simulations also show distinct wet biases in the tropical Indian Ocean, southern China and the tropical West Pacific.
The regional patterns of precipitation and the corresponding model simulation biases can be understood in terms of moisture sources and the atmospheric general circulation, by studying the associated moisture transport. To make that connection, here we use an approach based on water conservation. Atmospheric water conservation can be expressed in terms of an equation that involves vertically-integrated quantities [
29,
30]:
where
W and
are respectively the total amount of water and the total horizontal moisture flux in a unit area column. The first term on the left-hand side of expression (
1) represents the precipitable water tendency, the second term depicts the horizontal moisture flux divergence,
E is the evaporation from the surface and
P, the precipitation at the surface. If we consider averaged quantities over timescales larger than one month, changes in the water content column are very small compared to
fluxes. In this case, the water balance equation simplifies to:
where the bars denote averaging in time. Conservation equations like the one above have been used before to estimate quantities like surface moisture, energy and momentum fluxes [
27,
31]. Atmospheric moisture divergence connects sources and sinks of moisture to evaporation and precipitation. Equation (
2) shows that moisture divergent regions (positive term on left-hand side) are predominantly evaporative (
), whereas moisture convergent areas (negative term on left-hand side) are places of precipitation predominance (
). Moreover, since atmospheric moisture is concentrated in the lower troposphere, patterns of moisture transport, expressed by the
vector, closely reflect the atmospheric lower tropospheric circulation. In the following results,
has been produced by integrating the horizontal moisture flux over the full set of model vertical levels (60 in the case of ERA-I and 85 in the MetUM case).
June–August 1988–2007 mean moisture transport depicted in
Figure 1c shows vertically-integrated moisture flux,
, and moisture divergence for ERA-I. In the East Asian monsoon region, zones of moisture convergence can be seen in the tropics (including the South China Sea and the tropical West Pacific up to
longitude) and the extra-tropics (from Japan to the central North Pacific). Moisture into the East Asian area comes from four sources: moisture from the Arabian Sea and Bay of Bengal, transported by the Indian Monsoon; moisture from the western tropical Pacific, transported by the Southeast Asian monsoon; moisture crossing the equator in the
–
E area; and a small westerly moisture flux at midlatitudes.
Atmospheric moisture transport and divergence errors in AMIP-N96 are displayed in
Figure 1d. They show an excessive westerly moisture flux at about
N in the South China Sea and the tropical West Pacific that penetrates deep into the Pacific Ocean and becomes part of an erroneous cyclonic circulation, extending up to
N that brings excessive moisture convergence into the Philippine Sea and reduces the transport of moisture from East Asia to the North West Pacific. Another distinctive error in AMIP-N96 is characterised by an erroneous anticyclonic flow with excessive westward moisture flux crossing the Indian Peninsula and combines with an erroneous easterly flow in the equatorial Indian Ocean and leads to a convergent error in the equatorial Indian Ocean and a moisture divergence error in the Arabian Sea, Indian Peninsula and the Bay of Bengal.
AMIP-N96 errors in moisture divergence are strongly connected to the model mean precipitation biases in the region. As it is expressed in Equation (
2), a negative seasonal mean moisture divergence can be approximated as a predominant seasonal precipitation. This is the case in the regions where the main errors mentioned above develop (see
Figure 1c). This means that the moisture divergence errors can be approximated as precipitation errors. That is, the error patterns of moisture divergence in
Figure 1d can be interpreted as dry biases in the Arabian Sea west of the Indian Peninsula as well as in the Bay of Bengal and the islands of the Maritime Continent, and wet biases in the tropical Indian Ocean, the South China Sea and the tropical West Pacific, which correspond to the precipitation bias patterns shown in
Figure 1b. It is difficult to disentangle whether errors in the time-mean precipitation are a consequence of errors introduced in the way we choose to parametrize key processes such as tropical convection as a “local physics” response, or whether “remote forcing” of errors in the divergent circulation causes errors in moisture convergence leading to precipitation errors through erroneous inputs to the convection parametrization (see [
32] for a detailed discussion of local physics vs. remote forcing of model errors). In the following sections, we attempt analyze the remote vs. local sources of errors affecting the atmospheric moisture transports in the region through a combination of relaxation/nudging experiments and short-range NWP experiments.
3.1. Teleconnections and Remotely Forced Model Systematic Errors—Role of the Tropics
In order to explore possible mechanisms linking model systematic biases with the large-scale circulation and moisture transport errors mentioned above, we have carried out a series of both NWP-N216 and AMIP-N96 sensitivity experiments using the nudging/relaxation methodology first described in [
33] and used subsequently by others [
15,
34,
35]. The nudging methodology requires relaxing the free-running model simulation back to an analysis both over the whole globe and over specific sub-domains chosen as areas where model systematic errors may have their source and have a remote influence on the regions of interest in this study (see
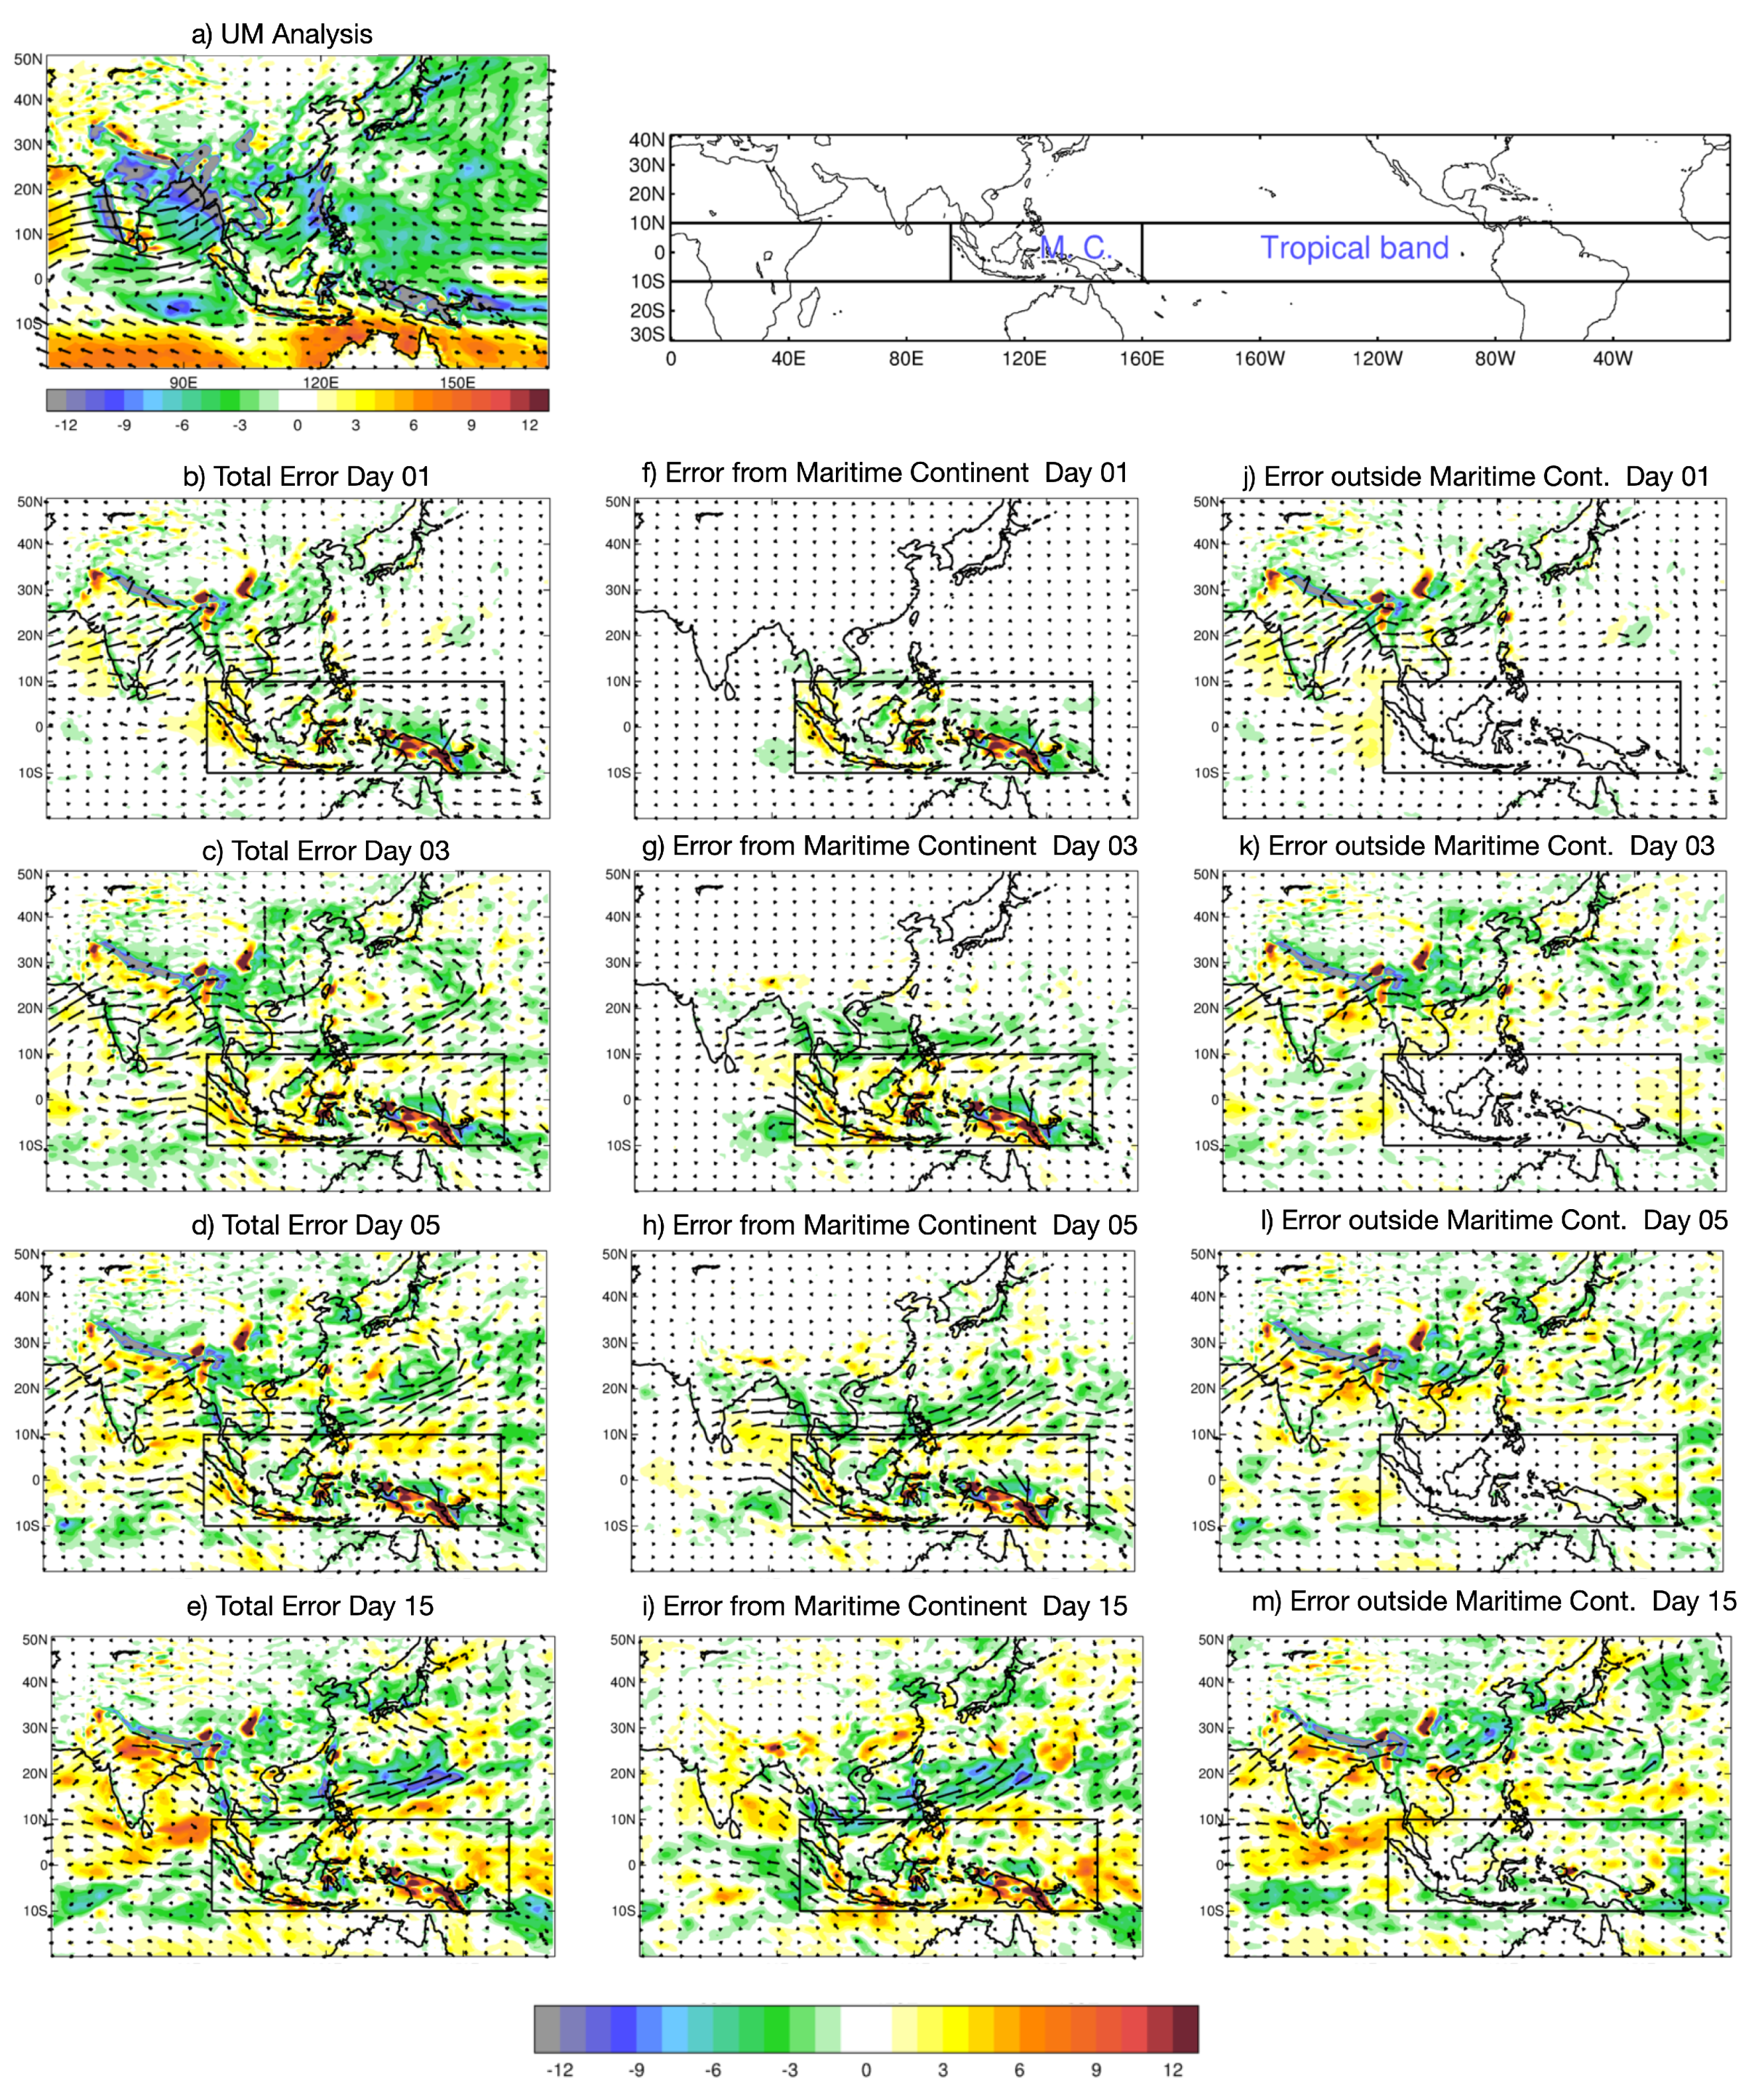
Figure 2 top right panel). Our focus is on the role of the tropics in forcing errors in the sub-tropics and in particular in the WPSH as a crucial component of the East Asian Summer Monsoon.
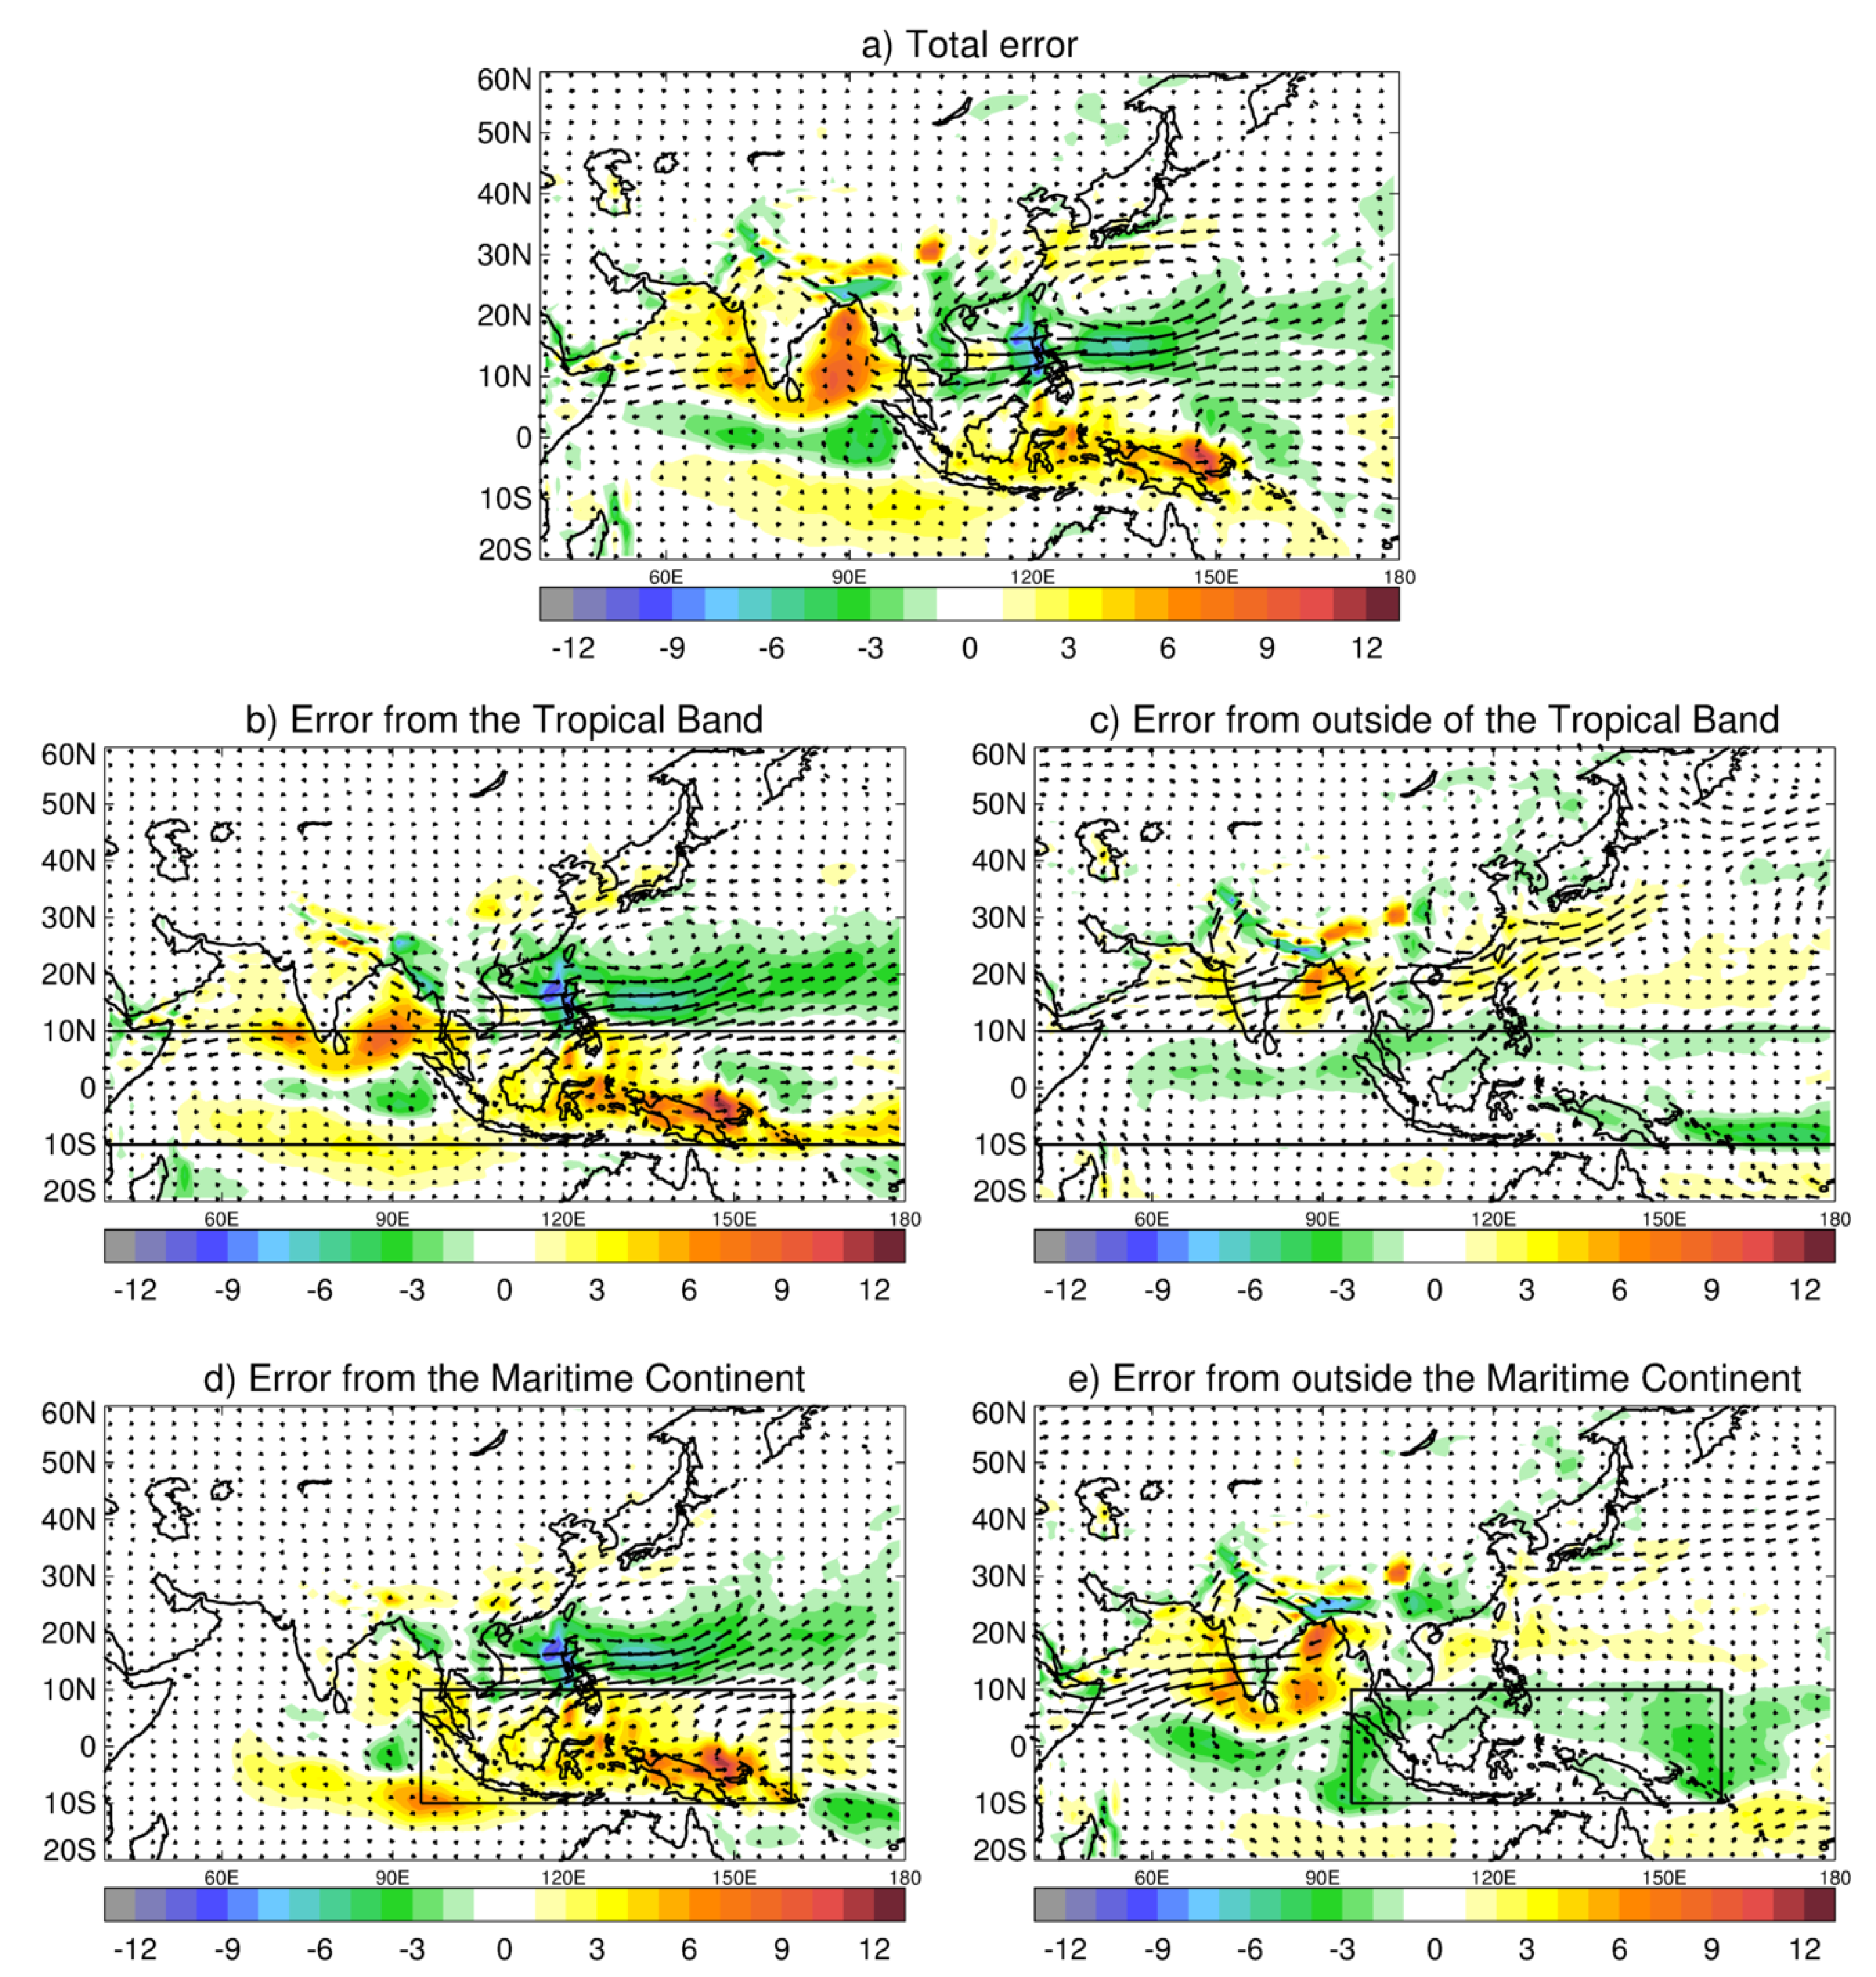
We begin with an example of the influence of the Maritime Continent (MC) on the growth of remotely forced model systematic errors over China, the western Pacific and the Indian Ocean over the first 15-days of simulation of the NWP-N216 nudging experiments conducted during June–August 2016 (
Figure 2). The total mean error (forecast-analysis) in the moisture transport and divergence for forecast days 1, 3, 5, and 15 (
Figure 2b–e) shows the gradual emergence of key systematic errors seen in the moisture transport/divergence for AMIP-N96 simulations vs. ERA-I (
Figure 1d). This includes the cyclonic circulation in the western Pacific sub-tropics and the erroneous extension of the Asian Monsoon low level flow into this region with associated convergence of moisture. The anti-cyclonic circulation and moisture divergence over India also appear early on (days 3–5) and is well established by day 15. We can also see significant local errors in moisture divergence/convergence over the MC itself. The island of New Guinea is dominated by erroneous moisture divergence tied to the island’s topography, while the adjacent ocean to the north shows too much convergence of moisture. These errors are large even at day 1 suggesting that errors in local parameterised physics are the key drivers rather than remote forcing errors of the circulation. The most likely source of these errors is in the large uncertainties in parameterising tropical convection (see [
16] for the study of sensitivity of model errors to details of MetUM convective parametrization).
The combination of the free run (A), globally nudged (B) and MC nudged runs (C) allows us to split the total mean error into contributions from the Maritime Continent and everywhere else following [
33]:
Total Mean Error = A − B,
Mean error originating from MC = A − C,
Mean error originating from outside MC = C − B.
On day 1, the contribution of the MC to the total error is mostly confined to the MC region as expected, but even by day 3 of the NWP forecasts the MC errors are responsible for forcing mean errors beyond the nudged region, such as the excessive westerly monsoon flow across the bay of Bengal, Southeast Asia, South China Sea and out into the western Pacific (
Figure 2f–i). On day 5, a northward component to the flow develops and, by day 15, there is a distinct cyclonic circulation in the west Pacific that explains a large proportion of the total mean error. For completeness, we also show the contribution to the total error from the areas outside the MC nudging domain (
Figure 2j–m). A smaller area of erroneous cyclonic circulation in the Pacific occurs just south of Japan and appears by day 3, contributing to the overall cyclonic circulation errors. However, this non-MC error doesn’t grow much in later forecast ranges (days 5 and 15) where it is a smaller contribution to the total cyclonic error in the Pacific. In contrast, the anti-cyclonic errors over India and the Arabian Sea are not really forced from the MC and are probably more local to the India region or possibly forced from other regions than the MC.
A similar set of nudging experiments has been carried out in the AMIP-N96 simulations relaxing back to ERA-I re-analyses in this case rather than the MetUM analyses and also covering multi-annual periods from 1989 to 2007. The total error bears a strong resemblance to the day 15 NWP-N216 total error (
Figure A1a vs.
Figure 2e). The AMIP nudged runs also show the key contribution of the MC in forcing the excessive westerly Asian Monsoon flow out into the Pacific and the southern part of the cyclonic bias in the western Pacific. Again, the MC plays little role in forcing the mean errors over the India region and even nudging the full tropical band (
N–
S—
Figure A1b,c) shows that a large proportion of the biases over India are forced from outside the deep tropics and are either local in origin or forced remotely from the extra-tropics.
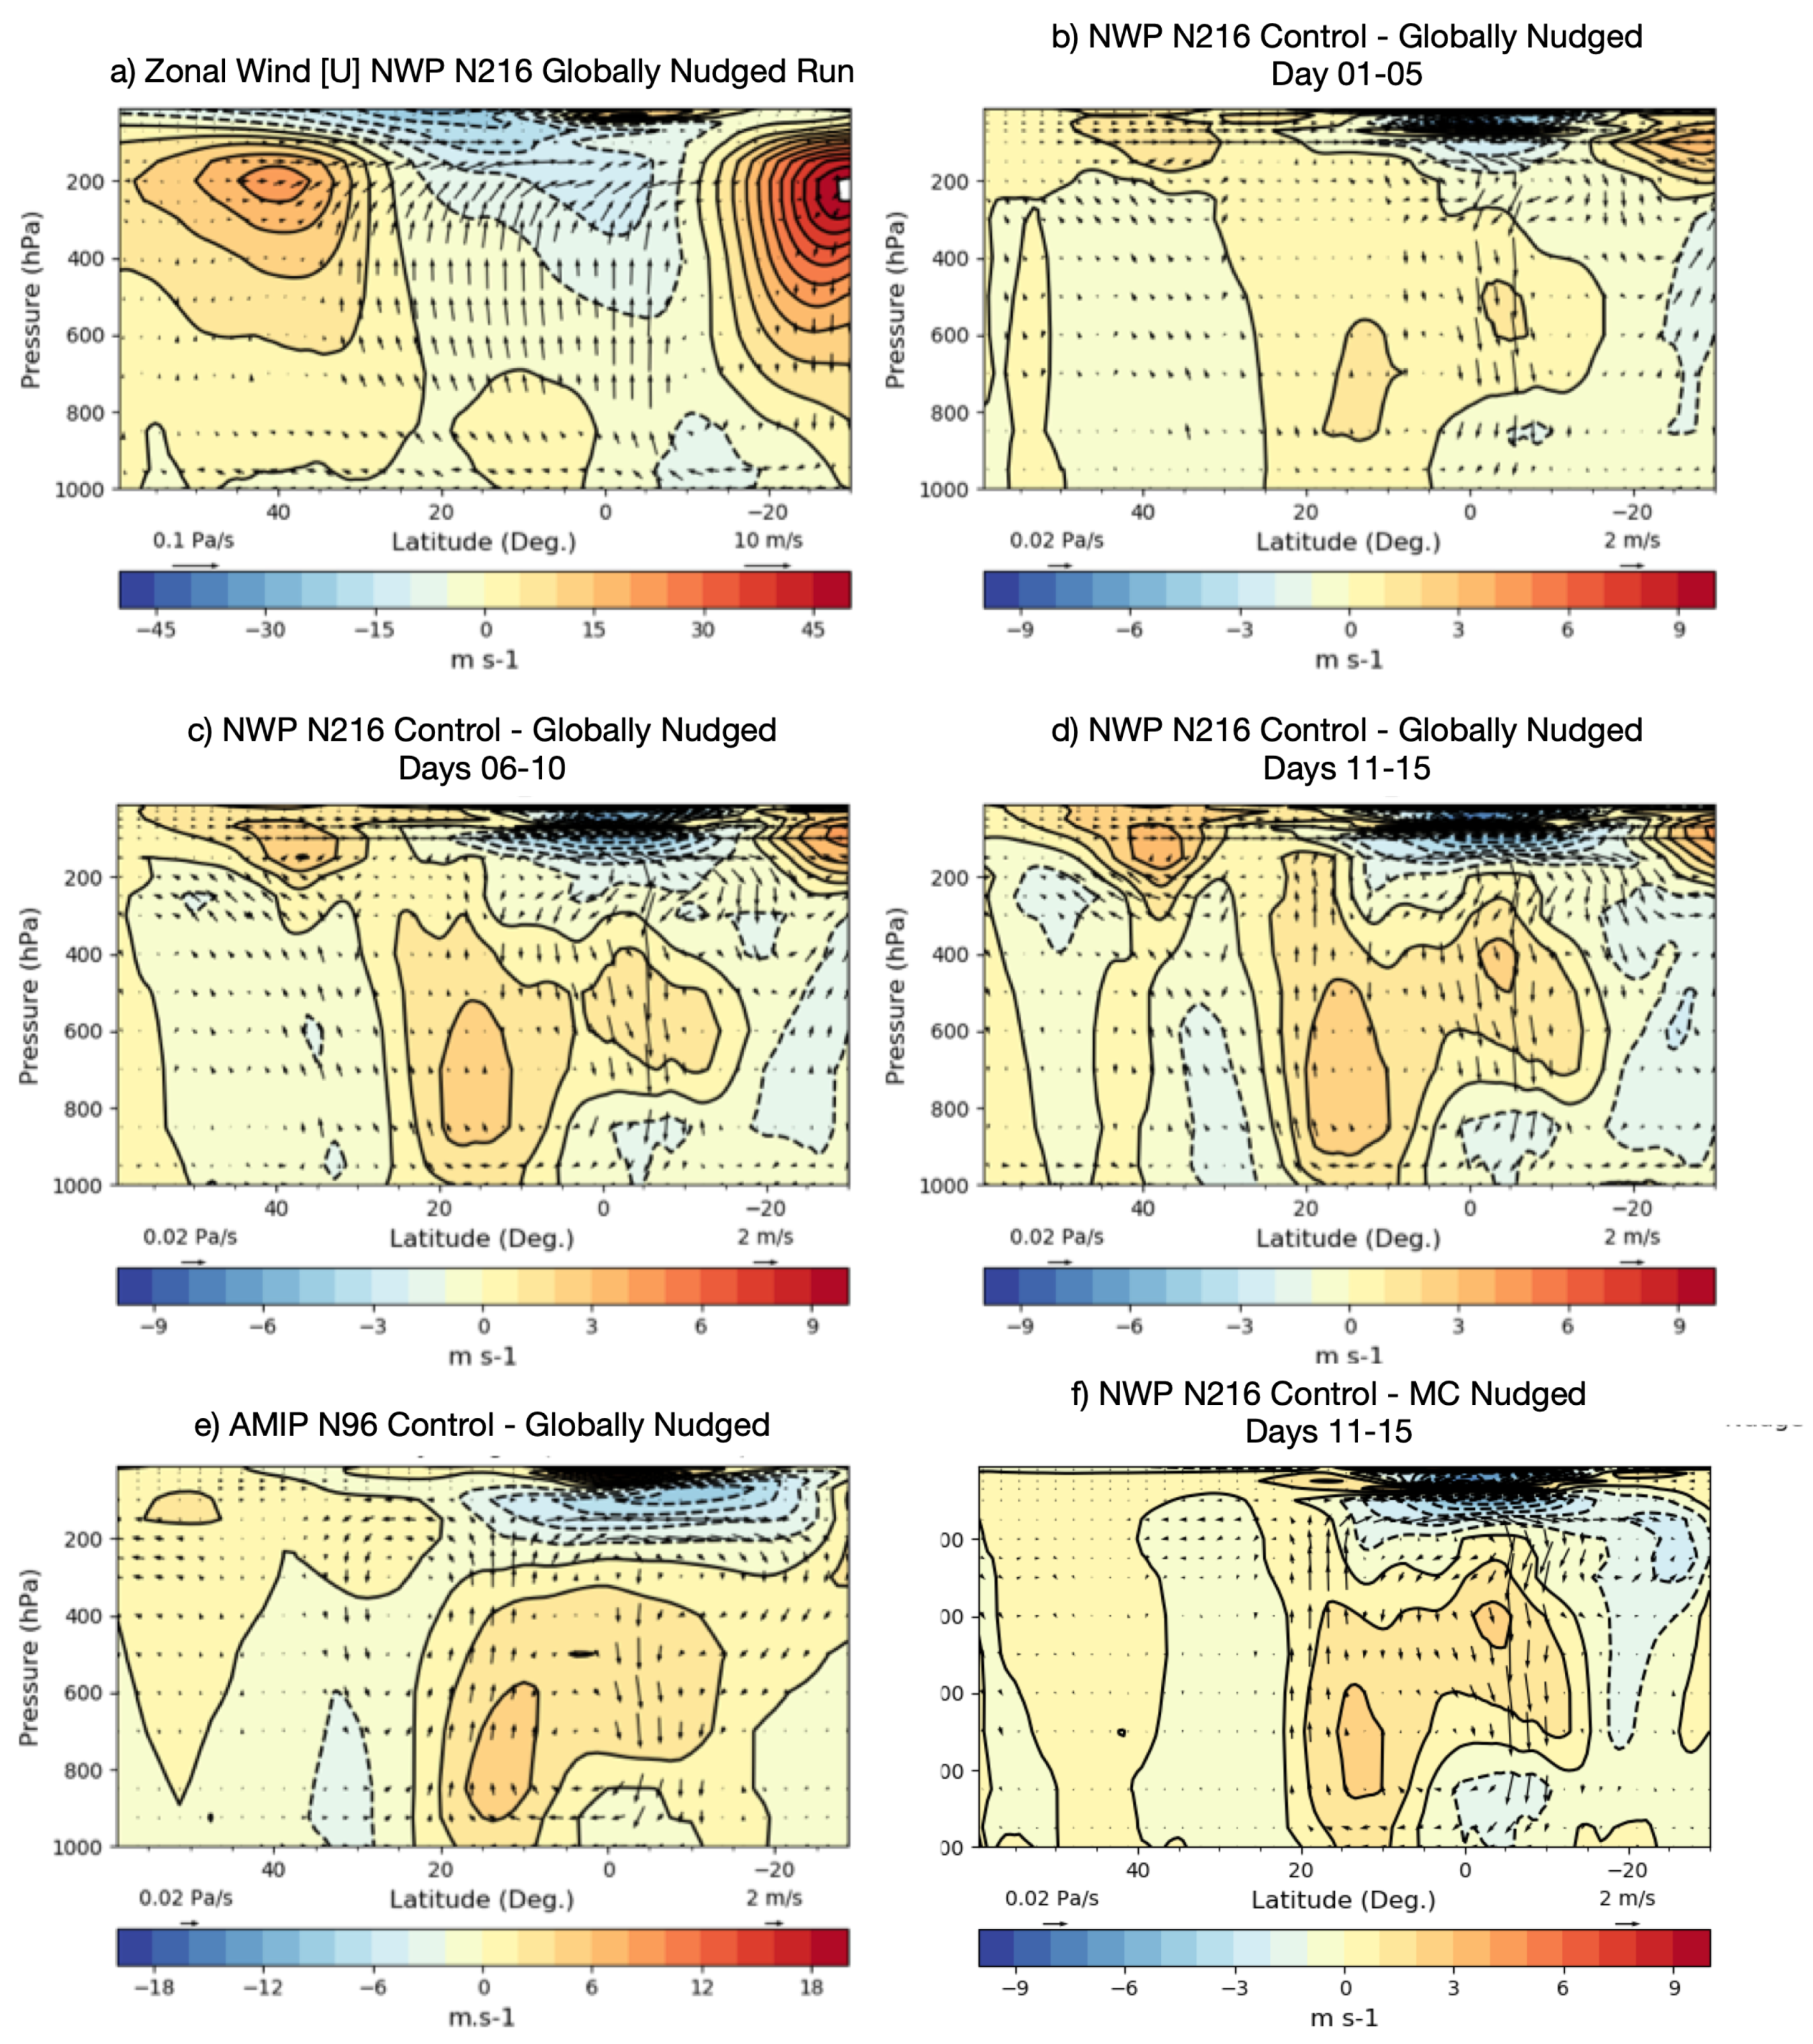
Finally, we consider the vertical structure of the model systematic errors in circulation and how they evolve with forecast range in height(pressure)-latitude cross sections (
Figure 3) over the longitude region from
–
E (see
Figure 2b for domain). MetUM analyses for 2016 (and ERA-I for 1989–2007—not shown) have the baroclinic structure of tropical easterlies aloft and westerlies in the lower troposphere (
N–
S) flanked by the subtropical-jets in both hemispheres. The wind vectors are the mean meridional circulation traced by the
v-
winds and show the broad region of rising air from the
S to
N and descent over
S–
S associated with the thermally direct Hadley circulation over these longitudes.
The evolution of the mean errors in these circulation features from days 1–5, 6–10 and 11–15 of the NWP-N216 forecast runs is shown in
Figure 3b–d. On days 1–5, the largest error is a region of erroneous descent over the equator and large easterly biases in the upper troposphere above 200 hPa, a westerly bias in the tropical mid-troposphere and easterly bias in the tropical boundary layer. The excessive descent is due to the rapid collapse of precipitation, diabatic heating, and vertical ascent over the MC region in the very earliest stages of the NWP forecasts, which can also be inferred from the excessive erroneous moisture divergence over the MC islands in
Figure 2. In addition, it is evident that a westerly bias centred at
N and peaking between 850 hPa and 600 hPa and correlates with the excessive westerly Asian Monsoon in the western Pacific region. On days 6–10, these errors have evolved and the region of descent has broadened to reach
S and, by days 11–15, we also have erroneous ascent at
N, which is connected to the equatorial descent as a large thermally direct circulation error. The AMIP-N96 error from the climate simulations bears a striking resemblance to the day 1–15 error, suggesting that the essential ingredients in forcing these errors are set up very early in the forecasts. The appearance of the largest errors over the equatorial MC region in the early forecast stages, and subsequent northward propagation suggests the MC is a key player in these circulation errors at both NWP and climate timescales. This is confirmed for the NWP timescale by using the nudged runs to compare the total mean error at days 11–15 (
Figure 3b) to the contribution that comes solely from the MC (
Figure 3f). Clearly out to
N, the forcing of the erroneous direct Hadley circulation with ascent at
N and descent at the equator can largely be explained by errors originating from the MC.
Thus far, in trying to study the growth of zonal-mean wind errors, we have shown mean circulation biases (as in
Figure 3), but clearly a more detailed examination of the time-mean zonal-momentum budget is required. Such budget includes, in addition to mean circulations (Hadley and Walker), contributions from the longitudinal pressure gradient, the Coriolis term, transports by transient eddies, transport by stationary eddies and frictional dissipation [
36,
37]. This will be the topic of a future paper. Having analyzed the mean-state circulation and atmospheric moisture transports associated with the EASM, we present, in the next section. their response to changes in one of the main components of the EASM, the WPSH.
3.2. Interannual Variability of the WPSH
The location and intensity of the WPSH are crucial components of the East Asian summer monsoon and act to modulate the monsoon seasonal evolution [
10,
38]. In AMIP-N96, as in many models, the seasonal mean WPSH is too weak and located too far east [
39], and we have shown, using nudging methodology, that some of this mean-state bias is forced by tropical biases originating over the MC, possibly in insufficient diabatic heating. To be more specific, we can use the 850 hPa geopotential height,
as a measure of the location and intensity of the WPSH [
12].
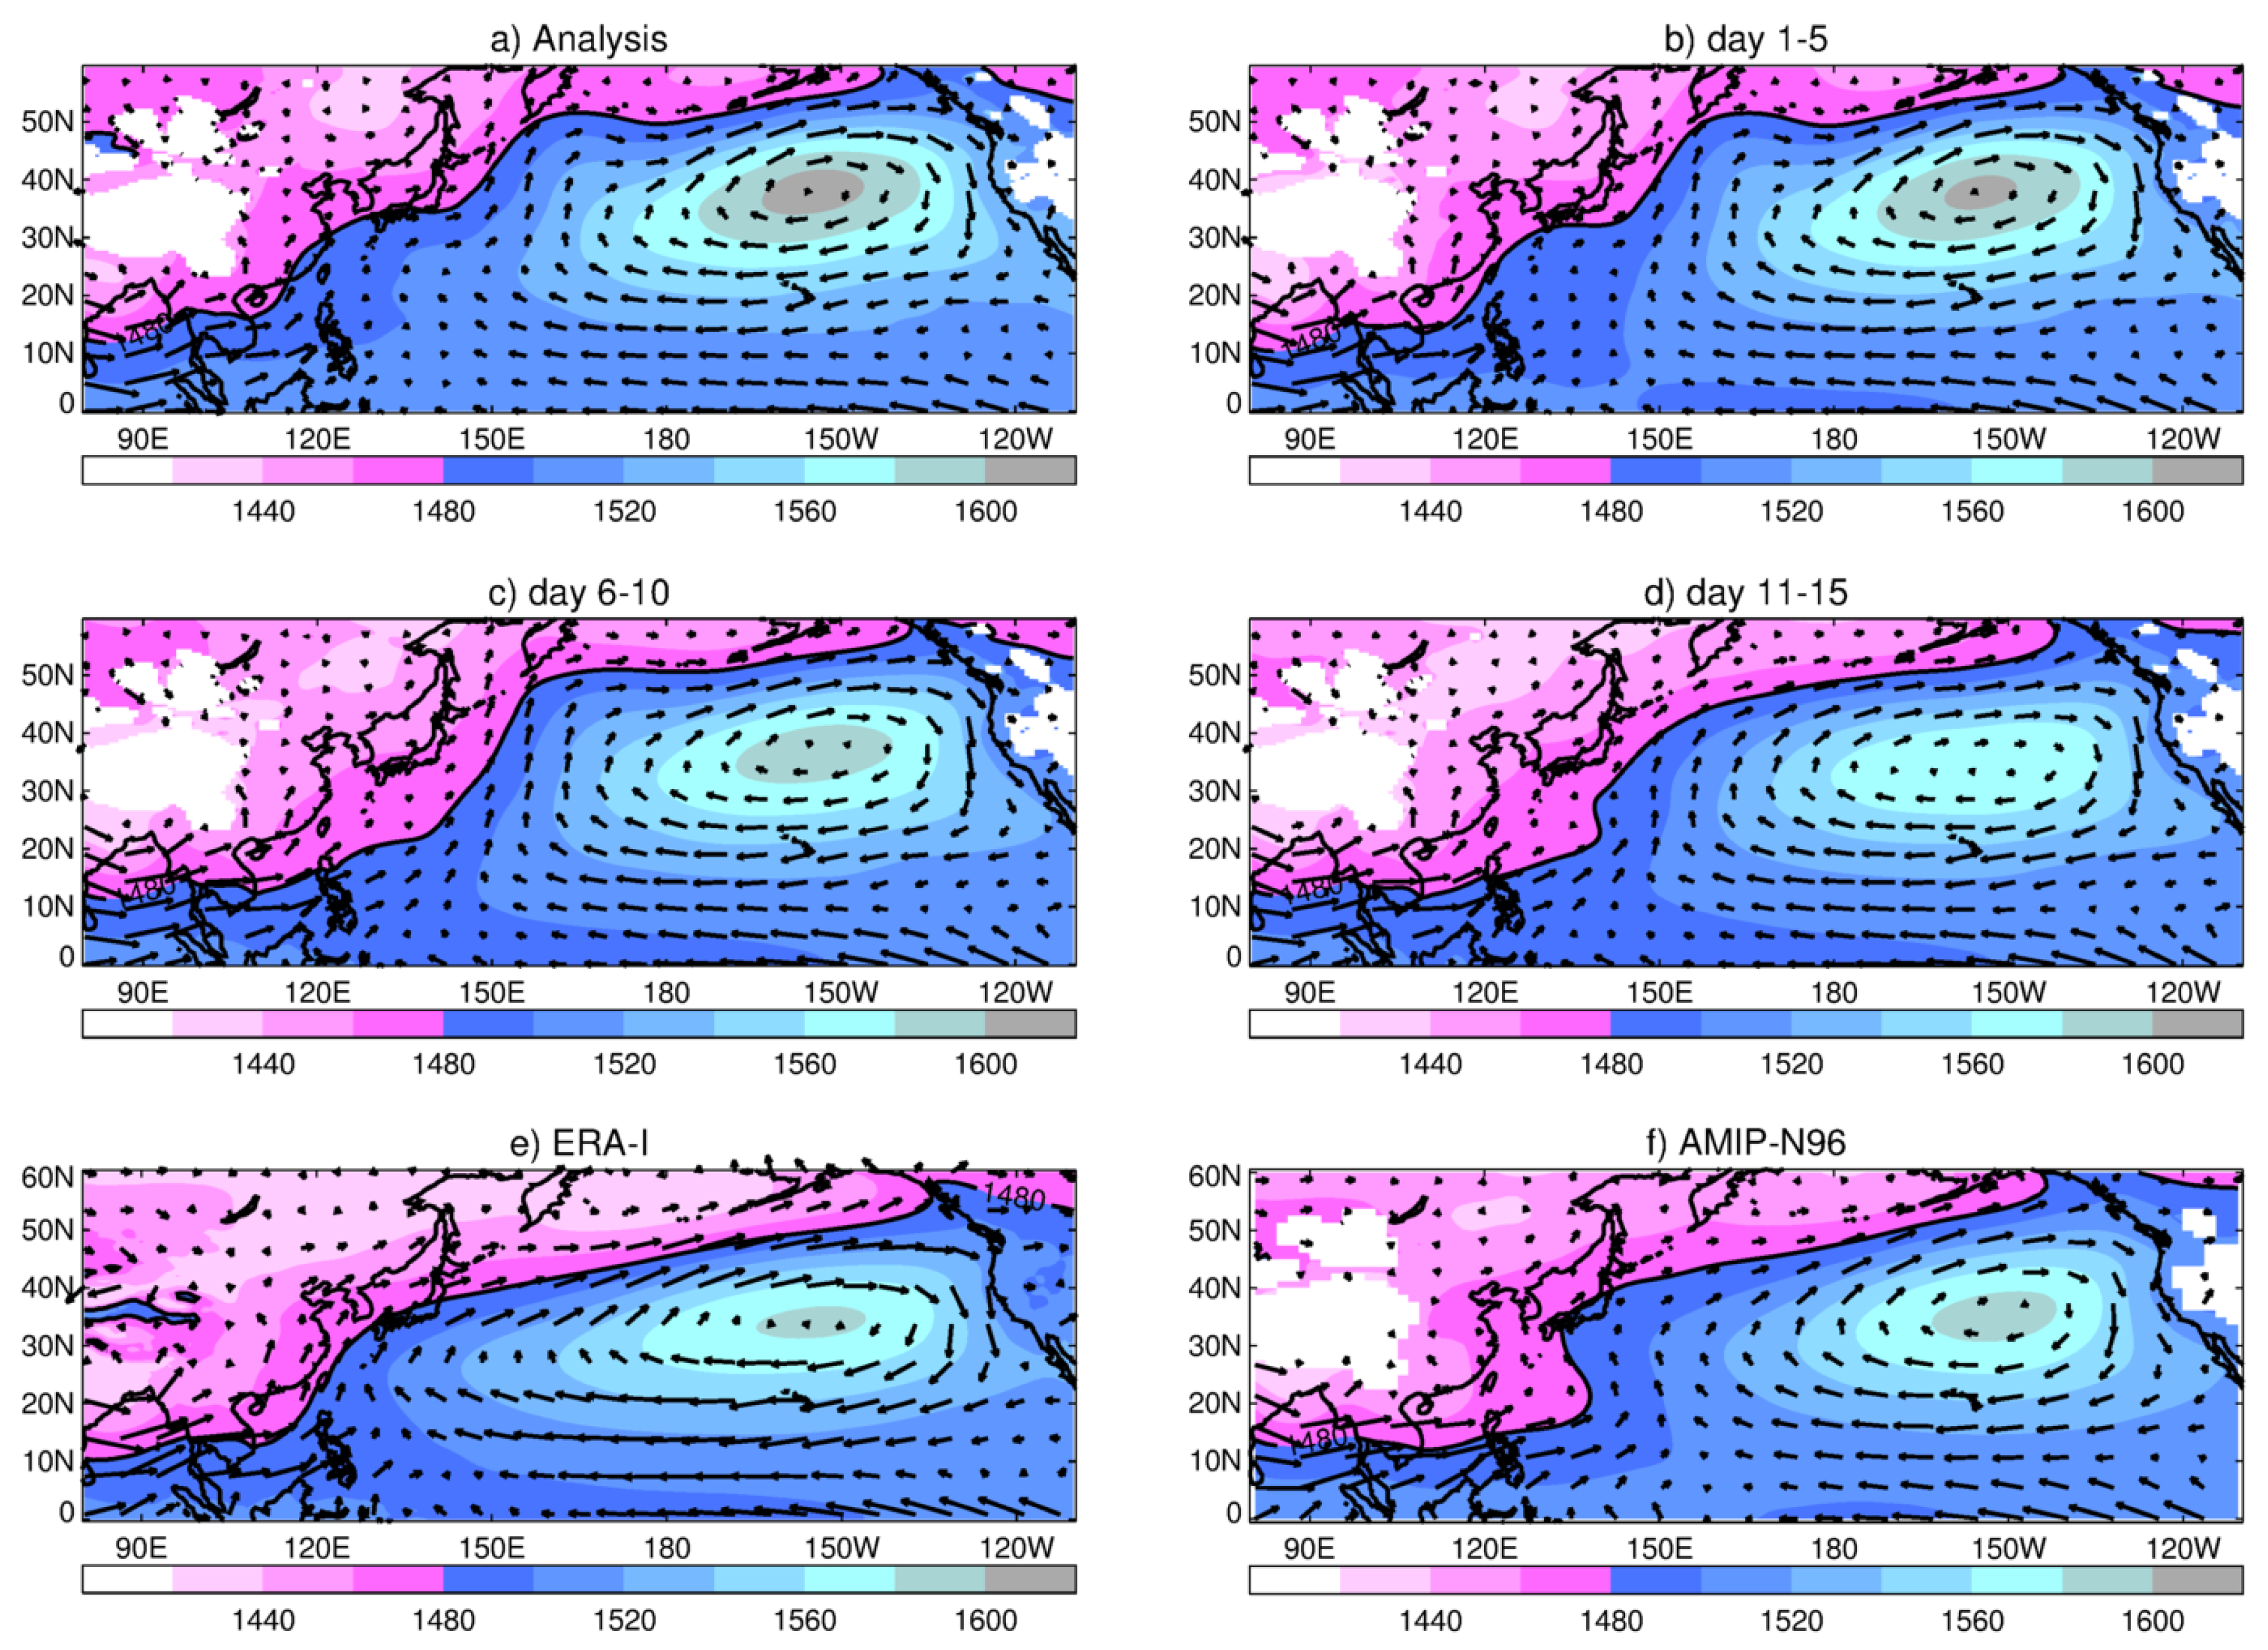
Figure 4a shows mean June–August 2016
over East Asia and the West and Central Pacific in MetUM analysis. The centre of the climatological anticyclone is located at approximately
W,
N. In MetUM hindcasts, as the forecast lead time increases from 1 to 15 days (
Figure 4b–d), the position of the high centre stays almost in the same place. However, the value of
at that central place (a measure of its intensity) decreases monotonically. That is, the WPSH becomes weaker. Using the 1480 m contour line between
E and
W as a measure of the WPSH northern extent [
12], we see how, in the hindcasts, it moves south as the forecast lead time increases. Simultaneously, the westward extent moves east (see, for example, the 1480 m contour line in the region 120–150
E). This is most noticeable in the tropical Pacific, where a strong westerly wind pushes the
m border deep into the West Pacific (
Figure 4d). These errors are consistent with the long-time systematic error seen in the AMIP-N96 model (
Figure 4f). For comparison, the long-term mean
for ERA-I is shown in
Figure 4e. This shows a significant northward flow over China on the westward flank of the WPSH, which becomes much weaker in NWP hindcasts as lead forecast time increases, and in the AMIP simulation.
To objectively compare the representation of WPSH in analysis and model simulations, we use three indices,
,
and
, following [
4] and [
12]. They represent, respectively, the intensity, the westward extension and northern edge of the WPSH. The indices defined in the above references have been modified slightly in this work, to accommodate to model simulation biases in their representation of the WPSH.
is defined as the regional average value of geopotential height at 850 hPa on points where it is greater than 1480 m, over the target region 115
–170
E,
–25
N. To measure
, the geopotential height values over the target region are subtracted by
. Then,
is defined as the longitude of the westward extension of 0 contours of the subtracted field. The north extension,
, is defined as the latitude of the WPSH ridge position, where the ridge is defined by points on which the zonal wind,
u, at middle level (500 hPa) satisfies
, and
, over the region
–140
E,
–40
N.
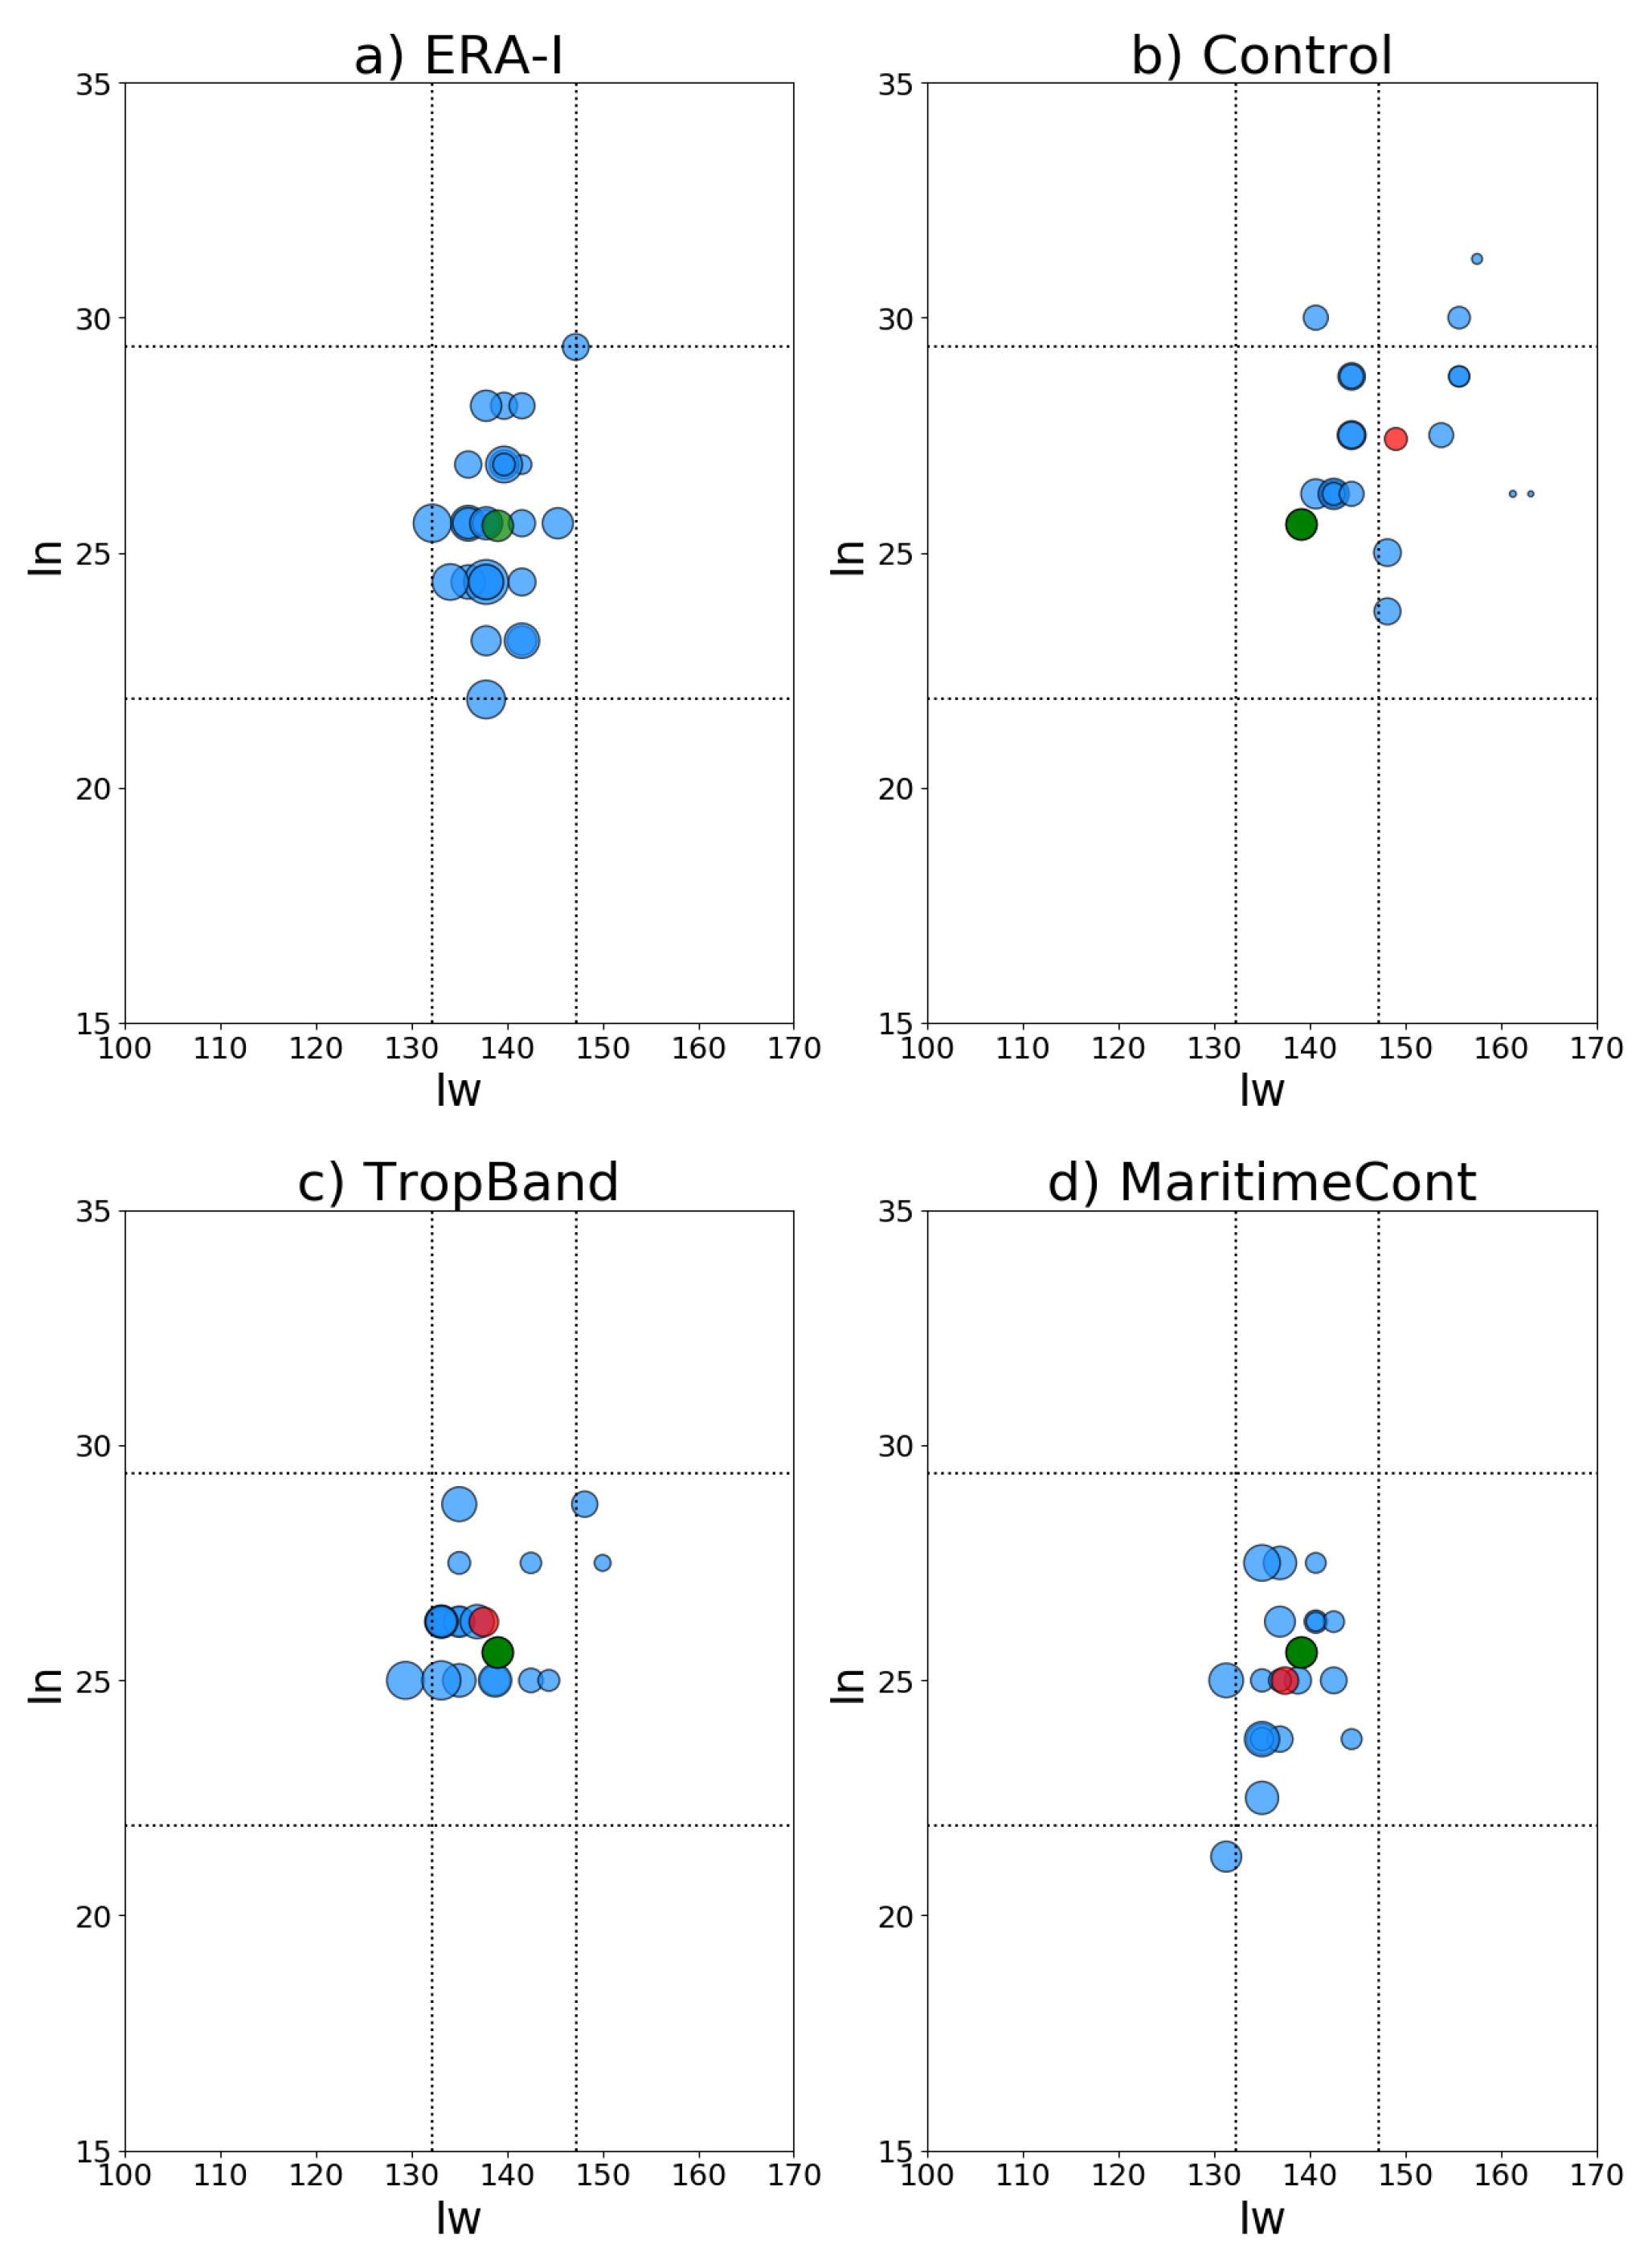
Figure 5 displays the interannual variability of summer WPSH intensity, its westward extension and northern edge, measured as scatter plots of the corresponding indices for ERA-I, AMIP-N96 and several nudging simulations. In ERA-I (
Figure 5a), the westward extension of the WPSH is confined to the region between
E and
E, while the northern edge is restricted to the region between
N and
N (this is indicated by the dotted lines in all panels of
Figure 5). Compared to ERA-I, the WPSH interannual variability in AMIP-N96 (
Figure 5b) shows a different structure. It is weaker, tends to be located further east and north, and its location varies more year on year. The differences between model simulations and observations can be summarized by their climatological (1982–2007) means, represented in
Figure 5b–d by the red (AMIP-N96) and green (ERA-I) dots.
Figure 5 also shows WPSH variability for two nudging experiments, the tropical band region and the Maritime Continent domain (
Figure 5c,d). A better representation of the WPSH variability is achieved when each of those regions are nudged (
Figure 5c,d. The WPSH tends in those cases to be weaker than in ERA-I, but its location and variability are in better agreement with their ERA-I’s counterparts. Improvements in the representation of the WPSH when the Maritime Continent region is nudged suggest that such region also plays a role remotely forcing the model circulation errors associated with the WPSH.
3.2.1. Moisture Transport Response to the WPSH Variability
To study the effect of summer WPSH variability in the East Asian regional hydrological cycle, we analyse atmospheric moisture fluxes in the region and perform land water budgets. We consider the impact of the WPSH intensity, westward extension and northward edge interannual variability using composites of moisture flux fields,
, and water cycle components. The composites have been created by collecting and meaning field values over years on which positive and negative WPSH index anomalies exceed the 30th percentile. Those composites are denoted hereafter by
,
,
,
,
and
, where the subindices indicate the WPSH index they are associated with.
Table 1 shows the years used in making up the various composites. In general, WPSH shifts in AMIP-N96 do not occur in the same years as in ERA-I case. This is expected for long-term free-run climate simulations, and suggests that the changes in the WPSH are not entirely driven by sea surface temperatures.
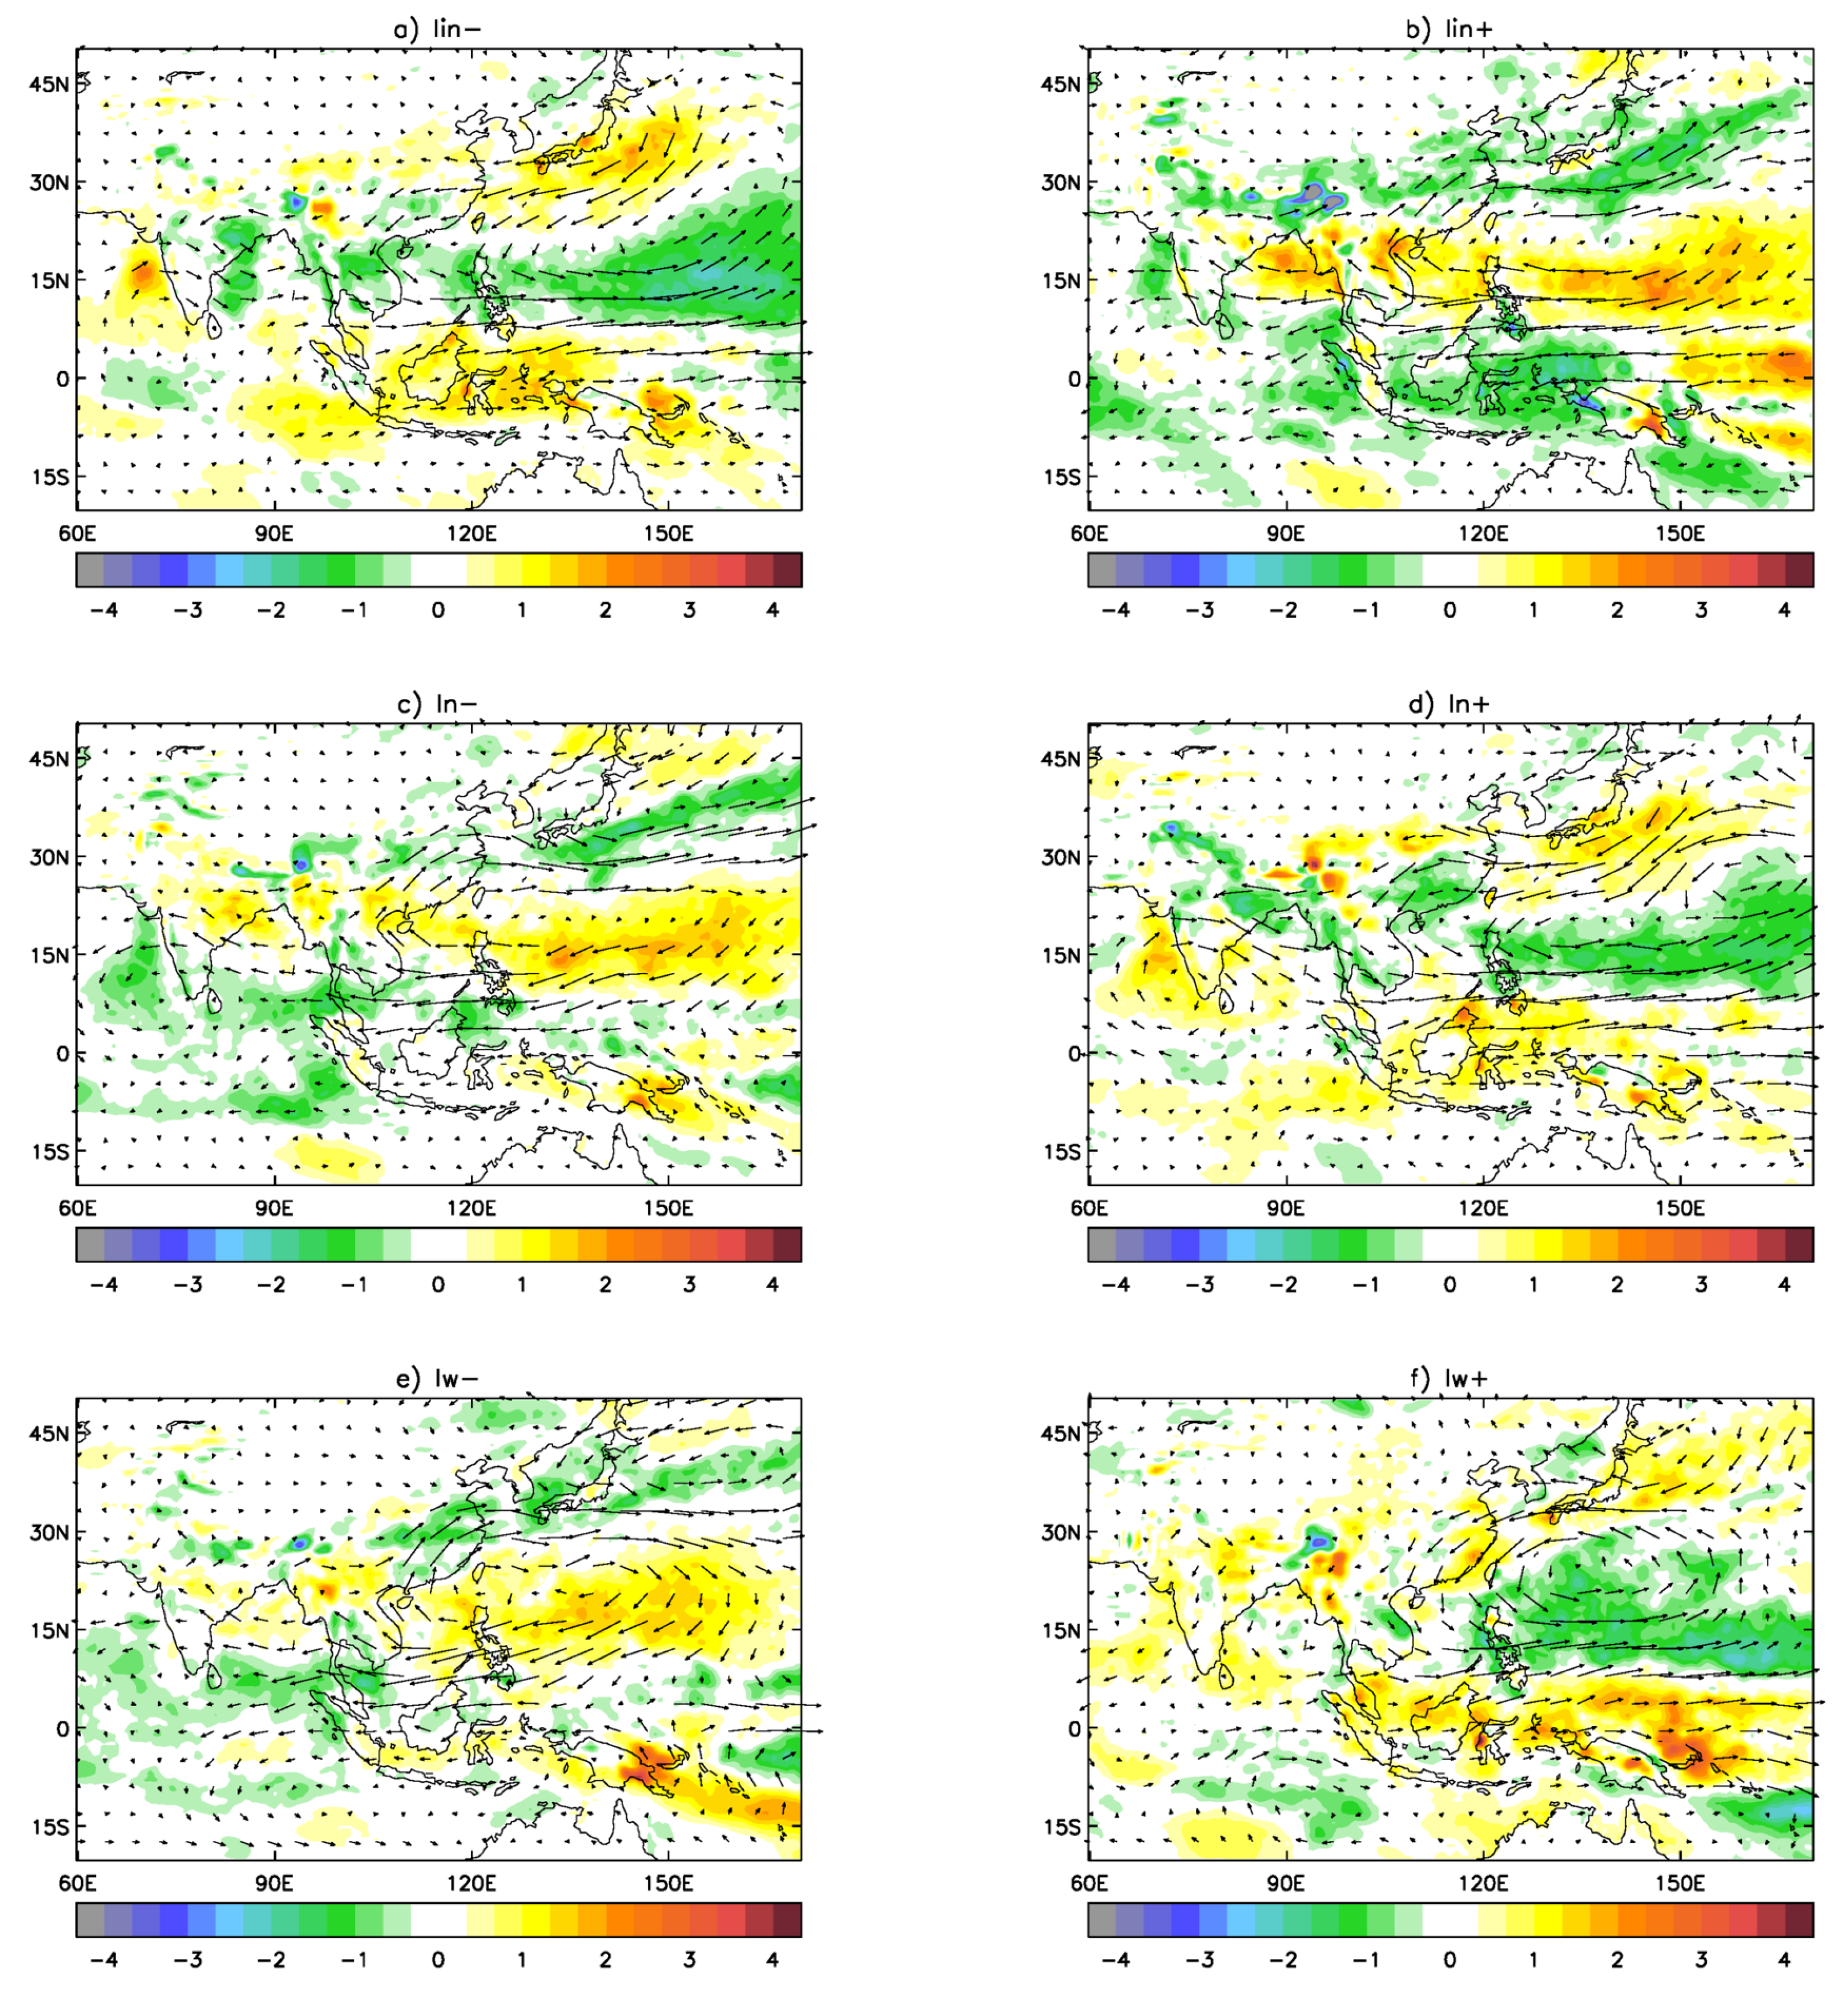
Changes in moisture transport and moisture convergence (relative to the mean state), associated with various ERA-I composites are shown in
Figure 6. The intensification of the WPSH (
composites,
Figure 6b), is manifested as an anomalous flow that enhances moisture convergence in a band centred at about
N that includes the Yangtze River basin in China and continues in the Western Pacific, South of Japan, to the international date line. It also causes a reduction of moisture convergence in a similar band, south of the previous band (especially in the West Pacific from
E to
E). On the other hand, a weakening of the WPSH (
Figure 6a) causes similar bands of increasing and decreasing moisture convergence, but, in reverse positions, bringing an increase of moisture convergence in Southern China and a reduction in North East China, Japan and its neighbouring seas.
When the WPSH moves south of its climatological value (
composites,
Figure 6c), it produces an anticyclonic anomalous moisture flow centred in the South China Sea, which is analogous to the case of intensification of the WPSH and, together with a northeasterly moisture flow from the North Pacific, causes similar bands of increased and reduced moisture convergence. The similarities in the moisture transport response to intensity and North–South shifts of the WPSH suggests that they are not independent. This is indeed the case; the timeseries of intensity and northern edge indices,
and
, are strongly anticorrelated in ERA-I (Pearson’s coefficient of −0.64).
A westward displacement of the WPSH (
composites,
Figure 6e) produces an anomalous anticyclonic moisture transport which increases the northward moisture flux at South China Sea and creates moisture convergence in South and East China, the Korean Peninsula, Japan and the North Pacific. It also decreases moisture convergence in the West Pacific (in a band from 10
N to 20
N). Conversely, when the WPSH moves eastwards (
Figure 6f), an anomalous cyclonic moisture transport in the area occurs, which drastically increases moisture convergence in the West Pacific. This response to an eastward shift of the WPSH, as expected, looks similar to the long-term mean moisture transport error in AMIP simulations.
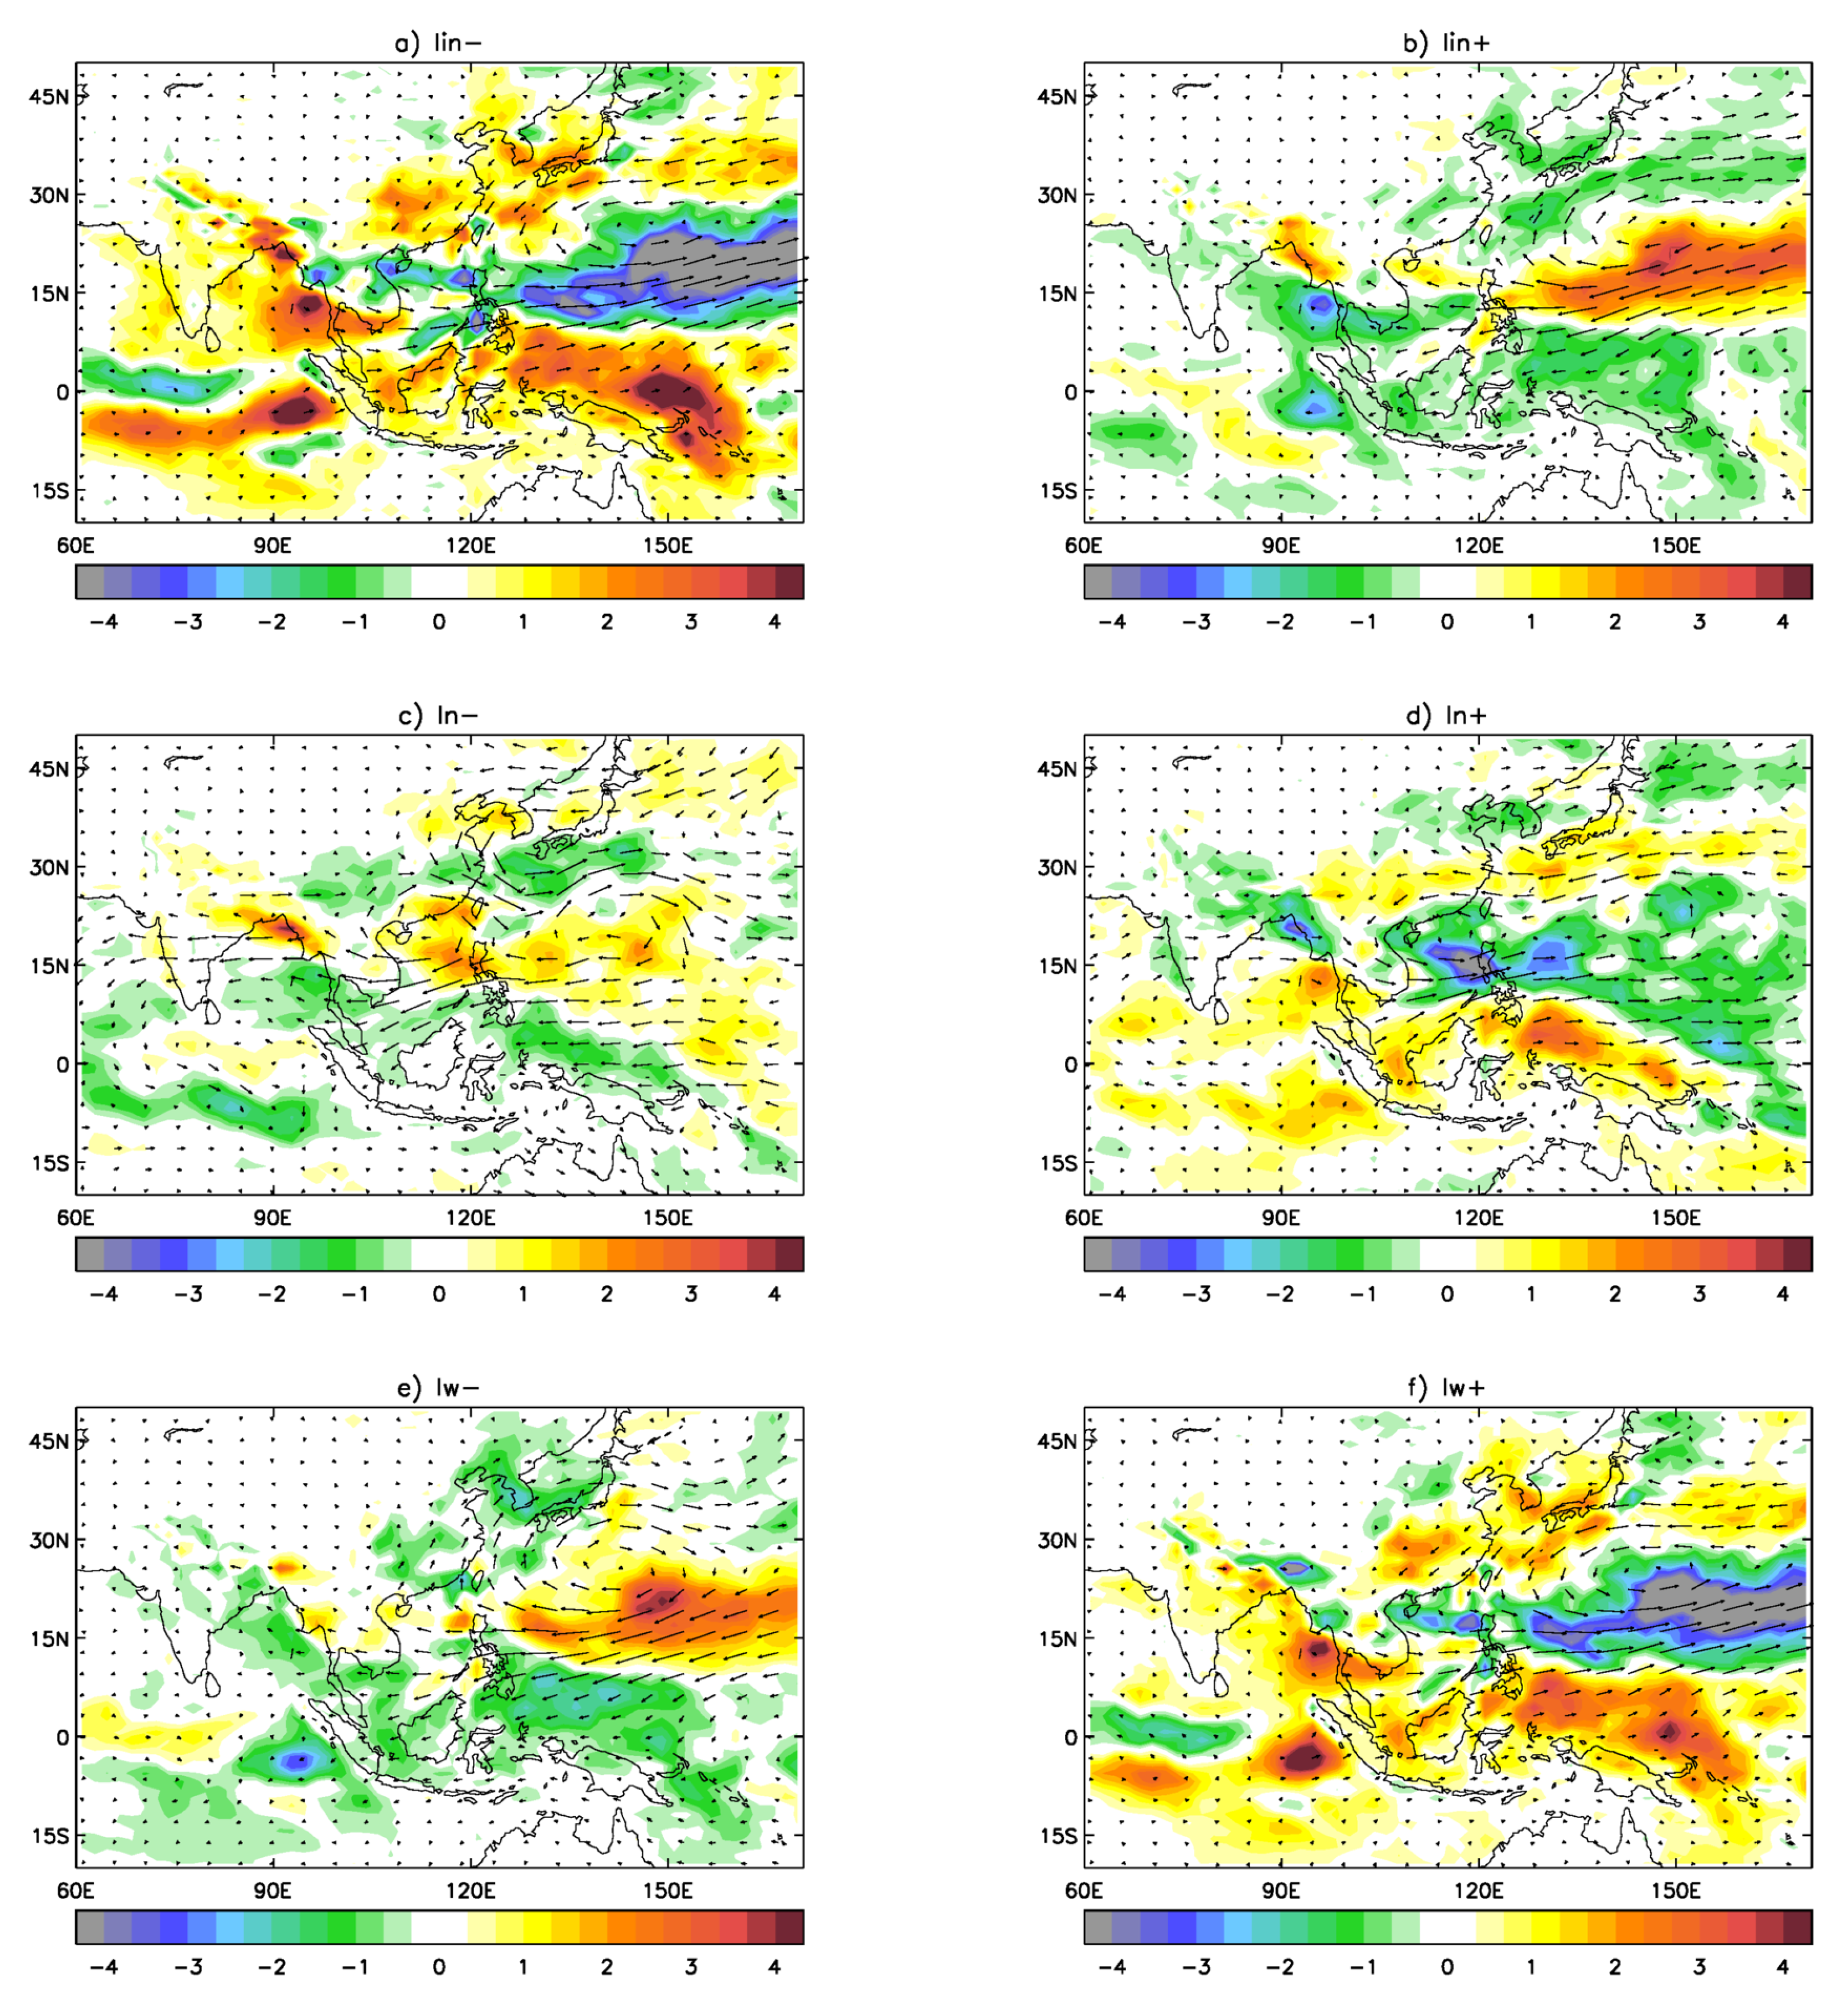
We now analyse changes in atmospheric moisture transports in AMIP-N96 as a response to shifts in the WPSH. The anomalous anticyclonic moisture flux associated with the intensification of the WPSH (
Figure 7b) is located further east, compared with the equivalent in ERA-I. It still produces contiguous bands of enhancement and decrease in moisture convergence with some similarity to the ones in ERA-I. However, the band of enhancement in moisture convergence is weaker in Easter China and stronger in the West Pacific. Moisture convergence decreases drastically in the West Pacific, south of 30
N. Differences between model simulations and ERA-I are more noticeable in the case of weakening of the WPSH (
Figure 7a). In this case, AMIP-N96 shows a very strong increase of moisture divergence (drier conditions) in Southeast China, the Korean Peninsula, Japan and its surrounding seas, and an excessive enhancement of moisture convergence in the West Pacific, south of 30
N.
A southward displacement of the WPSH in AMIP-N96 (
Figure 7c) brings changes in moisture convergence, which are similar to the ERA-I case. However, the further displacement east of the anomalous cyclonic moisture flux produces a stronger enhancement of moisture convergence in the Yangtze River basin and the West Pacific south of Japan.
In AMIP-N96, an anomalous anticyclonic moisture flux, similar to the one in the ERA-I case, is produced in the case of a westward shift of the WPSH (
Figure 7e). However, its extension is smaller and it is located further east and north. This brings an increase of moisture convergence in East China, the Korean Peninsula and Japan similar to the one in ERA-I case, although somehow stronger and an enhancement of moisture divergence in the West Pacific, which is too excessive. What do these changes in atmospheric moisture transport mean for summer rainfall in specific areas in the East Asian region? To answer this question, we analyse changes in regional water budgets in the next section.
3.2.2. Changes in Regional Precipitation
Precipitation over a land region comes from three sources: moisture already present in the atmosphere, convergence of moisture transported into the region by atmospheric circulation and moisture supplied by local evaporation from the land surface (recycling of fallen precipitation). To study how these sources of East Asian precipitation are modified by changes in the WPSH, we calculate regional water budget components in three domains shown in
Figure 8. We consider here the cases of intensification and westward displacement.
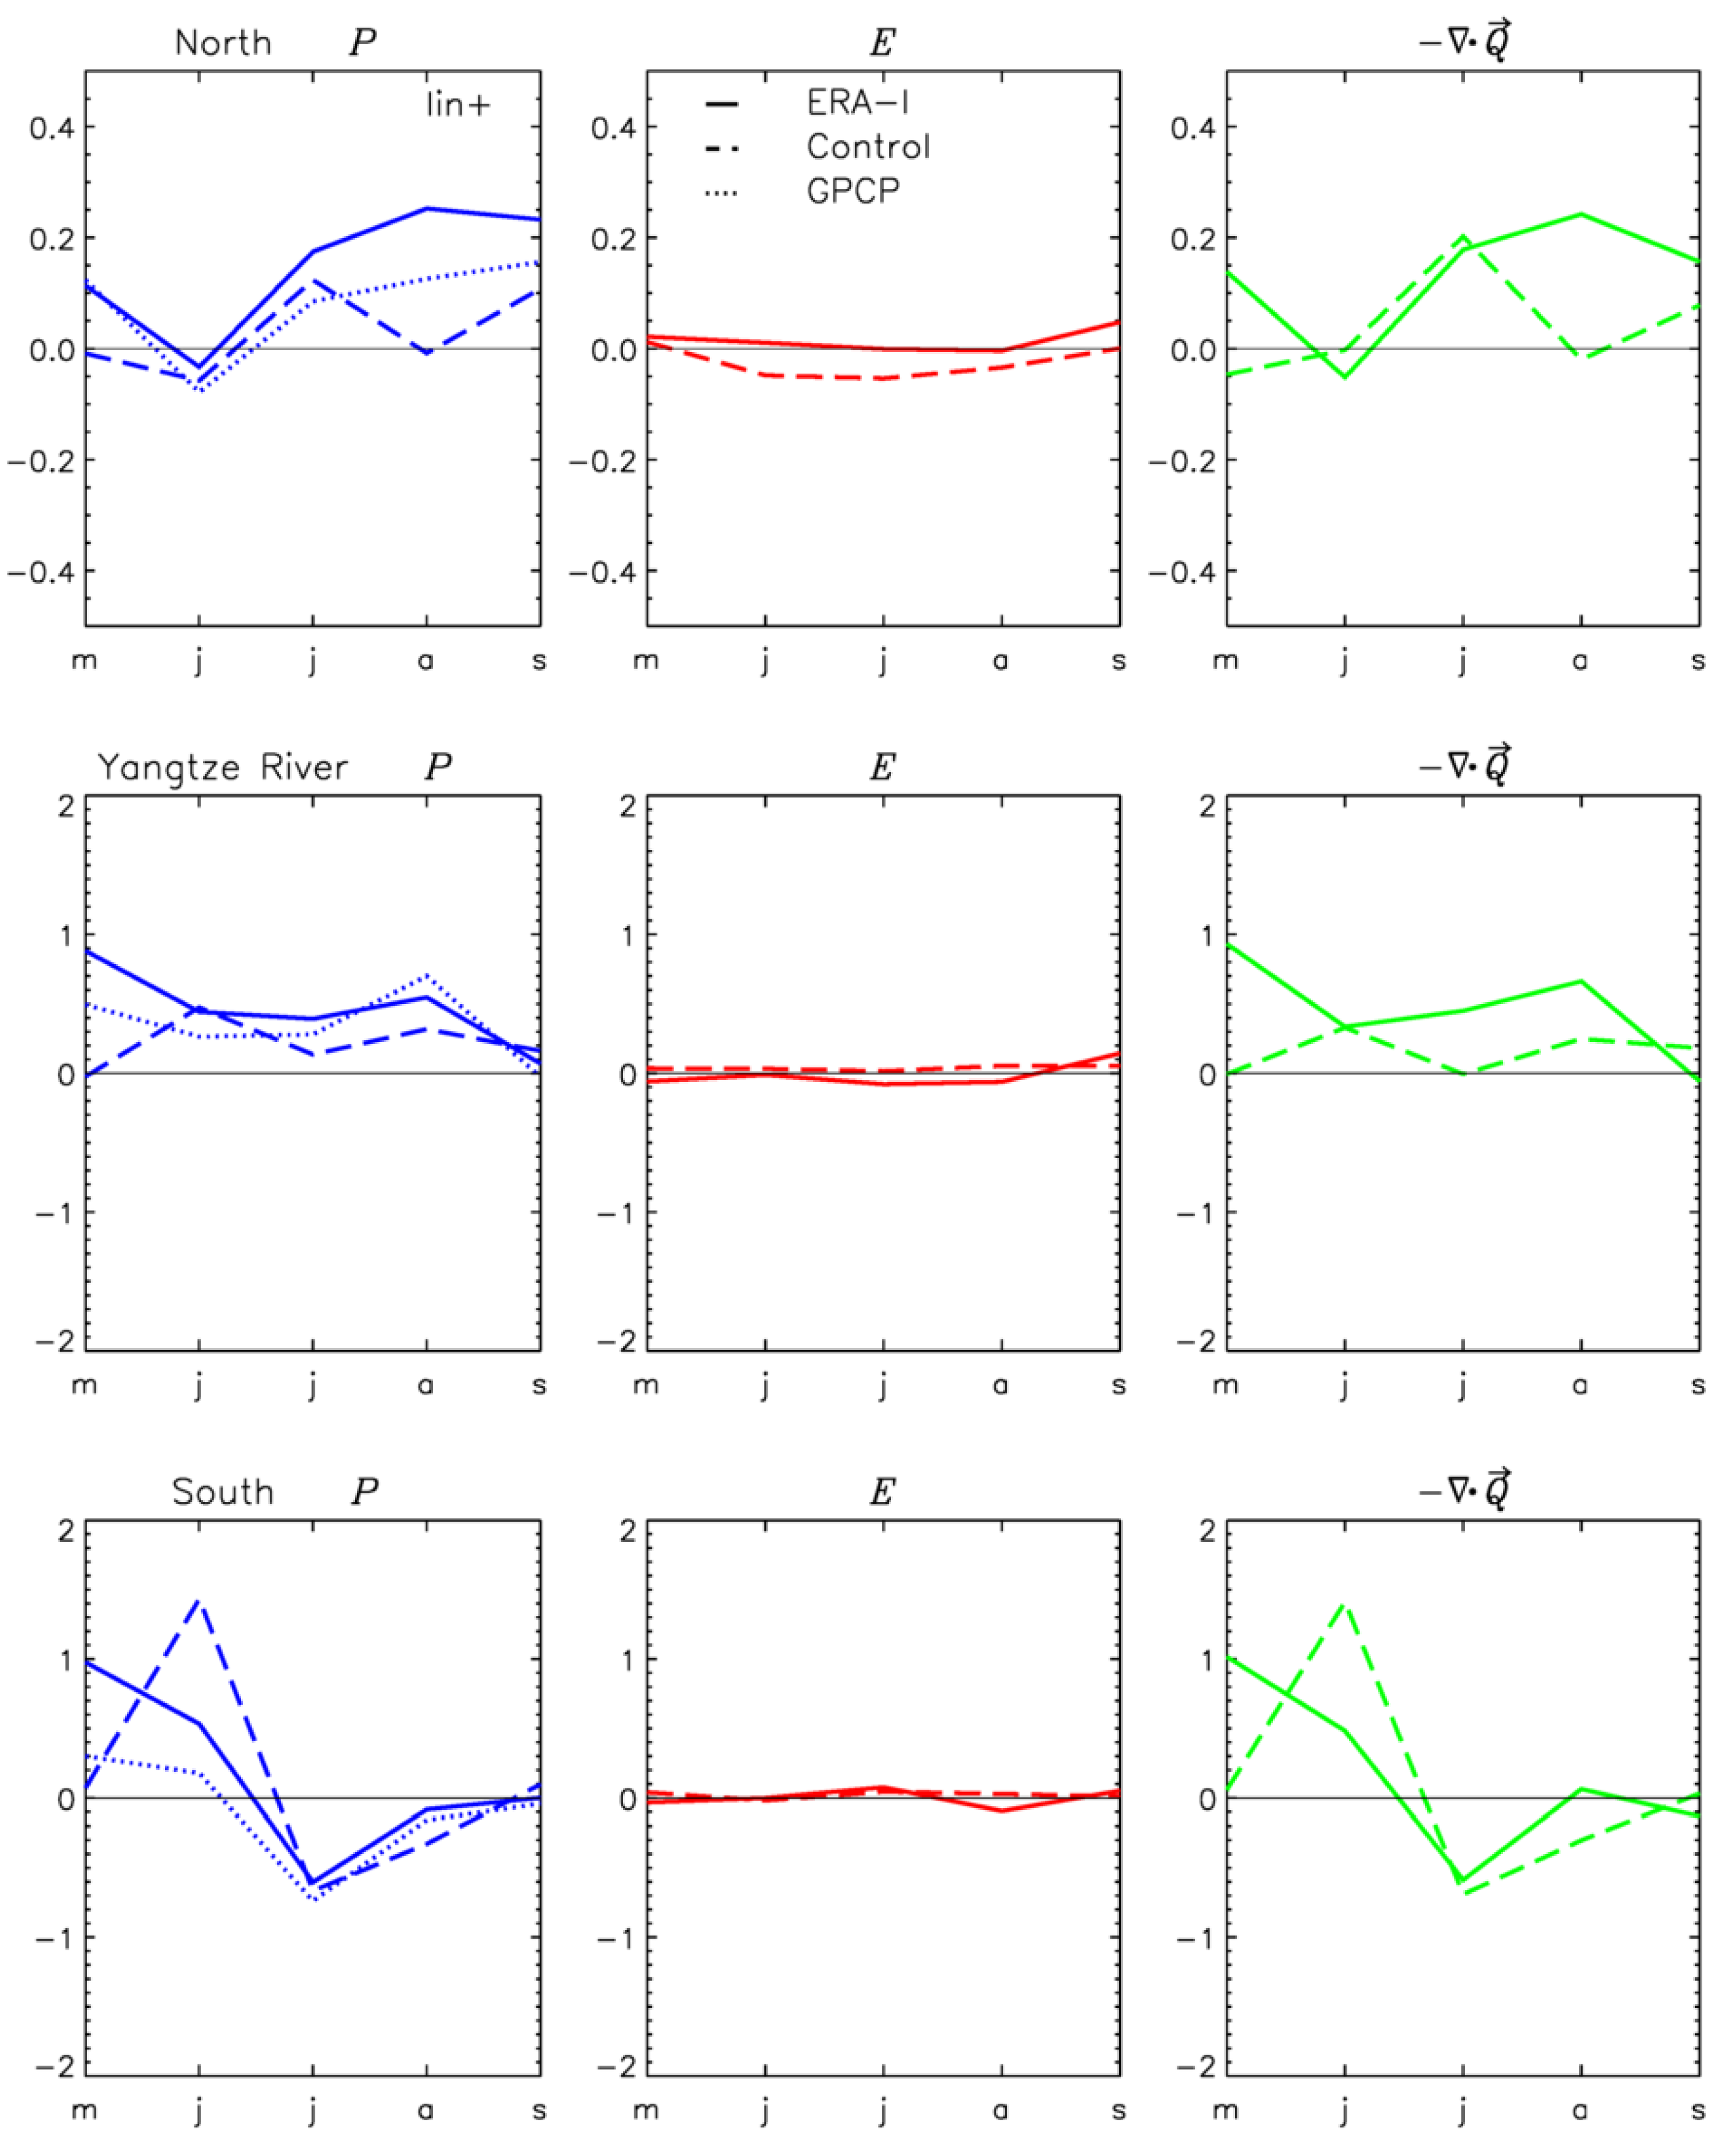
Figure 9 shows monthly changes in precipitation, evaporation and moisture convergence during the May–September season for composites associated with an intensification of the WPSH for ERA-I and AMIP-N96. Overall, moisture convergence is the dominant component and drives the monthly variability of precipitation. Intensification of the WPSH increases precipitation over the three domains and produces the following specific changes in ERA-I’s water budget components:
North domain (
Figure 9, top panels): an increase in moisture convergence, which peaks in August and brings an increase in seasonal precipitation. There is only a small contribution from evaporation to the changes in rainfall. AMIP-N96 also shows an enhancement of moisture, but it peaks too early (July). In AMIP-N96, the contribution from local evaporation to the precipitation change is negative (reducing the increase in precipitation).
Yangtze River (
Figure 9, middle panels): a seasonal-long enhancement of moisture convergence which increases summer precipitation. AMIP-N96 also shows the increase in moisture convergence, but it is smaller and generates less precipitation.
South domain: An increase of rainfall from May to mid June, followed by a rainfall reduction from mid-June to September, driven by similar changes in moisture convergence. This seasonal change in rainfall is relatively well represented in AMIP-N96, although the increase of precipitation in the first part of the season is too large in the model.
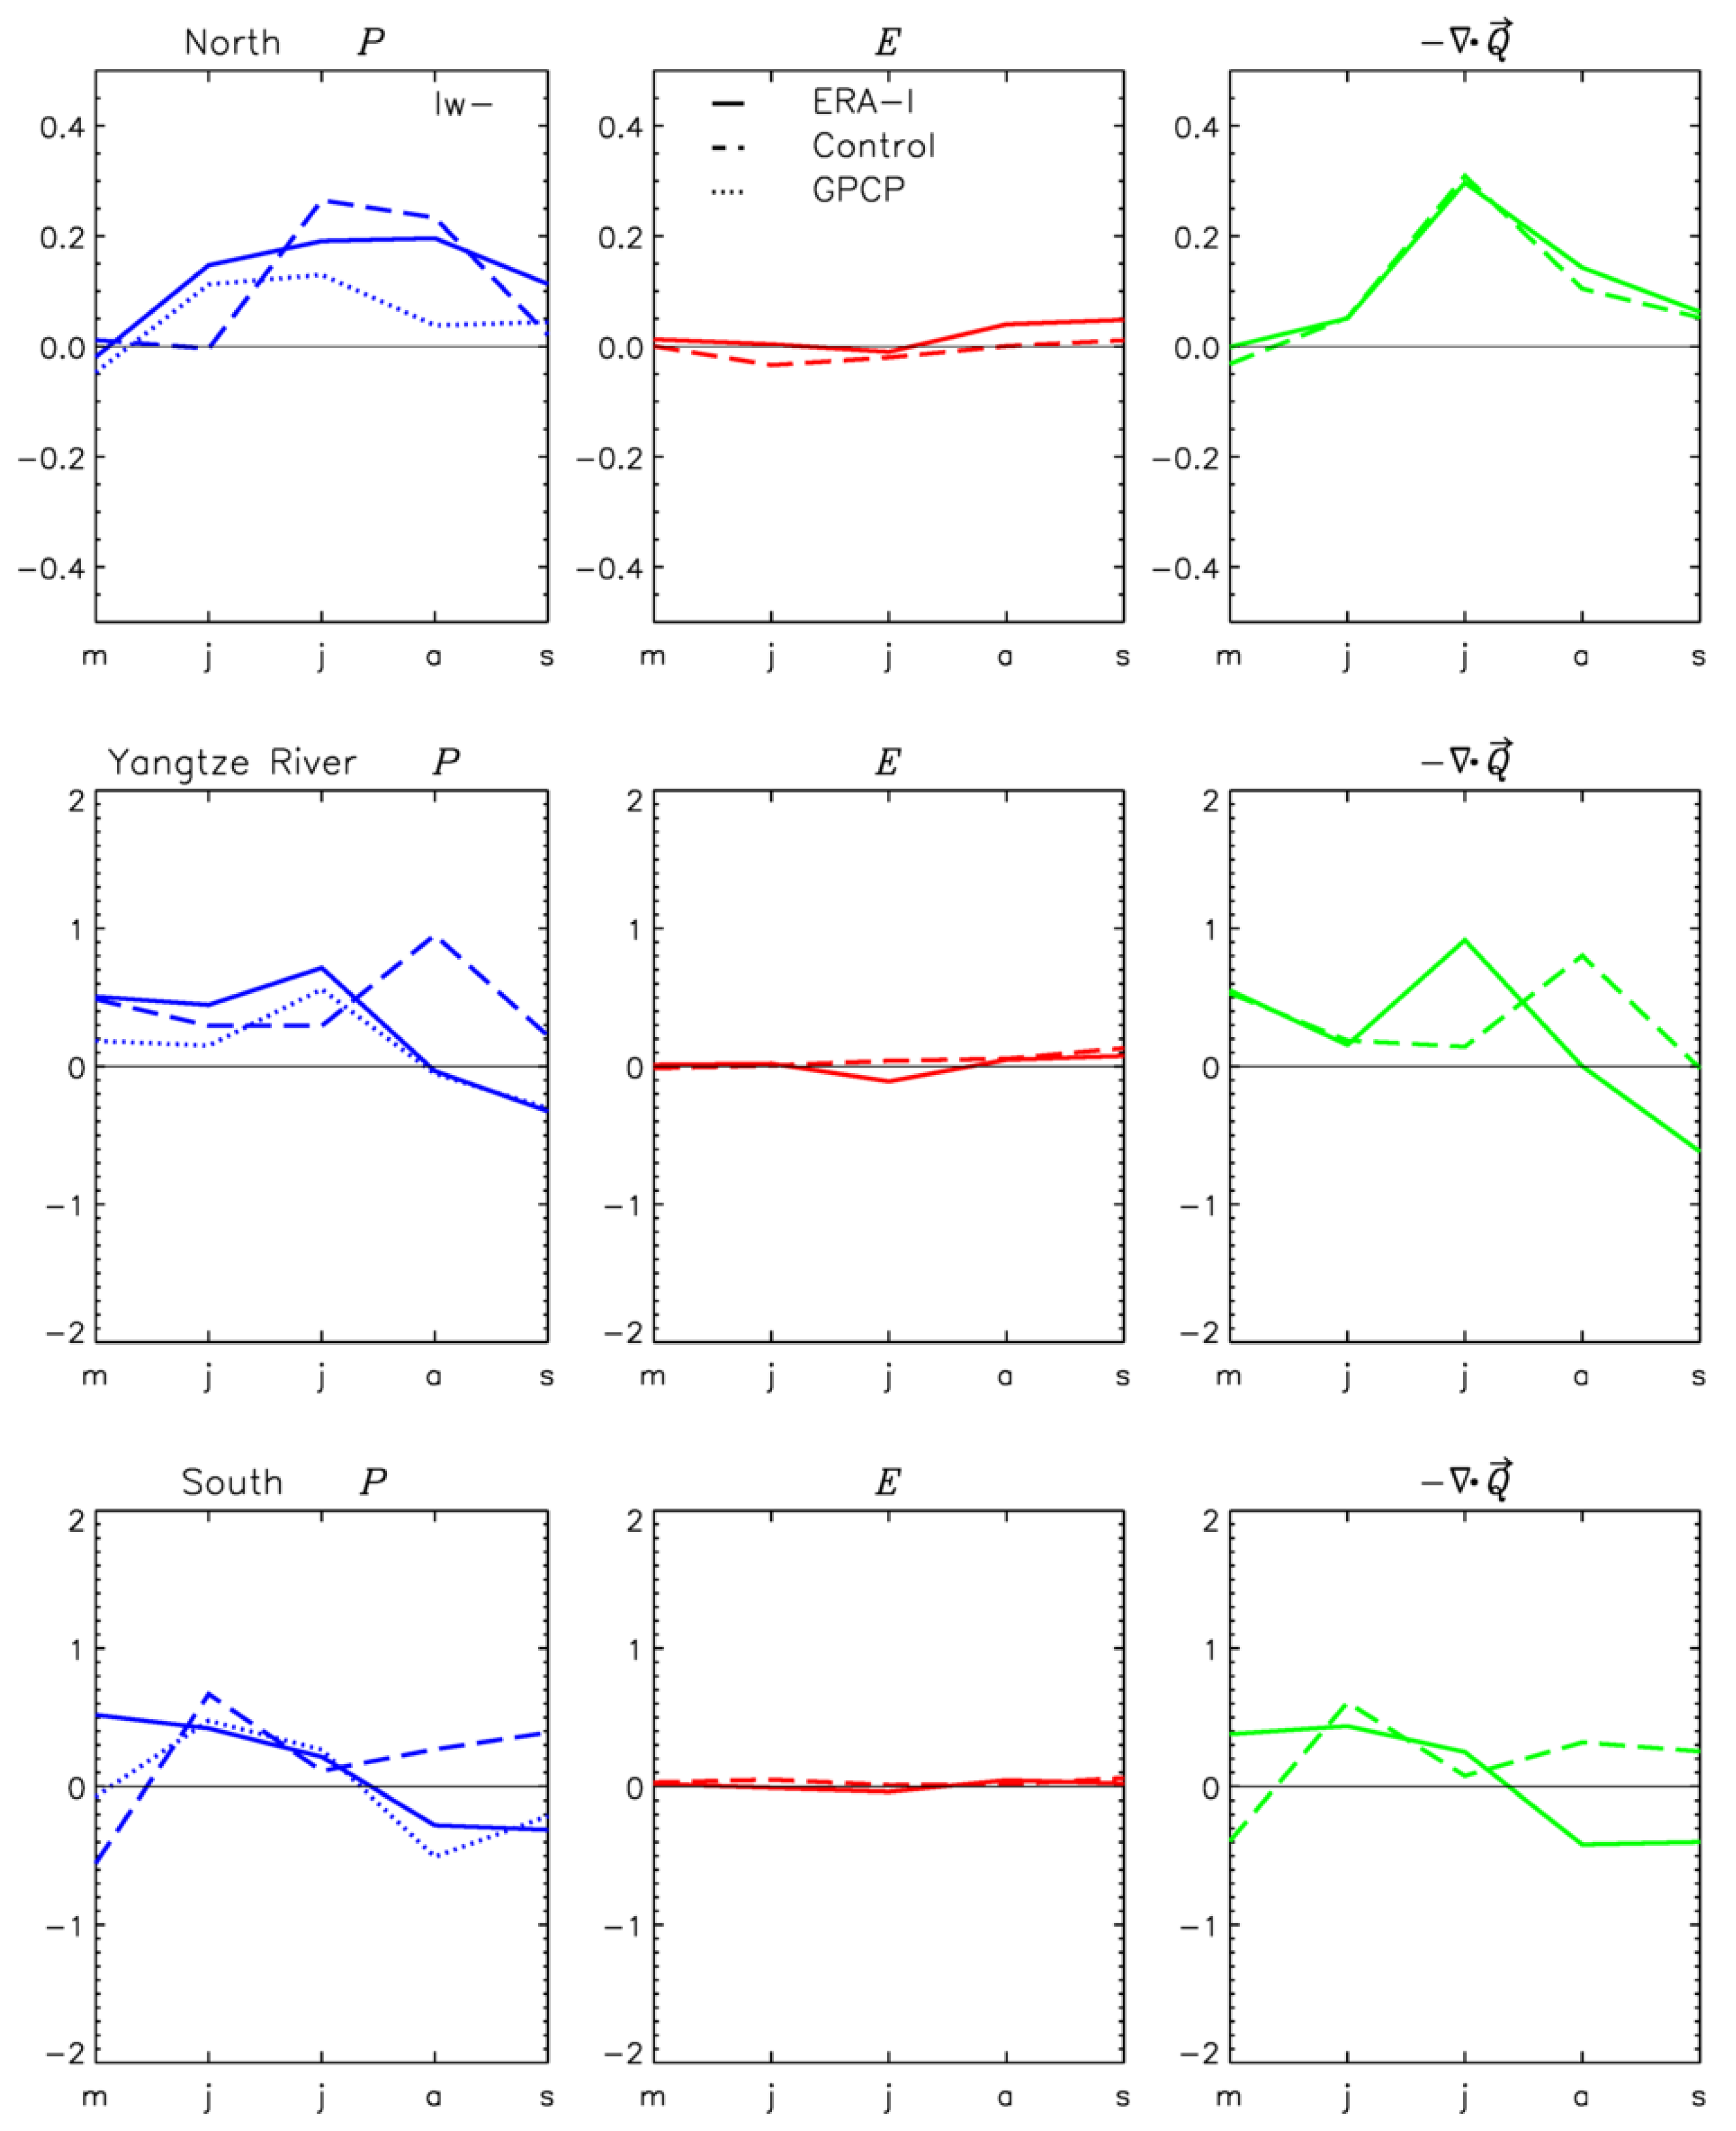
A westward shift of the WPSH increases seasonal precipitation in the North and Yangtze River domains, driven by an increase in moisture convergence. The changes in ERA-I budget components associated with such a displacement are the following (see
Figure 10):
North domain: a seasonal increase in moisture convergence, peaking in July. A good representation by AMIP-N96 of the change in seasonal moisture convergence does not bring the same increase in regional precipitation. This deficit, more noticeable in May and June, suggests that model local physics (parameterizations) are at play in the model error.
Yangtze River: increase of moisture convergence from May to August followed by a decrease from August to September. The positive anomaly is replicated in AMIP-N96, but it peaks later during the season (August, instead of July). In AMIP-N96, there is a small negative contribution from local evaporation that reduces the precipitation anomaly during the first months of the season.
South: a small increase in moisture convergence from May to the end of June, followed by a similar reduction of moisture convergence from July to September drives similar changes in the seasonal rainfall. In AMIP-N96, the WPSH displacement produces instead a season-long increase of moisture convergence. Since the changes in evaporation are negligible, these changes are replicated in the model’s regional precipitation.
To give a measure of uncertainty in the precipitation response to shifts in the WPSH, the left panels in
Figure 9 and
Figure 10 show changes in precipitation for the GPCP dataset (dotted lines) in addition to the ones for ERA-I. GPCP and ERA-I show differences in the size of the monthly anomalies associated with those shifts. On the other hand, AMIP-N96 anomaly errors (with respect to both sets of observations) are in general larger than the differences between ERA-I and GPCP responses.
