Environmental Life Cycle Assessment of Alternative Fuels for Western Australia’s Transport Sector


Abstract
:1. Introduction
2. Methodology
2.1. Fuel Selection
- Around 1.5 tonnes/ha was retained on the grain field to prevent soil erosion and enrich soil organic content [25].
- The average maximum cutting height from soil is 20 cm that does not go further due to the unevenness of the grain field [25].
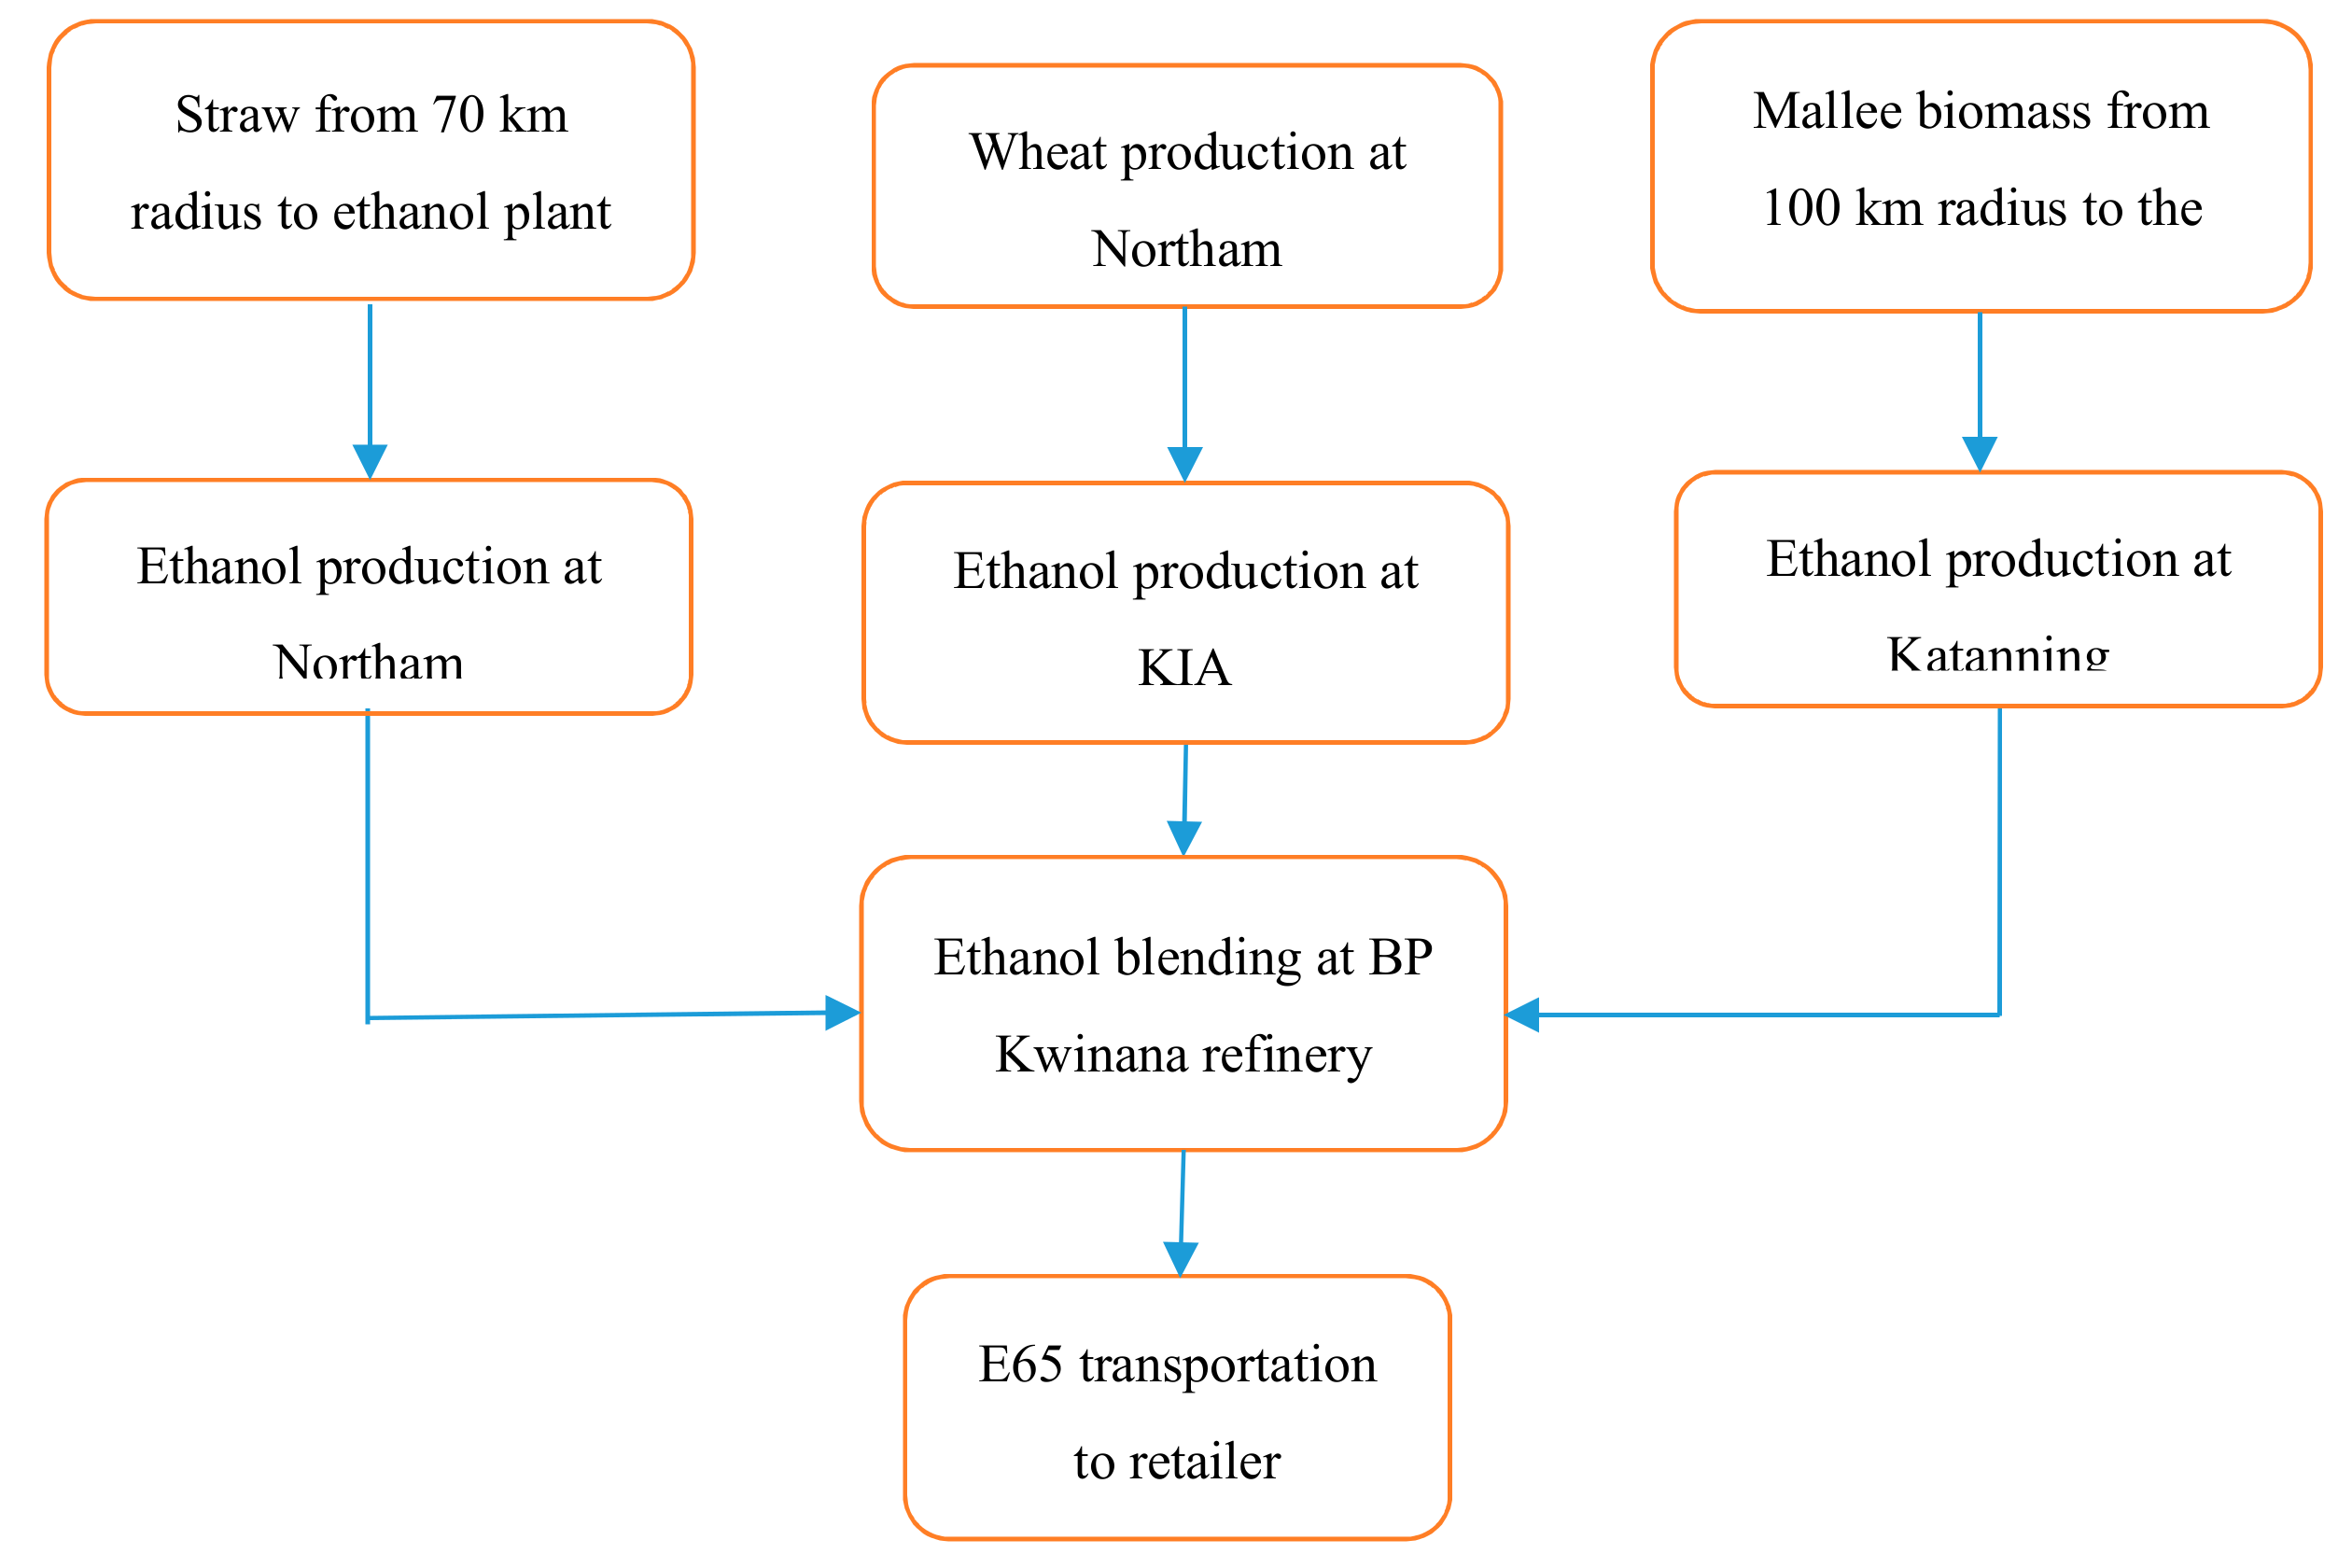
- Two locations (Albany and Three springs) were not considered due to the low resource availability of straw to fulfill the requirements for the plant [27].
2.2. Indicator Selection
2.3. Goal and Scope Definition
2.4. Life Cycle Inventory Analysis
2.4.1. Gasoline
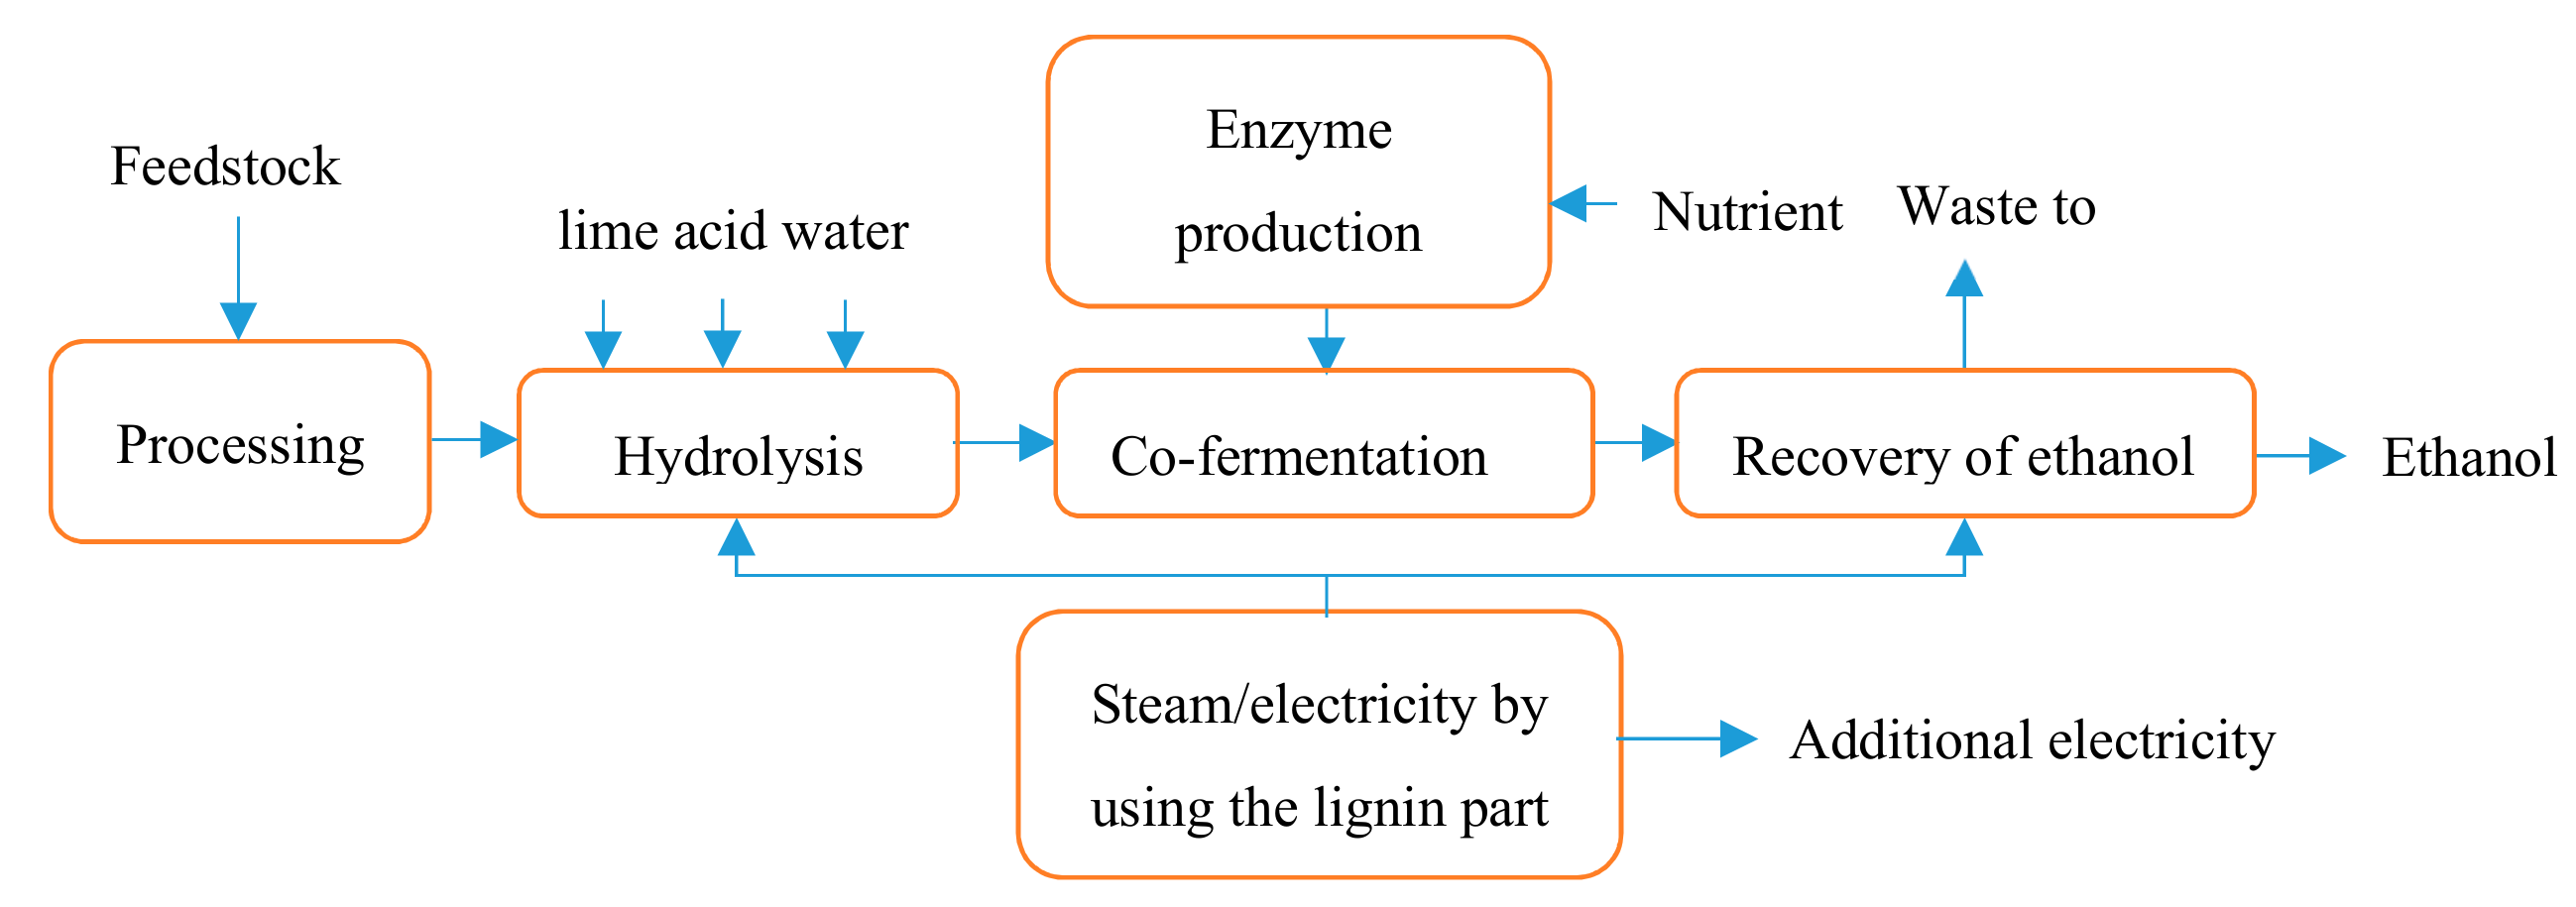
2.4.2. Ethanol
2.4.3. Electricity
2.4.4. Hydrogen
2.5. Life Cycle Impact Assessment
- Australian life cycle inventory emission database (AusLCI) libraries [105] developed by Australian Life Cycle Assessment Society (ALCAS) were employed to calculate the emissions corresponding to inputs used during the life cycle stages.
- Emission factors for international freight were considered to estimate the emissions for foreign transportation of chemicals and materials from overseas (e.g., urea fertilizers and membrane).
- Eco-inventory emission factors, AusLCI libraries and Western Australian electricity mix were used to estimate emissions from the Li-ion battery, charger, controller, inverter and converter for the electric vehicle.
- US input-output database was used to calculate the environmental impacts from farm machinery production during the agriculture of feedstock for ethanol fuel [69].
- The environmental impact of producing USD $1 (1998 price) equivalent farm machinery was available in the software database. In order to use this database, the current price of farm machinery was deflated to the 1998 price (average 2.45%) and converted to USD using the 1998 conversion factor [US$ 1=AU$ 1.5875] [106].
- Emission databases, such as Flexi-N fertilizer were developed based on the composition of Flexi N (40% urea, 40% ammonium nitrate and 20% water) [107].
- The process for enzyme production and water desalination were developed by using AusLCI libraries.
- The libraries for sodium metabisulphite and detergent for desalination were not available in the Simparo databases, so two main ingredients of sodium metabisulphite (sulphur oxide and caustic soda) were used to develop the emission databases for sodium metabisulphite [99]. In the case of detergent products, sodium silicate and sodium metasilicate pentahydrate were used [108].
- Although there are emission databases for the Western Australian electricity mix, this was slightly revised using the current electricity mix (Table 2).
3. Results and Discussions
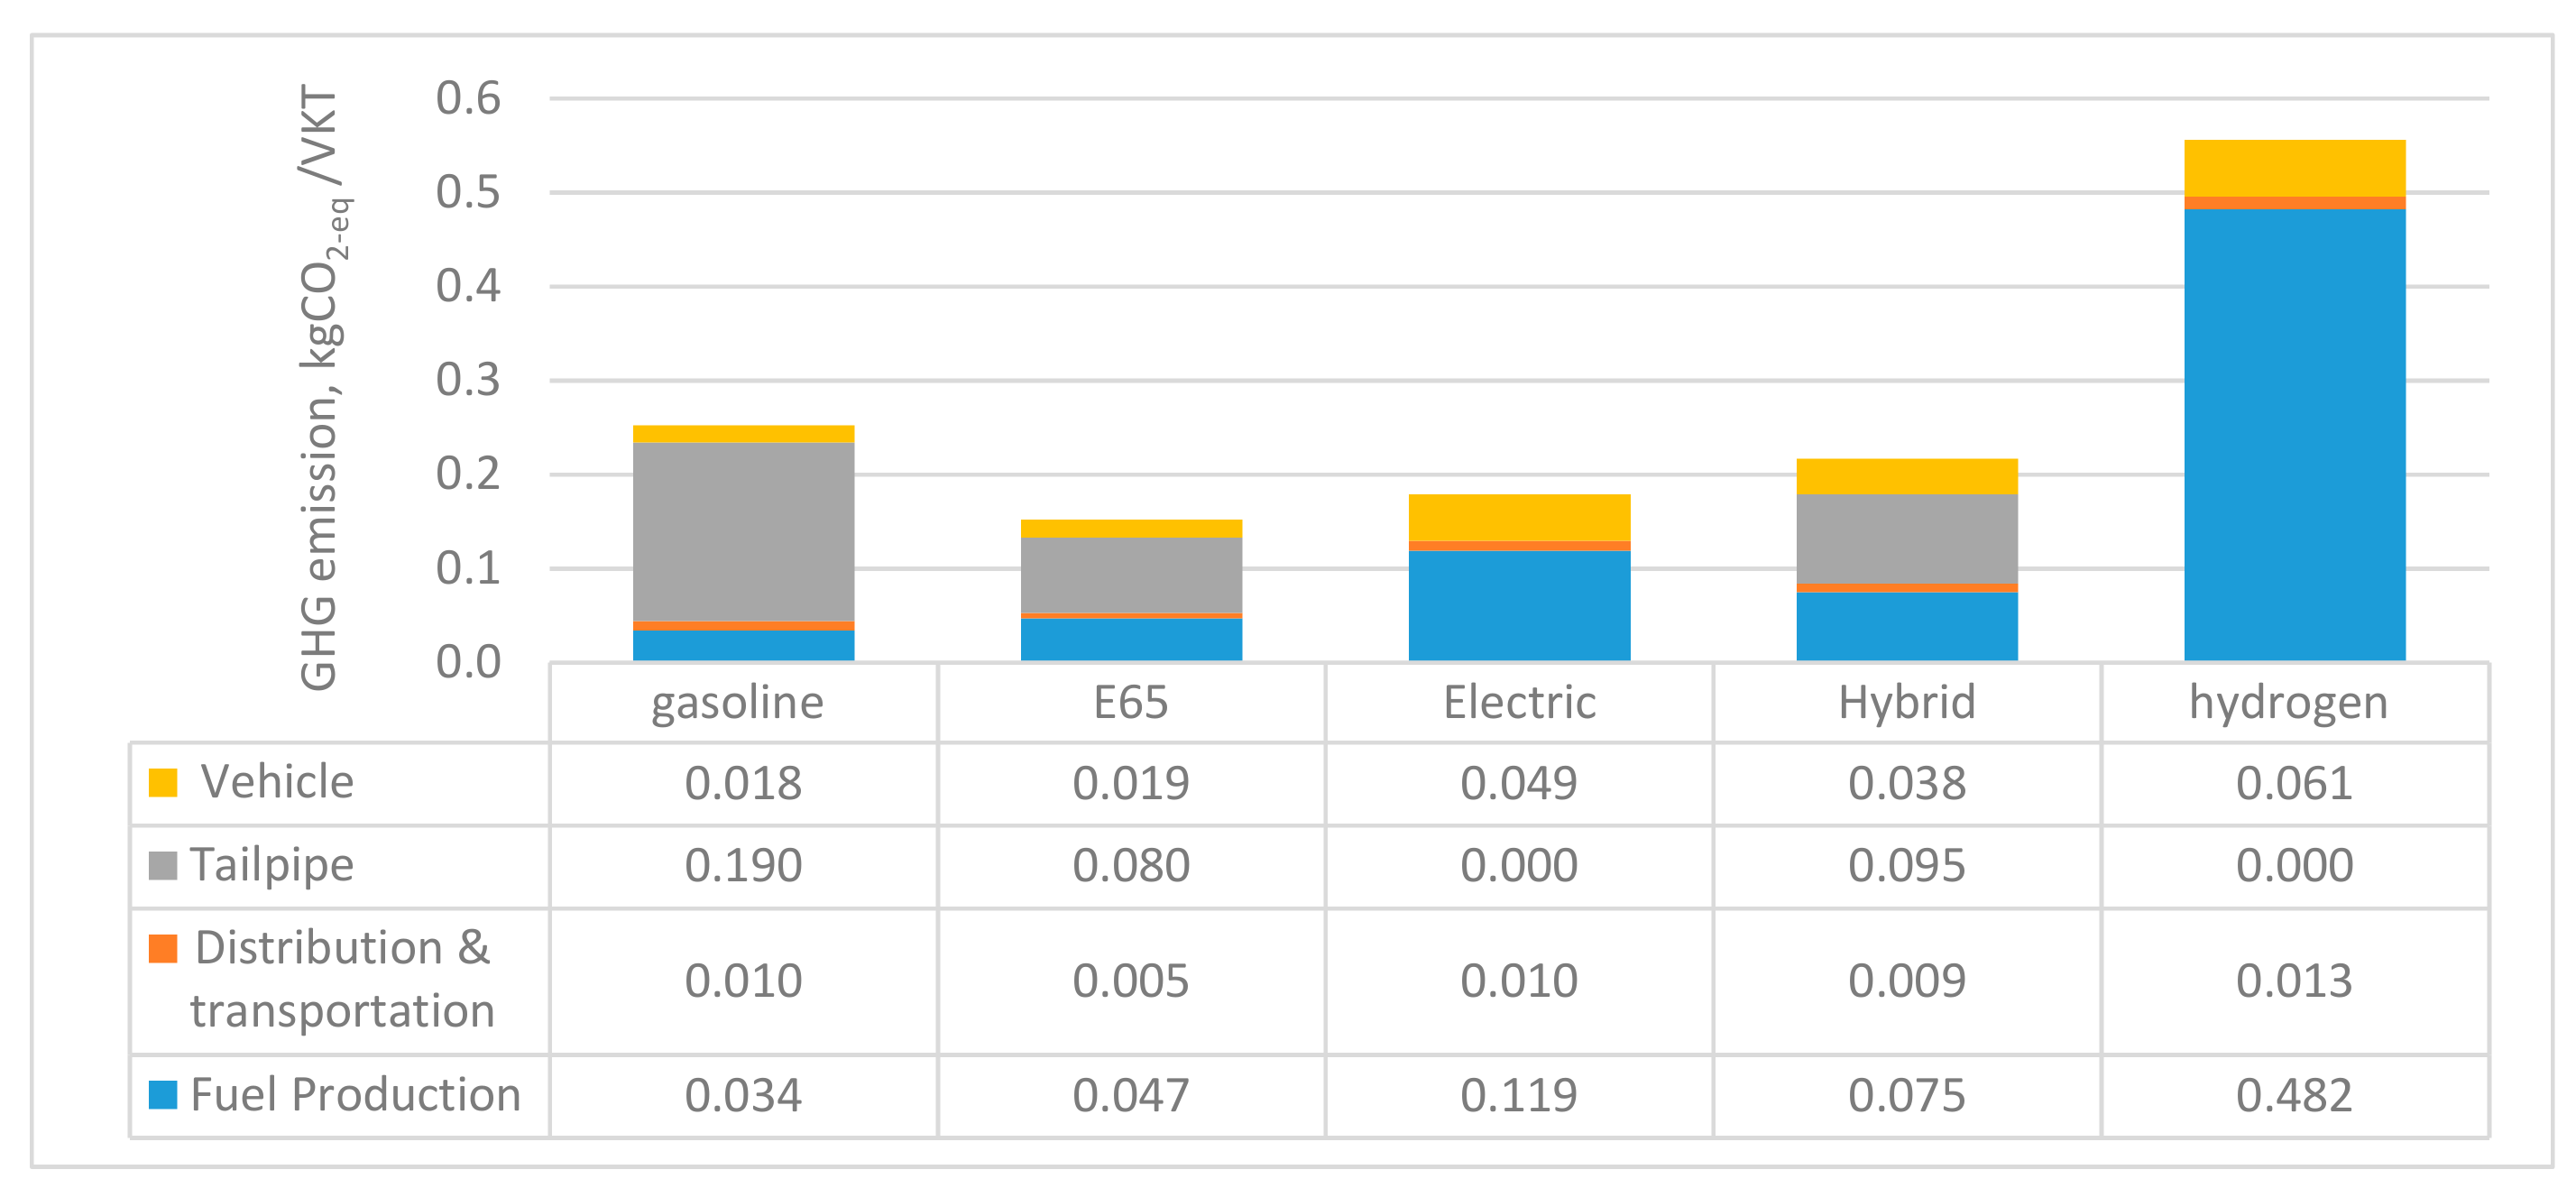
3.1. Global Warming Potential (GWP)
- For example, the GHG emissions for hydrogen fuel production and use in Western Australia for the current study (0.5 kgCO2-eq) is comparable with Biswas et al. (0.67 kgCO2-eq) in 2013 [10]. The GHG emissions of this study were lower due to the fact that it considered the recent WA’s electricity mix where the percentage of renewable was higher than that considered previously. Also, it considered the use of a more efficient electrolysis process.
- Emission from GV without taking into account glider emissions (.0184 kgCO2-eq /VKT i.e., total 2071 kgCO2-eq) and HFCV (.060 kgCO2-eq /VKT) were comparable to Stasinopoulos et al. (total 2137 kgCO2-eq without glider) [61] and Miotti et al. (around 0.085 kgCO2-eq/VKT with glider) [58] respectively. The GHG emissions for HFCV were higher for the previous study due to the consideration of glider materials.
- The reduction potential of GHG emissions associated with the replacement of an internal combustion (IC) engine with an EV powertrain of this study (29%) is slightly better than a previous study (22%) [22] in WA. This small difference mainly resulted from the use of updated energy mix and improved fuel efficiency.
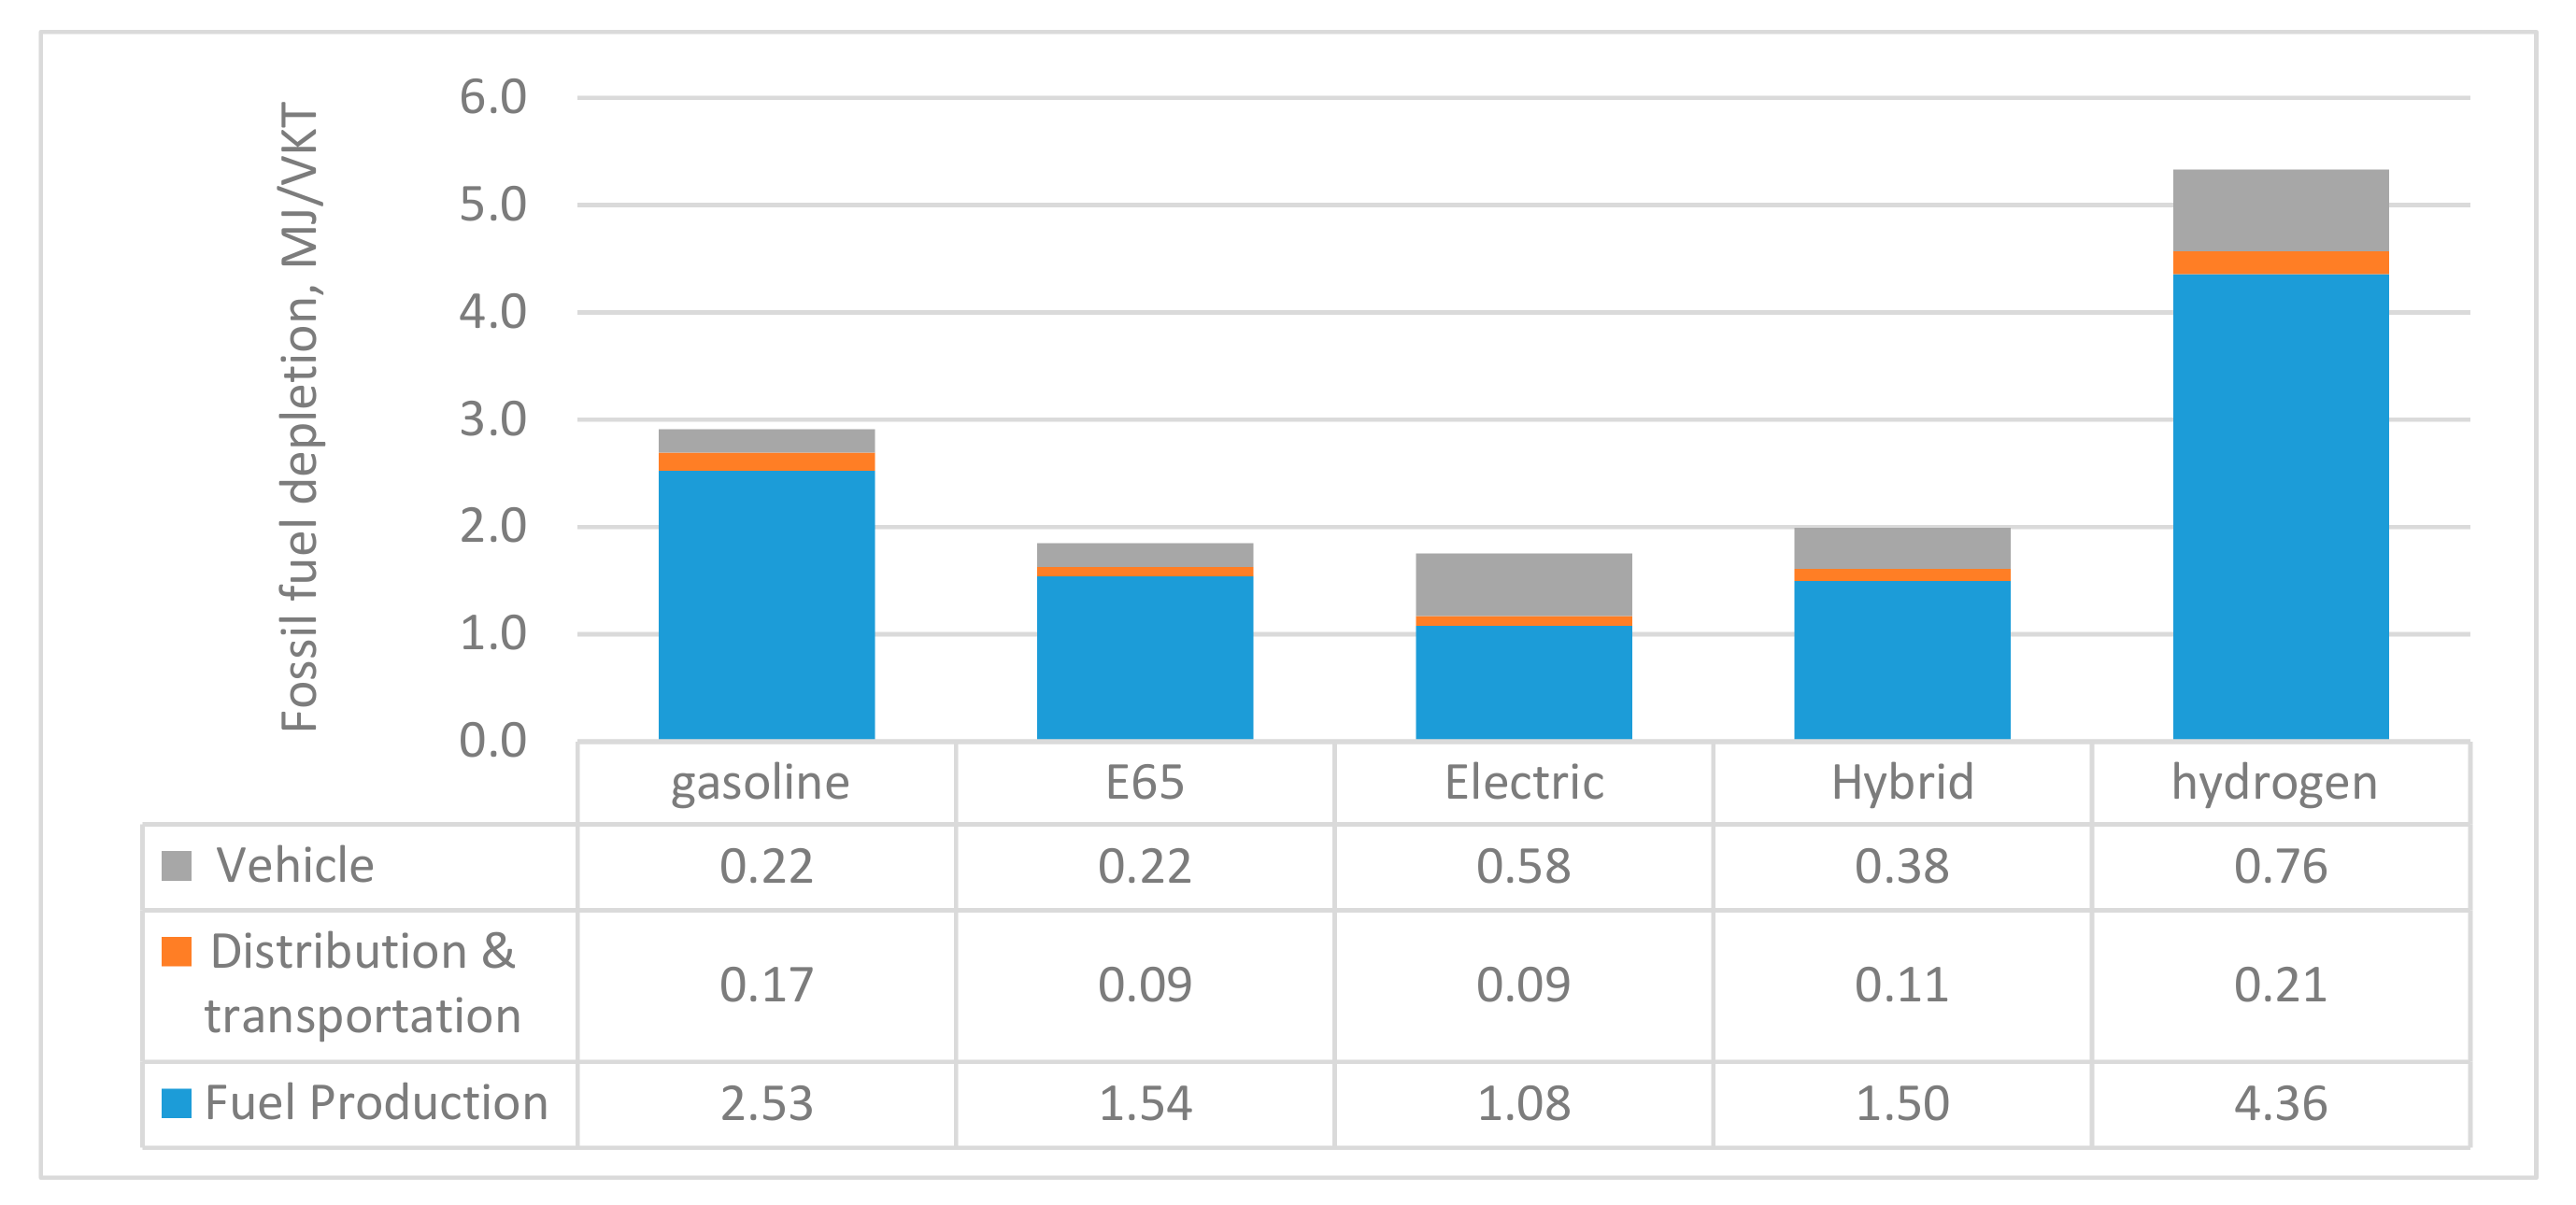
3.2. Fossil Fuel Depletion (FFD)
- Cavalett et al. [113] showed that E100 (100% ethanol) from sugarcane in Brazil produced 5 times lower FFD than the gasoline, while E65 containing 35% fossil fuel (i.e., gasoline) in this study produced almost 1.54 times lower FFD than the gasoline.
- In addition, the electric vehicle in different European countries reduced FFD impact between 25% to 36% depending on the electricity grid [23] which was comparable with the current study (i.e., 40% for the EV and 31% for PHEV).
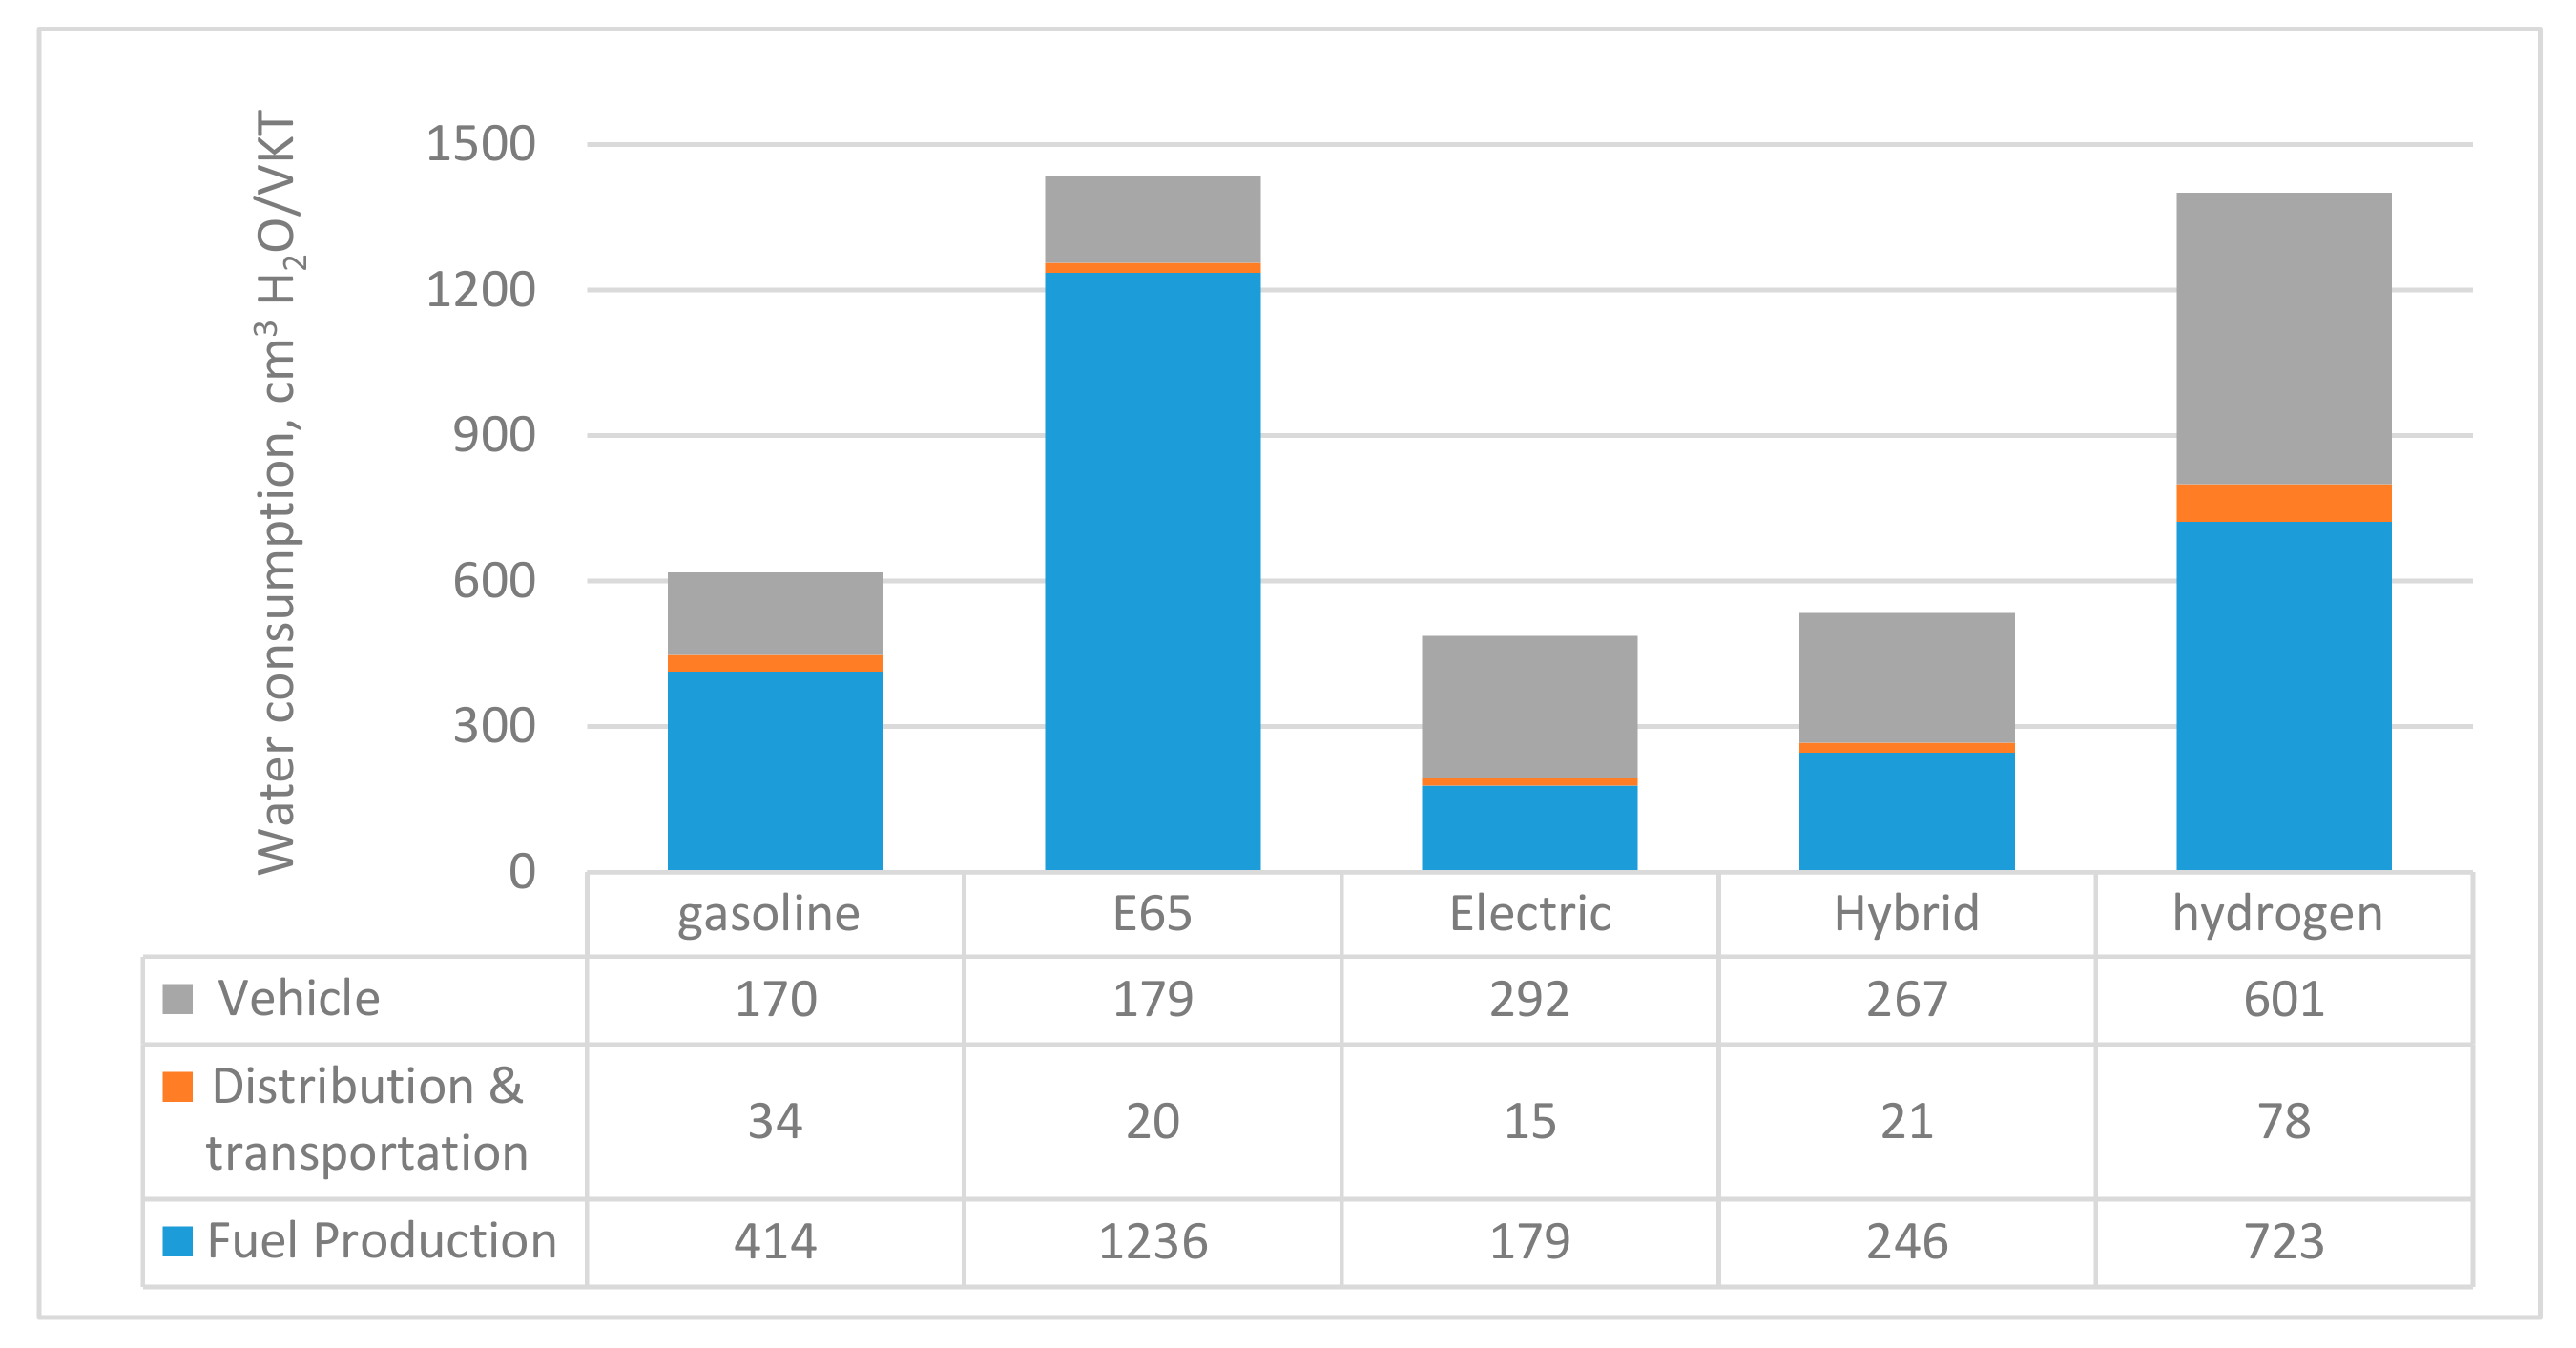
3.3. Water Consumption (WC)
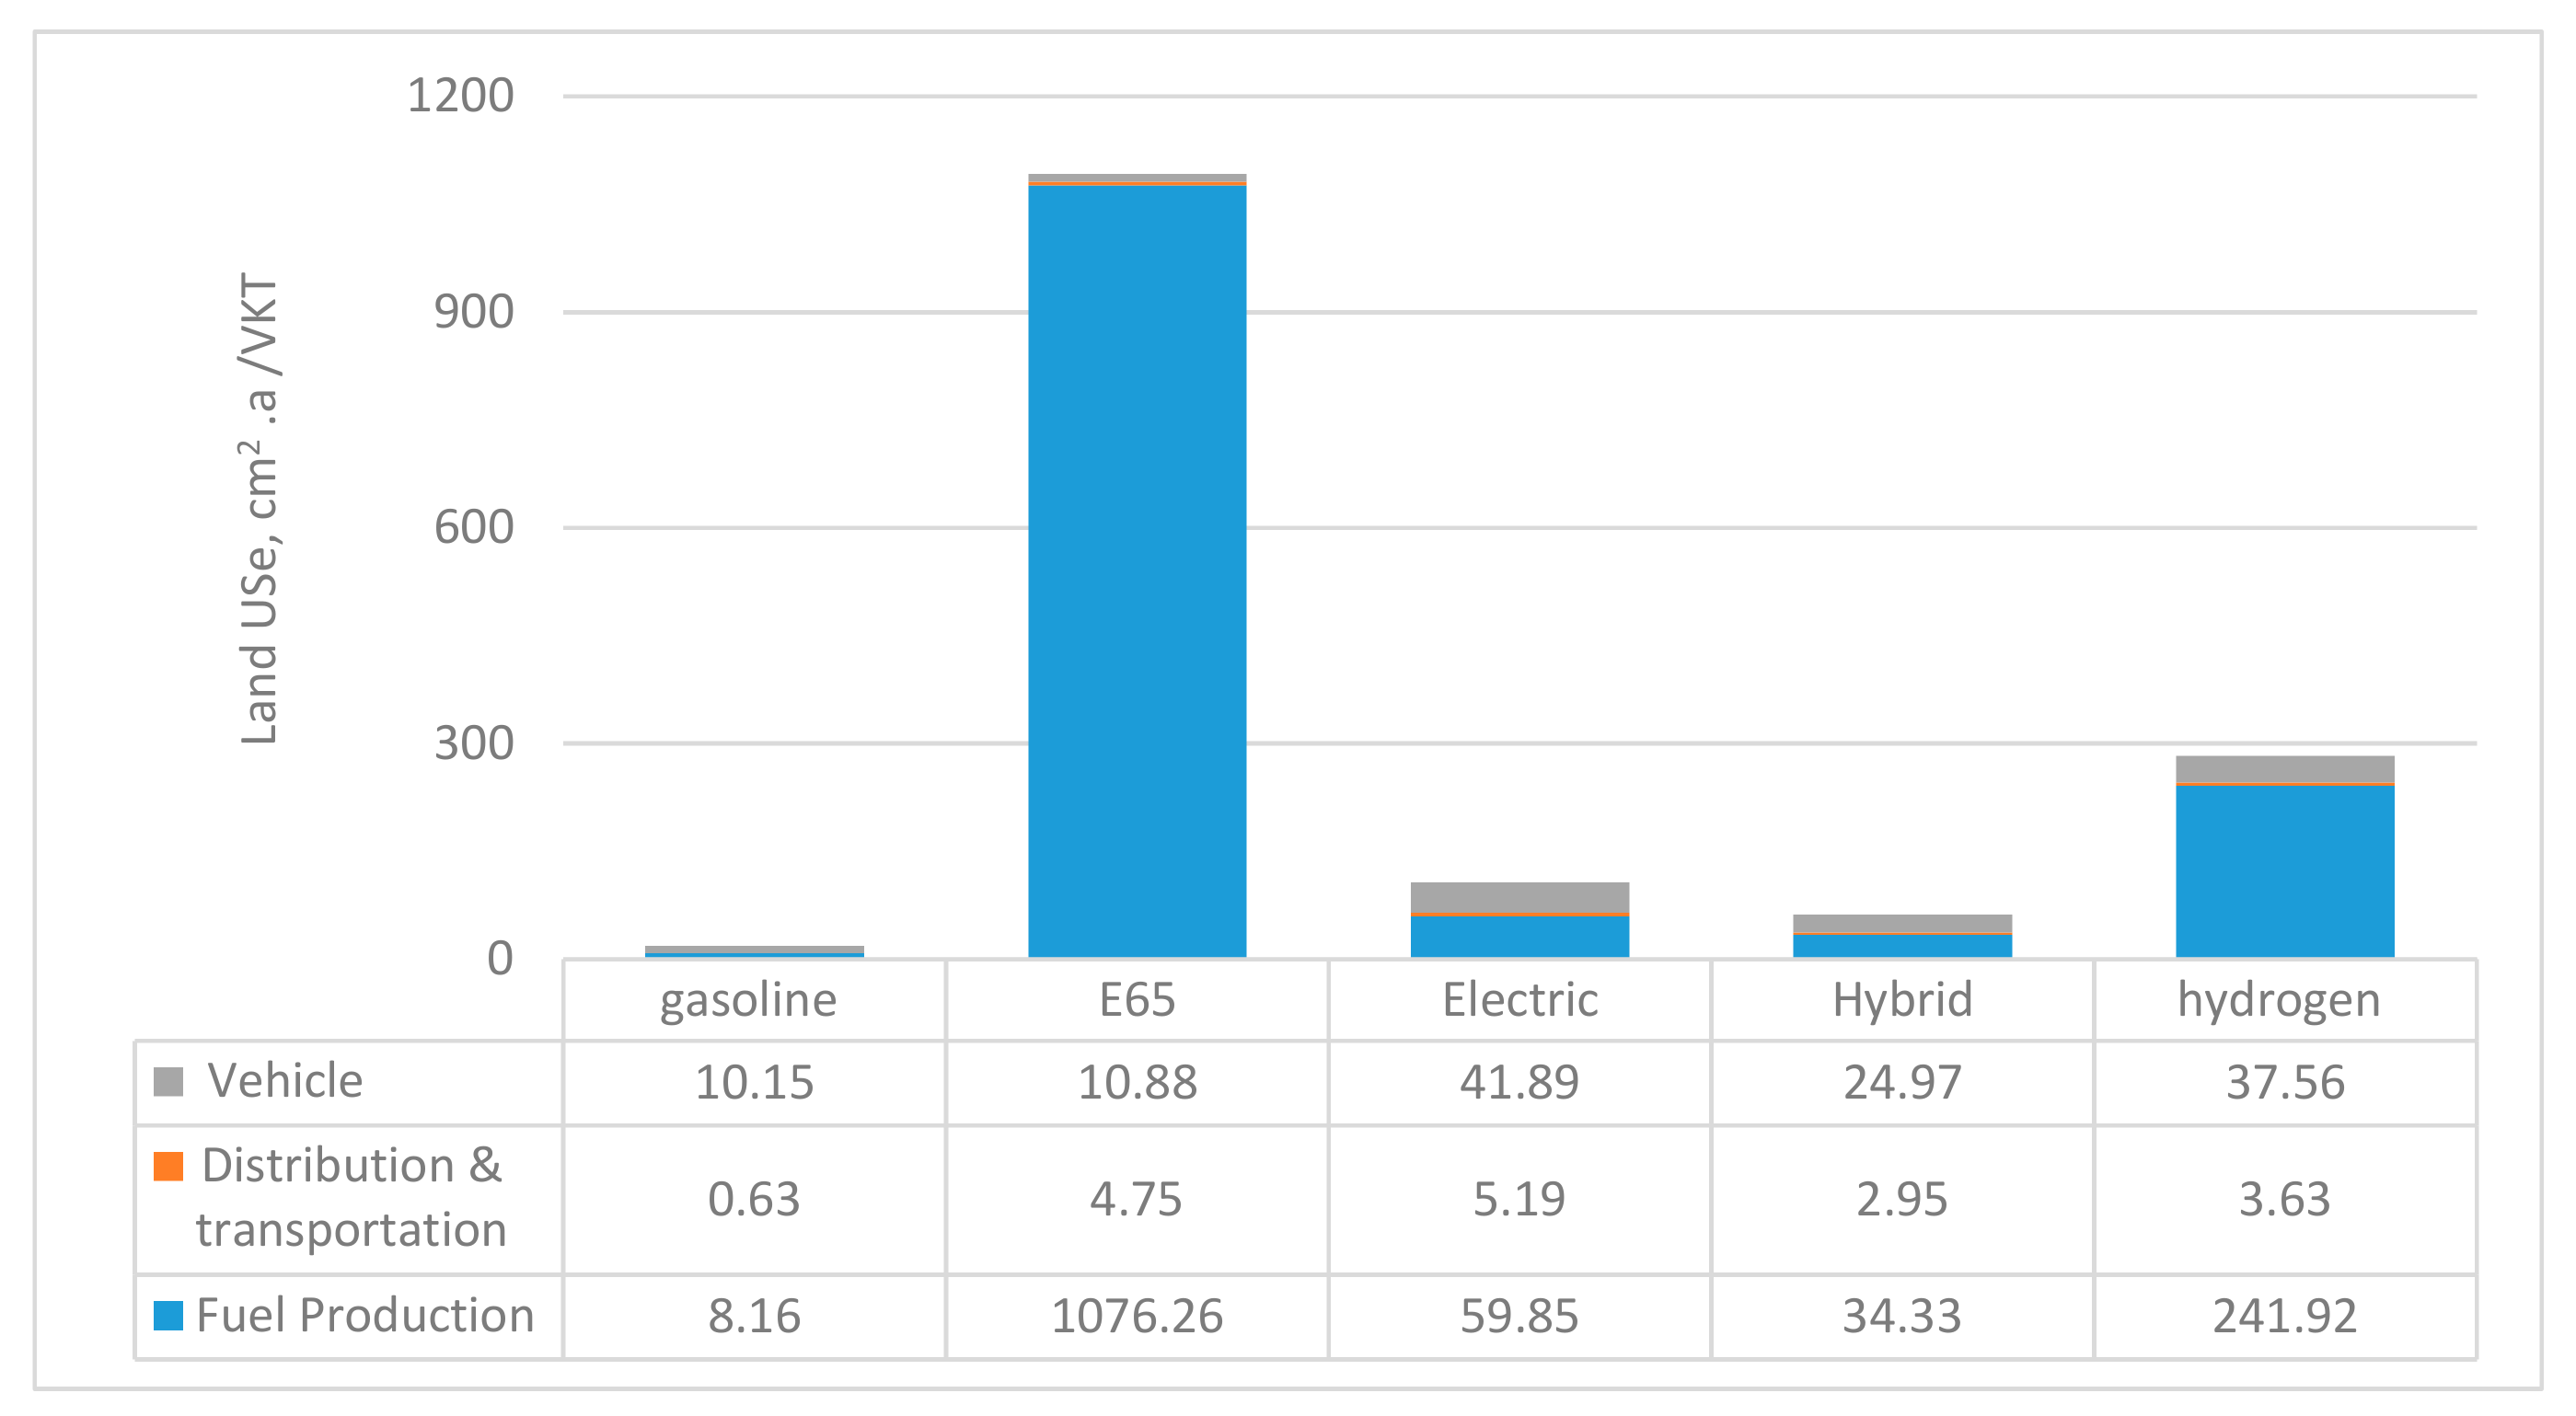
3.4. Land Use
4. Scenario Analysis
5. Uncertainty Analysis
6. Conclusions
Author Contributions
Funding
Acknowledgments
Conflicts of Interest
Abbreviations
| Additional vehicle materials |
| British Petroleum |
| The Commonwealth Scientific and Industrial Research Organisation |
| Coefficient of variance |
| Ethanol-gasoline blend (65% ethanol and 35% gasoline) |
| Ethanol-gasoline blend (85% ethanol and 15% gasoline) |
| Environmental Life cycle assessment |
| Electric vehicle |
| Fossil Fuel Depletion |
| Functional unit |
| Greenhouse gas |
| Gram |
| Green Metric tonne |
| Gasoline vehicle |
| Global warming potential |
| Hectare |
| Hydrogen fuel cell vehicle |
| International standard organization |
| Kilogram |
| Kwinana Industrial Area |
| Litre |
| Life cycle assessment |
| Life cycle inventory |
| Million Litre |
| Million tonne |
| Proton exchange membrane electrolysis |
| Plug-in hybrid electric vehicle |
| Peta joule |
| Tonne-kilometer |
| Vehicle kilometre |
| Western Australia |
| Water Consumption |
References
- Xing, Y.; Song, H.; Yu, M.; Wang, C.; Zhou, Y.; Liu, G.; Du, L. The characteristics of greenhouse gas emissions from heavy-duty trucks in the Beijing-Tianjin-Hebei (BTH) region in China. Atmosphere 2016, 7, 121. [Google Scholar] [CrossRef]
- Moghaddam, E.A.; Ahlgren, S.; Hulteberg, C.; Nordberg, Å. Energy balance and global warming potential of biogas-based fuels from a life cycle perspective. Fuel Process. Technol. 2015, 132, 74–82. [Google Scholar] [CrossRef]
- UNEP. Global Green House Gas Emission Data. 2017. Available online: https://www.epa.gov/ghgemissions/global-greenhouse-gas-emissions-data (accessed on 18 September 2017).
- Brondani, M.; Hoffmann, R.; Mayer, F.D.; Kleinert, J.S. Environmental and energy analysis of biodiesel production in Rio Grande do Sul, Brazil. Clean Technol. Environ. Policy 2015, 17, 129–143. [Google Scholar] [CrossRef]
- Western Australian Planning Commission. State Planning Strategy 2050; Western Australian Planning Commossion, Government of Western Australia: Perth, Australia, 2014.
- Department of the Environment and Energy. Australian Energy Update 2017; Commonwealth of Australia: Cabberra, Australia, 2017.
- Department of the Environment and Energy. Australian Energy Update 2018 (Table K). Commonwealth of Australia, Cabberra, Australia; 2018. Available online: https://www.energy.gov.au/publications/australian-energy-update-2018 (accessed on 12 July 2019).
- Australian Bureau of Statistics. 9208.0—Survey of Motor Vehicle Use, Australia; Government of Australia: Cabberra, Australia, 2017.
- Department of Finance Public Utilities Office. Strategic Energy Initiative Energy 2031: Building the Pathways for Western Australia’s Energy Future; Department of Finance Public Utilities Office: Perth, Australia, 2012.
- Biswas, W.K.; Thompson, B.C.; Islam, M.N. Environmental life cycle feasibility assessment of hydrogen as an automotive fuel in Western Australia. Int. J. Hydrog. Energy 2013, 38, 246–254. [Google Scholar] [CrossRef]
- Australian Bureau of Statistics. 9309.0—Motor Vehicle Census, Australia; Government of Australia: Canberra, Australia, 2017.
- Department of Resources Energy and Tourism. National Energy Security Assessment 2011; Commonwealth of Australia: Canberra, Australia, 2011.
- John, B.A.O. Australia’s Liquid Fuel Security Part-2; A Report for NRMA Motoring & Services; National Road and Motorists’ Association: Sydney, Australia, 2014. [Google Scholar]
- Biswas, W.K.; Barton, L.; Carter, D. Biodiesel production in a semiarid environment: A life cycle assessment approach. Environ. Sci. Technol. 2011, 45, 3069–3074. [Google Scholar] [CrossRef] [PubMed]
- Hoque, N.; Biswas, W.; Mazhar, I.; Howard, I. LCSA Framewrok for Assessing Sustainability of Alternative Fuel for Transport Sector. Chem. Eng. Trans. 2019, 72. [Google Scholar] [CrossRef]
- Hoque, N.; Mazhar, I.; Biswas, W. Application of Life Cycle Assessment for Sustainability Evaluation of Transportation Fuels. In Reference Module in Materials Science and Materials Engineering; Elsevier: Amsterdam, The Netherlands, 2018. [Google Scholar]
- Requia, W.J.; Adams, M.D.; Arain, A.; Koutrakis, P.; Ferguson, M. Carbon dioxide emissions of plug-in hybrid electric vehicles: A life-cycle analysis in eight Canadian cities. Renew. Sustain. Energy Rev. 2017, 78, 1390–1396. [Google Scholar] [CrossRef]
- Balat, M.; Balat, H. Recent trends in global production and utilization of bio-ethanol fuel. Appl. Energy 2009, 86, 2273–2282. [Google Scholar] [CrossRef]
- Farine, D.R.; O’Connell, D.A.; John Raison, R.; May, B.M.; O’Connor, M.H.; Crawford, D.F.; Herr, A.; Taylor, J.A.; Jovanovic, T.; Campbell, P.K. An assessment of biomass for bioelectricity and biofuel, and for greenhouse gas emission reduction in Australia. GCB Bioenergy 2012, 4, 148–175. [Google Scholar] [CrossRef]
- Lim, C.I.; Biswas, W.K. Development of triple bottom line indicators for sustainability assessment framework of Malaysian palm oil industry. Clean Technol. Environ. Policy 2018, 20, 539–560. [Google Scholar] [CrossRef]
- Lim, C.I.; Biswas, W. An evaluation of holistic sustainability assessment framework for palm oil production in Malaysia. Sustainability 2015, 7, 16561–16587. [Google Scholar] [CrossRef]
- Biswas, W.; Kabir, A.; Islam, N.; Rosano, M. Life Cycle Environmental Benefits from the Use of Retrofit Electric Vehicles in Western Australia. In Proceedings of the 8th Australian Life Cycle Assessment Society (ALCAS) Conference: Pathways to greening global markets, Sydney, Australia, 15–18 July 2013. [Google Scholar]
- Hawkins, T.R.; Singh, B.; Majeau-Bettez, G.; Strømman, A.H. Comparative Environmental Life Cycle Assessment of Conventional and Electric Vehicles. J. Ind. Ecol. 2013, 17, 53–64. [Google Scholar] [CrossRef]
- Sadeghinezhad, E.; Kazi, S.N.; Sadeghinejad, F.; Badarudin, A.; Mehrali, M.; Sadri, R.; Reza Safaei, M. A comprehensive literature review of bio-fuel performance in internal combustion engine and relevant costs involvement. Renew. Sustain. Energy Rev. 2014, 30, 29–44. [Google Scholar] [CrossRef]
- Stucley, C.; Schuck, S.; Sims, R.; Bland, J.; Marino, B.; Borowitzka, M.; Abadi, A.; Bartle, J.; Giles, R.; Thomas, Q. Bioenergy in Australia: Status and Opportunities; Bioenergy Australia: New South Wales, Australia, 2012. [Google Scholar]
- Wilkinson, I. Western Australian Wheat Industry. 2018. Available online: https://www.agric.wa.gov.au/grains-research-development/western-australian-wheat-industry (accessed on 1 January 2018).
- Brooksbank, K.; Lever, M.; Paterson, H.; Weybury, M. Biomass Scoping Study: Opportunities for Agriculture in Western Australia; Department of Agriculture and food: Perth, Australia, 2014. [Google Scholar]
- Department of the Environment and Energy. Australian Petroleum Statistics; Department of the Environment and Energy: Canberra, Australia, 2017.
- O’Connell, D.; Batten, D.; O’Connor, M.; May, B.; Raison, R.; Keating, B.A.; Beer, T.; Braid, A.; Haritos, V.; Begley, C. Biofuels in Australia: Issues and Prospects: A Report for the Rural Industries Research and Development Corporation; Rural Industries Research and Development Corporation: Canberra, Australia, 2007. [Google Scholar]
- Mu, D.; Seager, T.; Rao, P.S.; Zhao, F. Comparative life cycle assessment of lignocellulosic ethanol production: Biochemical versus thermochemical conversion. Environ. Manag. 2010, 46, 565–578. [Google Scholar] [CrossRef] [PubMed]
- United Petroleum. Ethanol Production. 2018. Available online: https://www.unitedpetroleum.com.au/about/ethanol-production/ (accessed on 3 May 2018).
- Wu, H.; Fu, Q.; Giles, R.; Bartle, J. Production of mallee biomass in Western Australia: Energy balance analysis. Energy Fuels 2007, 22, 190–198. [Google Scholar] [CrossRef]
- URS Asutralia. Oil Mallee Industry Development Plan for Western Australia; URS Australia Pty Ltd.: Perth, Australia, 2008. [Google Scholar]
- John, B.; Amir, A. The Economics of the Industry: Future Drivers and Barriers to the Bioenergy and Mallee Industries. 2019. Available online: https://www.oilmallee.org.au/media-centre.html (accessed on 10 May 2019).
- The Climate Institute. Clean Energy Jobs in Regional Australia. Available online: http://www.climateinstitute.org.au/verve/_resources/cleanenergyjobssnapshot_westernaustralia.pdf (accessed on 17 September 2018).
- Mullan, J.; Harries, D.; Bräunl, T.; Whitely, S. Modelling the impacts of electric vehicle recharging on the Western Australian electricity supply system. Energy Policy 2011, 39, 4349–4359. [Google Scholar] [CrossRef]
- OECD/IEA. Global EV Outlook 2017: Two Million and Counting; International Energy Agency: Paris, France, 2017. [Google Scholar]
- Roger, H. New diesel and petrol vehciles to be banned from 2040 in UK. BBC News, 26 July 2017. [Google Scholar]
- Chrisafis, A.; Vaughan, A. France to Ban Sales of Petrol and Diesel Cars by 2040. The Guardian, 6 July 2017. [Google Scholar]
- PRe’-Consultants. Simapro 8.4 Lca Software; Pre’ Consultants: Amersfoort, The Netherlands, 2016. [Google Scholar]
- Hydrogen Strategy Group. Hydrogen for Australia’s Future; Commonwealth of Australia: Canberra, Australia, 2018. [Google Scholar]
- Ally, J.; Pryor, T. Life-cycle assessment of diesel, natural gas and hydrogen fuel cell bus transportation systems. J. Power Sources 2007, 170, 401–411. [Google Scholar] [CrossRef] [Green Version]
- Pickin, J.; Randell, P. Australian National Waste Report 2016; Department of the Environment and Energy and Blue Environment Pty Ltd.: Melbourne, Australia, 2017. [Google Scholar]
- Zanchi, L.; Delogu, M.; Zamagni, A.; Pierini, M. Analysis of the main elements affecting social LCA applications: Challenges for the automotive sector. Int. J. Life Cycle Assess. 2018, 23, 519–535. [Google Scholar] [CrossRef]
- Renouf, M.; Grant, T.; Sevenster, M.; Logie, J.; Ridoutt, B.; Ximenes, F.; Bengtsson, J.; Cowie, A.; Lane, J. Best Practice Guide for Life Cycle Impact Assessment (LCIA) in Australia; Australian Life Cycle Assessment Society: Melbourne, Australia, 2015. [Google Scholar]
- Bureau of Meteorology. Australia’s Changing Climate; Bureau of Meteorology: Melbourne, Australia, 2016. [Google Scholar]
- Australian Bureau of Statistics. 4610.0—Water Account, Australia, 2015–2016; Government of Australia: Canberra, Australia, 2017. [Google Scholar]
- Rangelands NRM. What Are the Rangelands? Available online: https://rangelandswa.com.au/who-we-are-2/what-are-the-rangelands/ (accessed on 10 December 2018).
- Taylor, R. Drinking Water Shortage Forecast for South West WA within a Decade. ABC News, 21 July 2015. [Google Scholar]
- Water Corporation. Ground Water. Available online: https://www.watercorporation.com.au/water-supply/our-water-sources/groundwater?pid=res-wss-spw-np-gw (accessed on 17 October 2018).
- McFarlane, D. Will Perth have enough water for its diverse needs in a drying climate? In Planning Boomtown and Beyond; Biermann, S., Olaru, D., Paul, V., Eds.; UWA Publishing: Perth, Australia, 2016; pp. 209–237. [Google Scholar]
- Grant, T.; Bontinck, P.; Sharma, B.; Renouf, M. Greenhouse Gas and Sustainability Footprints of Current and Future Biofuels for Queensland; Lifecycles: Melbourne, Australia, 2016. [Google Scholar]
- Edge Environment and Life Cycle Strategies. Literature Review for Establishing a National LCA Approach for Australian Bioenergy; Australian Renewable Energy Agency: Canberra, Australia, 2016.
- Australian Renewable Energy Agency. Life Cycle Assessment (LCA) of Bioenergy Products and Projects; Australian Government: Canberra, Australia, 2016.
- Australian Institute of Health and Welfare. Australia’s Welfare 2017: In Brief. Available online: https://www.aihw.gov.au/reports/australias-welfare/australias-welfare-2017-in-brief/contents/indicators-of-australia-s-welfare (accessed on 14 November 2018).
- ISO14040. Environmental Mangament-Life Cycle Assessment-Principles and Frame Work; ISO: Geneva, Switzerland, 2006. [Google Scholar]
- ISO14044. Environemnental Management-Life Cycle Assessments-Requirements and Guidelines; International Standard Organization (ISO): Geneva, Switzerland, 2006. [Google Scholar]
- Miotti, M.; Hofer, J.; Bauer, C. Integrated environmental and economic assessment of current and future fuel cell vehicles. Int. J. Life Cycle Assess. 2017, 22, 94–110. [Google Scholar] [CrossRef]
- Sharma, R.; Manzie, C.; Bessede, M.; Crawford, R.H.; Brear, M.J. Conventional, hybrid and electric vehicles for Australian driving conditions. Part 2: Life cycle CO2-e emissions. Transp. Res. Part C Emerg. Technol. 2013, 28, 63–73. [Google Scholar] [CrossRef]
- Notter, D.A.; Gauch, M.; Widmer, R.; Wager, P.; Stamp, A.; Zah, R.; Althaus, H.-J. Contribution of Li-Ion Batteries to the Environmental Impact of Electric Vehicles; ACS Publications: New York, NY, USA, 2010. [Google Scholar]
- Stasinopoulos, P.; Shiwakoti, N.; McDonald, S. Life-cycle greenhouse gas emissions of electric and conventional vehicles in Australia. In Proceedings of the ITS—Enhancing Liveable Cities and Communities, Melbourne, Australia, 10–14 October 2016; pp. 1–10. [Google Scholar]
- Mushalik, M. Almost Half of Australia’s Petrol, Diesel and Jet Fuel Imports Come from South Korea and Japan. Available online: http://crudeoilpeak.info/almost-half-of-australias-petrol-diesel-and-jet-fuel-imports-come-from-south-korea-and-japan (accessed on 13 May 2019).
- Australian Bureau of Statistics. 9208.0—Survey of Motor Vehicle Use, Australia, 12 Months Ended 30 June 2018; Government of Australia: Canberra, Australia, 2018.
- Australian Bureau of Statistics. 9309.0—Motor Vehicle Census, Australia, 31 Jan 2018; Government of Australia: Canberra, Australia, 2018.
- Motoring Australia. Australian New Car Sales Drop in 2018. Available online: https://www.motoring.com.au/australian-new-car-sales-drop-in-2018-116332/ (accessed on 7 June 2019).
- Commonwealth of Australia. Green Vehicle Guide. 2018. Available online: https://www.greenvehicleguide.gov.au/ (accessed on 10 January 2019).
- Toyota Motor Corporation. Toyota Corolla Hatch Specifications. Available online: https://www.toyota.com.au/-/media/toyota/main-site/vehicle-hubs/corolla/files/corolla_hatch_spec_data_apr2019.pdf (accessed on 15 May 2019).
- Engelbrecht, D. Integrated Spatial Technology Framework for Greenhouse Gas Mitigation in Grain Production in Western Australia; Curtin University: Perth, Australia, 2015. [Google Scholar]
- Biswas, W.K.; Barton, L.; Carter, D. Global warming potential of wheat production in Western Australia: A life cycle assessment. Water Environ. J. 2008, 22, 206–216. [Google Scholar] [CrossRef]
- National Greenhouse Gas Inventory Committee. Australian Methodology for the Estimation of Greenhouse Gas Emissions and Sinks 2006; Agriculture Australian Government Department of Climate Change: Canberra, Australia, 2007.
- De Klein, C.; Novoa, R.S.; Ogle, S.; Smith, K.A.; Rochette, P.; Wirth, T.C.; McConkey, B.; Mosier, A.; Rypdal, K.; Walsh, M. N2O emissions from managed soils, and CO2 emissions from lime and urea application. IPCC Guidel. Natl. Greenh. Gas Invent. 2006, 4, 1–54. [Google Scholar]
- Barton, L.; Thamo, T.; Engelbrecht, D.; Biswas, W.K. Does growing grain legumes or applying lime cost effectively lower greenhouse gas emissions from wheat production in a semi-arid climate? J. Clean. Prod. 2014, 83, 194–203. [Google Scholar] [CrossRef] [Green Version]
- Brock, P.; Madden, P.; Schwenke, G.; Herridge, D. Greenhouse gas emissions profile for 1 tonne of wheat produced in Central Zone (East) New South Wales: A life cycle assessment approach. Crop Pasture Sci. 2012, 63, 319–329. [Google Scholar] [CrossRef]
- Muñoz, I.; Flury, K.; Jungbluth, N.; Rigarlsford, G.; i Canals, L.M.; King, H. Life cycle assessment of bio-based ethanol produced from different agricultural feedstocks. Int. J. Life Cycle Assess. 2014, 19, 109–119. [Google Scholar] [CrossRef]
- Zucaro, A.; Forte, A.; Fierro, A. Life cycle assessment of wheat straw lignocellulosic bio-ethanol fuel in a local biorefinery prospective. J. Clean. Prod. 2018, 194, 138–149. [Google Scholar] [CrossRef]
- Borrion, A.L.; McManus, M.C.; Hammond, G.P. Environmental life cycle assessment of bioethanol production from wheat straw. Biomass Bioenergy 2012, 47, 9–19. [Google Scholar] [CrossRef]
- Wilkinson, I. Western Australian Grains Industry; Department of primary Industries and Regional Development: Perth, Asutralia, 2018. [Google Scholar]
- Olivera, T.; Agbolab, F.; Stockenhubera, M. A Collaborative Supply Chain Study of Fertiliser Usage in an Australian Context, with a Focus on Pre-Farm Inputs, Using Life Cycle Assessment; The University of NewCastle: Newcastle, Australia, 2016. [Google Scholar]
- McKenzie, C.; (CSBP Fertilizer, K.I.A., Webberton, Australia). Personal communication, 2018.
- Oil Mallee Association Australia. Oil Malee Research and Development. Available online: https://www.oilmallee.org.au/industry-development.html (accessed on 10 May 2019).
- Crossin, E. Life cycle assessment of a mallee eucalypt jet fuel. Biomass Bioenergy 2017, 96, 162–171. [Google Scholar] [CrossRef]
- RAC. E 85 Conversion. Available online: https://www.racq.com.au/cars-and-driving/cars/owning-and-maintaining-a-car/facts-about-fuels/e85-conversions (accessed on 25 September 2018).
- Jones, C. Vehicle Changes for E85 Conversion. DoE/NREL/EPA Clean Cities Webcast. 2007. Available online: https://afdc.energy.gov/files/pdfs/jones_webcast_050307.pdf (accessed on 12 May 2019).
- Matějovskyý, L.; Macaýk, J.; Pospiýšil, M.; Baroš, P.; Staš, M.; Krausovaý, A. Study of Corrosion of Metallic Materials in Ethanol–Gasoline Blends: Application of Electrochemical Methods. Energy Fuels 2017, 31, 10880–10889. [Google Scholar] [CrossRef]
- Jin, D.; Choi, K.; Myung, C.-L.; Lim, Y.; Lee, J.; Park, S. The impact of various ethanol-gasoline blends on particulates and unregulated gaseous emissions characteristics from a spark ignition direct injection (SIDI) passenger vehicle. Fuel 2017, 209, 702–712. [Google Scholar] [CrossRef]
- Synergy. Electric Vehicle Home Plan; Synergy: Perth, Australia, 2019. [Google Scholar]
- Climate Works. The State of Electric Vehicles in Australia; ClimateWorks; Australia on Behalf of Electric Vehicle Council: Melbourne, Australia, 2017. [Google Scholar]
- RAC. The Latest and Greatest Electric Vehicles in Australia. Available online: Availabe online: https://rac.com.au/car-motoring/info/future_new-electric-vehicles-coming-to-australia-in-2019 (accessed on 14 May 2019).
- Nissan, A. New Nissan Leaf. 2019. Available online: https://www.nissan.com.au/cars-vehicles/new-leaf/overview (accessed on 14 May 2019).
- Helmers, E.; Dietz, J.; Hartard, S. Electric car life cycle assessment based on real-world mileage and the electric conversion scenario. Int. J. Life Cycle Assess. 2017, 22, 15–30. [Google Scholar] [CrossRef]
- Toyota Motor Corporation. Prius Prime Specs. Available online: https://www.toyota.com/priusprime/features/mpg/1235/1237/1239 (accessed on 14 May 2019).
- Wikipedia the Free Encyclopedia. Toyota Prius Plug-in Hybrid. Available online: https://en.wikipedia.org/wiki/Toyota_Prius_Plug-in_Hybrid (accessed on 14 May 2019).
- US Department of Energy. Plug in Hybrid Vehicle Vlaue Position Study; US Department of Energy: Oak Ridge, TN, USA, 2010. [Google Scholar]
- US Department of Energy. Vehicle Fuel Economy. Available online: https://www.fueleconomy.gov/feg/Find.do?action=sbs&id=41184 (accessed on 14 May 2019).
- Ciborowski, P.; Eyoh, I.; Seltz, J.; Wu, C. Air Emissions Impacts of Plug-In Hybrid Vehicles in Minnesota’s Passenger Fleet: Report for Plug-in Hybrid Task Force; Minnesota Pollution Control Agency: Baxter, MN, USA, 2007.
- Hinkley, J.; Hayward, J.; McNaughton, R.; Gillespie, R.; Matsumoto, A.; Watt, M.; Lovegrove, K. Cost Assessment of Hydrogen Production from PV and Electrolysis; CSIRO Australia: Canberra, Australia, 2016. [Google Scholar]
- Ehsani, M.; Gao, Y.; Longo, S.; Ebrahimi, K. Modern Electric, Hybrid Electric, and Fuel Cell Vehicles; CRC Press: Boca Raton, FL, USA, 2018. [Google Scholar]
- Shahabi, M.P.; McHugh, A.; Anda, M.; Ho, G. Comparative economic and environmental assessments of centralised and decentralised seawater desalination options. Desalination 2015, 376, 25–34. [Google Scholar] [CrossRef]
- Biswas, W.K. Life cycle assessment of seawater desalinization in Western Australia. World Acad. Sci. Eng. Technol. 2009, 56, 8. [Google Scholar]
- Technology, W. Perth Seawater Desalination Plant. Available online: https://www.water-technology.net/projects/perth/ (accessed on 16 May 2019).
- Simsons, A.; Bauer, C. Life Cycle Assessment of Hydrogen Production; Wokaun, A., Wilhelm, E., Eds.; Cambridge University Press: Cambridge, UK, 2011. [Google Scholar] [CrossRef]
- Corban, M.; (BP Refinery, K.I.A., Perth Australia). Personal communication, 2019.
- Toyota Motor Corporation. Mirai Product Information. Available online: https://ssl.toyota.com/mirai/assets/core/Docs/Mirai%20Specs.pdf (accessed on 16 May 2019).
- IPCC. Climate Change 2013: The Physical Science Basis; Contribution of Working Group I to the Fifth Assessment Report of the Intergovernmental Panel on Climate Change; Cambridge University Press: Cambridge, UK; New York, NY, USA.
- AusLCI. The Australian National Life Cycle Inventory Database (AusLCI); Australian Life Cycle Assessment Society (ALCAS): Melbourne, Australia, 2011. [Google Scholar]
- Trading Economics. Australian Historical Inflation Rate. Available online: https://tradingeconomics.com/australia/inflation-cpi (accessed on 16 May 2019).
- CSBP Fertilizer. Safety Data Sheets of Fertilizers. Available online: https://csbp-fertilisers.com.au/safety-data-sheets (accessed on 2 June 2019).
- DIATOM. Detergents. Available online: http://www.diatom.com.br/en-US/applications/detergentes (accessed on 16 May 2019).
- Arceo, A.; Biswas, W.K.; John, M. Eco-efficiency improvement of Western Australian remote area power supply. J. Clean. Prod. 2019, 230, 820–834. [Google Scholar] [CrossRef]
- Van Mierlo, J.; Messagie, M.; Rangaraju, S. Comparative environmental assessment of alternative fueled vehicles using a life cycle assessment. Transp. Res. Procedia 2017, 25, 3435–3445. [Google Scholar] [CrossRef]
- Sen, B.; Ercan, T.; Tatari, O. Does a battery-electric truck make a difference?—Life cycle emissions, costs, and externality analysis of alternative fuel-powered Class 8 heavy-duty trucks in the United States. J. Clean. Prod. 2017, 141, 110–121. [Google Scholar] [CrossRef]
- Wang, L.; Littlewood, J.; Murphy, R.J. Environmental sustainability of bioethanol production from wheat straw in the UK. Renew. Sustain. Energy Rev. 2013, 28, 715–725. [Google Scholar] [CrossRef] [Green Version]
- Cavalett, O.; Chagas, M.F.; Seabra, J.E.A.; Bonomi, A. Comparative LCA of ethanol versus gasoline in Brazil using different LCIA methods. Int. J. Life Cycle Assess. 2013, 18, 647–658. [Google Scholar] [CrossRef]
- Sun, P.; Elgowainy, A.; Wang, M.; Han, J.; Henderson, R.J. Estimation of U.S. refinery water consumption and allocation to refinery products. Fuel 2018, 221, 542–557. [Google Scholar] [CrossRef]
- Wu, M.; Xu, H. Consumptive Water Use in the Production of Ethanol and Petroleum Gasoline—2018 Update; Argonne National Laboratory (ANL): Lemont, IL, USA, 2018. [Google Scholar]
- Sharma, A.; Strezov, V. Life cycle environmental and economic impact assessment of alternative transport fuels and power-train technologies. Energy 2017, 133, 1132–1141. [Google Scholar] [CrossRef]
- Carre, A. A Comparative Life Cycle Assessment of Alternative Constructions of a Typical Australian House Design; Project Number PNA 147-0809; Forest and Wood Products Australia: Melbourne, Australia, 2011. [Google Scholar]
- Shafiullah, G.; Amanullah, M.; Ali, A.S.; Jarvis, D.; Wolfs, P. Prospects of renewable energy—A feasibility study in the Australian context. Renew. Energy 2012, 39, 183–197. [Google Scholar] [CrossRef]
- Bahadori, A.; Nwaoha, C.; Zendehboudi, S.; Zahedi, G. An overview of renewable energy potential and utilisation inAustralia. Renew. Sustain. Energy Rev. 2013, 21, 582–589. [Google Scholar] [CrossRef]
- Laslett, D.; Carter, C.; Creagh, C.; Jennings, P. A large-scale renewable electricity supply system by 2030: Solar, wind, energy efficiency, storage and inertia for the South West Interconnected System (SWIS) in Western Australia. Renew. Energy 2017, 113, 713–731. [Google Scholar] [CrossRef] [Green Version]
- Lu, B.; Blakers, A.; Stocks, M. 90–100% renewable electricity for the South West Interconnected System of Western Australia. Energy 2017, 122, 663–674. [Google Scholar] [CrossRef]
- Nocera, S.; Cavallaro, F. Economic evaluation of future carbon dioxide impacts from Italian highways. Procedia-Soc. Behav. Sci. 2012, 54, 1360–1369. [Google Scholar] [CrossRef]
- Nocera, S.; Cavallaro, F. The competitiveness of alternative transport fuels for CO2 emissions. Transp. Policy 2016, 50, 1–14. [Google Scholar] [CrossRef]
- Bureau of Transport and Regional Economics. Health Impacts of Transport Emissions in Australia: Economic Costs: Working Paper 63; Department of Transport and Regional Services, Commonwealth of Australia: Canberra, Australia, 2005. [Google Scholar]


| Potential Locations | Average Straw after 1.5 Tonne Retention (Tonne/per ha) | Land Area + (ha × 103) | Available Straw on Grain Field (Value * 103 Tonne) |
|---|---|---|---|
| Geraldton | (3.24 * − 1.50) = 1.74 | 267 | 465 |
| Three springs | 85 | 148 | |
| Moora | 425 | 740 | |
| Northam | 337 | 586 | |
| Merredin | 365 | 635 | |
| Lake Grace | 304 | 528 | |
| Narrogin | 200 | 348 | |
| Katanning | 526 | 915 | |
| Esparance | 541 | 941 | |
| Albany | 67 | 116 | |
| Total | 3112 | 5421 |
| Feedstocks | In GWh [7] | In % | GHG Emission (Low Voltage) [40] |
|---|---|---|---|
| Natural gas | 20146 | 53% | 0.8753 kgCO2/kWh |
| Coal | 10523 | 28% | |
| Oil products | 4223 | 11% | |
| Biogas | 126.9 | 0.34% | |
| Wind | 1643.2 | 4% | |
| Hydro | 206.1 | 1% | |
| Solar PV | 683.3 | 2% | |
| Total | 37552 | 100% |
| Indicators | Justifications |
|---|---|
| GWP | Eighty-seven percent (87%) of the respondents considered global warming potential (GWP) as an important indicator for the current study in WA during the survey process. |
| Different life cycle phases of alternative fuels such as feedstock production, conversion from feedstocks to fuel and transportation are GHG emission-intensive [16]. Around 14% of GHG emission is from the transport sectors of WA [10]. The government of WA is committed to reducing the significant portion of GHG emission from transport sectors through alternative fuels by the year 2031 [9]. | |
| FFD | Sixty-seven percent (67%) of the respondents considered fossil fuel depletion (FFD) as an important indicator. |
| Almost all the life cycle stages of alternative fuels consume fossil fuel (such as chemicals and fertilizers during the agricultural production of feedstock; transportation of feedstocks; and energy requirements during the conversion stage) [16]. The transport sector alone consumed 251 PJ of energy (19%) which is the 2nd most energy consumable sector in WA [46]. | |
| WC * | Sixty-three percent (63%) of the respondents considered water consumption (WC) as an important indicator. |
| Agriculture production of feedstock and conversion of alternative fuels requires water as a raw material. Electricity and other fossil fuel requirements in the different stages also have their own water use impacts [47]. Almost all of WA (around 85%) falls under the semiarid or arid climate by nature [48]. Estimations suggest that there could be a possible water crisis in the near future in WA as the water supply is reducing over time from both ground and surface water sources [49,50,51]. | |
| Land use | Fifty-three percent (53%) of the respondents considered it as an important indicator. |
| When any feedstock for alternative fuel derived from agriculture may produce higher land use impact than the fossil fuel [52]. Though the WA state has a huge land area (around 2.5 million km2), additional stress on land for biofuel can produce an impact on food production [53]. | |
| Eutrophication | Eutrophication was selected initially through review but 57% of the respondents considered it as a less important indicator for the current study. |
| Eutrophication was identified by the experts as a less important indicator for WA conditions mainly for two reasons. On the production side, as eutrophication results from the direct discharge of effluent to water, it may not be an issue since the alternative fuels are produced in confined spaces and the energy plant wastes are landfilled. Secondly, the alternative fuels are assumed in this study to be sourced from existing agricultural by-products (wheat straw in this study) or, in the case of Mallee, may potentially reduce the nutrient runoff [25]. | |
| Human toxicity | Two respondents from academic and industry categories emphasized the importance of ‘human toxicity’ due to its importance on human health. |
| The toxicity indicators are found to be either weak or nonexistent in Australian biofuel and bioenergy projects though upstream agriculture production of feedstock may release a small amount of toxic pesticides but other stages of fuel production are not directly related to emissions (heavy metals, pesticides, hormones, and organic chemical) which cause toxicity [53,54]. It has been found that due to the low population density (one people/km2 in WA) and geographical specificity (most of the Australian cities are near the sea), toxicity substances emitted to the soil in Australia has 160 times lower possibility for human exposure than Western Europe [45]. The human exposure factor was also found to be 20 times lower for toxic substances emitted to the air and water [45]. | |
| Biodiversity | Two respondents from academic and industry categories had suggested ‘biodiversity’ as land clearing due to the agriculture production of biofuel can destroy the ecosystem and biodiversity. |
| Most of the lands in Australia were cleared more than 20 years ago and any new land clearing in the country is under strict policy from the Australian government regarding nature conservation and protected areas [33,52]. Biodiversity is considered important where activities from the life cycle of a fuel disturb the local animals and plant life [45]. Feedstocks for alternative fuel production for the present study such as straw (by-product from current agriculture) and Mallee (grown within the narrow belt of existing agricultural systems) and a small portion of wheat for ethanol (from existing agriculture); electricity for EV; and sea water for hydrogen have no direct relationship with the land/forest clearing which can affect biodiversity or ecosystems. | |
| Vehicle exhaust emissions (as a measure of human health) | Three respondents from the academic category proposed ‘vehicle exhaust emission’ as air quality is the important driver for the application of alternative fuel. |
| In WA, the contribution of atmospheric air pollution from vehicles was quite low compared to mining and industrial applications. However, direct exposure from low elevated vehicle exhaust emissions (such as CO, PM and NOx) have the potential to cause significant human health problems [45]. Due to this reason, these emissions are considered as social sustainability indicators under the public health category for the current study and were not included here in the environmental life cycle assessment (ELCA) to avoid repetition. Besides, tailpipe CO2 emissions are already included under the GWP impact. | |
| PM formation | Two respondents from academic and government categories shared their view regarding ‘PM formation’ due to its potential damage for human health. |
| PM emission all over Australia is not the general problem due to the location of its main cities near the sea, its wind speed, flat terrain, mild industrialization and lower population densities [45]. The country is also ranked 2nd in the world according to the air quality index [55]. However, PM as a measure of human health is considered a social indicator under the current project due to the aforementioned reasons in the vehicle exhaust emission indicator. | |
| Comparison with traditional fuel | Two respondents from industry and government categories advised to include this comparison as singling out alternative fuels for a life cycle assessment without ensuring traditional fuels are being subject to the same life cycle assessment is not reasonable and would work against alternative fuel uptake. |
| By following the strategy, gasoline as the baseline fuel was compared with alternative fuel options, as gasoline is the predominant fuel for WA transport sectors. | |
| Direct displacement of food (due to feedstocks) | One participant from the government category highlighted the importance of food displacement as biofuel feedstocks may disturb the food cycle. |
| As described in detail in the fuel selection (Section 2.1), feedstocks for the current study (such as straw and mallee and a small portion of wheat) may not disturb the food supply chain in WA. Especially, straw and mallee as they are sourced from the unused resources in WA which have no direct relation with food displacement. However, the potentiality of this indicator will be examined in future for the social sustainability part of the current study. |
| Parameter | Unit | GV | EV | PHEV | HFCV | E65 |
|---|---|---|---|---|---|---|
| Hydrogen tank | kg | - | - | - | 7.77 × 10⁻⁴ | - |
| Battery * | kg | - | 3.37 × 10⁻³ | 1.07 × 10⁻³ | 2.03 × 10⁻⁴ | - |
| Fuel cell with assembly | kg | - | - | - | 9.50 × 10⁻⁴ | - |
| Motor | kg | - | 6.11 × 10⁻⁴ | 4.82 × 10⁻⁴ | 6.27 × 10⁻⁴ | - |
| Inverter | kg | - | 1.03 × 10⁻⁴ | 7.09 × 10⁻⁵ | 1.05 × 10⁻⁴ | - |
| Converter | kg | - | 2.20 × 10⁻⁴ | 1.52 × 10⁻⁴ | 2.26 × 10⁻⁴ | - |
| Motor controller | kg | - | 7.82 × 10⁻⁵ | 5.40 × 10⁻⁵ | 8.03 × 10⁻⁵ | - |
| Transmission differential and others (cables, cooling unit) | kg | 7.55 × 10⁻⁴ | 5.51 × 10⁻⁴ | 6.98 × 10⁻⁴ | 6.65 × 10⁻⁴ | 7.55 × 10⁻⁴ |
| charger | kg | - | 6.37 × 10⁻⁵ | 3.50 × 10⁻⁵ | - | - |
| Internal combustion engine | kg | 1.31 × 10⁻³ | - | 9.14 × 10⁻⁴ | - | 1.41 × 10⁻³ |
| Fuel system | kg | 1.60 × 10⁻⁴ | - | 1.38 × 10⁻⁴ | - | 1.62 × 10⁻⁴ |
| Exhaust system | kg | 2.13 × 10⁻⁴ | - | 1.83 × 10⁻⁴ | - | 2.13 × 10⁻⁴ |
| Types of Emission | Emission Factor | Corresponding Reference |
|---|---|---|
| Direct N2O emission from N fertilizer | 0.1% | Biswas et al. [69] |
| Fraction C in Urea for Urea hydrolysis | 0.2 | Klein et al. [71] |
| CO2 emission factor for lime | 0.12 | Klein et al. [71] |
| Emission from leaching | ||
| N fraction lost due to leaching | 0.3 | Klein et al. [71] |
| N2O emission due to leaching | 0.0075 | Klein et al. [71] |
| NH3 volatilization | ||
| Fraction of fertilizer N will be emitted as NH3 | 10% | Barton et al. [72] |
| Emission factor for N2O emission | 0.08% | Barton et al. [72] |
| Fertilizer | Amount Which Can Be Required Per Tonne of Straw, Kg [25] | Amount Considered for This Study Per Tonne of Straw, Kg |
|---|---|---|
| N | 2–10 | 6 |
| P | 0.2–1.5 | 0.8 |
| K | 6–16 | 7 |
| Chemical/Energy | Unit | Wheat | Straw | Mallee | ||
|---|---|---|---|---|---|---|
| Fuel Production | Agriculture | Urea fertilizer | kg | - | - | 3.85 × 10⁻³ |
| Di-ammonium phosphate (DAP) fertilizer | kg | 7.99 × 10⁻² | 2.78 × 10⁻² | 3.85 × 10⁻³ | ||
| Muriate of potash (MOP) fertilizer | kg | - | - | 1.54 × 10⁻³ | ||
| Flexi-N fertilizer | kg | 7.92 × 10⁻² | 2.75 × 10⁻² | |||
| Herbicide & pesticide | kg | 1.57 × 10⁻³ | 5.46 × 10⁻⁴ | 3.06 × 10⁻⁵ | ||
| Diesel for farm machinery | L | 9.48 × 10⁻³ | 3.30 × 10⁻⁴ | 1.44 × 10⁻³ | ||
| Diesel for harvester | L | 4.90 × 10⁻³ | 1.77 × 10⁻³ | 7.70 × 10⁻⁴ | ||
| Lime application to paddock | kg | 8.17 × 10⁻² | 2.84 × 10⁻² | - | ||
| Farm machinery | AUD | 5.59 × 10⁻³ | 1.25 × 10⁻³ | - | ||
| Harvester for Mallee | P | - | - | 3.89 × 10⁻⁴ | ||
| Transportation of chemicals and diesel | tkm | 4.21 × 10⁻² | 1.40 × 10⁻² | 3.99 × 10⁻² | ||
| Feedstock transportation to ethanol plant | tkm | 2.6 × 10⁻¹ | 2.35 × 10⁻¹ | 5.27 × 10⁻¹ | ||
| Ethanol conversion | Feedstock | kg | 1.99 | 3.35 | 5.27 | |
| Water | L | 0.25 | 7.02 | 4.02 | ||
| Enzyme | kg | - | 1.88 × 10⁻² | 1.92 × 10⁻² | ||
| Lime | kg | - | 8.63 × 10⁻² | 7.58 × 10⁻² | ||
| Sulfuric acid | kg | - | 3.79 × 10⁻² | 1.04 × 10⁻¹ | ||
| Corn steep liquor | kg | - | 2.58 × 10⁻¹ | 4.08 × 10⁻² | ||
| DAP | kg | 4.74 × 10⁻³ | 4.8 × 10⁻³ | |||
| NaOH | kg | 1.66 × 10⁻³ | 1.71 × 10⁻³ | |||
| Heat | MJ | 4.05 | - | - | ||
| Electricity | kWh | 8 × 10⁻² | - | - | ||
| Transportation of chemicals | tkm | 1.65 × 10⁻¹ | 2.17 × 10⁻¹ | |||
| Distribution & Transport | Transportation to blending stations | tkm | - | 1.03 × 10⁻¹ | 1.03 × 10⁻¹ | |
| E 65 Transportation to retailers (1 L) | tkm | 1.65 × 10⁻¹ | ||||
| Process | Unit | Amount | |
|---|---|---|---|
| Fuel Production | Electricity | kWh | 5.40 × 10⁻¹ |
| Desalinated water from sea | L | 9.00 × 10⁻² | |
| Hydrogen Compression | kWh | 9.42 × 10⁻³ | |
| Distribution to Retailer | tkm | 1.5 × 10⁻¹ | |
| Water Desalination (1 L) | Electricity | kWh | 3.00 × 10⁻³ |
| Sodium hypochlorite | g | 3.57 × 10⁻³ | |
| sulphuric acid | g | 6.90 × 10⁻⁴ | |
| sodium metabisulphite | g | 7.00 × 10⁻⁵ | |
| Detergent | g | 2.72 × 10⁻³ | |
| Citric acid | g | 9.30 × 10⁻⁴ | |
| Caustic soda | g | 4.00 × 10⁻⁴ | |
| Biocide | g | 9.86 × 10⁻³ | |
| Polypropylene | g | 5.00 × 10⁻⁵ | |
| Polyethylene | g | 5.00 × 10⁻⁴ | |
| Polyurethane | g | 1.40 × 10⁻⁴ | |
| Acrylonitrile butadiene styrene | g | 1.27 × 10⁻³ | |
| Polyamide | g | 1.40 × 10⁻⁴ | |
| Transportation | |||
| Local (chemicals) | tkm | 8.72 × 10⁻⁴ | |
| International (membranes from USA) | tkm | 5.48 × 10⁻⁴ | |
| Waste to landfill | tkm | 1.10 × 10⁻² | |
| Indicators | Impact Assessment Method | Unit |
|---|---|---|
| Global warming Potential (GWP) | IPCC GWP 100 based on IPCC 2013 [104] | kgCO2-eq/VKT |
| Fossil fuel depletion (FD) | CML-IA baseline V3.03 / World 2000. Based on lower heating value. Does not include renewable energy and energy from waste. | MJ/VKT |
| Water Consumption (WC) | Australian indicator set v2.01 | cm3 H2O/VKT |
| Land Use | Australian indicator set v2.01 | cm2.a/VKT |
| Fuel | Basis | Strategy Considered | Improvement |
|---|---|---|---|
| Hydrogen | Hot spots | Hydrogen production by Wind energy | -Base case result: 120% higher than gasoline. |
| -After implementing the strategy: 70% lower than gasoline. | |||
| EV | Hot spots | Cleaner grid electricity for charging | -Base case result: 29% lower than gasoline. |
| -After implementing the strategy: 50% lower than gasoline. | |||
| PHEV | Hot spots | Use of E10 in place of gasoline | -Base case result: 14% lower than gasoline. |
| Hot spots | Cleaner grid electricity for charging | -After implementing the strategies and alternative scenario: 33% lower than gasoline. Additional reduction of 3% for E10, 11% for cleaner electricity and 5% for considering the alternative scenario was achieved from the base case. | |
| Alternative scenario | Vehicle runs on electricity for 60% of the travel time. | ||
| Ethanol (E65) | Hot spots | Renewable energy is used for enzyme production | -Base case result: 40% lower compared to gasoline. -After implementing the strategy: 5% additional reduction per L of fuel. Overall reduction of 41% per km compared to gasoline. |
| Indicators | Parameters | Gasoline | E65 | EV | PHEV | Hydrogen |
|---|---|---|---|---|---|---|
| GWP (kgCO2) | Calculated Value | 0.253 | 0.152 | 0.179 | 0.217 | 0.556 |
| Mean | 0.252 | 0.149 | 0.173 | 0.211 | 0.549 | |
| CV | 1.47 | 1.6 | 2.99 | 1.36 | 2.98 | |
| FFD (MJ) | Calculated Value | 2.91 | 1.85 | 1.75 | 1.99 | 5.33 |
| Mean | 2.87 | 1.81 | 1.69 | 1.92 | 5.26 | |
| CV | 2.24 | 1.82 | 2.69 | 1.71 | 2.44 | |
| WC (cm3 H2O) | Calculated Value | 618 | 1435 | 487 | 534 | 1402 |
| Mean | 609 | 1433 | 477 | 521 | 1400 | |
| CV | 6.15 | 4.3 | 5.45 | 3.74 | 6.76 | |
| Land Use (cm2.a) | Calculated Value | 18.95 | 1092 | 107 | 62 | 283 |
| Mean | 17.80 | 1092 | 106 | 61 | 282 | |
| CV | 20.19 | 0.43 | 19.5 | 18.43 | 25.92 |
© 2019 by the authors. Licensee MDPI, Basel, Switzerland. This article is an open access article distributed under the terms and conditions of the Creative Commons Attribution (CC BY) license (http://creativecommons.org/licenses/by/4.0/).
Share and Cite
Hoque, N.; Biswas, W.; Mazhar, I.; Howard, I. Environmental Life Cycle Assessment of Alternative Fuels for Western Australia’s Transport Sector. Atmosphere 2019, 10, 398. https://doi.org/10.3390/atmos10070398
Hoque N, Biswas W, Mazhar I, Howard I. Environmental Life Cycle Assessment of Alternative Fuels for Western Australia’s Transport Sector. Atmosphere. 2019; 10(7):398. https://doi.org/10.3390/atmos10070398
Chicago/Turabian StyleHoque, Najmul, Wahidul Biswas, Ilyas Mazhar, and Ian Howard. 2019. "Environmental Life Cycle Assessment of Alternative Fuels for Western Australia’s Transport Sector" Atmosphere 10, no. 7: 398. https://doi.org/10.3390/atmos10070398
APA StyleHoque, N., Biswas, W., Mazhar, I., & Howard, I. (2019). Environmental Life Cycle Assessment of Alternative Fuels for Western Australia’s Transport Sector. Atmosphere, 10(7), 398. https://doi.org/10.3390/atmos10070398