Abstract
Urbanisation largely consists of removing native vegetation. Plants that remain interact with air quality in complex ways. Pollutants can be detrimental to plant growth; plants sometimes reduce air quality, yet some species also improve it through phytoremediation. A common pollutant of concern to human health in urban areas is particulate matter (PM), small particles of solid or liquid. Our study compared roadside moss turfs with leaves of a common Australian tree species, Pittosporum undulatum, in their ability to capture PM along an urban gradient. We sampled nine sites, three in each of three levels of urbanisation: low, medium, and high according to road type (freeway, suburban road, quiet peri-urban road). In addition, we deployed a PM monitor over a two-week period in one site of each urban level to provide concentrations of PM2.5. We used chlorophyll fluorescence (Fv/Fm; maximum quantum yield of photosystem II) as a measure of plant stress. We extracted PM in three size fractions using a filtration and washing technique with water and chloroform. Site averages for moss turfs were between 5.60 and 33.00 mg per g dry weight for total PM compared to between 2.15 and 10.24 mg per g dry weight for the tree leaves. We found that moss was more sensitive to increasing urbanisation, both in terms of trapping proportionately more PM than the leaves, and also in terms of photosynthetic stress, with moss Fv/Fm declining by a site average of 40% from low to high urban “class” (0.76 to 0.45). Our study highlights the stressors potentially limiting moss persistence in cities. It also demonstrates its ability to trap PM, a trait that could be useful in urban applications relating to urban greening or air quality.
1. Introduction
Urbanisation largely consists of removing native vegetation [1,2]. Plants that remain interact with air quality in a number of ways: poor air quality can be detrimental to plant growth [3,4,5], but tolerant plants may improve air quality [6,7]; in some cases, plants pollute air through emissions, or increase pollution by trapping air columns [8,9]. Understanding these complex interactions is important for conservation of biodiversity, as well as for creating healthy, sustainable urban spaces, given the rapid rise in global urbanisation: by 2050 the UN projects that almost 70% of countries will be more than 60 per cent urban [10].
Plants, as well as people in urban areas, are more prone to air pollutants due to a greater concentration of sources such as motor vehicles, industry, and residences. Air pollutants are numerous, ranging from the complex POPs (persistent organic pollutants) and PAHs (polycyclic aromatic hydrocarbons) to criteria air pollutants that are regulated worldwide and include carbon monoxide, particulate matter, and lead [3,11,12].
While many air pollutants are toxic to plants, amongst those considered most important are ozone, (O3), sulfur dioxide (SO2), and nitrogen dioxide (NO2) [4,5,13]. The impact of pollution on plants occurs at all scales, from molecular and cellular through to landscape and ecosystem. Both cellular and organelle membranes may be damaged, for instance, if chemicals react with membrane polar lipids and alter permeability [4,5] with knock on effects on osmotic potential, that in turn can damage chloroplasts and mitochondria. Such injury effects the key reactions, respiration, and photosynthesis, with consequences for growth and survival [6,14,15]. Pollutants also cause leaf, fruit, and root damage [16].
While air pollution can be detrimental to plants, in some circumstances, plants contribute to reduced air quality. For instance, depending on characteristics such as canopy structure, by altering aerodynamics and trapping polluted air in street canyons [8], shedding pollen [9], or emitting volatile organic compounds [17]. On the other hand, some species can improve air quality both chemically and physically [6]. Plants consume CO2 and emit oxygen as a product of photosynthesis; they can also take up numerous pollutants, including air pollutants such as VOCs [7].
One form of air pollution, particulate matter (PM), is of particular concern for human health, especially fine particles of less than 2.5 µm (PM2.5) which can penetrate human lungs, promoting respiratory diseases as well as cardiovascular disease [18,19,20]. Particulate matter consists of small air-borne particles, less than 100 µm in diameter, of both solids and droplets of liquid. These vary in origin and may consist of mixtures; hence, they are usually categorised according to size, for instance, 10–100 µm, 2.5–10 µm, and 0.2–2.5 µm [20], and in some cases size is a useful proxy for chemical composition [14].
PM can have a wide-reaching ecological impact [14], largely because of its effect on animal and plant health and productivity. Although organisms in ecosystems may adapt to increased PM [14], some species are sensitive and could be replaced with more tolerant ones, with an accompanying change in community assemblage. The direct effects of PM on plant stress is little studied, but initial findings suggest species vary widely in their tolerance for this pollution and this is reflected in health parameters such as chlorophyll fluorescence, which, as a measure of photosynthesis efficiency, is also a widely used proxy for plant stress [21,22,23,24].
Plants trap particles on leaves, either in surface features such as hairs, veins, and so on, or in a waxy cuticle [25]. These particles can interfere with photosynthesis and metabolism in numerous ways. For instance, PM can shade the leaf, reducing the amount of solar radiation it receives; it can block stomata, causing a reduction in gas exchange (H2O and CO2), affecting water balance and therefore potentially heat control and mineral transport through the plant; it can also directly injure leaf surfaces [14] both by abrasion and by chemical reactions, for instance, where pH is raised, causing hydrolysis of lipid and wax components.
Although plants may be damaged by PM, some plant species are sufficiently tolerant to be used in removal of PM by phytoremediation [25,26]. This process relies on plants’ ability to trap PM on their leaves and while research is well established (and growing) in vascular plants, phytoremediation is little studied in living moss.
Mosses are small plants, often less than 1 cm high, with small leaves usually only one cell thick, often termed non-vascular or non-flowering plants, because they generally have no internal transport system, and do not produce flowers [27]. As moss plants have no true roots, they can colonise bare rock-like substrates and skeletal soils, and therefore are pioneers and colonisers in urban areas. Their growth form, in mats and cushions, means they have a complex leaf arrangement with a high surface to volume ratio and may potentially trap PM.
One area where moss is already being used in air quality research is as a bio-monitor, due to its ability to accumulate chemicals, including heavy metals, on its surface and within its tissues, in particular, the cell wall [28,29]. It is often used for this task in the form of moss bags, which consist of “devitalised” moss shoots in a nylon mesh bag. Alternatively, moss samples are washed, homogenised in a grinder, and analysed using extraction techniques [30], or cleaned with nitrogen jet before tissues are ground and analysed [31]. Suggestions have been made that moss is valuable in phytoremediation, for instance, on extensive green roofs, or urban plantings, but few studies investigate the ability of urban mosses to trap PM and none we know of compare their ability with trees, which are already widely used in urban settings [6,32,33].
To begin to fill these gaps, our study aimed to compare the ability of moss to trap PM compared to trees and to gauge the sensitivity of this accumulation on an urban gradient, i.e. in sites that were highly urban, next to busy highways; of medium urbanisation, near suburban streets; and of low urbanisation, in quiet back roads. Such studies are useful because they can test hypotheses concerning the impact of urban development [34]. We sampled roadside moss turfs as well as leaves from an adjacent, common native tree species and analysed them for PM capture. We were also interested in plant stress on this gradient and therefore took measurements of photosynthetic efficiency of both plant types. Particulate matter accumulation has been measured in moss bags [29] and sediment capture by moss turfs has been measured in the lab [35], however to our knowledge this is the first time mosses in the field have been analysed in this manner. Pollution data is often available at a city level, but this is most often based on a single site, therefore we also sought to obtain PM data on an urban gradient by operating a mobile particulate matter monitoring device to fine tune understanding of air quality variation, both temporally and spatially.
2. Methods
2.1. Study Location
The study took place in the suburbs of Wollongong in the Illawarra region of NSW, Australia. Wollongong is a coastal city with a population of around 213,000, 85 km south of the state capital, Sydney [36]. Summer average temperatures are 20–22 °C, while in winter months, average temperatures range from 12 to 14 °C, and average annual rainfall is approximately 1100 mL [37]. It has a history of steel making and coal mining, and at the time of the study, a large industrial area still forms a significant hub and economical source within the city. The city is bounded by an 800 m high escarpment to the west, and the ocean to the east. Wollongong’s main source of PM is basic ferrous metal manufacturing and wood fires in homes [37].
2.2. Site Selection
Roadside sites were selected to vary in pollution levels due to road classification. Moss turfs were sampled at nine roadside sites in suburbs of Wollongong, with three in each level of urbanisation. “High” urban sites were next to highways or motorways, “medium” sites were on suburban roads in residential suburbs, and “low” sites were quiet roads in suburbs near to the Illawarra Escarpment, an area of natural vegetation (Figure 1).
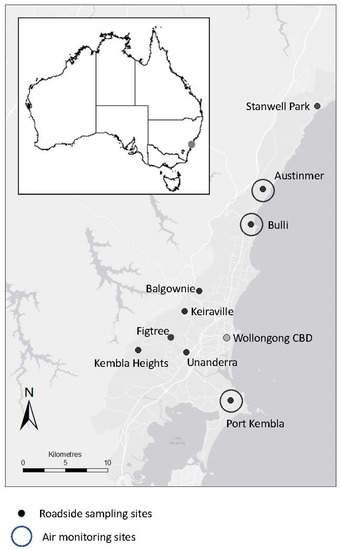
Figure 1.
Map showing 9 roadside selection sites in Wollongong suburbs, NSW, Australia. “Low” urban sites on quiet roads are Stanwell Park, Austinmer, and Kembla Heights. "Medium" urban sites on suburban roads are Bulli, Figtree, and Balgownie. “High” urban sites on highways are Port Kembla, Unanderra, and Keiraville. Monitoring stations locations are also shown (Austinmer, Bulli, and Port Kembla). The fixed government monitor is near Wollongong CBD.
2.3. Air Quality Monitoring
Quantitative measurements of ambient PM2.5 concentrations were made at three locations, one from each of the designated levels of urbanisation described above: Port Kembla (high), Bulli (medium), and Austinmer (low) (Figure 1). The measurements were made using a TSI DustTrak DRX 8533 particulate monitor fitted with a PM2.5 sampling inlet. The measurements were made in three two-week campaigns with the aim of verifying the classification of study sites to low/medium and high urban class (expected to be related to PM pollution). Each campaign was set up to continually monitor ambient particulate concentrations of PM2.5 at three-minute intervals. The monitor was set up according to the constraints of each site. At Port Kembla, it was placed on a stationery shipping container within the grounds of a steel making company. At Bulli, the instrument was placed on the roof of a single story shed, while at Austinmer, it was placed at ground level at the front of a private garden, next to the road. The measurements were also compared to coincident measurements of PM2.5 from the Office of Environment and Heritage’s (OEH) permanent air quality monitoring site in Wollongong (close to the city centre) using a particulate beta-attenuation instrumentation. These comparisons were used to ensure that differences observed at the different sites were predominantly the result of spatial variability of PM2.5 concentrations rather than temporal differences. Data was analysed using the statistical package R, using the “openair” package [38].
2.4. Tree Leaf and Moss Sampling
Plants were sampled in the first two hours post-sunrise, when UV readings were low on a day at least four days after rain, which can wash off particulate matter. The sampling occurred in Autumn. The tree, Pittosporum undulatum Vent., was chosen as a comparison tree species because it was the only species found at every site, and because it fell in 6th place out of 12 in an investigation into accumulation abilities of Australian tree species found in urban areas (Popek, unpubl).
At each site four moss samples (approximately 4 cm × 4 cm) were identified as close to a tree as possible, mostly within 50 m. The requirement for sufficient material for analysis of particulate matter meant relatively well-established moss turfs were sampled. Moss was identified to genus and, where possible, species using dissecting and compound microscopes.
Chlorophyll fluorescence measurements (effective (ϕPSII in the light; PSII, photosystem II is one of two units in the chloroplast that capture light) or optimum yield (dark adapted Fv/Fm)} were taken for each moss sample to obtain a field measurement using a MiniPam (WALZ Effeltrich, Germany). At some sites moss was completely dry, hence gave no reading, because photosynthesis ceases in the desiccated state, therefore at all sites the turf samples were lightly sprayed with water as the equivalent of a short, light, shower of rain. After 20 min, further fluorescence measurements were taken for each moss sample. Similar measurements were taken for four leaves from the tree. For each moss or leaf sample, four measurements were taken and averaged.
Moss was then collected and stored in a screw lid container in a cool-box. Eight leaves were also removed from the tree, four for dark adaptation and four leaves for PM measurement, and stored in paper bags. All samples were returned to the laboratory for further analysis.
2.5. Dark Adaptation
Pre-dawn measurements of fluorescence are often considered preferential because the plant is at its least stressed, and all PSIIs are oxidised and open for light absorption, but this was considered impractical at many of these urban sites. In order to obtain a similar measure of optimum yield (Fv/Fm), plant material was dark-adapted in the lab under a thick black plastic sheet. Chlorophyll fluorescence measurements were then taken approximately every hour until a maximum was achieved within four hours.
2.6. Particulate Matter Extraction
We followed a standard protocol for PM isolation by filtration, with some modifications due to equipment availability [39]. Particulate matter of different sizes was removed using a series of filters (Whatman): paper filters with mesh diameter 100 µm for water and chloroform extractions; paper filters with mesh diameter of 2.5 µm for water and chloroform; nylon filters with diameter 0.2 µm for water extraction and PTFE filters, diameter 0.2 µm for chloroform extraction. These were used with a flask and vacuum extractor as follows for each of the four samples from each site.
All filters for the extraction, including controls, were removed from packaging and equilibrated to room humidity for 30 minutes. Filters were weighed and two replicate series of weighed filters were set aside as controls. These controls ensured any changes in humidity that could affect filter weight were accounted for. Firstly, PM was removed with water in a manner that could simulate heavy rain.
2.7. Leaf PM Extraction
Four leaves were placed in a beaker with 150 mL distilled water. The beaker was agitated for one minute then the contents were passed through a 100 µm sieve. The sieve removed particles of greater than 100 µm which are not considered to be detrimental to human health. This water extract was then passed through the three filters described above, one after another, and the filters were set aside for drying.
Using the same leaf material, a second extraction was performed using 50 mL of chloroform in a beaker. The material was agitated for a minute before passing through the 100 µm sieve. Chloroform dissolves the leaf’s cuticle and releases PM that is embedded in the cuticle and is expected to remove the majority of waxes from a leaf [40]. The resultant chloroform was passed through the three filter sizes one after the other and the filters were put aside to dry. The final chloroform extract was poured into a previously weighed beaker and left for all liquid to evaporate (approximately 24 h) in order to isolate waxes that had been removed from the plant material.
2.8. Moss PM Extraction
Moss samples were prepared by separating all moss tissue, both green and brown, from any soil or other substrate. We aimed to use 400 mg of fresh material per sample for the extraction process, but where this was not possible, in three cases, the entire sample was used and, in these cases, ranged from 69 mg to 273 mg.
Each sample was placed in a plastic tea strainer and washed 10 times with 100 mL water to simulate the same ’rain’ process as for leaves. This washed and loosened particles remaining on the leaf and within the moss turf. The water was passed through the 100 µm sieve as for the leaf material and the process was repeated in exactly the same manner as for the leaves. After extraction, filters were left to dry, then weighed. Control filters were weighed at the same time.
Both leaf and moss samples were oven-dried for three days at 70 °C and weighed to allow standardisation of PM amounts to dry weight.
2.9. Analysis
Extracted PM was analysed using ANOVAs in JMP version 13 in the three fractions: by plant type and urban class, position in the leaf (surface or cuticle), and Fv/Fm. Sensor data was analysed using the openair software package in R [38].
3. Results
3.1. Verification of Site Categorisation Using Ambient PM2.5 Measurements
Ambient PM2.5 followed a clear trend of increasing amounts with urbanisation across the three sites of the campaign (Figure 2, Figure 3). The industrial site measurements were consistently higher than the suburban, which were consistently higher than the urban edge site (average 15 µg/m3, 9.0 µg/m3, and 5.3 µg/m3, respectively). Compared to the OEH publicly available data for Wollongong, these site figures were higher in the industrial and suburban site (the city measurements were 8.00 µg/m3 and 6.99 µg/m3 during this time) and lower in the least urban site (city measurement was 6.63 µg/m3). During the campaign, the industrial site exceeded daily air quality standards on one day, with a measurement of 27 µg/m3 compared to the daily standard of 25 µg/m3. This was a relatively calm day, with an average wind speed of 1.5 m/s, in an easterly direction, which suggested a local PM source from nearby iron and steel making, car and coal loading berths at the harbor, and ocean (salt) aerosols.
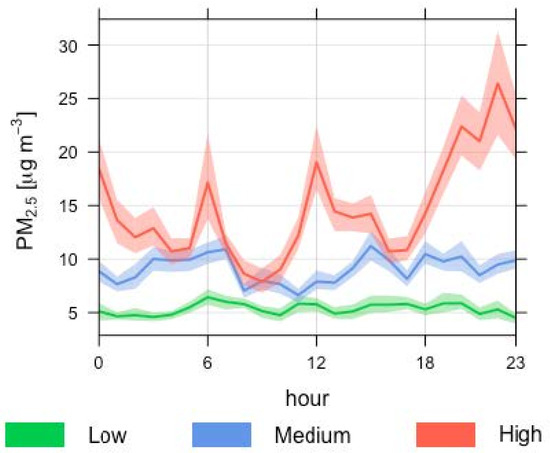
Figure 2.
Time variation plot of PM2.5 (µg/m3) concentrations from the three air monitoring sites within the urban classes, low, medium, and high. PM2.5 at corresponding time of day was averaged for each sampling period. Mean is shown with a solid line and 95% confidence interval in the mean is shown with a transparent area.

Figure 3.
(a) Notched boxplots of PM2.5 (μg/m3) hourly concentrations from each of the three air monitoring site locations. Austinmer was low urbanisation, Bulli was medium, and Port Kembla was highly urbanised. (b) Notched boxplot of PM2.5 (μg/m3) hourly concentrations from the Office of Environment and Heritage OEH permanent monitoring station during three different time periods (when the mobile air sensor was deployed at the different sites in (a), noted on the x axis).
In addition, all but the least urban site recorded averages that exceeded the yearly average standard of 8 µg/m3.
3.2. Particulate Matter
The total amounts of PM trapped by the roadside moss turfs ranged from a site mean of 33 mg of PM per g dry weight of moss in an industrialised site, to 5.60 mg per g dry weight in a low urban area. There is a clear and significant trend (F = 15.0502,8 p = 0.0046: Figure 4) in total PM amount trapped along the urban gradient, with dramatically less in low urban areas (mean 6.6 mg per g ± 1.3), more in suburban (mean 16.8 mg per g ± 0.6), and greatest in highly urban (25 mg per g ± 7). The main findings are also summarised in Table 1.
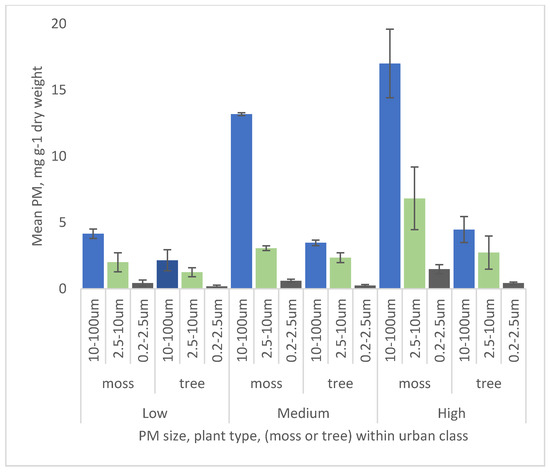
Figure 4.
Particulate matter (PM) captured by roadside moss turfs and tree leaf samples at nine sites in three urban classes, “low”, “medium”, and “high”. PM is shown by fraction size, 10–100 µm, 2.5–10 µm, and 0.2–2.5 µm. PM values are expressed as mg per g dry weight. Error bars are ± 1 standard error.

Table 1.
Summary of main results comparing moss turfs and tree leaves for PM capture, photosynthetic efficiency (Fv/Fm), and wax content at nine sites in three urban “classes”: low (quiet roads), medium (suburban roads), and high (freeways) within Wollongong, NSW. PM is shown in mg per g dry weight. PM100 refers to PM of 10–100 µm, PM10 is between 2.5 and 10 µm, and PM2.5 is between 0.2 and 2.5 µm. Fv/Fm is a ratio and represents the maximum quantum yield of PSII (PSII refers to photosystem II). Wax content is mg per g dry weight. Numbers in brackets show ranges for Fv/Fm and for wax content.
3.3. Size Fractions
All turfs trapped PM in all three size classes showed a similar decline from urban to less urban. For coarse PM (10–100 µm) and medium PM (2.5–10 µum), this trend was significant, with increases correlating to urbanisation (coarse: F = 19.18792,8, p = 0.025; medium: F = 9.32472,8, p = 0.0144). For the fine fraction, (0.2–2.5 µm), amounts correlated with urbanisation, but the differences were not significant (F = 5.14282,8, p = 0.05) (Figure 4).
3.4. Moss Versus Tree
For the leaves, there was also a trend with increased PM with urban class, but the differences were significant only for the coarse fraction (10–100 µm: F = 8.3122,8, p = 0.0186; medium: F = 2.28502,8, p = 0.1829; fine: F = 2.07312,8, p = 0.2068).
In all sizes and across urban classes, moss turfs trapped more than leaves on a weight by weight basis. The degree to which they trapped more also generally increased with urbanisation, but this trend is greatest for the coarse size (10–100 µm) and lowest for fine (0.2–2.5 µm). Across the three highest urban sites, moss trapped 3.8 times more than leaves.
3.5. In Wax PM and Wax Content
For roadside mosses, by far the majority of PM was on the plant surface compared to in the waxy cuticle fraction, this ratio is 5.0 (surface) to 1.0 (wax) (Figure 5). The Pittosporum leaves also captured more PM on their surface than in their wax, but in a more equivalent ratio (1.35:1.00). These differences between leaf location were significant for both plant types (moss F1,215 = 50.8934, p < 0.0001; tree F1,215 = 6.7459, p = 0.0100).
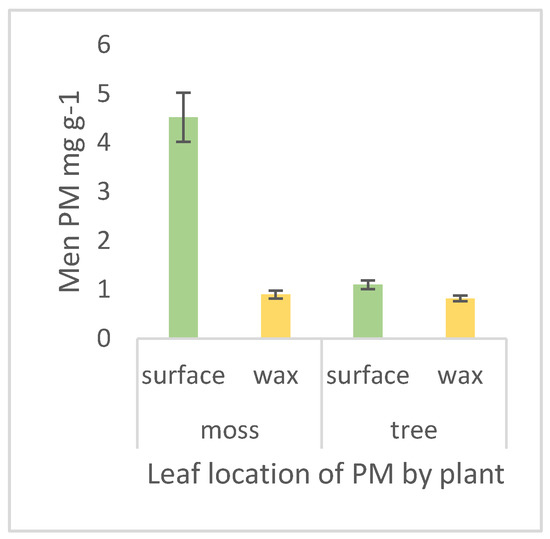
Figure 5.
Location of total PM on plant leaves comparing surface PM with that trapped in and extracted from wax from nine sites on an urban gradient. PM is measured in mg per g dry weight. Error bars are ± 1 standard error.
For both the moss and tree, wax isolated during the PM extraction followed a general trend of increasing wax with urbanisation but the results are not significant (Figure 6, tree (F = 0.97632,8, p = 0.4295; moss F = 1.80392,8, p = 0.2436). As expected, mosses had much less wax than trees.
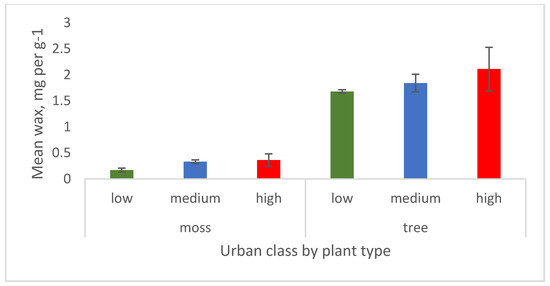
Figure 6.
Mean wax on moss and tree leaf showing trend with increasing urban class. Wax is measured in mg per g dry weight. Error bars are ± 1 standard error.
3.6. Chlorophyll Fluorescence
Healthy leaves from vascular plants, like trees, will have an Fv/Fm of 0.83 [23]. Mosses tend to have slightly lower healthy Fv/Fm values, and so 0.75 indicates healthy plants [41]. As photosynthetic efficiency declines, Fv/Fm declines, with 0.4 indicating a halving of efficiency. Both moss and trees thus show a trend for increased stress with urbanisation as measured by chlorophyll fluorescence in dark adapted samples, but the differences are not significant (moss: F = 3.04282,8, p = 0.1224; tree F = 1.35602,8, p = 0.3267: Figure 7). Tree leaves declined by 2% from low to high urbanisation, while moss photosynthetic efficiency declined by 40%, indicating a steeper stress gradient.
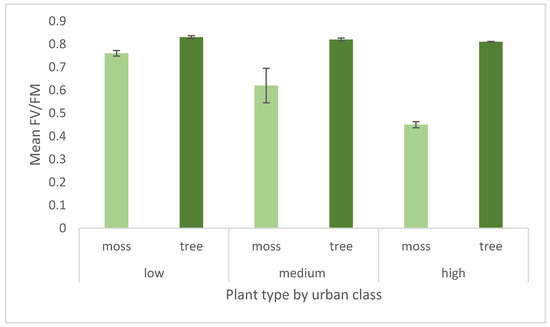
Figure 7.
Mean optimum photosynthetic efficiency, measured as the chlorophyll fluorescence parameter Fv/Fm after dark adaptation in the laboratory. Each urban class is an average of Fv/Fm over nine sites. Error bars are + 1 standard error.
3.7. Moss Species
The roadside mosses were identified as five different species using keys for south Australia [42,43]. They were Fabronia australis Hook, Hedwigia ciliata (Hedw.), Tortula muralis Hedw., Bryum argenteum Hedw., and a second moss from the Bryum genus. Although not all mosses were found in all site types, there was some spread along the urban gradient. Both Bryum species were found in sites of medium and high urbanisation, F. australis was found in low urbanised sites only, and H. ciliata and T. muralis were found in both low and high.
4. Discussion
Plants are beneficial for numerous reasons in the urban environment, including phytoremediation, for instance, by trapping PM. Moss is a common plant in urban areas because it is a coloniser and pioneer, yet moss turfs have not been studied for PM capture in situ. We compared moss with tree leaves, as numerous tree species have been investigated worldwide. We found that on a dry weight basis, moss traps more PM than leaves from the native tree Pittosporum undulatum. This is interesting because it confirms the potential value of moss in the urban environment, whether its presence is due to spontaneous growth, deliberate plantings for urban greening, or in potential applications such as green roofs.
While plants may be useful in urban settings, some species may also struggle to persist due to a range of stressors. PM is a potential stressor, so it is interesting to note the increased PM capture correlating with increased stress by moss as measured by Fv/Fm, a common measurement of plant stress.
Plant species vary widely in their ability to trap PM [25,39,44], due, at least in part, to differences in leaf surface features such as trichomes, stomata, and leaf shape [45]. Moss has a complex three-dimensional morphology compared to the study leaf which is relatively flat and two dimensional and could explain the difference in PM uptake. In addition, in the study area, moss tended to be growing at ground level, whether on soil, wood, or pavement, and could receive PM both from the air on a dry day, and with rain, as it is washed off vegetation or other surfaces that are higher. While precipitation might wash some PM onto the soil, within established moss turfs, it could simply move it deeper within the moss cushion.
The sensor data confirmed the validity of site choice and concentration of air PM2.5. It also quantified the patchy nature of air quality in an urban environment, in terms of both temporal and spatial variability, with measurements differing substantially from publicly available air quality data. These differences may add to the stress load of the plants in these areas. The variability of PM concentration was also greater in the more urban site, which might represent greater extremes of pollution that plants in these sites must tolerate to persist. Additionally, according to the World Health Organization (WHO), PM is a common proxy indicator for air pollution (although not always: [46]), so the plants in our study locations are likely to be experiencing differences in a range of other pollutant concentrations, not just PM.
Although moss species varied across sites, it is unlikely that the differences observed in PM capture are due to differences in species’ ability to trap PM. That is not to say that they may not differ, but at the concentrations observed, the differences appear to be overridden by background PM content. This interpretation is supported by the DustTrak data which shows a steady increase in PM2.5 from low to medium and from medium to high urbanisation.
We have not analysed the composition of the PM trapped, but ANSTO (Australian Nuclear Science and Technology Organisation) has conducted PM2.5 sampling and characterisation in the Illawarra since 1990 and found it to consist of ammonium sulfate (29%), black carbon (15%), organic matter (14%), salt (16%), soil (10%), and ’other’ components (16%: [37]). In the Illawarra, PM sources are industrial, including industrial vehicles and shipping, vehicles, and residential fuel burning. Black carbon comes from incomplete combustion of fossil fuels used in transport, heating, and industry, as well as bushfires. For both PM10 and PM2.5, by far the majority (81% and 70% respectively) is sourced from industry [37].
PM has well-known impacts on plants. Black carbon (BC) is known to block stomates, shade the leaf, and also increase leaf temperature, with adverse effects on growth and photosynthesis. But while these effects are commonly observed in laboratory experiments, they have not always been found in long term field studies, perhaps due to far greater concentrations of BC used in the laboratory [47]. Ammonium sulfate (AMS) can be formed from the precursor, SO2, and is thought to deliquesce (dissolve in water) on the leaf surface, then be absorbed into the leaf tissue, resulting in increased concentrations of NH4+, amino acids, and total soluble protein [47]. Nitrogen deposition is considered a threat to plant diversity in Europe, but exactly how these PM constituents impact local plants in Wollongong, NSW, Australia, may depend on species tolerance and local conditions [13]. Potentially, they could alter tolerance to other stresses, both biotic (e.g. pest) and abiotic (e.g. drought) [48].
Mosses showed a clear decrease in chlorophyll fluorescence measurements on the urban gradient, i.e. with lower measurements (lesser photosynthetic efficiency) on busier roads. It would be tempting to attribute this directly to the PM measurements but there are many ways in which urban environments are stressful for plants over and above air pollution. The urban environment can be considered one of multiple stressors [49] and further experimentation is planned to untangle the effects of various stress on urban moss. Other major stresses include changes to light intensity and quality [50], changes to hydrology and greater exposure to drought conditions, especially at a microhabitat scale [51,52]. An experiment directly testing the effect of PM on moss stress would be valuable.
In contrast, the tree Undulatum pittosporum appears to be coping well with urban life. It is an adaptable species, found naturally in moist environments, but also appears to tolerate drier environments, hence its status as a weed in some cities (and even continents [53]).
For roadside mosses, by far the majority of PM was on the plant surface compared to being embedded in a waxy cuticle. Whether this is because of its wax chemistry, or because its complex morphology has more influence, is unclear. In general, it is understood that the amount of wax on a leaf does not appear to influence the amount of PM trapped in leaf cuticle wax, and is instead understood to be due to composition and structure of the epicuticular wax layer, which varies between species [39,54]. Plants evolved waxy cuticles in their transition to land and, in general, mosses have less waxes than vascular plants such as trees. However, wax is a critical part of the plant stress tolerance repertoire [55] so it is interesting to see that both the mosses and the tree appear to respond similarly to urbanisation by producing increased wax.
Our study has a number of limitations. Moss grows close to its substrate, whether that be soil or a hard substrate such as bark or rock, or, in the urban environment, building materials such as concrete and brick. While moss turfs were cleaned as much as possible of macro particles from soil, it is impossible to know the origin of the PM still trapped on the turf, i.e., whether it has been deposited from the air or recirculated from the soil. In either case, what we tested was the ability of the turfs, growing in comparable situations, to trap PM.
In studies concerned with the use of moss for biomonitoring, such as those that measure bioaccumulation by moss (incorporation of contaminants such as metals into the tissues), it is particularly important to remove external matter thoroughly by washing leaves or through other techniques such as nitrogen jets [31]. Doubt has been cast on the efficiency of any of these techniques [56], but a comprehensive review by Fernandez et al. [30] confirms that washing samples removes substantial portions of particles and should not be ignored. Our study is not concerned with bioaccumulation, nonetheless, even though we cannot be certain of the efficacy of the washing technique, we can be certain that it removes an important portion of PM.
Additionally, it would have been valuable to test the air quality at all of our sites, but this was beyond our resources. While it is interesting to note that the moss appears to have more wax in the busier, more urban roadsides, we see this more as raising a hypothesis about increased wax with urbanisation for moss, since our method was relatively coarse in this regard.
Bryophytes such as moss are increasingly being studied for urban applications, such as extensive green roofs [57,58], storm-water management [59], and greening of building structures [60]. Few studies investigate its use in particle capture. Sempel et al (2013) [61] compared the sediment capture under different wind speeds of Sedum mats to moss in a laboratory setting and found the succulent Sedum captured more, but both plants intercepted particles of 0.5 and 1 µm in wind conditions. Commercial products for air purification have been trialed in cities in Europe and Asia [62] but very few studies have been published in the scientific literature in English. Our study suggests that the use of moss in phytoremediation deserves further investigation.
Moss often grows in a community of organisms known as a biocrust that also consists of lichen, fungi, cyanobacteria, algae, and bacteria that has been extensively studied in drylands [63]. Eldridge and Mallen-Cooper [35] (2016) investigated Australian biocrust species for a range of functional traits and found tall mosses to capture the most sediment.
A further project is planned to characterise the PM on these moss and leaf samples using a scanning electron microscope. This will give an indication of the source of particles as well as variety and type. Controlled experiments looking at the direct effect of selected PM on moss photosynthesis and other stress markers will isolate the role of PM in these plants’ stressful condition in urban environments. It would also be interesting to more comprehensively assess the role of waxes in moss stress response.
5. Conclusions
Our study is novel in that it is the first (to our knowledge) to investigate PM capture by moss turfs in a field setting, particularly an urban one. On the one hand, our results provide an insight into the stressors that moss must tolerate in an urban environment, and which may indicate environmental filters at play [64,65,66]. On the other hand, the capacity of moss turfs to capture and potentially retain PM could be a useful trait when considering plantings for urban greening, or more specialised applications using moss to improve urban air quality.
Author Contributions
Conceptualization, A.H., S.A.R. and C.P.-W.; methodology, A.H., R.P., C.P.-W; formal analysis, A.H., R.P. and M.B.; writing—original draft preparation, A.H..; writing—review and editing, A.H., R.P., M.B, C.P-W., S.A.R.; visualization, A.H. and M.B.; supervision, S.A.R. and C.P.-W..; project administration, A.H.
Funding
This research received funding from Australia’s National Environmental Science Program through the Clean Air and Urban Landscapes hub.
Acknowledgments
We acknowledge the following support: A.H. is in receipt of an RTP scholarship, and R.P. visited Australia with the assistance of an Endeavour Fellowship, both from the Australian Government. We also acknowledge general student support from the Centre for Sustainable Ecosystem Solutions, the Centre for Atmospheric Chemistry and the Faculty of Science, Medicine, and Health at the University of Wollongong.
Conflicts of Interest
The authors declare no conflict of interest.
References
- McKinney, M.L. Urbanization, Biodiversity and Conservation. Biosience 2002, 52, 883–890. [Google Scholar] [CrossRef]
- Duncan, R.P.; Clemants, S.E.; Corlett, R.T.; Hahs, A.K.; McCarthy, M.A.; McDonnell, M.J.; Schwartz, M.W.; Thompson, K.; Vesk, P.A.; Williams, N.S. Plant traits and extinction in urban areas: A meta-analysis of 11 cities. Global Ecol. Biogeogr. 2011, 20, 509–519. [Google Scholar] [CrossRef]
- Wright, P.L.; Zang, L.; Chang, I.; Aherne, J.; Wentworth, G.R. Impacts and effects indicators of Atmospheric Deposition of Major Pollutants to Various Ecosystems. Aerosol Air Qual. Res. 2018, 18, 1953–1992. [Google Scholar] [CrossRef]
- Reinert, R.A. Plant Response to Air Pollutant Mixtures. Ann. Rev. Phytopathol. 1984, 22, 421–442. [Google Scholar] [CrossRef]
- Heath, R. Initial events in injury in plants by air pollutants. Annu. Rev. Plant Physiol. 1980, 31, 395–431. [Google Scholar] [CrossRef]
- Salt, D.E.; Smith, R.D.; Raskin, I. Phytoremediation. Annu. Rev. Plant Physiol. Plant Mol. Biol. 1998, 49, 643–648. [Google Scholar] [CrossRef] [PubMed]
- Wolverton, B.C.; McDonald, R.C.; Watkins, E.A. Foliage Plants for Removing Indoor Air Pollutants from Energy-Efficient Homes. Econo. Bot. 1984, 8, 224–228. [Google Scholar] [CrossRef]
- Buccolieri, R.; Jeanjean, A.P.R.; Gatto, E.; Leigh, R.J. The impact of trees on street ventilation, NOx and PM2.5 concentrations across heights in Marylebone Rd street canyon, central London. Sustain. Cities Soc. 2018, 41, 217–241. [Google Scholar] [CrossRef]
- D’Amato, G. Thunderstorm-related asthma attacks. J. Allergy Clin. Immunol. 2007, 139, 1786–1787. [Google Scholar] [CrossRef]
- UN. Our Urbanizing World, POPFACTS, No. 2014/3. 2014. Available online: https://www.un.org/en/development/desa/population/publications/pdf/popfacts/PopFacts_2014-3.pdf (accessed on 15 August 2014).
- Bergin, M.S.; West, J.J.; Keating, J.J.; Russsell, R.A. Regional Atmospheric Pollution and Transboundary Air Quality Management. Annu. Rev. Environ. Resource. 2005, 30, 1–37. [Google Scholar] [CrossRef]
- Australian Department of Energy and Environment. Fact Sheets on Air Pollution. Available online: http://www.environment.gov.au/protection/publications/factsheet-global-environmental-health-and-air-pollution. Accessed February 2019 (accessed on 28 February 2019).
- Bobbink, R.; Hornung, M.; Roelofs, J.G.M. The effects of air-borne nitrogen nutrients on species diversity in natural and semi-natural European vegetation. J. Ecology 1998, 86, 717–738. [Google Scholar] [CrossRef]
- Grantz, D.A.; Garner, J.H.B.; Johnson, D.W. Ecological effects of particulate matter. Environ. Int. 2003, 29, 213–239. [Google Scholar] [CrossRef]
- Laurence, J.A.; Weinstein, L.H. Effects of Air Pollution on Plant Productivity. Ann. Rev. Phytopathol. 1981, 19, 257–271. [Google Scholar] [CrossRef]
- Dugger, W.M.; Ting, I.P. Air pollution oxidants—Their effects on metabolic processes in plants. Annu. Rev. Plant Physiol. 1970, 21, 215–234. [Google Scholar]
- Seco, R.; Penuelas, J.; Filella, I. Short-chain oxygenated VOCs: Emission and uptake by plants and atmospheric sources, sinks, and concentrations. Atmos. Environ. 2007, 41, 2477–2499. [Google Scholar] [CrossRef]
- Ning, X.; Ji, X.; Li, G.; Sang, N. Ambient PM2.5 causes lung injuries and coupled energy metabolic disorder. Ecotox. Environ. Safe. 2019, 170, 620–626. [Google Scholar] [CrossRef]
- A Comparative Risk Assessment of Burden of Disease and Injury Attributable to 67 Risk Factors and Risk Factor Clusters in 21 Regions, 1990–2010: A Systematic Analysis for the Global Burden of Disease Study 2010. Available online: https://www.ncbi.nlm.nih.gov/pubmed/23245609 (accessed on 28 February 2018).
- Dockery, D.W.; Xu, X.; Spengler, J.D.; Ware, J.H.; Fay, M.E.; Ferns, B.G.; Speizer, F.E. An association between air pollution and mortality in six US cities. N. Engl. J. Med. 1993, 329, 1753–1759. [Google Scholar] [CrossRef]
- Proctor, M.C.F. Experiments on the effect of different intensities of desiccation on bryophyte survival, using chlorophyll fluorescence as anindex of recovery. J. Bryol. 2003, 25, 201–210. [Google Scholar] [CrossRef]
- Popek, R.; Przybysz, A.; Gawronska, H.; Klamkowski, K.; Gawronski, S.W. Impact of particulate matter accumulation on the photosynthetic apparatus of roadside woody plants growing in the urban conditions. Ecotoxicol. Environ. Safe. 2018, 163, 56–62. [Google Scholar] [CrossRef]
- Maxwell, K.; Johnson, G.N. Chlorophyll fluorescence—A practical guide. J. Exp. Bot. 2000, 51, 659–668. [Google Scholar] [CrossRef]
- Davies, M.; Ecroyd, H.; Robinson, S.A.; French, K. Stress in native grasses under ecologically relevant heat waves. PLoS ONE 2018, 13, e0204906. [Google Scholar] [CrossRef]
- Shi, S.; Wu, Z.; Liu, F.; Fan, W. Retention of Atmospheric Particles by Local Plant Leaves in the Mount Wutai Scenic Area, China. Atmosphere 2016, 7, 104. [Google Scholar] [CrossRef]
- Saeobo, A.; Popek, R.; Nawrot, B.; Hanslin, H.M.; Gawronska, H.; Gawronski, S.W. Plant species differences in particulate matter accumulation on leaf surfaces. Sci. Total Environ. 2012, 427, 347–354. [Google Scholar] [CrossRef]
- Eldridge, D.; Tozer, M.E. A Practical Guide to Soil Lichens and Bryophytes of Australia’s Dry Country; Department of Land and Water Conservation: Sydney, Australia, 1997.
- Spagnulo, V.; Zampella, M.; Giordano, S.; Adamo, P. Cytological stress and element uptake in moss and lichen exposed in bags in urban area. Ecotoxicol. Environ. Saf. 2014, 74, 1434–1443. [Google Scholar] [CrossRef] [PubMed]
- Di Palma, A.; Capozzi, F.; Spagnuolo, V.; Giordano, S. Atmospheric particulate matter intercepted by moss-bags: Relations to moss trace element uptake and land use. Chemosphere 2017, 176, 361–368. [Google Scholar] [CrossRef] [PubMed]
- Fernandez, J.A.; Boquette, M.T.; Carballeira, A.; Aboal, J.R. A critical review of protocols for moss biomonitoring of atmospheric deposition: Sampling and sample preparation. Sci. Total Environ. 2018, 517, 132–150. [Google Scholar] [CrossRef]
- Ducceschi, L.; Legittimo, P.C.; Bonzi, L.M. Heavy Metals in Moss and Bark from Urban Area of Florence: A New Cleaness Procedure for Removing Superficial Particulate Matter. Chem. Ecol. 1999, 16, 119–141. [Google Scholar] [CrossRef]
- Franchini, M.; Mannucci, P.M. Mitigation of air pollution by greenness: A narrative review. Eur. J. Intern. Med. 2018, 55, 1–5. [Google Scholar] [CrossRef]
- Janahall, S. Review on urban vegetation and particle air pollution: Deposition and dispersal. Atmos. Environ. 2015, 105, 130–137. [Google Scholar] [CrossRef]
- Alberti, M.; Botsford, E.; Cohen, A. Quantifying the Urban Gradient: Linking Urban Planning and Ecology. Available online: https://link.springer.com/chapter/10.1007/978-1-4615-1531-9_5 (accessed on 28 February 2019).
- Mallen-Cooper, M.; Eldridge, D. Laboratory-based techniques for assessing the functional traits of biocrusts. Plant Soil 2016, 406. [Google Scholar] [CrossRef]
- Australian Bureau of Statistics. 2016. Available online: https://quickstats.censusdata.abs.gov.au/census_services/getproduct/census/2016/quickstat/LGA18450 (accessed on 28 February 2019).
- Chang, L.T.; Scorgie, Y.; Trieu, T. Air Quality Trends in the Illawarra; Office of Environment and Heritage: Sydney, Australia, 2015.
- Carslaw, D.C.; Ropkins, K. Openair—An R package for air quality data analysis. Environ. Model. Softw. 2012, 27–28, 52–61. [Google Scholar] [CrossRef]
- Dzierzanowski, K.; Popek, R.; Gawronska, H.; Saebo, A.; Gawronski, S.W. Deposition of particulate matter of different size fractions on leaf surfaces and in waxes of urban forest species. Int. J. Phytoremediation 2011, 13, 1037–1046. [Google Scholar] [CrossRef]
- Ganeva, T.; Stefanova, M.; Koleva, D.; Ruiz, S.R. Isolation and recrystallisation of epicuticular waxes from Sorbus and Cotoneaster leaves. Open Life Sci. 2015, 38, 3033–3044. [Google Scholar]
- Robinson, S.A.; Wasley, J.; Popp, M.; Lovelock, C.E. Desiccation tolerance of three moss species from continental Antarctica. Aust. J. Plant Physiol. 2000, 2, 379–388. [Google Scholar] [CrossRef]
- Scott, G.A.M.; Stone, I.G. The Mosses of Southern Australia; Academic Press: London, UK, 1976. [Google Scholar]
- Catcheside, D.G. Mosses of South Australia; Government Printer: Adelaide, Australia, 1980.
- Popek, R.; Gawronska, H.; Wrochna, M.; Gawronski, S.W.; Saebo, A. Particulate matter on foliage of 13 woody species: Deposition on surfaces and phytostabilisation in waxes—A 3-year study. Int. J. Phytoremediation 2013, 15, 245–256. [Google Scholar] [CrossRef]
- Wei, H.; Lang, F.; Cheng, W.; Feng, Y.; Yang, W. The mechanisms for lung cancer risk of PM2.5. Environ. Toxicol. 2017, 32, 2341–2351. [Google Scholar] [CrossRef] [PubMed]
- Levy, I.; Mihele, C.; Lu, G.; Narayan, J.; Brook, J.R. Evaluating Multipollutant Exposure and Urban Air Quality: Pollutant Interrelationships, Neighborhood Variability, and Nitrogen Dioxide as a Proxy Pollutant. Environ. Health Perspect. 2014, 122, 65–72. [Google Scholar] [CrossRef] [PubMed]
- Yamaguchi, M.; Izuta, T. Effects of black carbon and ammonium sulfate particles on plants. In Air Pollution Impacts on Plants in East Asia; Springer: Tokyo, Japan, 2017. [Google Scholar]
- Fangmeir, A.; Hawiger-Fangmeir, A.; Van der Eerden, L.; Jager, H.-J. Effects of atmospheric ammonia on vegetation—A review. Environ. Pollut. 1994, 86, 43–82. [Google Scholar] [CrossRef]
- Calfapietra, C.; Penuelas, J.; Niinemets, U. Urban plant physiology: adaptation-mitigation strategies under permanent stress. Trends Plant Sci. 2015, 20, 72–75. [Google Scholar] [CrossRef]
- Holbrook, N.M.; Lund, C.P. Photosynthesis in forest canopies. In Forest Canopies; Lowman, M.D., Nadkarni, N.M., Eds.; Academic Press: San Jose, CA, USA, 1995. [Google Scholar]
- Pickett, S.; Cadenasso, M.; Grove, J.; Boone, C.; Groffman, P.; Irwin, E.; Kaushal, S.; Marshall, V.; McGrath, P.; Nilon, C.; et al. Urban ecological systems: Scientific foundations and a decade of progress. J. Environ. Manage. 2011, 92, 331–362. [Google Scholar] [CrossRef]
- Schwarz, K.; Hermann, D.; McHale, M. Abiotic drivers of ecological structure and function in urban systems. In Urban Wildlife Conservation; Springer: Boston, MA, USA, 2014. [Google Scholar]
- Gleadow, R.M.; Narayan, I. Temperature thresholds for germination and survival of Pittosporum undulatum: implications for management by fire. Acta Oecologica. 2007, 31, 151–157. [Google Scholar] [CrossRef]
- Jouraeva, V.A.; Johnson, D.L.; Hassett, J.P.; Nowak, D.J. Differences in accumulation of PAHs and metals on the leaves of Tilia euchlora and Pyrus calleryana. Environ. Pollut. 2002, 120, 331–338. [Google Scholar] [CrossRef]
- Renault, H.; Alber, A.; Horst, N.A.; Basilio Lopes, A.; Rich, E.A.; Kriegshauser, L.; Wiedemann, G.; Ullmann, P.; Herrgott, L.; Erhardt, M.; et al. A phenol-enriched cuticle is ancestral to lignin evolution in plants. Nat. Commun. 2017, 8. [Google Scholar] [CrossRef]
- Spagnuolo, V.; Giordano, S.; Perez-Llamazares, A.; Ares, A.; Carballeira, A.; Fernandez, J.A.; Aboal, J.R. Distinguishing metal bioconcentration from particulate matter in moss tissue: Testing methods of removing particles attached to the moss surface. Sci. Total Environ. 2013, 463–464, 727–733. [Google Scholar] [CrossRef] [PubMed]
- Paco, T.A.; Cameira, M.R.; Branquinho, C.; Cruz de Carvalho, R.; Luis, L.; Esprito-Santo, D.; Valente, F.; Brandao, C.; Soares, A.L. Innovative Green Roofs for Southern Europe: Biocrusts and Native Plants for Low Water Use. In Proceedings of the 40th IAHS World Congress on Housing, Funchal, Portugal, 16–19 December 2014. [Google Scholar]
- Drake, P.; Grimshaw-Surette, H.; Heim, A.; Lundholm, J. Mosses inhibit germination of vascular plants on an extensive green roof. Ecol. Eng. 2011, 117, 111–114. [Google Scholar] [CrossRef]
- Anderson, M.; Lambrinos, J.; Schroll, E. The potential value of mosses for stormwater management in urban environments. Urban Ecosyst. 2010, 13, 319–332. [Google Scholar] [CrossRef]
- Cruz, M.; Beckett, R. Bioreceptive design: A novel approach to biodigital materiality. Arq 2016, 20, 51–64. [Google Scholar] [CrossRef]
- Sempel, F.; Gorbachevskaya, O.; Mewis, I.; Ulrichs, C. Modellversuch zur Feinstaubbindung: Extensive Dachbergrunung vs Schotterdach. Gesunde Pflanzen 2013, 65, 113–118. [Google Scholar] [CrossRef]
- Splitgerber, V.; Saenger, P. City Tree: A Vertical Plant Wall. In Air Pollution XXIII 295; WIT Press: Southampton, UK, 2015. [Google Scholar]
- Belnap, J.; Weber, B.; Budel, B. Biological Soil Crusts as an Organizing Principle in Drylands. In Biological Soil Crusts as an Organizing Principle in Drylands, 2nd ed.; Springer: New York, NY, USA, 2016. [Google Scholar]
- Williams, N.S.; Schwartz, M.W.; Vesk, P.A.; McCarthy, M.A.; Hahs, A.K.; Clemants, S.E.; Corlett, R.T.; Duncan, R.P.; Norton, B.A.; Thompson, K.; et al. A Conceptual Framework for Predicting the Effects of Urban Environments on Floras. J. Ecology 2009, 9, 4–9. [Google Scholar] [CrossRef]
- Cheptou, P.O.; Carrue, O.; Rouifed, S.; Cantarel, A. Rapid evolution of seed dispersal in an urban environment in the weed Crepis sancta. PNAS 2008, 105, 3796–3799. [Google Scholar] [CrossRef]
- Kalusová, V.; Čeplová, N.; Lososová, Z. Which traits influence the frequency of plant species occurrence in urban habitat types? Urban Ecosyst. 2017, 20. [Google Scholar] [CrossRef]
© 2019 by the authors. Licensee MDPI, Basel, Switzerland. This article is an open access article distributed under the terms and conditions of the Creative Commons Attribution (CC BY) license (http://creativecommons.org/licenses/by/4.0/).