Review

Improvements in Forecasting Intense Rainfall: Results from the FRANC (Forecasting Rainfall Exploiting New Data Assimilation Techniques and Novel Observations of Convection) Project

by
Sarah L. Dance
1,2,*,
Susan P. Ballard
3,
Ross N. Bannister
1,
Peter Clark
1,
Hannah L. Cloke
1,4,5,
Timothy Darlington
6,
David L. A. Flack
1,†,
Suzanne L. Gray
1,
Lee Hawkness-Smith
3,
Nawal Husnoo
6,
Anthony J. Illingworth
1,
Graeme A. Kelly
3,
Humphrey W. Lean
3,
Dingmin Li
3,
Nancy K. Nichols
1,2,
John C. Nicol
1,
Andrew Oxley
7,
Robert S. Plant
1,
Nigel M. Roberts
3,
Ian Roulstone
7,
David Simonin
3,
Robert J. Thompson
1 and
Joanne A. Waller
1
add Show full author list remove Hide full author list
1
Department of Meteorology, University of Reading, Reading RG6 6BB, UK
2
Department of Mathematics and Statistics, University of Reading, Reading RG6 6AX, UK
3
MetOffice@Reading, Meteorology Building, University of Reading, Reading RG6 6BB, UK
4
Department of Geography and Environmental Science, University of Reading, Reading RG6 6AB, UK
5
Department of Earth Sciences, Uppsala University, 752 36 Uppsala, Sweden
6
Met Office, Fitzroy Rd, Exeter EX1 3PB, UK
7
Department of Mathematics, University of Surrey, Guildford GU2 7XH, UK
*
Author to whom correspondence should be addressed.
Current affiliation: LMD/IPSL, Département de Géosciences, ENS, PSL Research University, Ecole Polytechnique, Université Paris Saclay, Sorbonne Universités, UPMC Univ Paris 06, CNRS, Paris, France.
Atmosphere 2019, 10(3), 125; https://doi.org/10.3390/atmos10030125
Submission received: 11 January 2019 / Revised: 8 February 2019 / Accepted: 13 February 2019 / Published: 7 March 2019
(This article belongs to the Special Issue Advances in Applications of Weather Radar Data)

Abstract

:
The FRANC project (Forecasting Rainfall exploiting new data Assimilation techniques and Novel observations of Convection) has researched improvements in numerical weather prediction of convective rainfall via the reduction of initial condition uncertainty. This article provides an overview of the project’s achievements. We highlight new radar techniques: correcting for attenuation of the radar return; correction for beams that are over 90% blocked by trees or towers close to the radar; and direct assimilation of radar reflectivity and refractivity. We discuss the treatment of uncertainty in data assimilation: new methods for estimation of observation uncertainties with novel applications to Doppler radar winds, Atmospheric Motion Vectors, and satellite radiances; a new algorithm for implementation of spatially-correlated observation error statistics in operational data assimilation; and innovative treatment of moist processes in the background error covariance model. We present results indicating a link between the spatial predictability of convection and convective regimes, with potential to allow improved forecast interpretation. The research was carried out as a partnership between University researchers and the Met Office (UK). We discuss the benefits of this approach and the impact of our research, which has helped to improve operational forecasts for convective rainfall events.

Graphical Abstract

1. Introduction

Brief periods of intense rainfall can lead to flooding with the potential to cause damage to property and to threaten lives. Climate projections (e.g., [1]) indicate future intensification of short-duration rain in summer, with significantly more surface-water and flash flood events. Hence there is an increased need for timely flood warnings. Even flood warnings issued a few hours before an event can allow preparations to be made to minimize damage. To improve the prediction of these events, more accurate forecasts of convective rainfall are needed, and these can then be used to inform flood guidance and warning systems (e.g., [2]). In this article, we summarize the highlights of a collaboration between UK University and Met Office scientists that aimed to improve intense convective rainfall predictions.
Flood forecasting in the UK is delivered at both a national and a local level, with these services complementing each other to support consistent flood guidance and flood warning. At the national level, the joint Met Office/Environment Agency Flood Forecasting Centre (and its Scottish equivalent, the Scottish Flood Forecasting Service) delivers 5-day forecasts of flood risk to emergency responders to support them in planning for and mitigating against flooding [3,4]. A distributed (gridded) hydrological model generates river flow forecasts on a 1 km 2 grid across the UK, forced by a time-series of rainfall for each grid-box. The rainfall time-series is generated from a synthesis of rain-gauge, weather radar and numerical weather prediction (NWP) data. The use of NWP is critical in allowing the lead time of forecasts to be extended beyond a few hours.
Over the last decade, increases in computer power have allowed operational use of convection-permitting NWP models, such as the Met Office UK variable resolution (UKV) configuration of the Unified Model [5,6]. Although convection-permitting models produce realistic precipitation features, errors grow rapidly (especially at small scales) [7,8] and hence initial condition errors are a key source of uncertainty. To reduce these errors, and provide detail on appropriate scales, the assimilation of observations that have high frequency both in space and time has become increasingly important [9,10,11,12,13]. The FRANC (Forecasting Rainfall exploiting new data Assimilation techniques and Novel observations of Convection) project involves fundamental research to improve forecasts of severe weather by exploring new techniques to extract the maximum amount of information from observations of winds, temperature, precipitation and moist processes. The FRANC project has been funded by the UK Natural Environment Research Council (NERC) Flooding from Intense Rainfall (FFIR) programme. This programme has the objective of reducing the risks of damage and loss of life by surface water and flash floods through improved identification, characterisation and prediction of interacting meteorological, hydrological and hydro-morphological processes that contribute to flooding associated with high intensity rainfall events. FRANC forms the first work-package of the programme and has been carried out as a close collaboration between UK University and Met Office researchers, using Met Office software and operational systems alongside research facilities. The second work-package SINATRA (Susceptibility of catchments to INTense RAinfall and flooding) has the aim of advancing scientific understanding of the hydrological processes determining the probability, incidence, and impacts of FFIR. An ongoing, third work-package, TENDERLY (Towards END-to End flood forecasting and a tool for ReaL-time catchment susceptibilitY), is bringing the work in FRANC and SINATRA together to assess the benefits and feasibility of end-to-end flood forecasting (from clouds to catchment to impacts). The programme began in 2013 and will end in 2019. Some of the research from FRANC became operational in the Met Office system during this time period. The outputs arising from the project have been cited in the text with an asterisk (*) in order to help distinguish them from the other work referred to here.
The purpose of this paper is to bring together the key new research findings from the FRANC project, and discuss how they are being used to further develop the UK operational national flood guidance system. A brief overview of the components of the current operational system is given in Section 2. The new research has involved improvements in weather radar observations of precipitation and humidity (Section 3); novel techniques to assimilate these radar observations (Section 4); improved techniques for accounting for observation and forecast uncertainty in data assimilation (Section 5); and an improvement in our understanding of convective predictability (Section 6). In Section 7 we discuss the impact of these research results on the operational system, and explain how our partnership working (between Universities and the operational provider) has contributed to faster development and uptake of ideas. In Section 8 we conclude and give recommendations for future research.

2. Operational Hydrometeorological Forecasting in the UK

In this section we give a brief overview of the operational national flood guidance system. The schematic shown in Figure 1 indicates the main elements of the system. We describe some of these components briefly here. Further information is available in the articles [3,4].
Weather radar 
The operational weather radar network used by the UK consists of 15 dual polarisation and Doppler weather radars owned and operated by the Met Office, 1 dual polarisation and Doppler weather radar operated by Jersey Met, and two single polarisation radars operated by Met Éireann. An additional non-operational dual polarisation and Doppler radar, with the same specification as the rest of the network, is available to the Met Office at Wardon Hill, for research and development purposes. All 19 radars operate at C-band. More details of the system are described by [14]*. Radar observations are used in several ways in the flood forecasting chain. They are assimilated into the UKV (convection-permitting NWP model configuration) alongside a wide range of other observation types. Radar-derived rain-rate products are also used for extrapolation-based nowcasting (e.g., in the Short Term Ensemble Prediction System (STEPS) [15,16], which blends the extrapolation with NWP), and as a component of the input to the G2G (Grid-to-Grid hydrological model).
Data assimilation 
Initial conditions for convection-permitting NWP are provided from an incremental variational assimilation scheme [17] that is a limited-area version of the Met Office variational data assimilation scheme [18]. The scheme was upgraded in July 2017 from a 3-hourly cycling 3D system to an hourly-cycling 4D system, where a simplified linear version of the NWP model and its adjoint are iterated. The hourly-cycling 4D-Var scheme allows improved usage of the observations and more frequent forecast updates and hence improved forecasts [11]. The assimilation uses an adaptive mesh that allows the accurate representation of boundary layer structures [19,20]. Observations that are routinely assimilated include Doppler radar winds; wind profilers; satellite radiances from Meteosat Second Generation (MSG) SEVIRI (Spinning Enhanced Visible and InfraRed Imager), MHS (Microwave Humidity Sounder), IASI (Infrared Atmospheric Sounding Interferometer), CrIS (Cross-track Infrared Sounder), AIRS (Atmospheric Infrared Sounder) and ATMS (Advanced Technology Microwave Sounder); atmospheric motion vectors (AMVs) derived from MSG cloud and humidity tracking; scatterometer winds; aircraft temperature and winds (AMDAR); surface temperature, relative humidity, wind pressure and visibility; radiosonde temperature and wind; Global Navigation Satellite System (GNSS) zenith total delay; cloud parameters from 1D-Var analysis of SEVIRI data (GeoCloud) [21]. In addition, in the current system, latent heat nudging of radar-derived rain-rates is carried out [22], but work is ongoing to develop direct assimilation of radar reflectivity (see Section 4). More details of the system are described by [11,23].
Weather forecast models 
The deterministic NWP modelling system used is the Met Office UKV, the variable-resolution configuration of the nonhydrostatic Unified Model [6], that allows an explicit representation of convective processes as described by [5]. The UKV has a 1.5 km fixed horizontal grid-spacing in its interior surrounded by a variable-resolution grid that increases smoothly in size to 4 km. There are 70 vertical levels up to a height of approximately 40 km. The variable-resolution grid allows for a larger domain and for the downscaled boundary conditions, taken from the global model, to spin up without an abrupt change in resolution before reaching the fixed interior grid. Forecast length varies depending on the start time: the longest, 120 h forecast is produced twice daily (from 03 and 15Z analyses).
Numerical weather prediction ensemble 
The Met Office Global and Regional Ensemble Prediction System (MOGREPS) provides an ensemble of short-range NWP forecasts. The MOGREPS-UK ensemble [24] consists of a control plus 11 perturbed ensemble members each running with an interior 2.2 km horizontal grid-spacing and the same 70 vertical levels as the UKV model configuration. The control member is initialized from the UKV analysis interpolated onto the 2.2 km grid. For the other 11 members, perturbations from the corresponding global ensemble (MOGREPS-G) member are added to the interpolated UKV control analysis. Lateral boundary conditions are provided from the corresponding global ensemble member. In March 2016, a random parameters stochastic physics scheme was implemented. This perturbs selected parameters across the ensemble members in order to represent uncertainties in key physical processes and their contributions to uncertainties in the forecasts [25]. MOGREPS-UK forecasts for 54 h from analysis times at 03, 09, 15 and 21Z.
Hydrological model 
The Grid-to-Grid (G2G) model [26] is a distributed hydrological model, driven by inputs of gridded rainfall. The rainfall inputs are an optimal combination of rain-gauge, radar and NWP, with the blend dependent on lead-time [3]. (The skill of NWP-based nowcasting is assessed as a function of lead-time by [27]). The G2G model uses a simple runoff production scheme to generate surface and sub-surface runoff, controlled by the soil characteristics of each 1 km × 1 km grid cell, and these are defined from spatial data sets covering soil/geology and land cover properties. Further information about the system is given by [3,4].

3. Weather Radar Observations

The UK weather radar network has recently undergone a major upgrade including the installation of dual polarisation capabilities, whereby pulses are transmitted with horizontal or vertical polarisation and the reflectivity and phase of the returns in the two polarisations is recorded at each radar gate. The dual polarisation technology upgrade to the radars was developed in-house by Met Office staff, which allowed for access and control over the hardware and signal processing and enabled some of the novel developments in the FRANC project [28]*.

3.1. Removal of Non-Meteorological Effects

One of the key benefits of dual polarisation radars is their ability to provide information on the type of targets being observed. A quality control scheme that makes use of the polarisation diversity information to identify and reject non-hydrometeor echoes such as insects, ground clutter, aircrafts, ships and radio interference [14]* was developed in the FRANC project and has been implemented operationally since September 2014, while a hydrometeor classification scheme to identify rain, snow, hail, etc., is under development. The removal of non-meteorological echoes or clutter is essential for the use of radar data in hydrological models and NWP, where even a single pixel with a low intensity of persistent contamination by ground clutter echoes can result in significant rainfall accumulations over time.
The new dual polarisation classification scheme takes a probabilistic, Naive Bayes classifier approach, similar to that described in [29]. This scheme has resulted in a composite with fewer spurious echoes. The sensitivity of the radars to light rainfall has also increased by about 2–5% [28]*.
Partial blocking of the radar beam occurs due to objects (usually related to orography) obscuring the signal. The FRANC project led to the development of a scheme to use nearby radar returns from higher elevation radar scans to correct the low elevation scans at longer ranges [30]*. This correction should allow a dynamic correction (needed to account for seasonal changes as well as newly created blocks) for this obscuration and allow robust larger corrections than currently possible, enabling use of more representative radar data for rainfall estimation.

3.2. Radar Reflectivity Attenuation Correction

Hourly rainfall totals derived from radar reflectivity appeared to have an average fractional error of about 60% when compared with rain gauges [31,32,33], and, on occasion, errors were even larger. A major contribution to these errors, especially when there is heavy rain, is the attenuation of the radar return by both the falling rainfall and by a film of water on the radome protecting the radar. A new method, based on the idea that all attenuators are emitters has been used to estimate and correct for attenuation.
In the initial study (using the old UK radar network), it was found that attenuation by a wet radome was very significant, with half the signal being lost at rainrates of 3–5 mm/h [34]. However, after the radar network upgrade, the attenuation due to the wet radome is significantly less due to a hydrophobic coating on the radome. As such, at this time no correction for wet radome attenuation is made, but a system has been developed in the FRANC project to monitor the radomes for degradation with time, and this has been operational since September 2015 [28]*.
Attenuation due to distant storms is particularly important in intense rainfall, when floods are most likely. We have developed a three-parameter approach to correcting for the attenuation due to a distant storm.
  • The current single polarisation attenuation correction scheme, known as the Hitschfeld and Borden approach (H&B) [35], uses the measured reflectivity to estimate the attenuation due to storms. As the attenuation correction is a cumulative value which is added to subsequent range gates before the correction for those gates is calculated, it is unstable and can grow to unrealistically high values if the reflectivity measurement is incorrectly calibrated or contaminated by non-rain returns.
  • The dual polarisation upgrade allows the measurement of the differential phase shift, which is related to the attenuation [36], but the calibration constant can vary by a factor of 2 depending on the drop size distribution [37].
  • The Met Office weather radars are thought to be unique in that they have an additional means of measuring the total attenuation along a given path by making use of the radiometric emissions from attenuating storms. This provides a valuable additional constraint on the attenuation [38]*.
We now have three independent measurements of the total attenuation along a given ray. We can use the consistency between these measurements to get a better estimate of the true attenuation along the path [39]*. This includes recalibrating the estimate based on differential phase shift, detecting contamination and calibration issues with H&B, and detecting when the radiometric measurement has been contaminated by interference. This has been operational since November 2016 [28]*.

3.3. Radar Refractivity Observations

Near-surface moisture is one of the most fundamental variables for forecasting convective initiation. A small variation in boundary layer moisture can easily have an impact on the initiation of convective-scale precipitation [40]. Often thought of as a proxy for surface humidity, the refractivity, N is a convenient measure of the refractive index, n, of the air, (where n = 1 + 10 6 N ), and varies with fluctuations in surface temperature and humidity. A high resolution refractivity field can be retrieved from weather radar measurements [41]. The technique exploits the change in phase between two returns with a time separation of Δ t from a stationary ground clutter target. For the UK (C-band) radar network, a unit change in refractivity ( Δ N = 1 ) at 20 C, is approximately equivalent to a 1% change in relative humidity [42,43,44].
The UK operational rain radar network has been upgraded to enable refractivity measurement for use in short-term NWP forecasts of convection and precipitation. The quality of the retrieval depends on the accuracy of the phase shift measurement. Thus, observations can be contaminated by millimeter-scale target motion. Initial studies with operational data demonstrated a need to change the radar scanning strategy (in order to include a lower elevation, short pulse scan) and to improve target selection, in order to obtain better quality observations. For target selection, a quality index has been developed that takes account of the coherence of the refractivity signal, and enables removal of measurements from moving targets. Results comparing the radar refractivity measurements with an equivalent value computed from the closest surface station are illustrated in Figure 2. The quality index selection significantly decreases the radar errors relative to the surface stations. The next steps are to carry out real-time monitoring of the radar data and compare with surface observations and model equivalent refractivity, and to develop appropriate assimilation software.

4. Weather Radar Data Assimilation

Weather radar is a crucial observation type for convection-permitting NWP, since it provides information on key variables at high spatio-temporal resolution in the boundary layer. Doppler radar winds have been directly assimilated into the Met Office UKV operational system for some time [23]. In this section we describe our new developments in radar reflectivity assimilation, which build on the observational work described in Section 3.
There are three main approaches that have been tested for the assimilation of radar reflectivity data: Diabatic initialization, variational methods, and the Ensemble Kalman Filter. Diabatic initialization methods account for diabatic effects either by adjusting the latent heat release in model columns, by assuming saturation in cloud regions, or a combination of both approaches. The Met Office operational UKV uses the latent heat nudging method [22] to assimilate a radar derived surface rainrate product. Variational methods include indirect retrievals, where a 1D-Var scheme is used to retrieve humidity and temperature profiles from radar reflectivity observations [45,46], and direct methods, where radar reflectivity is forward modelled during the full 3- or 4D-minimization [47,48]. Ensemble Kalman filter methods are reviewed by [10,49].
The Met Office has been developing a scheme for the direct assimilation in 4D-Var of radar reflectivity observations into the UKV model. The direct assimilation scheme is based on [50]*. This has involved the development of an observation operator which forward models the NWP model variable rain mixing ratio to the observation, radar reflectivity. The highly non-linear nature of precipitation means that linearisation errors grow rapidly in the linear model, and the upgrade from three-hourly to hourly cycling has made direct assimilation of reflectivity observations in 4D-Var feasible for the first time in the UKV. To avoid large differences between the model and observation which would result from point-to-point comparisons, the differences are spatially averaged to create super-observations and Poisson thinning is used to reduce the effect of correlated observation errors, as is done operationally with Doppler winds [23].
Assimilating reflectivity observations directly in the variational scheme together with all the other observations means that the information from all observations can be used together synergistically to improve the representation of all model fields. Figure 3 demonstrates this for a case study of radar reflectivity assimilation from a three-week trial in June 2014. In this case, the radar reflectivity- rainrate relation,
Z = 181 R 7 / 4.67 ,
was used in the observation operator, where R is the model rainrate in mm h 1 interpolated to the observation location, and Z is the radar reflectivity in mm 6 m 3 . The radar imagery shows a band of precipitation across the north-east coast of Ireland (indicated by black oval). The control forecast, a standard UKV configuration which includes latent heat nudging, has precipitation in the area, but does not have a structured band. Directly assimilating radar reflectivity observations in the variational scheme leads to horizontal wind increments that enhance a convergence line. The forecast run from this assimilation experiment correctly forecasts the advection of this precipitation band north-eastwards towards Scotland over a period of four hours.
The Met Office is continuing development of the reflectivity assimilation scheme for the UKV. All the improvements to the radar data quality described in Section 3 will feed into the observation data used by the reflectivity assimilation scheme. To maximise the benefit of the direct assimilation scheme, the correlated observation error diagnostics described in Section 5 will be used to investigate radar reflectivity observations.

5. Uncertainty in Data Assimilation

Data assimilation provides methods for combining observations with prior knowledge of the atmosphere to obtain an estimate of the current state of the atmosphere, suitable for use in initializing a forecast. The weight assigned to each contribution is determined by the magnitude of its associated error statistics; hence the correct specification of uncertainty is crucial to the accuracy of forecasts. In this section we consider our new developments in the treatment of observation and forecast uncertainty in data assimilation for convection-permitting NWP.

5.1. Observation Uncertainty in Data Assimilation

The efficient assimilation of high-resolution observations is becoming increasingly important in operational convection-permitting NWP. Each atmospheric observation has an associated observation error, which is a combination of instrument error and representation error [51]*. The sources of representation error include uncertainty in the observation operator (the mapping between model variables and a model-equivalent observation), mismatch between the scales resolved by the observation and the scales resolved by the model and issues in observation preprocessing and quality control. It is generally assumed that instrument errors are uncorrelated. However, the error of representation is generally correlated and state dependent [52]. Nevertheless, for most observation types in most operational systems, it is currently assumed that the observation errors are uncorrelated. The observation density is reduced to avoid violating this assumption. Taking into account the full, potentially correlated, error statistics will allow the quantity of observations used to be increased and improves NWP forecast skill.
During the FRANC project we have used the diagnostic of [53] to estimate observation error statistics for several observation types that are assimilated into the UKV model configuration [54,55,56]*. The diagnostic makes use of statistical averages of observation-model departures that are routinely generated during the assimilation cycle; hence it is a cheap and simple method for characterizing observation error statistics. Despite its simplicity the diagnostic suffers from a number of limitations. Work during the project has shown how diagnostic results can be interpreted [57]* and how the diagnostic must be modified if used with local ensemble assimilation [58]*. The diagnostic tools developed are now used by Met Office scientists to help understand the sources of observation error, and to determine observation selection and other assimilation parameters. For example, [54]* showed that for Doppler radar winds, the diagnosed observation error standard deviations are similar to those used operationally and grow with an increase in observation height. However, the estimated horizontal observation error correlation length scales (approximately 15–40 km) are significantly longer than the operational thinning distance (6 km). The correlation lengths are dependent on the distance of the observation away from the radar as well as the height of the observation. Further tests showed that the long correlations are in part a result of using superobservations and a simplified observation operator. We found similar results in a study of the assimilation of Doppler radar winds into the Deutsche Wetterdienst (DWD) convection-permitting system [59]*.
Better use of the high-resolution observations should be accomplished by the inclusion of correlated error statistics in the assimilation, as this allows for less thinning of the data. However, taking account of spatial correlations in a operational system does require a new supercomputing parallelization strategy to avoid excessive communications between processors. Initial forecast trials in the Met Office system with new software developed as part of the FRANC collaboration are described by [60]*. They demonstrate no significant difference in wall-clock time for the assimilation, despite a fourfold increase in the number of Doppler radar wind observations assimilated each cycle. These preliminary experiments show that there is a neutral to positive impact on forecast skill, particularly for quantitative precipitation forecasts. There is further potential to improve the forecast skill by tuning the assimilation parameters and applying the technique to other observation types.

5.2. Forecast Uncertainty in Data Assimilation

In data assimilation, prior information is provided by a background field, which usually comes from a recent forecast. The background error covariance matrix expresses our prior understanding about the uncertainties in the forecast. In data assimilation systems used to initialize large-scale models, the background error covariance matrix has been exploited to help keep the analyzed mass and wind in a state of near geostrophic and hydrostatic balance by imposing correlations between the relevant mass and wind fields. However, the assumptions typically used for global data assimilation are sometimes less valid for convective-scale flow where the errors are highly flow-dependent, inhomogeneous, and non-linear. The initialization of many more water variables (cloud water, cloud ice, and the various precipitation hydrometeors) also becomes important. In this context, the way that the background error covariance is formulated can have a profound influence on forecast precipitation amounts, patterns, and timings.
For the purposes of this article we restrict ourselves to a limited consideration of moisture errors. It is not uncommon for convective-scale forecasts to show spin-up and spin-down problems. The spin-up problem describes a delay in convective-initiation in models, or a period of adjustment to the scale of convective features, due to inappropriate initial conditions computed using an inappropriate forecast error covariance matrix, or when a convective-scale forecast is initialized from a lower-resolution model [12,61]. The spin-down problem on the other hand describes excess activity at the start of a forecast, especially in precipitation [62]. Excess precipitation may be a problem that can be tackled with an improved background error covariance matrix, to permit only states that have a degree of balance between moisture and other fields (e.g., by discouraging supersaturation, where relative humidity > 100 % ). This issue requires consideration of non-Gaussian background errors. This is a departure from usual assimilation schemes, which treat background errors as Gaussian.
The FRANC project has explored the treatment of non-Gaussian moisture errors using the technique of Gaussian anamorphosis (GA) [63]. GA is a framework for transforming an error variable with an arbitrary probability density to a new variable with a Gaussian density. An analysis variable with a Gaussian density is a more suitable variable for data assimilation, as this leads to a quadratic objective function for minimization.
In the example illustrated here, we transform the non-Gaussian relative humidity error variable, δ RH , to a new, Gaussian variable, δ χ , with zero mean and unit variance. Figure 4 illustrates this with a case that is very close to saturation (the true relative humidity is 99%) and where the background relative humidity has a non-Gaussian density (further details of the experiments are given in the caption).
The panels show histograms associated with doing single observation Monte-Carlo experiments for (a) conventional data assimilation when the background is assumed to be Gaussian (even though it is not), and (b) when the GA method is used. In each Monte-Carlo sample, the background forecast is sampled from the negatively skewed non-Gaussian distribution. The observation is sampled from a Gaussian distribution with mean value equal to the true relative humidity (99 %) and variance 1. The resulting analysis histograms are then computed. The background distribution does not support significant supersaturation (only 2% of background members are supersaturated). However, synthetic observations of supersaturation are allowed to simulate an assimilation system that anomalously encourages supersaturated states (e.g., by an incorrect interpretation of remotely sensed data, a background feature misalignment, a too-cold background, or where anomalous background error correlations push the system to supersaturation).
The method that assumes that the background distribution is Gaussian (Figure 4a) yields around 6% of the analysis samples as supersaturated. The method that uses GA (Figure 4b) takes account of the skewed background error distribution and yields fewer (1.3%) analysis samples as supersaturated. Analysing too many supersaturated cases will contribute to the spin-down problem discussed before, so these results suggest that there are potential benefits to improving the treatment of non-Gaussianity in operational data assimilation by GA. The practicalities of the GA approach for an operational system are discussed by [63].

5.3. Linear Models of Convection

In 4D-Var, a nonlinear least-squares problem is solved iteratively via a sequence of linearized problems. A linear dynamical model is used to evolve trajectories through the data assimilation time window. Sharp transitions between the regime of moist thermodynamics inside a cloud and dry thermodynamics outside a cloud can cause problems with minimizing the data assimilation objective function [64]. In FRANC we tackled the problem of deriving linear models of non-precipitating convection from cloud physics. The objective of this work was to expand on existing linear cloud models by implementing a smooth transition of buoyancy frequency across the cloud boundary. With the new model, we identified a critical relationship between growth rate and buoyancy frequency necessary for cloud solutions to form. Further details are given by [65]*.

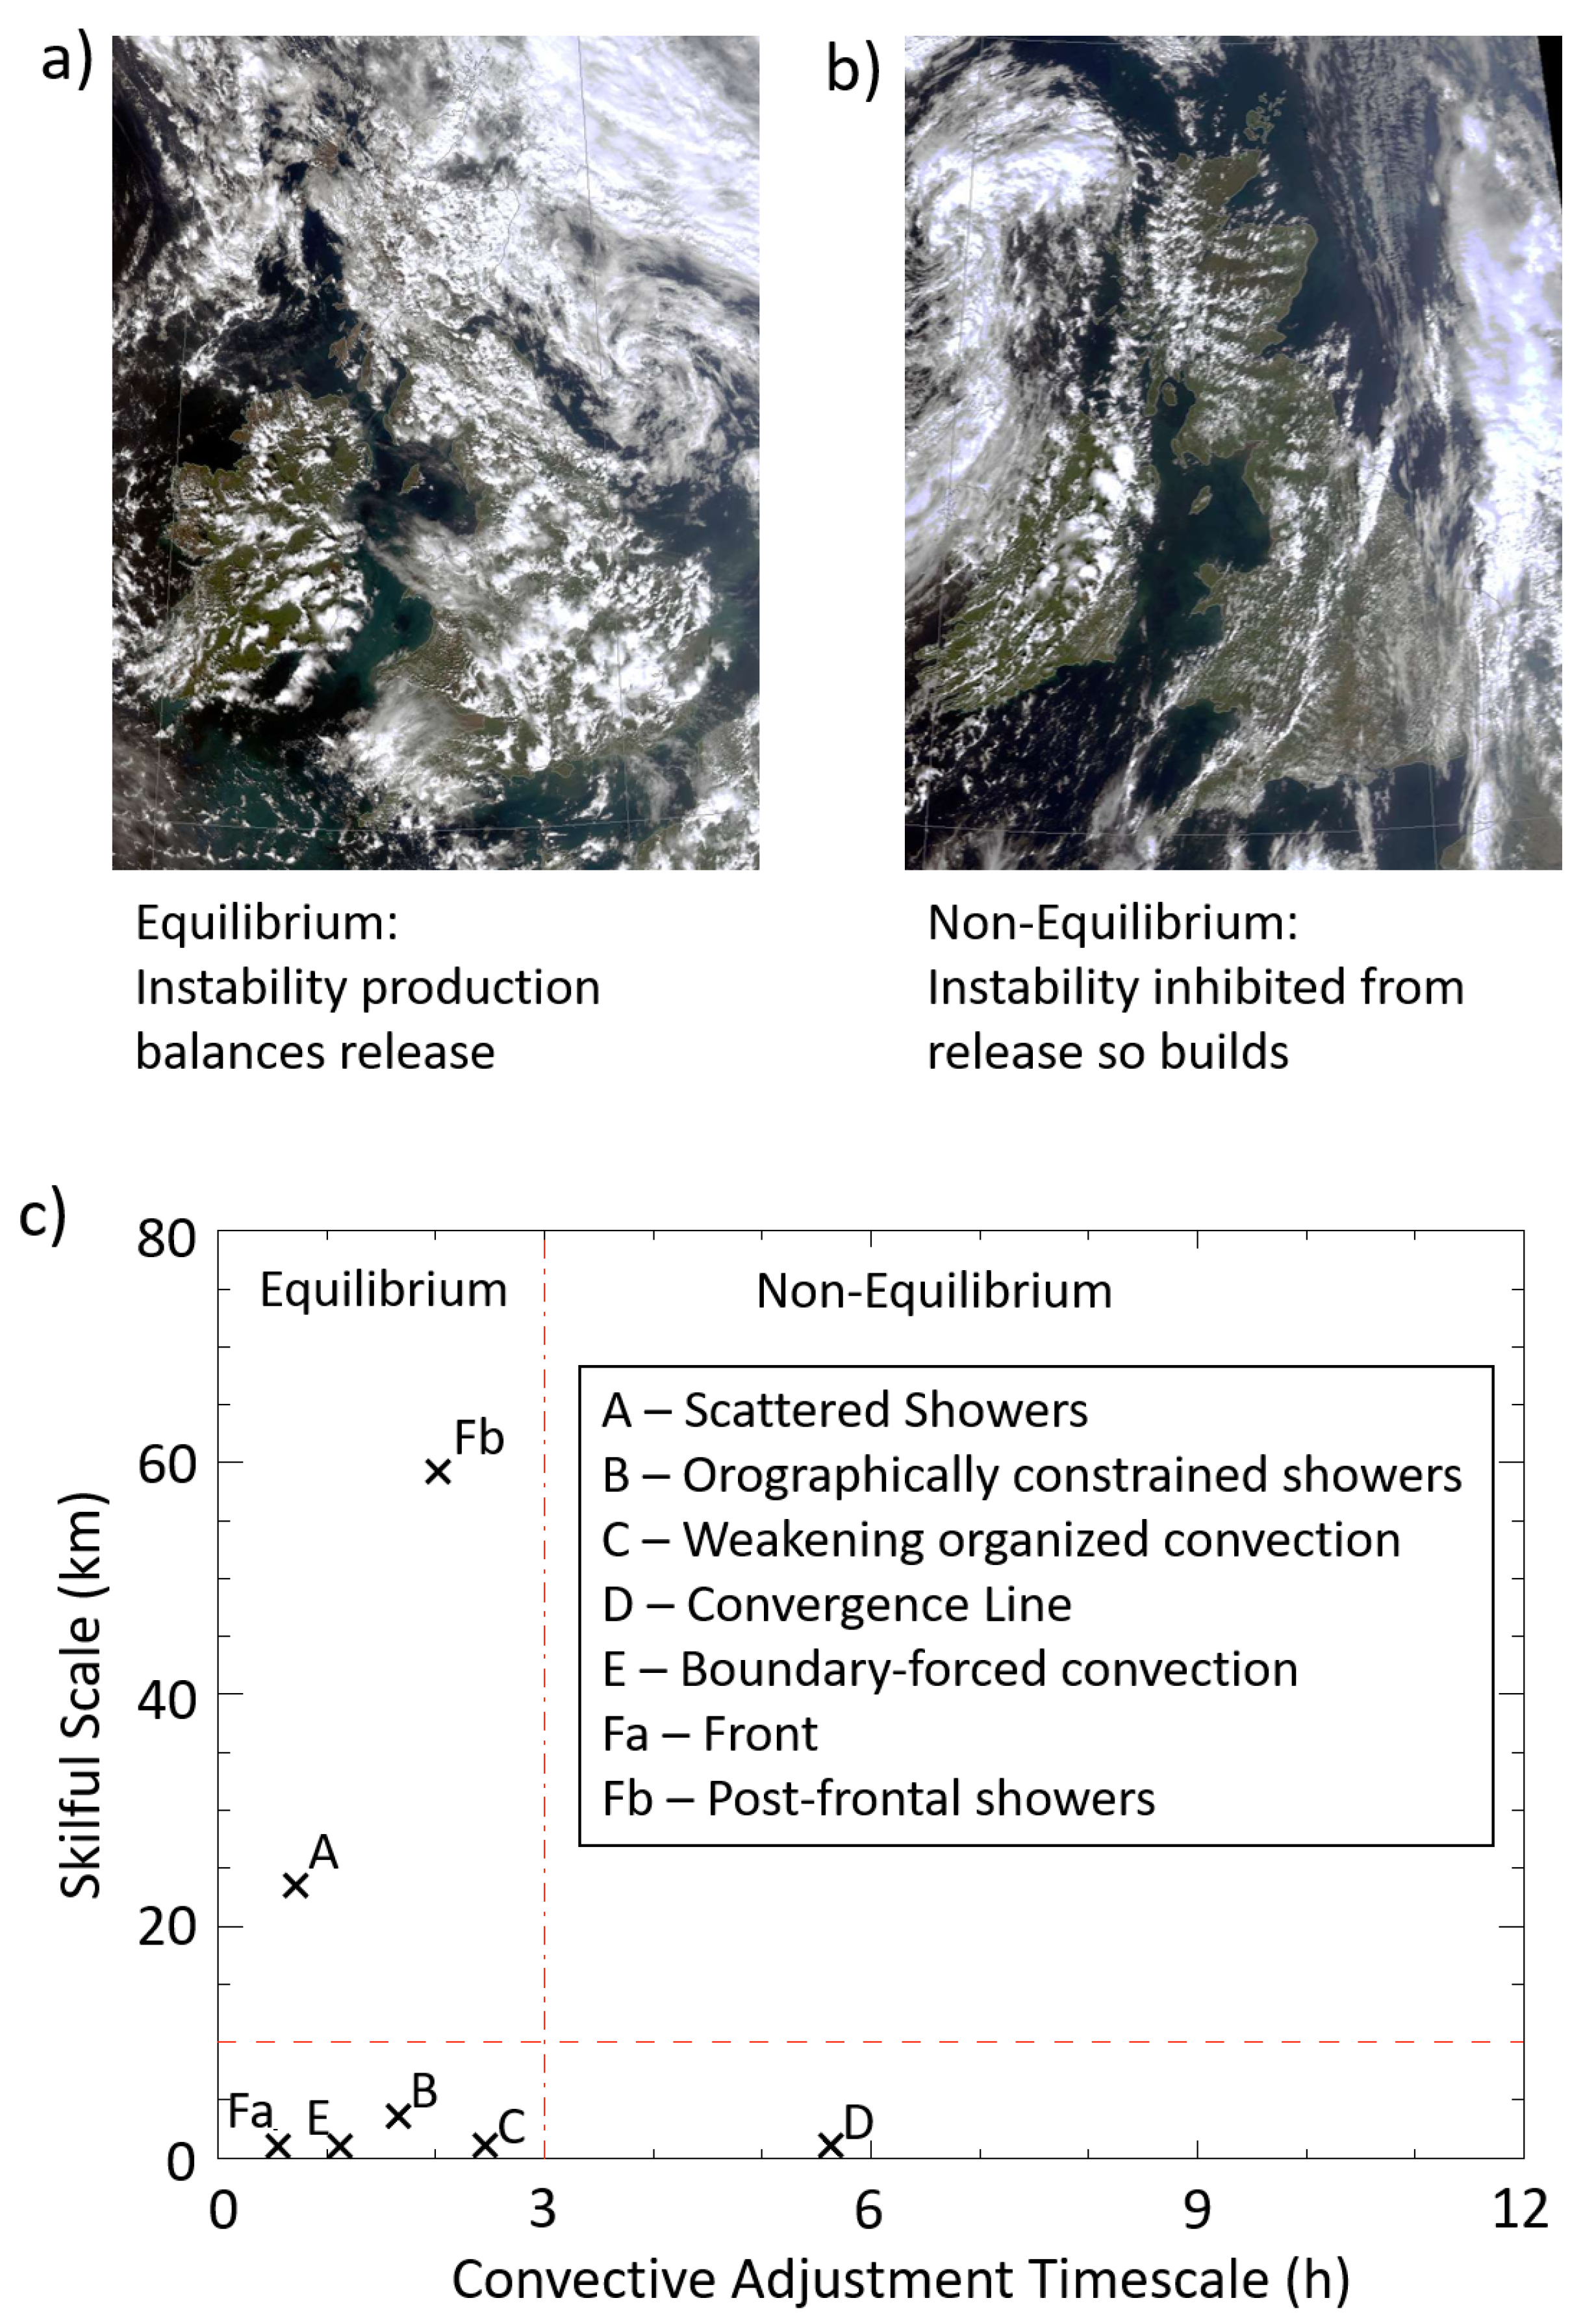
6. Convective Predictability

Previously in this article, we have discussed improvements to radar-retrieval algorithms and convective-scale data assimilation. However, it is important to recognize that the sensitivity of a rainfall forecast to the initial state of the model will depend upon the meterological situation. In particular, the impact from better assimilation of better-quality observations into an NWP system will depend upon the inherent predictability of the convection itself.
The predictability of a selection of convective cases has been examined in the FRANC project by constructing ensembles of perturbed convection-permitting forecasts [66]*. The ensemble members are formed by perturbing the UKV model by introducing small buoyancy fluctuations into the boundary layer. The six cases investigated span a spectrum of convective regimes including quasi-equilibrium and non-equilibrium environmental forcing.
Convective quasi-equilibrium occurs when instability production in the atmosphere on synoptic scales is approximately balanced by convection [67]. FRANC research showed that this type of convection accounts for ∼85% of UK summer convection cases [68]*. Non-equilibrium convection occurs when atmospheric instability is inhibited from release, and so instability continues to build until the inhibiting factor (such as an inversion or “lid”) can be overcome (see Emanuel [69], Chapter 11.2, for comparison between equilibrium and non-equilibrium and compare Figure 5a,b). To distinguish between these regimes [70] made use of a convective adjustment timescale. It is defined as the ratio of CAPE (Convective Available Potential Energy) to its rate of release by convection. A threshold timescale of around 3 h is often used to distinguish between the regimes.
The cases considered by the FRANC project in [66]* include an equilibrium case (A), two intermediate cases (B and C, closer to equilibrium and non-equilibrium, respectively), a non-equilibrium case (D) and two cases driven by the lateral boundary conditions of the model (E and F). Differences between the magnitudes of perturbation growth across ensemble members were found to be modest across the various cases. However, differences are pronounced in terms of the spatial scale at which ensemble pairs agree. Ensemble members are very dissimilar on the smallest scales in the model, but come into agreement if evaluated at successively larger scales. This behavior can be captured in terms of a skillful scale, as defined by [71,72]. Figure 5c compares the skillful scale with the convective adjustment timescale for each case. It shows greater spatial predictability (i.e., the forecast is more skillful on smaller scales) for cases C and D towards the non-equilibrium end of the spectrum (i.e., longer timescales) compared to cases A and B nearer to equilibrium. Case E, despite the short timescale, shows strong spatial agreement, which is likely a consequence of the prescribed boundary conditions. Case F is marked by a clear distinction between the high spatial predictability of frontal convection (Fa, early in the forecast) and the lower predictability of post-frontal showers (Fb).
Overall the results suggest that accurate small-scale information provided from the data assimilation of high-quality observations will have most impact on rainfall forecasts for those cases towards the non-equilibrium end of the spectrum, since such cases are better able to retain meaningful forecast skill on smaller scales. Cases towards the equilibrium end of the spectrum would still be expected to benefit, but in a more limited sense and perhaps over shorter lead times (as found by [73]). An important caveat is that our investigations focused on stochastic changes to model physics and so do not represent all forms of model uncertainty.

7. Operational Impact and Research Partnership

As we have seen in Section 3, Section 4 and Section 5, several of the new developments in the FRANC project are already operational and providing significant positive impacts on the UK weather forecast, or currently undergoing operational trials. In the preceding sections, we measured the benefits using standard objective skill scores for NWP, including spatial verification measures for rainfall. Since the overarching goal of our research programme is to improve flood forecasts, the next step is to investigate the impact of improved meteorological forecasts on hydrologic and hydraulic flood forecasts. However, we have found that there are some practical obstacles to running fully coupled end-to-end hydrometeorological forecasts for case studies, including a lack of backward compatibility of various software and observation systems. Furthermore, it is not yet clear which objective skill metrics and approaches for floods will be useful in evaluating NWP forecasts.
The relatively fast operational implementation of the academic research has been facilitated by the academic/operational partnership working on this project. The key aspects of this partnership have included co-planning and co-creation of research using shared facilities. In particular, the UK Natural Environment Research Council (NERC) funding the University contribution of the project required the academic and operational teams to work together in writing the grant proposal. Thus, University objectives became milestones in the integrated research plan of the Met Office, and vice versa. To ensure that this partnership-working plan became reality, the NERC FFIR programme executive board required us to (a) report on both University and Met Office aspects of the work during the project and (b) have a programme coordination leadership team that was provided with funds for programme integration and knowledge exchange activities. The Met Office made available significant staff time, and provided desktop computers to University staff to allow them to securely access their software, observations and supercomputing facilities on the same basis as Met Office staff. This gave the University researchers the opportunity to flexibly move back and forth as needed between the development of ideas using academic research techniques (such as experimental radar, idealized models and assimilation systems, mathematical theory etc.) and applying them in the complex operational systems. This has been particularly key for data assimilation research, where the need for both complex operational software and observational databases often excludes immediately applicable research. Early career scientists have particularly benefited from learning about the constraints of operations while carrying out publishable academic research.

8. Conclusions

The NERC Flooding from Intense Rainfall programme aims to reduce the risks of damage and loss of life caused by surface water and flash floods through improved identification, characterisation and prediction of interacting meteorological and hydrological processes that contribute to flooding associated with high-intensity rainfall events. The FRANC project (Forecasting Rainfall exploiting new data Assimilation techniques and Novel observations of Convection) has researched improvements in NWP of convective heavy rainfall events via the reduction of initial condition uncertainty. Observations, data assimilation and modelling have been carried out over the UK, but the methods and results are widely applicable. The FRANC work has brought operational impacts in improved radar reflectivity and refractivity observations and developed better data assimilation algorithms to maximize the value of these (and other observations) in data assimilation and convection-permitting weather forecasts. However, the sensitivity of a rainfall forecast to the initial data depends partly on the convective regime.
During our research, we found some practical obstacles to running fully coupled end-to-end hydrometeorological forecasts for case studies, including a lack of backward compatibility of various software and observation systems. Our recommendations arising from delivering the research in this multi-institution, inter-disciplinary programme include:
  • Research councils should fund more academic/operational partnerships with co-design of proposals and co-creation of research
  • There is a need for a better understanding and integrated use of objective skill measures that give useful information about weather forecasts and their impact on flood forecasts
  • There is a need for a stronger partnership between meteorology and hydrology including “translation” of technical terms and operational system constraints.
The relatively short timescale between academic investigation and operational employment of the new methods in NWP has been notable, and we anticipate that further research carried out in FRANC will contribute to operational systems in the future.

Author Contributions

All authors contributed to discussions of the research, writing and reviewing the manuscript. S.L.D. was the principal investigator for the FRANC project and a co-director of the NERC Flooding from Intense Rainfall programme. S.L.D. led the writing of this article, and co-led research on observation uncertainty in data assimilation. S.P.B. passed away after a long illness on 12 July 2018, during the manuscript drafting process. She led the Met Office component of the research in the FRANC project and was a co-director of the NERC Flooding from Intese Rainfall programme until her death. R.N.B. led the research on background error covariance modelling. P.C. co-supervised the research on linear models of convection. H.L.C. was a co-director of the NERC Flooding from Intense Rainfall programme. T.D. led the Met Office contribution to the work on radar reflectivity observations. D.L.A.F. carried out the investigation into convective predictability. S.L.G. co-supervised the research on convective predictability. L.H.-S. carried out the investigation into radar reflectivity assimilation. N.H. contributed to the study and operational implementation of the work on radar reflectivity observations. A.J.I. led University contributions to the work on radar reflectivity and refractivity observations. G.A.K. contributed to the observation error studies for AMVS and SEVIRI. Humphrey Lean co-supervised the research on convective predictability. D.L. carried out software developments for the Met Office hourly cycling 4D-Var system. N.K.N. co-led research on observation uncertainty in data assimilation. J.C.N. contributed to investigations of radar refractivity observations. A.O. investigated linear models of convection. R.S.P. co-supervised the research on convective predictability. N.M.R. co-supervised research on convective predictability. I.R. co-supervised research on linear models of convection. D.S. took over leading the Met Office component of work in the NERC Flooding from Intense Rainfall programme after SPB passed away. He contributed to investigations of radar refractivity observations and observation uncertainty in data assimilation. R.J.T. contributed to investigations of radar reflectivity observations. J.A.W. contributed to investigations of observation uncertainty in data assimilation.

Funding

The authors of this article were supported in part by the UK Natural Environment Research Council (NERC) Flooding from Intense Rainfall programme FRANC project, NE/K008900/1. David L. A. Flack acknowledges the use of the MONSooN system, a collaborative facility supplied under the Joint Weather and Climate Research Programme, which is a strategic partnership between the Met Office and NERC.

Acknowledgments

This paper is dedicated to the late Susan P. Ballard, as an internationally respected scientist, colleague, manager, mentor and friend.

Conflicts of Interest

The authors declare no conflict of interest. The study design was a response of the authors to the NERC Flooding from Intense Rainfall call for proposals. The funders had no role in the collection, analyses, or interpretation of data, in the writing of the manuscript, or in the decision to publish the results.

References

  1. Kendon, E.J.; Roberts, N.M.; Fowler, H.J.; Roberts, M.J.; Chan, S.C.; Senior, C.A. Heavier summer downpours with climate change revealed by weather forecast resolution model. Nat. Clim. Chang. 2014, 4, 570–576. [Google Scholar] [CrossRef]
  2. Alfieri, L.; Burek, P.; Dutra, E.; Krzeminski, B.; Muraro, D.; Thielen, J.; Pappenberger, F. GloFAS—Global ensemble streamflow forecasting and flood early warning. Hydrol. Earth Syst. Sci. 2013, 17, 1161–1175. [Google Scholar] [CrossRef]
  3. Price, D.; Hudson, K.; Boyce, G.; Schellekens, J.; Moore, R.; Clark, P.; Harrison, T.; Connolly, E.; Pilling, C. Operational use of a grid-based model for flood forecasting. Proc. Inst. Civ. Eng. Water Manag. 2012, 165, 65–77. [Google Scholar] [CrossRef]
  4. Pilling, C. New developments at the Flood Forecasting Centre: Operations and flood risk guidance. WIT Trans. Built Environ. 2016, 165, 237–248. [Google Scholar] [CrossRef]
  5. Lean, H.; Clark, P.; Dixon, M.; Roberts, N.; Fitch, A.; Forbes, R.; Halliwell, C. Characteristics of high-resolution versions of the Met Office Unified Model for forecasting convection over the United Kingdom. Mon. Weather Rev. 2008, 136, 3408–3424. [Google Scholar] [CrossRef]
  6. Tang, Y.; Lean, H.W.; Bornemann, J. The benefits of the Met Office variable resolution NWP model for forecasting convection. Meteorol. Appl. 2013, 20, 416–426. [Google Scholar] [CrossRef]
  7. Hohenegger, C.; Schar, C. Atmospheric predictability at synoptic versus cloud-resolving scales. Bull. Am. Meteorol. Soc. 2007, 88, 1783–1793. [Google Scholar] [CrossRef]
  8. Melhauser, C.; Zhang, F. Practical and intrinsic predictability of severe and convective weather at the mesoscales. J. Atmos. Sci. 2012, 69, 3350–3371. [Google Scholar] [CrossRef]
  9. Dance, S.L. Issues in high resolution limited area data assimilation for quantitative precipitation forecasting. Phys. D Nonlinear Phenom. 2004, 196, 1–27. [Google Scholar] [CrossRef]
  10. Sun, J.; Xue, M.; Wilson, J.W.; Zawadzki, I.; Ballard, S.P.; Onvlee-Hooimeyer, J.; Joe, P.; Barker, D.M.; Li, P.W.; Golding, B.; et al. Use of NWP for nowcasting convective precipitation: Recent progresses and challenges. Bull. Am. Meteorol. Soc. 2014, 95, 409–426. [Google Scholar] [CrossRef]
  11. Ballard, S.P.; Li, Z.; Simonin, D.; Caron, J.F. Performance of 4D-Var NWP-based nowcasting of precipitation at the Met Office for summer 2012. Q. J. R. Meteorol. Soc. 2016. [Google Scholar] [CrossRef]
  12. Clark, P.; Roberts, N.; Lean, H.; Ballard, S.P.; Charlton-Perez, C. Convection-permitting models: A step-change in rainfall forecasting. Meteorol. Appl. 2016, 23, 165–181. [Google Scholar] [CrossRef]
  13. Gustafsson, N.; Janjić, T.; Schraff, C.; Leuenberger, D.; Weissman, M.; Reich, H.; Brousseau, P.; Montmerle, T.; Wattrelot, E.; Bunek, A.; et al. Survey of data assimilation methods for convective-scale numerical weather prediction at operational centres. Q. J. R. Meteorol. Soc. 2017. [Google Scholar] [CrossRef]
  14. Harrison, D.; Norman, K.; Darlington, T.; Adams, D.; Husnoo, N.; Sandford, C.; Best, S. The evolution of the Met Office radar data quality control and product generation system: Radarnet. In Proceedings of the 37th AMS Conference on Radar Meteorology, Norman, OK, USA, 14--18 September 2015. [Google Scholar]
  15. Bowler, N.E.; Pierce, C.E.; Seed, A.W. STEPS: A probabilistic precipitation forecasting scheme which merges an extrapolation nowcast with downscaled NWP. Q. J. R. Meteorol. Soc. 2006, 132, 2127–2155. [Google Scholar] [CrossRef] [Green Version]
  16. Seed, A.W.; Pierce, C.E.; Norman, K. Formulation and evaluation of a scale decomposition-based stochastic precipitation nowcast scheme. Water Resour. Res. 2013, 49, 6624–6641. [Google Scholar] [CrossRef] [Green Version]
  17. Courtier, P.; Thepaut, J.; Hollingsworth, A. A strategy for operational implementation of 4D-Var, using an incremental approach. Q. J. R. Meteorol. Soc. 1994, 120, 1367–1387. [Google Scholar] [CrossRef]
  18. Rawlins, F.; Ballard, S.P.; Bovis, K.J.; Clayton, A.M.; Li, D.; Inverarity, G.W.; Lorenc, A.C.; Payne, T.J. The Met Office global four-dimensional variational data assimilation scheme. Q. J. R. Meteorol. Soc. 2007, 133, 347–362. [Google Scholar] [CrossRef] [Green Version]
  19. Piccolo, C.; Cullen, M. Adaptive mesh method in the Met Office variational data assimilation system. Q. J. R. Meteorol. Soc. 2011, 137, 631–640. [Google Scholar] [CrossRef] [Green Version]
  20. Piccolo, C.; Cullen, M. A new implementation of the adaptive mesh transform in the Met Office 3D-Var system. Q. J. R. Meteorol. Soc. 2012, 138, 1560–1570. [Google Scholar] [CrossRef]
  21. Renshaw, R.; Francis, P.N. Variational assimilation of cloud fraction in the operational Met Office Unified Model. Q. J. R. Meteorol. Soc. 2011, 137, 1963–1974. [Google Scholar] [CrossRef] [Green Version]
  22. Jones, C.; Macpherson, B. A latent heat nudging scheme for the assimilation of precipitation data into an operational mesoscale model. Meteorol. Appl. 1997, 4, 269–277. [Google Scholar] [CrossRef] [Green Version]
  23. Simonin, D.; Ballard, S.P.; Li, Z. Doppler radar radial wind assimilation using an hourly cycling 3D-Var with a 1.5 km resolution version of the Met Office Unified Model for nowcasting. Q. J. R. Meteorol. Soc. 2014, 140, 2298–2314. [Google Scholar] [CrossRef]
  24. Hagelin, S.; Son, J.; Swinbank, R.; McCabe, A.; Roberts, N.; Tennant, W. The Met Office convective-scale ensemble, MOGREPS-UK. Q. J. R. Meteorol. Soc. 2017, 143, 2846–2861. [Google Scholar] [CrossRef]
  25. McCabe, A.; Swinbank, R.; Tennant, W.; Lock, A. Representing model uncertainty in the Met Office convection-permitting ensemble prediction system and its impact on fog forecasting. Q. J. R. Meteorol. Soc. 2016, 142, 2897–2910. [Google Scholar] [CrossRef]
  26. Bell, V.; Kay, A.; Jones, R.; Moore, R.; Reynard, N. Use of soil data in a grid-based hydrological model to estimate spatial variation in changing flood risk across the UK. J. Hydrol. 2009, 377, 335–350. [Google Scholar] [CrossRef] [Green Version]
  27. Simonin, D.; Pierce, C.; Roberts, N.; Ballard, S.P.; Li, Z. Performance of Met Office hourly cycling NWP-based nowcasting for precipitation forecasts. Q. J. R. Meteorol. Soc. 2017, 143, 2862–2873. [Google Scholar] [CrossRef]
  28. Darlington, T.; Adams, D.; Best, S.; Husnoo, N.; Lyons, S.; Norman, K. Optimising the Accuracy of Radar Products With Dual Polarisation: ProjeCt Benefits; Technical Report; Met Office: Exeter, UK, 2016. [Google Scholar]
  29. Rico-Ramirez, M.; Cluckie, I.D. Classification of Ground Clutter and Anomalous Propagation Using Dual-Polarization Weather Radar. IEEE Trans. Geosci. Remote Sens. 2008, 46, 1892–1904. [Google Scholar] [CrossRef]
  30. Illingworth, A.; Thompson, R. Correction of Radar Reflectivity Due to Partial Beam Blocking. In Proceedings of the 38th Conference on Radar Meteorology, Chicago, IL, USA, 28 August–1 September 2017; p. 24A.1. [Google Scholar]
  31. Tabary, P. The new French operational radar rainfall product. Part I: Methodology. Weather Forecast. 2007, 22, 393–408. [Google Scholar] [CrossRef]
  32. Germann, U.; Galli, G.; Boscacci, M.; Bolliger, M. Radar precipitation measurement in a mountainous region. Q. J. R. Meteorol. Soc. 2006, 132, 1669–1692. [Google Scholar] [CrossRef] [Green Version]
  33. Fairman, J.G., Jr.; Schultz, D.M.; Kirshbaum, D.J.; Gray, S.L.; Barrett, A.I. A radar-based rainfall climatology of Great Britain and Ireland. Weather 2015, 70, 153–158. [Google Scholar] [CrossRef] [Green Version]
  34. Thompson, R.; Illingworth, A.; Ovens, J. Emission: A simple new technique to correct rainfall estimates from attenuation due to both the radome and heavy rainfall. In International Symposium on Weather Radar and Hydrology (WRaH 2011); Moore, R.J., Cole, S.J., Illingworth, A.J., Eds.; IAHS: London, UK, 2012; pp. 39–44. [Google Scholar]
  35. Hitschfeld, W.; Bordan, J. Errors inherent in the radar measurement of rainfall at attenuating wavelengths. J. Meteorol. 1954, 11, 58–67. [Google Scholar] [CrossRef]
  36. Bringi, V.; Chandrasekar, V.; Balakrishnan, N.; Zrnic, D.S. An examination of propagation effects in rainfall on radar measurements at microwave frequencies. J. Atmos. Ocean. Technol. 1990. [Google Scholar] [CrossRef]
  37. Carey, L.D.; Rutledge, S.A.; Ahijevych, D.A.; Keenan, T.D. Correcting propagation effects in C-band polarimetric radar observations of tropical convection using differential propagation phase. J. Appl. Meteorol. 2000, 39, 1405–1433. [Google Scholar] [CrossRef]
  38. Husnoo, N.; Darlington, T.; Thompson, R.; Illingworth, A. C-band Attenuation Correction in Heavy Rainfall Using Radiometric Emissions. In Proceedings of the 37th Conference on Radar Meteorology, Norman, OK, USA, 14–18 September 2015; p. 7B.4. [Google Scholar]
  39. Husnoo, N.; Darlington, T.; Thompson, R.; Illingworth, A. 6.18 Evaluation of Reflactivity/Polarimetry/ Radiometry Based C-Band Attenuation Correction Scheme Using Neighbouring Radars. In Proceedings of the 10th European Conference on Radar in Meteorology and Hydrology (ERAD 2018), Wageningen, The Netherlands, 1–6 July 2018; p. 252. [Google Scholar]
  40. Weckwerth, T.M.; Wilson, J.W.; Wakimoto, R.M. Thermodynamic variability within the convective boundary layer due to horizontal convective rolls. Mon. Weather Rev. 1996, 124, 769–784. [Google Scholar] [CrossRef]
  41. Fabry, F.; Frush, C.; Zawadzki, I.; Kilambi, A. On the extraction of near-surface index of refraction using radar phase measurements from ground targets. J. Atmos. Ocean. Technol. 1997, 14, 978–987. [Google Scholar] [CrossRef]
  42. Nicol, J.; Bartholemew, K.; Darlington, T.; Illingworth, A. Operational radar refractivity retrieval for numerical weather prediction. In Proceedings of the 8th International Symposium Weather Radar and Hydrology, Exeter, UK, 18–21 April 2011. [Google Scholar]
  43. Nicol, J.; Illingworth, A.; Darlington, T.; Kitchen, M. Quantifying errors due to frequency changes and target location uncertainty for radar refractivity retrievals. J. Atmos. Ocean. Technol. 2013, 30, 2006–2024. [Google Scholar] [CrossRef]
  44. Nicol, J.; Illingworth, A. The effect of phase-correlated returns and spatial smoothing on the accuracy of radar refractivity retrievals. J. Atmos. Ocean. Technol. 2013, 30, 22–39. [Google Scholar] [CrossRef]
  45. Caumont, O.; Ducrocq, V.; Wattrelot, E.; Jaubert, G.; Pradier-Vabre, S. 1D+3DVar assimilation of radar reflectivity data: A Proof of concept. Tellus A 2010, 62, 173–187. [Google Scholar] [CrossRef]
  46. Wattrelot, E.; Caumont, O.; Mahfouf, J.F. Operational Implementation of the 1D+3D-Var Assimilation Method of Radar Reflectivity Data in the AROME Model. Mon. Weather Rev. 2014, 142, 1852–1873. [Google Scholar] [CrossRef] [Green Version]
  47. Kawabata, T.; Kuroda, T.; Seko, H.; Saito, K. A Cloud-Resolving 4DVAR Assimilation Experiment for a Local Heavy Rainfall Event in the Tokyo Metropolitan Area. Mon. Weather Rev. 2011, 139, 1911–1931. [Google Scholar] [CrossRef]
  48. Wang, H.; Sun, J.; Zhang, X.; Huang, X.Y.; Auligné, T. Radar Data Assimilation with WRF 4D-Var. Part I: System Development and Preliminary Testing. Mon. Weather Rev. 2013, 141, 2224–2244. [Google Scholar] [CrossRef]
  49. Sun, J. Convective-scale assimilation of radar data: Progress and challenges. Q. J. R. Meteorol. Soc. 2005, 131, 3439–3463. [Google Scholar] [CrossRef] [Green Version]
  50. Hawkness-Smith, L.; Ballard, S. Assimilation of radar reflectivity data in the Met Office convective-scale forecast system. In Proceedings of the 36th AMS Conference on Radar Meteorology, Breckenridge, CO, USA, 16–20 September 2013. [Google Scholar]
  51. Janjić, T.; Bormann, N.; Bocquet, M.; Carton, J.A.; Cohn, S.E.; Dance, S.L.; Losa, S.N.; Nichols, N.K.; Potthast, R.; Waller, J.A.; Weston, P. On the representation error in data assimilation. Q. J. R. Meteorol. Soc. 2017. [Google Scholar] [CrossRef]
  52. Waller, J.A.; Dance, S.L.; Lawless, A.S.; Nichols, N.K.; Eyre, J.R. Representativity error for temperature and humidity using the Met Office high-resolution model. Q. J. R. Meteorol. Soc. 2014, 140, 1189–1197. [Google Scholar] [CrossRef]
  53. Desroziers, G.; Berre, L.; Chapnik, B.; Poli, P. Diagnosis of observation, background and analysis-error statistics in observation space. Q. J. R. Meteorol. Soc. 2005, 131, 3385–3396. [Google Scholar] [CrossRef] [Green Version]
  54. Waller, J.A.; Simonin, D.; Dance, S.L.; Nichols, N.K.; Ballard, S.P. Diagnosing observation error correlations for Doppler radar radial winds in the Met Office UKV model using observation-minus-background and observation-minus-analysis statistics. Mon. Weather Rev. 2016, 144, 3533–3551. [Google Scholar] [CrossRef]
  55. Waller, J.A.; Ballard, S.P.; Dance, S.L.; Kelly, G.; Nichols, N.K.; Simonin, D. Diagnosing Horizontal and Inter-Channel Observation Error Correlations for SEVIRI Observations Using Observation-Minus-Background and Observation-Minus-Analysis Statistics. Remote Sens. 2016, 8, 581. [Google Scholar] [CrossRef]
  56. Cordoba, M.; Dance, S.; Kelly, G.; Nichols, N.; Waller, J. Diagnosing Atmospheric Motion Vector observation errors for an operational high resolution data assimilation system. Q. J. R. Meteorol. Soc. 2017, 143, 333–341. [Google Scholar] [CrossRef]
  57. Waller, J.A.; Dance, S.L.; Nichols, N.K. Theoretical insight into diagnosing observation error correlations using observation-minus-background and observation-minus-analysis statistics. Q. J. R. Meteorol. Soc. 2016, 142, 418–431. [Google Scholar] [CrossRef]
  58. Waller, J.A.; Dance, S.L.; Nichols, N.K. On diagnosing observation error statistics in localized ensemble data assimilation. Q. J. R. Meteorol. Soc. 2017. [Google Scholar] [CrossRef]
  59. Waller, J.; Bauernschubert, E.; Dance, S.L.; Nichols, N.K.; Potthast, R. Observation error statistics for Doppler Radar radial winds assimilated into 2 the DWD COSMO-KENDA system. 2018; submitted. [Google Scholar]
  60. Simonin, D.; Waller, J.A.; Ballard, S.P.; Dance, S.L.; Nichols, N.K. A pragmatic strategy for implementing spatially correlated observation errors in an operational system: Demonstration for Doppler radial winds. 2018; submitted. [Google Scholar]
  61. Schwartz, C.S.; Liu, Z. Convection-permitting forecasts initialized with continuously cycling limited-area 3DVAR, ensemble Kalman filter, and “hybrid” variational–ensemble data assimilation systems. Mon. Weather Rev. 2014, 142, 716–738. [Google Scholar] [CrossRef]
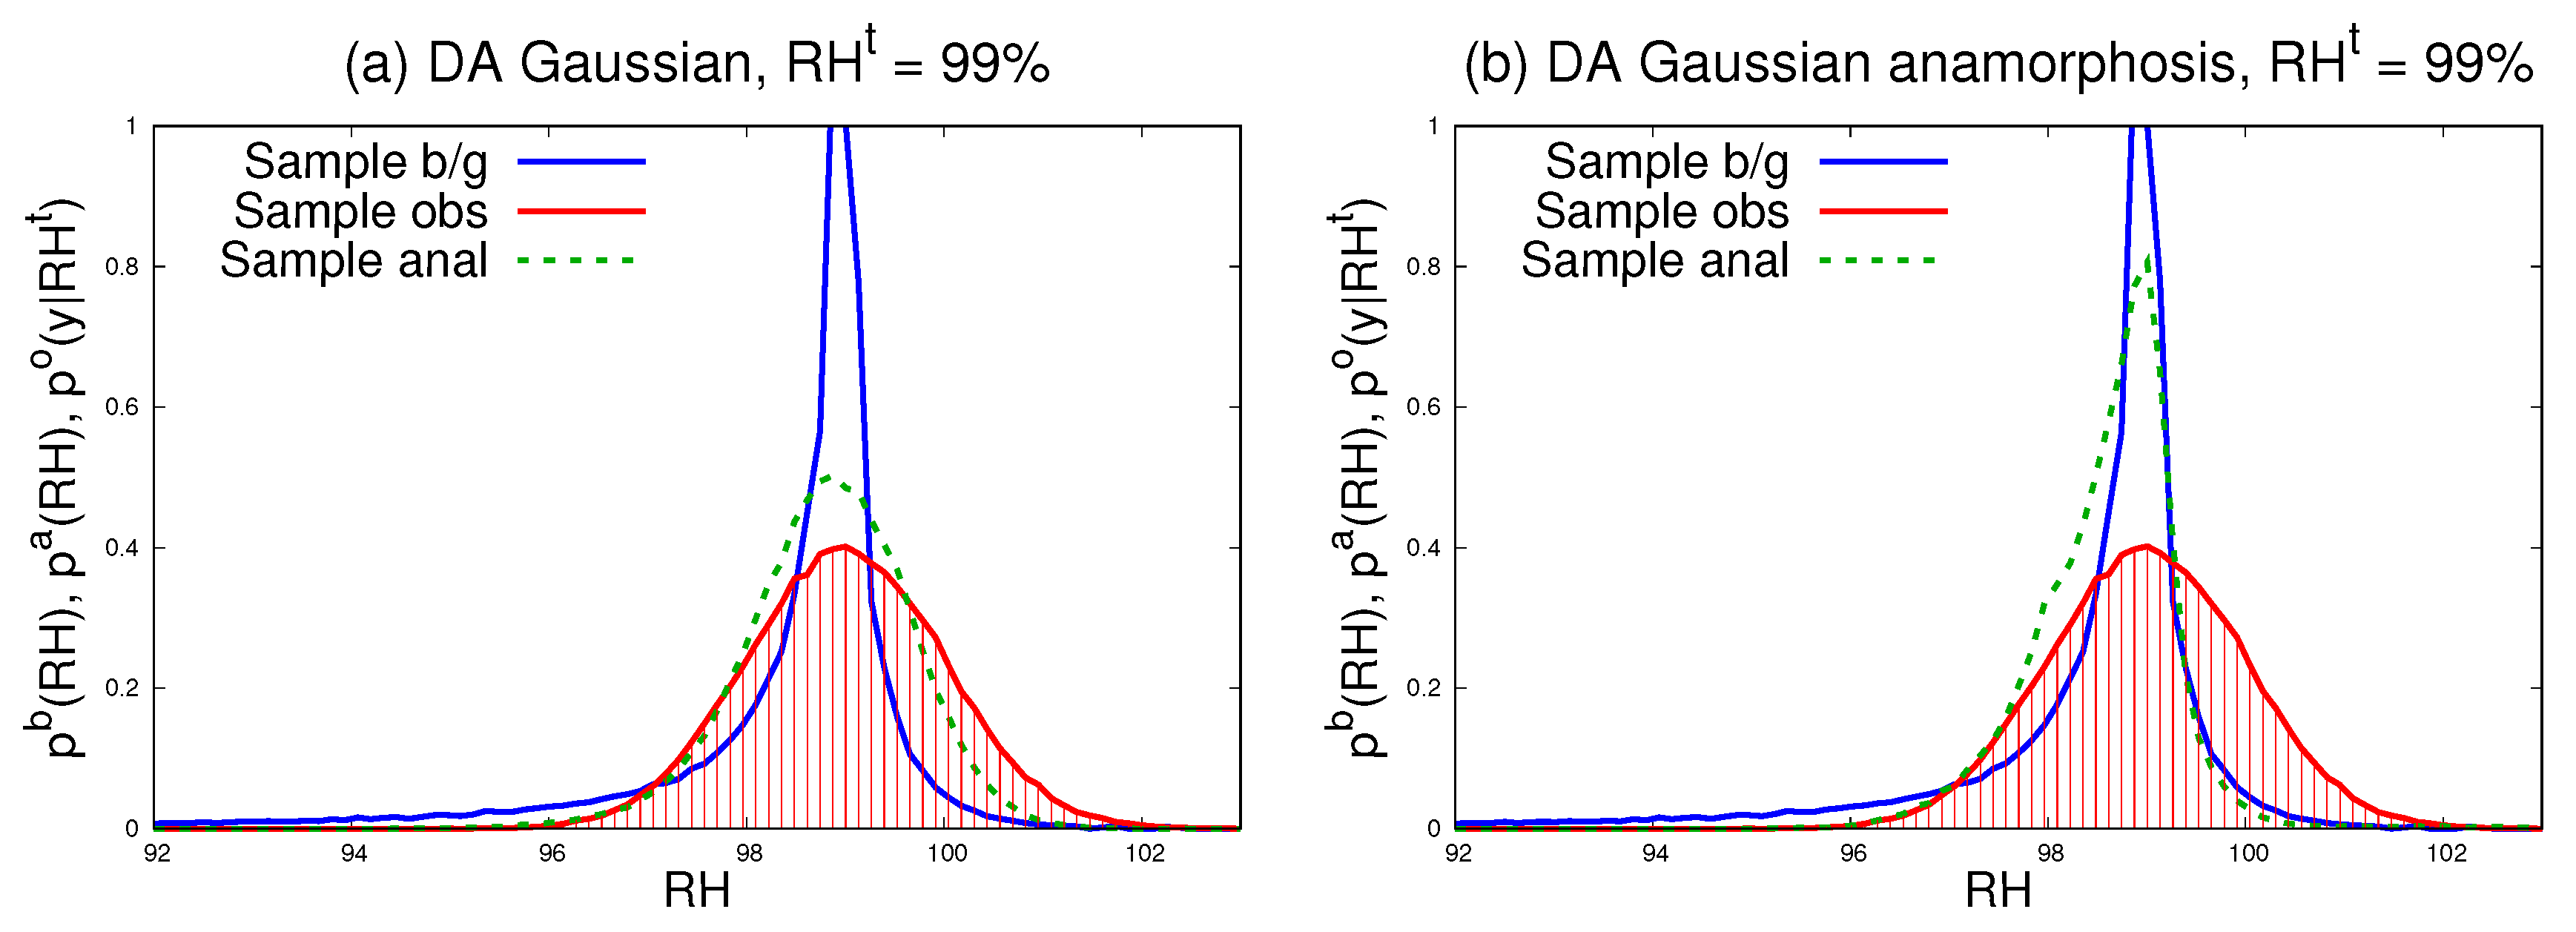
  62. Ingleby, N.; Lorenc, A.; Ngan, K.; Rawlins, F.; Jackson, D. Improved variational analyses using a nonlinear humidity control variable. Q. J. R. Meteorol. Soc. 2013, 139, 1875–1887. [Google Scholar] [CrossRef]
  63. Bocquet, M.; Pires, C.A.; Wu, L. Beyond Gaussian statistical modeling in geophysical data assimilation. Mon. Weather Rev. 2010, 138, 2997–3023. [Google Scholar] [CrossRef]
  64. Errico, R.M.; Bauer, P.; Mahfouf, J.F. Issues regarding the assimilation of cloud and precipitation data. J. Atmos. Sci. 2007, 64, 3785–3798. [Google Scholar] [CrossRef]
  65. Oxley, A. Linear Models of Non-Precipitating Convection. Ph.D. Thesis, University of Surrey, Guildford, UK, 2018. [Google Scholar]
  66. Flack, D.L.A.; Plant, R.S.; Gray, S.L.; Lean, H.W.; Craig, G.C. Convective-Scale Perturbation Growth Across the Spectrum of Convective Regimes. Mon. Weather Rev. 2018, 146, 387–405. [Google Scholar] [CrossRef]
  67. Arakawa, A.; Schubert, W.H. Interaction of a Cumulus Cloud Ensemble with the Large-Scale Environment, Part I. J. Atmos. Sci. 1974, 31, 674–701. [Google Scholar] [CrossRef] [Green Version]
  68. Flack, D.L.A.; Plant, R.S.; Gray, S.L.; Lean, H.W.; Keil, C.; Craig, G.C. Characterisation of Convective Regimes over the British Isles. Q. J. R. Meteorol. Soc. 2016, 142, 1541–1553. [Google Scholar] [CrossRef]
  69. Emanuel, K.A. Atmospheric Convection; Oxford University Press: Oxford, UK, 1994; p. 580. [Google Scholar]
  70. Done, J.; Craig, G.; Gray, S.; Clark, P.; Gray, M. Mesoscale Simulations of Organized Convection: Importance of Convective Equilibrium. Q. J. R. Meteorol. Soc. 2006, 132, 737–756. [Google Scholar] [CrossRef]
  71. Roberts, N.M.; Lean, H.W. Scale-Selective Verification of Rainfall Accumulations from High-Resolution Forecasts of Convective Events. Mon. Weather Rev. 2008, 136, 78–97. [Google Scholar] [CrossRef]
  72. Dey, S.R.A.; Leoncini, G.; Roberts, N.M.; Plant, R.S.; Migliorini, S. A Spatial View of Ensemble Spread in Convection Permitting Ensembles. Mon. Weather Rev. 2014, 142, 4091–4107. [Google Scholar] [CrossRef]
  73. Craig, G.C.; Keil, C.; Leuenberger, D. Constraints on the Impact of Radar Rainfall Data Assimilation on Forecasts of Cumulus Convection. Q. J. R. Meteorol. Soc. 2012, 138, 340–352. [Google Scholar] [CrossRef]
Figure 1. Schematic for the UK flood forecasting chain. Weather radar and raingauge data have been highlighted in green as specific subsets of atmospheric observations, as they are analysed for use in numerical weather prediction (arrow from blue atmospheric observations box) as well as used directly in nowcasting products (arrows from green ellipses).
Atmosphere 10 00125 g001
Figure 2. Co-located surface observations (grey) and radar observations of hourly change in refractivity, Δ N , as a function of time. The radar observations plotted are the spatially closest valid radar estimate of Δ N to the location of the surface observation for each hourly time window. The top panel (a) illustrates radar fields (red) with basic quality control whereas the bottom panel (b) illustrates radar fields with an additional quality index (signal coherence based) selection of targets.
Atmosphere 10 00125 g002aAtmosphere 10 00125 g002b
Figure 3. Case study of direct radar reflectivity assimilation in the UKV for model runs at 1200 UTC, 8 June 2014. The surface rainrate is plotted at 1400 UTC (T+2) for the radar surface rainrate product (a), the control forecast including latent heat nudging (b) and experimental forecast with direct reflectivity assimilation (d). The horizontal u wind increment on model level 6 is valid at 1130 UTC (c). The features in these figures are discussed in Section 4.
Atmosphere 10 00125 g003
Figure 4. Histograms of Monte-Carlo repeats of data assimilation experiments to analyse relative humidity (RH). Panel (a) does not account for background non-Gaussianity, but panel (b) does. Experiments are for a single point in an atmospheric domain when underlying conditions are moist (true relative humidity, RH t = 99 %). In all experiments the background forecasts are sampled from the non-Gaussian distributions (blue histograms) and the observations are sampled from the Gaussian distributions (red). All histograms comprise bins shown only for the observations to indicate the bin size. The histograms of analyses are shown as dashed green. In (a) the non-Gaussianity of the background distribution is ignored in the data assimilation where instead a Gaussian with the same variance as the actual distribution is used. In (b) non-Gaussianity is accounted for with Gaussian anamorphosis, where each background sample is considered to lie at the mode of the background’s error distribution. Note that the analysis histogram is not expected to have the same shape as that found from the product of the background and observation histograms, but we do find that the standard deviation of each analysis histogram is less than those of the background and observations.
Atmosphere 10 00125 g004
Figure 5. Example satellite images used for the convective regimes of (a) equilibrium and (b) non-equilibrium convection (Courtesy Dundee Satellite Receiving Station, University of Dundee, Scotland) and (c) the skillful scale vs. the domain-averaged convective adjustment timescale for cases A–F defined in [66]*. The skillful scale and timescale are defined at 1500 UTC on the case day with the exception of Fb for which it is defined as the average value after the front leaves the domain. 1500 UTC is used as convection is well established for all of the cases at this time. The dashed line represents the scale on which the perturbations are applied and the dot-dashed line represents the 3 h threshold used to consider the likely placement of the cases in terms of the convective regimes.
Atmosphere 10 00125 g005

