An Evaluation of Relationships between Radar-Inferred Kinematic and Microphysical Parameters and Lightning Flash Rates in Alabama Storms

 ,
,  ,
,
Abstract
1. Introduction
1.1. Background
1.2. Motivation and Objectives
2. Datasets and Methods
2.1. Lightning
2.2. Radar
2.2.1. Processing, Quality Control and Gridding
2.2.2. Dual-Doppler Analysis
2.2.3. Polarimetric Particle Identification
2.2.4. Storm Identification and Tracking
2.3. Linear Regression and Error Assessment
3. Results
3.1. Example of Lightning, Kinematic and Microphysical Properties in a Severe QLCS
3.2. Linear Relationships and Overall Performance
3.2.1. Overall Dataset with Zero Y-intercept
3.2.2. Overall Dataset with Non-zero Y-intercept
3.3. Error as a Function of Flash Rate
4. Discussion
- Conceptual model errors
- Observational errors
- Statistical errors
5. Conclusions
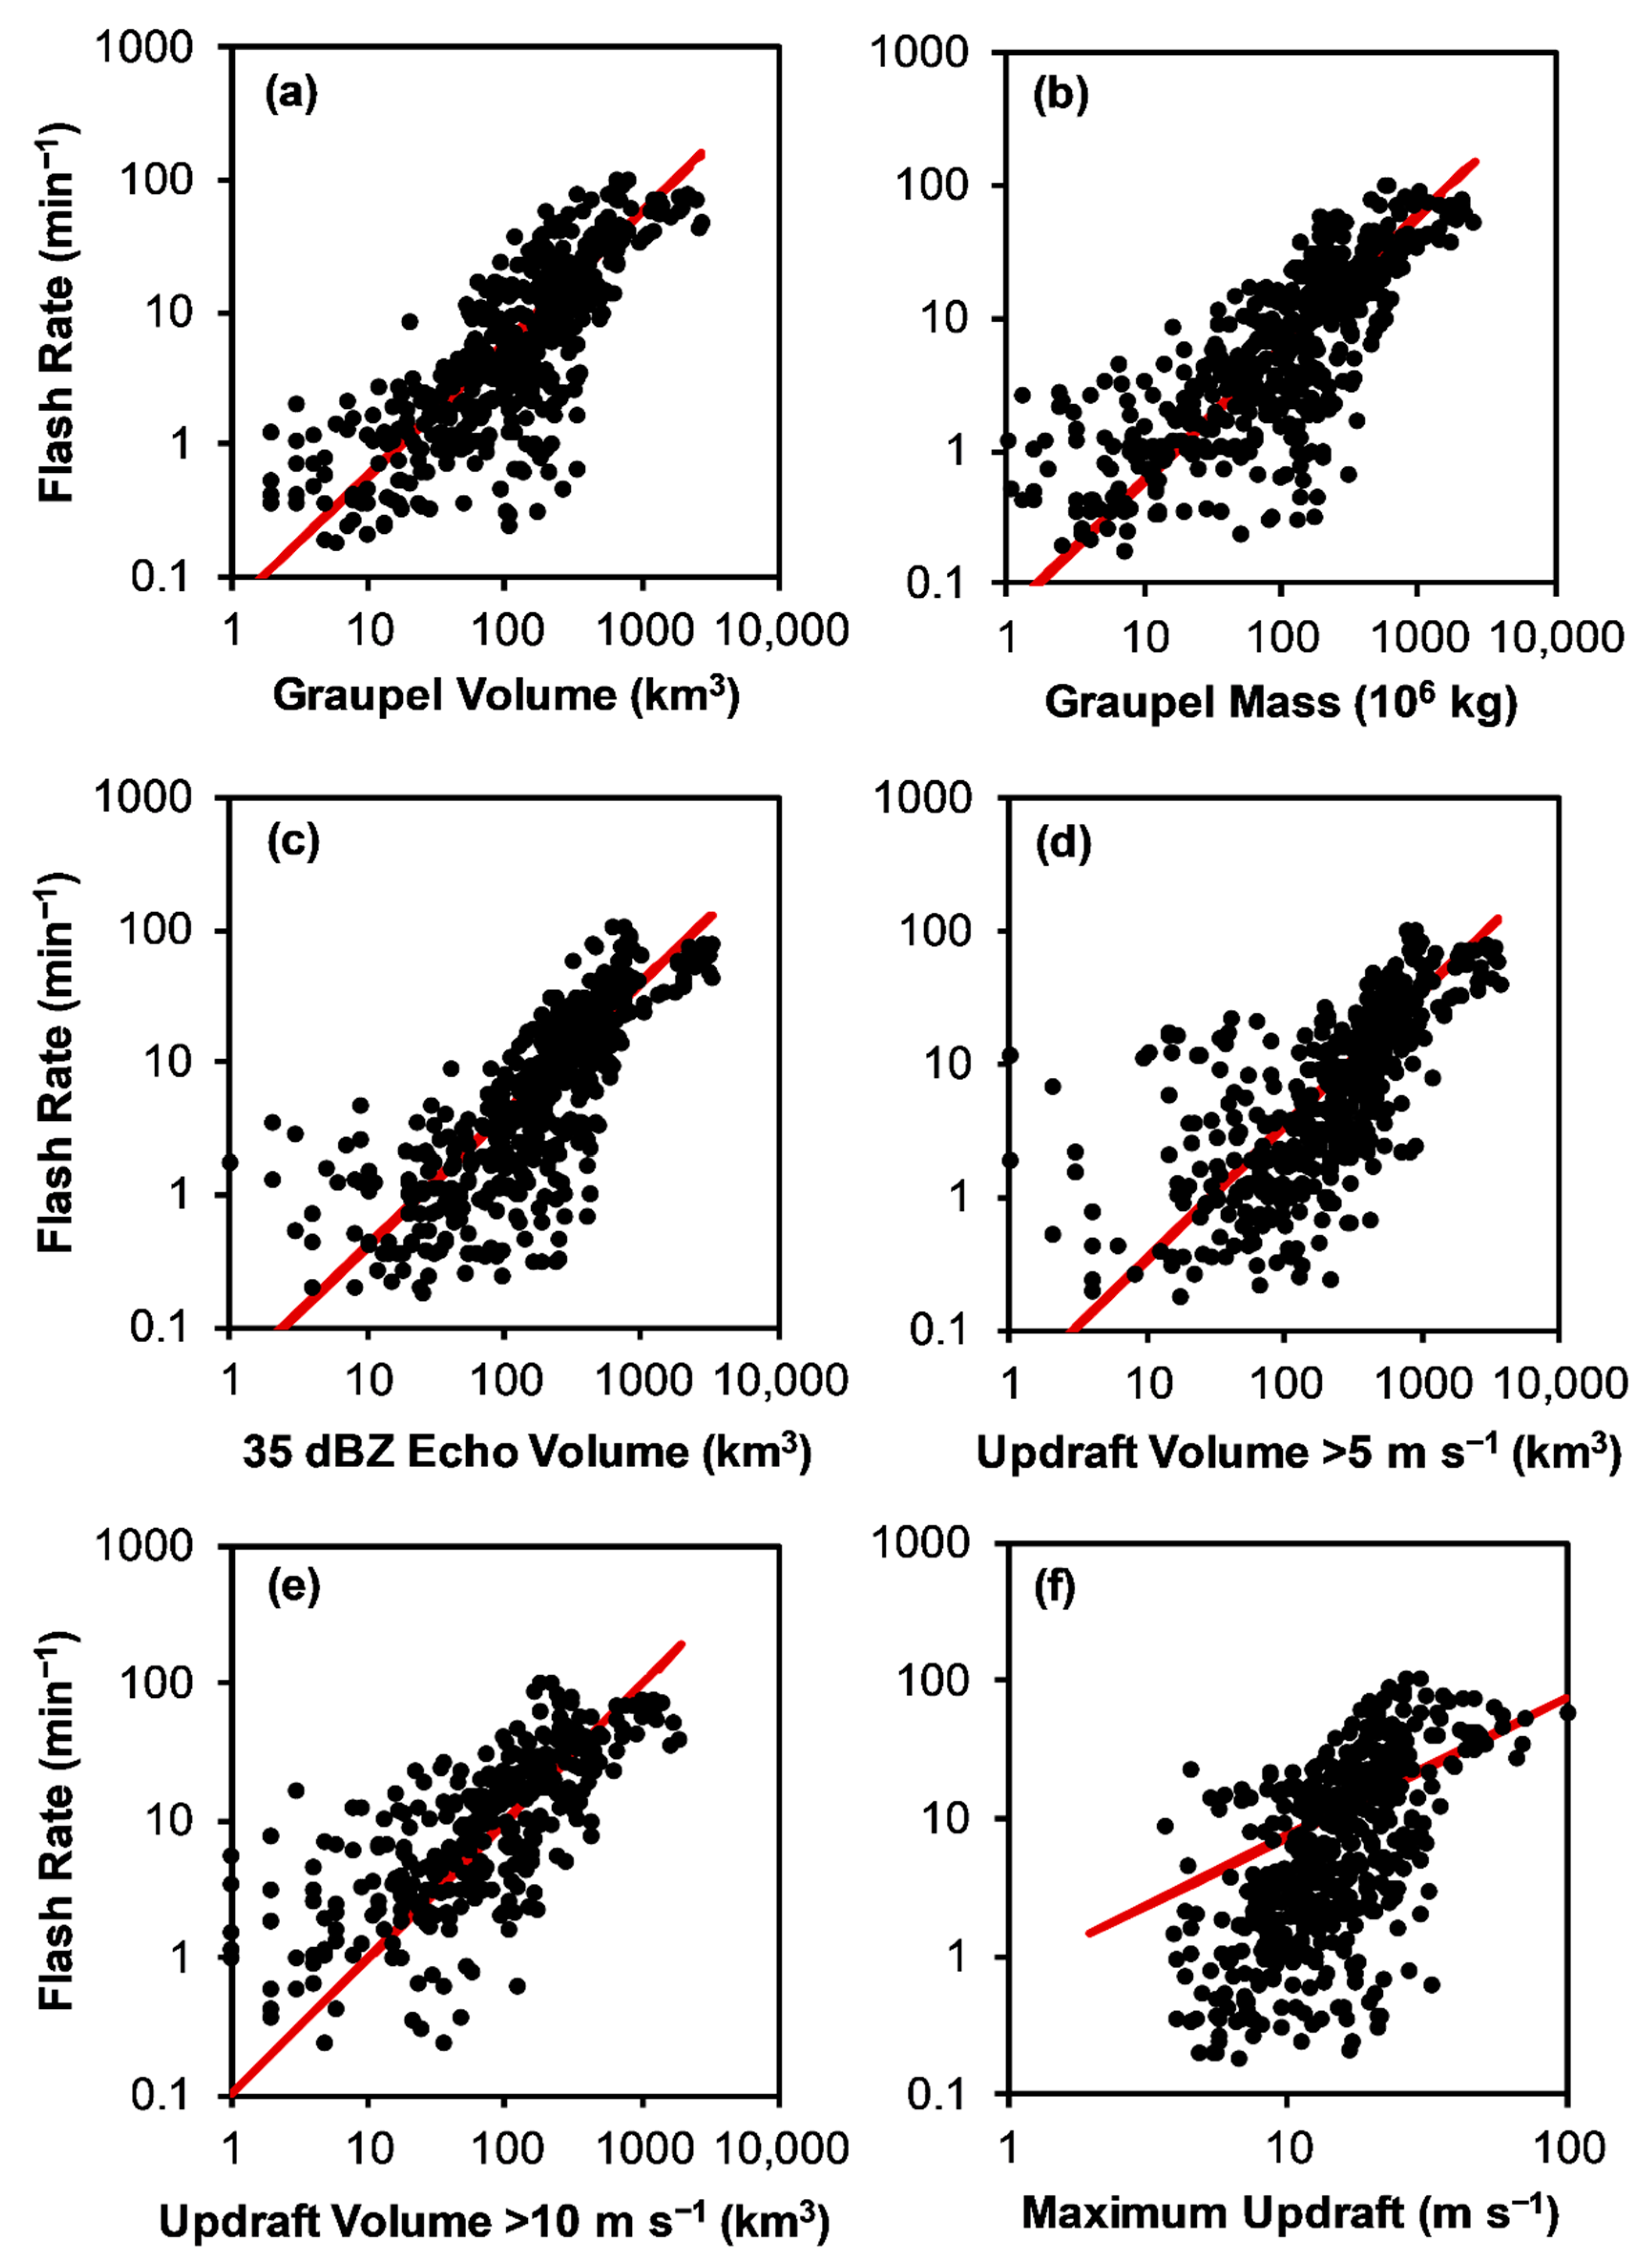
- When considering the entire data set, kinematic (i.e., updraft volume > 5 m s−1, updraft volume > 10 m s−1, and maximum updraft velocity) and microphysical (i.e., graupel echo volume, graupel mass, and 35 dBZ echo volume) parameters are generally correlated to lightning flash rate (ρ = 0.60 to 0.76). However, these overall Pearson correlation coefficients are lower than found in individual high-flash-rate storms or in the smaller storm samples of past studies. Because the sample in this study is three- to five-times larger than past studies and contains a larger fraction of low-flash-rate storms for which various errors (e.g., conceptual, observational, statistical, as discussed in Section 4) may be larger, these lower correlations between flash rate and storm kinematic and microphysical parameters likely represent a more realistic assessment of typical storm and observational conditions, especially at low flash rate.
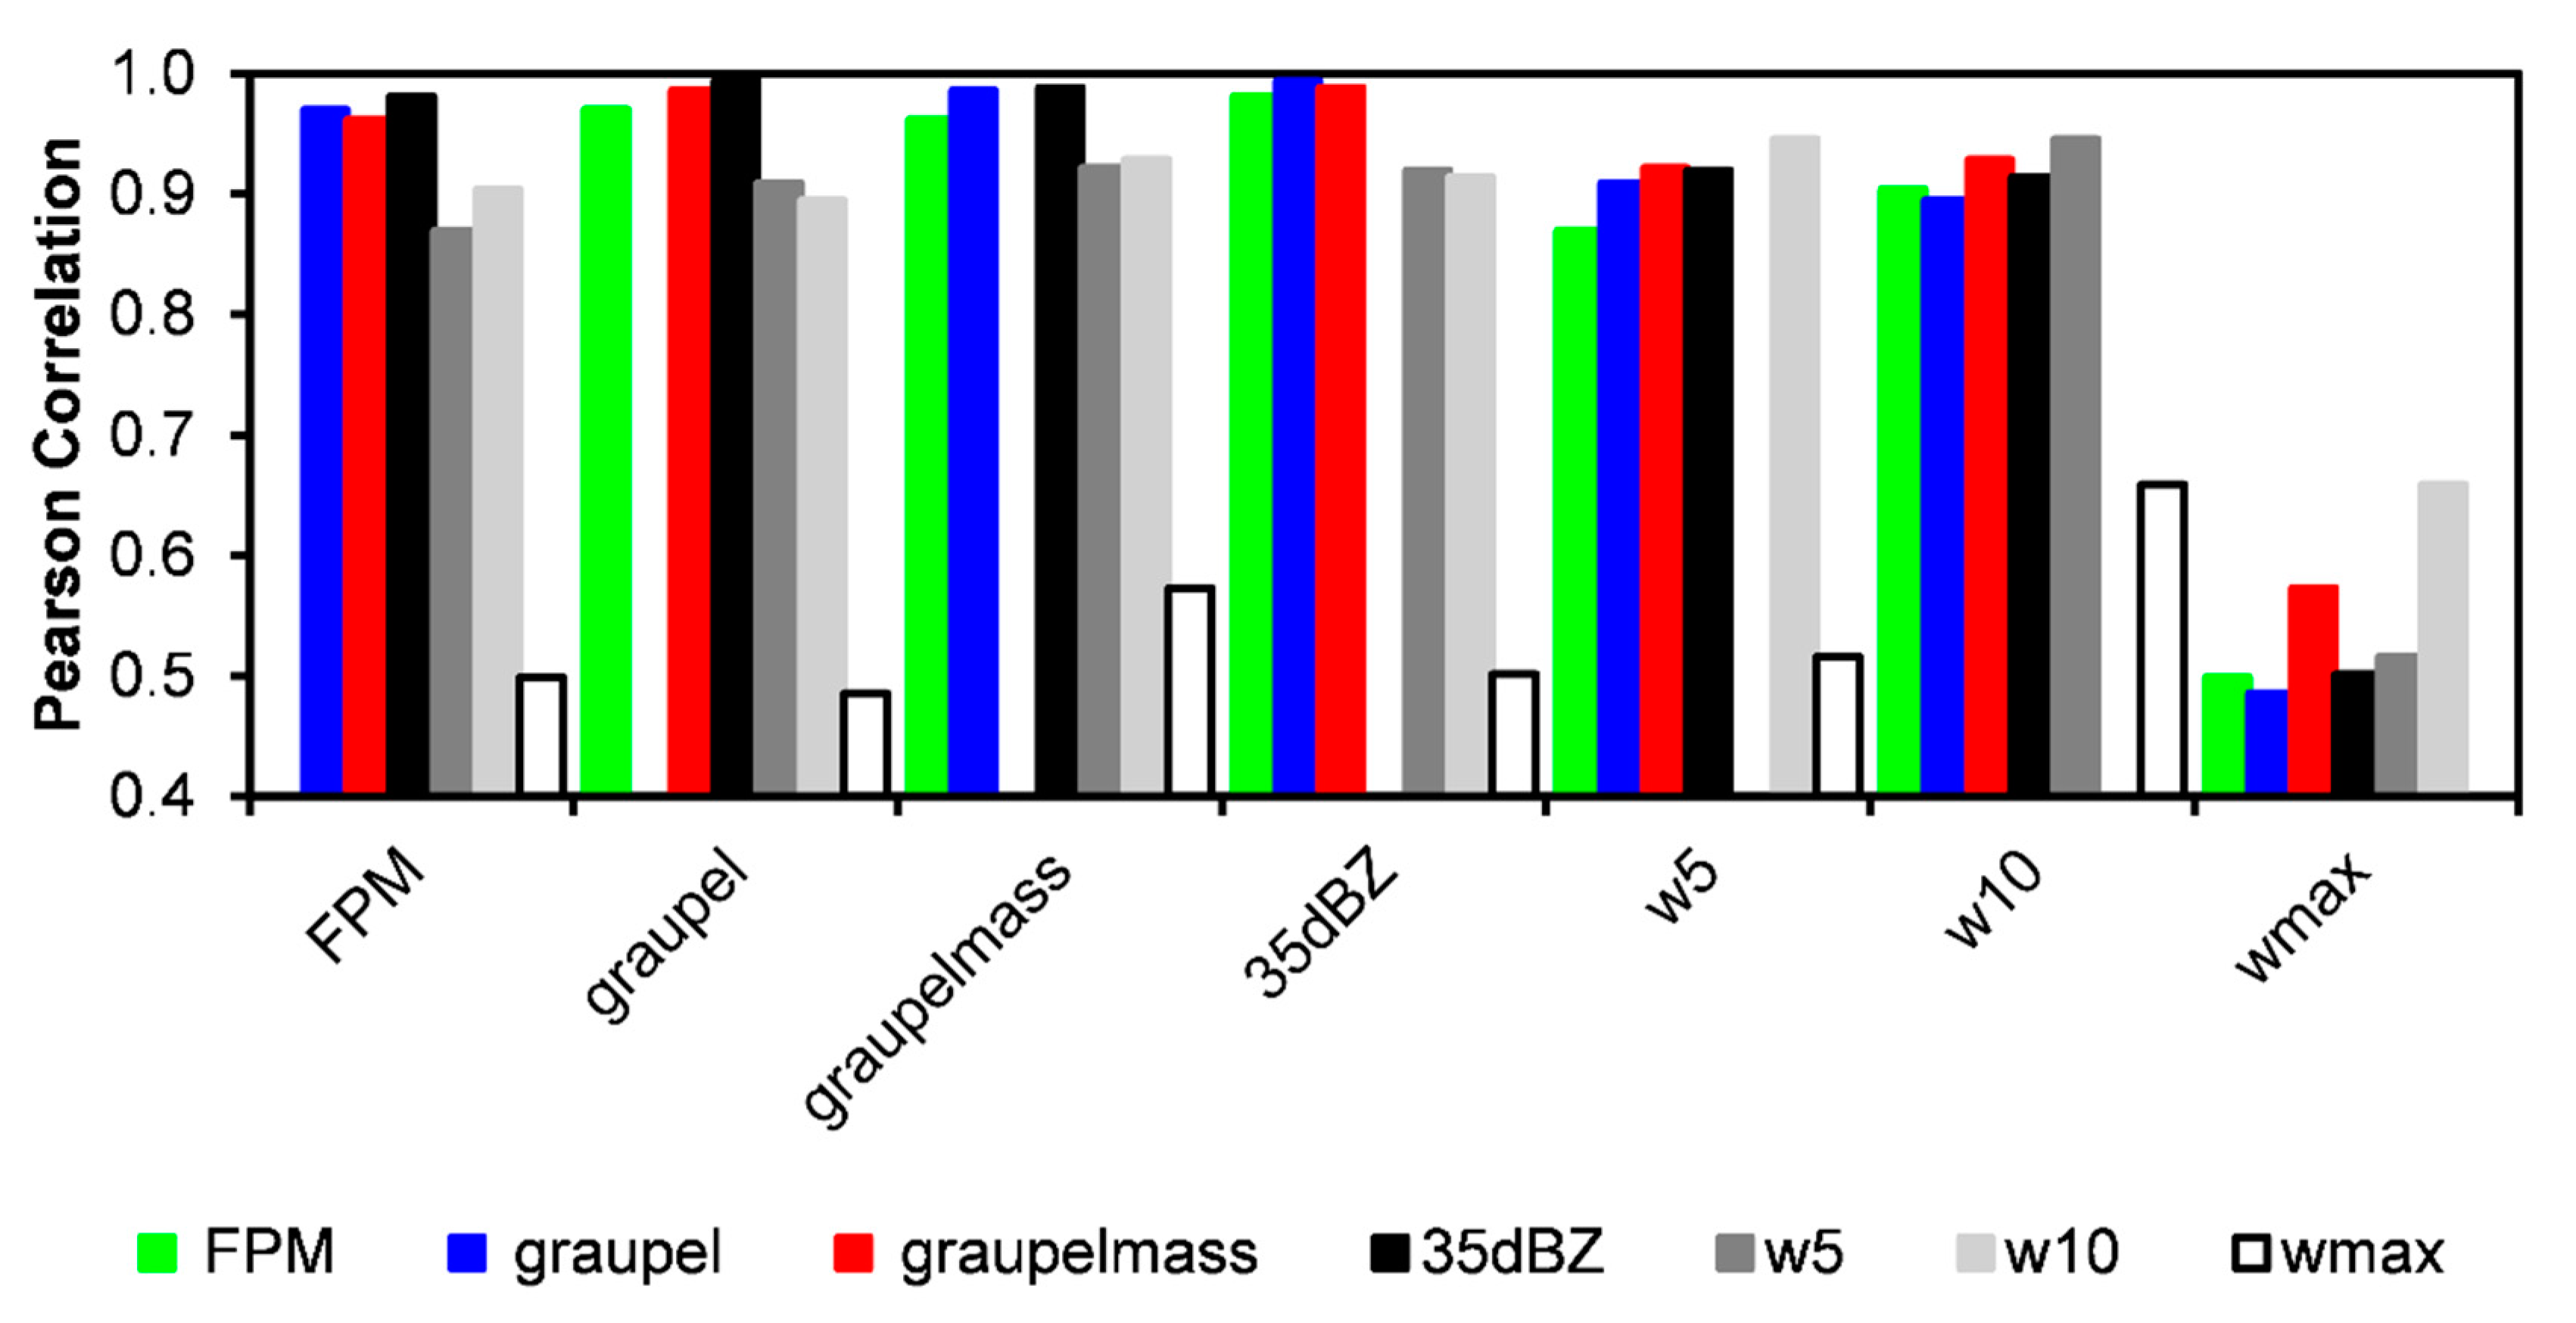
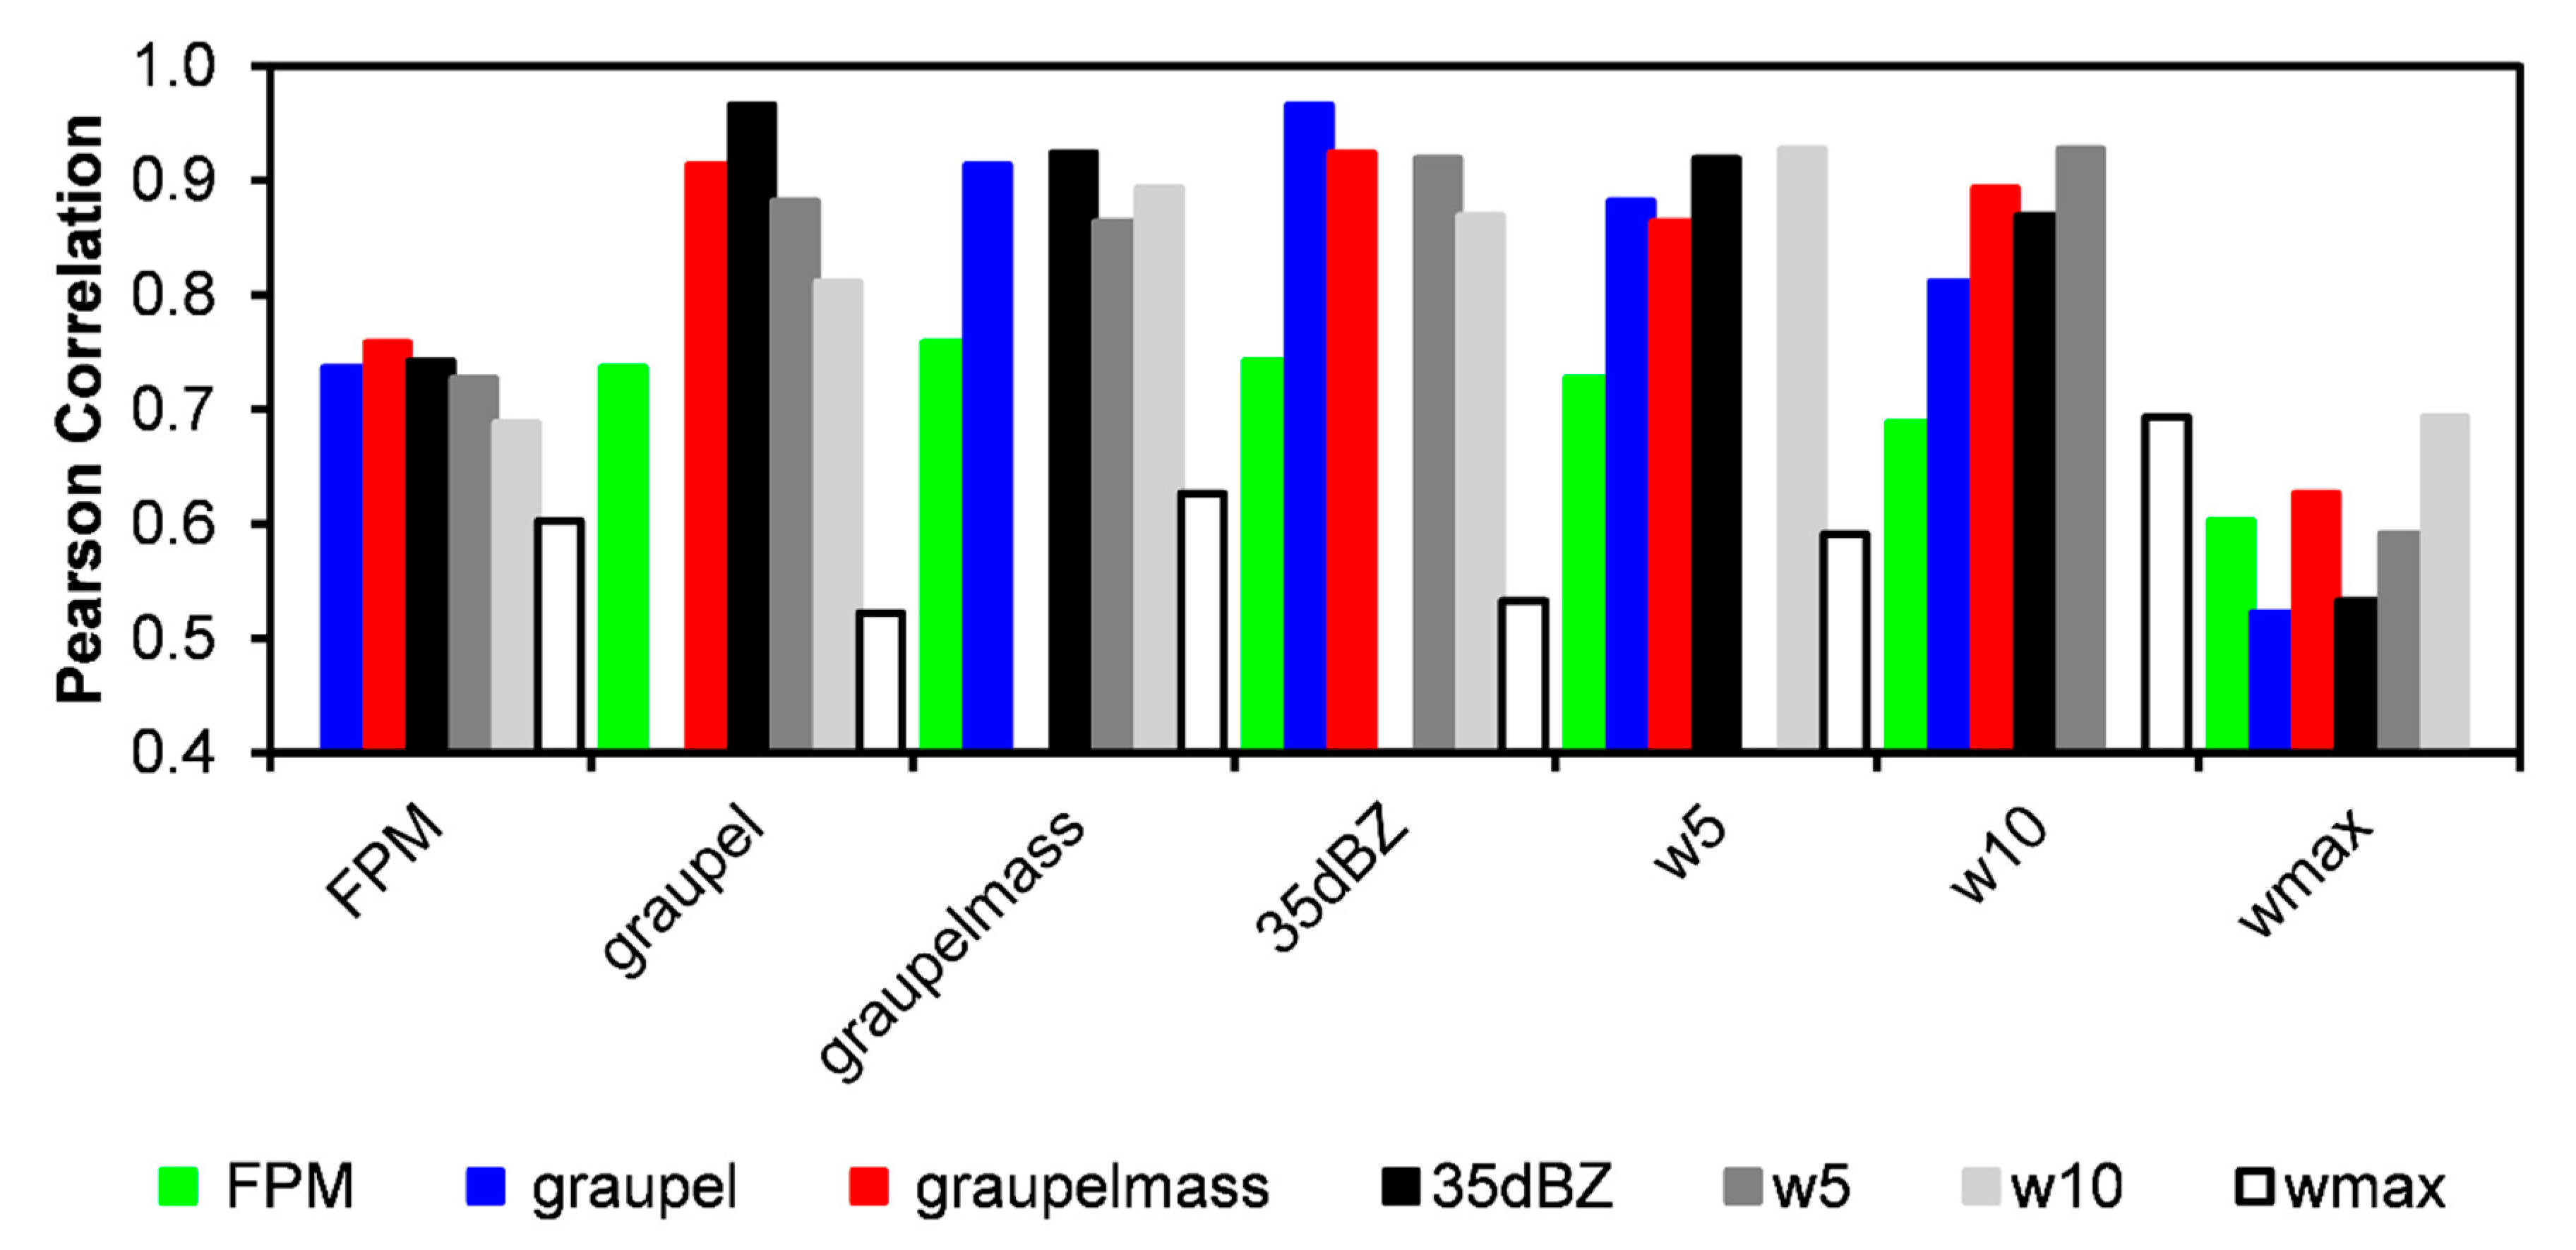
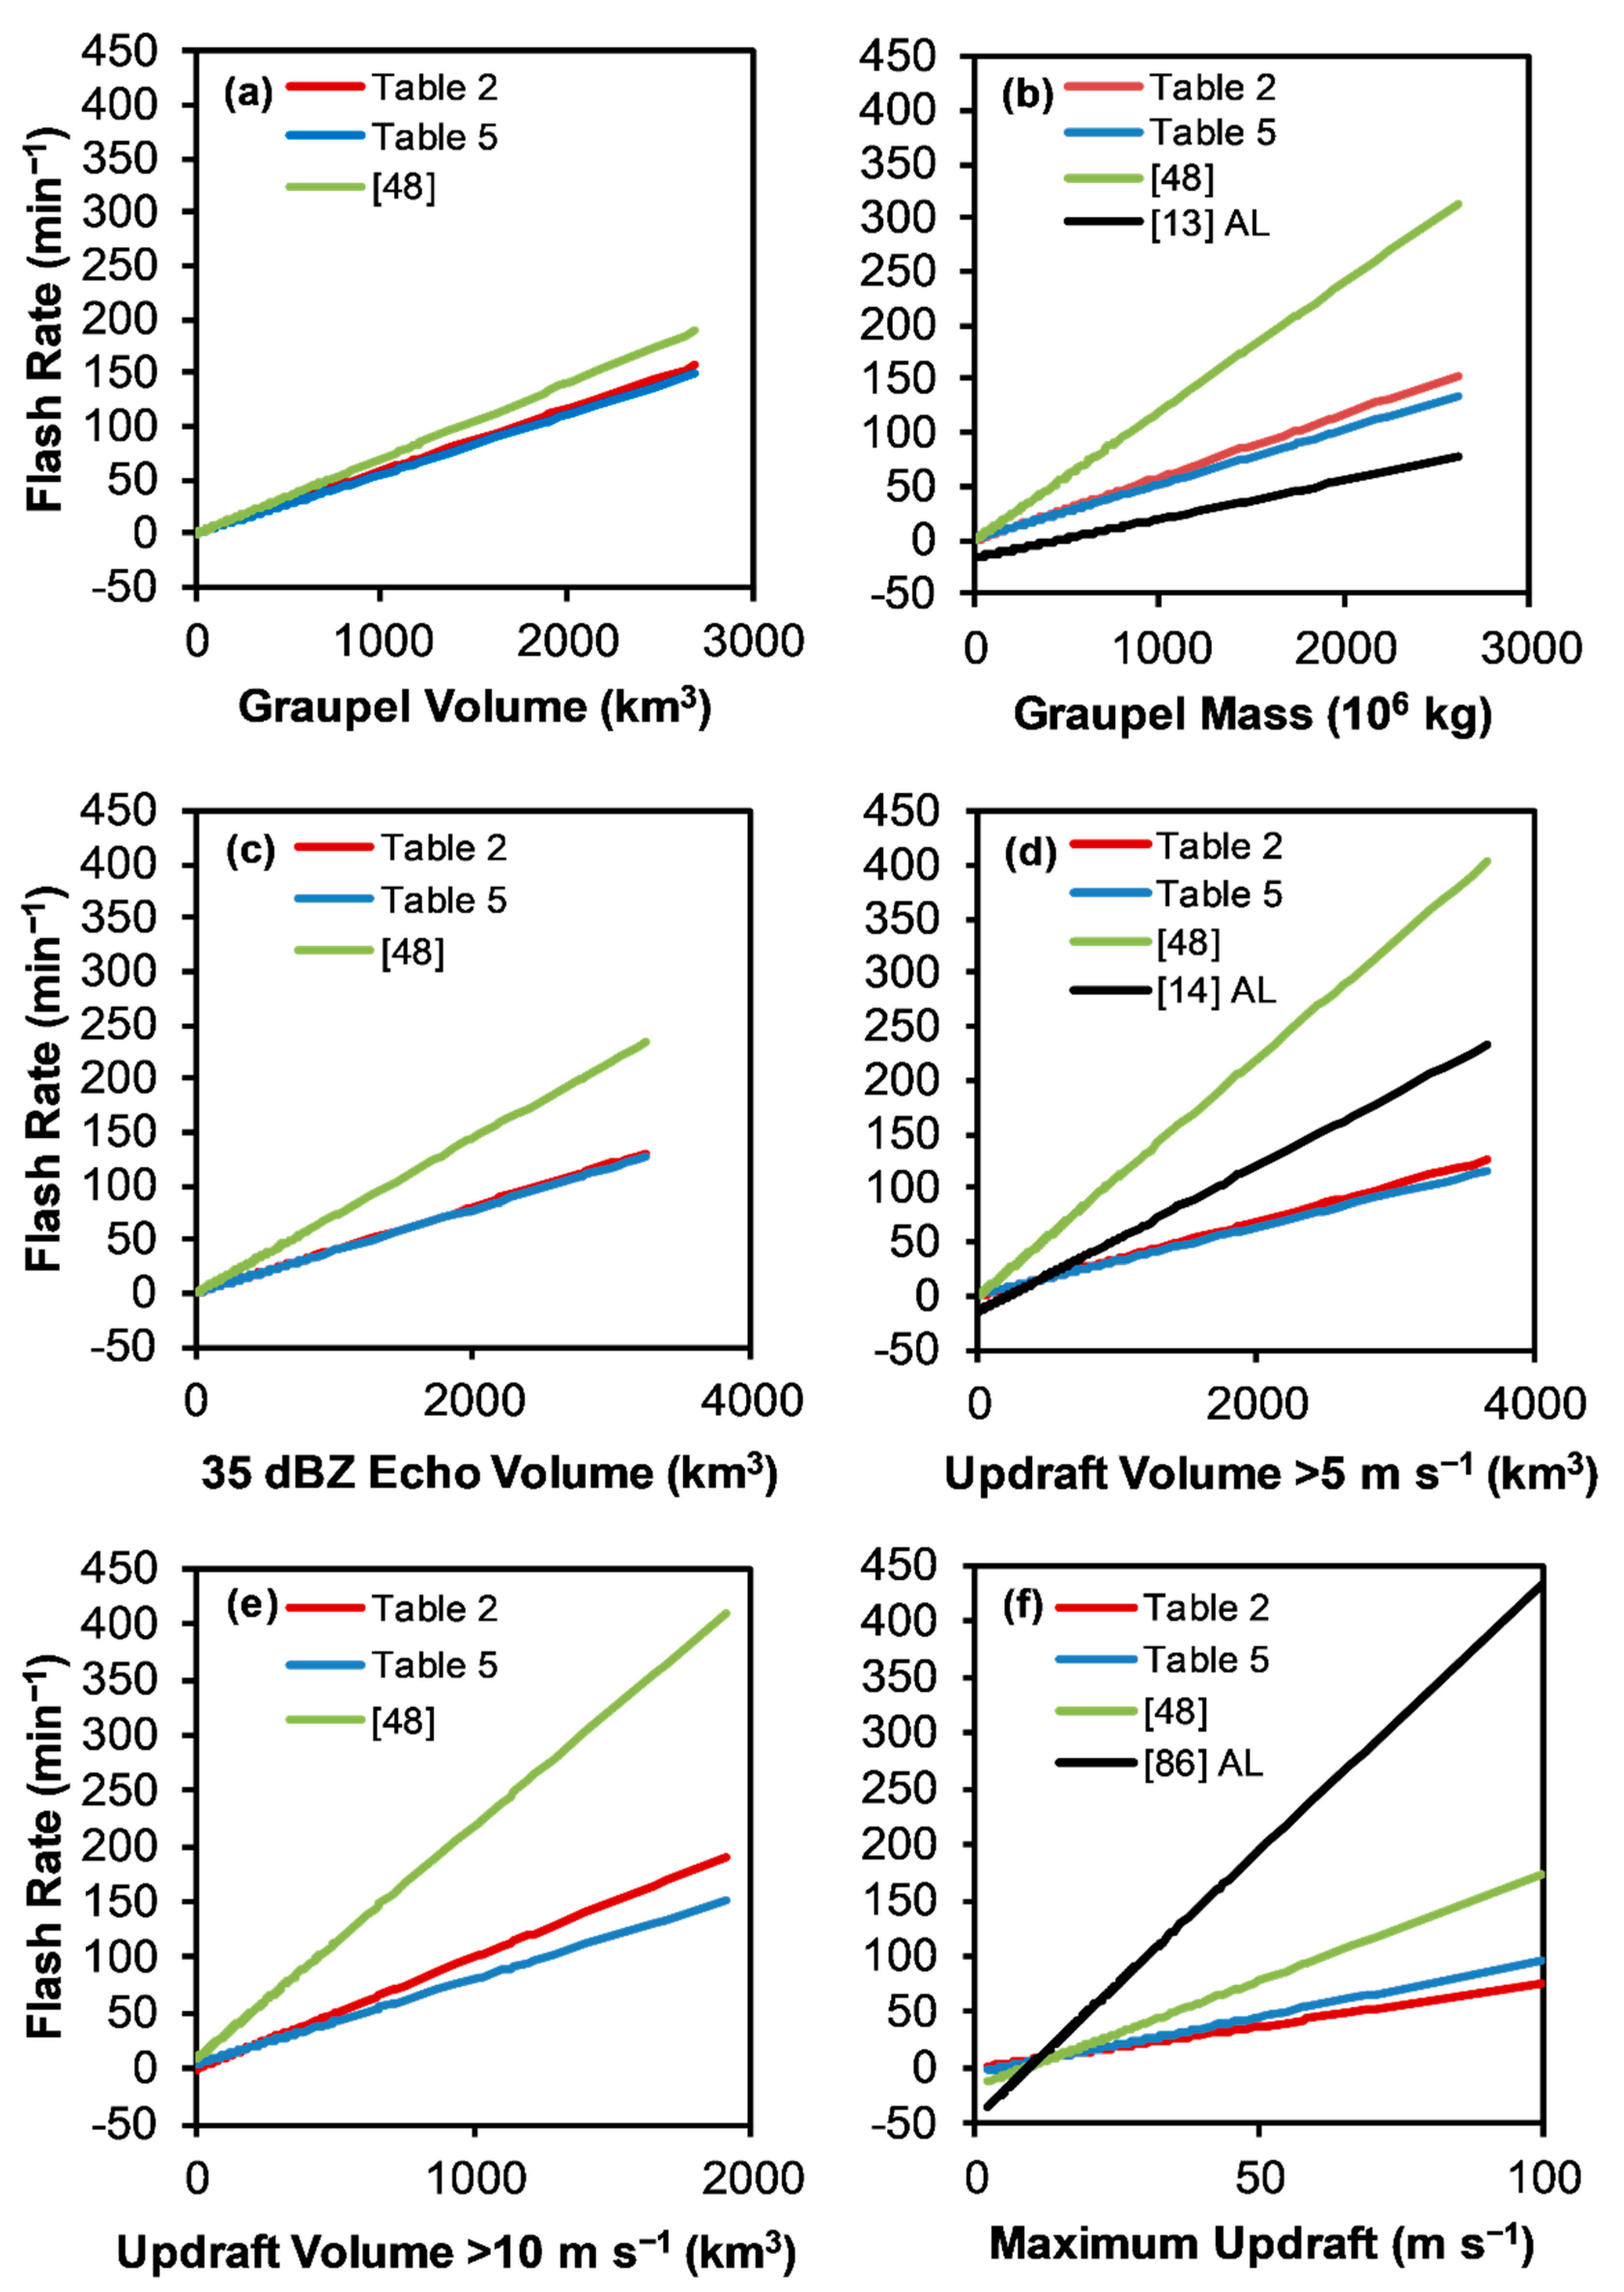
- Maximum updraft velocity (ρ = 0.60) has the lowest overall correlation with flash rate, while graupel mass (ρ = 0.76) has the highest overall correlation with flash rate. With the exception of maximum updraft velocity, all of the other kinematic and microphysical parameters have similar overall correlations with flash rate, ranging from ρ = 0.69 to 0.76. In fact, the various radar-inferred microphysical parameters are even better correlated to each other (ρ = 0.91 to 0.97), as are the updraft volumes with each other (ρ = 0.92) or with the microphysical parameters (ρ = 0.81 to 0.92). From simple Pearson correlation coefficient analysis, it could be anticipated that the overall performance of the flash rate parameterizations based on all of the various microphysical and kinematic parameters tested herein would be fairly similar to each other, with the notable exception of maximum updraft velocity, which would be somewhat worse.
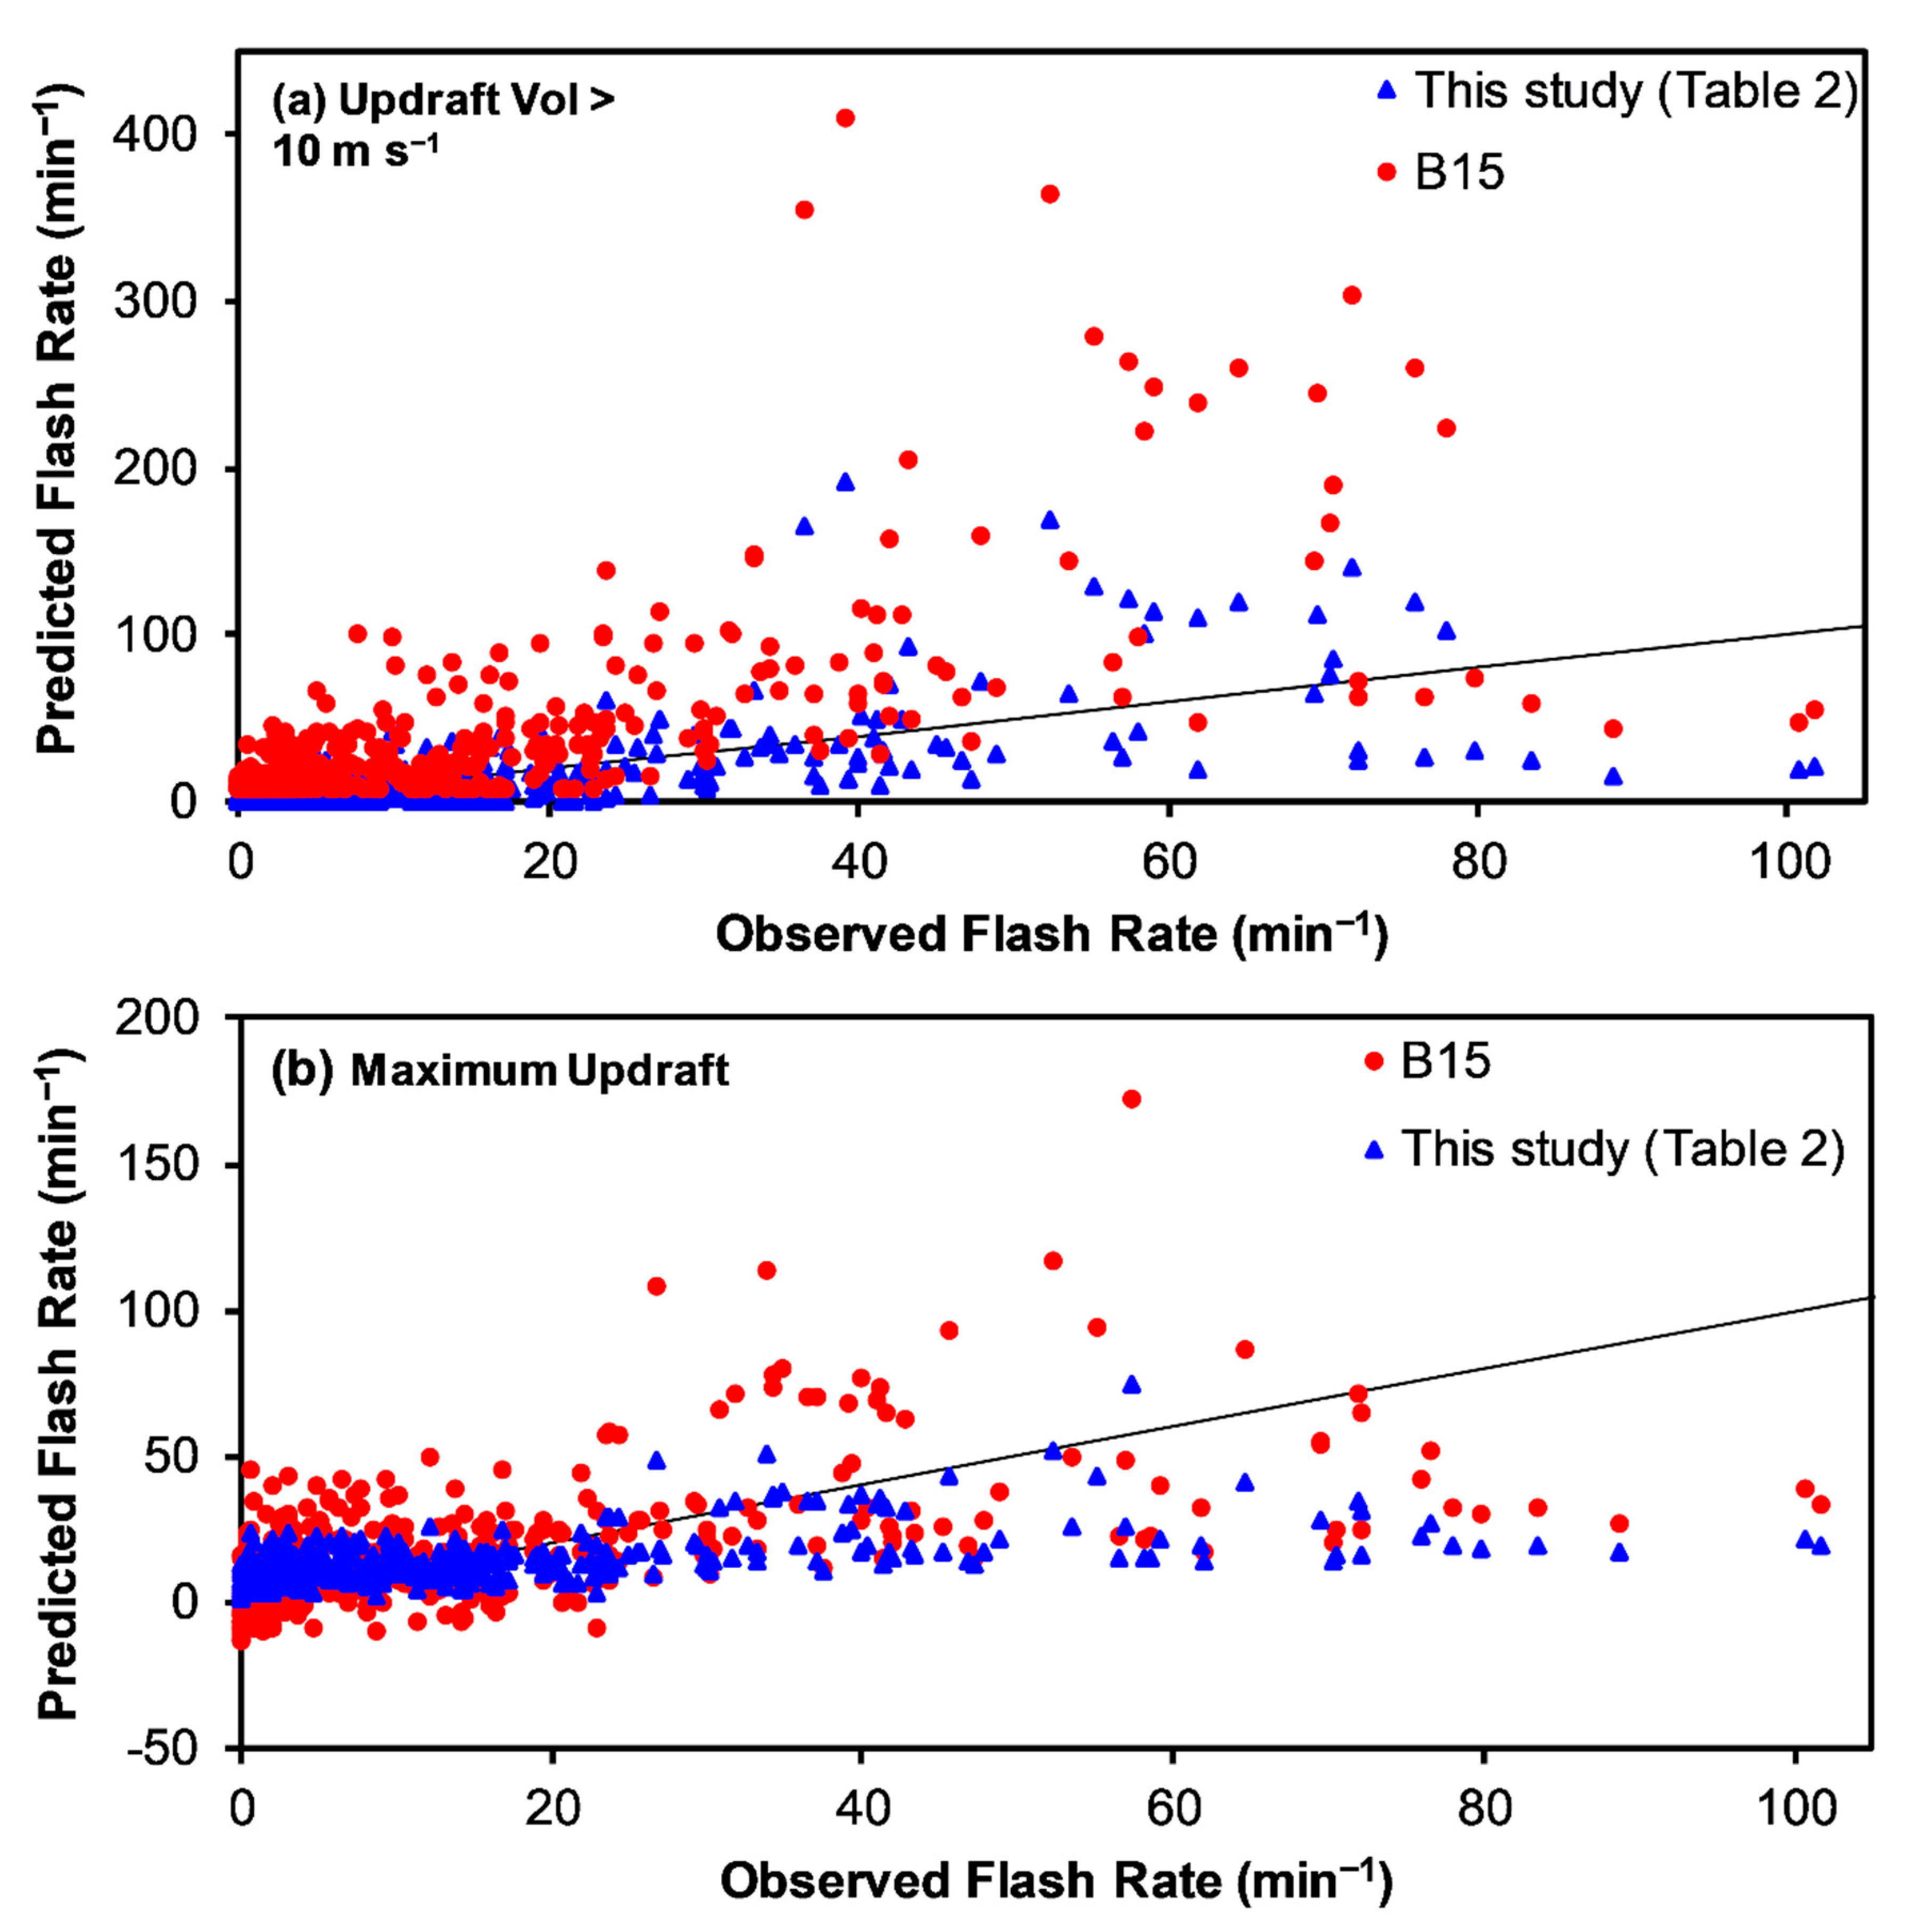
- Error analysis of the various flash rate parameterization relations developed and tested on the Alabama storms in the study find very low MBE or |NMBE| < 1% for all relations, as would be expected. When testing similar relations developed in other studies on the data in this study, the |NMBE| values are generally larger (>1%) and typically, much larger (>10%). All of the recently developed Colorado relations [48] overestimate flash rate when applied to the Alabama storms in this study, often with large positive NMBE, including 35 dBZ echo (11.2%), graupel mass (14.2%), updraft volume > 10 m s−1 (20.4%), and updraft volume > 5 m s−1 (27.7%). Lower MBE’s for the recent Colorado relations include graupel volume (3.5%) and maximum updraft velocity (2.1%). When tested on the Alabama data in this study, nearly all earlier relations, except maximum updraft, based on Alabama-only or Alabama and Colorado combined storms [13,14] typically have negative bias errors (i.e., underestimate flash rate) overall, which were sometimes large in magnitude (|NMBE| = 1% to 23%). In fact, the negative y-intercepts of the earlier relations [13,14] often result in negative flash rates for 49% to 90% of the Alabama data sample in this study. On the other hand, the earlier relations [13,14] based on maximum updraft velocity exhibit large positive bias (NMBE = 21.6% and 10.5%) when applied to the data in this study. When considering MBE, the performance of most prior flash rate relations is not generally acceptable, resulting in significant over-estimation or under-estimation of flash rates, including frequent unphysical negative flash rates.
- Error analysis of the various flash rate parameterization relations developed from and tested on the Alabama storms in the study find scatter error or NRMSE that are fairly low and similar to each other with no clear favorite, most values ranging from 12% to 14% and the largest NRMSE for updraft volume > 10 m s−1 at 17%. The NRMSE values in this study are fairly similar to those NRMSE (12% to 19%) found by a recent Colorado study [48] when developing and testing the same flash rate parameterization relations exclusively on their Colorado data. The Colorado study also found larger NRMSE when estimating the flash rate from kinematic parameters. As might be expected, the NRMSE’s of flash rate relations derived in prior studies are larger than the relations derived herein when applied to the Alabama data in this study. However, sometimes the NRMSE’s associated with relations from prior studies are much larger. When the Colorado study relations [48] are applied to the Alabama data in this study, the NRMSE for estimating flash rate increase, sometimes notably to a range of 16% to 55%. The Colorado study [48] graupel volume (16%) and maximum updraft velocity (17%) relations have the lowest NRMSE while the NRMSE’s for the other Colorado study relations are much higher (34% to 55%) when applied to the Alabama data in this study. Similarly, the NRMSE’s for most flash rate parameterizations developed in the earlier studies of Alabama-only or Colorado and Alabama storms combined [13,14] when applied to the Alabama storms in this study are typically large (23% to 54%) with the exception of the graupel mass relation developed with Alabama-only data [13], which has an NRMSE of 16%.
- When considering both bias error and RMSE, it is easy to come to the conclusion that most flash rate parameterization relations lack sufficient general applicability from one observational data set or study to the next, likely due to a combination of possible error sources discussed in Section 4 (e.g., conceptual model, observational and statistical errors). To improve the robustness and utility of these relations in both radar and model applications, future studies should attempt to isolate, quantify and mitigate the various error sources using a self-consistent radar-model analysis framework on a sufficiently large, diverse and representative sample of storms with similar assumptions and the ability to generate self-consistent kinematic and microphysical parameters between radar and cloud-resolving modeling systems.
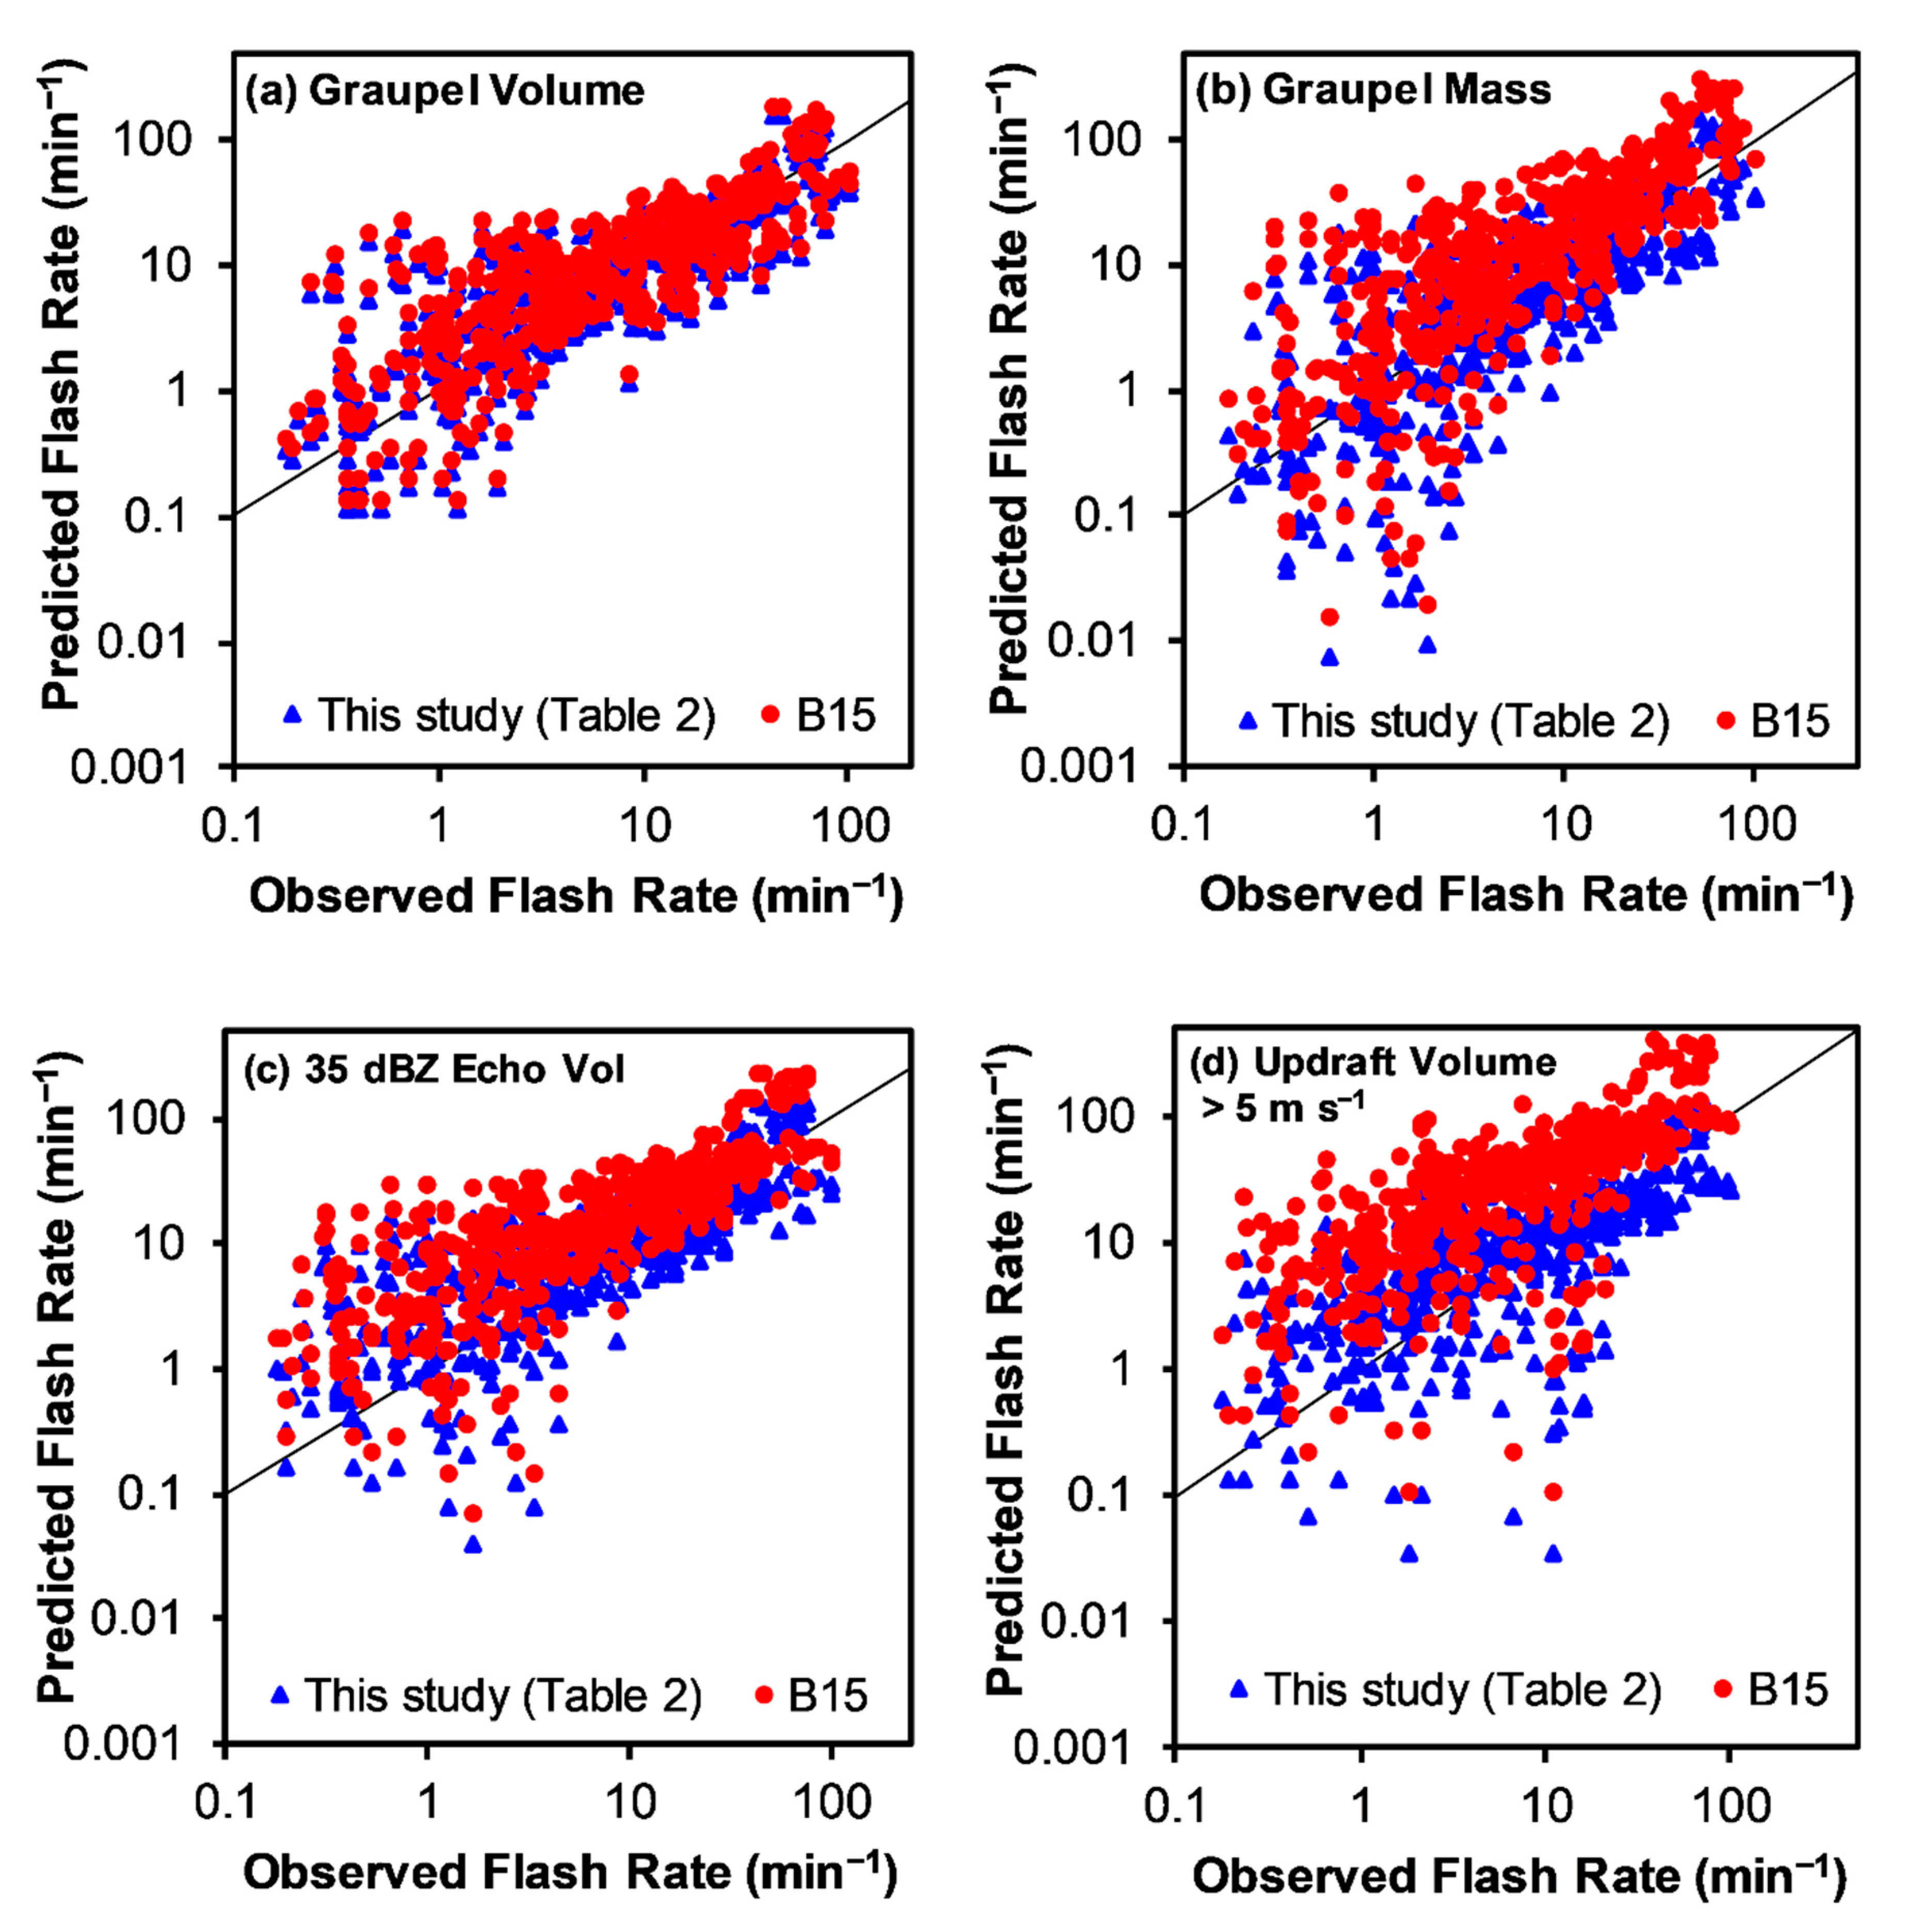
- Prior studies and results presented herein have identified potential issues when applying linear flash rate parameterization equations with large-magnitude y-intercepts. As noted in item 3), prior flash rate relations with large-magnitude negative y-intercepts often result in a majority fraction of unphysical negative flash rates, significant negative bias errors and large RMSE. Similarly, flash rate relations from prior studies with large-magnitude positive y-intercepts have sometimes resulted in the over-estimation of flash rate, significant positive biases and large RMSE. Given these findings, a sensitivity test is conducted herein by deriving and testing two types of linear equations, (1) one in which the flash rate solution is forced through the origin (i.e., zero y-intercept) and (2) the other in which the y-intercept is allowed to vary (i.e., non-zero y-intercept) during WLS regression. Although the non-zero y-intercept equations perform slightly better (i.e., slightly lower MBE and RMSE) than the zero y-intercept equations in this study, the difference in overall outcomes is small. The magnitudes of the y-intercepts derived in the second set of relations in this study are small (0.3 to 4.2 min−1), which may be why there is little difference in error performance between the two sets overall. However, it should be noted that there are significant differences in the performance of the two types of relations at low flash rates, as will be discussed next in item 7. Large-magnitude y-intercepts in flash rate relations from prior studies are not applicable to the storms in this study and may not be generally applicable due to statistical issues (e.g., small sample sizes, heteroscedasticity), although the different effects of observational and conceptual model errors between studies cannot yet be ruled out.
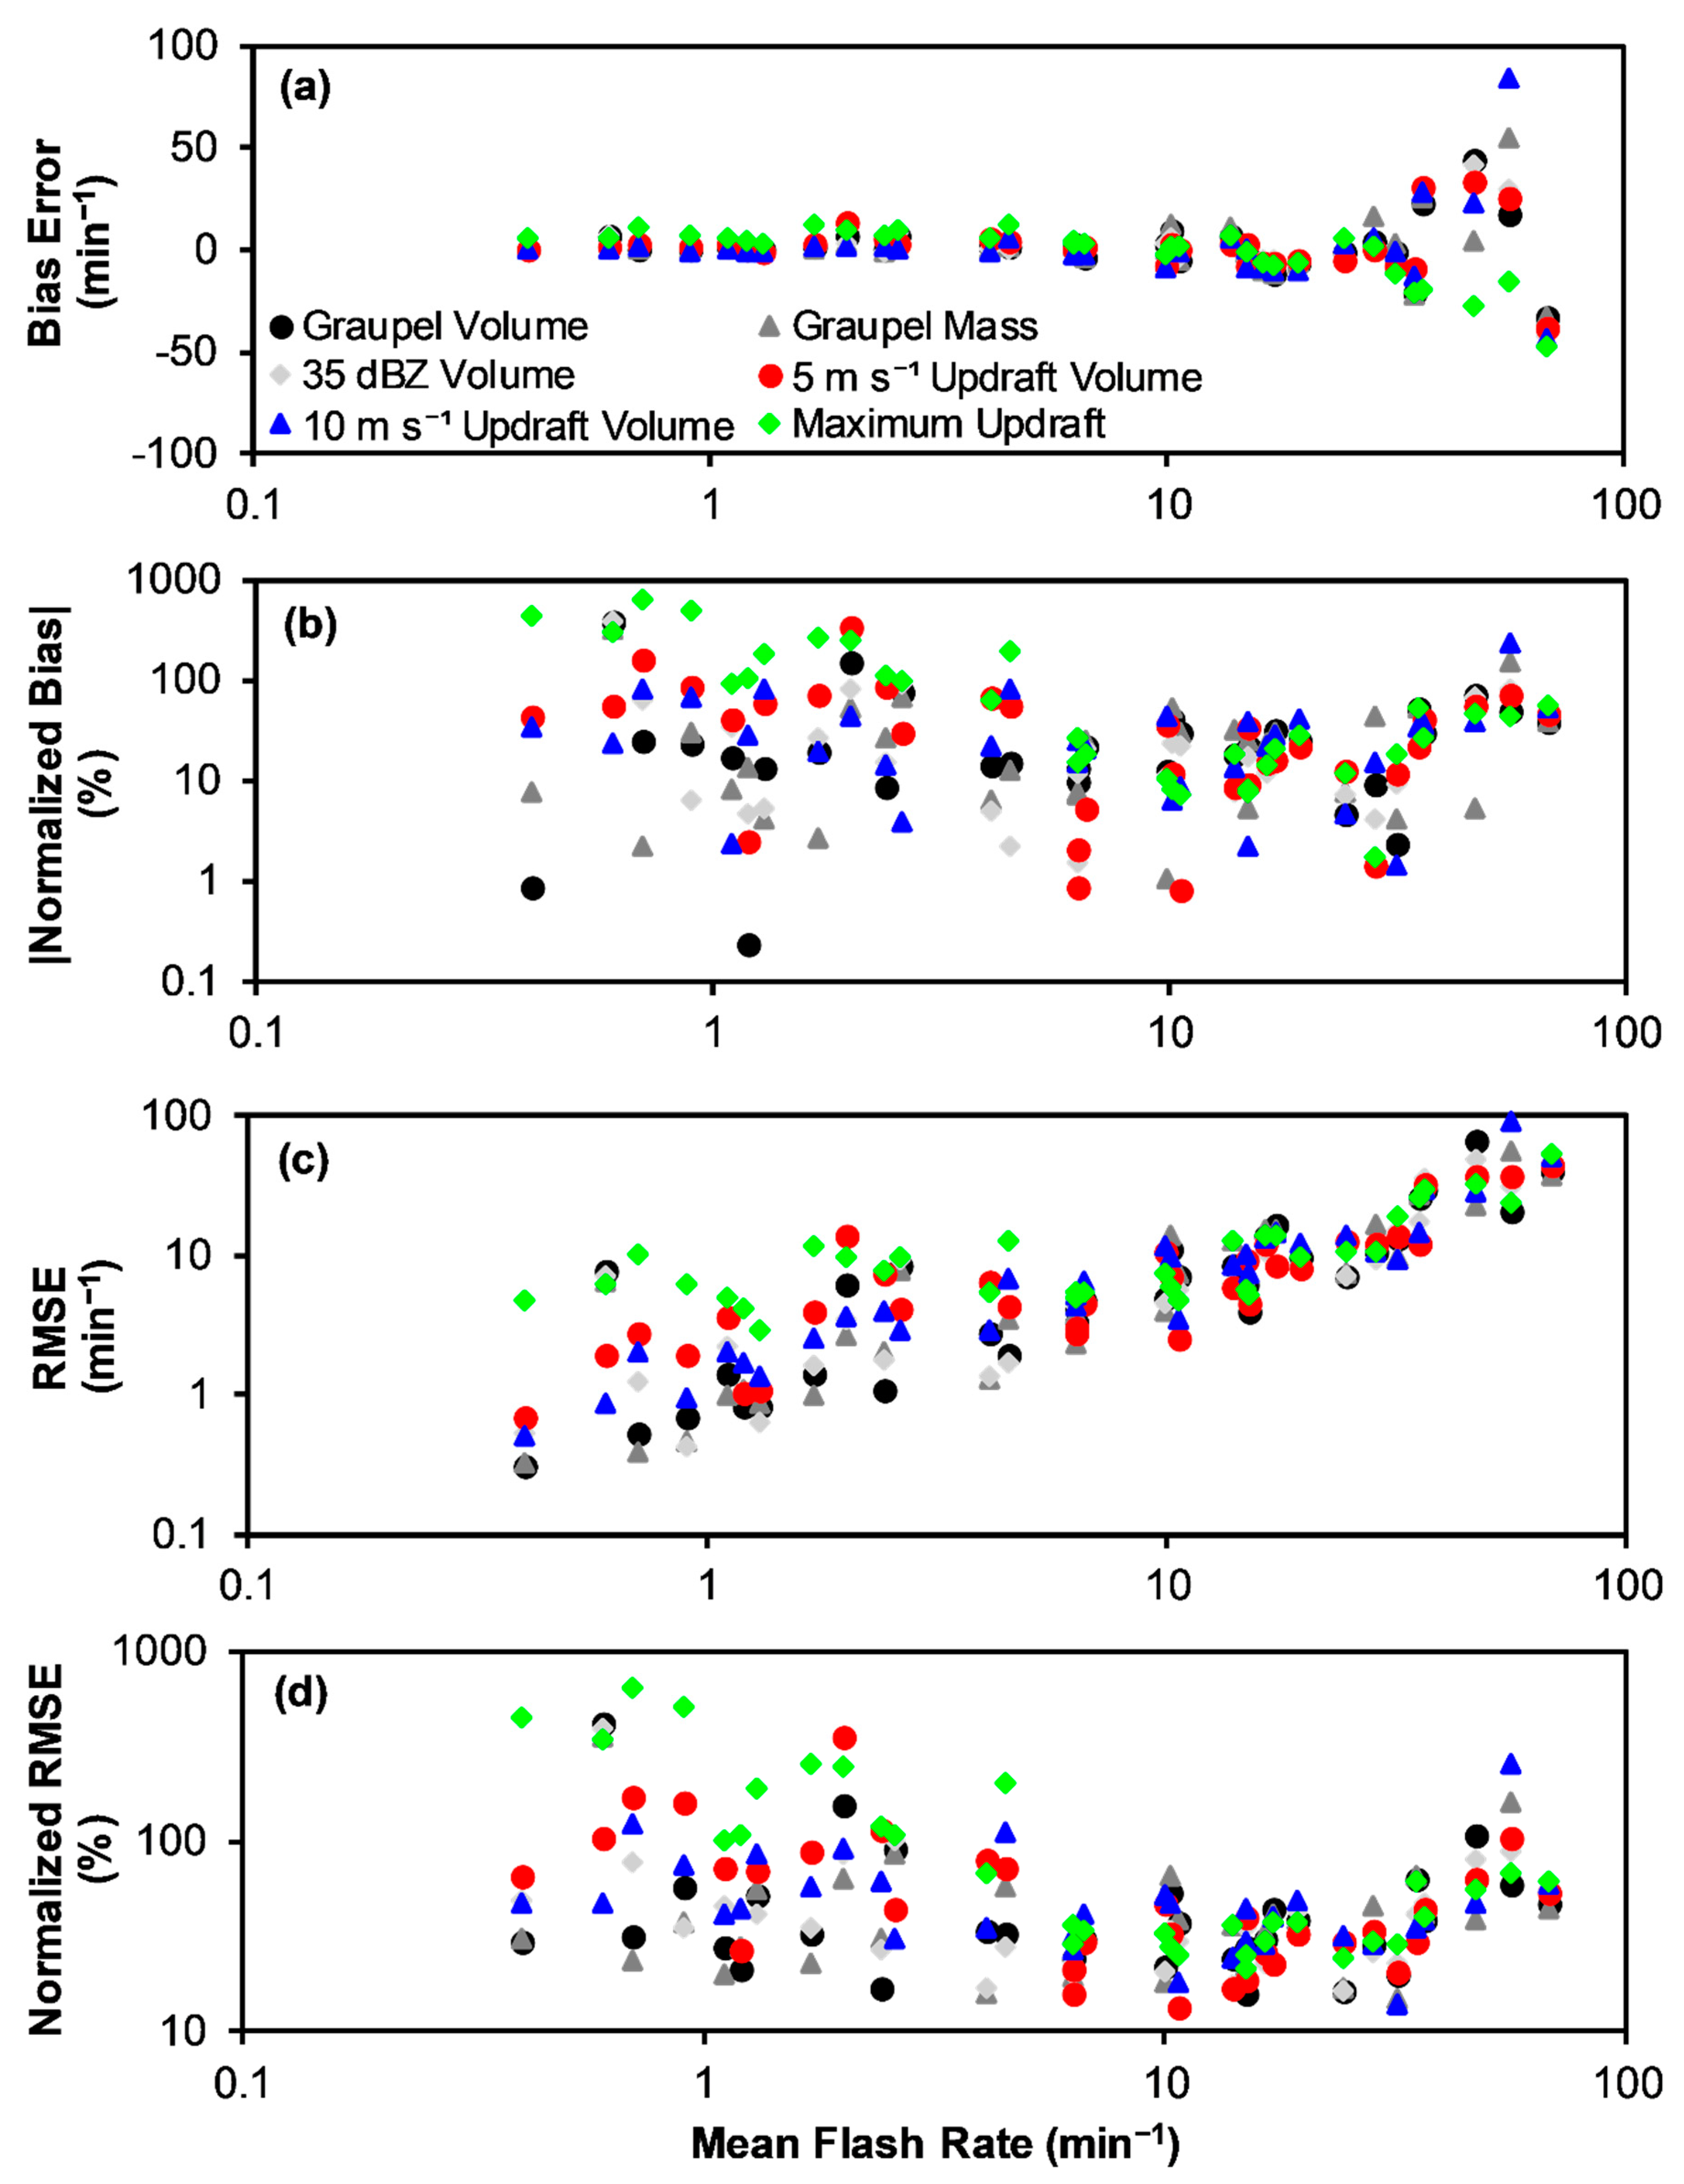
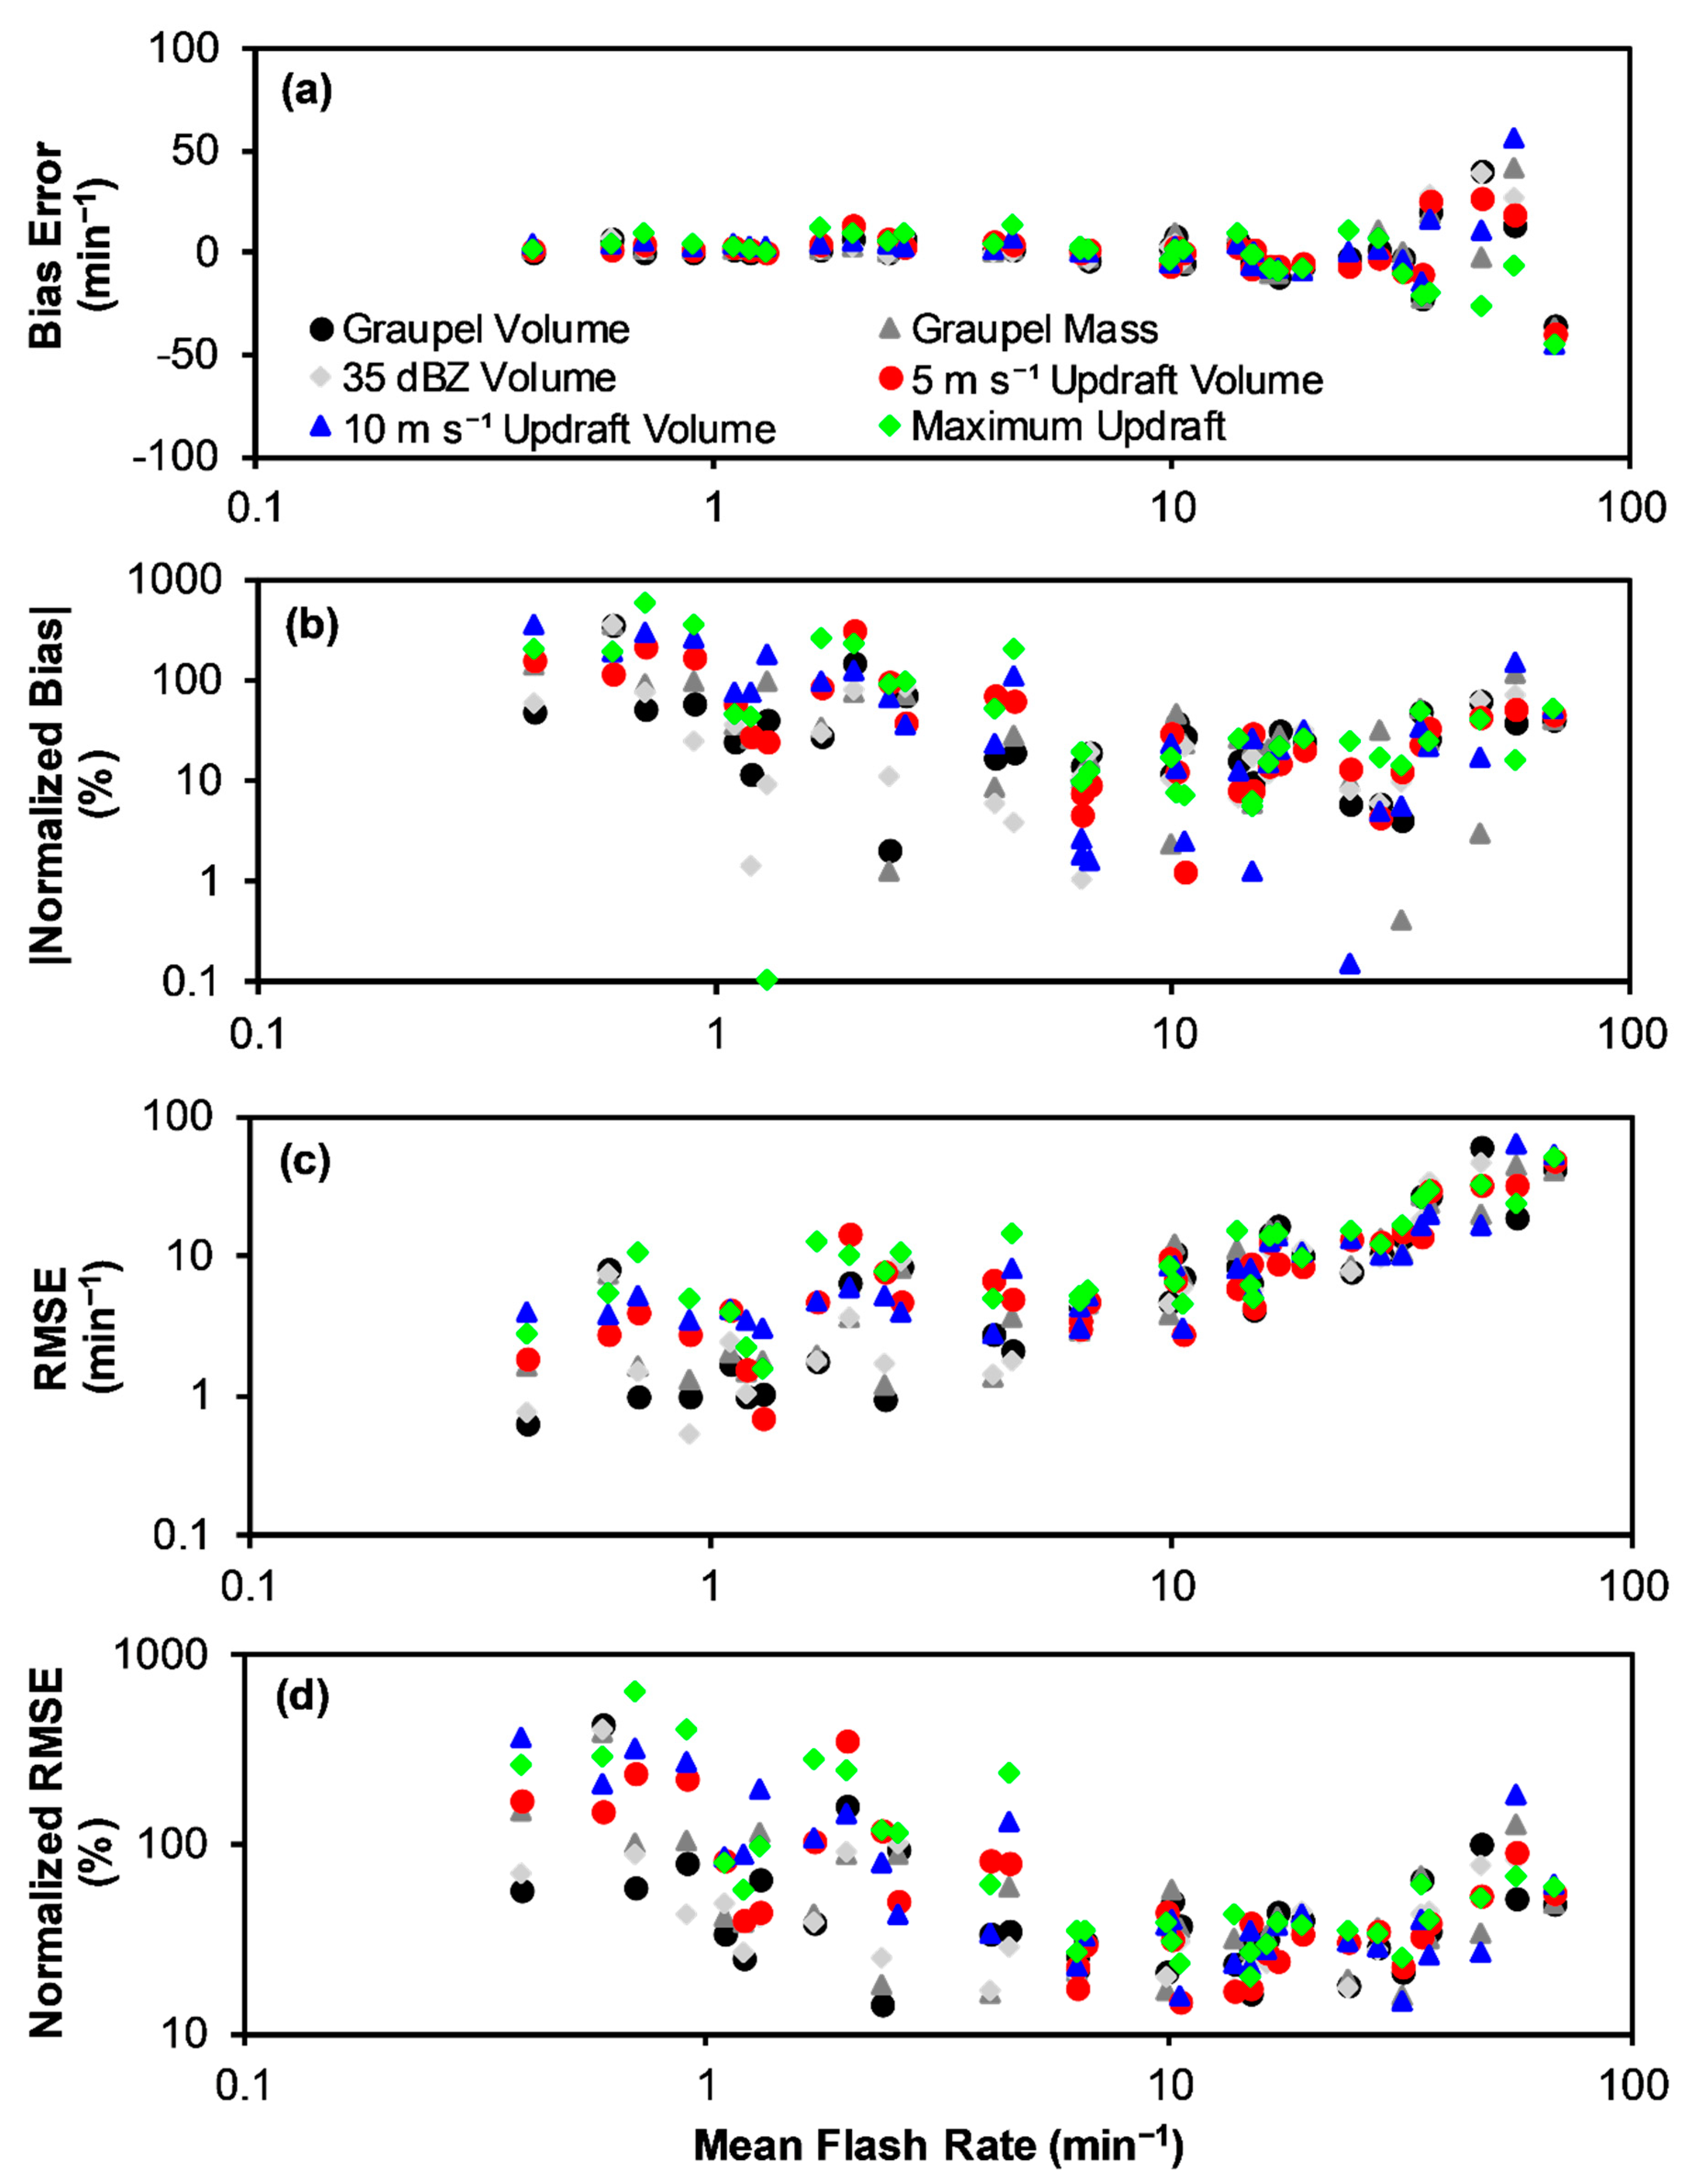
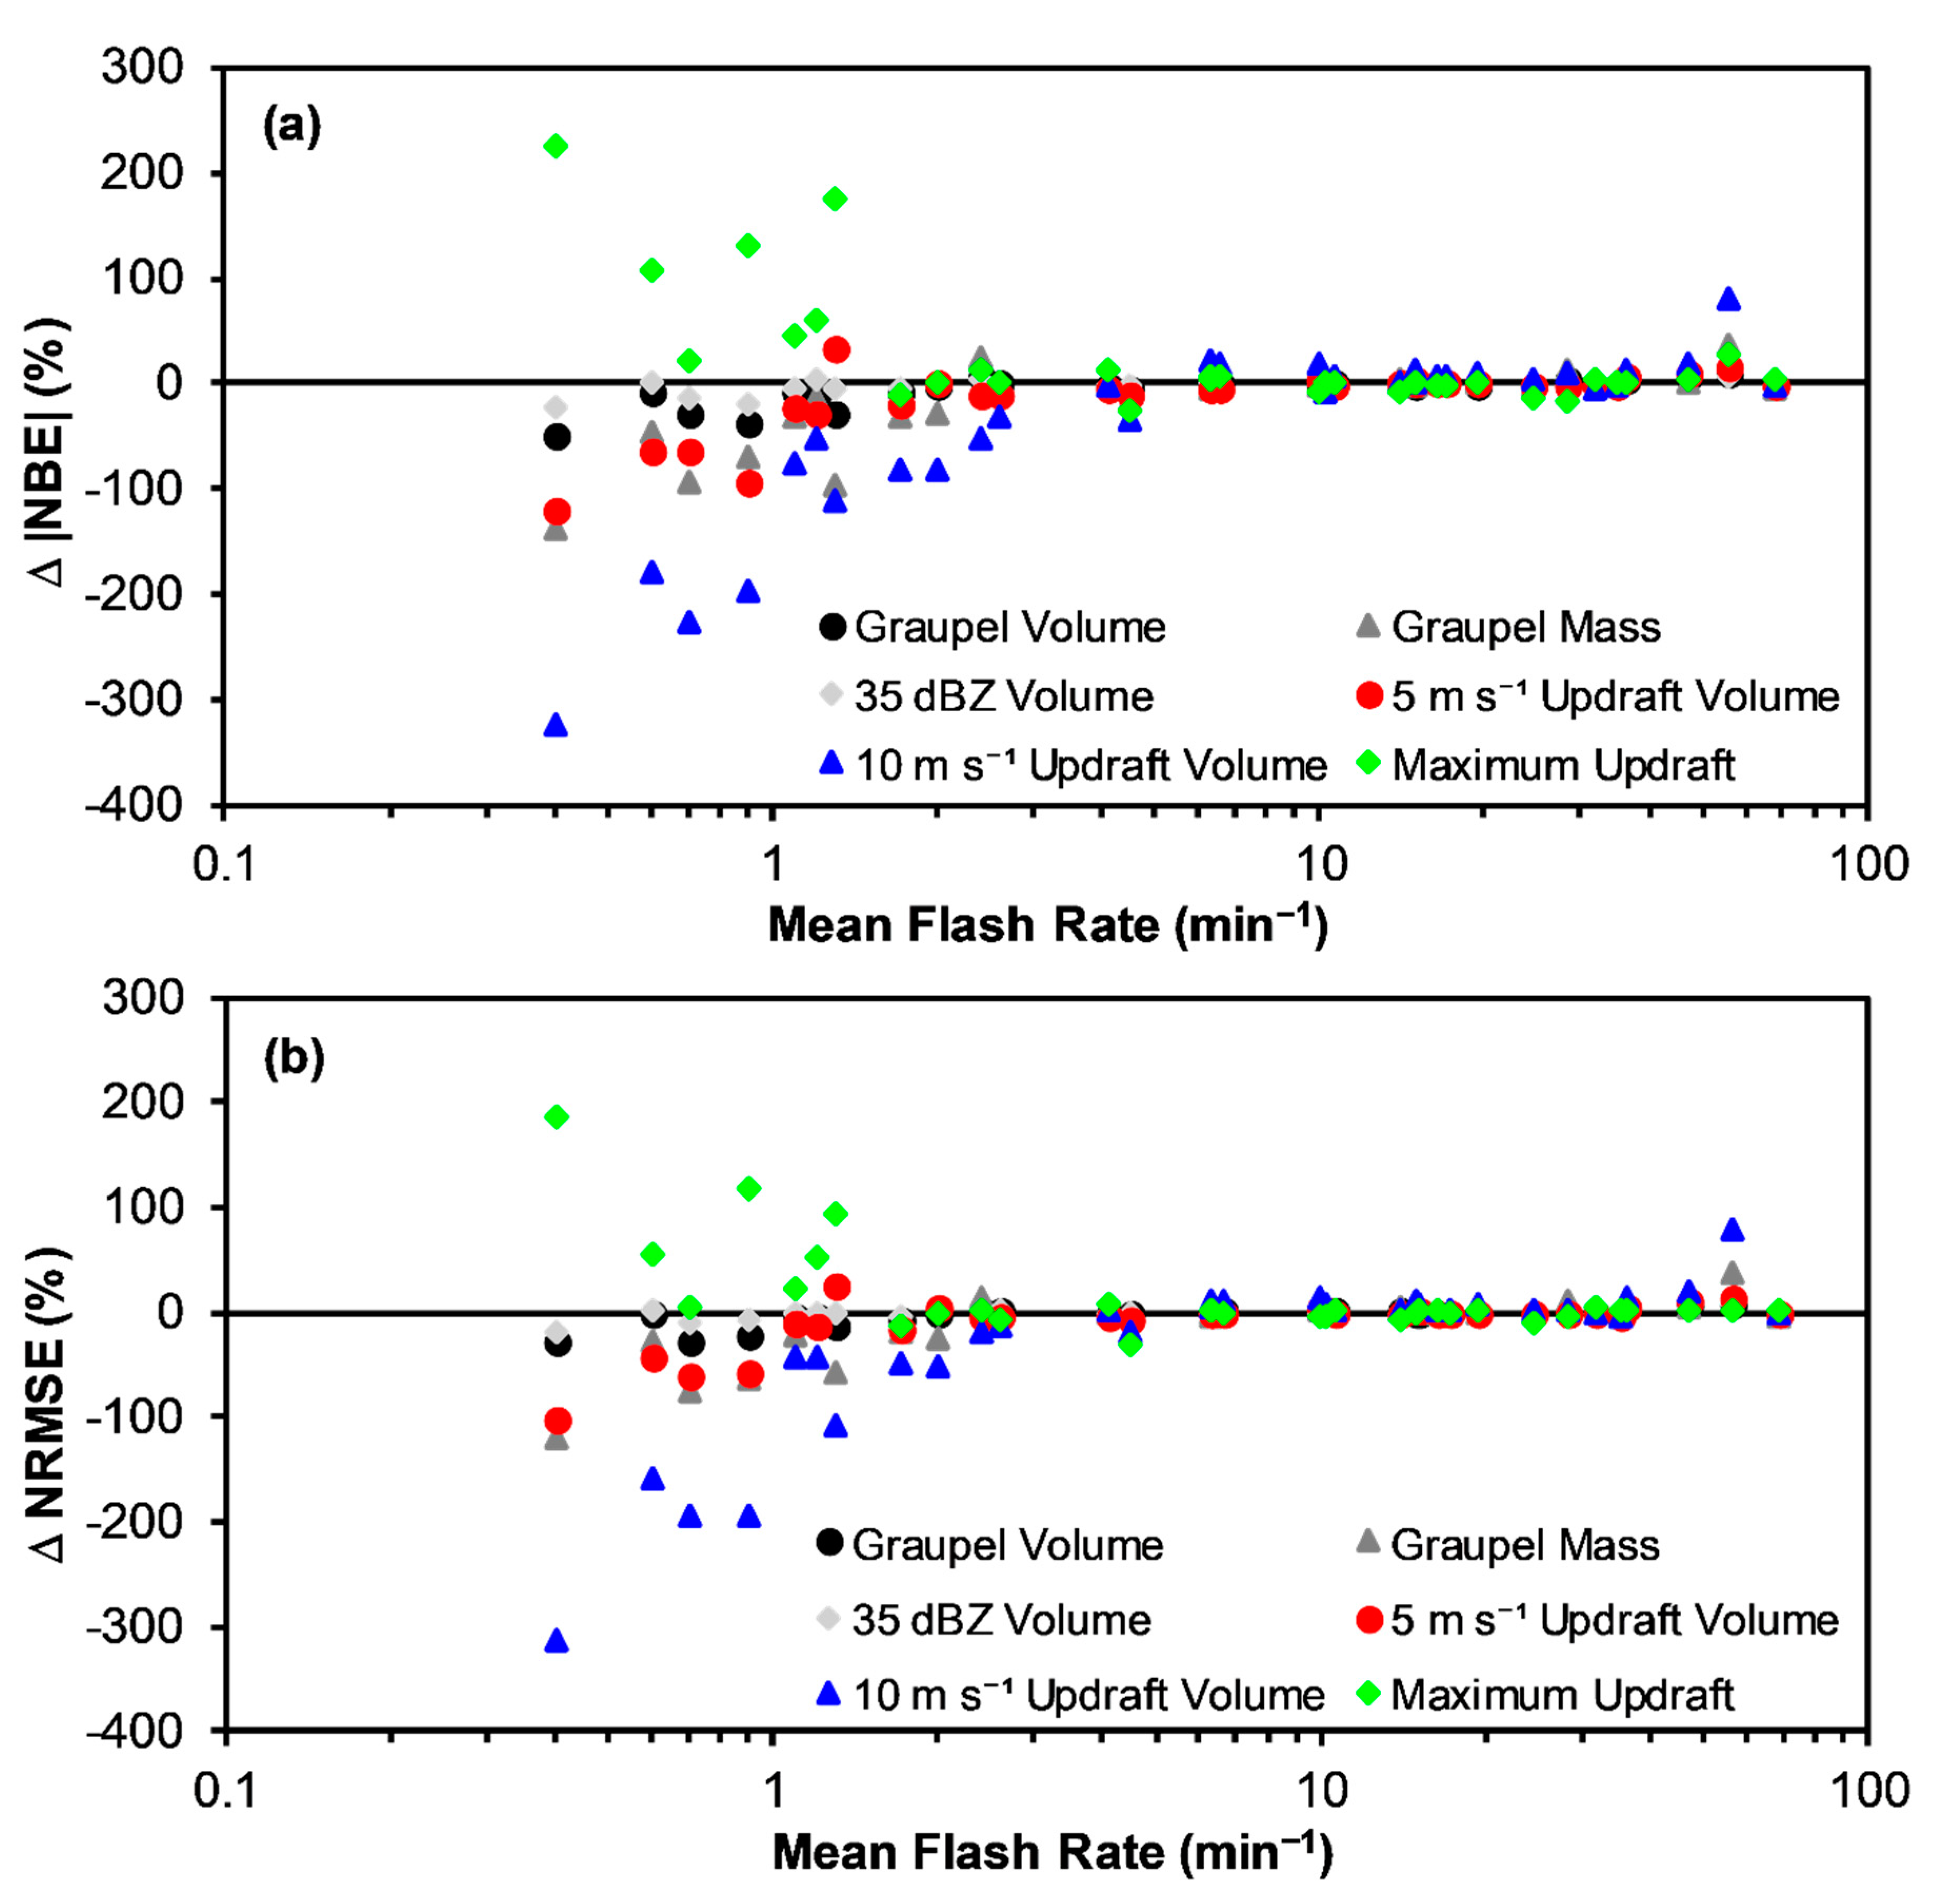
- To more completely assess expected performance, the flash rate relations derived (from the entire data set) herein are applied to each storm separately and the MBE and RMSE are evaluated for each storm individually as a function of storm mean flash rate, including for low-flash-rate storms. At low mean storm flash rates (<10 min−1), the errors associated with relations based on kinematic parameters, including updraft volume and especially maximum updraft velocity, are larger than for relations based on microphysical parameters (graupel volume, graupel mass, 35 dBZ echo volume), while all relations perform similarly at mean storm flash rates ≥10 min−1. At low-mean-storm-flash rates, the errors associated with most relations are undesirably high, especially for the kinematic-based relations like maximum updraft. At very low flash rates (<1–3 min−1), the error performance of maximum updraft is considerably worse for the zero y-intercept relations than the non-zero y-intercept relations in this study. Conversely, the error performance for all the rest of the flash rate relations, especially updraft volume > 10 m s−1, is worse at very low flash rates for the non-zero, and in these instances positive, y-intercept relations compared to the zero y-intercept relations. The error structure of the relations at low flash rates is likely strongly influenced by observational error, although all error sources (including conceptual model and statistical errors) likely interact and contribute.
- When considering all factors (e.g., low overall bias error, low overall RMSE, absence of negative flash rates, acceptable generality between studies, insensitivity to the choice of y-intercept, and relatively low bias error and low RMSE at the storm level for all flash rates, including low flash rates), the single-parameter flash rate parameterization relation with the best performance and most desirable overall characteristics found in this study is based on graupel volume. This conclusion may reflect (1) the primary, direct and causal role of graupel in the overall conceptual model of cloud electrification and lightning, (2) the relative robustness of fuzzy-logic-based polarimetric radar methods for identifying the bulk hydrometeor type (i.e., graupel) and (3) lower observational error associated with graupel echo volume compared to more complex radar products involving additional assumptions such as estimating precipitation ice mass from reflectivity or more complex methods such as dual-Doppler vertical motion retrievals. The finding of superior performance of the Zh > 35 dBZ echo volume relation in the Colorado study [48], even when applied to Alabama storms, could not be repeated herein, possibly due to the lack of non-isolated storms in the earlier study. Prior lightning studies of non-isolated Alabama storms [56] have found a high fraction of supercooled rain drops in the lower (i.e., warmer, −10 °C < T < −5 °C) portions of the mixed-phase zone (−40 °C < T < −5 °C) such that >35 dBZ echo at the warmer temperatures is often not associated with graupel. To confirm that graupel volume is superior to 35 dBZ echo volume (or vice versa, as found earlier [48]), this study should be repeated in a variety of regions that include frequent and diverse thunderstorm types, including low and high flash rate and non-severe and severe storms, with ample high-quality radar and lightning data such as in Cordoba, Argentina during the recent NSF RELAMPAGO (Remote Sensing of Electrification, Lightning, And Mesoscale/Microscale Processes with Adaptive Ground Observations) and DOE CACTI (Clouds, Aerosols, and Complex Terrain Interactions) joint field projects [97].
Author Contributions
Funding
Acknowledgments
Conflicts of Interest
References
- Dye, J.E.; Ridley, B.A.; Skamarock, W.; Barth, M.; Venticinque, M.; Defer, E.; Blanchet, P.; Thery, C.; Laroche, P.; Baumann, K.; et al. An overview of the Stratospheric-Tropospheric Experiment: Radiation, Aerosols, and Ozone (STERAO)-Deep Convection experiment with results for the July 10, 1996 storm. J. Geophys. Res. 2000, 105, 10023–10045. [Google Scholar] [CrossRef]
- Lang, T.J.; Miller, L.J.; Weisman, M.; Rutledge, S.A.; Barker, L.J.; Bringi, V.N.; Chandrasekar, V.; Detwiler, A.; Doesken, N.; Helsdon, J.; et al. The Severe Thunderstorm Electrification and Precipitation Study. Bull. Am. Meteorol. Soc. 2004, 85, 1107–1126. [Google Scholar] [CrossRef]
- MacGorman, D.R.; Rust, W.D.; Schuur, T.J.; Biggerstaff, M.I.; Straka, J.M.; Ziegler, C.L.; Mansell, E.R.; Bruning, E.C.; Kuhlman, K.M.; Lund, N.R.; et al. TELEX the Thunderstorm Electrification and Lightning Experiment. Bull. Am. Meteorol. Soc. 2008, 89, 997–1014. [Google Scholar] [CrossRef]
- Barth, M.C.; Cantrell, C.A.; Brune, W.H.; Rutledge, S.A.; Crawford, J.H.; Huntrieser, H.; Carey, L.D.; MacGorman, D.; Weisman, M.; Pickering, K.E.; et al. The Deep Convective Clouds and Chemistry (DC3) Field Campaign. Bull. Am. Meteorol. Soc. 2015, 96, 1281–1309. [Google Scholar] [CrossRef]
- Dye, J.E.; Jones, J.J.; Winn, W.P.; Cerni, T.A.; Gardiner, B.; Lamb, D.; Pitter, R.L.; Hallett, J.; Saunders, C.P.R. Early electrification and precipitation development in a small, isolated Montana cumulonimbus. J. Geophys. Res. 1986, 91, 1231–1247. [Google Scholar] [CrossRef]
- Dye, J.E.; Winn, W.P.; Jones, J.J.; Breed, D.W. The electrification of New Mexico thunderstorms: 1. Relationship between precipitation development and the onset of electrification. J. Geophys. Res. 1989, 94, 8643–8656. [Google Scholar] [CrossRef]
- Williams, E.R.; Weber, M.E.; Orville, R.E. The relationship between lightning type and convective state of thunderclouds. J. Geophys. Res. 1989, 94, 13213–13220. [Google Scholar] [CrossRef]
- Carey, L.D.; Rutledge, S.A. A multiparameter radar case study of the microphysical and kinematic evolution of a lightning producing storm. Meteorol. Atmos. Phys. 1996, 59, 33–64. [Google Scholar] [CrossRef]
- Carey, L.D.; Rutledge, S.A. The relationship between precipitation and lightning in tropical island convection: A C-Band polarimetric radar study. Mon. Weather 2000, 128, 2687–2710. [Google Scholar] [CrossRef]
- Petersen, W.A.; Christian, H.J.; Rutledge, S.A. TRMM observations of the global relationship between ice water content and lightning: TRMM observations. Geophys. Res. Lett. 2005, 32, L14819. [Google Scholar] [CrossRef]
- Kuhlman, K.M.; Ziegler, C.L.; Mansell, E.R.; MacGorman, D.R.; Straka, J.M. Numerically Simulated Electrification and Lightning of the 29 June 2000 STEPS Supercell Storm. Mon. Weather Rev. 2006, 134, 2734–2757. [Google Scholar] [CrossRef]
- Bruning, E.C.; Rust, W.D.; Schuur, T.J.; MacGorman, D.R.; Krehbiel, P.R.; Rison, W. Electrical and Polarimetric Radar Observations of a Multicell Storm in TELEX. Mon. Weather Rev. 2007, 135, 2525–2544. [Google Scholar] [CrossRef]
- Deierling, W.; Petersen, W.A.; Latham, J.; Ellis, S.; Christian, H.J. The relationship between lightning activity and ice fluxes in thunderstorms. J. Geophys. Res. 2008, 113, D15210. [Google Scholar] [CrossRef]
- Deierling, W.; Petersen, W.A. Total lightning activity as an indicator of updraft characteristics. J. Geophys. Res. 2008, 113, D16210. [Google Scholar] [CrossRef]
- Mansell, E.R.; Ziegler, C.L.; Bruning, E.C. Simulated Electrification of a Small Thunderstorm with Two-Moment Bulk Microphysics. J. Atmos. Sci. 2010, 67, 171–194. [Google Scholar] [CrossRef]
- Reynolds, S.E.; Brook, M.; Gourley, M.F. Thunderstorm charge separation. J. Meteorol. 1957, 14, 426–436. [Google Scholar] [CrossRef]
- Takahashi, T. Riming Electrification as a Charge Generation Mechanism in Thunderstorms. J. Atmos. Sci. 1978, 35, 1536–1548. [Google Scholar] [CrossRef]
- Saunders, C.P.R.; Keith, W.D.; Mitzeva, R.P. The effect of liquid water on thunderstorm charging. J. Geophys. Res. 1991, 96, 11007–11017. [Google Scholar] [CrossRef]
- Saunders, C.P.R.; Peck, S.L. Laboratory studies of the influence of the rime accretion rate on charge transfer during crystal/graupel collisions. J. Geophys. Res. 1998, 103, 13949–13956. [Google Scholar] [CrossRef]
- Nesbitt, S.W.; Zipser, E.J.; Cecil, D.J. A Census of Precipitation Features in the Tropics Using TRMM: Radar, Ice Scattering, and Lightning Observations. J. Clim. 2000, 13, 4087–4106. [Google Scholar] [CrossRef]
- Petersen, W.A.; Rutledge, S.A. Regional Variability in Tropical Convection: Observations from TRMM. J. Clim. 2001, 14, 3566–3586. [Google Scholar] [CrossRef]
- Toracinta, E.R.; Cecil, D.J.; Zipser, E.J.; Nesbitt, S.W. Radar, Passive Microwave, and Lightning Characteristics of Precipitating Systems in the Tropics. Mon. Weather Rev. 2002, 130, 802–824. [Google Scholar] [CrossRef]
- Cecil, D.J.; Goodman, S.J.; Boccippio, D.J.; Zipser, E.J.; Nesbitt, S.W. Three Years of TRMM Precipitation Features. Part I: Radar, Radiometric, and Lightning Characteristics. Mon. Weather Rev. 2005, 133, 543–566. [Google Scholar] [CrossRef]
- Zipser, E.J.; Cecil, D.J.; Liu, C.; Nesbitt, S.W.; Yorty, D.P. Where are the most intense thunderstorms ON earth? Bull. Am. Meteorol. Soc. 2006, 87, 1057–1072. [Google Scholar] [CrossRef]
- Liu, C.; Cecil, D.J.; Zipser, E.J.; Kronfeld, K.; Robertson, R. Relationships between lightning flash rates and radar reflectivity vertical structures in thunderstorms over the tropics and subtropics. J. Geophys. Res. 2012, 117, D06212. [Google Scholar] [CrossRef]
- Williams, E.; Boldi, B.; Matlin, A.; Weber, M.; Hodanish, S.; Sharp, D.; Goodman, S.; Raghavan, R.; Buechler, D. The behavior of total lightning activity in severe Florida thunderstorms. Atmos. Res. 1999, 51, 245–265. [Google Scholar] [CrossRef]
- Schultz, C.J.; Petersen, W.A.; Carey, L.D. Preliminary Development and Evaluation of Lightning Jump Algorithms for the Real-Time Detection of Severe Weather. J. Appl. Meteorol. Climatol. 2009, 48, 2543–2563. [Google Scholar] [CrossRef]
- Gatlin, P.N.; Goodman, S.J. A Total Lightning Trending Algorithm to Identify Severe Thunderstorms. J. Atmos. Ocean. Technol. 2010, 27, 3–22. [Google Scholar] [CrossRef]
- Schultz, C.J.; Petersen, W.A.; Carey, L.D. Lightning and Severe Weather: A Comparison between Total and Cloud-to-Ground Lightning Trends. Weather Forecast. 2011, 26, 744–755. [Google Scholar] [CrossRef]
- Bedka, K.M.; Wang, C.; Rogers, R.; Carey, L.D.; Feltz, W.; Kanak, J. Examining Deep Convective Cloud Evolution Using Total Lightning, WSR-88D, and GOES-14 Super Rapid Scan Datasets. Weather Forecast. 2015, 30, 571–590. [Google Scholar] [CrossRef]
- Schultz, C.J.; Carey, L.D.; Schultz, E.V.; Blakeslee, R.J. Insight into the Kinematic and Microphysical Processes that Control Lightning Jumps. Weather Forecast. 2015, 30, 1591–1621. [Google Scholar] [CrossRef]
- Schultz, C.J.; Carey, L.D.; Schultz, E.V.; Blakeslee, R.J. Kinematic and Microphysical Significance of Lightning Jumps versus Nonjump Increases in Total Flash Rate. Weather Forecast. 2017, 32, 275–288. [Google Scholar] [CrossRef] [PubMed]
- Tian, Y.; Qie, X.; Sun, Y.; Wang, D.; Yuan, S.; Sun, Z.; Lu, G.; Yu, L.; Sun, H.; Li, L.; et al. Total lightning signatures of thunderstorms and lightning jumps in hailfall nowcasting in the Beijing area. Atmos. Res. 2019, 230, 104646. [Google Scholar] [CrossRef]
- Terborg, A.; Stano, G.T. Impacts to Aviation Weather Center Operations Using Total Lightning Observations from the Pseudo-GLM. J. Oper. Meteorol. 2017, 5, 1–13. [Google Scholar] [CrossRef]
- Cummins, K.L.; Murphy, M.J. An Overview of Lightning Locating Systems: History, Techniques, and Data Uses, with an In-Depth Look at the U.S. NLDN. IEEE Trans. Electromagn. Compat. 2009, 51, 499–518. [Google Scholar] [CrossRef]
- Goodman, S.J.; Blakeslee, R.J.; Koshak, W.J.; Mach, D.; Bailey, J.; Buechler, D.; Carey, L.; Schultz, C.; Bateman, M.; McCaul, E.; et al. The GOES-R Geostationary Lightning Mapper (GLM). Atmos. Res. 2013, 125–126, 34–49. [Google Scholar] [CrossRef]
- Holle, R.L. A Summary of Recent National-Scale Lightning Fatality Studies. Weather Clim. Soc. 2016, 8, 35–42. [Google Scholar] [CrossRef]
- Stano, G.T.; Smith, M.R.; Schultz, C.J. Development and Evaluation of the GLM Stoplight Product for Lightning Safety. J. Oper. Meteorol. 2019, 7, 92–104. [Google Scholar] [CrossRef]
- Steiner, M.; Deierling, W.; Ikeda, K.; Nelson, E.; Bass, R. Airline and airport operations under lightning threats—Safety risks, impacts, uncertainties, and how to deal with them all. In Proceedings of the 6th AIAA Atmospheric and Space Environments Conference; American Institute of Aeronautics and Astronautics: Atlanta, GA, USA, 2014. [Google Scholar] [CrossRef]
- Roeder, W.P.; McNamara, T.M.; McAleenan, M.; Winters, K.A.; Maier, L.M.; Huddleston, L.L. The 2014 Upgrade to the Lightning Warning Areas Used By 45th Weather Squadron. In Proceedings of the 18th Conference on Aviation, Range, and Aerospace Meteorology; American Meteorological Society: Seattle, WA, USA, 2017. [Google Scholar]
- DeCaria, A.J.; Pickering, K.E.; Stenchikov, G.L.; Ott, L.E. Lightning-generated NOX and its impact on tropospheric ozone production: A three-dimensional modeling study of a Stratosphere-Troposphere Experiment: Radiation, Aerosols and Ozone (STERAO-A) thunderstorm. J. Geophys. Res. 2005, 110, D14303. [Google Scholar] [CrossRef]
- Pickering, K.E.; Wang, Y.; Tao, W.-K.; Price, C.; Müller, J.-F. Vertical distributions of lightning NOx for use in regional and global chemical transport models. J. Geophys. Res. 1998, 103, 31203–31216. [Google Scholar] [CrossRef]
- Barthe, C.; Barth, M.C. Evaluation of a new lightning-produced NOx parameterization for cloud resolving models and its associated uncertainties. Atmos. Chem. Phys. 2008, 8, 4691–4710. [Google Scholar] [CrossRef]
- Ott, L.E.; Pickering, K.E.; Stenchikov, G.L.; Allen, D.J.; DeCaria, A.J.; Ridley, B.; Lin, R.-F.; Lang, S.; Tao, W.-K. Production of lightning NOx and its vertical distribution calculated from three-dimensional cloud-scale chemical transport model simulations. J. Geophys. Res. 2010, 115, D04301. [Google Scholar] [CrossRef]
- Barthe, C.; Deierling, W.; Barth, M.C. Estimation of total lightning from various storm parameters: A cloud-resolving model study. J. Geophys. Res. 2010, 115, D24202. [Google Scholar] [CrossRef]
- Barthe, C.; Pinty, J.-P.; Mari, C. Lightning-produced NO x in an explicit electrical scheme tested in a Stratosphere-Troposphere Experiment: Radiation, Aerosols, and Ozone case study. J. Geophys. Res. 2007, 112, D04302. [Google Scholar] [CrossRef]
- Bovalo, C.; Barthe, C.; Pinty, J. Examining relationships between cloud-resolving model parameters and total flash rates to generate lightning density maps. Q. J. R. Meteorol. Soc. 2019, 145, 1250–1266. [Google Scholar] [CrossRef]
- Basarab, B.M.; Rutledge, S.A.; Fuchs, B.R. An improved lightning flash rate parameterization developed from Colorado DC3 thunderstorm data for use in cloud-resolving chemical transport models. J. Geophys. Res. Atmos. 2015, 120, 9481–9499. [Google Scholar] [CrossRef]
- Carey, L.D.; Koshak, W.; Peterson, H.; Mecikalski, R.M. The kinematic and microphysical control of lightning rate, extent, and NOX production. J. Geophys. Res. Atmos. 2016, 121, 7975–7989. [Google Scholar] [CrossRef]
- McCaul, E.W.; Goodman, S.J.; LaCasse, K.M.; Cecil, D.J. Forecasting Lightning Threat Using Cloud-Resolving Model Simulations. Weather Forecast. 2009, 24, 709–729. [Google Scholar] [CrossRef]
- Wang, Y.; Yang, Y.; Jin, S. Evaluation of Lightning Forecasting Based on One Lightning Parameterization Scheme and Two Diagnostic Methods. Atmosphere 2018, 9, 99. [Google Scholar] [CrossRef]
- Vincent, B.R.; Carey, L.D.; Schneider, D.; Keeter, K.; Gonski, R. Using WSR-88D reflectivity data for the prediction of cloud-to-ground lightning: A North Carolina study. Nat. Weather Dig. 2003, 27, 35–44. [Google Scholar]
- Wolf, P. Anticipating the Initiation, Cessation, and Frequency of Cloud-to-Ground Lightning, Utilizing WSR-88D Reflectivity Data. NWA Electron. J. Oper. Meteorol. 2007, 8, 1–19. [Google Scholar]
- Mosier, R.M.; Schumacher, C.; Orville, R.E.; Carey, L.D. Radar Nowcasting of Cloud-to-Ground Lightning over Houston, Texas. Weather Forecast. 2011, 26, 199–212. [Google Scholar] [CrossRef]
- Patton, J.R.; Fuelberg, H.E. Using Radar-Derived Parameters to Develop Probabilistic Guidance for Lightning Cessation within Isolated Convection near Cape Canaveral, Florida. Weather Forecast. 2019, 34, 559–575. [Google Scholar] [CrossRef]
- Mecikalski, R.M.; Bain, A.L.; Carey, L.D. Radar and Lightning Observations of Deep Moist Convection across Northern Alabama during DC3: 21 May 2012. Mon. Weather Rev. 2015, 143, 2774–2794. [Google Scholar] [CrossRef]
- Johnson, E.V. Behavior of Lightning and Updrafts for Severe and Non-Severe Storms in Northern Alabama. Master’s Thesis, The University of Alabama in Huntsville, Huntsville, AL, USA, 2009. [Google Scholar]
- Koshak, W.J.; Solakiewicz, R.J.; Blakeslee, R.J.; Goodman, S.J.; Christian, H.J.; Hall, J.M.; Bailey, J.C.; Krider, E.P.; Bateman, M.G.; Boccippio, D.J.; et al. North Alabama Lightning Mapping Array (LMA): VHF Source Retrieval Algorithm and Error Analyses. J. Atmos. Ocean. Technol. 2004, 21, 543–558. [Google Scholar] [CrossRef]
- Goodman, S.J.; Blakeslee, R.; Christian, H.; Koshak, W.; Bailey, J.; Hall, J.; McCaul, E.; Buechler, D.; Darden, C.; Burks, J.; et al. The North Alabama Lightning Mapping Array: Recent severe storm observations and future prospects. Atmos. Res. 2005, 76, 423–437. [Google Scholar] [CrossRef]
- Rison, W.; Thomas, R.J.; Krehbiel, P.R.; Hamlin, T.; Harlin, J. A GPS-based three-dimensional lightning mapping system: Initial observations in central New Mexico. Geophys. Res. Lett. 1999, 26, 3573–3576. [Google Scholar] [CrossRef]
- Petersen, W.A.; Knupp, K.; Walters, J.; Deierling, W.; Gauthier, M.; Dolan, B.; Dice, J.P.; Satterfield, D.; Davis, C.; Blakeslee, R.; et al. The UAH-NSSTC/WHNT ARMOR C-band dual-polarimetric radar: A unique collaboration in research, education and technology transfer. In Proceedings of the 32nd Conference on Radar Meteorology; American Meteorological Society: Albuquerque, NM, USA, 2005; p. 12R.4. [Google Scholar]
- Scott, R.D.; Krehbiel, P.R.; Rison, W. The Use of Simultaneous Horizontal and Vertical Transmissions for Dual-Polarization Radar Meteorological Observations. J. Atmos. Ocean. Technol. 2001, 18, 629–648. [Google Scholar] [CrossRef]
- Crum, T.D.; Alberty, R.L. The WSR-88D and the WSR-88D Operational Support Facility. Bull. Am. Meteorol. Soc. 1993, 74, 1669–1688. [Google Scholar] [CrossRef]
- Bringi, V.N.; Keenan, T.D.; Chandrasekar, V. Correcting C-band radar reflectivity and differential reflectivity data for rain attenuation: A self-consistent method with constraints. IEEE Trans. Geosci. Remote Sens. 2001, 39, 1906–1915. [Google Scholar] [CrossRef]
- Bringi, V.N.; Chandrasekar, V. Polarimetric Doppler Weather Radar: Principles and Applications; Cambridge Univ. Press: Cambridge, UK, 2001; ISBN 9780521019552. [Google Scholar]
- Marks, D.A.; Wolff, D.B.; Carey, L.D.; Tokay, A. Quality Control and Calibration of the Dual-Polarization Radar at Kwajalein, RMI. J. Atmos. Ocean. Technol. 2011, 28, 181–196. [Google Scholar] [CrossRef]
- Oye, D.; Mueller, C.; Smith, S. Software for radar translation, visualization, editing and interpolation. In Proceedings of the 27th Conference on Radar Meteorology; American Meteorological Society: Vail, CO, USA, 1995; pp. 359–361. [Google Scholar]
- Oye, D.; Case, M. REORDER: A Program for Gridding Radar Data—Installation and User Manual for the UNIX Version; NCAR Atmospheric Technology Division: Boulder, CO, USA, 1995; p. 19. [Google Scholar]
- Davies-Jones, R.P. Dual-Doppler Radar Coverage Area as a Function of Measurement Accuracy and Spatial Resolution. J. Appl. Meteorol. 1979, 18, 1229–1233. [Google Scholar] [CrossRef]
- Cressman, G.P. An operational objective analysis system. Mon. Wea. Rev. 1959, 87, 367–374. [Google Scholar] [CrossRef]
- Mohr, C.G.; Jay Miller, L.; Vaughan, R.L.; Frank, H.W. The Merger of Mesoscale Datasets into a Common Cartesian Format for Efficient and Systematic Analyses. J. Atmos. Ocean. Technol. 1986, 3, 143–161. [Google Scholar] [CrossRef][Green Version]
- Miller, L.J.; Frederick, S.M. CEDRIC: Custom Editing and Display of Reduced Information in Cartesian Space; National Center for Atmospheric Research Mesoscale and Microscale Meteorology Division: Boulder, CO, USA, 2009; p. 130. [Google Scholar]
- Armijo, L. A Theory for the Determination of Wind and Precipitation Velocities with Doppler Radars. J. Atmos. Sci. 1969, 26, 570–573. [Google Scholar] [CrossRef]
- Ray, P.S.; Ziegler, C.L.; Bumgarner, W.; Serafin, R.J. Single- and Multiple-Doppler Radar Observations of Tornadic Storms. Mon. Weather Rev. 1980, 108, 1607–1625. [Google Scholar] [CrossRef]
- O’Brien, J.J. Alternative Solutions to the Classical Vertical Velocity Problem. J. Appl. Meteorol. 1970, 9, 197–203. [Google Scholar] [CrossRef]
- Matejka, T.; Bartels, D.L. The Accuracy of Vertical Air Velocities from Doppler Radar Data. Mon. Weather Rev. 1998, 126, 92–117. [Google Scholar] [CrossRef]
- Gao, J.; Xue, M.; Shapiro, A.; Droegemeier, K.K. A Variational Method for the Analysis of Three-Dimensional Wind Fields from Two Doppler Radars. Mon. Weather Rev. 1999, 127, 2128–2142. [Google Scholar] [CrossRef]
- Vivekanandan, J.; Zrnic, D.S.; Ellis, S.M.; Oye, R.; Ryzhkov, A.V.; Straka, J. Cloud Microphysics Retrieval Using S-Band Dual-Polarization Radar Measurements. Bull. Am. Meteorol. Soc. 1999, 80, 381–388. [Google Scholar] [CrossRef]
- Heymsfield, A.J.; Miller, K.M. Water Vapor and ice Mass Transported into the Anvils of CCOPE Thunderstorms: Comparison with Storm Influx and Rainout. J. Atmos. Sci. 1988, 45, 3501–3514. [Google Scholar] [CrossRef]
- Smith, P.L. Equivalent Radar Reflectivity Factors for Snow and Ice Particles. J. Clim. Appl. Meteorol. 1984, 23, 1258–1260. [Google Scholar] [CrossRef]
- Dixon, M.; Wiener, G. TITAN: Thunderstorm Identification, Tracking, Analysis, and Nowcasting—A Radar-based Methodology. J. Atmos. Ocean. Technol. 1993, 10, 785–797. [Google Scholar] [CrossRef]
- Marshall, J.S.; Radhakant, S. Radar Precipitation Maps as Lightning Indicators. J. Appl. Meteorol. 1978, 17, 206–212. [Google Scholar] [CrossRef]
- Kutner, M.H.; Nachtsheim, C.J.; Neter, J.; Li, W. Applied Linear Statistical Models, 5th ed.; McGraw-Hill Irwin: New York, NY, USA, 2005; ISBN 0-07-238688-6. [Google Scholar]
- Wilks, D.S. Statistical Methods in the Atmospheric Sciences, 2nd ed.; International Geophysics Series; Academic Press: Cambridge, MA, USA, 2006; Volume 91, ISBN 0-12-751966-1. [Google Scholar]
- Root-Mean-Square Deviation. Available online: https://en.wikipedia.org/wiki/Root-mean-square_deviation (accessed on 11 September 2019).
- Deierling, W. The Relationship between Total Lightning and Ice Fluxes. Ph.D. Thesis, The University of Alabama in Huntsville, Huntsville, AL, USA, 2006. [Google Scholar]
- MacGorman, D.R.; Rust, W.D. The Electrical Nature of Storms; Oxford University Press: New York, NY, USA, 1998; ISBN 0-19-507337-1. [Google Scholar]
- Dye, J.E.; Bansemer, A. Electrification in Mesoscale Updrafts of Deep Stratiform and Anvil Clouds in Florida. J. Geophys. Res. Atmos. 2019, 124, 1021–1049. [Google Scholar] [CrossRef]
- MacGorman, D.R.; Elliott, M.S.; DiGangi, E. Electrical discharges in the overshooting tops of thunderstorms. J. Geophys. Res. Atmos. 2017, 122, 2929–2957. [Google Scholar] [CrossRef]
- Wu, T.; Wang, D.; Takagi, N. Intracloud Lightning Flashes Initiated at High Altitudes and Dominated by Downward Positive Leaders. J. Geophys. Res. Atmos. 2019, 124, 6982–6998. [Google Scholar] [CrossRef]
- Yair, Y.; Lynn, B.; Price, C.; Kotroni, V.; Lagouvardos, K.; Morin, E.; Mugnai, A.; del Carmen Llasat, M. Predicting the potential for lightning activity in Mediterranean storms based on the Weather Research and Forecasting (WRF) model dynamic and microphysical fields. J. Geophys. Res. 2010, 115, D04205. [Google Scholar] [CrossRef]
- Lynn, B.H.; Yair, Y.; Price, C.; Kelman, G.; Clark, A.J. Predicting Cloud-to-Ground and Intracloud Lightning in Weather Forecast Models. Weather Forecast. 2012, 27, 1470–1488. [Google Scholar] [CrossRef]
- Fuchs, B.R.; Bruning, E.C.; Rutledge, S.A.; Carey, L.D.; Krehbiel, P.R.; Rison, W. Climatological analyses of LMA data with an open-source lightning flash-clustering algorithm. J. Geophys. Res. Atmos. 2016, 121, 8625–8648. [Google Scholar] [CrossRef]
- Matsui, T.; Dolan, B.; Rutledge, S.A.; Tao, W.; Iguchi, T.; Barnum, J.; Lang, S.E. POLARRIS: A POLArimetric Radar Retrieval and Instrument Simulator. J. Geophys. Res. Atmos. 2019, 124, 4634–4657. [Google Scholar] [CrossRef]
- Zhang, G. Weather Radar Polarimetry; CRC Press: Boca Raton, FL, USA, 2017; ISBN 978-1-4398-6958-1. [Google Scholar]
- Williams, E.; Rothkin, K.; Stevenson, D.; Boccippio, D. Global Lightning Variations Caused by Changes in Thunderstorm Flash Rate and by Changes in the Number of Thunderstorms. J. Appl. Meteorol. 2000, 39, 2223–2230. [Google Scholar] [CrossRef]
- Nesbitt, S. Remote Sensing of Electrification, Lightning, And Mesoscale/microscale Processes with Adaptive Ground Observations (RELAMPAGO) and Clouds, Aerosols, and Complex Terrain Interactions (CACTI). Available online: https://www.eol.ucar.edu/field_projects/relampago (accessed on 27 November 2019).
- ARMOR. Available online: https://www.nsstc.uah.edu/armor/webimage/armor.html (accessed on 3 October 2019).
- NASA GHRC. Available online: https://ghrc.nsstc.nasa.gov/home/ (accessed on 3 October 2019).
- Atmospheric Soundings. Available online: http://weather.uwyo.edu/upperair/sounding.html (accessed on 3 October 2019).


| Date (Cell #) | Period (UTC) | Storm Type (Severity) | Life Cycle | # Samples | Max. Flash Rate (min−1) |
|---|---|---|---|---|---|
| 20060719 (1) | 18:31–19:10 | Multicell (wind) | G, M | 8 | 37.6 |
| 20060719 (2) | 20:41–21:19 | Multicell (wind) | M, D | 8 | 58.1 |
| 20060719 (3) | 21:05–21:52 | Multicell | G. M | 9 | 20.5 |
| 20070403 (1) | 16:20–17:00 | Multicell (hail) | M, D | 11 | 7.0 |
| 20070403 (2) | 18:27–19:59 | Multicell (hail) | G, M | 23 | 45.6 |
| 20070403 (3) | 18:46–20:29 | Multicell (hail) | G, M | 26 | 22.4 |
| 20070404 | 02:52–03:22 | QLCS (EF1, hail, wind) | M | 7 | 76.0 |
| 20070601 (1) | 21:01–21:37 | Multicell | M, D | 9 | 2.1 |
| 20070601 (2) | 21:01–21:33 | Multicell | G, M | 8 | 3.9 |
| 20070706 (1) | 17:19–19:15 | Multicell | G, M, D | 24 | 47.2 |
| 20070706 (2) | 17:19–18:13 | Multicell | M, D | 12 | 16.8 |
| 20070817 (1) | 19:58–20:48 | Multicell (wind) | G, M, D | 12 | 26.5 |
| 20070817 (2) | 19:20–20:48 | Multicell (wind) | G, M, D | 21 | 32.6 |
| 20070817 (3) | 19:33–20:48 | Multicell | G, M, D | 18 | 25.7 |
| 20070817 (4) | 22:45–23:32 | Multicell | G, M, D | 9 | 15.4 |
| 20070914 | 16:44–17:07 | Multicell | G, M | 5 | 4.3 |
| 20080206 | 10:02–11:19 | Supercell (EF4) | M | 13 | 101.7 |
| 20090410 (1) | 17:16–17:48 | Supercell (hail) | G, M | 6 | 41.2 |
| 20090410 (2) | 18:17–18:56 | Supercell (hail, wind) | M, D | 9 | 69.4 |
| 20090410 (3) | 18:12–18:53 | Supercell (hail) | G, M | 9 | 35.9 |
| 20100121 (1) | 21:32–22:28 | Low-top supercell (EF0, hail) | G, M, D | 18 | 1.9 |
| 20100121 (2) | 21:29–23:33 | Low-top supercell (hail) | G, M, D | 39 | 9.3 |
| 20100312 | 14:52–16:08 | QLCS (hail, wind) | G, M | 13 | 78.0 |
| 20101026 (1) | 22:04–22:38 | Multicell | M | 7 | 1.7 |
| 20101026 (2) | 22:18–23:27 | Low-top supercell (EF0) | M | 16 | 4.7 |
| 20101026 (3) | 22:14–23:14 | Low-top supercell (EF1) | M | 12 | 8.6 |
| 20110427 | 19:55–20:38 | Supercell (EF4) | M | 9 | 71.8 |
| 20120518 | 22:03–23:59 | Multicell | G, M, D | 28 | 19.5 |
| 20120521 (1) | 19:35–20:32 | Multicell | G, M, D | 15 | 1.1 |
| 20120521 (2) | 19:35–21:23 | Multicell | G, M, D | 30 | 5.0 |
| 20120611 | 18:39–21:22 | Multicell | G, M, D | 33 | 6.6 |
| 20120614 (1) | 18:31–18:56 | Multicell | M | 8 | 1.7 |
| 20120614 (2) | 16:28–18:29 | Multicell | G, M, D | 40 | 22.9 |
| Predictor Parameter Description (Radar Variable) | Radar Parameter Units | Flash Rate (f, min−1) Equation |
|---|---|---|
| Graupel Volume (GV) | km3 | f = (5.82 × 10⁻²) × GV |
| Graupel Mass (GM) | kg | f = (5.88 × 10⁻⁸) × GM |
| 35 dBZ Echo Volume (V35) | km3 | f = (4.02 × 10⁻²) × V35 |
| Updraft Volume > 5 m s−1 (UV5) | km3 | f = (3.44 × 10⁻²) × UV5 |
| Updraft Volume > 10 m s−1 (UV10) | km3 | f = (1.00 × 10⁻¹) × UV10 |
| Maximum Updraft Velocity (Wmax) | m s−1 | f = (7.46 × 10⁻¹) × Wmax |
| Equation Source Reference | Equation Type | MBE (min−1) | NMBE (%) | RMSE (min−1) | NRMSE (%) |
|---|---|---|---|---|---|
| Graupel Volume | |||||
| This study, Table 2 | 0.8 | 0.8 | 13.9 | 13.6 | |
| This study, Table 5 | 0.6 | 0.6 | 13.3 | 13.1 | |
| [48], Their Table 3 | 3.5 | 3.5 | 16.6 | 16.4 | |
| Graupel Mass | |||||
| This study, Table 2 | 0.7 | 0.7 | 13.9 | 13.7 | |
| This study, Table 5 | 0.6 | 0.6 | 12.5 | 12.3 | |
| [48], Their Table 3, Precipitation ice (PI) mass | 14.4 | 14.2 | 34.9 | 34.4 | |
| [13], Their Table 6, All, PI mass | −23.0 | −22.6 | 25.8 | 25.3 | |
| [13], Their Table 6, Alabama, PI mass | −11.5 | −11.3 | 16.7 | 16.4 | |
| [13], Their Table 6, All, Graupel mass | −20.7 | −20.3 | 23.7 | 23.3 | |
| 35 dBZ Echo Volume | |||||
| This study, Table 2 | 0.8 | 0.8 | 13.6 | 13.4 | |
| This study, Table 5 | 0.6 | 0.6 | 13.2 | 13.0 | |
| [48], Their Table 3 | 11.4 | 11.2 | 27.6 | 27.2 | |
| Updraft Volume > 5 m s−1 | |||||
| This study, Table 2 | 0.2 | 0.2 | 13.4 | 13.2 | |
| This study, Table 5 | 0.4 | 0.4 | 12.8 | 12.6 | |
| [48], Their Table 3 | 28.2 | 27.7 | 55.9 | 55.0 | |
| [14], Their Table 3, All | −1.4 | −1.4 | 26.7 | 26.2 | |
| [14], Their Table 3, Alabama | −1.9 | −1.9 | 26.6 | 26.2 | |
| Updraft Volume > 10 m s−1 | |||||
| This study, Table 2 | −0.9 | −0.9 | 17.6 | 17.3 | |
| This study, Table 5 | 0.6 | 0.6 | 14.3 | 14.1 | |
| [48], Their Table 3 | 20.7 | 20.4 | 45.6 | 44.8 | |
| Maximum Updraft Velocity | |||||
| This study, Table 2 | −0.2 | -0.2 | 14.3 | 14.1 | |
| This study, Table 5 | −0.1 | -0.1 | 14.1 | 13.9 | |
| [48], Their Table 3 | 2.1 | 2.1 | 17.5 | 17.2 | |
| [14], Their Table 4, All | 10.7 | 10.5 | 54.8 | 53.9 | |
| [86] 1, Their Table 4.10, Alabama | 22.0 | 21.6 | 49.0 | 48.2 | |
| Equation Source Reference | Equation Type | (% Negative) | MBE (min−1) | NMBE (%) | RMSE (min−1) | NRMSE (%) |
|---|---|---|---|---|---|---|
| Graupel Mass | ||||||
| [13], Their Table 6, All, PI mass | 90% | −10.6 | −10.5 | 17.9 | 17.7 | |
| [13], Their Table 6, Alabama, PI mass | 66% | −9.3 | −9.1 | 16.0 | 15.7 | |
| [13], Their Table 6, All, Graupel mass | 87% | −10.2 | −10.0 | 17.3 | 17.0 | |
| Updraft Volume > 5 m s−1 | ||||||
| [14], Their Table 3, All | 49% | 3.1 | 3.0 | 25.2 | 24.8 | |
| [14], Their Table 3, Alabama | 50% | 2.8 | 2.8 | 25.1 | 24.6 | |
| Maximum Updraft Velocity | ||||||
| This study, Table 5 | 2% | −0.1 | −0.1 | 14.1 | 13.9 | |
| [48], Their Table 3 | 21% | 3.0 | 3.0 | 17.2 | 16.9 | |
| [14], Their Table 4, All | 43% | 20.2 | 19.9 | 51.4 | 50.6 | |
| [86] 1, Their Table 4.10, Alabama | 24% | 24.9 | 24.5 | 48.4 | 47.6 | |
| Predictor Parameter Description (Radar Variable) | Parameter Units | Flash Rate (f, min−1) Equation | Coefficient of Determination (R2) |
|---|---|---|---|
| Graupel Volume (GV) | km3 | f = (5.50 × 10⁻²) × GV + 0.5 | 0.54 |
| Graupel Mass (GM) | kg | f = (5.08 × 10⁻⁸) × GM + 1.7 | 0.57 |
| 35 dBZ Echo Volume (V35) | km3 | f = (3.88 × 10⁻²) × V35 + 0.3 | 0.55 |
| Updraft Volume > 5 m s−1 (UV5) | km3 | f = (3.13 × 10⁻²) × UV5 + 1.4 | 0.53 |
| Updraft Volume > 10 m s−1 (UV10) | km3 | f = (7.67 × 10⁻²) × UV10 + 4.2 | 0.47 |
| Maximum Updraft Velocity (Wmax) | m s−1 | f = 1.00 × Wmax − 4.2 | 0.36 |
© 2019 by the authors. Licensee MDPI, Basel, Switzerland. This article is an open access article distributed under the terms and conditions of the Creative Commons Attribution (CC BY) license (http://creativecommons.org/licenses/by/4.0/).
Share and Cite
Carey, L.D.; Schultz, E.V.; Schultz, C.J.; Deierling, W.; Petersen, W.A.; Bain, A.L.; Pickering, K.E. An Evaluation of Relationships between Radar-Inferred Kinematic and Microphysical Parameters and Lightning Flash Rates in Alabama Storms. Atmosphere 2019, 10, 796. https://doi.org/10.3390/atmos10120796
Carey LD, Schultz EV, Schultz CJ, Deierling W, Petersen WA, Bain AL, Pickering KE. An Evaluation of Relationships between Radar-Inferred Kinematic and Microphysical Parameters and Lightning Flash Rates in Alabama Storms. Atmosphere. 2019; 10(12):796. https://doi.org/10.3390/atmos10120796
Chicago/Turabian StyleCarey, Lawrence D., Elise V. Schultz, Christopher J. Schultz, Wiebke Deierling, Walter A. Petersen, Anthony Lamont Bain, and Kenneth E. Pickering. 2019. "An Evaluation of Relationships between Radar-Inferred Kinematic and Microphysical Parameters and Lightning Flash Rates in Alabama Storms" Atmosphere 10, no. 12: 796. https://doi.org/10.3390/atmos10120796
APA StyleCarey, L. D., Schultz, E. V., Schultz, C. J., Deierling, W., Petersen, W. A., Bain, A. L., & Pickering, K. E. (2019). An Evaluation of Relationships between Radar-Inferred Kinematic and Microphysical Parameters and Lightning Flash Rates in Alabama Storms. Atmosphere, 10(12), 796. https://doi.org/10.3390/atmos10120796