Abstract
Lightning flash rate parameterizations based on polarimetric and multi-Doppler radar inferred microphysical (e.g., graupel volume, graupel mass, 35 dBZ volume) and kinematic (e.g., updraft volume, maximum updraft velocity) parameters have important applications in atmospheric science. Although past studies have established relations between flash rate and storm parameters, their expected performance in a variety of storm and flash rate conditions is uncertain due to sample limitations. Radar network and lightning mapping array observations over Alabama of a large and diverse sample of 33 storms are input to hydrometeor identification, vertical velocity retrieval and flash rate algorithms to develop and test flash rate relations. When applied to this sample, prior flash rate linear relations result in larger errors overall, including often much larger bias (both over- and under-estimation) and root mean square errors compared to the new linear relations. At low flash rates, the new flash rate relations based on kinematic parameters have larger errors compared to those based on microphysical ones. Sensitivity of error to the functional form (e.g., zero or non-zero intercept) is also tested. When considering all factors (e.g., low errors including at low flash rate, consistency with past linear relations, and insensitivity to functional form), the flash rate parameterization based on graupel volume has the best overall performance.
1. Introduction
Diagnosis and short-term prediction of thunderstorm impacts using observations and numerical models remain important challenges in a broad array of research disciplines in the atmospheric sciences, including severe local storms, atmospheric electricity, atmospheric chemistry and their intersection [1,2,3,4]. Improvements in storm impact assessment and nowcasting require a better understanding of underlying dynamical and physical processes and the development of new technologies and approaches. For example, observational and modeling studies have shown that storm electrification and lightning production are closely tied to convective microphysical and kinematic processes in the mixed-phase region of thunderstorms [5,6,7,8,9,10,11,12,13,14,15]. In particular, a vigorous convective updraft promotes particle-scale charging during rebounding collisions between graupel and ice crystals in the presence of super-cooled liquid cloud water [16,17,18,19] and storm-scale separation of the differentially charged ice, allowing for the development of strong electric fields and lightning. With this physical understanding, observed lightning properties, such as total (i.e., intracloud + cloud-to-ground; throughout the manuscript, whether stated explicitly or not, flash rates are based on total lightning.) flash rates, have been used as proxy metrics of intensity in weather and climate studies of deep convective storms on regional-to-global scales [20,21,22,23,24,25] and to inform operational forecasters regarding the potential for severe convective weather and aviation hazards associated with thunderstorms such as turbulence and icing [2,26,27,28,29,30,31,32,33,34]. These severe weather and climate applications of lightning have been facilitated by the ready availability of a wide variety of ground-based and space-based lightning location systems on the mesoscale to global scale [35], including the next-generation series of Geostationary Operational Environmental Satellite (GOES-R) carrying the Geostationary Lightning Mapper (GLM) [36].
Lightning also has the potential for direct impacts as it is a hazard for personnel, infrastructure, aviation and spaceport operations [37,38,39,40]. A direct impact of thunderstorms on atmospheric chemistry and climate is the lightning production and vertical transport of nitrogen oxides (e.g., NO + NO2 = NOX) to the upper troposphere, where a net increase can lead to net production of ozone, which is a powerful greenhouse gas [1,4,41]. A better understanding of the relationships between lightning and convective cloud microphysics and kinematics has the potential to improve the diagnosis and forecasting of these direct lightning impacts. For example, the lightning production of nitrogen oxides (LNOX) has been estimated indirectly in cloud-resolving chemical transport models from calculated kinematic and microphysical fields [42,43,44,45] without the use of existing explicit cloud electrification and lightning physics, which can be computationally expensive. In contrast to studies using explicit cloud electrification and lightning flash rate [46,47], the flash rate used for LNOX production in these chemical transport models is estimated from flash rate parameterization schemes, which utilize model-predicted storm kinematic and microphysical quantities and are often based on radar-observed relationships [8,9,10,13,14,25,48,49]. Similarly, the initiation, cessation, and frequency of lightning have been forecasted using flash rate parameterizations with model-predicted [50,51] or radar-observed [52,53,54,55] kinematic and microphysical parameters as inputs.
1.1. Background
A careful evaluation of the relationships between total lightning flash rate and radar inferred kinematic and microphysical parameters, including their variability and error, has the potential to improve severe storm nowcasting, the forecasting of aviation hazards associated with storms, climate change studies, lightning hazard forecasting, and lightning impact studies in atmospheric chemistry and climate. To that end, dual-Doppler and polarimetric radar and lightning observations of 11 thunderstorms from Alabama and Colorado [13,14] were used to identify useful and regionally invariant linear relationships between lightning flash rate and several kinematic and microphysical parameters in the mixed-phase zone (or between about −5 °C and −40 °C) of thunderstorms, including graupel (or precipitation ice) mass, ice mass flux product, convective (>5 m s−1) updraft volume and maximum updraft velocity. These detailed linear relationships were consistent with earlier studies that also found a high Pearson correlation coefficient between precipitation ice mass and flash rate using different observational approaches on the mesoscale [9] to global scale [10].
A more recent study [48] using similar dual-Doppler and polarimetric radar observations of 11 different Colorado thunderstorms updated and improved the performance of the linear relationships between flash rate and storm parameters such as maximum updraft velocity, updraft volume >5 m s−1, precipitation ice mass, and ice mass flux product. Based on earlier work [8,25], the more recent study [48] also explored the relationship between flash rate and two other storm parameters, namely graupel echo volume and 35 dBZ echo volume in the mixed phase zone. They [48] found that 35 dBZ echo volume had the lowest error for estimating flash rate, although graupel echo volume and precipitation ice mass performed nearly as well. A recent modeling study [47] has also concluded that graupel mass is a good estimator of the flash rate. In contrast to an earlier study [14], the more recent observational study [48] concluded that linear flash rate parameterizations based on maximum updraft and updraft volumes (>5 m s−1 and >10 m s−1) in the mixed-phase zone had lower coefficients of determination and higher error than similar linear relations based on graupel echo volume, precipitation ice mass and 35 dBZ echo volume. Absence of a strong correlation between flash rate and maximum updraft velocity has also been noted in numerical modeling studies [11,47]. In more recent observational work [48], it was also determined that some of the linear relations from the earlier observational research [13,14] to estimate flash rate from precipitation ice mass and updraft volume resulted in large root mean square error, large negative bias error and frequent unphysical negative flash rates when applied to the new sample of Colorado storms, in part because of negative y-intercepts in the formulation of the earlier linear relationships. A recent modeling study [47] also raised the issue of the interpretation, suitability and performance of having a non-zero y-intercept, including positive and negative, in estimating flash rate as a dependent variable from a linear relationship based on a microphysical or kinematic storm parameter as the independent variable. For example, it was determined that the linear relation to estimate flash rate from convective (>10 m s−1) updraft volume was not satisfactory in their modeling study [47] because of high false alarms and an over-estimate of the lightning activity (i.e., positive bias error), likely associated with a large positive y-intercept (i.e., significant flash rates are estimated even when updraft volume is very small or zero). The optimal form of the linear relationship between flash rate and storm parameter is clearly an open research question.
1.2. Motivation and Objectives
While prior radar studies have clearly established the potential for and explored the performance of various lightning flash rate parameterization schemes in a variety of storm types and regions, they have developed and assessed their flash rate relations on a relatively small sample of storms (e.g., 11 Colorado storms total, including seven with dual-Doppler coverage, in a recent study [48] and 11 total storms, including five Alabama and six Colorado storms, in an earlier work [13,14]) in large part due to the difficulty of obtaining high-quality multi-Doppler radar datasets. As discussed in Section 2, this study takes advantage of six years of consistent dual-Doppler and polarimetric radar storm sampling in Alabama and adapts the tested methods developed in earlier studies [13,14] to analyze a much larger sample of 515 radar volumes of 33 independent storms on 17 different days, representing a three- to five-times increase in utilized radar volumes compared to earlier [13,14] and more recent [48] radar studies. Although entirely from Alabama, the large radar and lightning datasets in this study include a wider variety of storm types and intensities that more generally reflect the range of characteristics of storms in the Alabama region, including not only high-flash-rate severe storms but a significant number of ordinary (i.e., typical) low-flash-rate storms.
These unique and comprehensive datasets allow this study to extend prior results that were based on limited samples, explore unresolved issues recently raised and examine new important issues, such as: (1) the apparent lack of generality of lightning flash rate parameterization schemes based on a single storm parameter (e.g., mixed-phase graupel volume, graupel mass, 35 dBZ echo volume, updraft volume and maximum updraft velocity) through direct assessment and comparison of our results with prior radar studies [13,14,48], (2) the impact of the form of the linear relationship (i.e., linear equation with and without a y-intercept) on the error performance of the various flash rate parameterization schemes derived in this and prior studies, and (3) the expected estimation error associated with the overall flash rate parameterization schemes derived in this study when applied to individual storms evaluated as a function of the average storm flash rate. For overall assessment, prior radar-based flash rate parameterization studies have either only reported the correlation coefficient (or coefficient of determination) of the regressed linear relationships [13,14] or also reported the root mean square error (RMSE) of the relationships over the entire sample [48]. In order to better quantify the expected performance of these single-parameter flash rate parameterization schemes in individual storms, particularly across a range of flash rates, this study computes the mean bias error (MBE) and RMSE of each relationship not only for the entire sample overall but also, for individual storms as a function of storm averaged flash rate. The distribution of error as a function of storm averaged flash rate provides understanding of the likely expected error in individual storms and thus has important potential implications for the use of these relationships in severe and high-impact weather nowcasting, lightning hazard forecasting and LNOX studies.
The datasets and methods to estimate lightning flash rates and radar inferred kinematic and microphysical parameters, the methods to derive linear relationships between them and assess their error are described in Section 2. Results are presented in Section 3. In Section 4, limitations and error sources of the current and prior related work are discussed and future potential research directions are identified. The research findings are summarized and conclusions are presented in Section 5.
2. Datasets and Methods
In this section, the lightning and radar instrumentation, datasets and methods are presented. One of the motivations behind this study was to take advantage of the availability of a large sample of storms (Table 1) that have been largely processed, analyzed and presented in prior studies using similar instruments and methods [31,32,56,57]. Although the datasets and methods of this study overlap with prior studies, their scientific objectives are different. One prior study [56] analyzed a single case study for the purpose of relating radar and lightning properties. The other studies analyzed either a few storms in detail [31] or the statistics of a large sample of storms [32] in order to investigate the kinematic and microphysical controls of lightning jumps, which are a nowcasting signature of storm intensity and severity. Nearly all of the storms (i.e., 32 of the 33) analyzed herein were first analyzed in the prior studies [31,32,56,57], highlighting an advantage that the datasets and methods have been well vetted. These studies built upon even earlier work [13,14], which first developed the techniques and pioneered the use of the Alabama radar and lightning networks (Figure 1). This study extends the science of the earlier work [13,14] by utilizing the specific storm datasets and processing methods of the more recent studies [31,32,56,57].

Table 1.
Overview of Alabama storm properties, including date, cell number (#), analysis period (hh: mm UTC), storm type, severity type, storm life cycle phase(s) represented (G = growth, M = mature, D = decay), sample size (or number of radar volumes) and maximum lightning flash rate. The maximum Enhanced Fujita (EF) tornado damage scale is shown as part of the severity type.
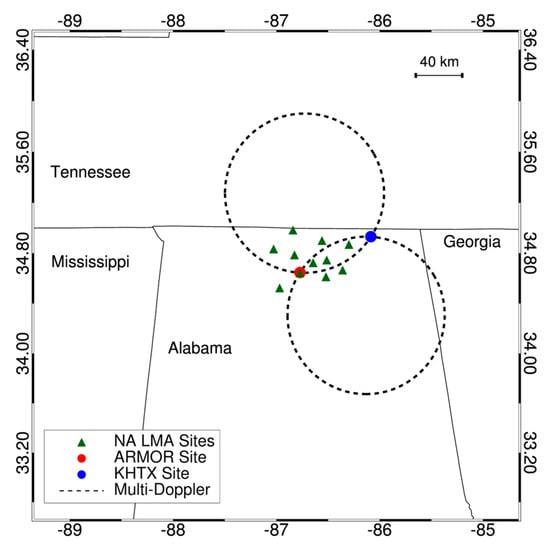
Figure 1.
Map of the radar and lightning networks centered over Northern Alabama and used in this study. The solid red (blue) circle represents the ARMOR (KHTX) radar at KHSV (Hytop, AL, USA). The green triangles depict the sensor locations of the NALMA. The black, dashed circles represent the ARMOR-KHTX dual-Doppler regions as defined by the 30° beam crossing angle. A distance scale is shown in the upper-right and latitude and longitude values are provided along the outside. Adapted from [56]. © Copyright [2015] AMS.
For this study, the storm sample includes 515 radar volumes of 33 storms on 17 different days (Table 1). The storm sample is diverse, representing a wide variety of storm morphology, intensity, severity and flash rate regimes, including 22 multicellular storms (7 severe and 15 non-severe), 9 supercells, of which 5 were tornadic and 4 were low-topped with low flash rates [32,57], and 2 cells within quasi-linear convective systems (QLCS’s). Storm maximum flash rates varied from 1.1 min−1 to 101.7 min−1. To be included in the sample, the storm needed to pass within the dual-Doppler lobes (Figure 1) so that dual-Doppler radar analysis could be conducted to estimate updraft vertical velocities during at least the mature phase of the storm, if not also other phases (e.g., growth, decay), for at least 5 radar volumes (or for ≥20–25 min). Additional constraints for the inclusion of storms into the sample are discussed in the sections on lightning (Section 2.1) and radar (Section 2.2) data and methods below.
2.1. Lightning
Total lightning information is obtained from the North Alabama Lightning Mapping Array (NALMA) [58,59], which is owned and operated by NASA’s Marshall Space Flight Center (MSFC) and based on the design by New Mexico Tech [60]. NALMA consists of 11 sensors operating at Very High Frequency (VHF) between 76 and 82 MHz and is centered on the National Space Science and Technology Center on the campus of the University of Alabama in Huntsville (UAH) (34.72° N, 86.64° W; Figure 1). VHF radiation source points are associated with electrical breakdown of lightning flashes in three dimensions. NALMA sensors sample the peak power of VHF radiation sources in 80 µs windows, providing three-dimensional lightning mapping via a time-of-arrival (TOA) technique. Typical horizontal and vertical spatial location errors of VHF sources are about 50 m to 500 m within a 100 km range from the network center [58]. All storms analyzed in this study were within about 100 km of NALMA’s center. VHF sources are combined into corresponding lightning flashes using a clustering algorithm designed specifically for NALMA [50]. The algorithm requires that all VHF sources in a flash satisfy a 0.3 s temporal clustering criterion and an azimuth- and range-dependent spatial separation criterion. To further reduce the impact of noise, only lightning flashes with ≥10 VHF sources were used [31,32,56,57]. Flashes are associated with a storm if they initiate within the radar footprint of the identified and tracked storm discussed in Section 2.2.4. Storm average total lightning flash rates (min−1) are computed by adding the number of associated NALMA flashes during the radar volume scan time and dividing by the radar volume scan time. As such, lightning flash rates are an average storm flash rate over about 4–6 min (Section 2.2).
2.2. Radar
In order to develop relationships between lightning flash rate and radar-inferred kinematic and microphysical storm parameters at a storm level, it is necessary to first process, quality control and grid the Doppler and polarimetric radar data (Section 2.2.1), to conduct dual-Doppler analysis to infer maximum updraft velocities and convective updraft volumes (Section 2.2.2), to implement a polarimetric-based particle identification (PID) scheme to infer graupel echo volume and graupel mass (Section 2.2.3), and to identify storm footprint boundaries to compute and associate flash rate and radar-inferred storm parameters (Section 2.2.4).
The radars utilized in this study include the University of Alabama in Huntsville (UAH) Advanced Radar for Meteorological and Operational Research (ARMOR) and the NOAA National Weather Service’s (NWS) KHTX radar. ARMOR is a polarimetric weather radar located at the Huntsville International Airport (KHSV) and operates at a wavelength of 5.5 cm (C-band) [61]. ARMOR’s beamwidth is 1° and it implements dual-polarization (i.e., H: horizontal and V: vertical) capability using simultaneous transmit and receive (STAR) mode [62]. During storms, ARMOR can be operated in sector or 360° surveillance volume mode at operator-optimized elevation angles to efficiently sample a complete storm volume in 3–6 min. The KHTX radar is located in Hytop, Alabama about 70 km east–northeast of KHSV and ARMOR (Figure 1). KHTX is a Doppler S-band radar with a 1° beamwidth. It operates in continuous 360° surveillance volume coverage patterns that use fixed elevation angles and repeat every 4–6 min [63]. KHTX was upgraded to polarimetric capability in January 2012 after the overwhelming majority of storm days (Table 1). For consistency, this study relies exclusively on ARMOR’s polarimetric measurements to implement PID and make microphysical inferences (Section 2.2.3) similar to many past studies using ARMOR [13,31,32,56,57]. The effective radar reflectivity factor at horizontal polarization (Zh) and Doppler radial velocity (Vr) are measured by both ARMOR and KHTX. ARMOR also measures several polarimetric radar variables, including the differential reflectivity (Zdr), the co-polar correlation coefficient (ρhv) and the differential phase (ϕdp). During data processing, additional radar variables and products are also estimated and utilized as described in Section 2.2.1, Section 2.2.2, Section 2.2.3 and Section 2.2.4.
2.2.1. Processing, Quality Control and Gridding
Following past studies [31,32,56,57], ARMOR C-band radar data are corrected for propagation effects, namely attenuation and differential attenuation, using a ϕdp-based, self-consistent method with constraints [64]. The ARMOR-specific differential phase (Kdp) is estimated from the range derivative of the filtered or smoothed ϕdp [65]. The relative calibration of Zdr is maintained utilizing vertical pointing scans of light rain and the absolute calibration of Zh is maintained using the self-consistency between Zh, Zdr and Kdp in rain [66]. Aliased Vr data are manually unfolded using National Center for Atmospheric Research’s (NCAR) SOLO, version 2 or 3 [67]. Other radar artifacts such as ground clutter, sidelobe and second-trip echoes are also manually removed with SOLO. Using NCAR REORDER software [68], ARMOR and KHTX radar data are interpolated onto a Cartesian grid centered on ARMOR (34.646° N, 86.771° W). Given the 70 km baseline between ARMOR and KHTX, dual-Doppler radar analysis is limited to ranges <86 km from each radar in order to optimize dual-Doppler accuracy, resolution and coverage area [31,32,69]. For consistency and data quality purposes, polarimetric PID and other radar analyses are also limited to the same maximum range from each radar. Given the <1.5 km radar resolution implied by a 1° beamwidth at radar ranges <86 km, a grid resolution of 1 km is implemented in the horizontal and vertical directions. The radar data are interpolated with a Cressman weighting scheme [70] and a 1 km radius of influence in the horizontal and vertical.
2.2.2. Dual-Doppler Analysis
The dual-Doppler radar analysis methods and assumptions in this study followed the general approach refined in prior studies [13,14,31,32,56,57]. More details on the specific methods and assumptions used in this study can be found in recent radar studies of the kinematic and microphysical significance of lightning jumps [31,32]. For completeness, a summary of key points is provided herein.
To be considered for dual-Doppler analysis, the radar data have to meet the following criteria: (1) storms occur within the dual-Doppler lobes (Figure 1) at ranges <86 km from both ARMOR and KHTX (<1.5 km radar resolution) for at least 5 radar volumes (about 20–25 min) including the mature phase, (2) the ARMOR and KHTX radar volume start times are within 2 min of each other to minimize updraft retrieval errors associated with spatial offsets in storm location during a finite radar sample time, and 3) the storm echo top (e.g., about the 0–10 dBZ echo surface) and upper-level divergence are well sampled by both radars to reduce updraft retrieval errors.
After processing, quality control and gridding of ARMOR and KHTX radar data, NCAR’s Custom Editing and Display of Reduced Information in Cartesian Space (CEDRIC) [71,72] is used to merge radar data sets and implement multi-Doppler synthesis. CEDRIC implements a storm motion correction to minimize remaining spatial offsets of the radar data. Storm motion is determined from subjective analysis and objective storm tracking explained below (Section 2.2.4). The Vr measurements from the two radars and assumed hydrometeor fall speed relationships [31] are used to solve a set of linear equations to retrieve the horizontal (u, v) velocities within some prescribed error dictated by ARMOR and KTHX measurement error in Vr and a beam-crossing angle requirement (30° as depicted in Figure 1) [72,73,74]. Vertical velocity is estimated by integrating the anelastic mass continuity equation using the retrieved horizontal winds (u, v) and assumed vertical velocity boundary conditions of 0 m s−1 at the prescribed upper and lower boundaries. As in other studies [14,31,32,56,57], the variational integration method [75] is used to mitigate vertical velocity retrieval errors associated with errors in measured divergence and fall speeds [76,77].
Following prior studies [13,14,48] for the purpose of comparison, maximum updraft velocity (m s−1) and convective updraft volumes (km3) meeting specific minimum vertical velocity thresholds (>5 m s−1 and >10 m s−1) are estimated in the mixed-phase region defined earlier (i.e., heights corresponding to environmental temperatures between −5 °C and −40 °C) because this is where the majority of charge separation and lightning initiation occurs, as discussed in Section 1. Environmental temperature data are obtained from the closest NOAA NWS representative atmospheric sounding to the dual-Doppler analysis domain in Figure 1, which is usually from Birmingham, Alabama (BMX; 33.16° N, 86.76° W), Nashville, Tennessee (BNA; 36.25° N, 86.57° W) or an average of both. Storm volumes are computed by counting the number of grid boxes that satisfy the convective updraft threshold in the mixed-phase region within the bounds of the two-dimensional footprint of the defined storm feature (Section 2.2.4) and multiplying that grid count by the grid volume, which is 1 km3 in this study.
2.2.3. Polarimetric Particle Identification
NCAR’s fuzzy logic based polarimetric PID algorithm [78] as modified for C-band [13] is implemented with quality-controlled ARMOR observations of Zh, Zdr, Kdp, and ρhv and environmental temperature profile data as inputs. The source of the temperature profile data is described in Section 2.2.2. Using REORDER, the NCAR PID output is interpolated to a Cartesian grid with 1 km horizontal and vertical resolution using a nearest-neighbor weighting scheme and 1 km radii of influence. For this study, the “graupel/small hail” category was used exclusively to represent graupel, which is a primary and necessary ingredient for significant cloud electrification and lightning production, as reviewed in Section 1. As discussed in earlier studies [13,31], including other PID categories with rimed precipitation ice, such as “graupel/rain”, “large hail” or “rain/hail” in the mixed-phase region does not improve the correlation between precipitation ice and lightning. Graupel/small hail also tends to dominate the rimed precipitation ice echo volume and mass in the mixed-phase region [13]. Since a grid box volume is 1 km3, the graupel volume is equal to the number of grid boxes with a PID of “graupel/small hail” in the mixed-phase region (−5 °C to −40 °C) within the boundaries of the two-dimensional storm footprint (Section 2.2.4). Following earlier studies [13,31,32], the graupel ice water content (IWC, g m−3) for each grid box is estimated from a radar reflectivity-IWC (z-IWC) relationship for graupel [79] (p. 3510, their Equation (5)) using the ARMOR Zh (after accounting for dielectric differences between z and Zh [80]) in each grid box characterized as “graupel/small hail” by the NCAR PID. The graupel mass used to generate a relationship with lightning flash rate in this study is calculated by summing the product of grid box graupel IWC (converted to kg km−3) and grid volume (1 km3) in all grid boxes in the mixed-phase region within the boundaries of the two-dimensional storm footprint. More succinctly, the graupel mass of interest is a mixed-phase region integrated storm quantity in kg or shown in 106 kg for convenience.
2.2.4. Storm Identification and Tracking
Following earlier studies [27,29,31,32], objective storm identification and tracking is implemented using the Thunderstorm, Identification, Tracking, Analysis and Nowcasting (TITAN) algorithm [81]. Gridded radar reflectivity features (e.g., 35 dBZ) at the height of −10 °C, which correlate well with lightning [82], are identified and tracked in time. As described in Section 2.2.2, environmental temperature data are taken from representative soundings. TITAN provides the center location and major axis of an assumed ellipse encompassing the storm of interest for every volume when a reflectivity feature is observed at the grid height closest to −10 °C. The two-dimensional storm position and size information from TITAN are then used to compute storm lightning flash rates and mixed-phase-region (−5 °C to −40 °C) storm quantities defined earlier, including maximum updraft, convective updraft >5 m s−1 and >10 m s−1, graupel volume and graupel mass. One additional storm quantity computed is the 35 dBZ echo volume (km3) in the mixed-phase region, which is well correlated with lightning flash rates [25,48]. Because the grid box volume is 1 km3, the 35 dBZ echo volume is equivalent to the number of grid boxes characterized by Zh > 35 dBZ in the mixed-phase region within the two-dimensional storm boundary. As noted in prior studies [25,48,52,53], radar reflectivity in the mixed-phase region is sensitive to the presence of precipitation-sized particles, most likely, large rimed ice. Although not as accurate as the output from the polarimetric PID, the 35 dBZ echo volume is an approximate proxy for the presence of graupel and hail and can, therefore, be grouped with the PID-based microphysical parameters defined earlier.
In a few instances of multicellular storms or storms within a QLCS, TITAN objective tracking is not sufficiently accurate due to storm drop outs (i.e., lost track), merging and/or splitting of storms. In those instances, TITAN is supplemented by subjective storm identification and tracking using an expert radar scientist in the loop to draw a subjective boundary around similar reflectivity features of interest at −10 °C or to manually merge a dropped track if the expert assesses the TITAN identified storms to be the same. Although an infrequent option in about 12% of storms in this study, a subjective two-dimensional storm boundary is used in place of TITAN when necessary to improve accuracy.
2.3. Linear Regression and Error Assessment
Linear relationships are derived between the total lightning flash rates (Section 2.1) as the dependent or predicted variable and the various storm kinematic and microphysical properties defined in Section 2.2 as the independent or predictor variable. Because there is some uncertainty over whether it is better to utilize a non-zero y-intercept as is typical or to use a zero y-intercept (i.e., force the line through the origin) [47,48], both are accomplished in this study. The method of ordinary least squares (OLS) regression assumes that there is constant variance in the errors (i.e., homoscedasticity). In this study, the assumption of constant variance in the errors implicit in OLS regression is routinely and clearly violated (i.e., heteroscedasticity). To account for the condition of heteroscedasticity, the method of weighted least squares (WLS) linear regression is implemented [83]. The utilized weights are inversely proportional to the estimated error variance. Although they are not generally known, the weights can be estimated. Although not shown, a plot of residuals against the predictor exhibits a megaphone shape for all predictor equations. In this situation, it is possible to regress the absolute values of the residuals against the predictor. The resulting fitted values of this regression are estimates of the square root of the error variance (i.e., or standard deviation) from which the weights can be calculated and the WLS regression implemented [83].
Error assessment of the regressed linear equations to predict flash rate from storm kinematic and microphysical parameters in this study utilizes calculations of the RMSE and the MBE [84] with units of min−1. The normalized RMSE (NRMSE) and normalized MBE (NMBE) in percent (%) are also calculated. For direct comparison with a recent study [48], the NRMSE (NMBE) is defined as the RMSE (MBE) divided by the range of flash rates (i.e., maximum–minimum) in the sample being assessed. Normalizing error by the range is a standard statistical practice [85] and helps to account for the wide range of flash rates in the overall and individual storm samples. Note that in Section 3.2, the normalization is by the range of flash rate in the overall data set, including all 33 storms. In Section 3.3, the error of using relationships derived from the overall data set when applied to individual storms is being assessed as a function of storm average flash rate. In this case, the normalization in Section 3.3 is by the range of flash rate in individual storms, which varies. These individual storm errors provide insight into the likely lower bound of expected error when the relationships from this study are applied to other individual storms with similar flash rates. These errors are likely a lower bound as other factors such as regional variability of storm parameters and lightning behavior, radar estimation error, and model conceptual error may influence the outcomes of these relationships when applied to other situations, as discussed in Section 4.
3. Results
In Section 3.1, a single severe storm in Alabama is briefly analyzed to demonstrate the strong physical and statistical correlations between lightning and various kinematic and microphysical properties (i.e., maximum updraft velocity, convective updraft volumes >5 m s−1 and >10 m s−1, 35 dBZ echo volume, graupel mass and graupel volume) in the mixed-phase zone on the individual storm scale. Linear relationships between lightning and radar-inferred kinematic and microphysical parameters are then derived in Section 3.2 for the entire storm dataset (i.e., encompassing all Alabama storms in Table 1) using a zero y-intercept (Section 3.2.1) and a non-zero y-intercept (Section 3.2.2), assessed for overall performance and intercompared with each other and prior studies. Finally, error associated with the overall flash rate parameterization schemes derived in this study when applied to individual storms are evaluated as a function of the average storm flash rate in Section 3.3.
3.1. Example of Lightning, Kinematic and Microphysical Properties in a Severe QLCS
To demonstrate the close relationship between lightning flash rate and other storm parameters, an example time series from a severe storm embedded in a larger QLCS that occurred in Northern Alabama on 12 March 2010 is shown in Figure 2. The storm produced severe hail up to 45 mm in diameter, strong downbursts and convective straight-line wind gusts. It was sampled in the observational domain for a little over an hour during the growth and mature stages (Table 1). During this period, the average flash rate was 36 min−1 and the maximum flash rate was 78 min−1. With the exception of the maximum updraft, it can be seen that the flash rate in Figure 2 evolves in a similar manner as the other storm parameters, including rapid increases around 1458–1509 UTC, a steadier period of growth until 1533 UTC, then more rapid increases until a maximum in storm intensity around 1545–1556 UTC and the beginning of a weakening period from peak maturity before it moved out of the analysis domain.
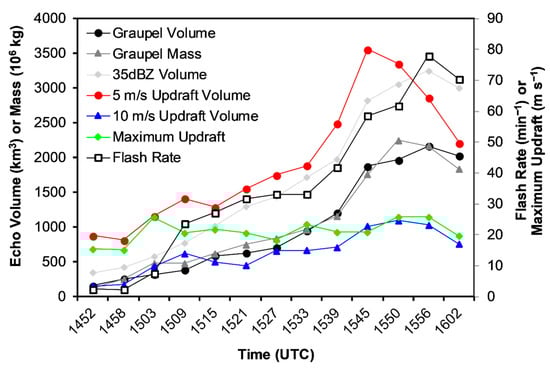
Figure 2.
Temporal evolution of graupel volume (km3), graupel mass (106 kg), 35 dBZ echo volume (km3), convective updraft volume >5 m s−1 and >10 m s−1 (km3), maximum updraft velocity (m s−1) and lightning flash rate (min−1) for a severe storm embedded in a QLCS traversing the analysis domain over Northern Alabama (Figure 1) on 12 March 2010.
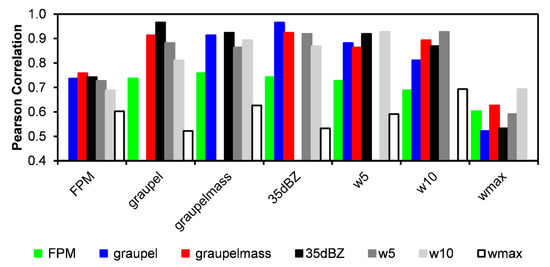
Pearson correlation coefficients (ρ) between the time series evolution of lightning flash rate, kinematic parameters (maximum updraft and convective updraft volume >5 m s−1 and >10 m s−1) and microphysical parameters (graupel volume, graupel mass and 35 dBZ echo volume) are provided in Figure 3. The lightning flash rate is highly correlated to most storm parameters, including especially the microphysical parameters (ρ = 0.96 to 0.98) and, to a slightly lesser extent, the updraft volumes (ρ = 0.87 to 0.90). Flash rate is least correlated to the maximum updraft (ρ = 0.50) in this particular severe storm. These correlations between flash rate and radar kinematic and microphysical parameters are generally similar to what has been found in prior studies of individual storms [8,9] and small samples of storms from similar regions [13,14,48]. The correlation between maximum flash rate and maximum updraft in this storm is lower than found in one study [13] but agrees more closely with other radar [48] and numerical cloud modeling [11,47] studies. It is worth noting that most kinematic (other than maximum updraft) and microphysical parameters are also well correlated to each other (ρ = 0.89 to 0.99), as noted in an earlier study [14]. As expected, the radar parameter with the highest correlation to maximum updraft is the updraft volume > 10 m s−1 and the second highest is to updraft volume >5 m s−1, although all storm parameter correlations with maximum updraft are ≤0.66. The moderate-to-high correlations of most radar kinematic and microphysical parameters with each other and with flash rate in Figure 3 suggest that there should be little difference in the expected performance of various flash rate parameterization schemes with the possible exception of maximum updraft for this particular severe storm.
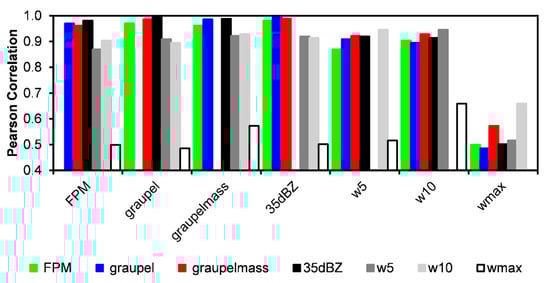
Figure 3.
Pearson correlation coefficients between the time series of storm parameters shown in Figure 2 for a severe storm on 12 March 2010, including lightning flash rate (FPM, min−1) graupel volume (graupel, km3), graupel mass (106 kg), 35 dBZ echo volume (km3), convective updraft volume >5 m s−1 (w5, km3), convective updraft volume >10 m s−1 (w10, km3), and maximum updraft (m s−1).
To explore the suggestion that most flash rate parameterization schemes should perform equally as well for the severe storm on 12 March 2010, scatterplots of flash rate versus radar parameters and the associated best fit lines are provided in Figure 4. The microphysical parameters such as graupel volume, graupel mass and 35 dBZ echo volume all perform nearly equally as well with very low scatter, an overwhelming majority of the variance of the flash rate explained (R2 = 0.92 to 0.96) and very low implied flash rate retrieval error (NRMSE = 6% to 9%). Although their performance is not quite as good as the microphysical parameters, the updraft volume >5 m s−1 and >10 m s−1 both provide good results with low-to-moderate scatter, high explained variance (R2 = 0.76 to 0.82) and low expected error (NRMSE = 14% to 16%). As expected, the scatter between flash rate and maximum updraft for this storm is large, the explained variance is fairly low (R2 = 0.25) and the expected error is higher (NRMSE = 28%) than the other parameters. For this individual severe storm at least, the performance of the microphysical-based parameters is the best and they are all fairly similar, although a 35 dBZ echo volume is slightly better than graupel volume and graupel mass, which is consistent with a prior study [48]. These flash rate parameterization results are for one severe storm only and are customized to the storm of interest. As such, these outcomes should be considered ideal and not necessarily general in nature.
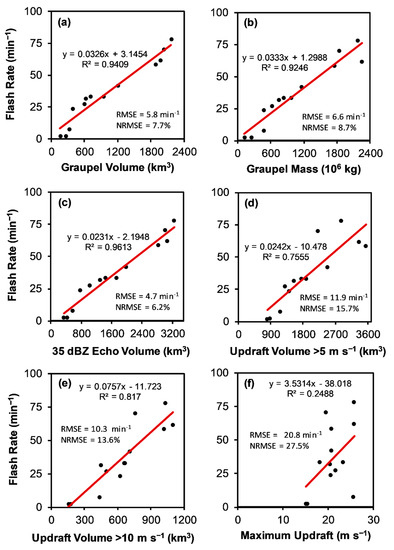
Figure 4.
Scatter plot of lightning flash rate versus radar-inferred storm parameters shown in Figure 2 for a severe storm on 12 March 2010, including (a) graupel volume (km3), (b) graupel mass (106 kg), (c) 35 dBZ echo volume (km3), (d) updraft volume >5 m s−1 (km3), (e) updraft volume >10 m s−1 (km3) and (f) maximum updraft (m s−1). The weighted least squares (WLS) linear regression is depicted as a solid red line and the resulting equation, where y = flash rate and x = radar parameter, is given for each scatterplot. The coefficient of determination (R2), the root mean square error (RMSE) and the normalized RMSE (NRMSE) are provided for each line.
3.2. Linear Relationships and Overall Performance
In order to provide more useful and general results, the analysis of a single severe storm in Section 3.1 is repeated and expanded here on a dataset that combines the entire 33 storm (515 radar volume) sample, which is summarized in Table 1. To characterize the thunderstorm dataset further, histograms of mean and maximum flash rate are provided in Figure 5. The storms exhibit a wide range of flash rates with storm maximum flash rates ranging from 1.1 min−1 to 101.7 min−1. The mode or most common storm has mean and maximum flash rates ≤10 min−1, which is not uncommon for non-severe storms or low-topped supercells in Alabama. In fact, half of the Alabama storm sample has a storm average flash rate <10 min−1 and a storm maximum flash rate <21 min−1. This distribution of flash rates is typical for Alabama but lower than Colorado’s high mean flash rates [13,14], especially compared to a recent Colorado data sample dominated by high flash rate storms [48].
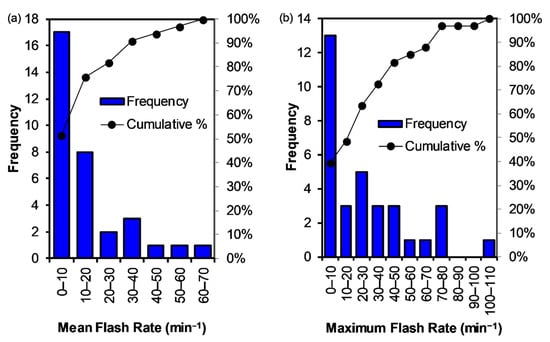
Figure 5.
Frequency and cumulative (%) histograms of storm (a) mean and (b) maximum flash rate (min−1) for all 33 storms in this study (Table 1).
Because the severe storm analyzed in Section 3.1 has mean (91st percentile) and maximum (97th percentile) flash rates that are much larger than most storms in the overall study sample, it is important to revisit the correlation between lightning, kinematic and microphysical parameters as revealed by ρ of the overall time series data (Figure 6) before moving onto regressing linear relationships between them. Comparing Figure 3 and Figure 6, there are some similarities and differences. Similar to the QLCS severe storm, the microphysical parameters are somewhat better correlated to each other than to kinematic parameters and vice-versa in the overall data set, although there are a few minor exceptions. With the exception of maximum updraft, the values of ρ between lightning flash rate and the various radar-inferred kinematic and microphysical parameters are lower in the overall data set (0.69–0.76) than the severe QLCS storm (0.87–0.98). Interestingly, the ρ between lightning and maximum updraft is slightly higher in the overall data set (0.60) than the severe QLCS storm (0.50) but is still the lowest of all the storm-parameter–lightning relationships. The ρ between overall flash rates and storm parameters in Figure 6 are generally lower compared to prior studies of single storms [8,9], including the Alabama severe QLCS in Figure 3, and small samples of storms [13,14,48]. Although the microphysical parameters again have higher correlation to flash rate than the kinematic parameters in the overall data set, the differences are less than for the severe QLCS storm. Based on Figure 6, the error performance metrics of the various flash rate parameterizations derived from the overall data set are likely to be fairly similar with the possible exception of maximum updraft and updraft volume > 10 m s−1, which are likely to be slightly worse. This suggestion will be explored in more detail in the following sub-sections along with an overall assessment of lightning–radar relationships and a comparison to prior studies.
3.2.1. Overall Dataset with Zero Y-intercept
Using the datasets and methods outlined in Section 2, linear equations estimating lightning flash rate from various radar-inferred microphysical and kinematic parameters are regressed with a zero y-intercept and provided in Table 2 using data from all 33 storms and 515 samples (Table 1). It is worth noting that the coefficient of determination (R2) is purposefully omitted from Table 2 since an R2 for a regression solution forced through the origin does not have the same physical interpretation (i.e., % variance explained) and cannot be directly compared to an R2 when the regression solution is not forced through the origin. Scatterplots of lightning flash rates versus radar parameters for all thunderstorms are shown in Figure 7 with the corresponding best fit lines from Table 2. The scatter between flash rate and radar-inferred microphysical and kinematic parameters is clearly much larger for the full sample of 33 Alabama storms (Figure 7), including low and high flash rate storms of varying types and severity, than for one high flash rate severe storm (Figure 4). In particular, the scatter in Figure 7 is much larger at low flash rates (i.e., <10 min−1) than it is at moderate-to-high rates. A similar trend of large scatter in lightning–radar relations at flash rates <10 min−1 can be gleaned from the smaller samples of earlier studies [13,14,48], although the fraction of low flash rates is much larger in this study. As noted earlier, a little over half (17) of the 33 storms in this study have a storm average flash rate <10 min−1 (Figure 5). In fact, the median (mean) lightning flash rate for all 515 analyzed samples in this study is 4.6 min−1 (12.5 min−1) and fully 63% of the flash rates (i.e., during a radar sample volume time) are <10 min−1. These low flash rates occur in a variety of storm types, including non-severe multicellular storms and low-topped supercells, and are very common in Alabama. The amount of scatter qualitatively evident in the lightning flash rate versus radar parameters in Figure 7 is similar for each of the different microphysical and kinematic properties evaluated, including the increased scatter at low flash rates. Quantitative assessment of estimation error in Table 3 confirms that RMSE (NRMSE) is similar for the microphysical parameters and most kinematic parameters, ranging from 13–14 min−1 (13–14%) for the linear equations in Table 2 and Figure 7. For updraft volume >10 m s−1, RMSE (NRMSE) is larger at 18 min−1 (17%). Mean bias errors (Table 3) for the relations in Table 2 are small, ranging from −0.9% to 0.8%, which is to be expected since the lines are derived using WLS linear regression on the Alabama data in Figure 7.
Table 2.
Linear equations for estimating lightning flash rate (f) from dual-polarization and dual-Doppler radar-inferred microphysical and kinematic properties in the mixed-phase zone (−5 °C to −40 °C) of a large sample of Alabama thunderstorms (i.e., 515 radar volumes of 33 thunderstorms on 17 different days, as summarized in Table 1). All regressed linear equations are forced to have a zero y-intercept (i.e., are forced through the origin).
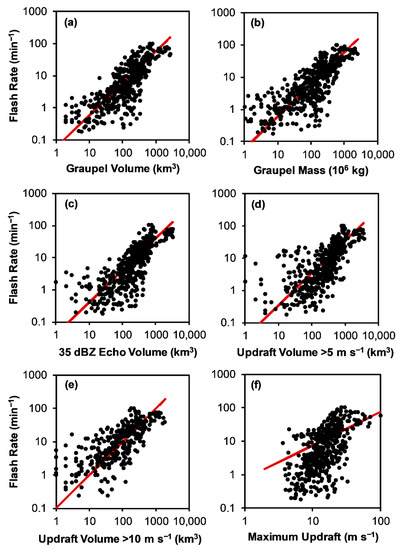
Figure 7.
Same as Figure 4 except the flash rate versus radar parameter scatterplots are for data encompassing all 33 storms in this study (Table 1). For each parameter, the linear equation (Table 2) that is forced through the origin (i.e., with zero y-intercept) is depicted as a solid red line. (a) graupel volume (km3), (b) graupel mass (106 kg), (c) 35 dBZ echo volume (km3), (d) updraft volume >5 m s−1 (km3), (e) updraft volume >10 m s−1 (km3) and (f) maximum updraft (m s−1).
Table 3.
Summary of the estimation error associated with various lightning flash rate parameterization equations when applied to Alabama storms in Table 1. The source, including reference, and type of each flash rate parameterization equation are provided. Performance metrics for the estimation of flash rate from these equations include the mean bias error (MBE, min−1), the normalized MBE (NMBE, %), the root mean square error (RMSE, min−1) and the normalized RMSE (NRMSE, %). The NMBE and NRMSE are calculated by dividing the MBE and RMSE, respectively, by the range of observed flash rates in the Alabama thunderstorms summarized in Table 1. Note that some equations resulted in non-physical negative flash rates, which are included in error estimation.
When applying flash rate parameterization equations that were derived in earlier studies using smaller Alabama and Colorado [13,14] or Colorado-only [48] observational datasets to the larger sample of independently observed Alabama thunderstorms in this study, the RMSE and MBE increase for all radar parameters (Table 3), sometimes significantly, compared to the new Alabama relations developed in this study. Flash rate parameterization equations derived in prior studies that perform reasonably well with relatively low error when applied to the Alabama dataset herein are based on the graupel volume (NRMSE = 16% and NMBE = 4%) and maximum updraft velocity (NRMSE = 17% and NMBE = 2%) observed in Colorado thunderstorms [48]. Relations from prior studies [13,14,48] based on graupel mass, 35 dBZ echo volume, updraft volume >5 m s−1, and updraft volume >10 m s−1 perform poorly on the Alabama dataset in this study, exhibiting much larger NMBE, NRMSE or both (Table 3).
All of the flash rate parameterization relations derived from Colorado thunderstorms only [48] overestimate flash rates when applied to the Alabama thunderstorms observed in this study. As can be seen in Table 3 and Figure 8, the positive bias (NMBE) and associated scatter error (RMSE) for the Colorado-only relations [48] increase from graupel volume (NMBE = 4% and NRMSE = 16%) to 35 dBZ echo volume (NMBE = 11% and NRMSE = 27%) to graupel mass (NMBE = 14% and NRMSE = 34%) to updraft volume > 5 m s−1 (NMBE = 28% and NRMSE = 55%).
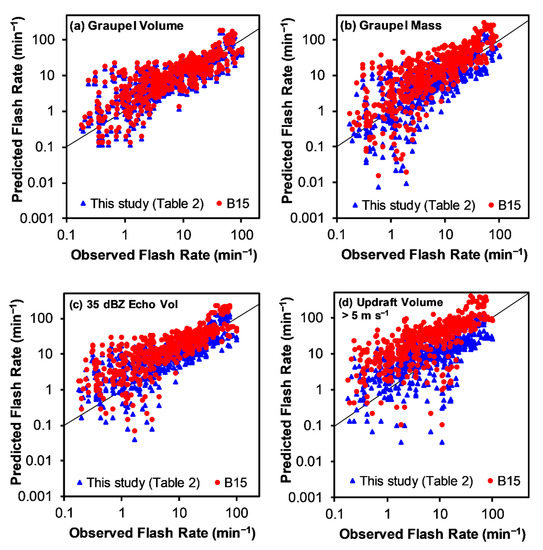
Figure 8.
Same as Figure 7 except flash rate parameterization equations derived in a recent study using lightning and radar data from Colorado thunderstorms [48] are also applied to the Alabama data in this study and plotted with red circles (B15) alongside the same results from this study using relations in Table 2 (blue triangles). Note that only (a) graupel volume (km3), (b) graupel mass (106 kg), (c) 35 dBZ echo volume (km3), and (d) updraft volume > 5 m s−1 (km3) are shown here. The other two parameters are shown in Figure 9 in order to highlight aspects not possible in a log plot.
One possible explanation for the positive bias and increased RMSE in the Colorado-only graupel mass relation for estimating flash rate could be due to differences in methodology with this study because in their study [48], the dependent variable is strictly precipitation ice mass, which may include the ice mass from both graupel and hail. However, in an earlier study of both Alabama and Colorado storms [13], hail contributed little to the overall precipitation ice mass such that it was very similar to graupel mass. Although not shown here, a similar outcome is found in this study, which is why only graupel mass is utilized. It is possible that the thunderstorm sample in the Colorado-only study [48] has more hail that contributed significantly to the precipitation ice mass. However, combining hail and graupel into precipitation ice mass in this study and using the Colorado-only relation [48] would only increase the positive biases in estimated flash rates for Alabama storms.
The fairly large positive bias and NRMSE associated with estimating flash rates from the 35 dBZ echo volume relation is surprising given the findings in the Colorado-only study [48] that found superior performance, including when applied to Alabama storms. One possible explanation for the discrepancy is that the earlier Colorado-only study [48] excludes non-isolated storms, while this study does not exclude them given their ubiquitous presence in Alabama. In this study, any errors in automated cell tracking associated with non-isolated, multicellular storms are manually corrected.
The large positive bias and RMSE in flash rates estimated from the Colorado-only [48] updraft volume > 5 m s−1 and >10 m s−1 (Table 3) would make these relations unsuitable for use in Alabama storms. An additional challenge for flash rate parameterization equations based on updraft volume > 10 m s−1 is that Alabama thunderstorms with non-zero flash rates often have little or no updrafts > 10 m s−1 (Figure 9), which is why the relation from this study in Table 2 with a zero y-intercept predicts low or zero flash rates in these situations, resulting in a negative bias (Table 3). By comparison, the Colorado-only flash rate relation based on updraft volume > 10 m s−1 [48] has a positive y-intercept (of 8.8 min−1), thus predicting a flash rate of 8.8 min−1 even when the >10 m s−1 updraft volume is zero (Figure 9).
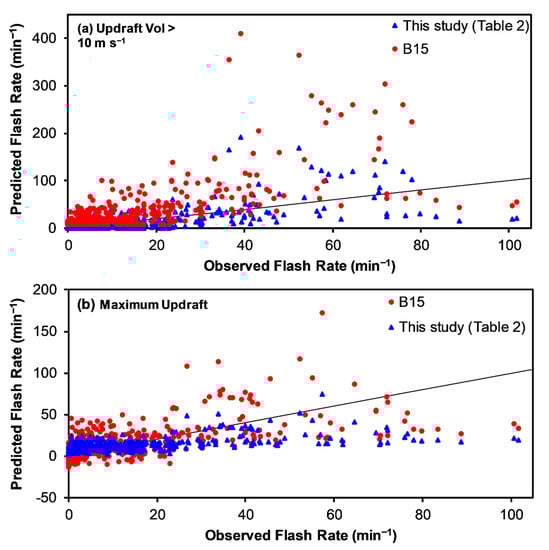
Figure 9.
Similar to Figure 8 except predicted flash rates based on (a) updraft volume > 10 m s−1 (km3) and (b) maximum updraft velocity (m s−1). Linear axes are utilized to emphasize the zero and negative flash rates predicted by the relations, which would not be possible on a log plot.
Conversely, the Colorado-only flash rate relation based on maximum updraft velocity [48] has a negative y-intercept, frequently (i.e., 21% of the time; Table 4), resulting in a prediction of unphysical negative flash rates when applied to the Alabama thunderstorms in this study (Figure 9). Despite the negative flash rates at small values of maximum updraft, the Colorado-only maximum updraft velocity relation [48] over-estimates flash rate in the mean when applied to the Alabama data (Table 3), especially if the unphysical negative flash rates are replaced by zero before error estimation (Table 4). This positive bias despite negative flash rates is likely due to the Colorado-only relation [48] over-estimating flash rate at moderate-to-high values of maximum updraft velocity compared to the relation in this study derived from the Alabama data (Table 2, Figure 10). In fact, all of the Colorado-only relations [48] over-estimate flash rate in nearly all kinematic and microphysical conditions compared to the Alabama-only relations derived in this study, as can be seen clearly in Figure 10. Possible factors underlying the differences in relations are discussed in Section 4.
Table 4.
Same as Table 3 except predicted non-physical negative flash rates are replaced by zero (0 min−1) for calculation of error statistics. Presented results are limited to those equations with negative y-intercepts that resulted in the prediction of negative flash rates. The percentage (%) of the total sample with predicted negative flash rates, which are set to zero for error estimation, is also shown.
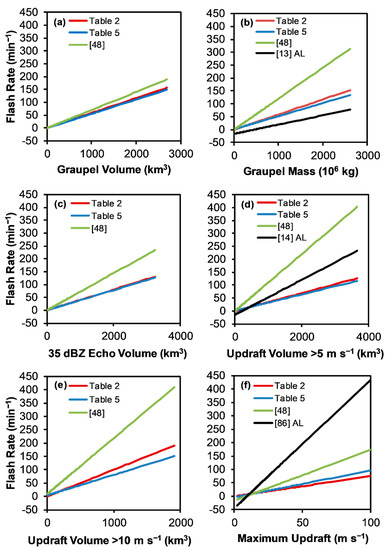
Figure 10.
Flash rate parameterization equations based on radar-inferred microphysical or kinematic properties, including (a) graupel volume (km3), (b) graupel mass (106 kg), (c) 35 dBZ echo volume (km3), (d) updraft volume > 5 m s−1 (km3), (e) updraft volume > 10 m s−1 (km3), and (f) maximum updraft velocity (km3). Linear flash rate parameterization equations are shown for the Alabama storms in this study derived with a zero y-intercept (Table 2, red lines) and a non-zero y-intercept (Table 5, blue lines), the recent study using Colorado-only storms [48] (green lines) and the Alabama (AL) only storm relations from an earlier series of related studies [13,14,86] (black line).
Similarly, the flash rate parameterization equations derived in earlier studies of Alabama-only or Alabama and Colorado storms combined [13,14] also have negative y-intercepts and frequently produce physically unrealistic negative flash rates when applied to the Alabama thunderstorms in this study. In fact, negative flash rates are estimated in 49% to 50% of the samples when the updraft volume > 5 m s−1 relation from the earlier study [14] is applied to the radar samples in this study (Table 4). Negative flash rates are even more frequently predicted (66–90%) when the graupel (or precipitation ice) mass relations are applied to the radar data in this study (Table 4). When negative flash rates are included in error estimation (Table 3), the bias errors for relations based on updraft volume > 5 m s−1 and graupel mass from the earlier studies [13,14] as applied to radar data in this study are negative and accompanied by large RMSE, making them generally unsuitable. Similar results and conclusions regarding frequently predicted negative flash rates were also found by a recent study [48] that tested these earlier relations [13,14] on Colorado-only data. If the negative flash rates are replaced by zero before error estimation (Table 4), the bias errors for relations in the earlier studies [13,14] become less negative for graupel mass and even slightly positive for updraft volume > 5 m s−1 when applied to radar samples in this study. The switch in bias from negative to positive when substituting zero for unphysical negative flash rates is related, in part, to the earlier updraft volume > 5 m s−1 relation [14] over-estimating flash rate at moderate-to-large values of updraft volume, as seen in a comparison (Figure 10) of the flash rate parameterization equation for Alabama storms in [14] to those derived from the Alabama data in this study (Table 2).
Flash rates estimated from relations based on maximum updraft velocity that were derived in earlier radar studies [14,86] of Alabama-only or Alabama and Colorado storms are also frequently (24–43%) negative when applied to the radar observations of Alabama storms in this study, resulting in large NRMSE (Table 3 and Table 4). Interestingly, the NMBE is large and positive despite the negative flash rates (Table 3) and only increases if negative flash rates are replaced by zero (Table 4) because the earlier relations [14,86] are grossly over-estimating flash rate at larger maximum updrafts when compared to the relations for Alabama storms in this study (Figure 10). Regardless of how negative flash rates are treated in error estimation, relations that produce them frequently are likely not well suited for general use. It is unclear why the earlier flash rate parameterizations [13,14,86] based on graupel mass, updraft volume > 5 m s−1 and maximum updraft velocity derived from Alabama and Colorado (or Alabama only) storms frequently predict unrealistic negative flash rates when applied to the Alabama storms in this study or other Colorado storms [48]. Differences in data and methodology seem less likely to be important since the same radar and lightning networks and most methods as used in the earlier studies [13,14,86] are used herein.
3.2.2. Overall Dataset with Non-zero Y-intercept
Given that it is standard statistical practice [84] and that other studies have used unforced linear regression with a non-zero y-intercept in all [13,14] or some [48] of their flash rate parameterization equations, the analysis in Section 3.2.1 is briefly repeated here using non-zero y-intercepts. The R2 for the regressed equations in Table 5 with non-zero y-intercepts suggest that parameterizations based on radar-inferred microphysical parameters can explain about 60% of the variance in flash rate, while radar-inferred kinematic parameters can explain about 50% based on updraft volume to about 40% based on maximum updraft velocity. The R2 and explained variance of flash rates by radar parameters in this study are lower than in prior studies [13,14,48], although it is worth noting that the recent Colorado study [48] also found lower R2 for relations based on kinematic quantities compared to microphysical ones. The higher R2 in the prior studies is likely the result of smaller samples and larger mean flash rates, although there could be other possible explanations (e.g., differences in storm dynamics, microphysics, observational error, and conceptual model error).
Table 5.
Same as Table 2 except that all regressed linear equations have a non-zero y-intercept (i.e., the solution is not forced to zero at the origin) and the Coefficient of Determination (R2) is provided.
The flash rate parameterization equations in this study have positive y-intercepts except for maximum updraft velocity, which is negative (Table 5). With the exception of maximum updraft velocity, this is different than the earlier studies for Alabama-only or Alabama and Colorado combined storms [13,14], which had all negative y-intercepts (Figure 10). On the other hand, for those relations in the recent Colorado-only study [48] with non-zero y-intercepts (i.e., updraft volume > 10 m s−1 and maximum updraft velocity), the signs of the y-intercepts (i.e., positive for the former and negative for the latter) are the same as in this study. A consistent difference between the relations in Table 5 and all prior studies is that the y-intercept parameters tend to have smaller magnitudes in this study (0.3 to 4.2 min−1) compared to (8.8 to 16.7 min−1) in the Colorado relations [48] and (5.1 to 44.4 min−1) for the earlier studies of Alabama and Colorado (or Alabama only) storms [13,14,86]. As is also evident in Figure 10, the flash rate parameterization relations in this study with zero y-intercepts (Table 2) are very similar to those with non-zero y-intercepts (Table 5), which is expected since the y-intercepts in Table 5 are small (or not far from zero). As such, the error performance for the two sets of relations in this study are fairly similar with the non-zero y-intercept relations in Table 5 having slightly smaller magnitudes of MBE and RMSE (Table 3 and Table 4).
Given these results, it seems that differences in storm characteristics, sample sizes, observational errors and/or radar and lightning analysis methods between studies are more likely to be behind poor error performance in flash rate parameterization equations derived in one study when applied to different data from another study than the choice of whether the linear regression is forced through the origin (zero y-intercept) or not (non-zero y-intercept). In Section 4, we argue that these differences between radar-lightning studies are likely what causes variance in the flash rate parameterization equations, including y-intercepts and slopes, in the first place.
3.3. Error as a Function of Flash Rate
While it is important to quantify the overall expected error performance for various flash rate parameterization relations when applied to the entire Alabama observational dataset in this study (as done in Section 3.2), the overall error may not provide a representative assessment of how the relations would perform on individual storms in a variety of situations. In this section, the parameterization equations in Table 2 and Table 5 derived from the overall Alabama dataset are applied to the 33 distinct storms (Table 1) and error statistics are computed separately for each storm and plotted as a function of the storm-averaged flash rate in Figure 11 and Figure 12, respectively.
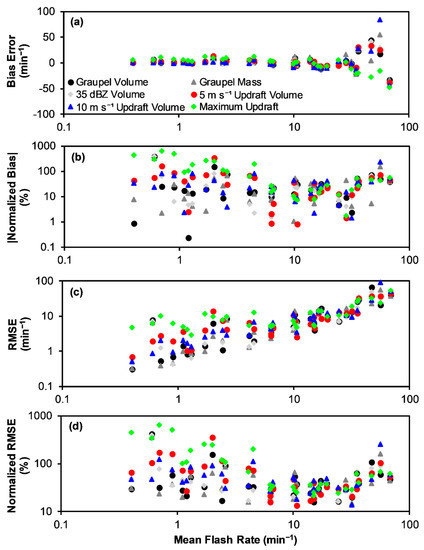
Figure 11.
Error performance when applying the various flash rate parameterization equations with zero y-intercept (Table 2) derived from the entire Alabama dataset to each of the 33 individual storms in this study (Table 1). Storm-level error statistics are plotted versus storm mean flash rate (min−1), including (a) MBE (min−1), (b) |NMBE| (%), (c) RMSE (min−1), and (d) NRMSE (%). Each type of relation has a different type and color marker, as shown in the legend in panel (a).
Consistent with the overall error (Table 2 and Table 5), the flash rate errors associated with relations based on kinematic parameters, including the updraft volumes and especially, maximum updraft velocity, are larger than for relations based on microphysical parameters (graupel volume, graupel mass, 35 dBZ echo volume) at low flash rates (<10 min−1), while they are generally more similar at moderate-to-high flash rates (≥10 min−1). The magnitude of the |NMBE| and the NRMSE for all types of flash rate relations are generally a minimum at moderate flash rates, not coincidentally close to the median (10 min−1) and mean (15 min−1) of the 33 storm average flash rates, while the normalized errors tend to climb at the tails of the average storm flash rate, including high flash rates (> 30 min−1) and especially, low flash rates (<5 min−1). In fact, the error performance of most flash rate relations can only be characterized as undesirably high at these low flash rates, especially for the kinematic relations like maximum updraft. These errors are likely due to the high scatter in flash rates with radar-inferred kinematic parameters at low flash rate (Figure 7). The same is likely true at high flash rate, although small sample size at high flash rates may also play a role in how it affects the regression process, depending on the procedures implemented. In this study, a WLS linear regression is implemented, which has the effect of reducing the weight at and influence of the very-high-flash-rate samples due to increased error variance with flash rate. The small sample and WLS regression approach may explain, in part, the increased errors at high flash rates.
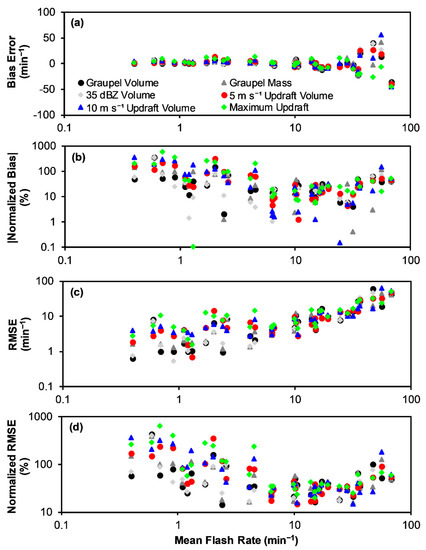
At very low flash rates (<1–3 min−1), the error performance of maximum updraft is considerably worse for the zero y-intercept relations in Table 2 compared to the non-zero y-intercept relations in Table 5 (c.f., Figure 11 and Figure 12). To facilitate the comparison, the error difference (or delta error) between the two sets of relations is also shown in Figure 13. As others have argued [47], the presence of a negative y-intercept for kinematic quantities, like maximum updraft in this study (Table 5), may be interpreted as a threshold in maximum updraft that is physically necessary before lightning is possible. Of course, other factors (e.g., sample size, conceptual model error, observational error) may influence the regression resulting in a negative y-intercept. Conversely, at very low flash rates, the error performance for all the rest of the flash rate relations, especially updraft volume > 10 m s−1, is worse for the non-zero, and in these instances positive, y-intercept relations compared to the zero y-intercept relations (c.f., Figure 11 and Figure 12; Figure 13). As noted previously [47], a positive y-intercept in a flash rate parameterization equation is likely not physically driven as it implies a non-zero flash rate even when the radar-inferred kinematic or microphysical predictor is zero. Errors may affect the regression process, resulting in a physically unrealistic positive y-intercept in order to minimize the sum of the squares of the differences between the observed flash rates and those predicted by the linear function. In other words, it is a statistical outcome as influenced by observational error, not necessarily a physically realistic one. At the very high flash rate tail, there is some indication that the zero y-intercept relations perform worse, although it is only notable for a single storm (i.e., a tornadic supercell on 27 April 2011), which may be an outlier. So, although the choice of forcing the solution through the origin or not during regression may not affect the overall error performance much (Table 3 and Table 4) at most flash rates, it can affect it considerably in the tails, especially at low flash rates (Figure 13).
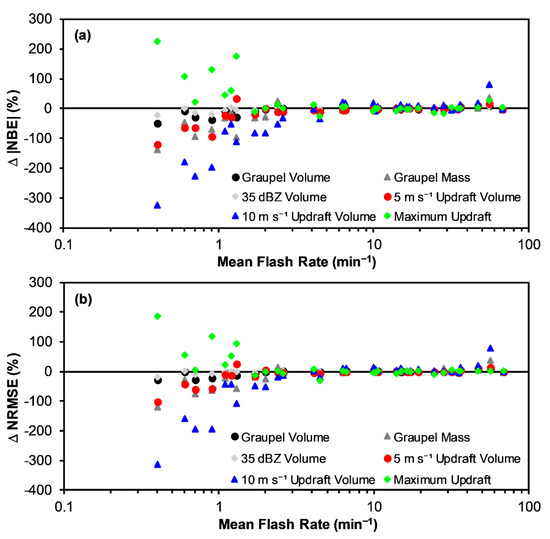
Figure 13.
Difference in percentage errors (%) between the various sets of linear equations with zero y-intercept (Table 2) and non-zero y-intercept (Table 5) versus storm mean flash rate (min−1) for (a) Δ|NBE| = (|NBE| Table 2 Equation) − (|NBE| Table 5 Equation) and (b) Δ NRMSE = (NRMSE Table 2 Equation) − (NRMSE Table 5 Equation). The type of flash rate parameterization equation is provided in the figure legend.
4. Discussion
As noted throughout Section 3, there are several different potential sources of error that can impact the performance of flash rate parameterization equations based on radar-inferred kinematic or microphysical parameters. The error sources fall into three general categories:
- Conceptual model errors
- Observational errors
- Statistical errors
Conceptual model error refers to inaccuracy in the physical model postulated in the design of the flash rate parameterization equation. For example, in this study and several others, it is assumed that a single kinematic or microphysical parameter, whether they are inferred from radar or numerical models, can explain all or most of the lightning flash rate. Although the single-parameter relations in this study and others do explain a large fraction of the variance in flash rate, it is perhaps overly simplistic to believe that it could explain all variance or perhaps even a large majority, given the complexity of the thunderstorm electrification and lightning processes. As storm microphysical, kinematic and electrical conditions co-vary associated with differing regions, seasons, environmental conditions (e.g., meteorology, aerosols), storm type, storm intensity, and storm lifecycle, the relationship between single kinematic (e.g., updraft volume, maximum updraft velocity) or single microphysical (e.g., graupel volume, 35 dBZ echo volume, graupel mass), cloud electrification processes (e.g., non-inductive ice–ice collisional charging and other secondary processes such as inductive charging) and lightning production may vary. As shown earlier and in other studies, these parameters have a high correlation on a storm basis. Yet, the quantitative relationship between single storm parameters and lightning may still vary due to the complexity of the storm processes and unexplained variance, which is the nature of conceptual model error. This study analyzes storms from Alabama only and compares outcomes from prior studies that derived similar relationships from Alabama and Colorado. The land/ocean and tropics/mid-latitude contrasts are not addressed herein. As noted earlier, as the storm sample size or variability increases, the percentage of explained variance in flash rate by a single microphysical or kinematic parameter decreases and parameterization error increases. This decrease in performance may be particularly true as more storms are added to the sample with very low flash rates when other electrification generation and dissipation processes, which are not well represented by the current conceptual models [13,87,88], may be relevant. It is also possible that variability in convective mode (e.g., supercell vs. multicell) or storm severity [57] could imply variations in dynamical or microphysical processes that alter the relationships between the storm parameters studied herein and lightning flash rate. Assuming that sufficient observational sample sizes of the various categories can be obtained, these are topics worthy of future research.
Another issue that is not addressed herein but is worthwhile for future studies to explore is the consideration of a potential systematic lag between a given kinematic or microphysical parameter and flash rate, as seen in Figure 2 and some past studies [8]. The optimal lag may depend on the parameter considered, the storm type, and storm intensity. However, accounting for such lags may reduce the error associated with flash rate parameterizations. Finally, this study did not explicitly consider over-shooting top (OT) electrical discharges [89] or downward positive intracloud lightning (+IC) [90], which both occur at high altitudes and temperatures colder than the mixed-phase zone microphysical and kinematic parameters emphasized in this study. OT electrical discharges would be eliminated by the source-to-flash clustering methods used in this study and not included in our flash rate totals. Assessing the practical impacts of OT electrical discharges and developing a parameterization for them would be an interesting subject for future work. If they existed in the storms in this study, downward +IC flashes would likely have been included in the flash rate totals. It is unclear if the current flash rate parameterizations emphasizing mixed-phase storm quantities in this study are optimally designed for modeling the initiation of +IC flashes at such cold temperatures so they may have contributed to observed errors. Future work could look into their frequency and impact on the flash rate parameterizations.
Although single-parameter relations are the focus of this study, other studies have proposed two- (or multi-) parameter relations based on combined kinematic and microphysical conditions (e.g., ice mass flux [13,50]) or radar and environmental conditions [48]. Based on the results herein and other studies [13,48,50,51,91,92], more research on multi-parameter flash rate parameterization equations is likely warranted, especially if tests are conducted on a much larger sample size in a wider variety of conditions to validate generality. Another possibility to explore in future work is the use of multiple linear regression using combinations of some or all of the kinematic and microphysical parameters explored in this study. Unfortunately, several of these multi-parameter schemes, which have been tested in models, may not work with observations as they rely on quantities that are difficult, if not impossible, to observe directly. Single-parameter approaches also benefit from their simplicity. In the event that a single-parameter flash parameterization approach is desirable, then graupel volume would likely be the best choice based on the results in this Alabama study, its close consistency with the recent Colorado study [48], methodological simplicity (e.g., no multi-Doppler retrievals needed, no assumptions about reflectivity-ice mass relations), and its direct physical connection to non-inductive ice–ice collisional charging processes [16,17,18,19].
Observational error includes random measurement error and systematic biases associated with observations or methods to estimate the desired kinematic, microphysical and flash rate products inferred from radar and LMA observables. Different radar and LMA networks can have different random and bias errors, which could result in differences in estimated flash rate parameterization equations. There are a number of different multi-Doppler and polarimetric radar methods and associated assumptions that are used to estimate kinematic and microphysical fields. Variations in these radar methods and their many assumptions related to hydrometeor identification, vertical velocity retrieval, and precipitation ice mass estimation could result in some of the large offsets in flash rate parameterization equations between this and other studies [13,14,48]. When storms are only marginally electrified and producing low flash rates, observational errors may begin to dominate the physical signal present in these flash rate parameterization equations, likely explaining much of the poor performance at low flash rate. Even estimating flash rate from an LMA requires specific methods and assumptions (e.g., VHF source to flash clustering) that can result in biases in flash rates from one study to another, especially at high flash rate [93]. For example, in the earlier studies of Alabama and Colorado storms [13,14], a flash is defined by a spatial and temporal cluster of at least three VHF sources, while, in this study and in the more recent Colorado study [48], a minimum of 10 VHF sources is used. Differences in cell identification and tracking could also affect the outcome of thunderstorm properties by affecting the storm footprint and volume in which storm properties are defined. Although our study shares similar observational networks and some methods with prior studies [13,14], it is thus still possible that observational errors or differences in observational methods such as flash rate estimation or cell definition are a significant source of variability between relations. Needless to say, cloud-resolving numerical models have their own random and bias errors in estimating the various kinematic and microphysical fields and those bias errors typically do not match observational studies, resulting in the need to apply scaling factors or other adjustments to apply observational-based relations to numerical models [43,45]. A suggestion for future work to mitigate impacts of observational radar error on flash rate parameterizations and their use in numerical cloud models is to adapt a self-consistent analysis and parameter retrieval framework with similar assumptions and the ability to generate self-consistent kinematic and microphysical parameters between radar and cloud-resolving modeling systems [94,95]. As part of this self-consistent radar-model analysis framework, it would be helpful to quantify more carefully the likely error sources of the input observations, perhaps as part of a data assimilation approach [95].
Variation in sample size assumptions and regression techniques, or statistical errors, between studies can result in variations in retrieved flash rate parameterization equations. Small sample sizes can result in lack of statistical representativeness given a conceptual model with its own potential errors, especially in the presence of observational error. Besides containing a larger sample, this study also includes more ordinary, low-flash-rate storms, which likely better represent the overall lightning climatology [96]. Small sample sizes, especially low numbers of low-flash-rate storms, may give undue influence to particular storms, especially at high flash rates, and bias the slope and/or y-intercept of the flash rate parameterization equations. This bias of relations toward high-flash-rate storms may be exacerbated if OLS regression is used in the presence of heteroscedasticity, which is fairly typical and why WLS regression is used herein to mitigate its effects. In this study, the choice of a linear regression forced through the origin (i.e., zero y-intercept) or not (non-zero y-intercept) does not have a large impact on overall outcomes. Importantly, the choice does impact the error performance of the flash rate relations in the tails, especially at low flash rate. Relations with large magnitude (negative or positive signed) y-intercepts from earlier studies generally perform poorly when applied to the large sample in this study. However, some relations from earlier studies with a zero y-intercept also perform poorly. As a result, it is speculated that the choice of zero vs. non-zero y-intercept is not as important as other statistical (e.g., WLS vs. OLS regression, sample size), conceptual model and observational errors. Some studies have physically interpreted the meaning of negative y-intercepts to represent a minimum threshold in kinematic or microphysical parameter for lightning occurrence [47]. While physically reasonable, it is also likely that the various errors described above may also affect the magnitude and sign of the regressed y-intercept such that physical interpretation should be done only with caveats. For example, the various errors described above (e.g., observational noise and biases, small samples, incomplete conceptual models) likely explain a large fraction of most positive y-intercepts and perhaps some negative y-intercepts as well, especially the ones with larger magnitudes.
5. Conclusions
As demonstrated in a variety of laboratory, modeling and observational studies, cloud electrification and lightning production are intimately tied to the microphysical and kinematic processes and properties of the mixed-phase zone, especially those related to the growth and convective transport of rimed precipitation ice. A recent use of these statistical and likely physically causal relationships is the development of single-parameter flash rate parameterization equations based on kinematic (e.g., convective updraft, maximum updraft velocity) and microphysical (e.g., graupel volume, graupel mass, 35 dBZ echo volume) properties. Flash rate parameterizations have been used in a number of thunderstorm applications where direct observations or explicit model representation of lightning is unavailable, such as lightning hazard forecasting and LNOX production. Conversely, lightning flash rate relations have been used to diagnose and nowcast high impact convective weather, such as aviation hazards and severe storms.
One of the key objectives of this study is to investigate the generality and overall performance of these flash rate parameterization equations based on radar-inferred kinematic and microphysical parameters in a variety of storm conditions (i.e., type, intensity, severity) and flash rates over Alabama. To develop new relations and test them alongside of prior relations, the study utilizes six years of consistent dual-Doppler radar, polarimetric radar and LMA thunderstorm sampling in Northern Alabama and adapts proven research methods to analyze a large sample of 515 radar volumes of 33 distinct storms, representing a three- to five-times increase in available research-quality kinematic, microphysical and flash rate observational data compared to prior studies. An important aspect of this study is the representative sampling of low-flash-rate storms, which are the most copious and ubiquitous, along with moderate-to-high flash rate storms, often the particular focus of some past studies. With adequate sampling of a variety of flash rates, another key objective of this study is the assessment of flash rate error on a storm-by-storm basis as a function of storm mean flash rate, providing better insight into the expected performance of the flash rate parameterizations for typical applications. Given the recent identification of issues related to the application and interpretation of linear flash rate relations with large magnitude (negative or positive signed) y-intercepts, a final key objective of this study is to characterize the overall and storm-by-storm relative performance of the new linear equations with both zero y-intercepts and non-zero y-intercepts.
A summary of key findings and conclusions are as follows:
- When considering the entire data set, kinematic (i.e., updraft volume > 5 m s−1, updraft volume > 10 m s−1, and maximum updraft velocity) and microphysical (i.e., graupel echo volume, graupel mass, and 35 dBZ echo volume) parameters are generally correlated to lightning flash rate (ρ = 0.60 to 0.76). However, these overall Pearson correlation coefficients are lower than found in individual high-flash-rate storms or in the smaller storm samples of past studies. Because the sample in this study is three- to five-times larger than past studies and contains a larger fraction of low-flash-rate storms for which various errors (e.g., conceptual, observational, statistical, as discussed in Section 4) may be larger, these lower correlations between flash rate and storm kinematic and microphysical parameters likely represent a more realistic assessment of typical storm and observational conditions, especially at low flash rate.
- Maximum updraft velocity (ρ = 0.60) has the lowest overall correlation with flash rate, while graupel mass (ρ = 0.76) has the highest overall correlation with flash rate. With the exception of maximum updraft velocity, all of the other kinematic and microphysical parameters have similar overall correlations with flash rate, ranging from ρ = 0.69 to 0.76. In fact, the various radar-inferred microphysical parameters are even better correlated to each other (ρ = 0.91 to 0.97), as are the updraft volumes with each other (ρ = 0.92) or with the microphysical parameters (ρ = 0.81 to 0.92). From simple Pearson correlation coefficient analysis, it could be anticipated that the overall performance of the flash rate parameterizations based on all of the various microphysical and kinematic parameters tested herein would be fairly similar to each other, with the notable exception of maximum updraft velocity, which would be somewhat worse.
- Error analysis of the various flash rate parameterization relations developed and tested on the Alabama storms in the study find very low MBE or |NMBE| < 1% for all relations, as would be expected. When testing similar relations developed in other studies on the data in this study, the |NMBE| values are generally larger (>1%) and typically, much larger (>10%). All of the recently developed Colorado relations [48] overestimate flash rate when applied to the Alabama storms in this study, often with large positive NMBE, including 35 dBZ echo (11.2%), graupel mass (14.2%), updraft volume > 10 m s−1 (20.4%), and updraft volume > 5 m s−1 (27.7%). Lower MBE’s for the recent Colorado relations include graupel volume (3.5%) and maximum updraft velocity (2.1%). When tested on the Alabama data in this study, nearly all earlier relations, except maximum updraft, based on Alabama-only or Alabama and Colorado combined storms [13,14] typically have negative bias errors (i.e., underestimate flash rate) overall, which were sometimes large in magnitude (|NMBE| = 1% to 23%). In fact, the negative y-intercepts of the earlier relations [13,14] often result in negative flash rates for 49% to 90% of the Alabama data sample in this study. On the other hand, the earlier relations [13,14] based on maximum updraft velocity exhibit large positive bias (NMBE = 21.6% and 10.5%) when applied to the data in this study. When considering MBE, the performance of most prior flash rate relations is not generally acceptable, resulting in significant over-estimation or under-estimation of flash rates, including frequent unphysical negative flash rates.
- Error analysis of the various flash rate parameterization relations developed from and tested on the Alabama storms in the study find scatter error or NRMSE that are fairly low and similar to each other with no clear favorite, most values ranging from 12% to 14% and the largest NRMSE for updraft volume > 10 m s−1 at 17%. The NRMSE values in this study are fairly similar to those NRMSE (12% to 19%) found by a recent Colorado study [48] when developing and testing the same flash rate parameterization relations exclusively on their Colorado data. The Colorado study also found larger NRMSE when estimating the flash rate from kinematic parameters. As might be expected, the NRMSE’s of flash rate relations derived in prior studies are larger than the relations derived herein when applied to the Alabama data in this study. However, sometimes the NRMSE’s associated with relations from prior studies are much larger. When the Colorado study relations [48] are applied to the Alabama data in this study, the NRMSE for estimating flash rate increase, sometimes notably to a range of 16% to 55%. The Colorado study [48] graupel volume (16%) and maximum updraft velocity (17%) relations have the lowest NRMSE while the NRMSE’s for the other Colorado study relations are much higher (34% to 55%) when applied to the Alabama data in this study. Similarly, the NRMSE’s for most flash rate parameterizations developed in the earlier studies of Alabama-only or Colorado and Alabama storms combined [13,14] when applied to the Alabama storms in this study are typically large (23% to 54%) with the exception of the graupel mass relation developed with Alabama-only data [13], which has an NRMSE of 16%.
- When considering both bias error and RMSE, it is easy to come to the conclusion that most flash rate parameterization relations lack sufficient general applicability from one observational data set or study to the next, likely due to a combination of possible error sources discussed in Section 4 (e.g., conceptual model, observational and statistical errors). To improve the robustness and utility of these relations in both radar and model applications, future studies should attempt to isolate, quantify and mitigate the various error sources using a self-consistent radar-model analysis framework on a sufficiently large, diverse and representative sample of storms with similar assumptions and the ability to generate self-consistent kinematic and microphysical parameters between radar and cloud-resolving modeling systems.
- Prior studies and results presented herein have identified potential issues when applying linear flash rate parameterization equations with large-magnitude y-intercepts. As noted in item 3), prior flash rate relations with large-magnitude negative y-intercepts often result in a majority fraction of unphysical negative flash rates, significant negative bias errors and large RMSE. Similarly, flash rate relations from prior studies with large-magnitude positive y-intercepts have sometimes resulted in the over-estimation of flash rate, significant positive biases and large RMSE. Given these findings, a sensitivity test is conducted herein by deriving and testing two types of linear equations, (1) one in which the flash rate solution is forced through the origin (i.e., zero y-intercept) and (2) the other in which the y-intercept is allowed to vary (i.e., non-zero y-intercept) during WLS regression. Although the non-zero y-intercept equations perform slightly better (i.e., slightly lower MBE and RMSE) than the zero y-intercept equations in this study, the difference in overall outcomes is small. The magnitudes of the y-intercepts derived in the second set of relations in this study are small (0.3 to 4.2 min−1), which may be why there is little difference in error performance between the two sets overall. However, it should be noted that there are significant differences in the performance of the two types of relations at low flash rates, as will be discussed next in item 7. Large-magnitude y-intercepts in flash rate relations from prior studies are not applicable to the storms in this study and may not be generally applicable due to statistical issues (e.g., small sample sizes, heteroscedasticity), although the different effects of observational and conceptual model errors between studies cannot yet be ruled out.
- To more completely assess expected performance, the flash rate relations derived (from the entire data set) herein are applied to each storm separately and the MBE and RMSE are evaluated for each storm individually as a function of storm mean flash rate, including for low-flash-rate storms. At low mean storm flash rates (<10 min−1), the errors associated with relations based on kinematic parameters, including updraft volume and especially maximum updraft velocity, are larger than for relations based on microphysical parameters (graupel volume, graupel mass, 35 dBZ echo volume), while all relations perform similarly at mean storm flash rates ≥10 min−1. At low-mean-storm-flash rates, the errors associated with most relations are undesirably high, especially for the kinematic-based relations like maximum updraft. At very low flash rates (<1–3 min−1), the error performance of maximum updraft is considerably worse for the zero y-intercept relations than the non-zero y-intercept relations in this study. Conversely, the error performance for all the rest of the flash rate relations, especially updraft volume > 10 m s−1, is worse at very low flash rates for the non-zero, and in these instances positive, y-intercept relations compared to the zero y-intercept relations. The error structure of the relations at low flash rates is likely strongly influenced by observational error, although all error sources (including conceptual model and statistical errors) likely interact and contribute.
- When considering all factors (e.g., low overall bias error, low overall RMSE, absence of negative flash rates, acceptable generality between studies, insensitivity to the choice of y-intercept, and relatively low bias error and low RMSE at the storm level for all flash rates, including low flash rates), the single-parameter flash rate parameterization relation with the best performance and most desirable overall characteristics found in this study is based on graupel volume. This conclusion may reflect (1) the primary, direct and causal role of graupel in the overall conceptual model of cloud electrification and lightning, (2) the relative robustness of fuzzy-logic-based polarimetric radar methods for identifying the bulk hydrometeor type (i.e., graupel) and (3) lower observational error associated with graupel echo volume compared to more complex radar products involving additional assumptions such as estimating precipitation ice mass from reflectivity or more complex methods such as dual-Doppler vertical motion retrievals. The finding of superior performance of the Zh > 35 dBZ echo volume relation in the Colorado study [48], even when applied to Alabama storms, could not be repeated herein, possibly due to the lack of non-isolated storms in the earlier study. Prior lightning studies of non-isolated Alabama storms [56] have found a high fraction of supercooled rain drops in the lower (i.e., warmer, −10 °C < T < −5 °C) portions of the mixed-phase zone (−40 °C < T < −5 °C) such that >35 dBZ echo at the warmer temperatures is often not associated with graupel. To confirm that graupel volume is superior to 35 dBZ echo volume (or vice versa, as found earlier [48]), this study should be repeated in a variety of regions that include frequent and diverse thunderstorm types, including low and high flash rate and non-severe and severe storms, with ample high-quality radar and lightning data such as in Cordoba, Argentina during the recent NSF RELAMPAGO (Remote Sensing of Electrification, Lightning, And Mesoscale/Microscale Processes with Adaptive Ground Observations) and DOE CACTI (Clouds, Aerosols, and Complex Terrain Interactions) joint field projects [97].
Author Contributions
Conceptualization, L.D.C., W.D. and W.A.P.; methodology, L.D.C., E.V.S., C.J.S. and W.D.; software, E.V.S., W.D. and C.J.S.; formal analysis, L.D.C., E.V.S., C.J.S., and A.L.B.; investigation, L.D.C.; resources, L.D.C. and W.A.P.; data curation, E.V.S.; writing—original draft preparation, L.D.C.; writing—review and editing, E.V.S., C.J.S., W.D., W.A.P., A.L.B. and K.E.P.; visualization, L.D.C.; supervision, L.D.C., W.A.P. and K.E.P.; project administration, L.D.C.; funding acquisition, L.D.C. and W.A.P.
Funding
This research is supported by the National Science Foundation (NSF) under Grant Numbers NSF AGS 1063573 and NSF AGS 1661785.
Acknowledgments
We wish to acknowledge Retha M. Mecikalski for software and visualization support. We also thank Danielle Kozlowski and Lori Schultz for their assistance with editing some of the Doppler radar data. We gratefully acknowledge the many ARMOR and NALMA operators, technicians and engineers over the years. ARMOR data are available from the University of Alabama in Huntsville [98]. NALMA data are available from the NASA GHRC [99]. Sounding data are available from University of Wyoming [100].
Conflicts of Interest
The authors declare no conflict of interest. The funders had no role in the design of the study; in the collection, analyses, or interpretation of data; in the writing of the manuscript, or in the decision to publish the results.
References
- Dye, J.E.; Ridley, B.A.; Skamarock, W.; Barth, M.; Venticinque, M.; Defer, E.; Blanchet, P.; Thery, C.; Laroche, P.; Baumann, K.; et al. An overview of the Stratospheric-Tropospheric Experiment: Radiation, Aerosols, and Ozone (STERAO)-Deep Convection experiment with results for the July 10, 1996 storm. J. Geophys. Res. 2000, 105, 10023–10045. [Google Scholar] [CrossRef]
- Lang, T.J.; Miller, L.J.; Weisman, M.; Rutledge, S.A.; Barker, L.J.; Bringi, V.N.; Chandrasekar, V.; Detwiler, A.; Doesken, N.; Helsdon, J.; et al. The Severe Thunderstorm Electrification and Precipitation Study. Bull. Am. Meteorol. Soc. 2004, 85, 1107–1126. [Google Scholar] [CrossRef]
- MacGorman, D.R.; Rust, W.D.; Schuur, T.J.; Biggerstaff, M.I.; Straka, J.M.; Ziegler, C.L.; Mansell, E.R.; Bruning, E.C.; Kuhlman, K.M.; Lund, N.R.; et al. TELEX the Thunderstorm Electrification and Lightning Experiment. Bull. Am. Meteorol. Soc. 2008, 89, 997–1014. [Google Scholar] [CrossRef]
- Barth, M.C.; Cantrell, C.A.; Brune, W.H.; Rutledge, S.A.; Crawford, J.H.; Huntrieser, H.; Carey, L.D.; MacGorman, D.; Weisman, M.; Pickering, K.E.; et al. The Deep Convective Clouds and Chemistry (DC3) Field Campaign. Bull. Am. Meteorol. Soc. 2015, 96, 1281–1309. [Google Scholar] [CrossRef]
- Dye, J.E.; Jones, J.J.; Winn, W.P.; Cerni, T.A.; Gardiner, B.; Lamb, D.; Pitter, R.L.; Hallett, J.; Saunders, C.P.R. Early electrification and precipitation development in a small, isolated Montana cumulonimbus. J. Geophys. Res. 1986, 91, 1231–1247. [Google Scholar] [CrossRef]
- Dye, J.E.; Winn, W.P.; Jones, J.J.; Breed, D.W. The electrification of New Mexico thunderstorms: 1. Relationship between precipitation development and the onset of electrification. J. Geophys. Res. 1989, 94, 8643–8656. [Google Scholar] [CrossRef]
- Williams, E.R.; Weber, M.E.; Orville, R.E. The relationship between lightning type and convective state of thunderclouds. J. Geophys. Res. 1989, 94, 13213–13220. [Google Scholar] [CrossRef]
- Carey, L.D.; Rutledge, S.A. A multiparameter radar case study of the microphysical and kinematic evolution of a lightning producing storm. Meteorol. Atmos. Phys. 1996, 59, 33–64. [Google Scholar] [CrossRef]
- Carey, L.D.; Rutledge, S.A. The relationship between precipitation and lightning in tropical island convection: A C-Band polarimetric radar study. Mon. Weather 2000, 128, 2687–2710. [Google Scholar] [CrossRef]
- Petersen, W.A.; Christian, H.J.; Rutledge, S.A. TRMM observations of the global relationship between ice water content and lightning: TRMM observations. Geophys. Res. Lett. 2005, 32, L14819. [Google Scholar] [CrossRef]
- Kuhlman, K.M.; Ziegler, C.L.; Mansell, E.R.; MacGorman, D.R.; Straka, J.M. Numerically Simulated Electrification and Lightning of the 29 June 2000 STEPS Supercell Storm. Mon. Weather Rev. 2006, 134, 2734–2757. [Google Scholar] [CrossRef]
- Bruning, E.C.; Rust, W.D.; Schuur, T.J.; MacGorman, D.R.; Krehbiel, P.R.; Rison, W. Electrical and Polarimetric Radar Observations of a Multicell Storm in TELEX. Mon. Weather Rev. 2007, 135, 2525–2544. [Google Scholar] [CrossRef]
- Deierling, W.; Petersen, W.A.; Latham, J.; Ellis, S.; Christian, H.J. The relationship between lightning activity and ice fluxes in thunderstorms. J. Geophys. Res. 2008, 113, D15210. [Google Scholar] [CrossRef]
- Deierling, W.; Petersen, W.A. Total lightning activity as an indicator of updraft characteristics. J. Geophys. Res. 2008, 113, D16210. [Google Scholar] [CrossRef]
- Mansell, E.R.; Ziegler, C.L.; Bruning, E.C. Simulated Electrification of a Small Thunderstorm with Two-Moment Bulk Microphysics. J. Atmos. Sci. 2010, 67, 171–194. [Google Scholar] [CrossRef]
- Reynolds, S.E.; Brook, M.; Gourley, M.F. Thunderstorm charge separation. J. Meteorol. 1957, 14, 426–436. [Google Scholar] [CrossRef]
- Takahashi, T. Riming Electrification as a Charge Generation Mechanism in Thunderstorms. J. Atmos. Sci. 1978, 35, 1536–1548. [Google Scholar] [CrossRef]
- Saunders, C.P.R.; Keith, W.D.; Mitzeva, R.P. The effect of liquid water on thunderstorm charging. J. Geophys. Res. 1991, 96, 11007–11017. [Google Scholar] [CrossRef]
- Saunders, C.P.R.; Peck, S.L. Laboratory studies of the influence of the rime accretion rate on charge transfer during crystal/graupel collisions. J. Geophys. Res. 1998, 103, 13949–13956. [Google Scholar] [CrossRef]
- Nesbitt, S.W.; Zipser, E.J.; Cecil, D.J. A Census of Precipitation Features in the Tropics Using TRMM: Radar, Ice Scattering, and Lightning Observations. J. Clim. 2000, 13, 4087–4106. [Google Scholar] [CrossRef]
- Petersen, W.A.; Rutledge, S.A. Regional Variability in Tropical Convection: Observations from TRMM. J. Clim. 2001, 14, 3566–3586. [Google Scholar] [CrossRef]
- Toracinta, E.R.; Cecil, D.J.; Zipser, E.J.; Nesbitt, S.W. Radar, Passive Microwave, and Lightning Characteristics of Precipitating Systems in the Tropics. Mon. Weather Rev. 2002, 130, 802–824. [Google Scholar] [CrossRef]
- Cecil, D.J.; Goodman, S.J.; Boccippio, D.J.; Zipser, E.J.; Nesbitt, S.W. Three Years of TRMM Precipitation Features. Part I: Radar, Radiometric, and Lightning Characteristics. Mon. Weather Rev. 2005, 133, 543–566. [Google Scholar] [CrossRef]
- Zipser, E.J.; Cecil, D.J.; Liu, C.; Nesbitt, S.W.; Yorty, D.P. Where are the most intense thunderstorms ON earth? Bull. Am. Meteorol. Soc. 2006, 87, 1057–1072. [Google Scholar] [CrossRef]
- Liu, C.; Cecil, D.J.; Zipser, E.J.; Kronfeld, K.; Robertson, R. Relationships between lightning flash rates and radar reflectivity vertical structures in thunderstorms over the tropics and subtropics. J. Geophys. Res. 2012, 117, D06212. [Google Scholar] [CrossRef]
- Williams, E.; Boldi, B.; Matlin, A.; Weber, M.; Hodanish, S.; Sharp, D.; Goodman, S.; Raghavan, R.; Buechler, D. The behavior of total lightning activity in severe Florida thunderstorms. Atmos. Res. 1999, 51, 245–265. [Google Scholar] [CrossRef]
- Schultz, C.J.; Petersen, W.A.; Carey, L.D. Preliminary Development and Evaluation of Lightning Jump Algorithms for the Real-Time Detection of Severe Weather. J. Appl. Meteorol. Climatol. 2009, 48, 2543–2563. [Google Scholar] [CrossRef]
- Gatlin, P.N.; Goodman, S.J. A Total Lightning Trending Algorithm to Identify Severe Thunderstorms. J. Atmos. Ocean. Technol. 2010, 27, 3–22. [Google Scholar] [CrossRef]
- Schultz, C.J.; Petersen, W.A.; Carey, L.D. Lightning and Severe Weather: A Comparison between Total and Cloud-to-Ground Lightning Trends. Weather Forecast. 2011, 26, 744–755. [Google Scholar] [CrossRef]
- Bedka, K.M.; Wang, C.; Rogers, R.; Carey, L.D.; Feltz, W.; Kanak, J. Examining Deep Convective Cloud Evolution Using Total Lightning, WSR-88D, and GOES-14 Super Rapid Scan Datasets. Weather Forecast. 2015, 30, 571–590. [Google Scholar] [CrossRef]
- Schultz, C.J.; Carey, L.D.; Schultz, E.V.; Blakeslee, R.J. Insight into the Kinematic and Microphysical Processes that Control Lightning Jumps. Weather Forecast. 2015, 30, 1591–1621. [Google Scholar] [CrossRef]
- Schultz, C.J.; Carey, L.D.; Schultz, E.V.; Blakeslee, R.J. Kinematic and Microphysical Significance of Lightning Jumps versus Nonjump Increases in Total Flash Rate. Weather Forecast. 2017, 32, 275–288. [Google Scholar] [CrossRef] [PubMed]
- Tian, Y.; Qie, X.; Sun, Y.; Wang, D.; Yuan, S.; Sun, Z.; Lu, G.; Yu, L.; Sun, H.; Li, L.; et al. Total lightning signatures of thunderstorms and lightning jumps in hailfall nowcasting in the Beijing area. Atmos. Res. 2019, 230, 104646. [Google Scholar] [CrossRef]
- Terborg, A.; Stano, G.T. Impacts to Aviation Weather Center Operations Using Total Lightning Observations from the Pseudo-GLM. J. Oper. Meteorol. 2017, 5, 1–13. [Google Scholar] [CrossRef]
- Cummins, K.L.; Murphy, M.J. An Overview of Lightning Locating Systems: History, Techniques, and Data Uses, with an In-Depth Look at the U.S. NLDN. IEEE Trans. Electromagn. Compat. 2009, 51, 499–518. [Google Scholar] [CrossRef]
- Goodman, S.J.; Blakeslee, R.J.; Koshak, W.J.; Mach, D.; Bailey, J.; Buechler, D.; Carey, L.; Schultz, C.; Bateman, M.; McCaul, E.; et al. The GOES-R Geostationary Lightning Mapper (GLM). Atmos. Res. 2013, 125–126, 34–49. [Google Scholar] [CrossRef]
- Holle, R.L. A Summary of Recent National-Scale Lightning Fatality Studies. Weather Clim. Soc. 2016, 8, 35–42. [Google Scholar] [CrossRef]
- Stano, G.T.; Smith, M.R.; Schultz, C.J. Development and Evaluation of the GLM Stoplight Product for Lightning Safety. J. Oper. Meteorol. 2019, 7, 92–104. [Google Scholar] [CrossRef]
- Steiner, M.; Deierling, W.; Ikeda, K.; Nelson, E.; Bass, R. Airline and airport operations under lightning threats—Safety risks, impacts, uncertainties, and how to deal with them all. In Proceedings of the 6th AIAA Atmospheric and Space Environments Conference; American Institute of Aeronautics and Astronautics: Atlanta, GA, USA, 2014. [Google Scholar] [CrossRef]
- Roeder, W.P.; McNamara, T.M.; McAleenan, M.; Winters, K.A.; Maier, L.M.; Huddleston, L.L. The 2014 Upgrade to the Lightning Warning Areas Used By 45th Weather Squadron. In Proceedings of the 18th Conference on Aviation, Range, and Aerospace Meteorology; American Meteorological Society: Seattle, WA, USA, 2017. [Google Scholar]
- DeCaria, A.J.; Pickering, K.E.; Stenchikov, G.L.; Ott, L.E. Lightning-generated NOX and its impact on tropospheric ozone production: A three-dimensional modeling study of a Stratosphere-Troposphere Experiment: Radiation, Aerosols and Ozone (STERAO-A) thunderstorm. J. Geophys. Res. 2005, 110, D14303. [Google Scholar] [CrossRef]
- Pickering, K.E.; Wang, Y.; Tao, W.-K.; Price, C.; Müller, J.-F. Vertical distributions of lightning NOx for use in regional and global chemical transport models. J. Geophys. Res. 1998, 103, 31203–31216. [Google Scholar] [CrossRef]
- Barthe, C.; Barth, M.C. Evaluation of a new lightning-produced NOx parameterization for cloud resolving models and its associated uncertainties. Atmos. Chem. Phys. 2008, 8, 4691–4710. [Google Scholar] [CrossRef]
- Ott, L.E.; Pickering, K.E.; Stenchikov, G.L.; Allen, D.J.; DeCaria, A.J.; Ridley, B.; Lin, R.-F.; Lang, S.; Tao, W.-K. Production of lightning NOx and its vertical distribution calculated from three-dimensional cloud-scale chemical transport model simulations. J. Geophys. Res. 2010, 115, D04301. [Google Scholar] [CrossRef]
- Barthe, C.; Deierling, W.; Barth, M.C. Estimation of total lightning from various storm parameters: A cloud-resolving model study. J. Geophys. Res. 2010, 115, D24202. [Google Scholar] [CrossRef]
- Barthe, C.; Pinty, J.-P.; Mari, C. Lightning-produced NO x in an explicit electrical scheme tested in a Stratosphere-Troposphere Experiment: Radiation, Aerosols, and Ozone case study. J. Geophys. Res. 2007, 112, D04302. [Google Scholar] [CrossRef]
- Bovalo, C.; Barthe, C.; Pinty, J. Examining relationships between cloud-resolving model parameters and total flash rates to generate lightning density maps. Q. J. R. Meteorol. Soc. 2019, 145, 1250–1266. [Google Scholar] [CrossRef]
- Basarab, B.M.; Rutledge, S.A.; Fuchs, B.R. An improved lightning flash rate parameterization developed from Colorado DC3 thunderstorm data for use in cloud-resolving chemical transport models. J. Geophys. Res. Atmos. 2015, 120, 9481–9499. [Google Scholar] [CrossRef]
- Carey, L.D.; Koshak, W.; Peterson, H.; Mecikalski, R.M. The kinematic and microphysical control of lightning rate, extent, and NOX production. J. Geophys. Res. Atmos. 2016, 121, 7975–7989. [Google Scholar] [CrossRef]
- McCaul, E.W.; Goodman, S.J.; LaCasse, K.M.; Cecil, D.J. Forecasting Lightning Threat Using Cloud-Resolving Model Simulations. Weather Forecast. 2009, 24, 709–729. [Google Scholar] [CrossRef]
- Wang, Y.; Yang, Y.; Jin, S. Evaluation of Lightning Forecasting Based on One Lightning Parameterization Scheme and Two Diagnostic Methods. Atmosphere 2018, 9, 99. [Google Scholar] [CrossRef]
- Vincent, B.R.; Carey, L.D.; Schneider, D.; Keeter, K.; Gonski, R. Using WSR-88D reflectivity data for the prediction of cloud-to-ground lightning: A North Carolina study. Nat. Weather Dig. 2003, 27, 35–44. [Google Scholar]
- Wolf, P. Anticipating the Initiation, Cessation, and Frequency of Cloud-to-Ground Lightning, Utilizing WSR-88D Reflectivity Data. NWA Electron. J. Oper. Meteorol. 2007, 8, 1–19. [Google Scholar]
- Mosier, R.M.; Schumacher, C.; Orville, R.E.; Carey, L.D. Radar Nowcasting of Cloud-to-Ground Lightning over Houston, Texas. Weather Forecast. 2011, 26, 199–212. [Google Scholar] [CrossRef]
- Patton, J.R.; Fuelberg, H.E. Using Radar-Derived Parameters to Develop Probabilistic Guidance for Lightning Cessation within Isolated Convection near Cape Canaveral, Florida. Weather Forecast. 2019, 34, 559–575. [Google Scholar] [CrossRef]
- Mecikalski, R.M.; Bain, A.L.; Carey, L.D. Radar and Lightning Observations of Deep Moist Convection across Northern Alabama during DC3: 21 May 2012. Mon. Weather Rev. 2015, 143, 2774–2794. [Google Scholar] [CrossRef]
- Johnson, E.V. Behavior of Lightning and Updrafts for Severe and Non-Severe Storms in Northern Alabama. Master’s Thesis, The University of Alabama in Huntsville, Huntsville, AL, USA, 2009. [Google Scholar]
- Koshak, W.J.; Solakiewicz, R.J.; Blakeslee, R.J.; Goodman, S.J.; Christian, H.J.; Hall, J.M.; Bailey, J.C.; Krider, E.P.; Bateman, M.G.; Boccippio, D.J.; et al. North Alabama Lightning Mapping Array (LMA): VHF Source Retrieval Algorithm and Error Analyses. J. Atmos. Ocean. Technol. 2004, 21, 543–558. [Google Scholar] [CrossRef]
- Goodman, S.J.; Blakeslee, R.; Christian, H.; Koshak, W.; Bailey, J.; Hall, J.; McCaul, E.; Buechler, D.; Darden, C.; Burks, J.; et al. The North Alabama Lightning Mapping Array: Recent severe storm observations and future prospects. Atmos. Res. 2005, 76, 423–437. [Google Scholar] [CrossRef]
- Rison, W.; Thomas, R.J.; Krehbiel, P.R.; Hamlin, T.; Harlin, J. A GPS-based three-dimensional lightning mapping system: Initial observations in central New Mexico. Geophys. Res. Lett. 1999, 26, 3573–3576. [Google Scholar] [CrossRef]
- Petersen, W.A.; Knupp, K.; Walters, J.; Deierling, W.; Gauthier, M.; Dolan, B.; Dice, J.P.; Satterfield, D.; Davis, C.; Blakeslee, R.; et al. The UAH-NSSTC/WHNT ARMOR C-band dual-polarimetric radar: A unique collaboration in research, education and technology transfer. In Proceedings of the 32nd Conference on Radar Meteorology; American Meteorological Society: Albuquerque, NM, USA, 2005; p. 12R.4. [Google Scholar]
- Scott, R.D.; Krehbiel, P.R.; Rison, W. The Use of Simultaneous Horizontal and Vertical Transmissions for Dual-Polarization Radar Meteorological Observations. J. Atmos. Ocean. Technol. 2001, 18, 629–648. [Google Scholar] [CrossRef]
- Crum, T.D.; Alberty, R.L. The WSR-88D and the WSR-88D Operational Support Facility. Bull. Am. Meteorol. Soc. 1993, 74, 1669–1688. [Google Scholar] [CrossRef]
- Bringi, V.N.; Keenan, T.D.; Chandrasekar, V. Correcting C-band radar reflectivity and differential reflectivity data for rain attenuation: A self-consistent method with constraints. IEEE Trans. Geosci. Remote Sens. 2001, 39, 1906–1915. [Google Scholar] [CrossRef]
- Bringi, V.N.; Chandrasekar, V. Polarimetric Doppler Weather Radar: Principles and Applications; Cambridge Univ. Press: Cambridge, UK, 2001; ISBN 9780521019552. [Google Scholar]
- Marks, D.A.; Wolff, D.B.; Carey, L.D.; Tokay, A. Quality Control and Calibration of the Dual-Polarization Radar at Kwajalein, RMI. J. Atmos. Ocean. Technol. 2011, 28, 181–196. [Google Scholar] [CrossRef]
- Oye, D.; Mueller, C.; Smith, S. Software for radar translation, visualization, editing and interpolation. In Proceedings of the 27th Conference on Radar Meteorology; American Meteorological Society: Vail, CO, USA, 1995; pp. 359–361. [Google Scholar]
- Oye, D.; Case, M. REORDER: A Program for Gridding Radar Data—Installation and User Manual for the UNIX Version; NCAR Atmospheric Technology Division: Boulder, CO, USA, 1995; p. 19. [Google Scholar]
- Davies-Jones, R.P. Dual-Doppler Radar Coverage Area as a Function of Measurement Accuracy and Spatial Resolution. J. Appl. Meteorol. 1979, 18, 1229–1233. [Google Scholar] [CrossRef]
- Cressman, G.P. An operational objective analysis system. Mon. Wea. Rev. 1959, 87, 367–374. [Google Scholar] [CrossRef]
- Mohr, C.G.; Jay Miller, L.; Vaughan, R.L.; Frank, H.W. The Merger of Mesoscale Datasets into a Common Cartesian Format for Efficient and Systematic Analyses. J. Atmos. Ocean. Technol. 1986, 3, 143–161. [Google Scholar] [CrossRef][Green Version]
- Miller, L.J.; Frederick, S.M. CEDRIC: Custom Editing and Display of Reduced Information in Cartesian Space; National Center for Atmospheric Research Mesoscale and Microscale Meteorology Division: Boulder, CO, USA, 2009; p. 130. [Google Scholar]
- Armijo, L. A Theory for the Determination of Wind and Precipitation Velocities with Doppler Radars. J. Atmos. Sci. 1969, 26, 570–573. [Google Scholar] [CrossRef]
- Ray, P.S.; Ziegler, C.L.; Bumgarner, W.; Serafin, R.J. Single- and Multiple-Doppler Radar Observations of Tornadic Storms. Mon. Weather Rev. 1980, 108, 1607–1625. [Google Scholar] [CrossRef]
- O’Brien, J.J. Alternative Solutions to the Classical Vertical Velocity Problem. J. Appl. Meteorol. 1970, 9, 197–203. [Google Scholar] [CrossRef]
- Matejka, T.; Bartels, D.L. The Accuracy of Vertical Air Velocities from Doppler Radar Data. Mon. Weather Rev. 1998, 126, 92–117. [Google Scholar] [CrossRef]
- Gao, J.; Xue, M.; Shapiro, A.; Droegemeier, K.K. A Variational Method for the Analysis of Three-Dimensional Wind Fields from Two Doppler Radars. Mon. Weather Rev. 1999, 127, 2128–2142. [Google Scholar] [CrossRef]
- Vivekanandan, J.; Zrnic, D.S.; Ellis, S.M.; Oye, R.; Ryzhkov, A.V.; Straka, J. Cloud Microphysics Retrieval Using S-Band Dual-Polarization Radar Measurements. Bull. Am. Meteorol. Soc. 1999, 80, 381–388. [Google Scholar] [CrossRef]
- Heymsfield, A.J.; Miller, K.M. Water Vapor and ice Mass Transported into the Anvils of CCOPE Thunderstorms: Comparison with Storm Influx and Rainout. J. Atmos. Sci. 1988, 45, 3501–3514. [Google Scholar] [CrossRef]
- Smith, P.L. Equivalent Radar Reflectivity Factors for Snow and Ice Particles. J. Clim. Appl. Meteorol. 1984, 23, 1258–1260. [Google Scholar] [CrossRef]
- Dixon, M.; Wiener, G. TITAN: Thunderstorm Identification, Tracking, Analysis, and Nowcasting—A Radar-based Methodology. J. Atmos. Ocean. Technol. 1993, 10, 785–797. [Google Scholar] [CrossRef]
- Marshall, J.S.; Radhakant, S. Radar Precipitation Maps as Lightning Indicators. J. Appl. Meteorol. 1978, 17, 206–212. [Google Scholar] [CrossRef]
- Kutner, M.H.; Nachtsheim, C.J.; Neter, J.; Li, W. Applied Linear Statistical Models, 5th ed.; McGraw-Hill Irwin: New York, NY, USA, 2005; ISBN 0-07-238688-6. [Google Scholar]
- Wilks, D.S. Statistical Methods in the Atmospheric Sciences, 2nd ed.; International Geophysics Series; Academic Press: Cambridge, MA, USA, 2006; Volume 91, ISBN 0-12-751966-1. [Google Scholar]
- Root-Mean-Square Deviation. Available online: https://en.wikipedia.org/wiki/Root-mean-square_deviation (accessed on 11 September 2019).
- Deierling, W. The Relationship between Total Lightning and Ice Fluxes. Ph.D. Thesis, The University of Alabama in Huntsville, Huntsville, AL, USA, 2006. [Google Scholar]
- MacGorman, D.R.; Rust, W.D. The Electrical Nature of Storms; Oxford University Press: New York, NY, USA, 1998; ISBN 0-19-507337-1. [Google Scholar]
- Dye, J.E.; Bansemer, A. Electrification in Mesoscale Updrafts of Deep Stratiform and Anvil Clouds in Florida. J. Geophys. Res. Atmos. 2019, 124, 1021–1049. [Google Scholar] [CrossRef]
- MacGorman, D.R.; Elliott, M.S.; DiGangi, E. Electrical discharges in the overshooting tops of thunderstorms. J. Geophys. Res. Atmos. 2017, 122, 2929–2957. [Google Scholar] [CrossRef]
- Wu, T.; Wang, D.; Takagi, N. Intracloud Lightning Flashes Initiated at High Altitudes and Dominated by Downward Positive Leaders. J. Geophys. Res. Atmos. 2019, 124, 6982–6998. [Google Scholar] [CrossRef]
- Yair, Y.; Lynn, B.; Price, C.; Kotroni, V.; Lagouvardos, K.; Morin, E.; Mugnai, A.; del Carmen Llasat, M. Predicting the potential for lightning activity in Mediterranean storms based on the Weather Research and Forecasting (WRF) model dynamic and microphysical fields. J. Geophys. Res. 2010, 115, D04205. [Google Scholar] [CrossRef]
- Lynn, B.H.; Yair, Y.; Price, C.; Kelman, G.; Clark, A.J. Predicting Cloud-to-Ground and Intracloud Lightning in Weather Forecast Models. Weather Forecast. 2012, 27, 1470–1488. [Google Scholar] [CrossRef]
- Fuchs, B.R.; Bruning, E.C.; Rutledge, S.A.; Carey, L.D.; Krehbiel, P.R.; Rison, W. Climatological analyses of LMA data with an open-source lightning flash-clustering algorithm. J. Geophys. Res. Atmos. 2016, 121, 8625–8648. [Google Scholar] [CrossRef]
- Matsui, T.; Dolan, B.; Rutledge, S.A.; Tao, W.; Iguchi, T.; Barnum, J.; Lang, S.E. POLARRIS: A POLArimetric Radar Retrieval and Instrument Simulator. J. Geophys. Res. Atmos. 2019, 124, 4634–4657. [Google Scholar] [CrossRef]
- Zhang, G. Weather Radar Polarimetry; CRC Press: Boca Raton, FL, USA, 2017; ISBN 978-1-4398-6958-1. [Google Scholar]
- Williams, E.; Rothkin, K.; Stevenson, D.; Boccippio, D. Global Lightning Variations Caused by Changes in Thunderstorm Flash Rate and by Changes in the Number of Thunderstorms. J. Appl. Meteorol. 2000, 39, 2223–2230. [Google Scholar] [CrossRef]
- Nesbitt, S. Remote Sensing of Electrification, Lightning, And Mesoscale/microscale Processes with Adaptive Ground Observations (RELAMPAGO) and Clouds, Aerosols, and Complex Terrain Interactions (CACTI). Available online: https://www.eol.ucar.edu/field_projects/relampago (accessed on 27 November 2019).
- ARMOR. Available online: https://www.nsstc.uah.edu/armor/webimage/armor.html (accessed on 3 October 2019).
- NASA GHRC. Available online: https://ghrc.nsstc.nasa.gov/home/ (accessed on 3 October 2019).
- Atmospheric Soundings. Available online: http://weather.uwyo.edu/upperair/sounding.html (accessed on 3 October 2019).
© 2019 by the authors. Licensee MDPI, Basel, Switzerland. This article is an open access article distributed under the terms and conditions of the Creative Commons Attribution (CC BY) license (http://creativecommons.org/licenses/by/4.0/).