


Abstract
Extreme climate events, either being linked to dry spells or extreme precipitation, are of major concern in Africa, a region in which the economy and population are highly vulnerable to climate hazards. However, recent trends in climate events are not often documented in this poorly surveyed continent. This study makes use of a large set of daily rain gauge data covering Southern West Africa (extending from 10° W to 10° E and from 4° N to 12° N) from 1950 to 2014. The evolution of the number and the intensity of daily rainfall events, especially the most extremes, were analyzed at the annual and seasonal scales. During the first rainy season (April–July), mean annual rainfall is observed to have a minor trend due to less frequent but more intense rainfall mainly along the coast of Southern West Africa (SWA) over the last two decades. The north–south seasonal changes exhibit an increase in mean annual rainfall over the last decade during the second rainy season (September–November) linked by both an increase in the frequency of occurrence of rainy days as well as an increase in the mean intensity and extreme events over the last decade. The study also provides evidence of a disparity that exists between the west and east of SWA, with the east recording a stronger increase in the mean intensity of wet days and extreme rainfall during the second rainy season (September–November).
1. Introduction
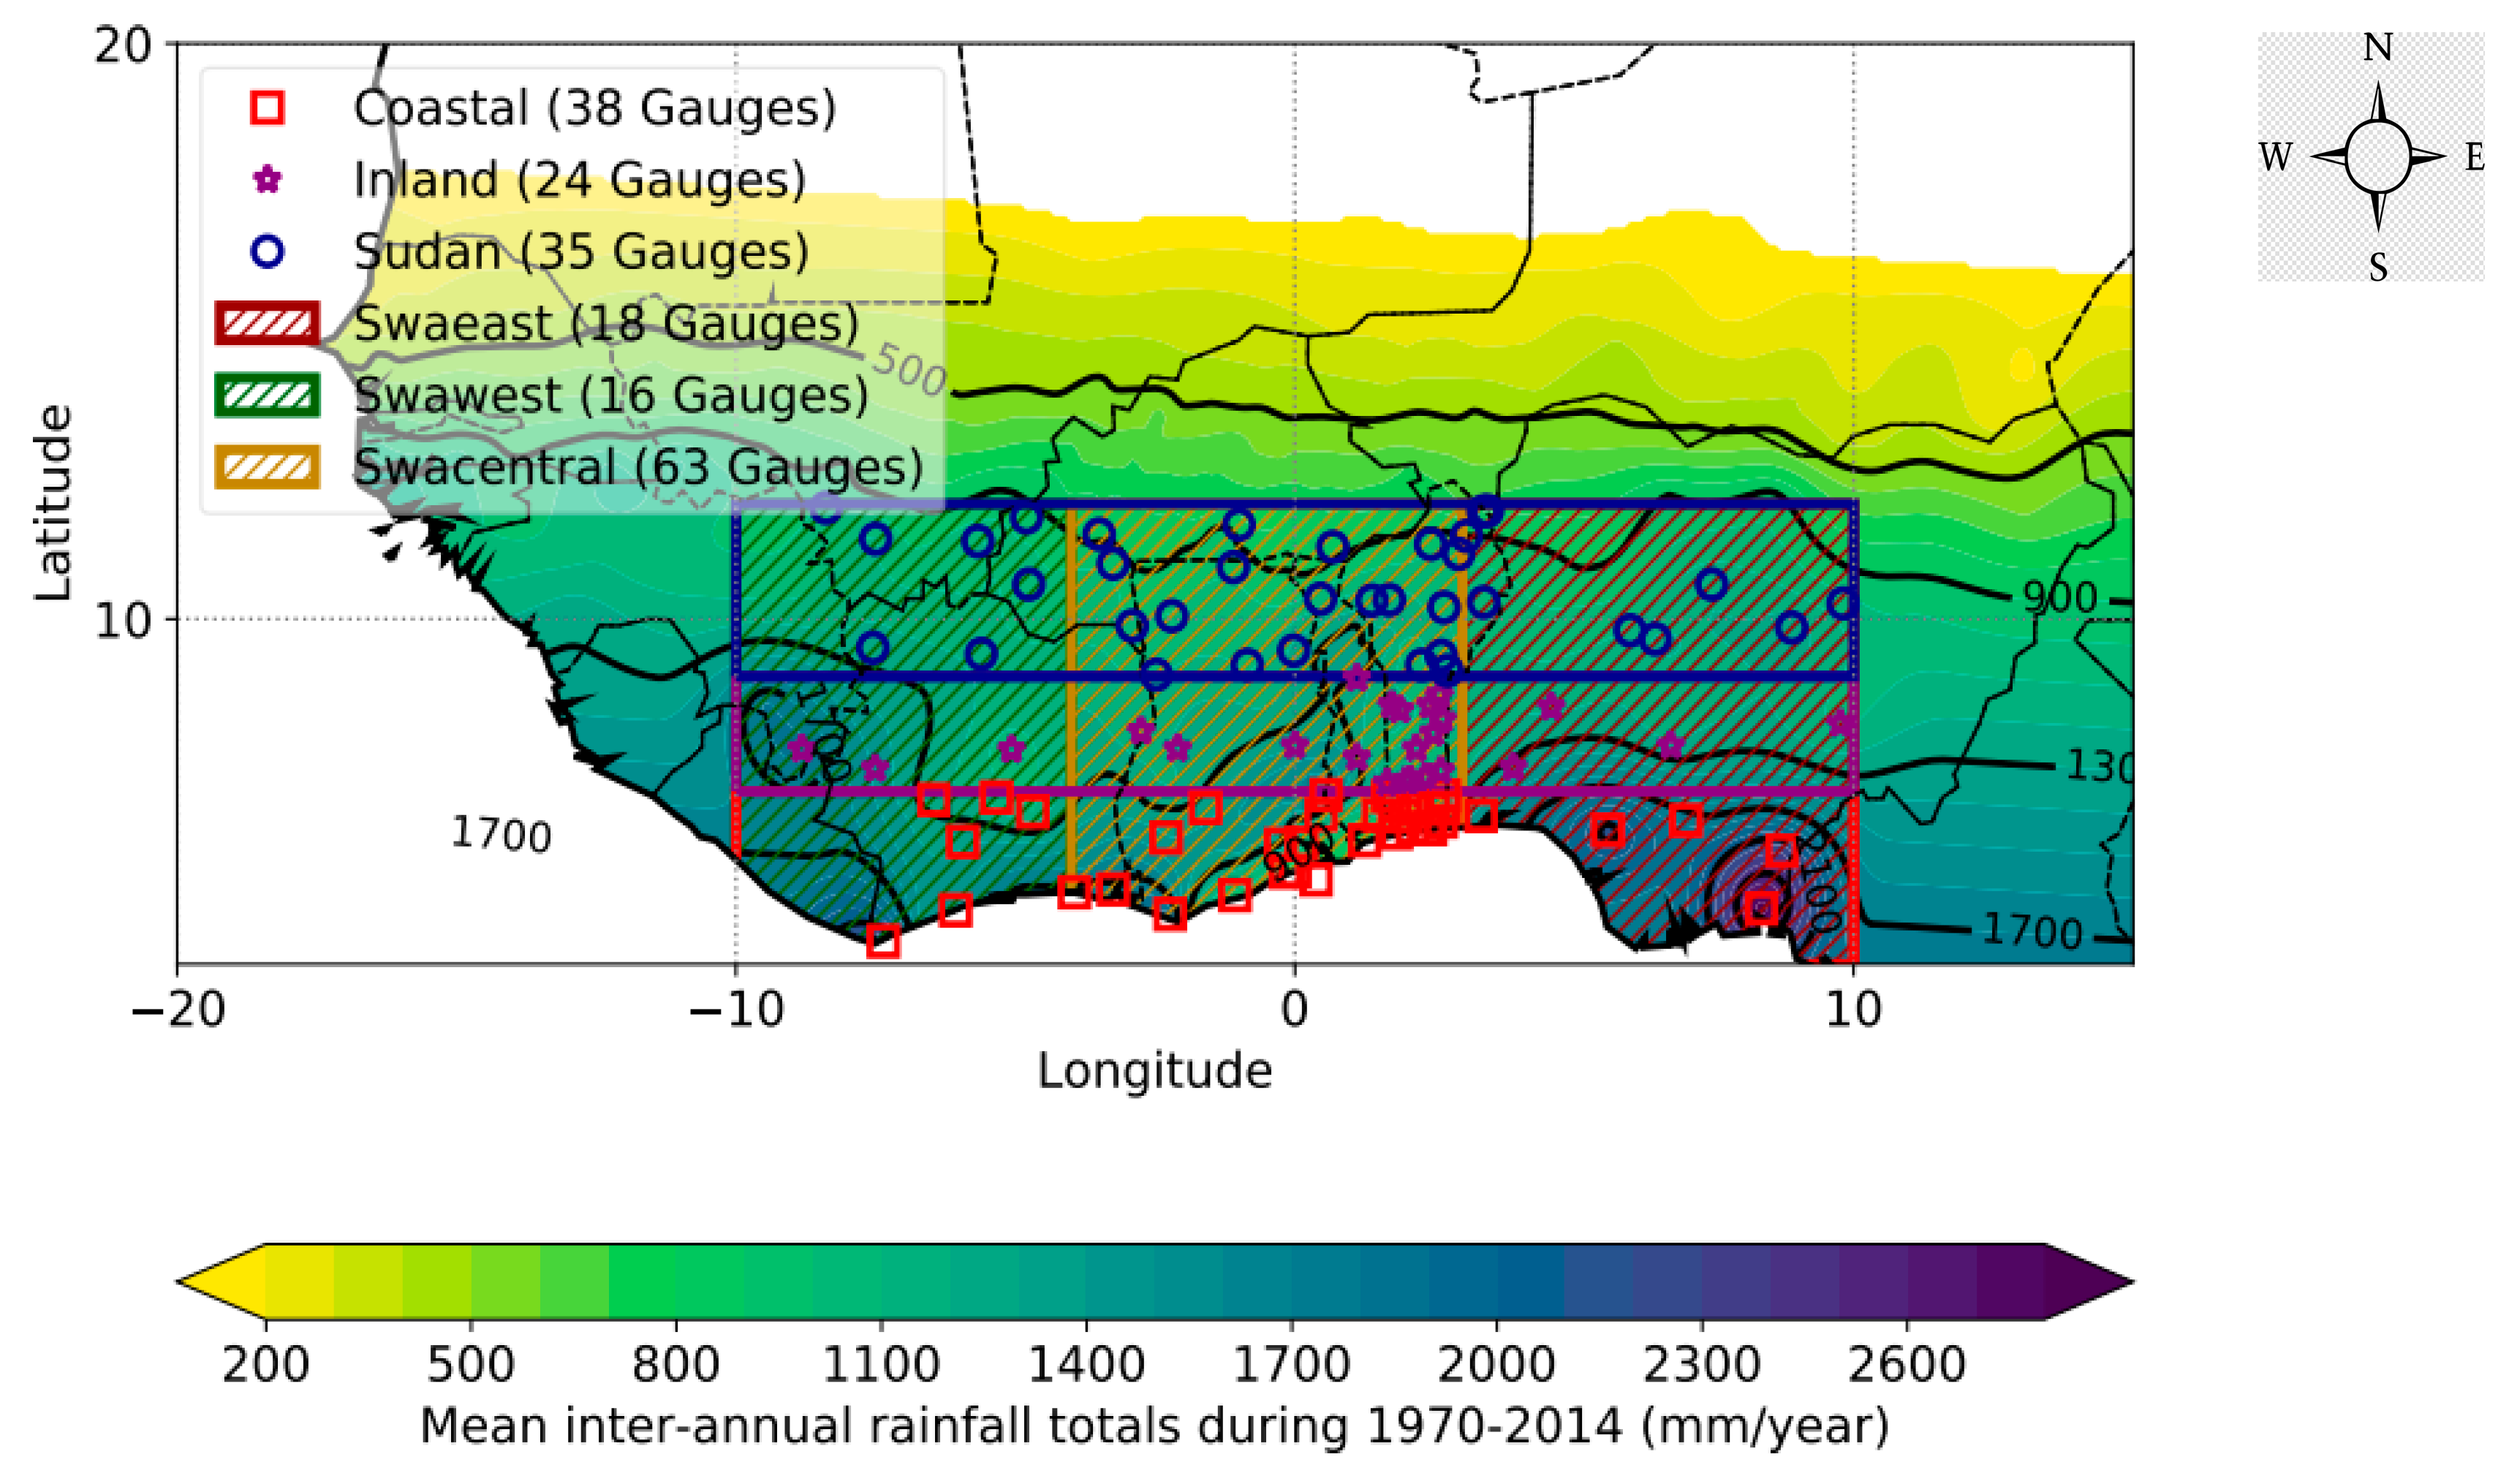
Since about 1950, there has been strong evidence for extreme rainfall events becoming more frequent than expected from natural variability alone across the globe [1,2]. The scientific community, therefore, faces an urgency of informing society about expected changes in climatic conditions and high impact weather events in the future. The predictions of more frequent floods [3] and an increased frequency of extreme rainfall in many parts of the world due to global warming [4] send possible signals of an intensification of the global hydrological cycle [5,6,7]. The economic damages caused by floods, and likewise the number of people affected by them, have increased significantly in recent decades globally [8,9]. Rainfall is of key socio-economic importance for tropical West Africa, located close to the coast of the Atlantic Ocean roughly between 4° N and 25° N, as shown in Figure 2. Activities, such as rain-fed agriculture, livestock rearing, and hydroelectric power production, among other things, are exceedingly vulnerable to extreme precipitation events [10,11].
Various indices and measures have already been used in the literature to explore the frequency, magnitude, and changes in rainfall extremes over seasonal and climatological time scales [12,13,14]. Common approaches include the use of threshold definitions by the Expert Team on Climate Change Detection and Indices (ETCCDI) at the World Meteorological Organization [12,15]. In the hydrology community, extreme rainfall distribution (temporally or spatially) and information on the return level associated to a return period is used in flood risk management [16].
Within the region of West Africa, a lot of work has been done in the Sahel region, with a focus on the evolution of rainfall characteristics. Giannini et al. (2013) [17] and Sanogo et al. (2015) [18] report a trend towards more intense rainfall events in the Sahel, which coincides with a decreased frequency of rainfall events. Other recent studies from Panthou et al. (2013, 2014, 2018) [19,20,21] have focused on the characterization of extreme daily rainfall events in West Africa and analyzed changes in extreme rainfall and rainfall regimes in the Sahel region. Panthou et al. (2014) [20] concluded that the contribution of the extreme rainy days in the annual totals has considerably increased from 19% in the wet period to 21% during the last decade in the Central Sahel during the period 1950–2010. Panthou et al. (2018) [21] found a general increase of daily rainfall intensity over the Sahel since the beginning of the 1980s associated with an increase in extreme sub-daily intensities in South-West Niger since 1990 (African Monsoon Multidisciplinary Analysis - Coupling the Tropical Atmosphere and the Hydrological Cycle, AMMA-CATCH) Niger network, Galle et al. 2018) [22]. Taylor et al. (2017) [23] also suggested that the number of extreme storms has increased during the last 30 years over the Sahel region. They also indicate an increase in the vertical development of the Mesoscale Convective Systems (MCSs) that are responsible for extreme rainfall in the Sahel, facilitating the convergence of humidity and producing exceptional cumulative rainfall.
The findings by Taylor et al. (2017) [23] for the Sahel raise the question of whether similar mechanisms and trends in extreme rainfall could apply to Southern West Africa (SWA), just south of the Sahel, where comparably little work on precipitation-related extremes has been done so far. Most existing studies over SWA examined rainfall evolution during the 1950s to 1990s, using rain gauges as the main source of information for trend detection. Accessing daily rainfall gauge data for recent years is exceptionally difficult in West Africa. Due to this difficulty, most research tends to focus on individual countries in the region. For example, Easterling et al. (2000) [24] observed a decrease in maximum daily rainfall rates up to 1997 in the Sahel region of Nigeria in their analysis of heavy precipitation events in different countries around the world, using the Palmer Drought Severity Index (for both dry and wet seasons) and the number of days with precipitation. New et al. (2006) [25] used daily rainfall data over Africa from only six stations in the Southern West African region (two in the Gambia and four in Nigeria) and identified a rising trend in annual maximum daily rainfall at only one observation site. Goula et al. (2012) [26] in their analysis of annual maximum daily rainfall time series from 34 stations for the period 1947–1995 in the Ivory Coast, reported a downward trend in extreme rainfall events based on three indices (annual maximum rainfall, number of days where precipitation exceeded a 50-mm threshold, and the contribution of rainfall exceeding 50 mm in annual cumulations). Bichet and Diedhiou (2018) [27] provide an analysis of trends in rainfall in the Guinea Coast based on satellite estimates but supported by only a limited number of rain gauge data. Complementing existing studies for individual countries in SWA, this study will therefore evaluate extreme rainfall characteristics based on a novel rain gauge dataset that combines gauge data provided by West African national weather stations at a daily timescale since 1950. The aim of this paper is to reconcile the various results for rainfall trends in SWA and improve the spatial picture of rainfall regime changes in that region. Thus, a thorough analysis of the characterization of extreme daily rainfall events over the SWA was conducted, capturing recent trends sub-divisional differences and their impact over SWA. This study, therefore, seeks to:
- Report recent trends in extreme rainfall in Southern West Africa, based on long series of daily rainfall covering the period 1950–2014 quite homogeneously over the 4° N–12° N and 10° W–10° E domains;
- Compare the characteristics of recent rainfall regime changes in different sub-divisions in the SWA region. The sub-divisions created from the Southern West African region is mainly based on the differences in the configuration of rainfall patterns; and
- Analyze separately the influence of each rainfall season in the sub-divisions of SWA, which shows a bimodal distribution, and their contributions to rainfall trends over the study period.
The next section describes the climatological context of the study area, the rainfall dataset, and the methodology used in the investigation of rainfall extremes. In Section 3, a statistical analysis of extreme events is performed, and other results are discussed. Finally, Section 4 summarizes the primary results of this study.
2. Region, Data, and Methodology
2.1. Climate of Southern West Africa
The climate of the SWA region is driven by the annual West African monsoon that occurs during boreal summer. It is characterized by two distinct rainfall patterns: A Sudanian climate, with one wet and one dry season in the northern part (higher than roughly 9° N), and a Guinean climate, with two wet (bimodal) seasons in the southern part, also called the forest zone (~4–9° N; e.g., [28]).
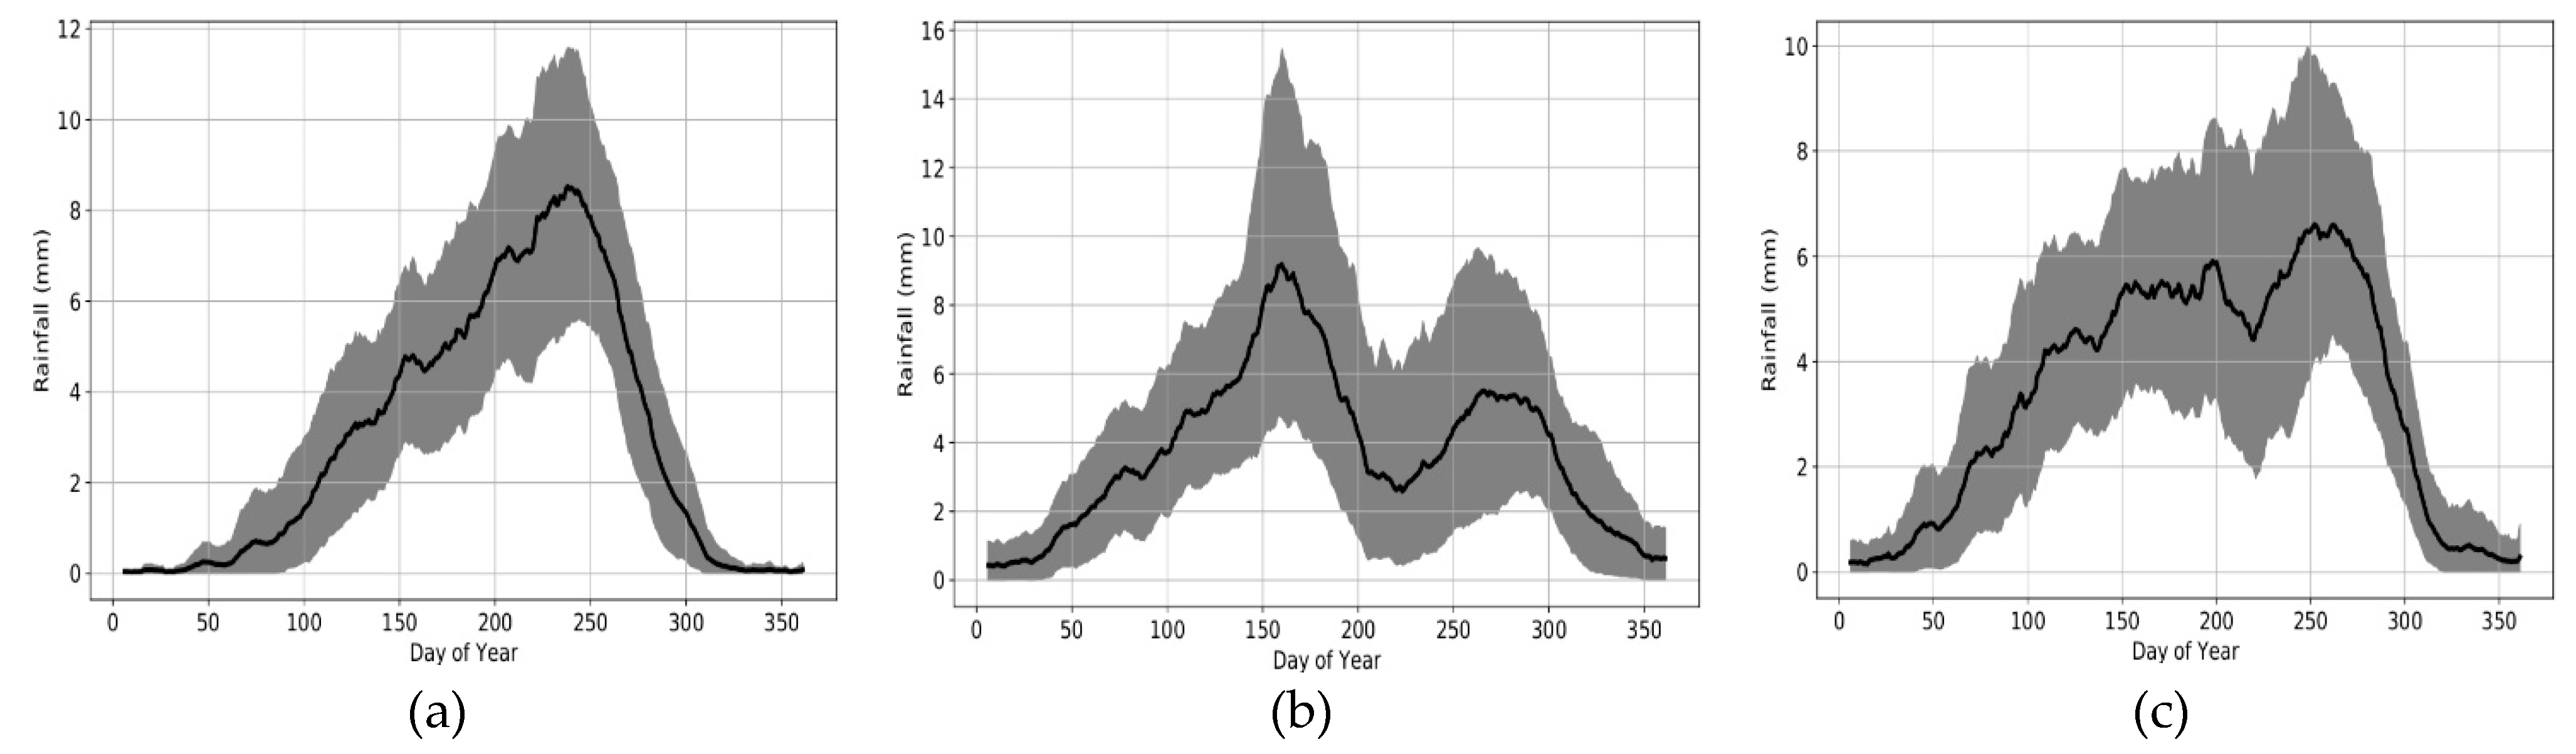
The unimodal Sudanian rainfall regime extends from mid-March to the end of October [29] and peaks during the months of July and August (Figure 1a). The average annual rainfall is approximately 1200 mm, but it displays a marked regional north–south gradient (Figure 2).
Figure 1.
Seasonal cycle of rainfall over the Guinean climate: (a) Sudan and (b) Coastal and (c) inland sub-divisions of SWA (Southern West Africa). The solid black line represents the mean rainfall while the gray zone represents the 95% interval.
Figure 2.
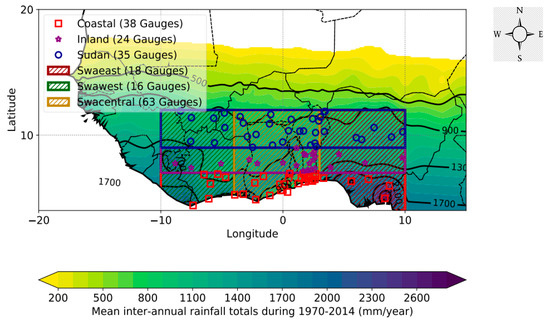
Long-term daily rainfall series used to quantify rainfall over six sub-divisions over the SWA; mean annual rainfall totals over the West African region (shading) from rain gauge data are also represented for the period 1970–2014.
The Guinean climate exhibits different patterns over its coast and the inland region. The coastal region displays a bimodal rainfall cycle exhibiting a clear major rainy season, which peaks in June and a second—producing less rainfall—in September and October during the return of the rainbelt to the south (Figure 1b). In this region, some areas receive in excess of 2000 mm each year. The inland region also shows a bimodal distribution, however, with a somewhat higher minor peak in September (Figure 1c). A local minimum is observed in August, marking the so-called “little dry season” [30,31]. This so-called Dahomey gap is a tract of savannah with relatively little rain, which stretches from the coast of central Ghana and runs east through Togo and Benin.
2.2. Rainfall Data, Areas, and Periods of Study
For this study, we accessed daily rainfall data from over 200 stations along with detailed metadata covering SWA from 10° W to 10° E and 4° N to 12° N. This network incorporates climate stations gathered by the National Meteorological Agencies within the region with measurements available from 1950 to 2014. Rainfall is measured by either tipping buckets or from automatic rain gauges. Missing data and temporal inhomogeneity were checked before using data in subsequent analyses.
From this large dataset, attention was paid to assess changes in rainfall characteristics over the period 1950–2014 in order to analyze the decadal variability of the rainfall regime. We also aimed at not only studying rainfall regime changes at the scale of the entire SWA but also within the study region. Indeed, recent studies showed that contrasting rainfall trends can be observed inside climate entities, such as, for instance, in the Sahel (see, e.g., [21,32,33,34]). However, it was not possible to select one single dataset with a sufficient number of stations covering the entire period (1950–2014) and the study region to allow a robust analysis in sub-domains.
Two complementary datasets were thus considered in this study. The first dataset was selected to analyze rainfall changes over the entire study region covering the period from 1950 to 2014. It consisted of 65 stations with less than 10% of missing data out of the 65 years. The method for data checking and quality control is fully explained in Panthou et al. (2018) [21], where a criterion is used to classify a year as missing. The annual aggregation of a missing year is achieved by attributing a flag value at each of these steps:
- If its annual total is 2 (respectively 5) times the mean annual total of the whole series, then the flag equals 1 (respectively 2), or else the flag = 0;
- The same algorithm for the mean number of wet days;
- The same algorithm for the mean intensity of wet days; and
- An interannual average of monthly totals is computed, and rainy/dry months are classified according to a threshold of 90 mm. Then, the flag value is equal to the number of months that have not recorded rains.
The aggregated flag of a particular year is given by the sum of the four flags. If the aggregated flag is ≤1, the year is marked as valid or else as missing. This procedure is somewhat strict but leads to confidence in the quality of information available for a year qualified as valid.
The second dataset was designed to analyze spatial contrasts in rainfall changes by selecting stations covering homogeneously six sub-divisions:
- The coastal region, the southernmost sub-division of SWA from 4° N to 7° N;
- The inland region, representing the middle sub-division of SWA from 7° N to 9° N;
- The Sudan region, the northernmost sub-division of SWA from 9° N to 12° N;
- The West region of SWA (referred to as swaWEST) from 10° W to 3° W;
- The central region of SWA (referred to as swaCENTRAL) from 3° W to 3° E; and
- The East region of SWA (referred to as swaEAST) from 3° E to 10° E.
The optimization of the rain gauge network spatial coverage over these sub-domains is done at the expense of the time record length. Here, we decided to focus the analysis on the most recent time period by starting from 2014 and going backwards in time in the rainfall series while preserving the maximum spatial coverage. The period 1970–2014 was retained as a good compromise between record length and spatial coverage. The corresponding dataset consisted of 97 rain gauges evenly distributed over the study region (Figure 2) with less than 10% missing years per station over the 45 years. These daily missing values were excluded when computing the annual statistics.
2.3. Methodology
Our methodological approach builds on the recent study of Panthou et al. (2018) [21] achieved over the Sahelian West Africa. Based on daily rainfall data, our rainfall regime analysis relied on the investigation of four rainfall metrics: The spatial mean of annual rainfall totals (AR), the number of rainy days (NWD), the mean wet day intensity (MWD), and the 90th, 95th, and 98th percentiles of positive daily rainfall. The computed annual statistics do not take into consideration the zero (0) rainfall events. These four metrics were computed at the seasonal scale, a season being defined from April to July and September to November. They were also computed at the sub-seasonal scale for the inland and coastal Guinean areas by separating the first season, defined from April to July, from the second season, defined from September to November. The term NWD was used in this study to denote a day on which a station recorded at least 1 mm of rainfall. As depicted in Panthou et al. (2018) [21], the metrics were first computed at the station scale in order to derive regional mean values by using a kriging approach. Because of the rainfall network spatial configuration and the low density of its coverage, regional mean values are subject to uncertainties. Confidence intervals were thus derived based on a spatial bootstrap method (as in [21]). The standard parametric t-test (also sometimes referred to as the Student t-test) was further used to determine the significance of the difference between recent and past trends in the extreme rainfall indices.
3. Regional Rainfall Trends and Sub-Regional Contrasts at the Seasonal Scale
3.1. Regional Rainfall Trends
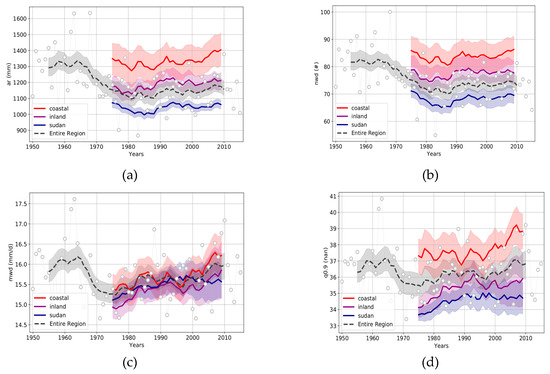
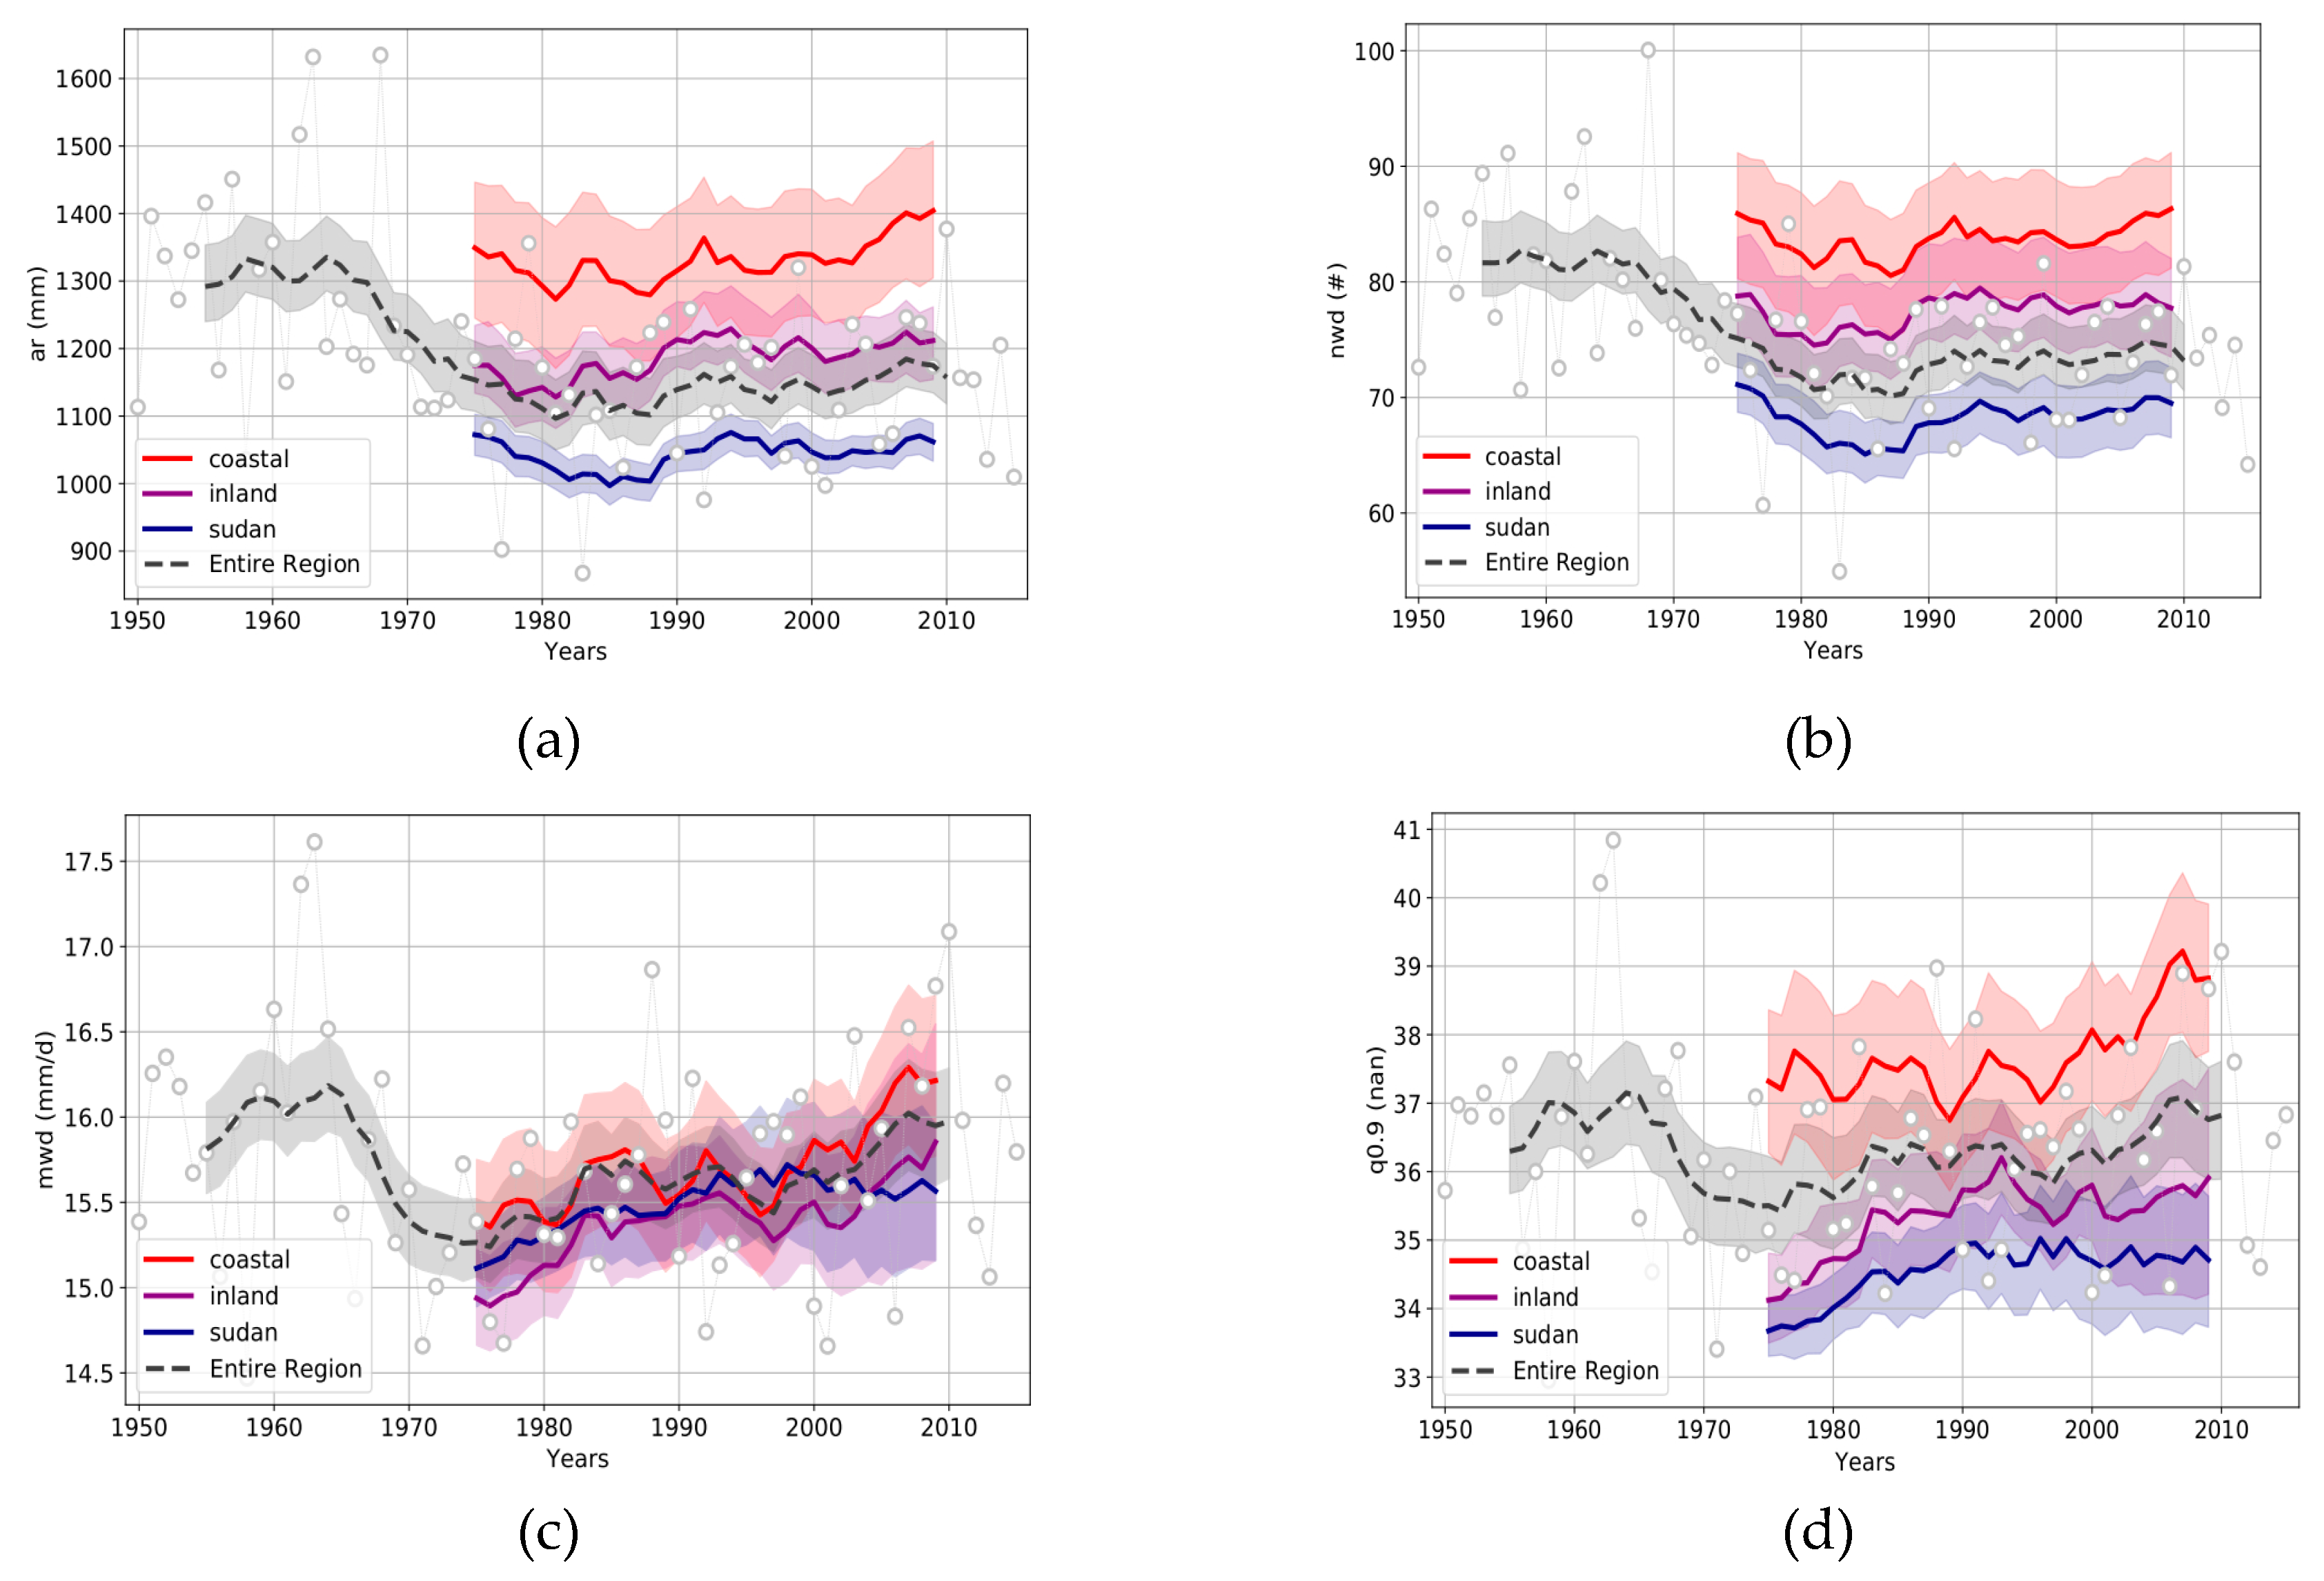
The Southern West Africa (SWA) mean annual rainfall total (AR) displays a reduction in the rainfall amount between 1960 and 1980 with a slight increase at the end of the 1980s, with annual totals far below what was observed in the 1950s (Figure 3a). A similar pattern to that of AR is depicted in the number of wet days (NWD), with a decrease from the mid-1960s to 1980, which was followed by a slight upward trend after 1980. From 1960 to the mid-1970s, the mean intensity of wet days (MWD) depicts a similar pattern over the entire region with a sharp decrease and a clear increasing trend from the 1980s through to 2014. It should be noted that the relative recovery observed over 1980 to 2014 in MWD is larger than the increase in NWD. Events above the 90th percentile (q0.9) increased from the 1980s to 2000s, recording extremes close to that observed in the 1950s. It is worth noting that MWD tends to increase with increasing q0.9. The other tested percentiles displayed similar temporal patterns as observed in q0.9 (analysis of the 95th (q0.95) and 99th (q0.99) percentiles is displayed in the Appendix A). In all following figures, we kept the 1950–2014 curves as a comparison with the period 1970–2014.
Figure 3.
Plots of the 11-year moving averages of (a) mean annual rainfall total (AR) (mm); (b) number of wet days (NWD) (days); (c) mean intensity of wet days (MWD) (mm/day); and (d) 90th percentile (q0.9) (mm/day) for coastal, inland, and Sudan sub-divisions.
3.2. South–North (Coastal–Sudan) Disparity
An analysis was made to understand the behavior of the rainfall regime of daily indices across the south–north sub-divisions for the period between 1970 and 2014 (Figure 3). Rainfall patterns over all sub-divisions seem to observe similar trends in mean annual rainfall (AR) and number of rainy days (NWD) as portrayed over the entire region. Nevertheless, changes in mean intensity (MWD) were observed during the mid-1990s, with the coastal and inland regions showing an increment in MWD and the Sudan region observing a slightly downward trend. These observed changes in MWD are noticeable over the coastal region, as seen in the extreme index (q0.9). The inland and Sudan regions do not observe clear changes in extreme events. Extreme rainfall above the 90th percentile observed a steady increase in the coastal region from 1990, while the inland and Sudan regions observed an increase between 1970 and 1990, followed by a stabilization through to the current years.
Decadal differences observed at these subregions show that the coastal region is observed to be wetter, with about 5% more rainfall over the recent decade (2005–2014) as compared to an early decade (1970–1979) (Table 1). The inland region observed 4% more rainfall over 2005 to 2014 as compared to 1970 to 1979 and a 1% decrease in rainfall in the Sudan region over 2005 to 2014 as compared to 1970 to 1979, although all these changes are not significant. The differences observed in the last two decades also show a non-significant increase of the rainfall amount, with wetter conditions of 4% more rainfall over 2005 to 2014 as compared to 1995 to 2004 over the coastal region, a decrease of 1% in the mean annual rainfall in the inland region over 2005 to 2014 as compared to 1995 to 2004, and the Sudan region recording a 1% increase in rainfall amounts over the last two decades.
Table 1.
Relative variation of some key statistics of the rainfall regime: (1) Over 2005 to 2014 as compared to 1970 to 1979, and (2) over 2005 to 2014 as compared to 1995 to 2004. These two differences are separated by a semicolon (1; 2). Stars indicate the significance level of the T-Student test: 10% (*), 5% (**), and 1% (***).
Trends of NWD between 2005 and 2014 and 1970 and 1979 show an insignificant increase of 1% in NWD in the coastal region and decrease of 1% and 3% in the inland and Sudan regions, respectively (Figure 3 and Table 1). The recent two decades experienced an overall insignificant trend, with an increment in NWD of 2% and 1% in the coastal and Sudan regions, respectively, with the inland region still observing a decrease of 2% in NWD. On the other hand, it is observed that the mean rainfall intensity (MWD) shows a 6% significant increase over 2005 to 2014 as compared to 1970 to 1979 over the coastal and inland region, and the Sudan region recording a 4% significant increase. Over the last two decades (i.e., 2005–2014 and 1995–2004), there have been no significant changes over the region, with the coastal region realizing a 3% increment in MWD, the inland region recording an increment of 2%, and the Sudan region recording no changes in MWD. Considering the contribution of extreme rainfall to annual rainfall, a significant increase of 10% is realized in the Sudan region over the last decade as compared to 1970 to 1979, with the coastal region observing a 6% increment (Table 1). The inland region, on the other hand, observed a 3% reduction in this index, although this is not significant. Changes in the last two decades show no significant trend, although the inland region observed a decline of about 7% in the contribution of extreme events to annual rainfall while the coastal and Sudan regions depicted an increase of 2% and 4%, respectively.
3.3. East–West Disparity
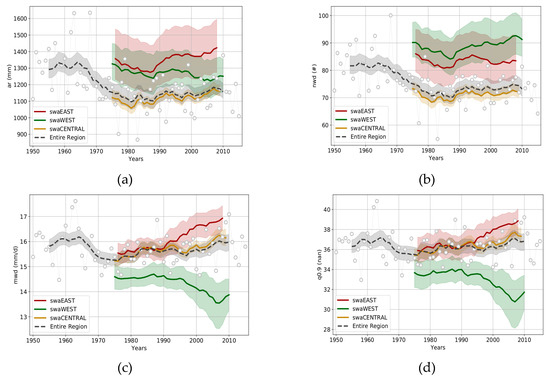
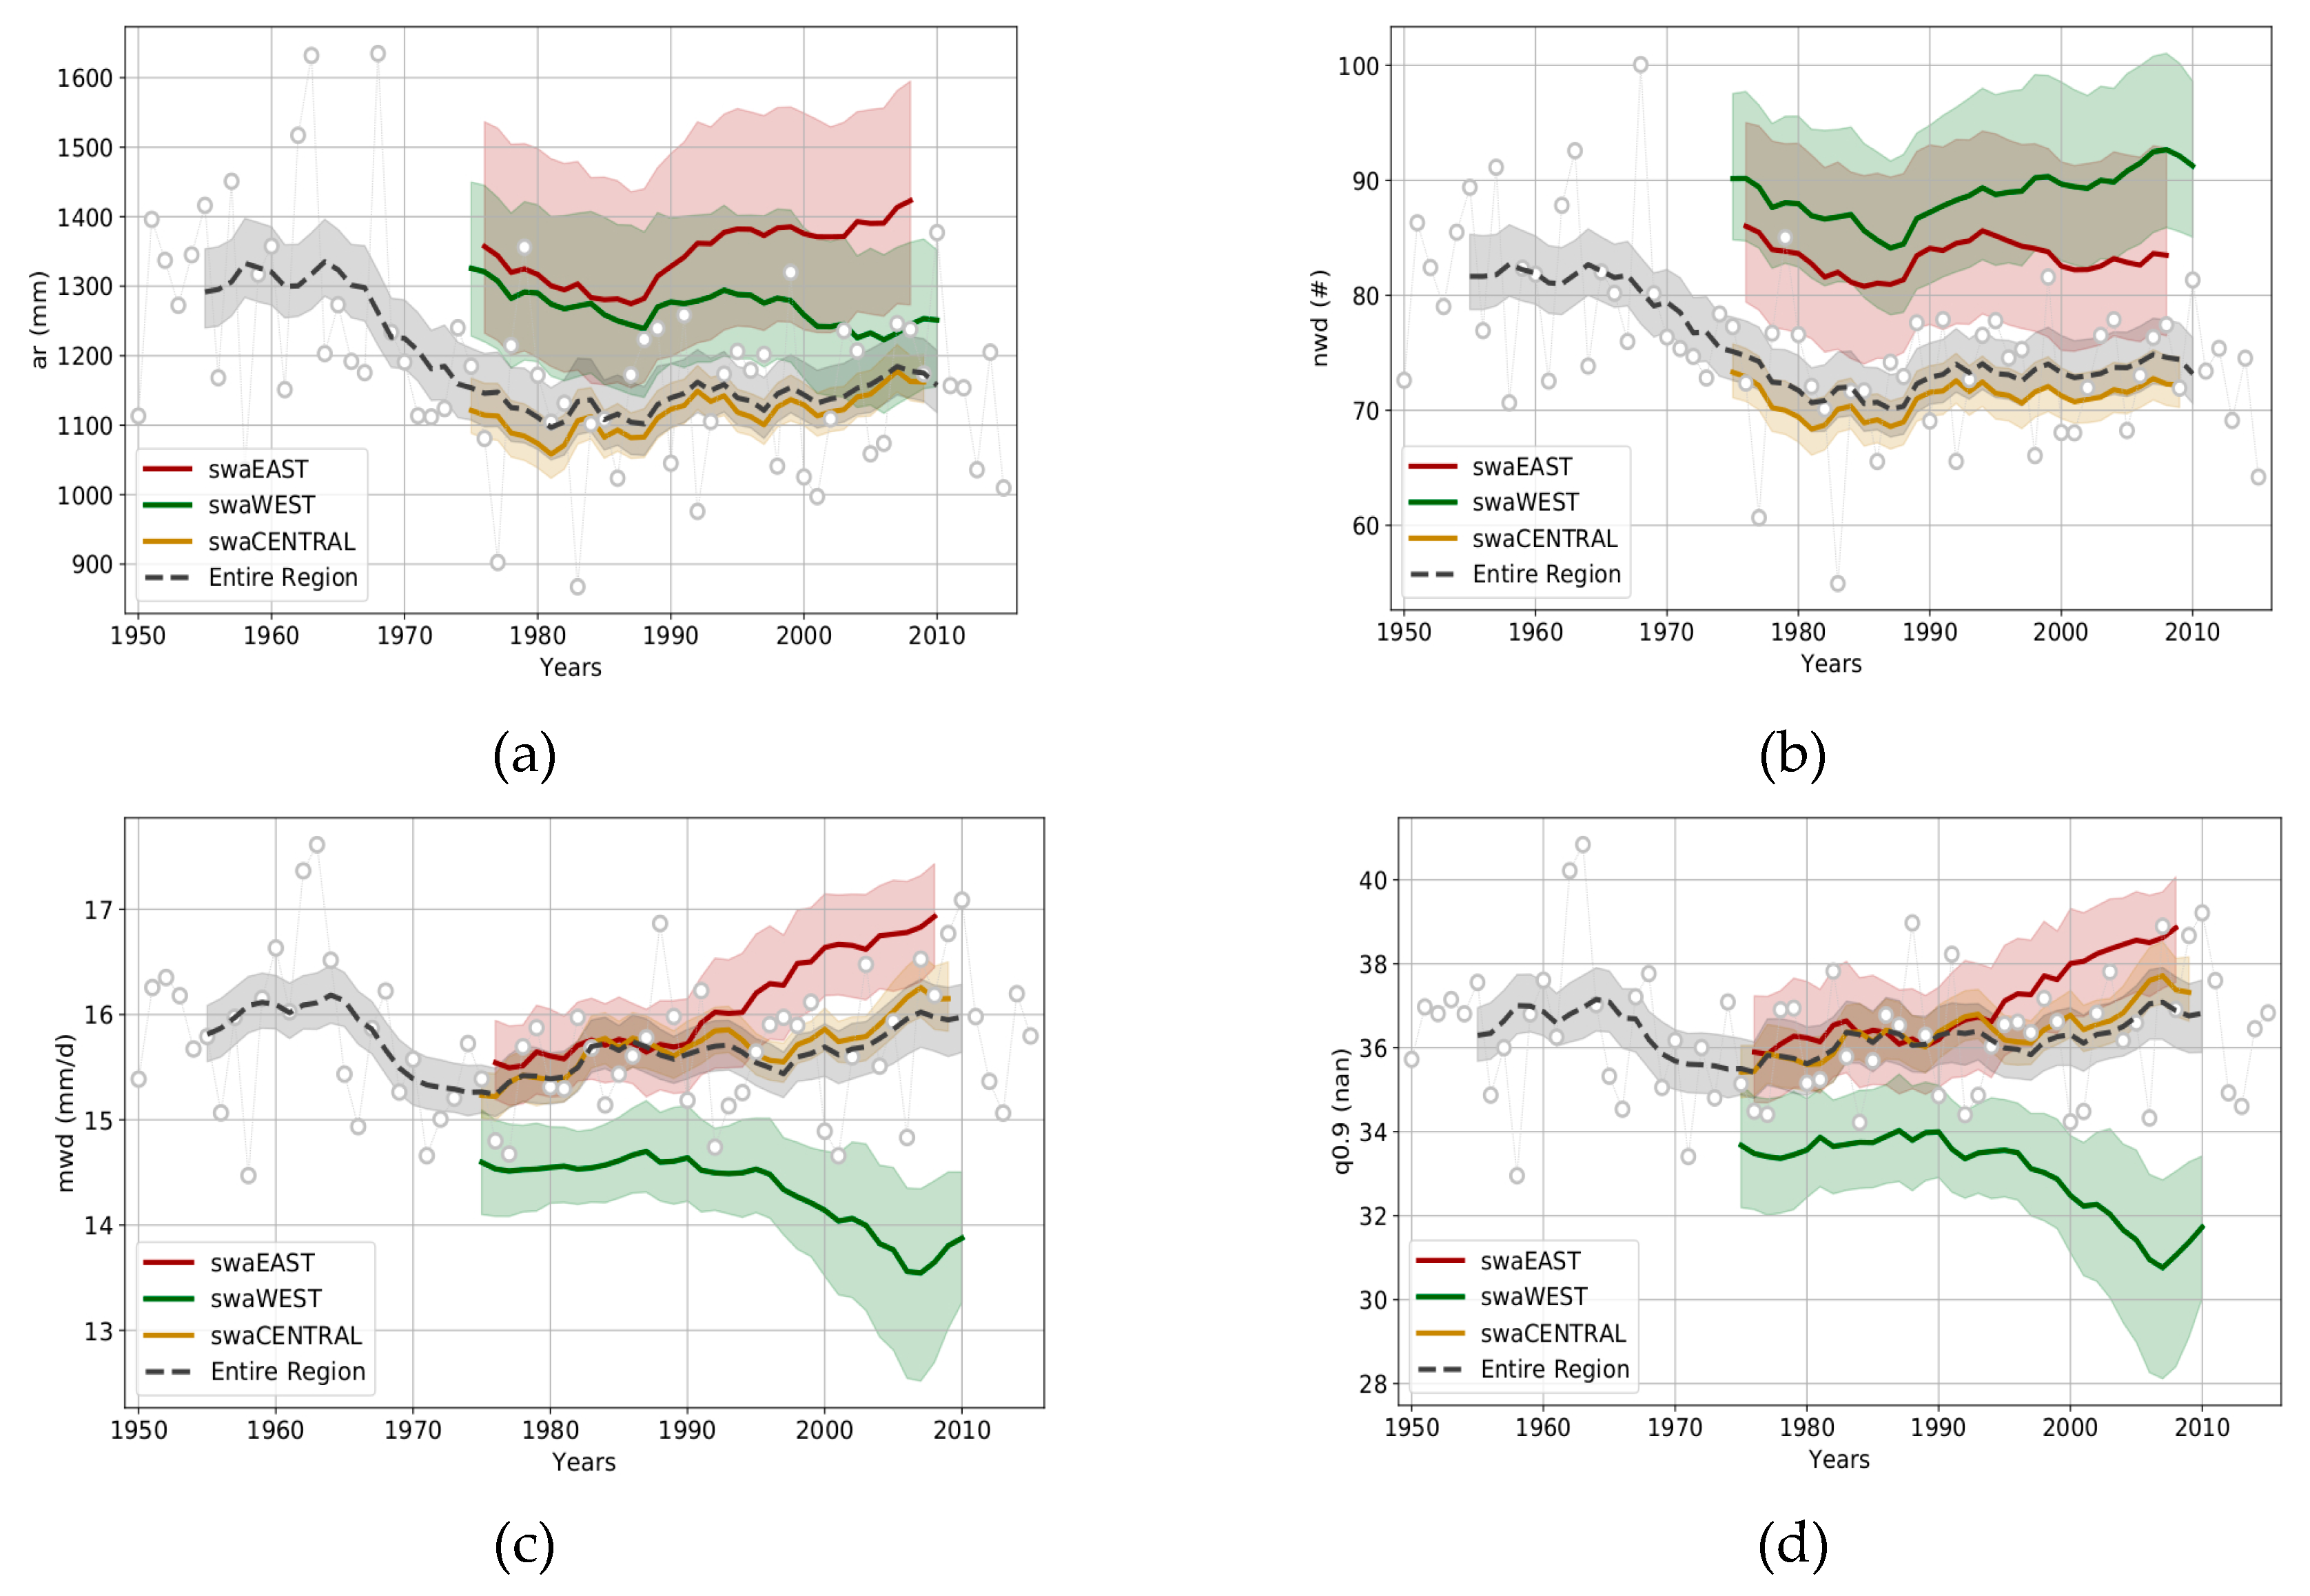
The mean annual rainfall totals (AR) were first analyzed for the general behavior of annual rainfall over the swaEAST, swaCENTRAL, and swaWEST (Figure 4). Due to similarities in the swaCENTRAL over all mean trend of the whole SWA region, this discussion focuses on the disparity between the swaEAST and swaWEST. AR depicts a decrease from the 1970s to the start of 1990 in all sub-divisions. All three sub-regions observed an increase after 1990, although swaWEST seems to have observed a decrease from 2000 with a slight increase at the end of that decade. NWD displays a similar evolution as in AR, with a decrease between 1970 and the late 1980s in all sub-regions followed by a slight recovery through to the current decade, while swaEAST displayed a decrease in the number of events from the late 1990s. The mean intensity of wet days (MWD) tended to display an interesting behavior, with swaEAST and swaWEST displaying a ‘mirror’ pattern after a steady trend between 1970 and 1990. swaEAST depicts an increase surpassing the events in the 1950s while swaWEST displays a decrease from the 1990s. An overall similar pattern is observed with the 90th percentile index, showing an increase in extreme rainfall over swaEAST from 1990 onwards. As a result, extreme rainfall is now roughly above levels observed in the 1950s (Figure 4). The swaWEST region, on the other hand, displays a continuous decrease from 1990 to the late 2000s, after which a sharp increase is observed. From these observations, it can be said that swaWEST remains drier (5% less rainfall over 2004 to 2014 than over 1970 to 1979) while the swaEAST recorded a wetter decade (7% more rainfall over 2004 to 2014 than over 1970 to 1979). These differences in behavior between the swaEAST and swaWEST also hold in the evolution of NWD and MWD. In NWD, the West observes a decrease from 1970 to the end of the 1980s, followed by an increase of about 3% above the mean average of the 1970–1979 period (Table 2). The Eastern sub-region, on the other hand, recorded a decrease (2% fewer wet days over 2004 to 2014 than over 1970 to 1979). Consequently, while MWD has significantly increased (10%) over swaEAST in the recent decade compared to the 1970s, the swaWEST recorded a significant 5% decrease in mean intensities after a steady trend in the 1970s. Similar patterns persisted in observations made with q0.9, with the east region experiencing an increasing trend after the 1980s and the west region recording a significant decrease after the 1980s. It can be noted that the trends observed in the mean rainfall intensity correlate well with thee trends in extreme events over the SWA region.
Figure 4.
Plots of the 11-year moving averages of (a) mean annual rainfall total (AR); (b) number of wet days (NWD) (days); (c) mean intensity of wet days (MWD), and (d) 90th percentile (q0.9) for east, west, and central sub-divisions.
Table 2.
Relative variation of some key statistics of the rainfall regime: (1) Over 2005 to 2014 as compared to 1970 to 1979, and (2) over 2005 to 2014 as compared to 1995 to 2004. These two differences are separated by a semicolon (1; 2). Stars indicate the significance level of the T-Student test: 10% (*), 5% (**), and 1% (***). (swaEAST: East region of SWA, swaWEST: West region of SWA, swaCENTRAL: central region of SWA, SWA: Southern West Africa).
The observed disparity is also evident when taking into account the contribution of extreme events to annual rainfall, which increased significantly by 14% in the east and decreased significantly by 17% in the west (Table 2). It should be pointed out that the swaEAST region (which observed similar trends as that of the central region) displays a clear contrast in recent trends to that of the swaWEST region. An increment in an index in the east corresponds with a reduction in an index at the west, and vice versa. Comparisons made between the last two decades (i.e., 2005–2014 and 1995–2004) show slight changes in patterns; however, these changes are not significant. It is realized that the swaEAST region observes an increase across all indices while swaWEST records a decrease in all indices, with an exception in the number of rainy days, which realizes a nonsignificant increase.
3.4. Disparities between the Two Rainy Seasons (AMJJ and SON) in the SWA Coastal and Inland Regions.
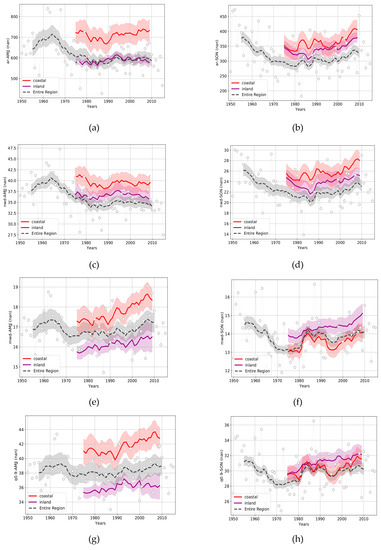
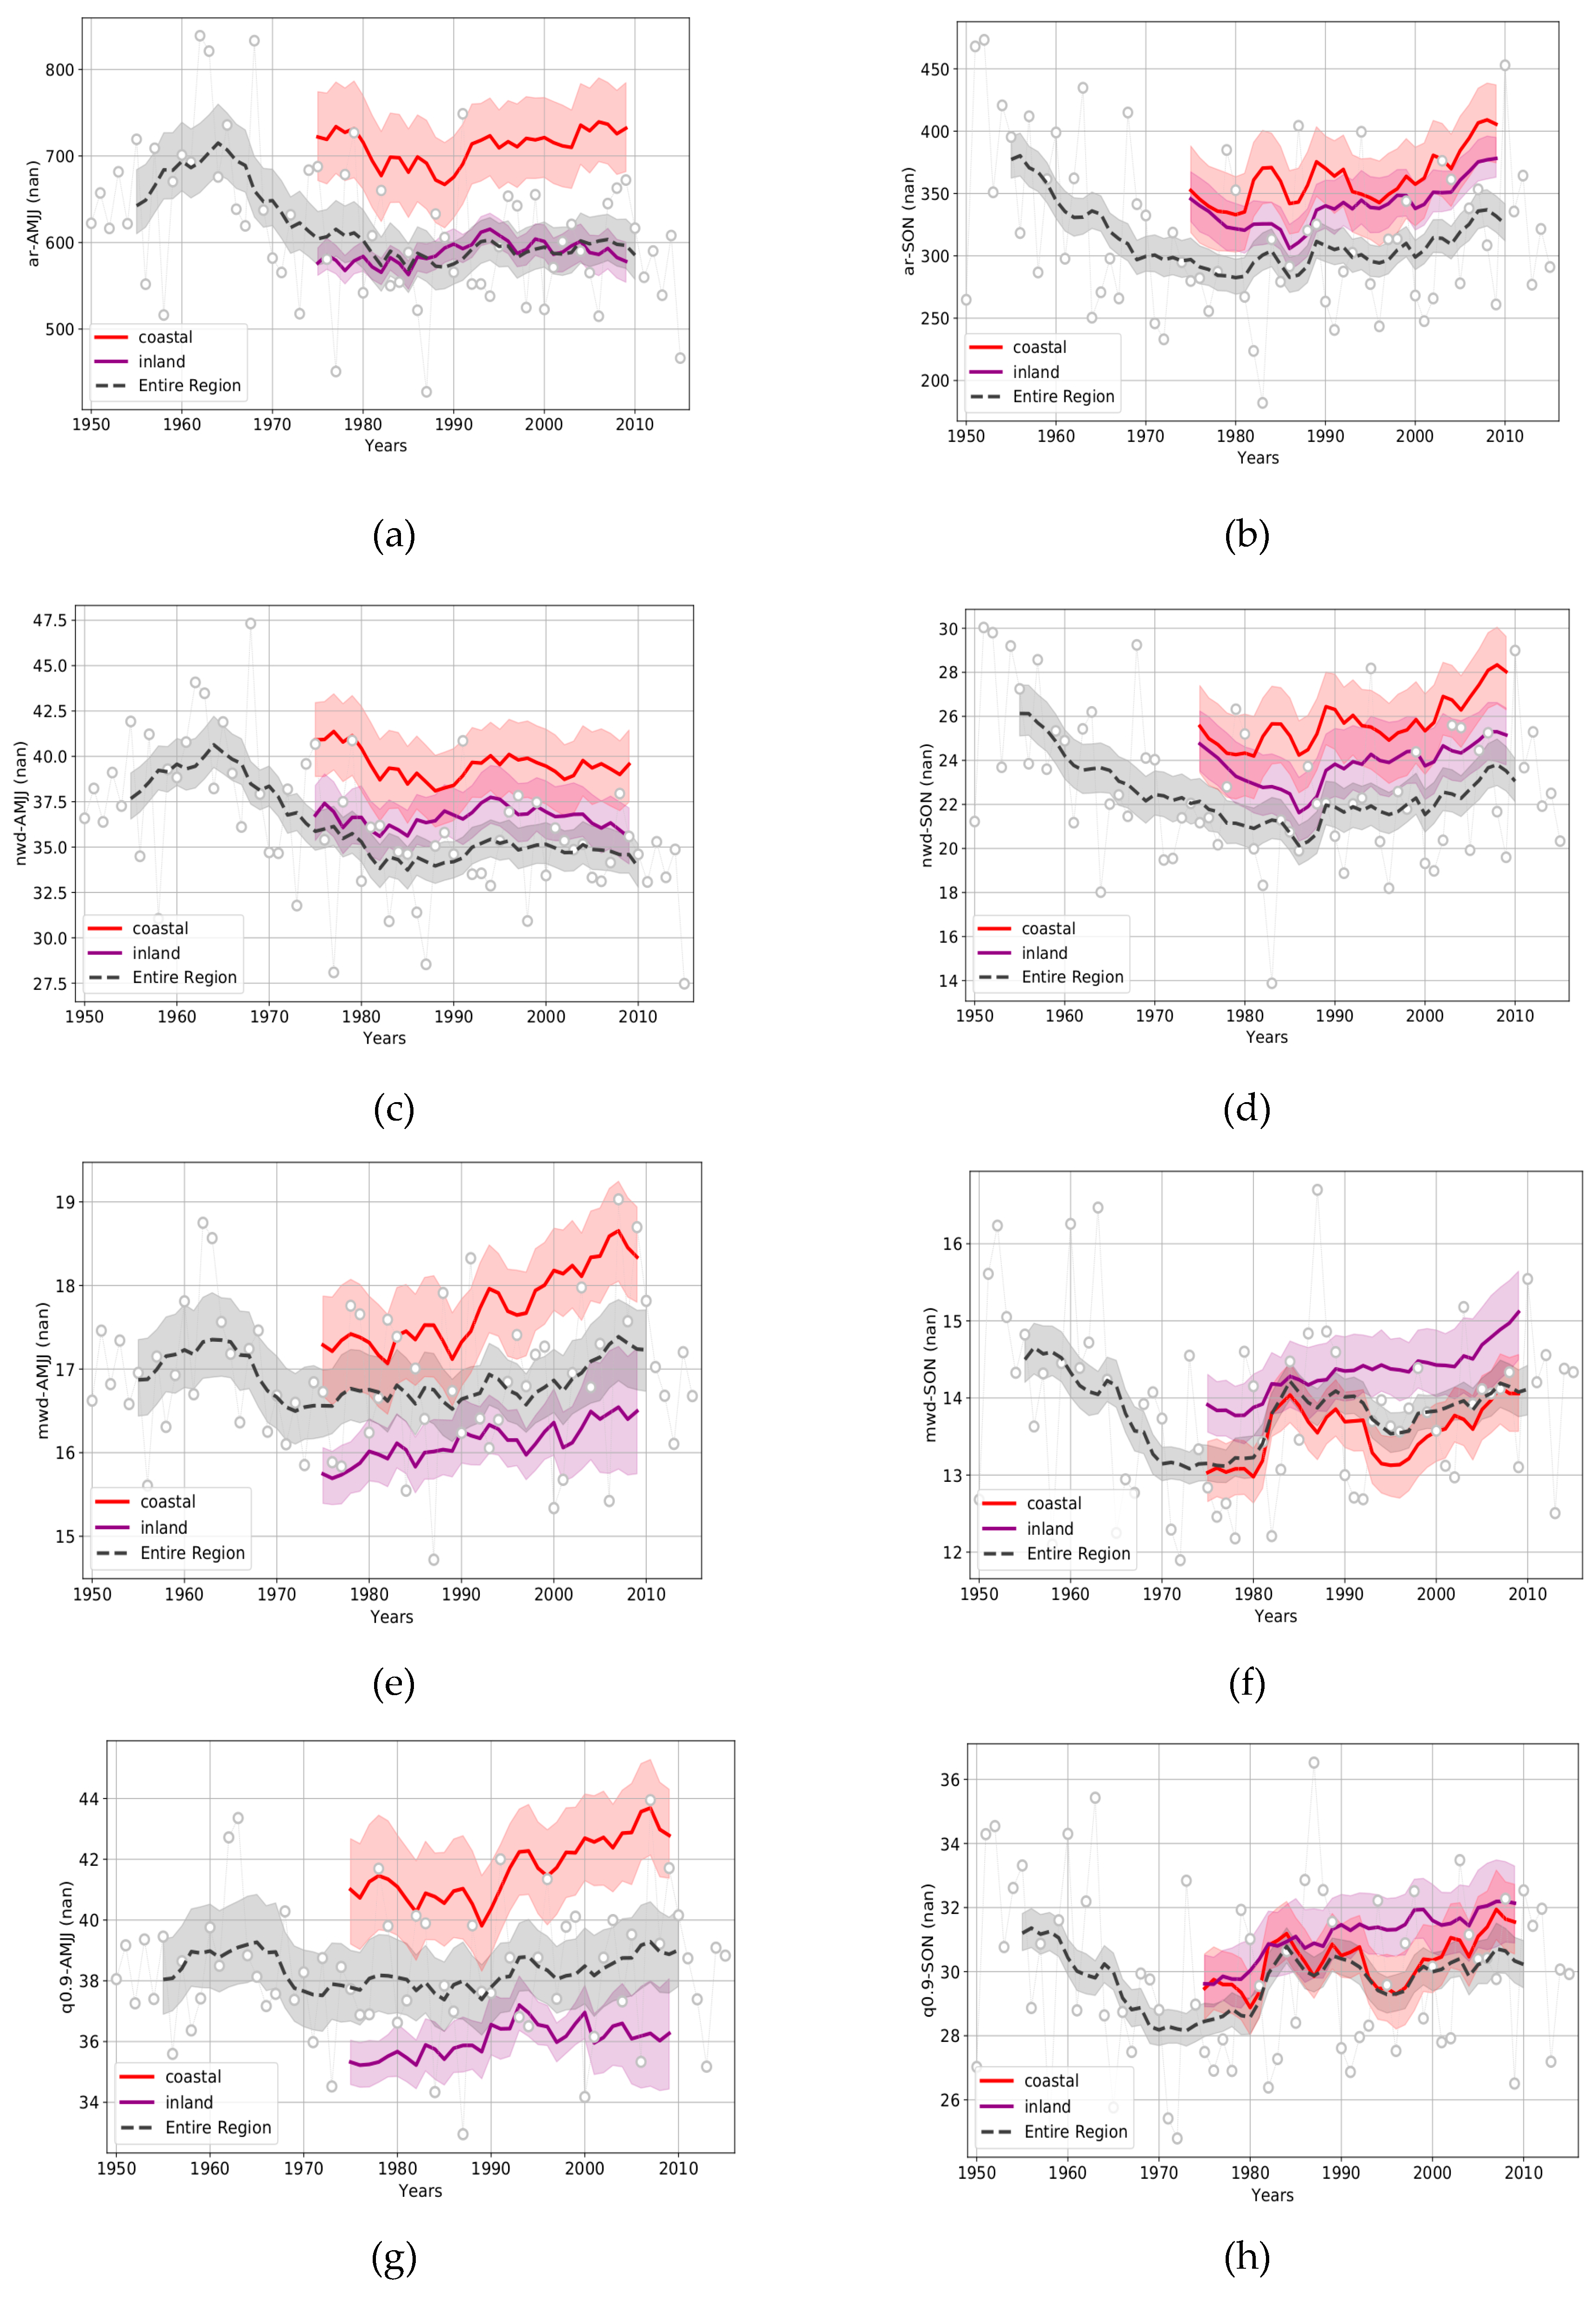
The analysis of rainfall variabilities over the forest zone (region exhibiting bimodal distribution), with a focus on the two rainfall seasons was carried out. Two general comments can be drawn from Figure 5. First of all, seasonal rainfall indices (AR, NWD, MWD, and q0.9) over the AMJJ continues to record higher values in the coastal region as compared to other sub-seasonal divisions (Figure 5). Second, rainfall indices for the coastal region display higher values than for the inland region, with the exception of the MWD and q0.9 indices for the SON period.
Figure 5.
Plots of the 11-year moving averages of seasonal rainfall total; mean intensity of wet days (MWD) (mm); number of wet days (NWD) (days), and 90th percentile (q0.9) for April–May–June–July (AMJJ) (a,c,e,g) and September–October–November (SON) (b,d,f,h) rainfall seasons for coastal, inland, and Sudan sub-divisions.
Annual rainfall (AR) reached its lowest values in the late 1980s over the coastal region. It increases afterwards to averages observed in the mid-1970s. The inland region recorded a steady even trend throughout the period in the first rainy season. The SON rainfall season, on the other hand, has experienced an increase in annual rainfall over the inland region from the mid-1980s, with the coastal region realizing an increasing trend in the 1990s.
For NWD in AMJJ, both regions observed an initial decrease during the 1970s, and remained fairly stable, depicting a general decrease in the frequency of occurrence of wet events over the forest zone of the SWA region during AMJJ. Nevertheless, the SON season recorded an increase in NWD after a downward trend from 1970 to the late 1980s.
It is worth noting the increasing trend of MWD in the AMJJ rainfall season over both the coastal and inland sub-domains from the 1970s to the recent decade. In the SON season, the inland sub-division, MWD observed a gradual increase until the start of the last decade and then, a sharp gain was recorded during the last decade. The coastal sub-division witnessed an unstable trend, with the 1980s recording high intensities compared to the 1970s. The index reached its lowest values in the mid-1990s; it sharply increased afterwards.
During the AMJJ season, the q0.9 index observed an increment from the late 1980s in the coastal sub-division, with the inland sub-division realizing a fairly steady trend over the whole period. The pattern realized over the SON season for the q0.9 index depicts the trends observed in the MWD index for the same season.
4. Discussion
To summarize, the detection of long-term variabilities in the evolution of rainfall of tropical regions like Southern West Africa (SWA) from observations has been a challenge and also a necessity since climate models often do not agree on this issue. The use of advanced statistical tools remains, therefore, a potent source to obtain relevant information on the detection of significant changes in the rainfall regime using rain gauge daily data, which still remains an imperative source of information.
Based on rain gauge data from 97 stations for the period 1970–2014, this paper suggests a trend towards more intense rainfall in the SWA while the occurrence of rainfall events seem to be stable. In recent studies, Maranan et al. 2018 [34] pointed out the latitudinal dependence of total rainfall on convective systems, with local thunderstorms dominating the rainfall fraction at the coast [35,36] and long-lived, organized convective systems dominating in the Sudanian region further north. Over the SWA region, a regime of wetter conditions has been observed since the mid-1990s, amidst more occurrences of extreme events.
This intensification in rainfall events is mainly due to the increase in mean intensities of wet days. This is more pronounced in the coastal and inland regions than the Sudan region, which shares boundaries with the Sahel. This extends the results obtained by Sanogo et al. (2015) [18], and suggests a trend towards more intense rainfall in Southern West Africa in the last decade, with a seemingly steady occurrence of rainfall events. These trends appear to be similar to patterns observed over the Sahel region, with Panthou et al. (2014, 2018) [20,21], Sanogo et al. (2015) [18], and Taylor et al. (2017) [23] indicating a similar intensification of rainfall events. A similar analysis of precipitation extremes in tropical Singapore has recently been reported with some methodological and meteorological similarities (Li, X et al., 2018) [37].
One notable outcome in the analysis of seasonal trends is the change observed between the two rainfall seasons over the study region. Amidst a steady trend in annual rainfall in recent years over the AMJJ rainfall period, the intensity of the events has been increasing significantly in both the coastal and inland regions. This is in agreement with Taylor et al. (2017) [23], indicating that the intensification signal of mesoscale convective systems (MCSs) emerges above the strong decadal variability of total rainfall even in Southern West Africa during the boreal spring, aiding unusual cumulative rainfall. The recent intensification of the rainfall regime generates concern of the likely changes in the spatial extent and organization of MCSs. The second rainfall season also realizes similar trends in rainfall regime as compared to the AMJJ season, although the coastal region recorded a unique pattern during the 1990s.
5. Conclusions
Over the past 45 years, it was observed that the rain gauge dataset depicted different trends in mean annual rainfall for the two rainfall seasons. A clear rainfall increase was observed during the second rainfall season (SON) in all subregions. This agrees with observations made by Bichet and Diedhiou (2018) [27] and Sanogo et al. (2015) [18]. The intensification, as observed by Sanogo et al. (2015) [18], in mean annual rainfall in recent years is a result of more intense and more frequent rainfall events. Considering the north–south disparities over the studied region, it was observed that the insignificant trend in mean annual rainfall during the AMJJ rainfall season occurs in combination with more intense but less frequent rainfall events.
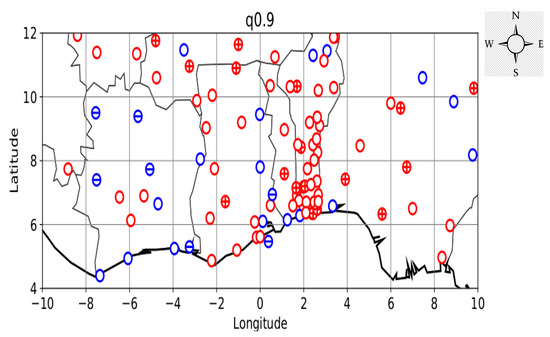
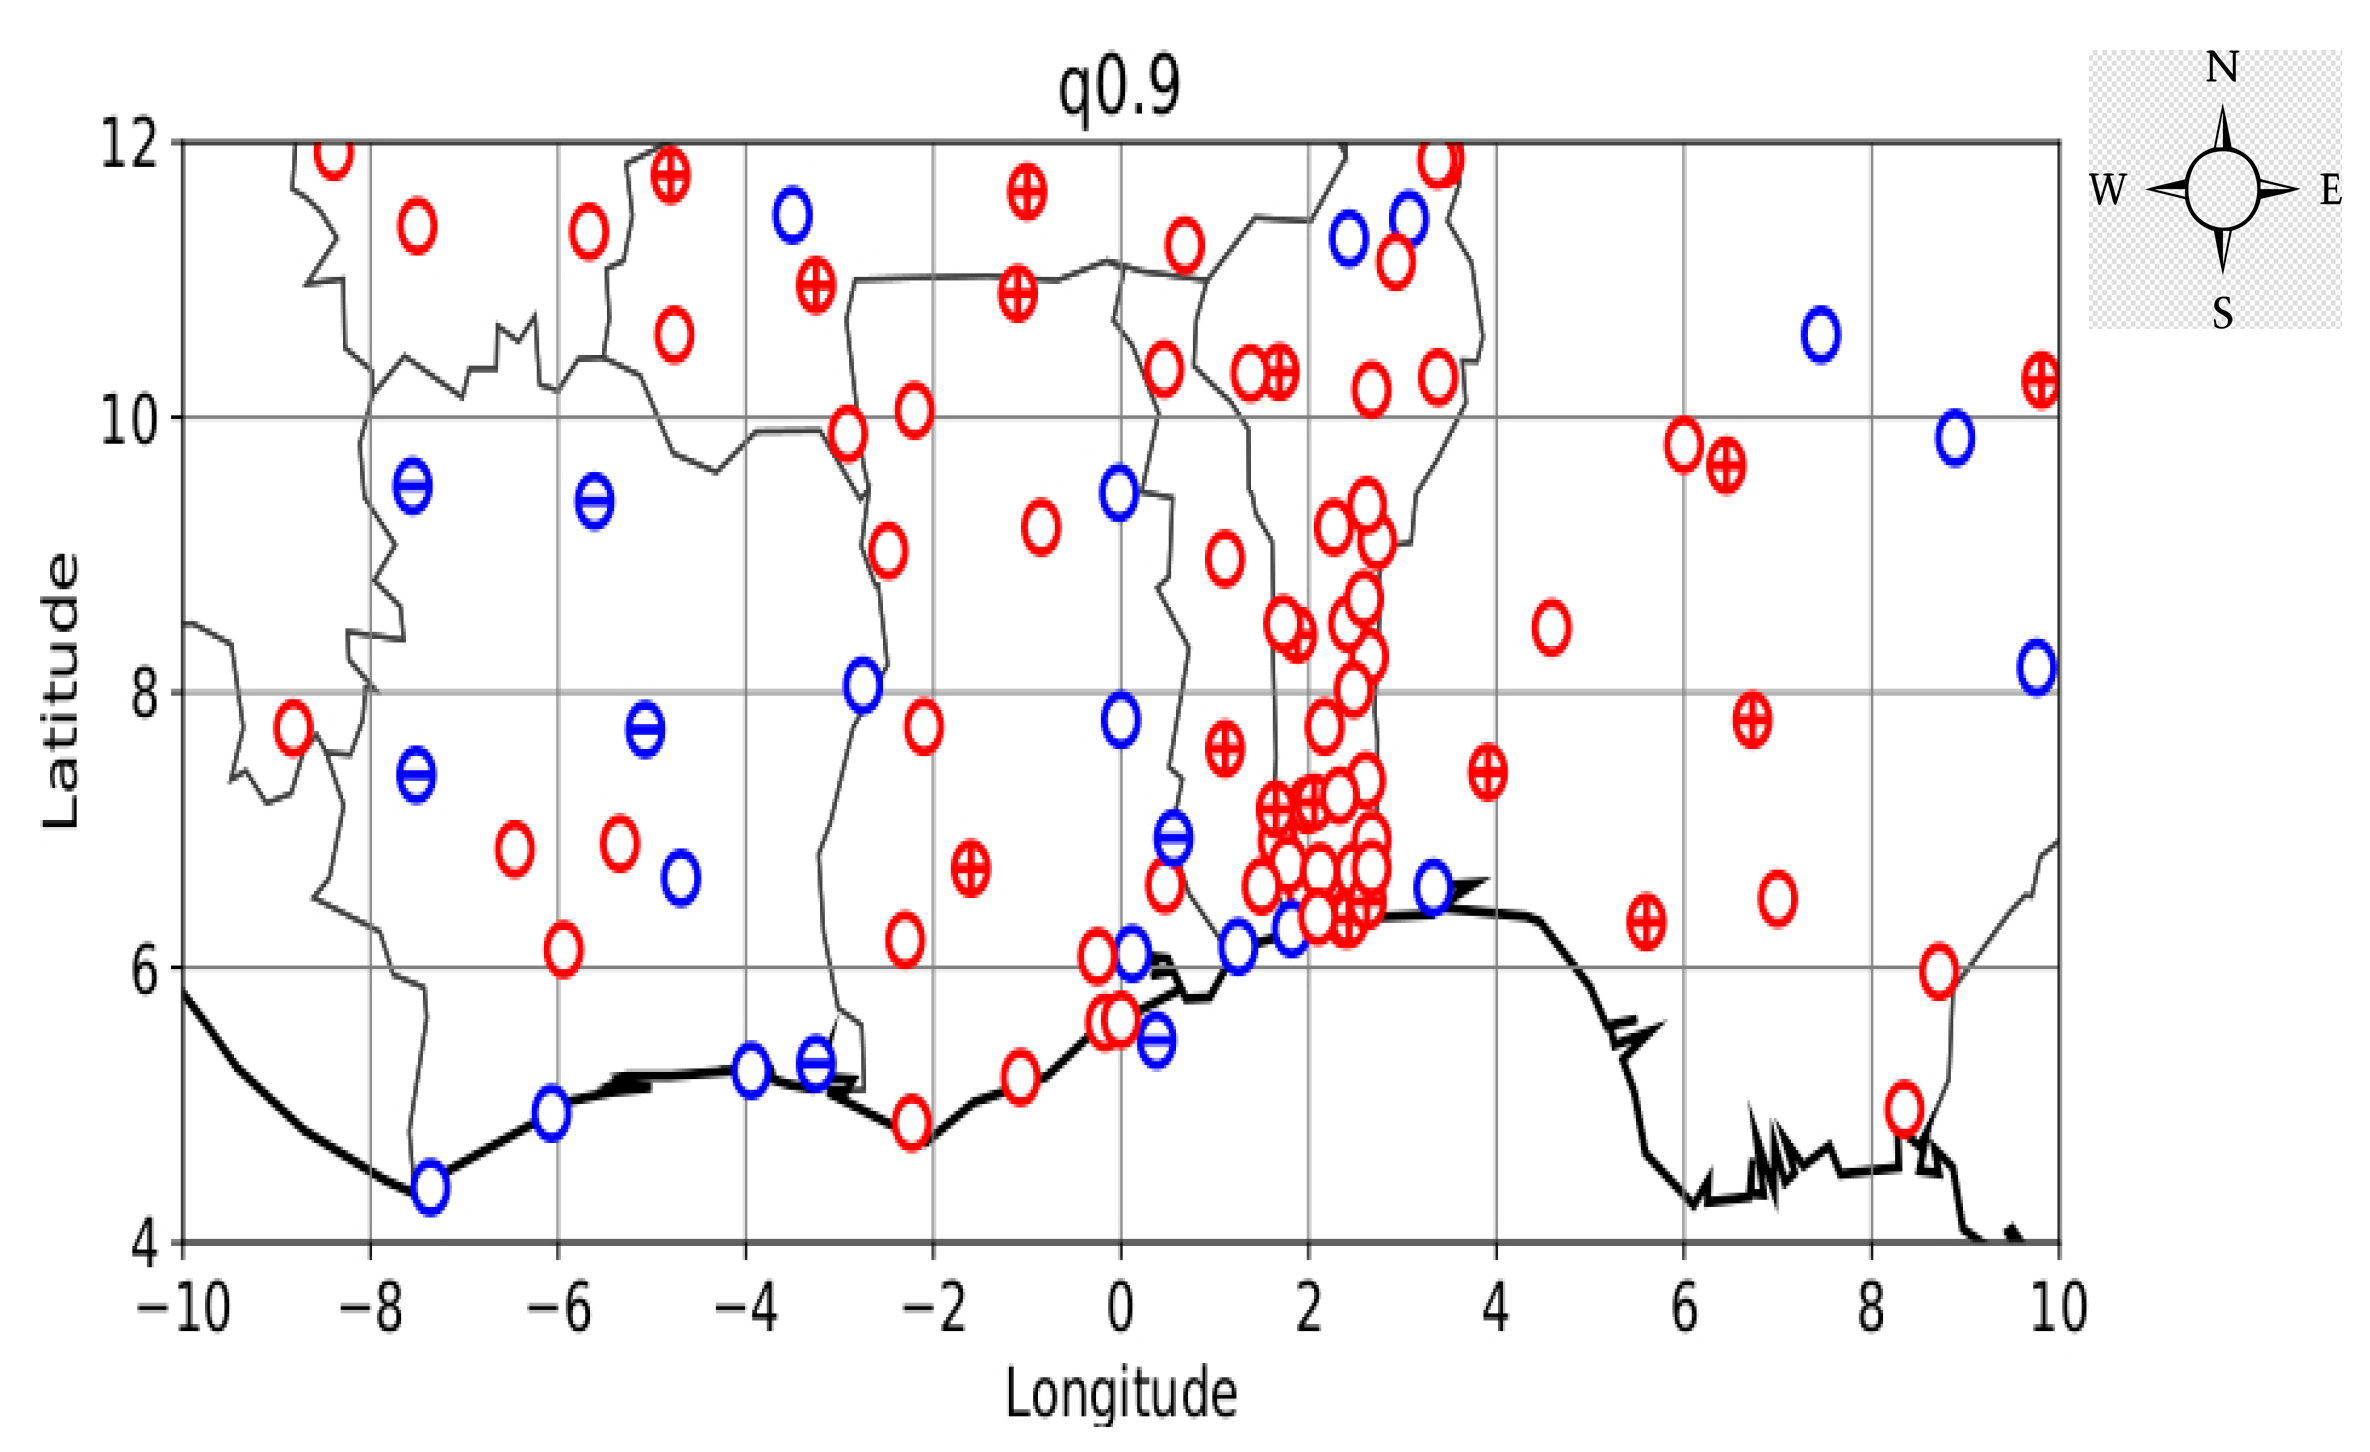
Analyses of the east–west disparities over the region showed a slight decrease in mean annual rainfall over the west as a result of less intense and less extreme rainfall events in recent years, although the frequency of rainfall events increased over both rainfall seasons. These east–west disparities observed using the rain gauge dataset were also slightly visible in Bichet and Diedhiou (2018) [27] but with a much lower magnitude in the trend, with no significant trend and located more in the western part of the SWA (in the Sudanian region of Senegal). This raises the question of the possibility that the trend we identified might come from the low density of the rain-gauge network in the Ivory Coast. It is worth pointing out here that the satellite remote sensing data used in Bichet and Diedhiou (2018) [27] still remain very uncertain. Therefore, trends identified by Bichet and Diedhiou (2018) [27] cannot be used as an absolute reference. Moreover, it is worth noting that we excluded an effect of data quality, as the trend was quite consistent between all rain-gauges and over the region. Figure 6 shows that analyses at the station levels—despite the noise that this analysis can produce (Panthou et al. 2014) [20]—confirmed that a majority of stations display a decreasing trend in extreme rainfall over Ivory Coast and confirmed the trend detected at the regional scale.
Figure 6.
Map of the trends of extreme rainfall (90th percentile (q0.9)) at station levels over SWA from 1970 to 2014; red (blue) circles indicate an increase (decrease) in the trend of extreme rainfall. The plus (minus) sign indicates the significance at a 5% level of significance.
Analyses of rainfall changes using rain gauge data showed disparities over the SWA region between north–south and east–west sub-divisions. These zonal and meridional contrasts observed raise many questions about the atmospheric mechanisms involved over the SWA region. Atmospheric dynamics modulating the zonal and meridional disparities of the West African Monsoon need further investigation to understand the causes of the differential intensification observed across the region. This is to build on the known fact that the interannual variability of El Niño-Southern Oscillation, ENSO [38], and the Atlantic Nino [39] have an important impact on the rainfall in the region while one-third of the intraseasonal variability of the West African monsoon is related to the MJO [40,41].
Author Contributions
Conceptualization, F.N. and T.V.; methodology, G.P.; validation, G.P.; formal analysis, F.N.; investigation, T.V.; resources, F.N., T.V., and G.P.; data, F.N., G.P., and A.D.; writing—original draft preparation, F.N.; editing, T.V., G.P., N.A.B.K., A.D., and D.C.A; revision, F.N., T.V., and G.P.; supervision, N.A.B.K. and D.C.A.
Funding
This research was funded by the NERC/DFID “Future Climate for Africa” program under the AMMA-2050 project, grant number NE/M019969/1.
Acknowledgments
The research leading to this publication has received funding from the NERC/DFID “Future Climate for Africa” program under the AMMA-2050 project, grant number NE/M019969/1. This work was made possible thanks to the participation of collaborators from IGE, University of Grenoble Alpes
Conflicts of Interest
The authors declare no conflict of interest.
Appendix A
Figure A1.
Plots of the 11-year moving averages of 95th percentile (q0.95) (a,c,e) and 99th percentile (q0.99) (b,d,f) for whole year, April-July (AMJJ) and September-November (SON) rainfall seasons for coastal, inland, and Sudan sub-divisions.
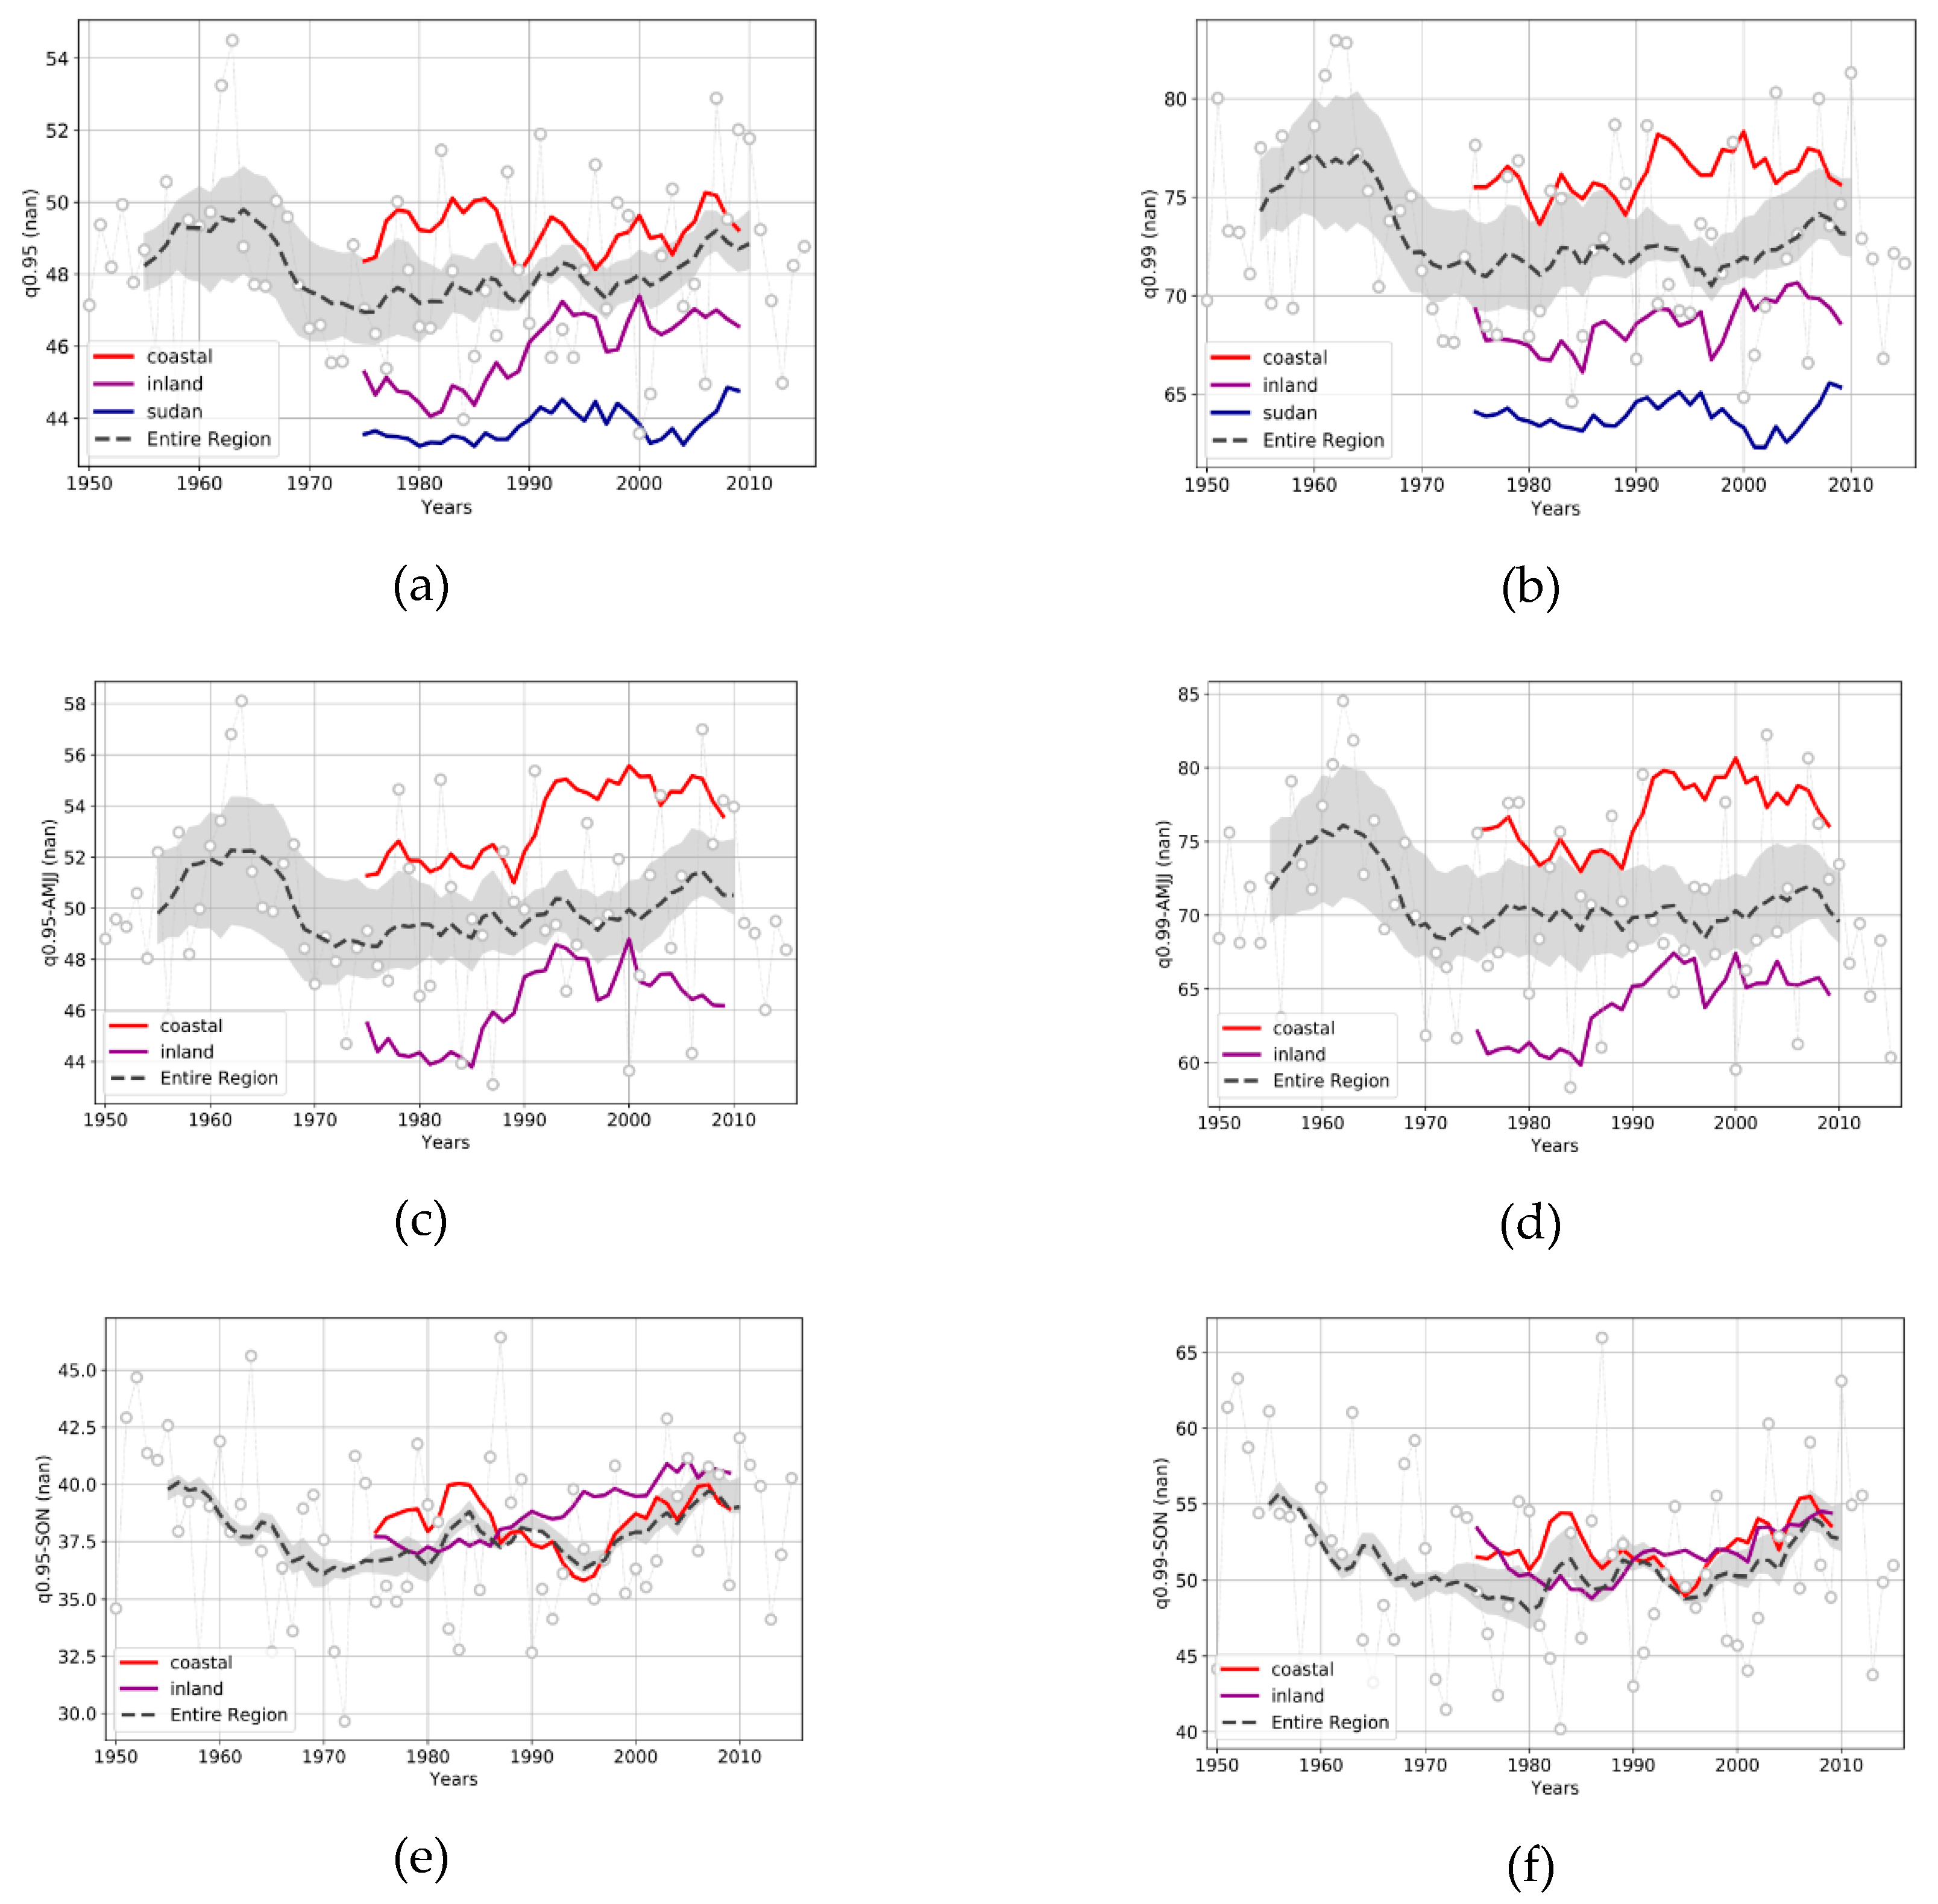
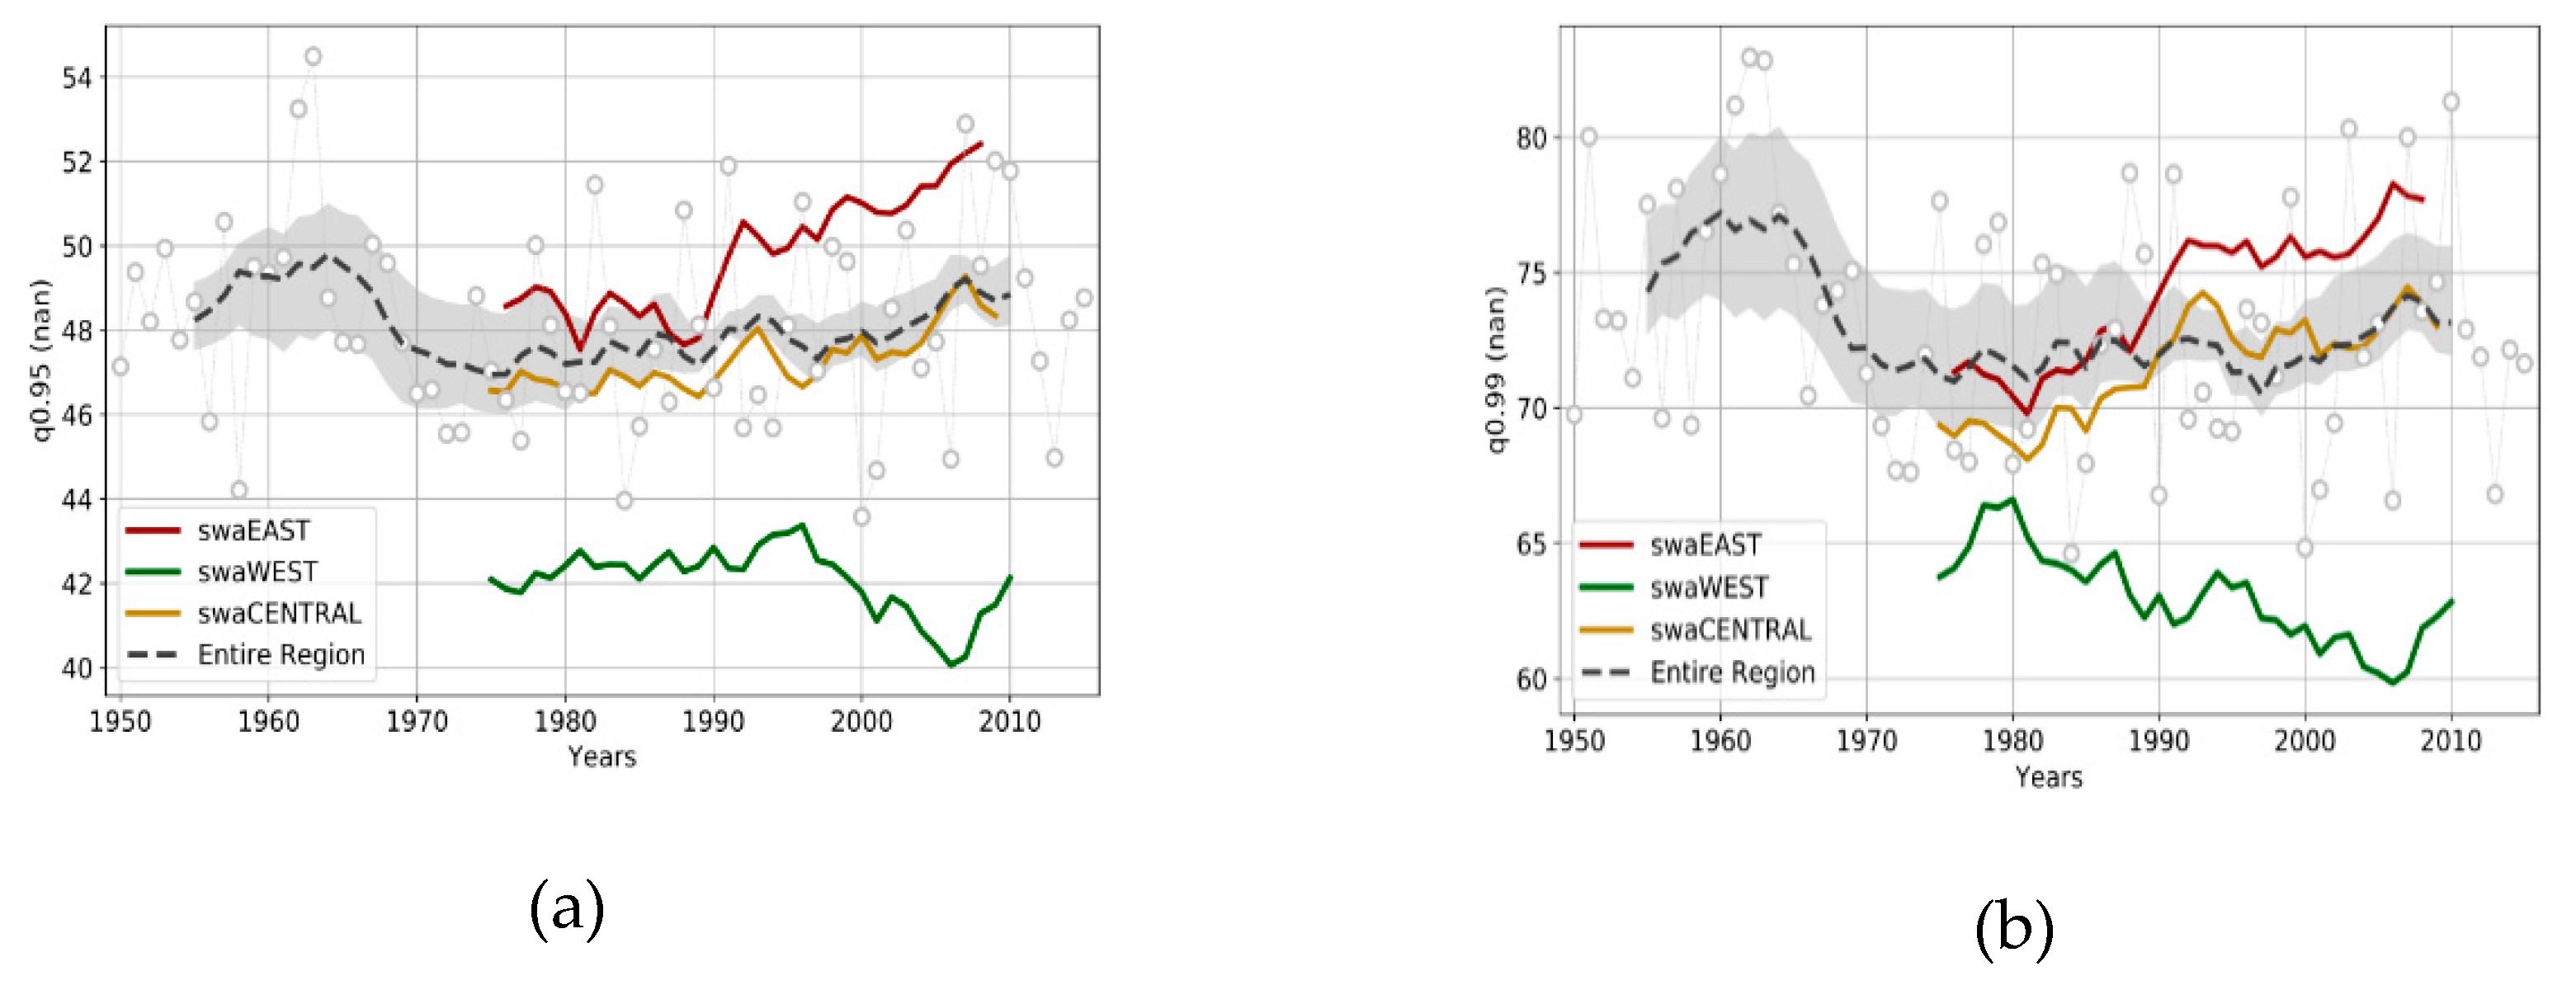
Figure A2.
Plots of the 11-year moving averages of 95th percentile (q0.95) (a) and 99th percentile (q0.99) (b) for whole year for east, west, and central sub-divisions.
References
- IPCC. Climate change 2013: The Physical Science basis. In Contribution of Working Group I to the Fifth Assessment Report of the Intergovernmental Panel on Climate Change; Stocker, T.F., Qin, D., Plattner, G.-K., Tignor, M., Allen, S.K., Boschung, J., Nauels, A., Xia, Y., Bex, V., Midgley, P.M., Eds.; Cambridge University Press: Cambridge, UK; New York, NY, USA, 2013; p. 1535. [Google Scholar]
- Min, S.K.; Zhang, X.; Zwiers, F.W.; Hegerl, G.C. Human contribution to more-intense precipitation extremes. Nature 2011, 470, 378–381. [Google Scholar] [CrossRef] [Scilit] [PubMed]
- Kundzewicz, Z.W.; Kanae, S.; Seneviratne, S.I.; Handmer, J.; Nicholls, N.; Peduzzi, P.; Mechler, R.; Bouwer, L.M.; Arnell, N.; Mach, K.; et al. Flood risk and climate change: Global and regional perspectives. Hydrol. Sci. J. 2014, 59, 1–28. [Google Scholar] [CrossRef] [Scilit]
- Donat, M.G.; Lowry, A.L.; Alexander, L.V.; O’Gorman, P.A.; Maher, N. More extreme precipitation in the world’s dry and wet regions. Nat. Clim. Chang. 2016, 6, 508–513. [Google Scholar] [CrossRef] [Scilit]
- Huntington, T.G. Evidence for intensification of the global water cycle:Review and synthesis. J. Hydrol. 2006, 319, 83–95. [Google Scholar] [CrossRef] [Scilit]
- Kingston, D.G.; Todd, M.C.; Taylor, R.G.; Thompson, J.R.; Arnell, N.W. Uncertainty in the estimation of potential evapotranspiration under climate change. Geophys. Res. Lett. 2009, 36, L20403. [Google Scholar] [CrossRef] [Scilit]
- Murray, S.J.; Foster, P.N.; Prentice, I.C. Evaluation of global continental hydrology as simulated by theLand-surface Processes and eXchanges Dynamic Global Vegetation Model. Hydrol. Earth Syst. Sci. 2011, 15, 91–105. [Google Scholar] [CrossRef] [Scilit]
- Jonkman, S.N. Global Perspectives on Loss of Human Life Caused by Floods. Nat. Hazards 2005, 34, 151–175. [Google Scholar] [CrossRef] [Scilit]
- Alfieri, L.; Bisselink, B.; Dottori, F.; Naumann, G.; de Roo, A.; Salamon, P.; Wyser, K.; Feyen, L. Global projections of river flood risk in a warmer world. Earths Future 2017, 5, 171–182. [Google Scholar] [CrossRef] [Scilit]
- Carvalho, L.M.V.; Jones, C.; Liebmann, B. Extreme Precipitation Events in Southeastern South America and Large-Scale Convective Patterns in the South Atlantic Convergence Zone. J. Clim. 2002, 15, 2377–2394. [Google Scholar] [CrossRef] [Scilit]
- Bettolli, M.L.; Penalba, O.C.; Vargas, W.M. Synoptic weather types in the south of South America and their relationship to daily rainfall in the core crop-producing region in Argentina. Aust. Meteorol. Oceanogr. J. 2010, 60, 37–48. [Google Scholar] [CrossRef] [Scilit]
- Frich, P.; Alexander, L.V.; Della-Marta, P.; Gleason, B.; Haylock, M.; Klein Tank, A.M.; Peterson, T. Observed coherent changes in climatic extremes during the second half of the twentieth century. Clim. Res. 2002, 19, 193–212. [Google Scholar] [CrossRef] [Scilit]
- Garrett, C.; Müller, P. Supplement to extreme events. Bull. Amer. Meteor. Soc. 2008, 89, 45–56. [Google Scholar] [CrossRef] [Scilit]
- Sen Roy, S. A spatial analysis of extreme hourly precipitation patterns in India. Int. J. Climatol. 2009, 29, 345–355. [Google Scholar] [CrossRef] [Scilit]
- Zhai, P.M.; Zhang, X.B.; Wan, H.; Pan, X.H. Trends in total precipitation and frequency of daily precipitation extremes over China. J. Clim. 2005, 18, 1096–1108. [Google Scholar] [CrossRef] [Scilit]
- Mayooran, T.; Laheetharan, A. The Statistical Distribution of Annual Maximum Rainfall in Colombo District. Sri Lankan J. Appl. Stat. 2014, 15, 107–130. [Google Scholar] [CrossRef] [Scilit]
- Giannini, A.; Salack, S.; Lodoun, T.; Ali, A.; Gaye, A.T.; Ndiaye, O. A unifying view of climate change in the Sahel linking intra-seasonal, interannual and longer time scales. Environ. Res. Lett. 2013, 8. [Google Scholar] [CrossRef] [Scilit]
- Sanogo, S.; Fink, A.H.; Omotosho, J.A.; Ba, A.; Redl, R.; Ermert, V. Spatio-temporal characteristics of the recent rainfall recovery in West Africa. Int. J. Climatol. 2015, 35, 4589–4605. [Google Scholar] [CrossRef] [Scilit]
- Panthou, G.; Vischel, T.; Lebel, T.; Quantin, G.; Pugin, A.-C.F.; Blanchet, J.; Ali, A. From pointwise testing to a regional vision: An integrated statistical approach to detect nonstationarity in extreme daily rainfall. Application to the Sahelian region. J. Geophys. Res. Atmos. 2013, 118, 8222–8237. [Google Scholar] [CrossRef] [Scilit]
- Panthou, G.; Vischel, T.; Lebel, T. Recent trends in the regime of extreme rainfall in the Central Sahel. Int. J. Climatol. 2014, 34, 3998–4006. [Google Scholar] [CrossRef] [Scilit]
- Panthou, G.; Vischel, T.; Lebel, T.; Quantin, G. Rainfall intensification in tropical semi-arid regions: The Sahelian case. Environ. Res. Lett. 2018, 13. [Google Scholar] [CrossRef] [Scilit]
- Galle, S.; Grippa, M.; Peugeot, C.; Bouzou Moussa, I.; Cappelaere, B.; Demarty, J.; Mougin, E.; Panthou, G.; Adjomayi, P.; Agbossou, E.K.; et al. AMMA-CATCH, a Critical Zone Observatory in West Africa Monitoring a Region in Transition. Vadose Zone J. 2018, 17. [Google Scholar] [CrossRef] [Scilit]
- Taylor, C.; Belusic, D.; Guichard, F.; Parker, D.; Vischel, T.; Bock, O.; Harris, P.; Janicot, S.; Klein, C.; Panthou, G. Frequency of extreme Sahelian storms tripled since 1982 in satellite observations. Nature 2017, 544, 475–478. [Google Scholar] [CrossRef] [Scilit] [PubMed]
- Easterling, D.R.; Evans, J.L.; Groisman, P.Y.; Karl, T.R.; Kunkel, K.E.; Ambenje, P. Observed variability and trends in extreme climate events: A brief review. Bull. Am. Meteorol. Soc. 2000, 81, 417–426. [Google Scholar] [CrossRef] [Scilit]
- New, M.; Hewitson, B.; Stephenson, D.B.; Tsiga, A.; Kruger, A.; Manhique, A.; Gomez, B.; Coelho, C.A.S.; Masisi, D.N.; Kululanga, E.; et al. Evidence of trends in daily climate extremes over Southern and West Africa. J. Geophys. Res. 2006, 111. [Google Scholar] [CrossRef] [Scilit]
- Goula, B.T.A.; Soro, E.G.; Kouassi, W.; Srohourou, B. Trends and breaks at the level of daily rainfall extremes in the Ivory Coast (West Africa). Hydrol. Sci. J. 2012, 57, 1067–1080. [Google Scholar] [CrossRef] [Scilit]
- Bichet, A.; Diedhiou, A. Less frequent and more intense rainfall along the coast of the Gulf of Guinea in West and Central Africa (1981−2014). Clim. Res. 2018, 76, 191–201. [Google Scholar] [CrossRef] [Scilit]
- Nguyen, H.; Thorncroft, C.D.; Zhang, C. Guinean coastal rainfall of the West African Monsoon. Q. J. R. Meteorol. Soc. 2011, 137, 1828–1840. [Google Scholar] [CrossRef] [Scilit]
- Yabi, I.; Afouda, F. Extreme rainfall years in Benin (West Africa). Quat. Int. 2012, 262, 39–43. [Google Scholar] [CrossRef] [Scilit]
- Nicholson, S.E. Rainfall and atmospheric circulation during drought periods and wetter years in West Africa. Mon. Weather Rev. 1981, 109, 2191–2208. [Google Scholar] [CrossRef] [Scilit]
- Le Barbé, L.; Lebel, T.; Tapsoba, D. Rainfall variability in West Africa during the years 1950–1990. J. Clim. 2002, 15, 187–202. [Google Scholar] [CrossRef] [Scilit]
- Lebel, T.; Cappelaere, B.; Galle, S.; Hanan, N.; Kergoat, L.; Levis, S.; Vieux, B.; Descroix, L.; Gosset, M.; Mougin, E.; et al. AMMA-CATCH studies in the Sahelian region of West-Africa: An overview. J. Hydrol. 2009, 375, 3–13. [Google Scholar] [CrossRef] [Scilit]
- Blanchet, J.; Aly, C.; Vischel, T.; Panthou, G.; Sané, Y.; DiopKane, M. Trend in the co-occurrence of extreme daily rainfall in West Africa since 1950. J. Geophys. Res. Atmos. 2018, 123, 1536–1551. [Google Scholar] [CrossRef] [Scilit]
- Maranan, M.; Fink, A.H.; Knippertz, P. Rainfall types over southern West Africa: Objective identification, climatology and synoptic environment. Q. J. R. Meteorol. Soc. 2018, 144, 1628–1648. [Google Scholar] [CrossRef] [Scilit]
- Acheampong, P.K. Rainfall Anomaly along the Coast of Ghana—Its Nature and Causes. Geografiska Annaler Ser. A Phys. Geogr. 1982, 64, 199–211. [Google Scholar]
- Omotosho, J.B. The separate contributions of squall lines, thunderstorms and the monsoon to the total rainfall in Nigeria. J. Clim. 1985, 5, 543–552. [Google Scholar] [CrossRef] [Scilit]
- Li, X.; Meshgi, A.; Babovic, V. Analysis of variability and trends of precipitation extremes in Singapore during 1980–2013. Int. J. Climatol. 2018, 38, 125–141. [Google Scholar] [CrossRef] [Scilit]
- Joly, M.; Voldoire, A. Influence of ENSO on the West African Monsoon: Temporal Aspects and Atmospheric Processes. J. Clim. 2009, 22, 3193–3210. [Google Scholar] [CrossRef] [Scilit]
- Giannini, A.; Saravanan, R.; Chang, P. Oceanic forcing of Sahel rainfall on interannual to interdecadal time scales. Science 2003, 302, 1027–1030. [Google Scholar] [CrossRef] [Scilit]
- Janicot, S.; Caniaux, G.; Chauvin, F.; de Coëtlogon, G.; Fontaine, B.; Hall, N.; Kiladis, G.; Lafore, J.-P.; Lavaysse, C.; Lavender, S.L.; et al. Intraseasonal variability of the West African monsoon. Atmos. Sci. Lett. 2011, 58–66. [Google Scholar] [CrossRef] [Scilit]
- Zhang, C. Madden–Julian Oscillation: Bridging Weather and Climate. Bull. Am. Meteor. Soc. 2013, 94, 1849–1870. [Google Scholar] [CrossRef] [Scilit]

© 2019 by the authors. Licensee MDPI, Basel, Switzerland. This article is an open access article distributed under the terms and conditions of the Creative Commons Attribution (CC BY) license (http://creativecommons.org/licenses/by/4.0/).