Article

Retrieval of Horizontal Visibility Using MODIS Data: A Deep Learning Approach

1
State Key Laboratory of Remote Sensing Science, Faculty of Geographical Science, Beijing Normal University, Beijing 100875, China
2
Beijing Engineering Research Center for Global Land Remote Sensing Products, Faculty of Geographical Science, Beijing Normal University, Beijing 100875, China
3
Ningbo Meteorological Administration, Ningbo 315012, China
4
National Satellite Meteorological Center, China Meteorological Administration, Beijing 100081, China
*
Authors to whom correspondence should be addressed.
Atmosphere 2019, 10(12), 740; https://doi.org/10.3390/atmos10120740
Submission received: 10 October 2019 / Revised: 19 November 2019 / Accepted: 22 November 2019 / Published: 25 November 2019
(This article belongs to the Section Aerosols)

Abstract

:
Horizontal visibility (HVIS) is a primary index used for assessing air quality. Although satellite images provide information regarding atmospheric aerosols, atmospheric visibility is not directly measured. In this paper, a deep learning approach is proposed to retrieve HVIS using moderate-resolution imaging spectroradiometer (MODIS) aerosol optical depth (AOD) data, the European Centre for Medium-Range Weather Forecasts reanalysis dataset, and ground-based visibility observations. The deep neural network model comprises a multi-layer unsupervised restricted Boltzmann machine (RBM) and a layer for supervised learning. The dropout mechanism was used in the training process to overcome the errors caused by over-fitting. The results demonstrate that the correlation coefficient values between HVIS observations and retrievals during training, pre-validating, and evaluation were 0.74, 0.723, and 0.697, respectively. The retrieved HVIS in Eastern China exhibited a north-to-south increasing trend, increasing and decreasing in summer and winter, respectively. In conclusion, the proposed model presents an effective and more reliable method for HVIS retrieval. However, the small samples, low AOD, low albedo, high total column water, high longitude, and the low vertical wind component at 10 m likely cause HVIS bias.

1. Introduction

Atmospheric visibility, a primary index used for describing air quality, commonly refers to horizontal visibility (HVIS) [1,2]. Low HVIS can result in human illness and diseases as well as transportation risks [3,4,5]. The degradation of HVIS is caused by the scattering and absorption of light by air molecules, hydrometeors (rain, snow, fog, and clouds), and aerosols. HVIS is affected by various natural and anthropogenic factors [6,7,8]. The contamination of air by anthropogenic aerosol particulates is the main factor causing low HVIS [6,7]. Generally, highly accurate atmospheric HVIS observations can be obtained from ground-based observations. However, the sparse and uneven spatial distribution of ground-based observations limits data availability. Satellite-derived aerosol optical depth (AOD) remote sensing data with wide spatial coverage and fine spatial resolution, e.g., the moderate-resolution imaging spectroradiometer (MODIS) Collection 6 Level 2 product with a spatial resolution of 3 km, can provide useful information for air quality [9,10,11].
Satellite-derived AOD is defined as the integration of light extinction in the entire atmospheric column. Satellite sensors have exhibited highly accurate retrieval of AOD [12,13]. Operational AOD products have been widely used in various aerosol studies [9,14,15]; however, few studies have calculated HVIS using satellite-retrieved AOD. Koschmieder [16] demonstrated that aerosol extinction coefficients at the surface ( σ s , 550 nm) is a parameter commonly used to derive HVIS with a simple inverse formula, named Koschmieder’s equation (extinction coefficient = 3.912/HVIS). Early studies examined the relationship between AOD and inverse of HVIS using simple linear regression model, and the correlation coefficient between AOD and the inverse of HVIS was 0.85 in 1980 and 0.56 in 1981 in Washington, DC, USA [17]. The correlation between total vertical extinction and surface extinction is high only under extreme conditions of high clarity and extremely low HVIS. Hadjimitsis et al. [18] computed the inverse of HVIS based on the darkest-pixel (Landsat-5 thematic matter (TM) Band 1) atmospheric correction algorithm in cooperation with radiative transfer model. Although the coefficient of determination between determined and measured HVIS is 0.97, only a few satellite images were used. However, the vertical distribution of aerosol is the most crucial factor for determining the accuracy of HVIS from satellite-derived AOD [19,20]. Kessner et al. [21] tried to obtain the HVIS using a scaling approach with H V I S = H V I S GEOS 5   ×   A O D GEOS 5 A O D MODIS , where H V I S GEOS 5 and A O D GEOS 5 were obtained from Goddard Earth Observing System Model, Version 5 (GEOS-5) and A O D MODIS was obtained from the MODIS L2 product. The best result when compared with observational HVIS showed that the root mean square error (RMSE) was 7.82 km and the correlation coefficient (R) was 0.7. He et al. [22] proposed a vertical correction method based on a two-layer aerosol model to estimate the HVIS of MODIS AOD. Seasonal spatial comparisons showed that most R(90%) were > 0.6, and more than half the samples (68%) exhibited R of > 0.7.
However, simple linear regression is not based on systematic theories, whereas many meteorological elements, such as relative humidity (RH) [23,24,25] and wind [26], were not considered, which significantly affected the accuracy of HVIS derived from MODIS AOD. For the scaling approach, the accuracy is limited by the uncertainties of the model parameterization. All these factors lead to the inaccuracy of HVIS simulations. As such, developing an effective approach for HVIS estimations is essential.
Deep learning (DL) is an area of machine learning that tries to model high-level abstractions of data using multiple processing layers [27]. DL has attracted considerable academic and industrial attention [28,29]. Recent studies have reported successful DL application in the fields of character recognition [30], computer vision [31], natural language processing [32], human activity recognition [33,34], and motion modeling [35,36]. The deep belief network (DBN) is a typical DL method, which uses the restricted Boltzmann machine (RBM) as the basic unit of network modeling. DBNs adopt the unsupervised greedy layer-by-layer training algorithm in co-operation with the top-down fine-tuning training method to identify the essential characteristics of data, which can considerably improve classification and prediction accuracy [37]. An integrated DBN was first proposed for regression and time series prediction [38]. The deep confidence network that is used to characterize and classify hyperspectral remote sensing data has considerably improved classification accuracy [39]. Recently, Huang and Xiang [40] proposed a DBN model based on a SoftMax classifier and dropout mechanism to improve the prediction accuracy of landslides. The discard mechanism in the training process can reduce the prediction errors caused by over-fitting.
The DL model and long short-term memory model have been applied to predict particulate matter with an aerodynamic diameter less than or equal to 2.5 µm (PM2.5) concentration at ground stations [41,42]. However, to the best of our knowledge, few recent studies have estimated HVIS, and even fewer have combined satellite-derived AOD using deep learning models. Determining HVIS from satellite-derived AOD is inherently complex as HVIS accuracy is influenced by various factors such as boundary-layer height [BLH], RH, wind, pressure, and altitude. However, deep learning models trained using a greedy hierarchical approach to generate representative impact factors to estimate HVIS without any prior knowledge may produce accurate HVIS results.
In this study, we present a HVIS deep belief network (HVIS_DBN) model that could be directly applied to estimate HVIS by using MODIS AOD, meteorological data, and other factors in Eastern China. A spatial prediction framework was built based on the HVIS_DBN model considering the spatial correlations of HVIS in the simulation process. The experimental results demonstrated that the proposed methods exhibit a more accurate performance than existing methods for determining HVIS. The remainder of this paper is structured as follows: Section 2 provides a brief introduction of data and describes the proposed method in detail. The results are discussed in Section 3. The conclusions are summarized in Section 4.

2. Materials and Methods

2.1. MODIS AOD Product

The MODIS operational AOD data have been widely used to investigate the spatiotemporal distribution of aerosols and to evaluate air quality [12,43]. The MODIS Collection 6 (C6) AOD Level 2 product with a spatial resolution of 3 km uses the dark target algorithm. The AOD over land is derived from observed top-of-atmosphere reflectance at 0.47, 0.66, and 2.12 µm bands [10,11]. Remer et al. [11] compared the MODIS AOD 3 km product with aerosol robotic network (AERONET) measurements and showed that the MODIS AOD retrievals fall within one standard deviation of the predicted uncertainty of ΔAOD (equal to ±0.05 ± 0.20 AOD over land). Xie et al. [44] compared 3 km MODIS AOD products from Aqua with AERONET at three sites located in Beijing, China. The results showed that MODIS AOD is highly consistent with AERONET measurements, with a Pearson correlation coefficient of 0.93 and the average difference in AOD was 0.29 at the three sites. In this study, the MODIS C6 AOD Level 2 Aqua product with a spatial resolution of 3 × 3 km was applied for the retrieval of the HVIS.

2.2. European Centre for Medium-Range Weather Forecasts ERA-Interim Data

The reanalysis data used in this study were obtained from the European Centre for Medium-Range Weather Forecasts Re-Analysis Interim (ERA-Interim) dataset. ERA-Interim is the latest global atmospheric reanalysis data produced. The ERA-Interim project was conducted in part to prepare for a new atmospheric reanalysis to replace ERA-40, which extends back to the early part of the 20th century [45]. In this study, data at 06:00 UTC (14:00 LST) were selected to match the equatorial crossing time at 13:30 LST of Aqua. The ERA-Interim reanalysis data of albedo (AL), dewpoint temperature at 2 m (D2m), surface pressure (SP), air temperature at 2 m (T2m), total column ozone (TCO3), total column water (TCW), vertical wind component at 10 m (V10), and BLH with a 0.125° × 0.125° spatial resolution confined to the area 23°–35° N and 113°–123° E were used.

2.3. HVIS Data

HVIS data from 168 ground-based stations (Figure 1) were obtained from the China Meteorological Administration (CMA). According to the forward scattering principle of light, the forward scattering visibility meter emits infrared pulses to measure the forward scattering intensity of suspended particles in the air. Based on Rayleigh scattering theory, the extinction coefficient is calculated by scattering data, and then the HVIS is calculated by the equation HVIS = 3.912/ σ s (aerosol extinction coefficients of 550 nm at surface) [16]. The accuracy of HVIS is ±10% in the range of 10 to 10,000 m and ±20% in the range of 10,000 to 35,000 m. This dataset, with a 1 h temporal resolution, covered the period from 1 January 2014 to 31 December 2017. To match MODIS AOD data, the time difference was limited to ±1 h.

2.4. Methodology

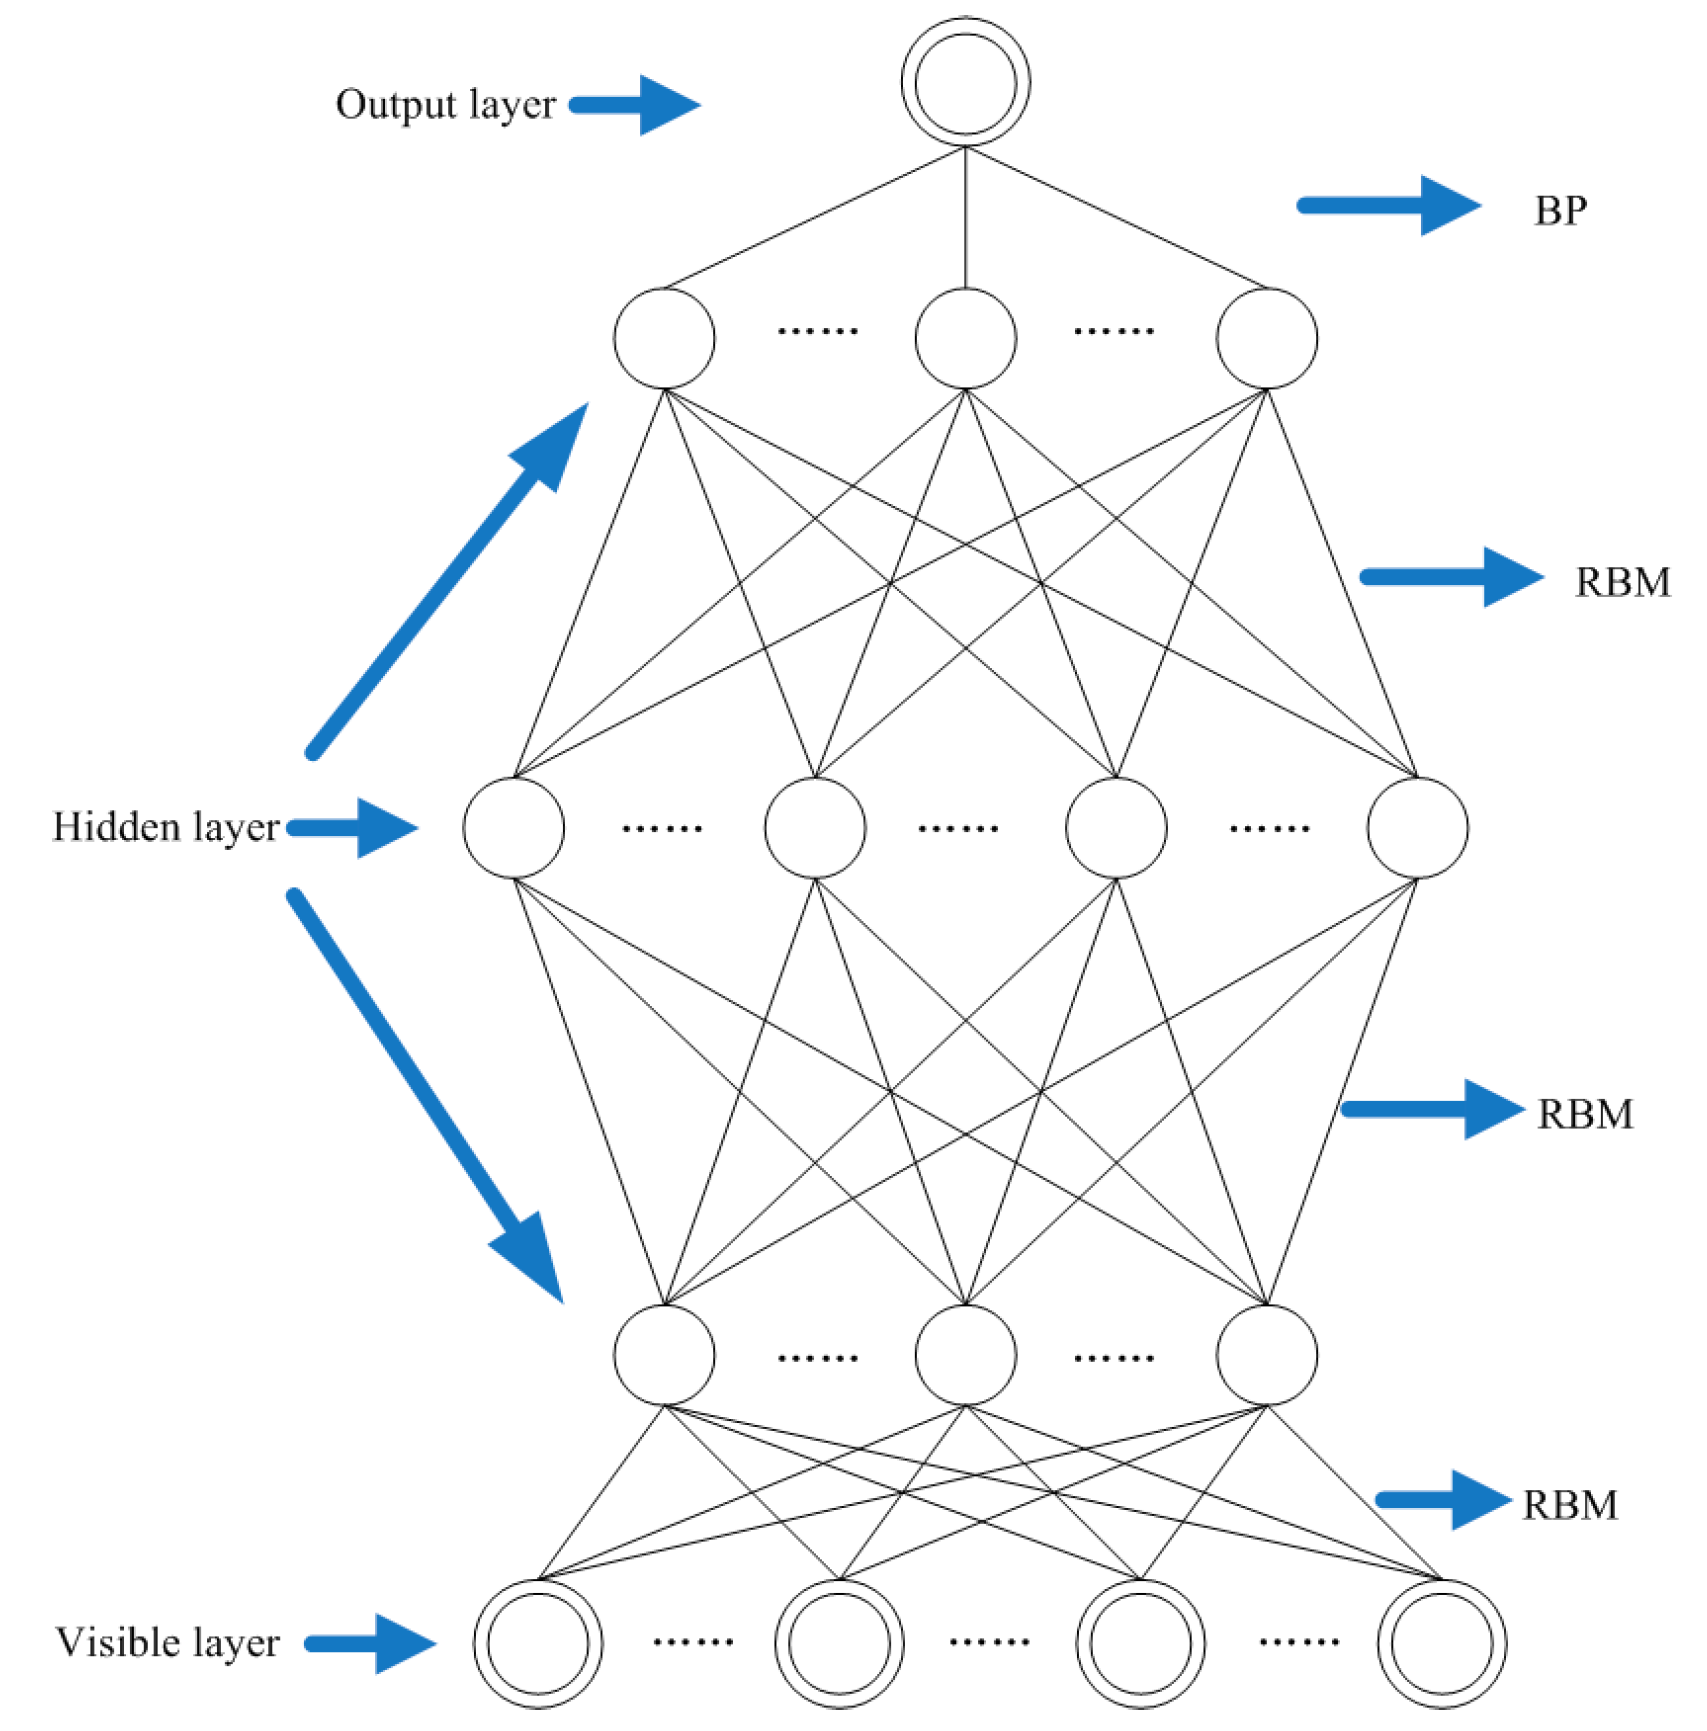
In this study, a typical DL method was designed for retrieving HVIS from MODIS AOD data. As shown in Figure 2, the HVIS_DBN model is a multi-layered probabilistic, generative model [28,29]. It is a semi-supervised learning method that combines the advantages of unsupervised and supervised learning methods. The model has a strong ability to classify and predict high dimensional feature vectors. The HVIS_DBN model comprises a multi-layer unsupervised RBM and a layer for supervised learning. The training process of the model includes three main stages: Pre-processing, pre-training, and fine-tuning. It uses a layer-by-layer unsupervised learning for pre-training the initial weights of the networks and global supervised learning for fine-tuning.

2.4.1. Pre-Processing

In the pre-processing stage, the input variables and parameters of HVIS_DBN were first initialized using zero-mean method. The input variables included HVIS (m), AOD, AL, RH (%), SP (Pa), TCO3 (kg m−2), TCW (kg m−2), V10 (m s−1), BLH (m), altitude (m), longitude (°), and latitude (°):
V std , i = V i μ i σ i
where V std , i is the standardized input variable, V i is the original input variable, μ i is the average of V i , and σ i is the variance of V i .
Since the ECMWF ERA-Interim dataset did not include the variable RH, we used the following formula was used to calculate RH [46]:
RH = 100 × exp ( 17.2694 × D 2 m D 2 m + 237.3 17.2694 × T 2 m T 2 m + 237.3 ) ,
where D2m is the dewpoint temperature at 2 m and T2m is the air temperature at 2 m.

2.4.2. Pre-Training

After pre-processing, the input variables and parameters were trained using the layer-by-layer network training method. For each training cycle, the unsupervised learning method was used for training every layer of RBM. The weight and bias values of each layer can be obtained by pre-training. The RBM is an energy-based model, consisting of a visible layer (V) and a hidden layer (H). No neuronal connections were observed within the same inner layer; however, between layers, neurons were fully connected.
In a binary RBM, a joint configuration ( υ , h) of visible and hidden units has the following energy:
E ( υ , h | θ ) = i = 1 n a i ν i j = 1 m b j h j i = 1 n j = 1 m W ij ν i h j
where θ = ( W ij , a i , b j ) represents the parameter of RBM; ν i and h j are the binary states of visible unit i and hidden units j, respectively; a i and b j are the biases of visible unit i and hidden units j, respectively; W ij is the connecting weight between visible unit i and hidden units j; and m and n are the numbers of visible and hidden units, respectively. The purpose of the training algorithm is to obtain θ , which determines the performance of the RBM network. The lower the energy, the better the state of the network.
Based on the energy function, the joint probability of ( υ , h ) can be written as
P ( υ , h | θ ) = e E ( υ , h | θ ) Z ( θ )
where Z is a partition function. It is used for normalizing:
Z ( θ ) = υ , h e E ( υ , h | θ ) .
The marginal probability of the joint probability that the network distributed to υ , can be defined as follows:
P ( υ | θ ) = 1 Z ( θ ) h e E ( υ , h | θ ) .
The gradient or derivative of the log probability of training vectors with respect to W ij ,   a i , and b j can be derived as follows, respectively:
logP ( υ | θ ) W ij = υ i h j data υ i h j model
logP ( υ | θ ) a i = υ i data υ i model
logP ( υ | θ ) b j = h j data h j model
where . data represents the expectation of the probability defined by the dataset and . model is the expection on the probability defined by the model. The learning rule for stochastic steepest ascent in the log probability of the training data can be expressed as
Δ W ij = η ( υ i h j data υ i h j model )
Δ a i = η ( υ i data υ i model )
Δ b j = η ( h j data h j model )
where η is the learning rate.
Because the units in a single hidden layer are unrelated, the conditional distribution P ( h | v ) can be calculated as follows:
P ( h j = 1 | v ) = S ( b j + j W i j υ i )
where S ( x ) = 1 / ( 1 + exp ( x ) ) is the logistic sigmoid function.
Due to the units in a single visible layer being unrelated, the conditional distributions P ( v | h ) can be calculated as
P ( v j = 1 | h ) = S ( a j + i W ij h j ) .
θ can be calculated by the maximum-likelihood estimation of the training set [29]. However, the maximum-likelihood learning is infeasible in a large RBM because it is expensive to compute the derivative of the log probability of training data. Expected outcomes obtained using the model are difficult to achieve. A highly satisfactory stochastic approximation, known as the contrastive divergence (CD) algorithm, makes θ suitable as building blocks for learning DBN [28,29]. This algorithm uses Gibbs sampling, which alternates between stochastically updating the hidden and visible units. Even when only one iteration of Gibbs sampling is used, the CD algorithm provides satisfactory results [29]. The weight and bias are updated according to the following equations:
Δ W ij = η ( υ i h j data υ i h j recon )
Δ a i = η ( υ i data υ i recon )
Δ b j = η ( h j data h j recon )
where . data represents the expectation on the probability defined by dataset, and . recon is the expectation of the probability defined by the reconstructed model.

2.4.3. Fine-Tuning

Fine-tuning is a supervised training process with labeled data. To improve network performance, the gradient descent algorithm is used for fine-tuning parameters. The back propagation (BP) algorithm, which was used to adjust and optimize weight parameters extracted in the pre-training stage, was used to fine-tune the entire network’s parameters in a top-down fashion. The weight of each layer was pretrained by the RBM before fine-tuning. However, it was not in random initialization because BP neural networks avoid local convergence. Through multiple-iteration forward and back propagation, the weights between neurons were modified. When the error between the actual value and the output value meets the requirement, the training stopped. Finally, the HVIS were retrieved using Equation (18):
V HVIS _ retrieved = V std , HVIS × σ HVIS +   μ HVIS
where V HVIS _ retrieved is the retrieved HVIS, V std , HVIS is the standardized output, μ HVIS is the average of the HVIS training set, and σ i is the variance of the HVIS training set.

3. Results and Discussion

3.1. Model Training and Pre-Validation

We selected data for training and pre-validation of the HVIS_DBN model from 1 January 2014 to 31 December 2016 to evaluate the effectiveness and performance of the model. In the three years of the study, the matchup samples totaled 31,377 pairs of input data and HVIS. In our experiment, we randomly selected 80% of the data as the training set and 20% as the validation set [47]. The input variables of HVIS_DBN were standardized according to Equation (1). To overcome potential HVIS_DBN model over-fitting, dropout techniques were applied to train the model. The model with dropout exhibited a higher predictive accuracy than without dropout, especially in the small dataset, where dropout-DBN produced the best performance [29,32].
The dropout technique is a random retreat mechanism used to overcome the data problem of over-fitting [32]. The basic idea of the dropout technique is to randomly ignore neurons of the hidden layer in the training process to prevent over-fitting. In the pre-training process of the HVIS_DBN model, some of the random sections of nodes were not involved in the forward propagation training process and the weight was reserved during each iteration process. These neurons may be involved in training in the next iteration. The dropout technique improves the generalization ability and effectively overcomes the time-consuming problem of network training, thus preventing interdependence among features and distinctly improving precision. The mean absolute error (MAE), RMSE, and R were used to evaluate model prediction accuracy.
Figure 3 depicts comparisons between predicted and observed HVIS during the model training and the pre-validation stages. The horizontal axis represents the observed HVIS from ground-based stations. The vertical axis represents the predicted HVIS from HVIS_DBN model. The numbers of the matched data points are 25,101 and 6276 for model training and pre-validation, respectively. During the model training stage (Figure 3a), the R was 0.74 and RMSE was 4.725 km. For the pre-validation period (Figure 3b), the R value only decreased by 0.017 and RMSE only increased by 0.173 km. Basically, the predicted HVIS values were slightly overestimated relative to observations below 20 km altitude, however HVIS values were underpredicted above 20 km. This was consistent for both model training and pre-validation periods.

3.2. Model Evaluation

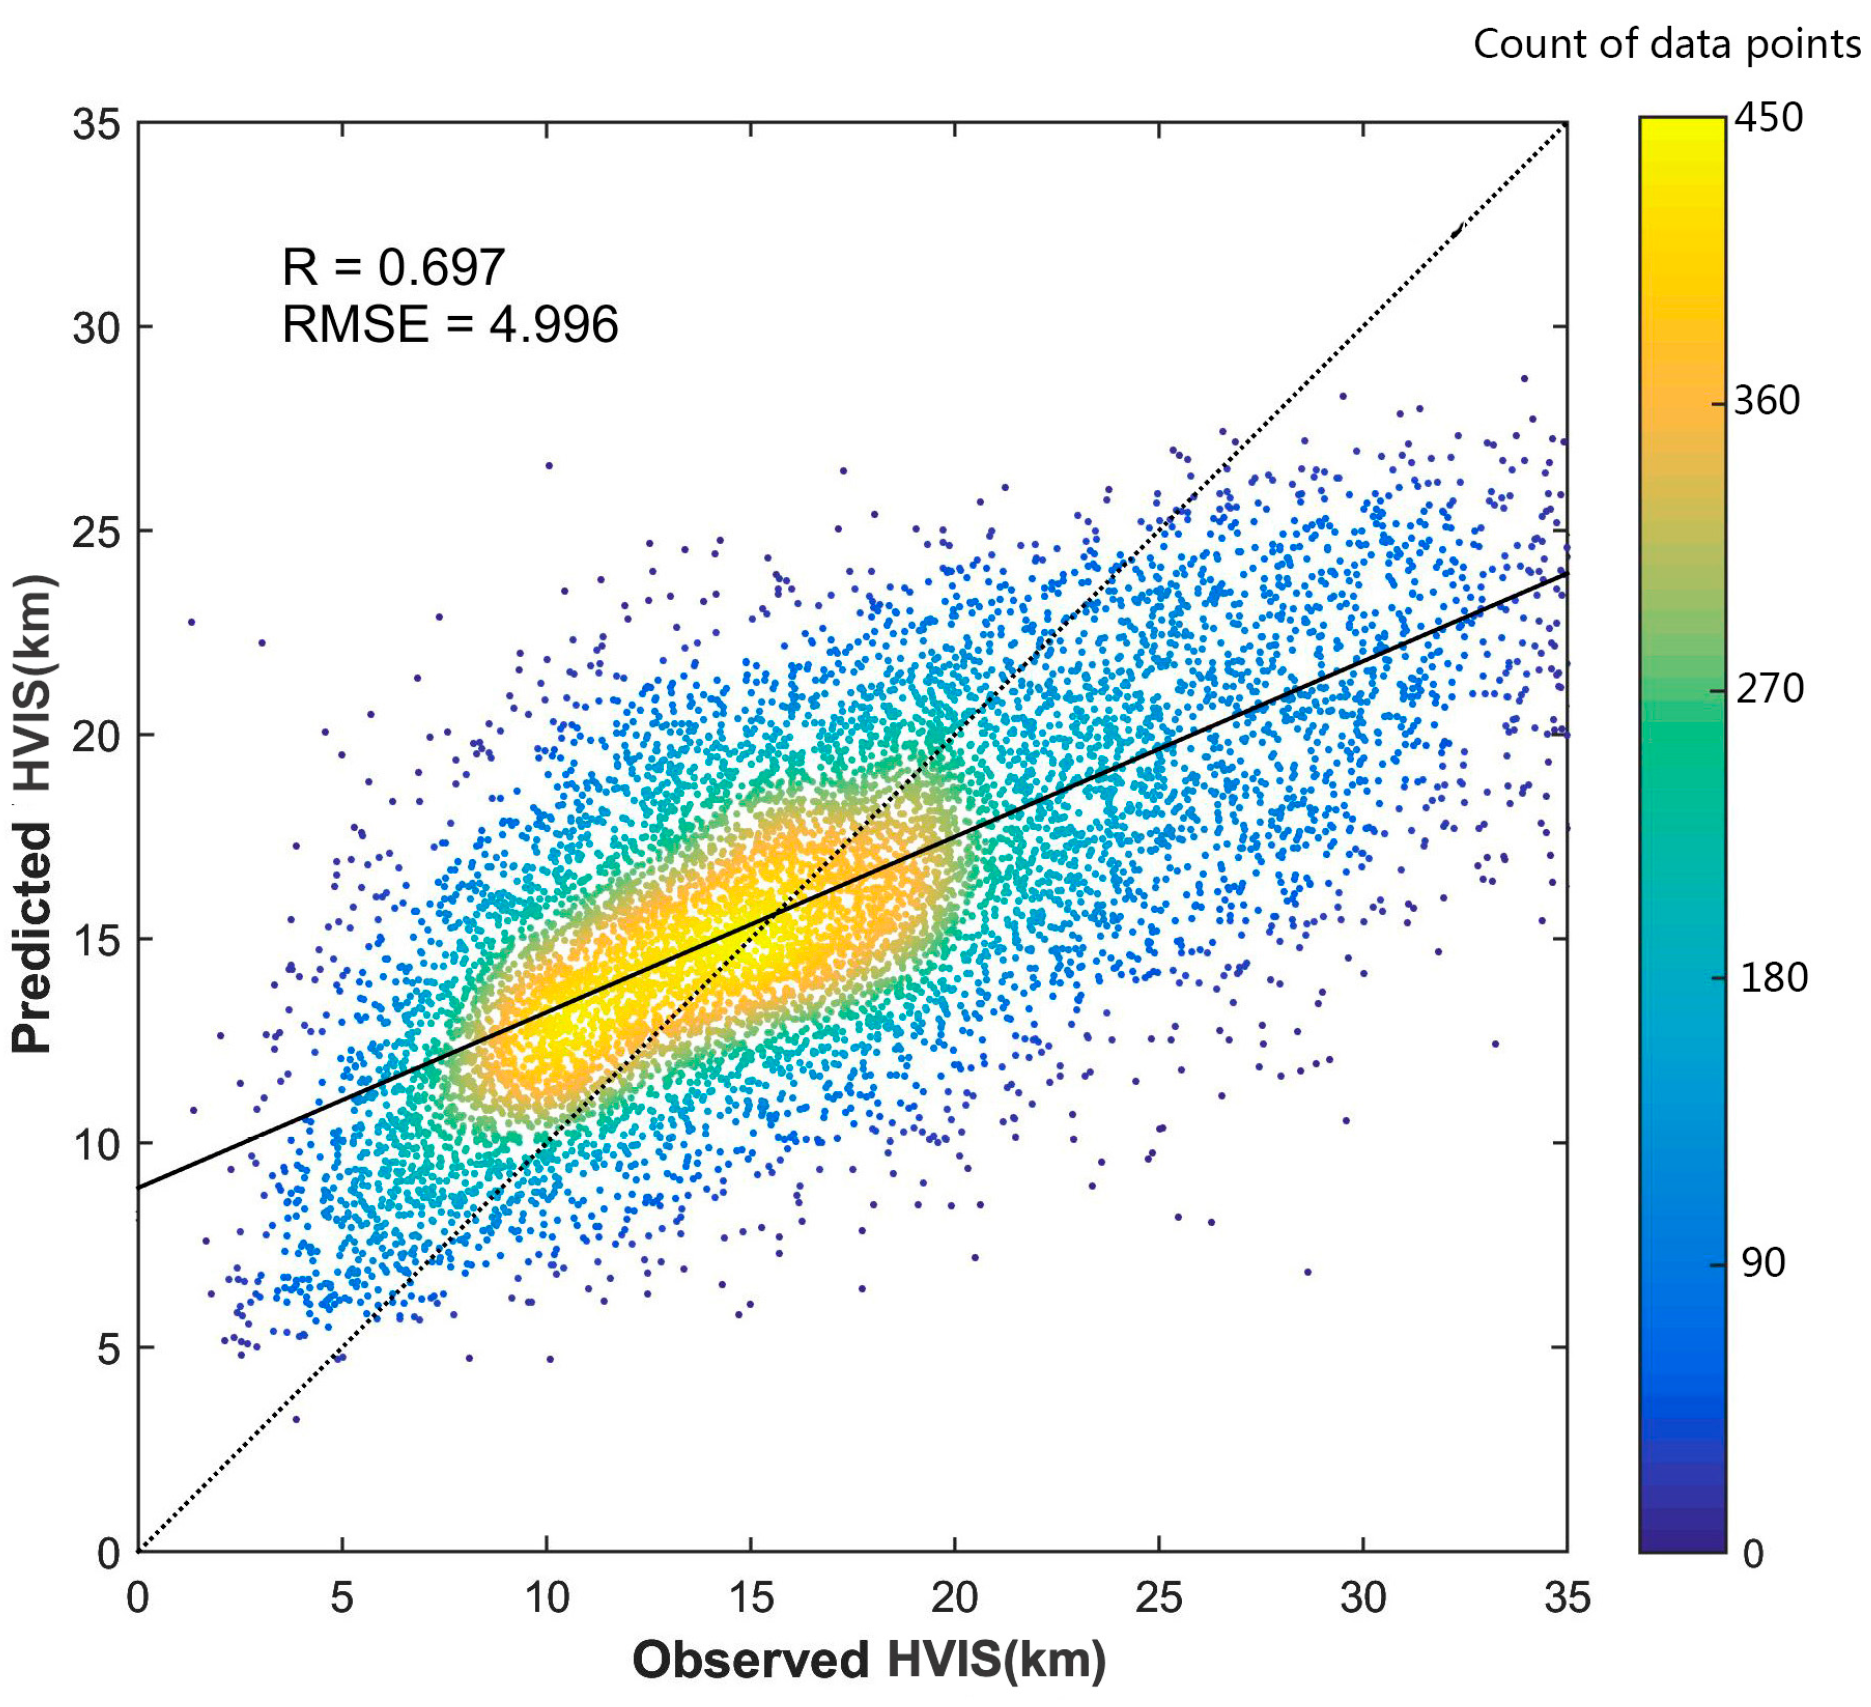
The goal of the trained HVIS_DBN model is to be widely used for retrieving HVIS over Eastern China. To provide a more objective evaluation of the HVIS_DBN model, the data from 2017 (different from the training data) were applied. For evaluation, we matched HVIS from ground-based observations with retrieval results from the HVIS_DBN model. The number of matchup samples in 2017 was 8717. As shown in Figure 4, the relationship between observed and retrieved HVIS was approximately linear with an R of 0.697 and RMSE of 4.996 km. Compared with the training and pre-validating results, the R of retrieved results only decreased by 0.043 and 0.026, respectively. The RMSE only increased by 0.271 km and 0.098 km, respectively.
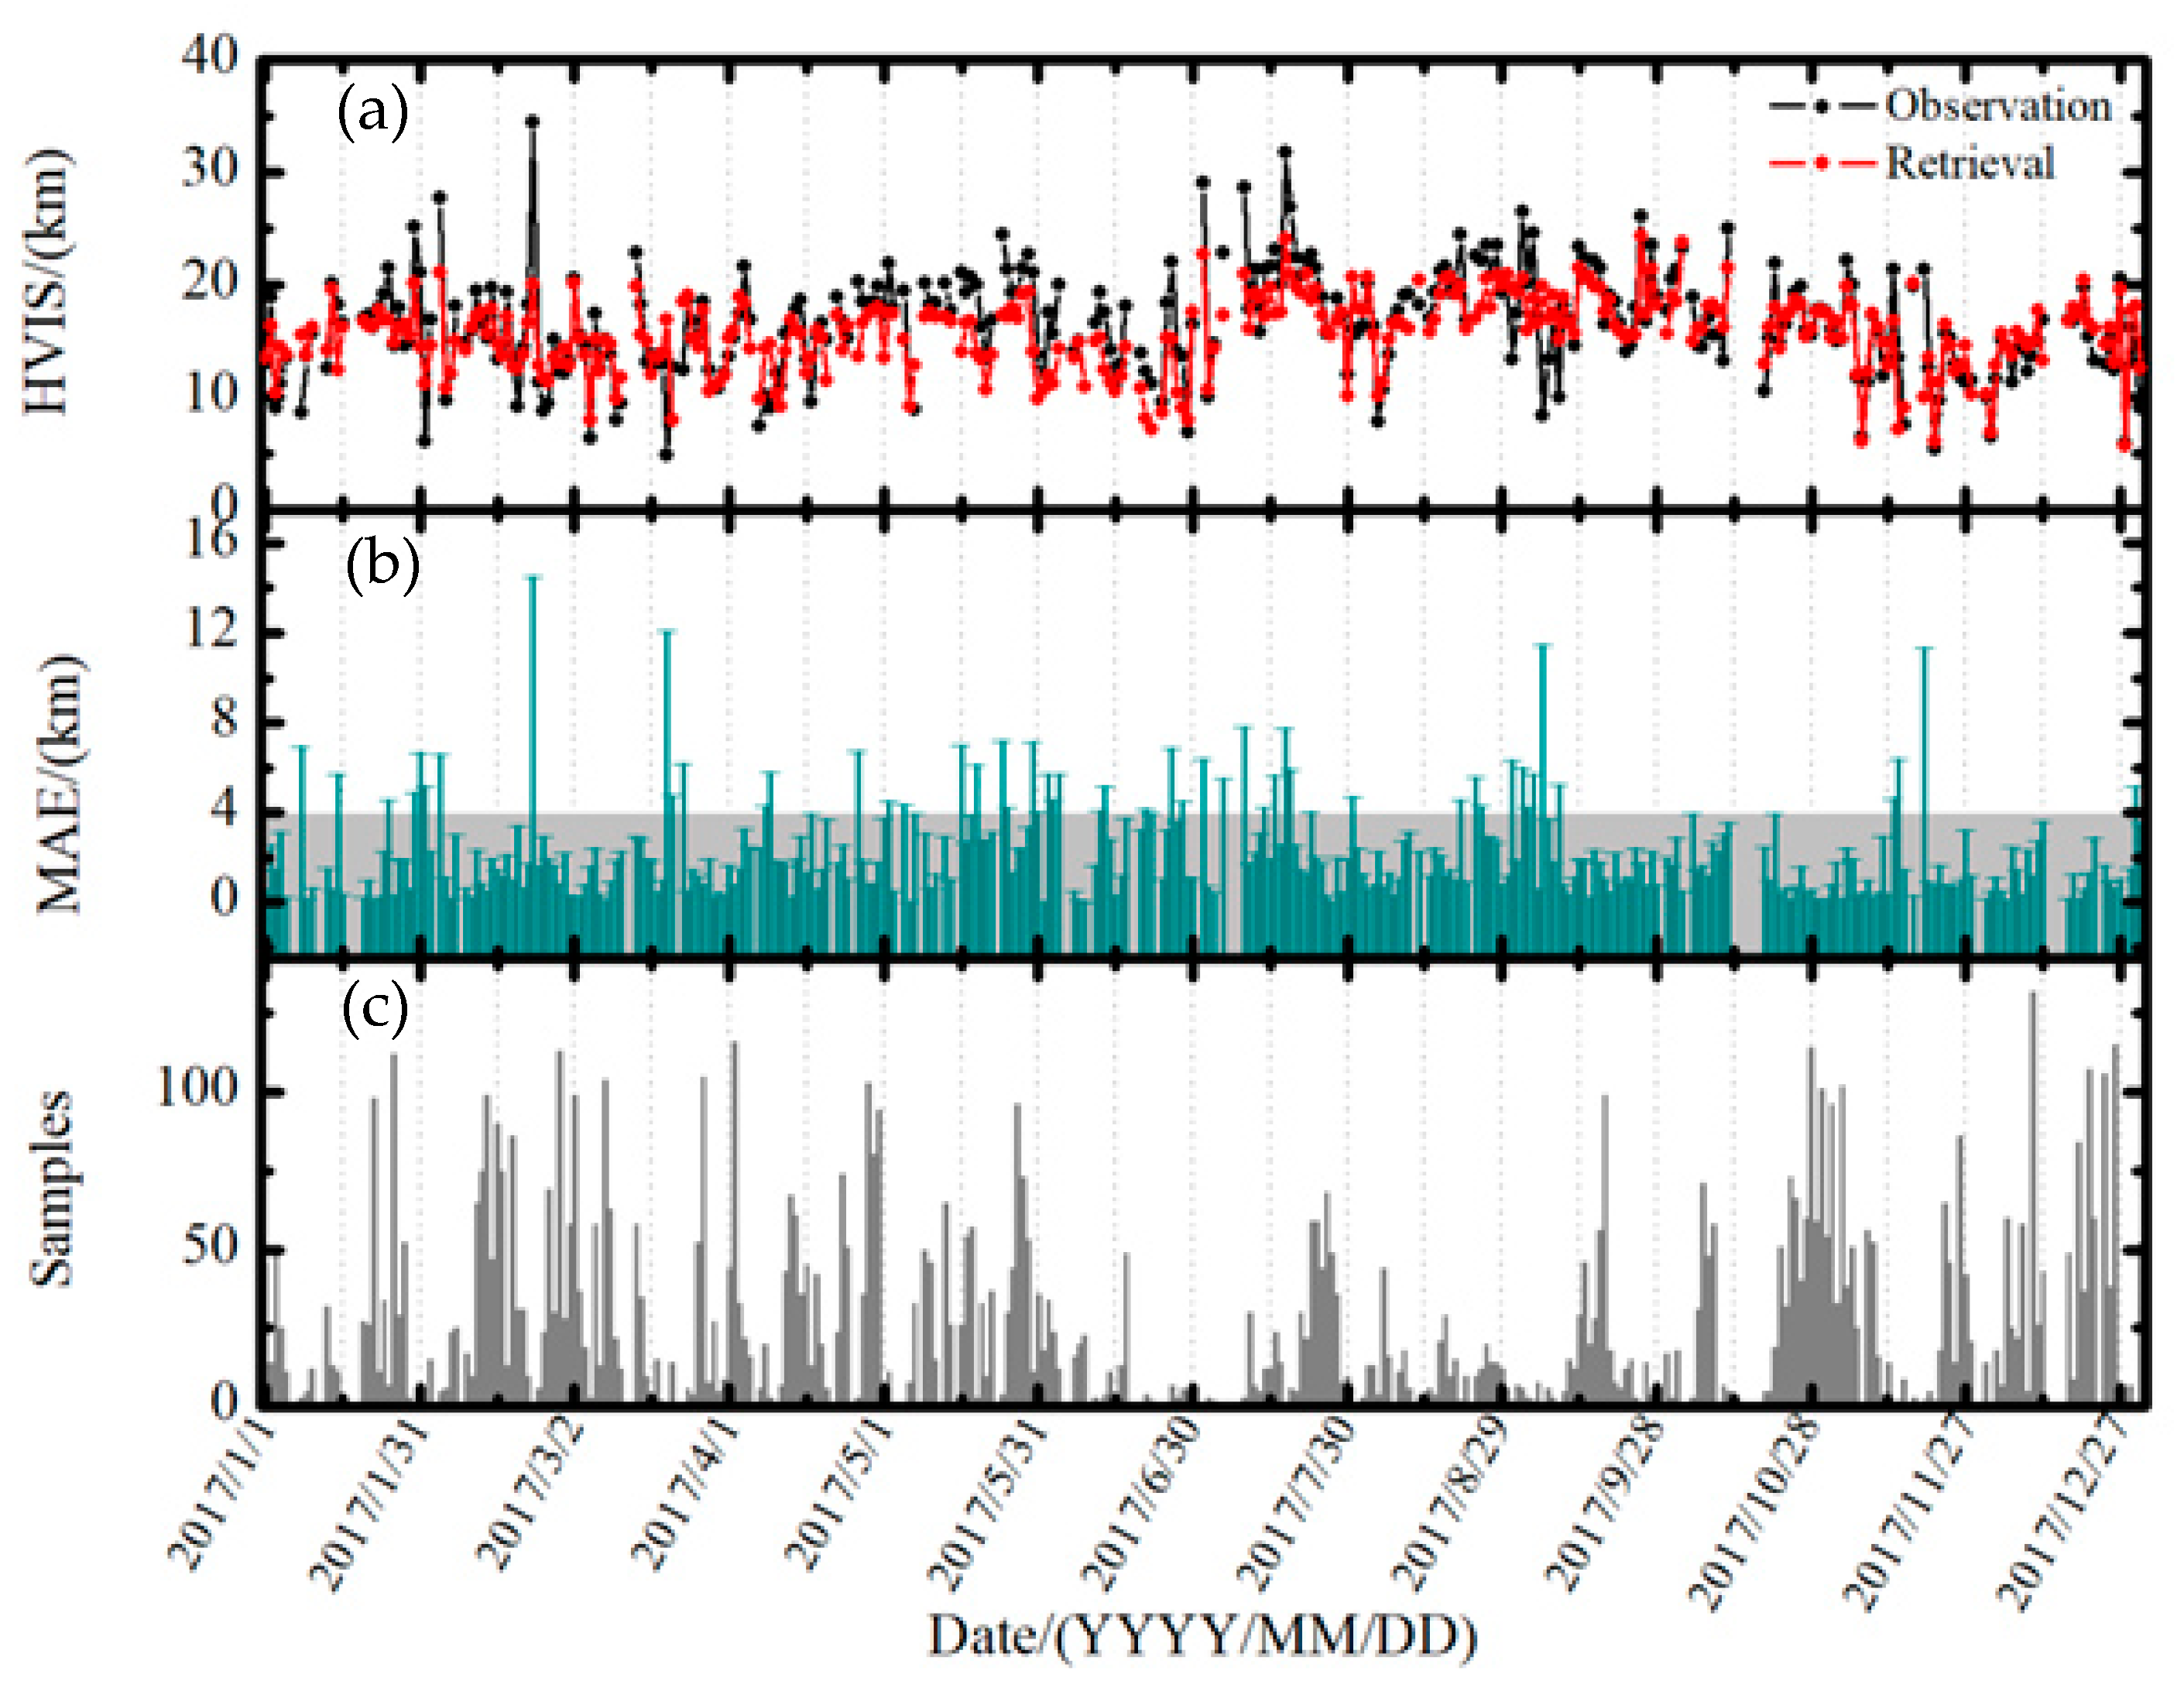
Figure 5 provides the time series of daily averaged HVIS between ground-based observations and retrievals from the HVIS_DBN model in 2017. The R and RMSE values of the daily mean HVIS were better than those of the separated matchup samples. The R was 0.77 with an RMSE of 3.08 km. According to statistical analysis, approximately 83.4% of the daily mean HVIS samples had a MAE of <4 km. The percentage of the samples with a MAE of <2 km was approximately 59.2%. The average number of matchup samples was approximately 31.6 when the MAE was less than 4 km. However, when the MAE was >4 km, the average number of matchup samples decreases to approximately 8.5. One of the reasons for the lower precision of HVIS retrieved by the HVIS_DBN model is an inadequate number of samples.
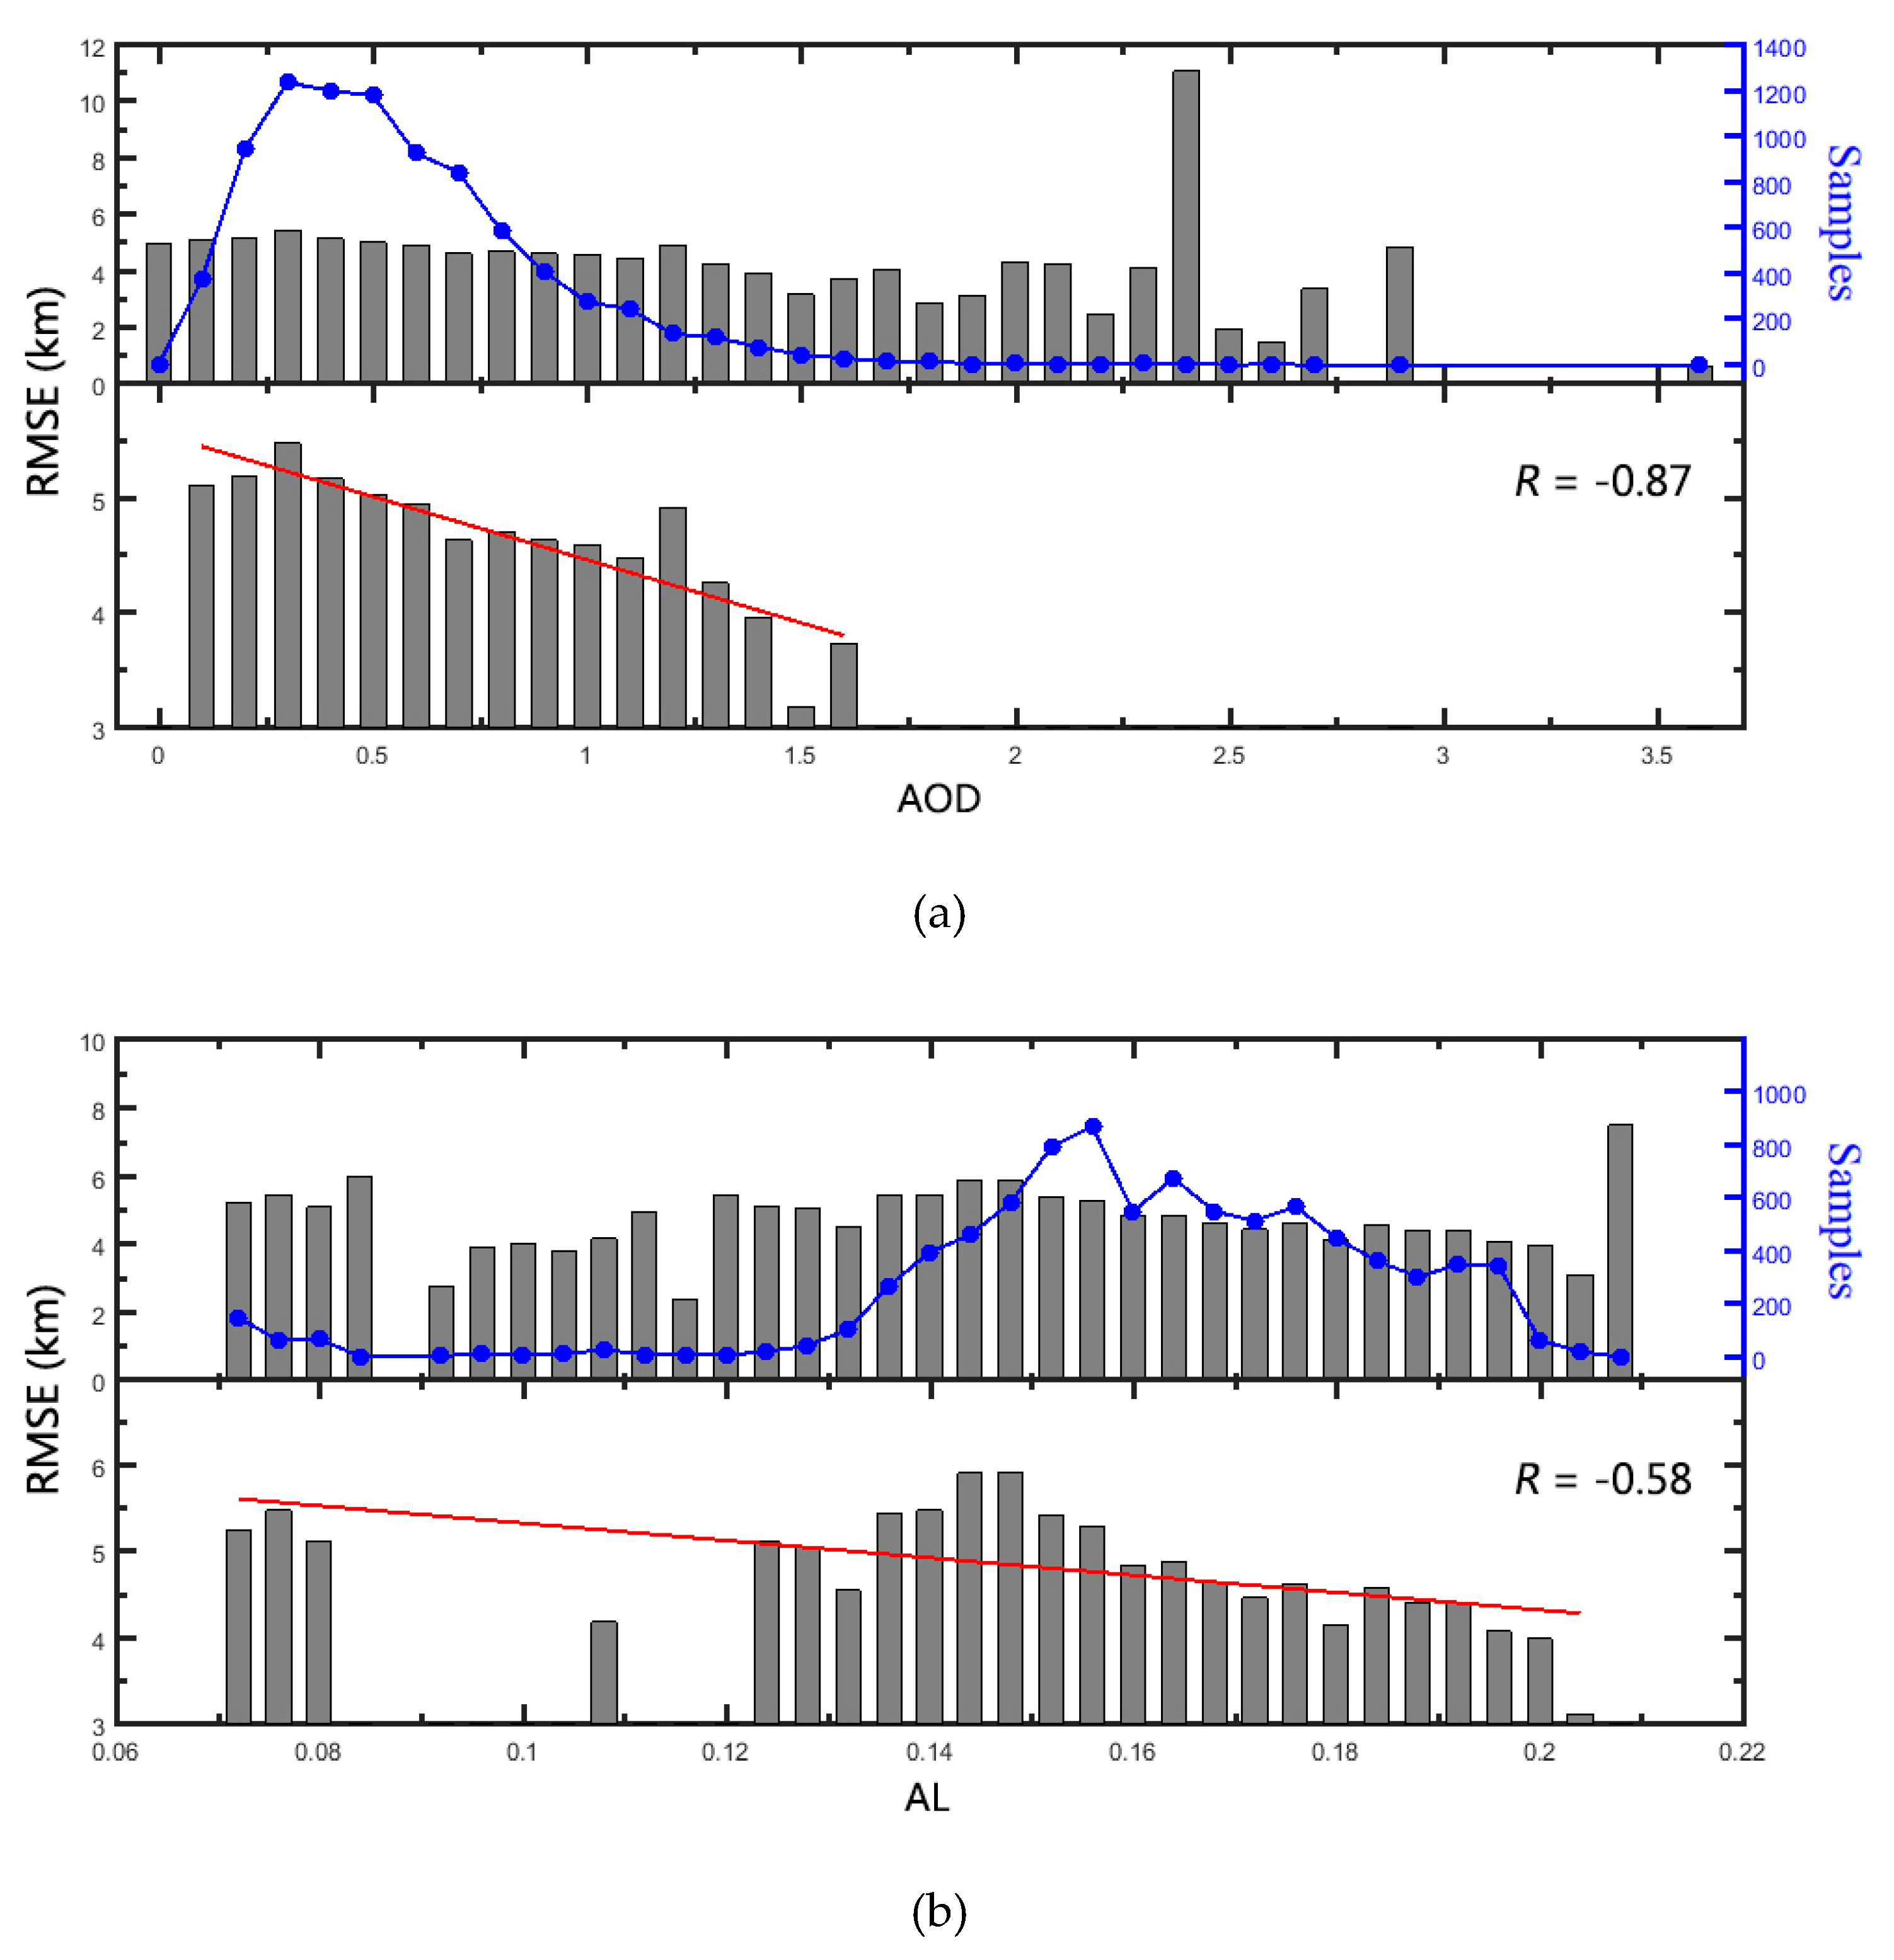
For all the matchup samples, the value of AOD ranged from 0 to 3.7. To analyze the precision of retrievals, the AOD was graded in 0.1 intervals. As shown in Figure 6a, the value of RMSE ranged from 0.641 to 11.087 km. The number of samples indicated significant variations with different AOD values. When the number of samples exceeded 20, the RMSE, ranging from 2.9 to 5.5 km, decreased with increasing values of AOD. The linear regression between AOD and RMSE produced correlation coefficient of −0.87 (significant at the 0.01 level(two-tailed)). This indicated that lower AOD values may have higher biases when retrieving HVIS using the HVIS_DBN model.
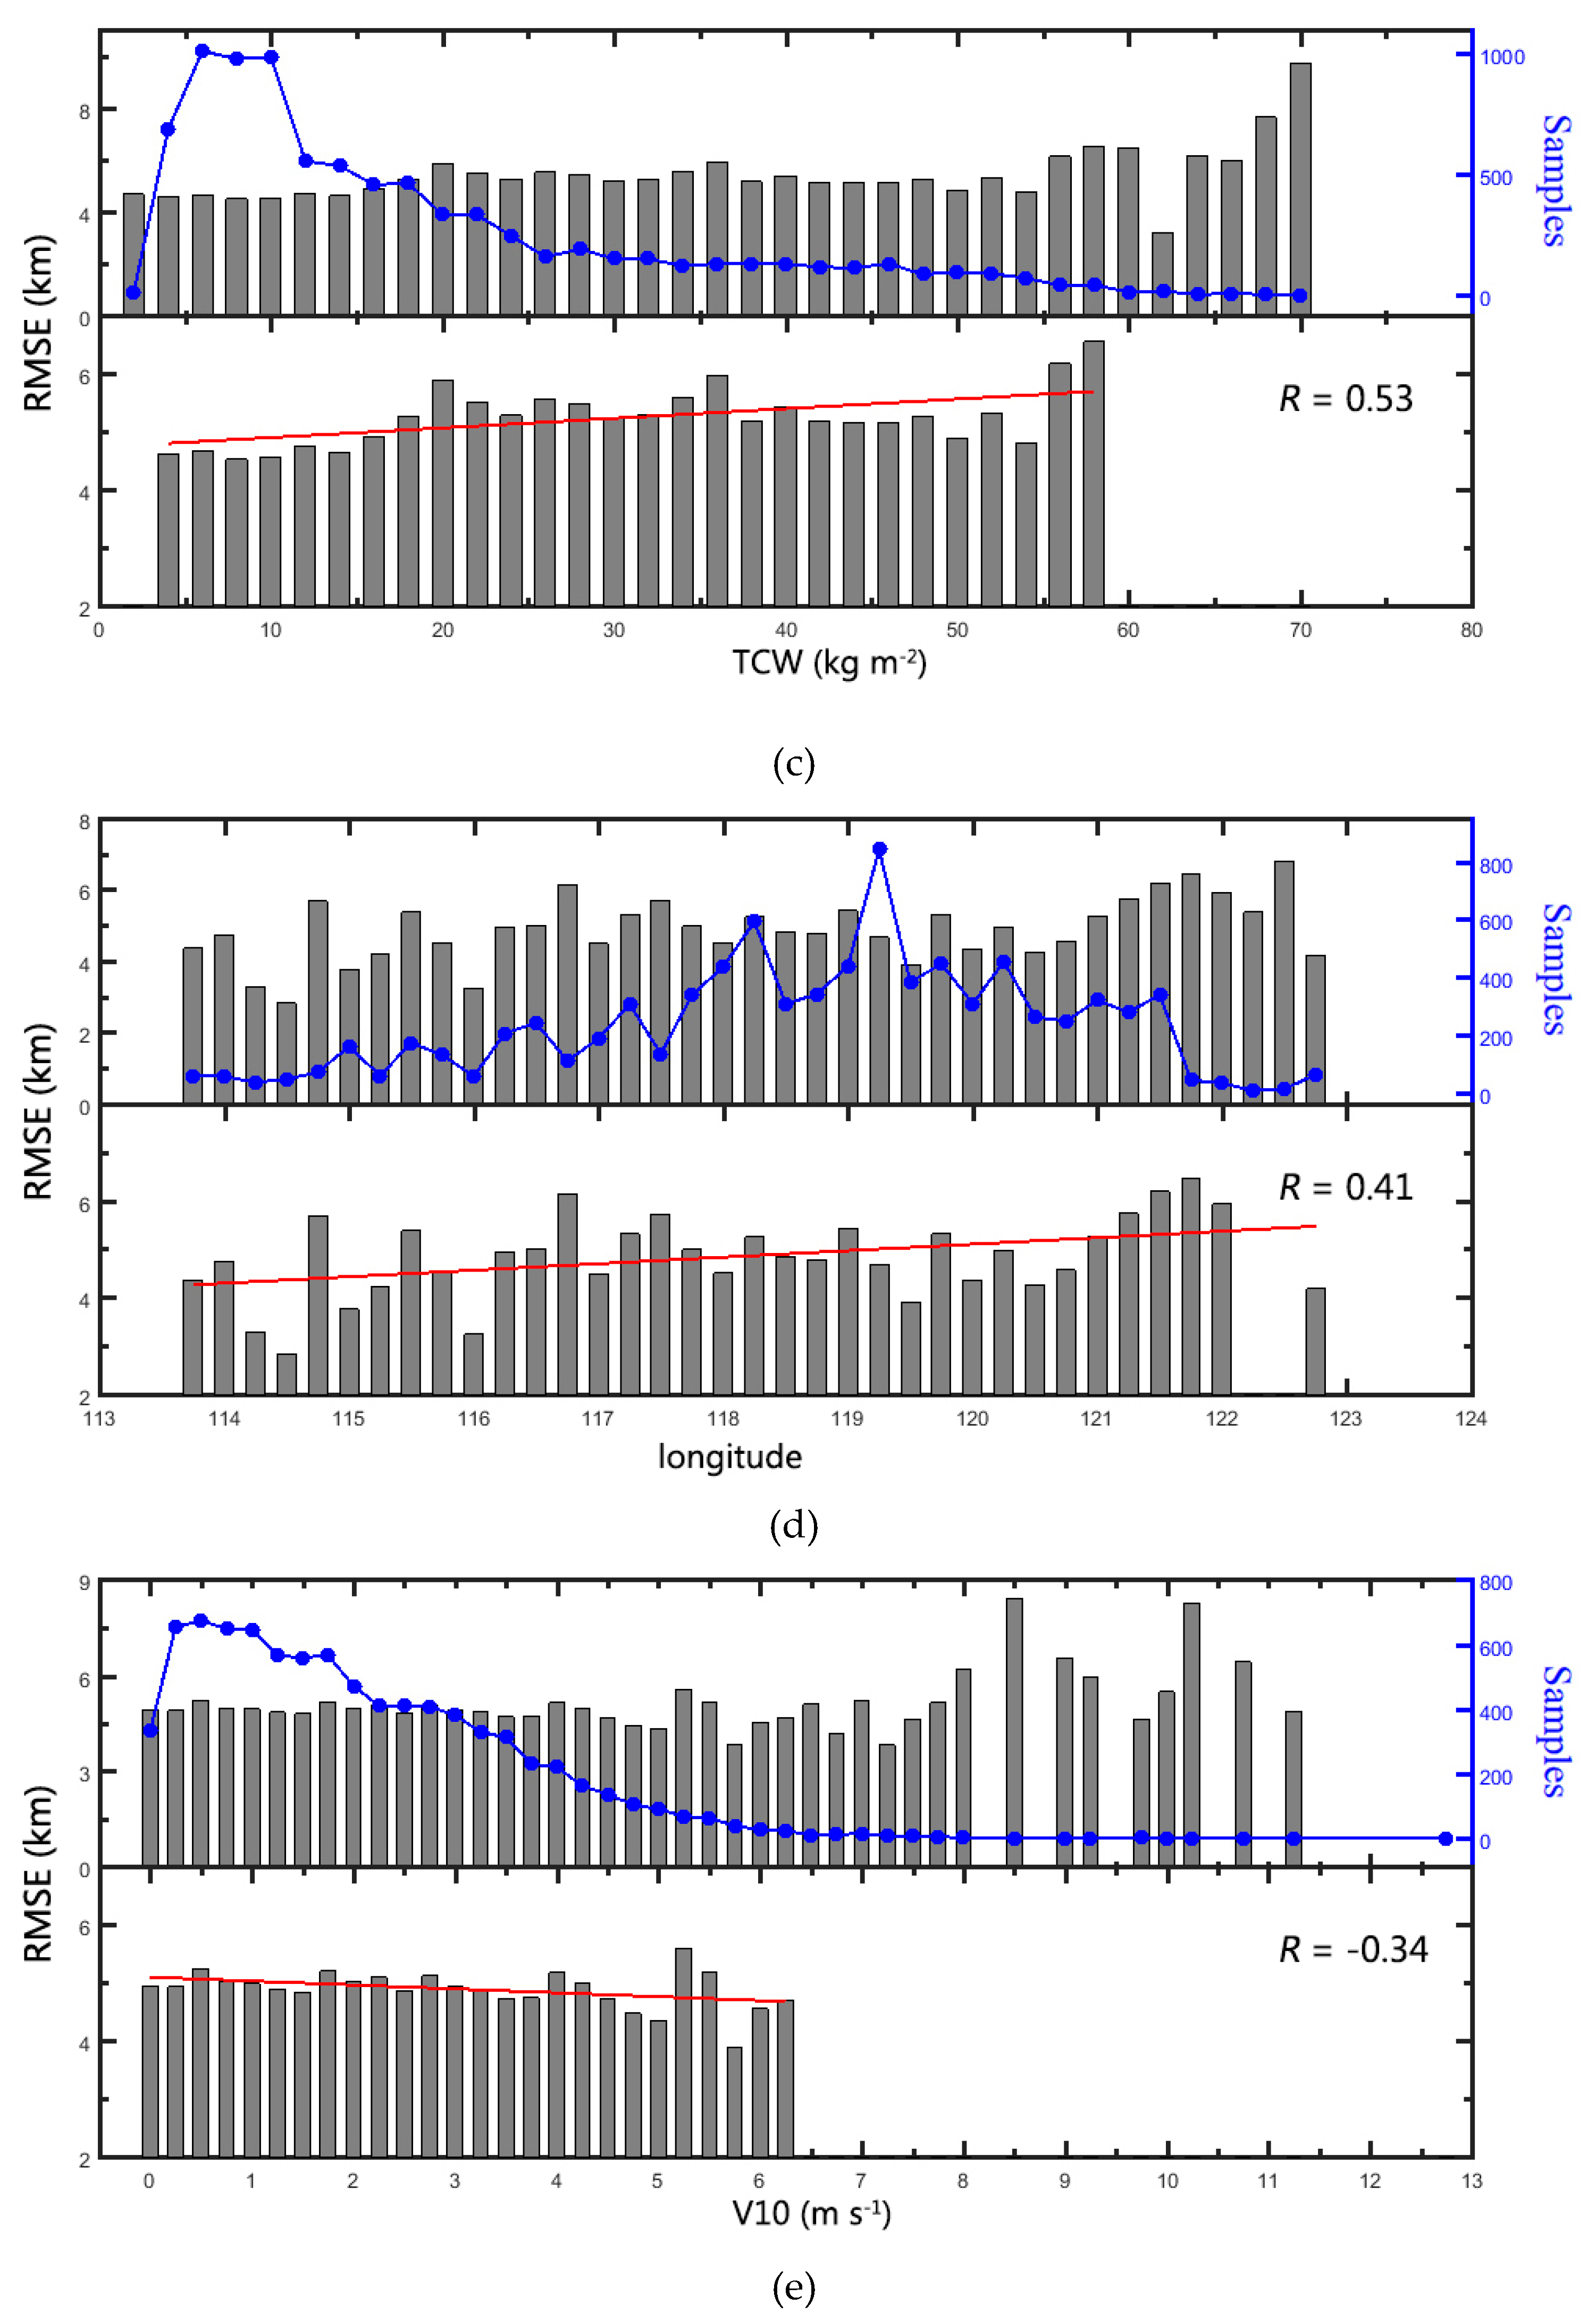
Figure 6b–e illustrates the variations in RMSE with AL, TCW, longitude, and V10. The graded intervals were 0.004, 2 kg m−2, 0.25, and 0.25 m s−1, respectively. The RMSE ranged from 2.403 to 7.536 km for AL, from 3.224 to 9.782 km for TCW, from 2.859 to 6.824 km for longitude, and from 0.069 to 8.438 km for V10. When the number of samples exceeded 20, the RMSE between observed HVIS and predicted HVIS showed a gradually decreasing trend with increasing AL (Figure 6b). The values of RMSE increased when TCW increased (Figure 6c). The values of RMSE increased slightly when longitude increased (Figure 6d); the values of RMSE decreased slightly when V10 increased (Figure 6e). The R values of linear fitting were −0.58, 0.53, 0.41, and −0.34, respectively. The correlation coefficient between RMSE and AL, and the correlation coefficient between RMSE and TCW, all passed the t-test at a 0.01 level of significance (two-tailed). The correlation coefficient between RMSE and longitude, and the correlation coefficient between RMSE and V10, were significant at the 0.05 level (two-tailed). According to the analysis, the lower precision of HVIS retrievals by the HVIS_DBN model were probably due to lower AL, higher TCW, higher longitude, and lower V10.
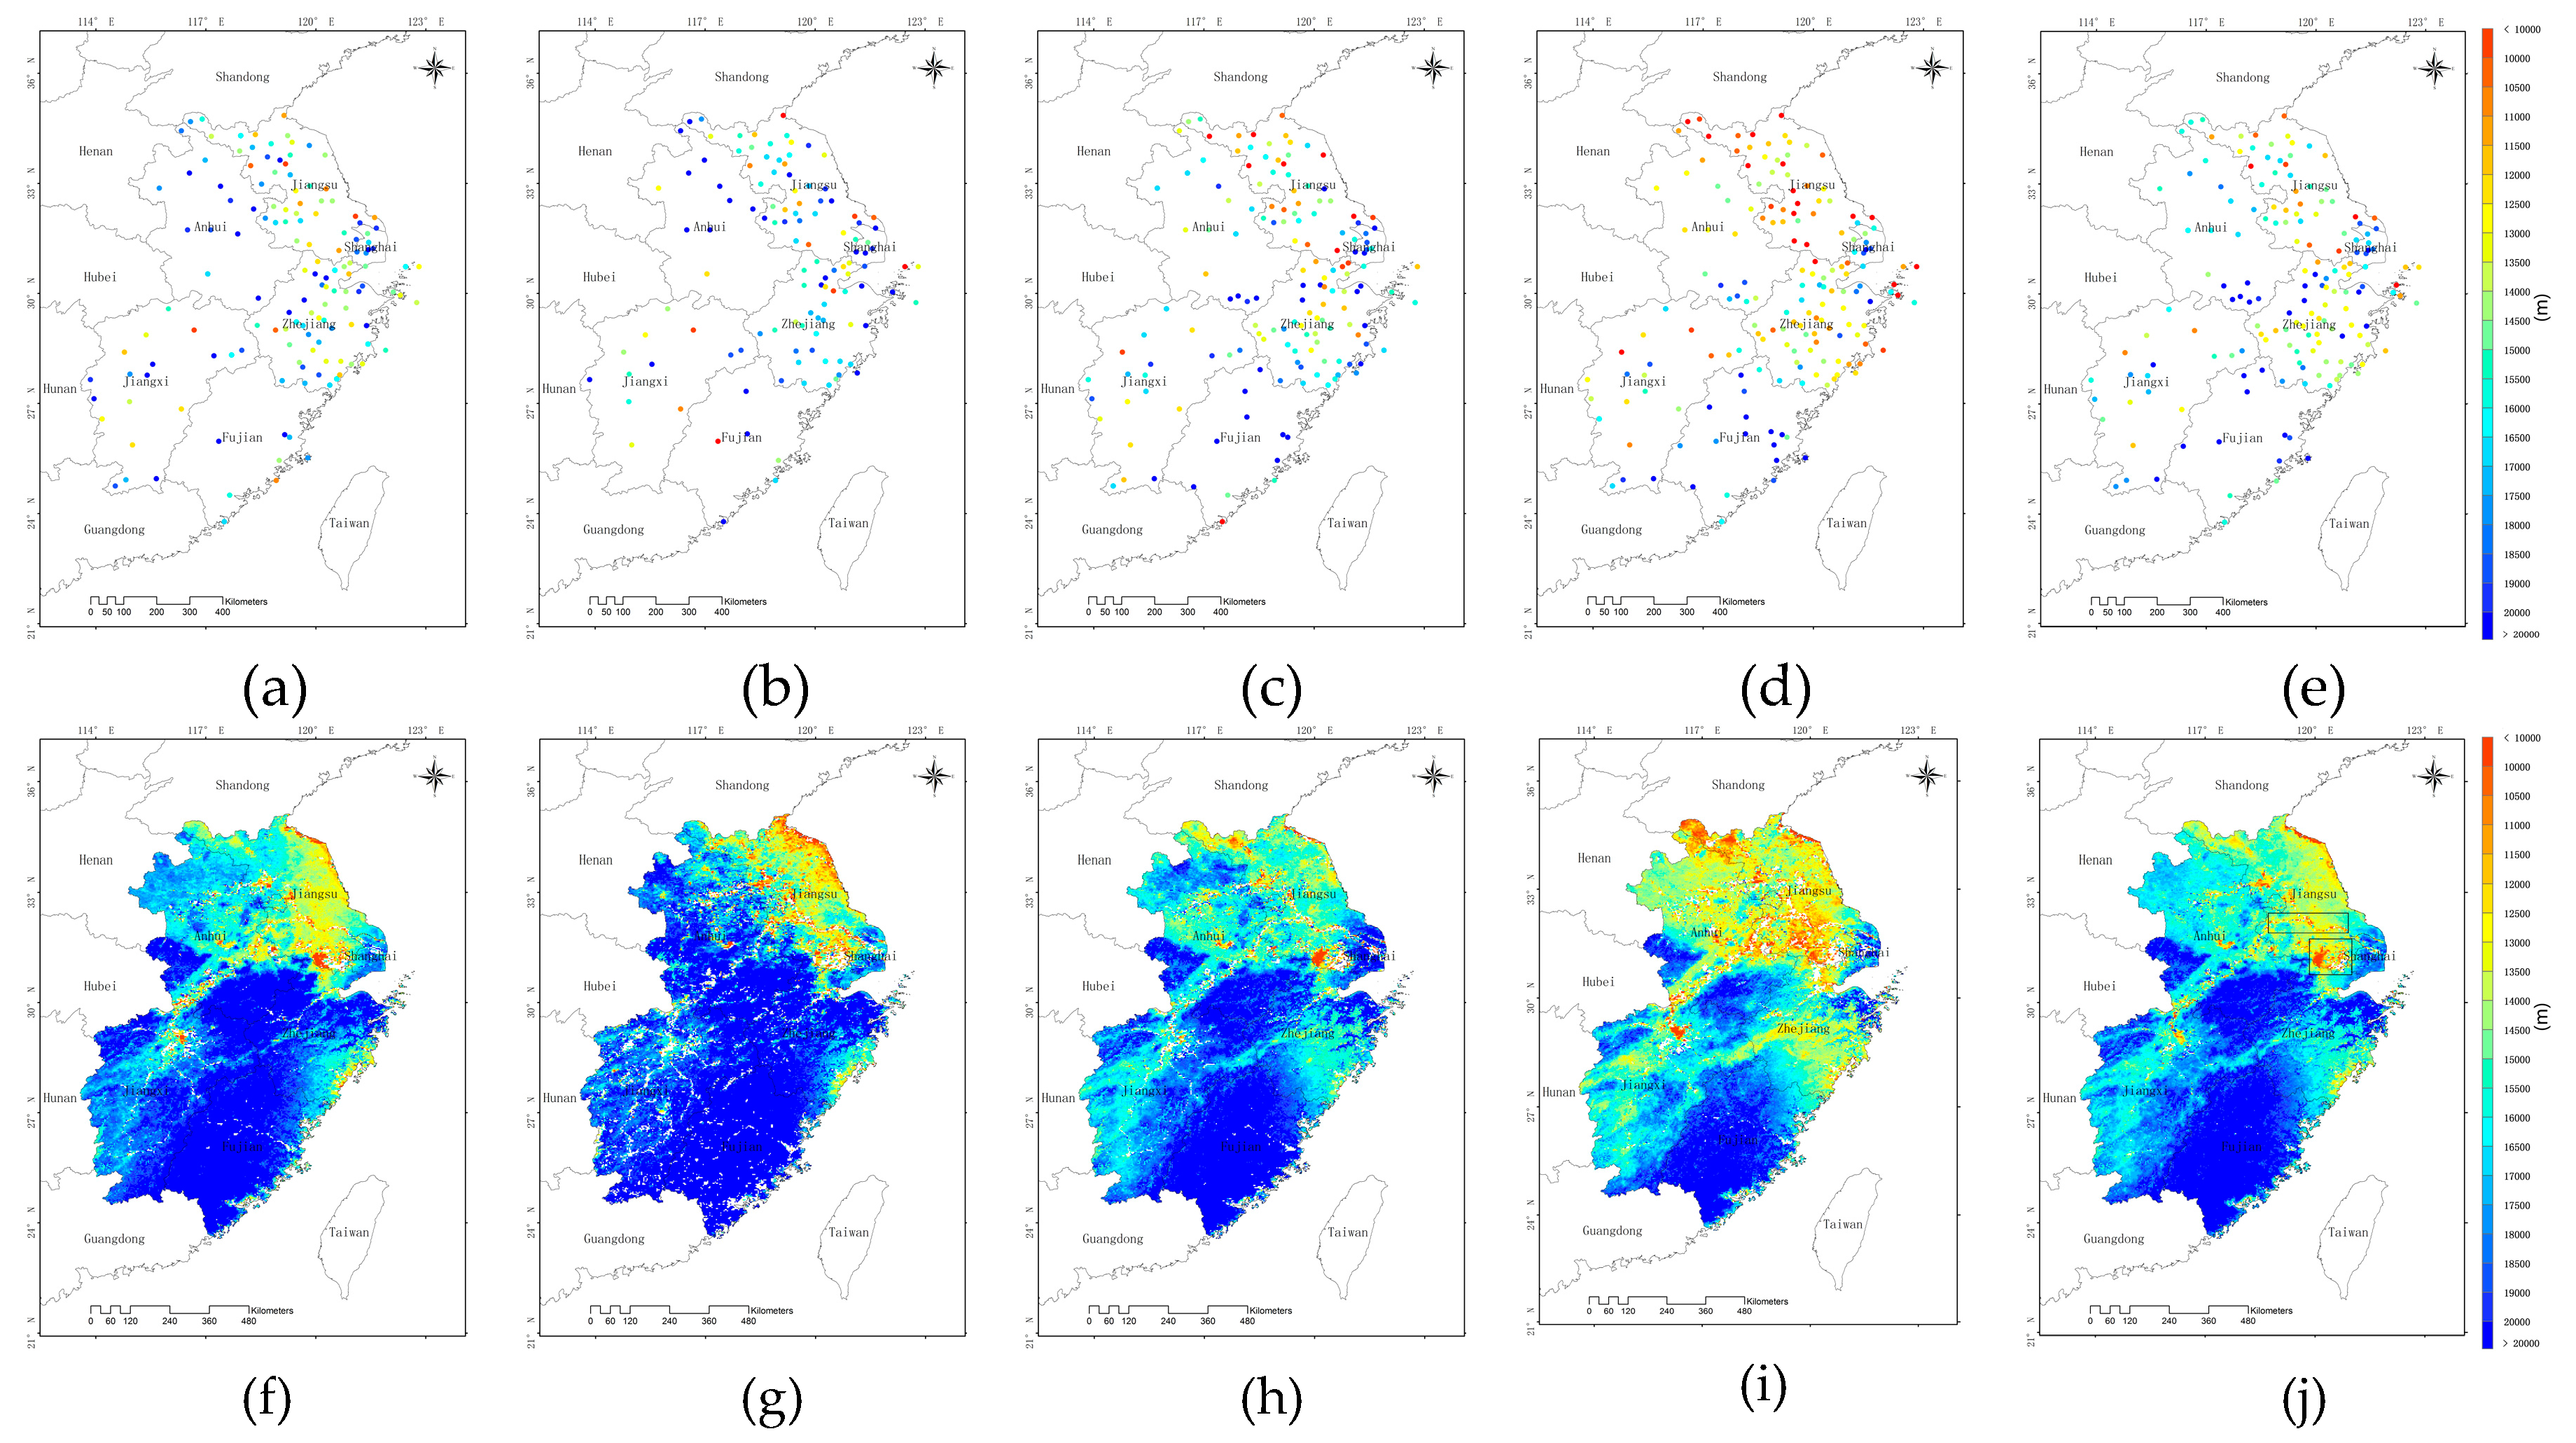
Figure 7 illustrates the seasonal and annual variations in the predicted and observed HVIS over Eastern China during 2017. Figure 7 reveals the high consistency between predicted and observed HVIS both for spatial and seasonal variations. The HVIS_DBN model effectively improves HVIS retrievals. Compared with ground-based observations, it performed well when analyzing the spatial distributions of HVIS, revealing that HVIS values followed a north-to-south increasing trend. The lower values of HVIS were mainly located in Jiangsu Province. The spatial distribution of HVIS also showed that the HVIS over water bodies (such as Taihu Lake and Yangtze River) was lower than other land covers. The HVIS exhibited a strong seasonal variation, which increased in summer and decreased in winter.
Figure 8 depicts a case from 1 November 2017. The MAE spatial distribution of HVIS between ground-based observations (Visg) and retrievals (Vism) is demonstrated in Figure 8a. In total, 96 matchup samples were used for the analysis. According to the statistical result, the R of all the samples was 0.87 and the RMSE was 3.978 km. There were 59 samples with a MAE less than 3 km and 18 samples with a MAE larger than 5 km. The values of MAE in the regions with lower AOD (such as Fujian) were always higher than 5 km (Figure 8b). This finding is consistent with the analysis in Figure 6a. Figure 8c displays the distributions of retrieved HVIS over Eastern China on 1 November 2017. The distribution revealed that the regions with lower HVIS always had lower MAE. The findings indicate that the HVIS_DBN model is more reliable for retrieving low HVIS.

4. Conclusions

In this study, a DL method for retrieving HVIS was presented. This method is primarily based on a HVIS_DBN model with data from the MODIS AOD product, ECMWF reanalysis data, and the HVIS observations of CMA. The HVIS_DBN model comprises a multi-layer unsupervised RBM and layer for supervised learning. The training of the HVIS_DBN model involved three main steps: Pre-processing, pre-training, and fine tuning. In the pre-processing stage, the input variables and parameters of HVIS_DBN were first initialized using zero-mean method. In the pre-training step, the input variables and parameters were first initialized. The BP algorithm, which is used to adjust and optimize weight parameters extracted in the pre-training stage, was used for fine-tuning the entire network’s parameters in a top-down manner. The dropout mechanism introduced in the HVIS_DBN training process was used to overcome the over-fitting problem.
We used data from three years (2014–2016) for training and pre-validating the HVIS_DBN model. The data from 2017 were applied for model evaluations. The results demonstrated that the R values between observations and retrievals were 0.74 for training, 0.723 for pre-validating, and 0.697 for evaluations. The values of RMSE were all less than 5 km. The time series result of daily averaged HVIS showed high consistency between the ground-based observations and retrievals, with R of 0.77 and RMSE of 3.08 km; a small number of samples resulted in low precision. The precision analysis revealed that the bias of HVIS retrievals by the HVIS_DBN model was probably caused by lower AOD, lower albedo, higher TCW, higher longitude, and lower V10. The spatial distribution of HVIS followed a north-to-south increasing trend, showing that the HVIS over water bodies (such as Taihu Lake and Yangtze River) is lower than over other land cover types. The HVIS exhibited a strong seasonal variation, which increased in summer and decreased in winter. The regions with lower HVIS invariably exhibited lower MAE, which indicates that the HVIS_DBN model is more reliable in retrieving low HVIS.
Overall, the HVIS_DBN model provides an effective method for retrieving HVIS. The evaluations also exhibited a higher performance than ground-based HVIS. In future studies, the model should be improved to adapt to different ranges of input data (including higher AOD, higher albedo, lower TCW, lower longitude, and higher V10), and a larger number of training samples should be used, particularly for the samples with lower HVIS to improve the accuracy of the HVIS_DBN model. The retrieved HVIS can be further applied for PM2.5 estimation by introducing humidity correction for hygroscopic growth. This work would have certain application in atmospheric environmental monitoring and air quality forecasts over Eastern China.

Author Contributions

Conceptualization, X.Z. (Xingying Zhang) and R.S.; methodology, B.H.; software, B.H.; validation, X.Z. (Xianchun Zhu); formal analysis, B.H.; investigation, B.H.; resources, X.Z. (Xingying Zhang); data curation, R.S.; writing (original draft preparation), B.H.; writing (review and editing), B.H.; visualization, X.Z. (Xianchun Zhu); supervision, R.S.; project administration, X.Z. (Xingying Zhang); and funding acquisition, X.Z. (Xingying Zhang).

Funding

This work was supported by National Key R&D Program of China (Grant Nos. 2017YFB0504001 and 2016YFB0500705) and National Natural Science Funds of China (Grant No. 41775028).

Acknowledgments

We immensely appreciate the MODIS Science Data Support Team and the NASA LAADS DAAC for processing and distributing the MODIS data used in this paper.

Conflicts of Interest

The authors declare no conflict of interest.

References

  1. Watson, J.G. Visibility: Science and Regulation. J. Air Waste Manag. Assoc. 2002, 52, 628–713. [Google Scholar] [CrossRef] [PubMed]
  2. Bäumer, D.; Vogel, B.; Versick, S.; Rinke, R.; Möhler, O.; Schnaiter, M. Relationship of visibility, aerosol optical thickness and aerosol size distribution in an ageing air mass over South-West Germany. Atmos. Environ. 2008, 42, 989–998. [Google Scholar] [CrossRef]
  3. Huang, W.; Tan, J.; Kan, H.; Zhao, N.; Song, W.; Song, G.; Chen, G.; Jiang, L.; Jiang, C.; Chen, R.; et al. Visibility, air quality and daily mortality in Shanghai, China. Sci. Total Environ. 2009, 407, 3295–3300. [Google Scholar] [CrossRef] [PubMed]
  4. Ying, Q.; Mysliwiec, M.; Kleeman, M.J. Source apportionment of visibility impairment using a three-dimensional source-oriented air quality model. Environ. Sci. Technol. 2004, 38, 1089–1101. [Google Scholar] [CrossRef] [PubMed]
  5. Thach, T.Q.; Wong, C.M.; Chan, K.P.; Chau, Y.K.; Chung, Y.N.; Ou, C.Q.; Yang, L.; Hedley, A.J. Daily visibility and mortality: Assessment of health benefits from improved visibility in Hong Kong. Environ. Res. 2010, 110, 617–623. [Google Scholar] [CrossRef] [PubMed]
  6. Watson, J.G.; Chow, J.C. Clear sky visibility as a challenge for society. Annu. Rev. Energy Environ. 1994, 19, 241–266. [Google Scholar] [CrossRef]
  7. Wang, K.; Dickinson, R.E.; Liang, S. Clear sky visibility has decrease over land globally from 1973 to 2007. Science 2009, 323, 1468–1470. [Google Scholar] [CrossRef]
  8. Qu, W.; Wang, J.; Gao, S.; Wu, T. Effect of the strengthened western Pacific subtropical high on summer visibility decrease over eastern China since 1973. J. Geophys. Res. Atmos. 2013, 118, 7142–7156. [Google Scholar] [CrossRef]
  9. Lin, C.; Li, Y.; Yuan, Z.; Lau, A.K.; Li, C.; Fung, J.C. Using satellite remote sensing data to estimate the high-resolution distribution of ground-level PM2.5. Remote Sens. Environ. 2015, 156, 117–128. [Google Scholar] [CrossRef]
  10. Levy, R.C.; Mattoo, S.; Munchak, L.A.; Remer, L.A.; Sayer, A.M.; Patadia, F.; Hsu, N.C. The Collection 6 MODIS aerosol products over land and ocean. Atmos. Meas. Tech. 2013, 6, 2989–3034. [Google Scholar] [CrossRef]
  11. Remer, L.A.; Mattoo, S.; Levy, R.C.; Munchak, L.A. MODIS 3km aerosol product: Algorithm and global perspective. Atmos. Meas. Tech. 2013, 6, 1829–1844. [Google Scholar] [CrossRef]
  12. Zhang, J.; Reid, J.S. A decadal regional and global trend analysis of the aerosol optical depth using a data-assimilation grade over-water MODIS and Level 2 MISR aerosol products. Atmos. Chem. Phys. 2010, 10, 10949–10963. [Google Scholar] [CrossRef]
  13. Zhang, Z.; Wong, M.; Nichol, J. Global trends of aerosol optical thickness using the ensemble empirical mode decomposition method. Int. J. Climatol. 2016, 36, 4358–4372. [Google Scholar] [CrossRef]
  14. Kloog, I.; Koutrakis, P.; Coull, B.A.; Lee, H.J.; Schwartz, J. Assessing temporally and spatially resolved PM2.5 exposures for epidemiological studies using satellite aerosol optical depth measurements. Atmos. Environ. 2011, 45, 6267–6275. [Google Scholar] [CrossRef]
  15. Liu, Y.; Wang, Z.; Wang, J.; Ferrare, R.A.; Newsom, R.K.; Welton, E.J. The effect ofaerosol vertical profiles on satellite-estimated surface particle sulfate concentrations. Remote Sens. Environ. 2011, 115, 508–513. [Google Scholar] [CrossRef]
  16. Koschmieder, H. Theorie der Horizontalen Sichtweite: Kontrast und Sichtweite; Keim & Nemnich Press: Munich, Germany, 1925; pp. 25–33. [Google Scholar]
  17. Kaufman, Y.J.; Fraser, R.S. Light extinction by aerosols during summer air pollution. J. Clim. Appl. Meteorol. 1983, 22, 1694–1706. [Google Scholar] [CrossRef]
  18. Hadjimitsis, D.G.; Clayton, C.; Toulios, L. Retrieving visibility values using satellite remote sensing data. Phys. Chem. Earth Parts A/B/C 2010, 35, 121–124. [Google Scholar] [CrossRef]
  19. Van Donkelaar, A.; Martin, R.V.; Park, R.J. Estimating ground-level PM2.5 using aerosol optical depth determined from satellite remote sensing. J. Geophys. Res. Atmos. 2006, 111, D21201. [Google Scholar] [CrossRef]
  20. Yang, D.; Li, C.; Lau, A.K.; Li, Y. Long-term measurement of daytime atmospheric mixing layer height over Hong Kong. J. Geophys. Res. Atmos. 2013, 118, 2422–2433. [Google Scholar] [CrossRef]
  21. Kessner, A.L.; Wang, J.; Levy, R.C.; Colarco, P.R. Remote sensing of surface visibility from space: A look at the United States East Coast. Atmos. Environ. 2013, 81, 136–147. [Google Scholar] [CrossRef]
  22. He, Q.; Li, C.; Geng, F.; Zhou, G.; Gao, W.; Yu, W.; Li, Z.; Du, M. A parameterization scheme of aerosol vertical distribution for surface-level visibility retrieval from satellite remote sensing. Remote Sens. Environ. 2016, 181, 1–13. [Google Scholar] [CrossRef]
  23. Malm, W.C.; Day, D.E. Estimates of aerosol species scattering characteristics as a function of relative humidity. Atmos. Environ. 2001, 35, 2845–2860. [Google Scholar] [CrossRef]
  24. Tsai, Y.I.; Cheng, M.T. Effects of sulfate and humidity on visibility in the Taichung harbor are (Taiwan). J. Aerosol. Sci. 1998, 29, S1213–S1214. [Google Scholar] [CrossRef]
  25. Tsai, Y.I.; Cheng, M.T. Visibility and aerosol chemical compositions near the coastal area in central Taiwan. Sci. Total Environ. 1999, 231, 37–51. [Google Scholar] [CrossRef]
  26. Green, M.C.; Flocchini, R.G.; Myrup, L.O. The relationship of the extinction coefficient distribution to wind field patterns in southern California. Atmos. Environ. Part A Gen. Top. 1992, 26, 827–840. [Google Scholar] [CrossRef]
  27. Lecun, Y.; Bengio, Y.; Hinton, G.E. Deep learning. Nature 2015, 521, 436–444. [Google Scholar] [CrossRef]
  28. Bengio, Y. Learning Deep Architectures for AI. Found. Trends Mach. Learn. 2009, 2, 1–127. [Google Scholar] [CrossRef]
  29. Hinton, G.E.; Osindero, S.; Teh, Y.W. A fast learning algorithm for deep belief nets. Neural Comput. 2006, 18, 1527–1554. [Google Scholar] [CrossRef]
  30. Shim, H.; Lee, S. Multi-channel electromyography pattern classification using deep belief networks for enhanced user experience. J. Cent. South Univ. 2015, 22, 1801–1808. [Google Scholar] [CrossRef]
  31. Chan, T.; Jia, K.; Gao, S.; Lu, J.; Zeng, Z.; Ma, Y. PCANet: A simple deep learning baseline for image classification? IEEE Trans. Image Process. 2015, 24, 5017–5032. [Google Scholar] [CrossRef]
  32. Hinton, G.E.; Deng, L.; Yu, D.; Dahl, G.; Mohsmed, A.; Jaitly, N.; Senior, A.; Vanhoucke, V.; Nguyen, P.; Sainath, T.; et al. Deep neural networks for acoustic modeling in speech recognition: The shared views of four research groups. IEEE Signal Process. Mag. 2012, 29, 82–97. [Google Scholar] [CrossRef]
  33. Ronao, C.A.; Cho, S.B. Human activity recognition with smartphone sensors using deep learning neural networks. Expert Syst. Appl. 2016, 59, 235–244. [Google Scholar] [CrossRef]
  34. Gao, Z.; Cai, Q.; Yang, Y.; Dong, N.; Zhang, S. Visibility graph from adaptive optimal kernel time-frequency representation for classification of epileptiform EEG. Int. J. Neural Syst. 2017, 27, 1750005. [Google Scholar] [CrossRef] [PubMed]
  35. Silver, D.; Huang, A.; Maddison, C.J.; Guez, A.; Sifre, L.; Van Den Driessche, G.; Schrittwieser, J.; Antonoglou, I.; Panneershelvam, V.; Lanctot, M.; et al. Mastering the game of Go with deep neural networks and tree search. Nature 2016, 529, 484–489. [Google Scholar] [CrossRef]
  36. Mohamed, A.; Sainath, T.N.; Dahl, G.; Ramabhadran, B.; Hinton, G.E.; Picheny, M.A. Deep belief networks using discriminative features for phone recognition. In Proceedings of the IEEE International Conference on Acoustics, Speech and Signal Processing, Prague, Czech Republic, 22–27 May 2011. [Google Scholar] [CrossRef] [Green Version]
  37. Bengio, Y.; Courville, A.; Vincent, P. Representation learning: A review and new perspectives. IEEE Trans. Pattern Anal. Mach. Intell. 2013, 35, 1798–1828. [Google Scholar] [CrossRef]
  38. Qiu, X.; Zhang, L.; Ren, Y.; Suganthan, P.N.; Amaratunga, G. Ensemble deep learning for regression and time series forecasting. In Proceedings of the IEEE Symposium on Computational Intelligence in Ensemble Learning, Orlando, FL, USA, 9–12 December 2014. [Google Scholar] [CrossRef]
  39. Chen, Y.; Zhao, X.; Jia, X. Spectral-Spatial Classification of Hyperspectral Data Based on Deep Belief Network. IEEE J. Sel. Top. Appl. Earth Obs. Remote Sens. 2015, 8, 2381–2392. [Google Scholar] [CrossRef]
  40. Huang, L.; Xiang, L. Method for Meteorological Early Warning of Precipitation-Induced Landslides Based on Deep Neural Network. Neural Process. Lett. 2018, 48, 1243–1260. [Google Scholar] [CrossRef]
  41. Li, X.; Peng, L.; Hu, Y.; Shao, J.; Chi, T. Deep learning architecture for air quality predictions. Environ. Sci. Pollut. Res. 2016, 23, 22408–22417. [Google Scholar] [CrossRef]
  42. Li, X.; Peng, L.; Yao, X.; Cui, S.; Hu, Y.; You, C.; Chi, T. Long short-term memory neural network for air pollutant concentration predictions: Method development and evaluation. Environ. Pollut. 2017, 231, 997–1004. [Google Scholar] [CrossRef]
  43. Zhang, Y.; Li, Z. Remote sensing of atmospheric fine particulate matter (PM2.5) mass concentration near the ground from satellite observation. Remote Sens. Environ. 2015, 160, 252–262. [Google Scholar] [CrossRef]
  44. Xie, Y.; Wang, Y.; Zhang, K.; Dong, W.; Lv, B.; Bai, Y. Daily Estimation of Ground-Level PM2.5 Concentrations over Beijing Using 3 km Resolution MODIS AOD. Environ. Sci. Technol. 2015, 49, 12280–12288. [Google Scholar] [CrossRef] [PubMed] [Green Version]
  45. Dee, D.P.; Uppala, S.M.; Simmons, A.J.; Berrisford, P.; Poli, P.; Kobayashi, S.; Andrae, U.; Balmaseda, M.A.; Balsamo, G.; Bauer, P. The ERA-Interim reanalysis: Configuration and performance of the data assimilation system. Q. J. R. Meteorol. Soc. 2011, 137, 553–597. [Google Scholar] [CrossRef]
  46. Sheng, P.; Mao, J.; Li, J.; Zhang, A.; Sang, J.; Pan, N. Atmospheric Physics; Peking University Press: Beijing, China, 2005; pp. 20–21. [Google Scholar]
  47. Hilborn, E.D.; Catanzaro, D.G.; Jackson, L.E. Repeated holdout cross-validation of model to estimate risk of Lyme disease by landscape characteristics. Int. J. Environ. Health Res. 2011, 1, 1–11. [Google Scholar] [CrossRef]
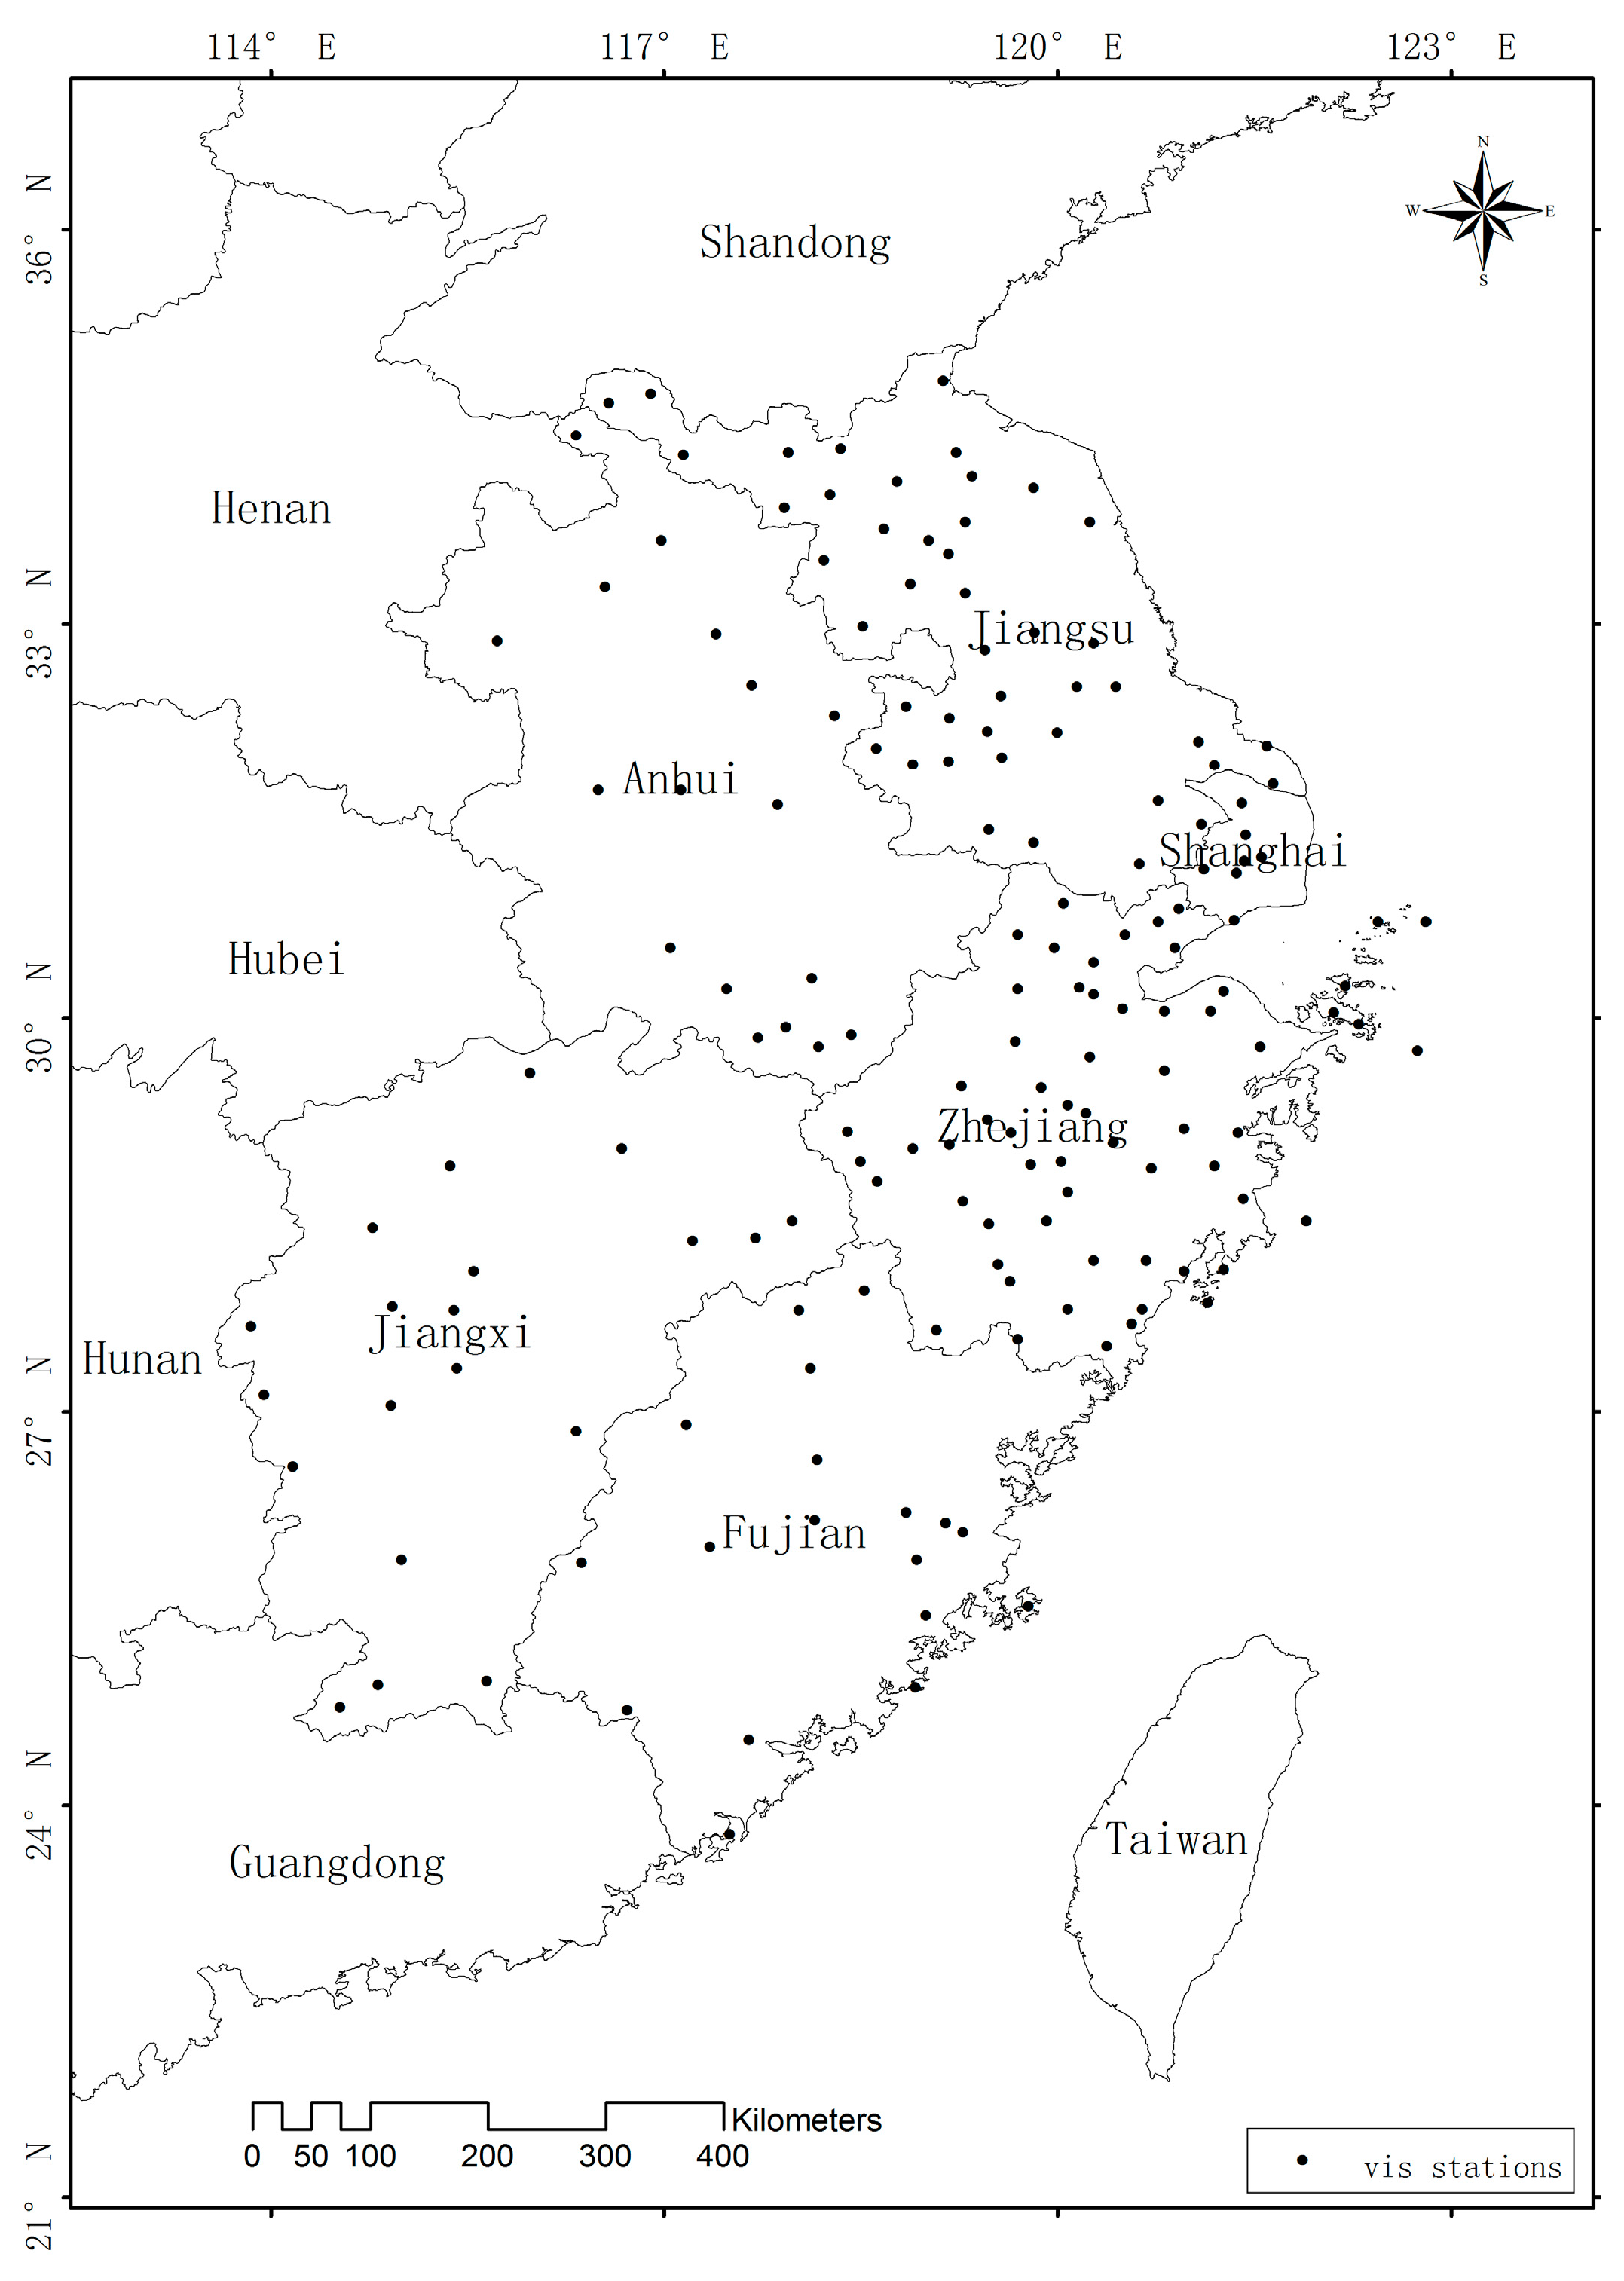
Figure 1. Locations of the horizontal visibility (HVIS) ground-based stations in Eastern China.
Atmosphere 10 00740 g001
Figure 2. Deep architecture model for HVIS predictions. The restricted Boltzmann machines (RBMs) at the bottom are used for feature extraction, and the back propagation (BP) layer at the top is for real-value predictions.
Atmosphere 10 00740 g002
Figure 3. Comparisons between predicted and observed HVIS. (a) Pre-training fitting performance; (b) pre-validation retrieving performance. The black solid lines are the linear regression results between observed and predicted HVIS. The black dashed lines indicate the diagonal lines. The color of the scatters represents different numbers of data points.
Atmosphere 10 00740 g003
Figure 4. Comparison between the retrieved HVIS (from HVIS deep belief network (HVIS_DBN) model) and observed HVIS (from ground-based stations) in 2017 depicted in Figure 3.
Atmosphere 10 00740 g004
Figure 5. (a) Time series of daily averaged HVIS between ground-based observations (black dots) and retrievals (red dots) over Eastern China during 2017; (b) mean absolute error (MAE) (blue bars) of HVIS between observations and retrievals (shaded areas represent MAE less than 4 km); (c) numbers of valid matchup samples between observed HVIS and moderate-resolution imaging spectroradiometer (MODIS) aerosol optical depth (AOD) (gray bars).
Atmosphere 10 00740 g005
Figure 6. Variations in the averaged root mean square error (RMSE) (between observed and predicted HVIS) with the changes in (a) AOD, (b) albedo (AL), (c) total column water (TCW), (d) longitude, and (e) vertical wind component at 10 m (V10) in the study region during 2017. The grey bars represent the averaged value of RMSE corresponding to different AOD, AL, TCW, longitude, and V10 values; the blue dotted lines represent the sample numbers of different AOD, AL, TCW, longitude, and V10 values; the red lines represent the best linear fitting results for sample numbers higher than 20.
Atmosphere 10 00740 g006aAtmosphere 10 00740 g006b
Figure 7. Top: Observed seasonal ((a) Spring, (b) Summer, (c) Autumn, (d) Winter) and annual mean (e) HVIS of the ground-based stations; bottom: predicted seasonal ((f) Spring, (g) Summer, (h) Autumn, (i) Winter) and annual mean (j) HVIS over Eastern China during 2017. The areas in the black rectangular box represent water bodies.
Atmosphere 10 00740 g007
Figure 8. A retrieval case on 1 November 2017: (a) The spatial variation in MAE between observed HVIS and predicted HVIS (the base image is MODIS true color map composed by one, four, and three bands, and the purple rectangular box represents higher MAE); (b) MODIS AOD image (cloudy area has no AOD data); and (c) retrieved HVIS over Eastern China.
Atmosphere 10 00740 g008