How Much Does Weather Matter? Effects of Rain and Wind on PM Accumulation by Four Species of Australian Native Trees


1
Department of Basic Research in Horticulture, Institute of Horticulture Sciences, Warsaw University of Life Sciences - SGGW, 02-787 Warsaw, Poland
2
School of Earth, Atmospheric and Life Sciences (SEALS), University of Wollongong, Wollongong, NSW 2522, Australia
3
Centre for Sustainable Ecosystem Solutions, University of Wollongong, Wollongong, NSW 2522, Australia
*
Author to whom correspondence should be addressed.
Atmosphere 2019, 10(10), 633; https://doi.org/10.3390/atmos10100633
Submission received: 26 September 2019
/
Revised: 12 October 2019
/
Accepted: 16 October 2019
/
Published: 21 October 2019
(This article belongs to the Special Issue Air Quality in New South Wales, Australia)
Abstract
:As interest in improving urban air quality grows, phytoremediation—amelioration through plants—is an increasingly popular method of targeting particulate matter (PM), one of the most harmful pollutants. Decades of research has proven that plants effectively capture PM from air; however, more information is needed on the dynamics of PM accumulation. Our study evaluated the effects of meteorological conditions on the dynamics of PM deposition, wash off and resuspension using four Australian tree species growing under natural conditions near a busy highway. Accumulation of PM on foliage was analyzed over the short term (daily changes) and over a longer time period (weekly changes). The results obtained were correlated with ambient concentrations of PM2.5 and PM10, rain intensity and wind strength. The highest accumulation of PM was recorded for Eucalyptus ovata (100.2 µg cm−2), which also had the thickest wax layer while the lowest was for Brachychiton acerifolius (77.9 µg cm−2). PM accumulation was highly changeable, with up to 35% different PM loads on the foliage from one day to the next. Importantly these dynamics are hidden in weekly measurements. Changes in PM deposition on the leaves was mostly affected by rain and to a lesser extent by wind, but the extent of the effect was species specific. The large PM fraction (10–100 µm) was the first to be removed from leaves, while the smallest PM fraction (0.2–2.5 µm) was retained for longer. Precipitation affects also PM retained in waxes, which until now were believed to be not affected by rain. This work demonstrates important interactions between PM load and weather, as well as adding to the small inventory of Australian native tree PM accumulation data.
1. Introduction
With 68% of the world’s population predicted to live in urban areas by 2050, city planners worldwide are increasingly concerned about the declining air quality that comes with such increased population density. Among mechanisms used to improve air quality is phytoremediation: using various characteristics of living plants to reduce ambient pollutant concentrations. One of the most important targets of these phytoremediation efforts is particulate matter (PM) [1].
These microscopic pollutants consist of particles with diameters between 0.001 and 100 μm in a heterogeneous solid-liquid mixture [2]. Depending on size, PM can be suspended in the air for weeks [3] and travel great distances, as illustrated by the discovery in 2006 that 11% of black carbon found in the western United States was produced in China [4]. In terms of source, we distinguish between PM of natural origin such as forest fires, volcanic activity or dust storms and anthropogenic causes such as incomplete combustion of fuels in car engines, abrasion of roads and tyres, and industrial or construction activities [5,6,7]. Chemically, PM may be composed of several trace metals, black carbon, dibenzofurans, polychlorinated biphenyls (PCBs) and polycyclic aromatic hydrocarbons [8,9]. Chronic exposure to PM is the cause of numerous health problems including cardiopulmonary diseases and lung cancer [10,11] and is responsible for around 2.1 million premature deaths annually over the world [12].
Urban plantings such as trees and shrubs with dense twigs and leaves can effectively capture PM from ambient air [13,14] or be a physical barrier preventing its spread [15,16]. It was estimated that deciduous trees and shrubs forming street canyons can reduce PM concentration in the air by as much as 60% [17]. However, species differ in their ability to accumulate PM [14,18,19]. Plants with rough leaf surfaces are more effective in capturing PM than those with smooth leaves [20]. Accumulation of PM on the leaves can be also increased by leaf surface structures such as hairs and a wax layer [21,22,23]. While it is well established that species may vary in their entrapment efficiency, only a handful of species have been tested, and many of these are in selected countries and regions only. For instance, in Australia, only 16 species, all found in the Greater Sydney Region, have been investigated for PM capture [24].
Another area ripe for investigation is the variation of PM accumulation over time. Most studies, for instance, Sæbø et al. (2012) [25], Popek et al. (2013) [26], and Xu et al. (2018) [27], demonstrate the ability of trees and shrubs to accumulate PM by measuring PM deposition at a given time, usually at the end of the growing season. However, PM deposition, its runoff and resuspension from foliage is a complicated and dynamic process, greatly affected by weather conditions, especially precipitation and wind [28]. How much PM is lost from foliage depends on rain intensity and duration, wind speed and direction and other meteorological factors, as well as season and plant species, PM concentration in the air and type of PM [28,29,30,31,32]. The overall effect of weather depends on intensity: heavy rain and strong wind may remove PM from leaf surfaces, while lighter rain and weaker wind may increase PM load on vegetation. This is because leaves can become more sticky, and more likely to trap PM on first wetting, but heavy rain will effectively wash a leaf and clean off PM [33,34,35]. Schaubroeck et al. (2014) [35] used a model to demonstrate that a Scots pine (Pinus sylvestris L.) stand accumulated 31.43 kg ha−1 year−1 PM2.5 via dry deposition, of which 23.93 kg was resuspended, 7.38 kg was considered as definitely removed by dripping off the canopy to the forest floor and only 0.11 kg remained in the tree canopy at the end of the year. Removal of PM from foliage surface by rain and wind is however not necessarily an undesirable phenomenon because leaf surfaces may become saturated with PM over time and their phytoremediation capacity would thus be greatly reduced [36].
Precipitation and wind not only impact deposition of PM, but also the concentration of PM in the air [20,37]. Greater wind speed creates turbulence, resulting in dispersion of PM in the air [38], while wind direction affects the spatial distribution of PM and the direction it is transported [28]. Precipitation is one of the primary natural processes reducing PM in the ambient air [39]; its scavenging effects result from wet deposition onto surfaces such as foliage and wet removal from the air [40]. Zhang et al. (2018) [28], showed that exactly how wind and precipitation impact PM concentration depends on PM size. Fine PM (0.2−2.5 µm) decreased gradually with increasing wind speed, while coarse PM (2.5−10 µm) increased in concentration due to resuspension in strong wind. The purifying efficiency of precipitation on coarse PM was over twice that of fine PM. It is also important to note that other meteorological conditions will affect PM concentration in the air, and these include air temperature, humidity and vertical inversions in the lower troposphere [41].
While it is appreciated that PM deposits change in concentration due to runoff and resuspension, most investigations into the effects of rain and wind have been carried out in controlled environments, rather than in the field. So although this is a growing field of research, knowledge about the dynamics and life cycle of PM remains scattered and incomplete.
This work aims to evaluate the effect of meteorological conditions (precipitation, wind, concentration of PM in ambient air) on the dynamics of PM deposition on four Australian woody species over long and short time periods under natural conditions. We tested the following hypotheses: (i) Under natural conditions, the amount of PM deposited on foliage changes significantly over short time periods (one day) compared to over longer periods (one week), (ii) atmospheric conditions (rain and wind) affect the amount of PM on the leaf surface, and (iii) PM capture varies across the four plant species.
2. Methods
2.1. Study Area and Plant Material
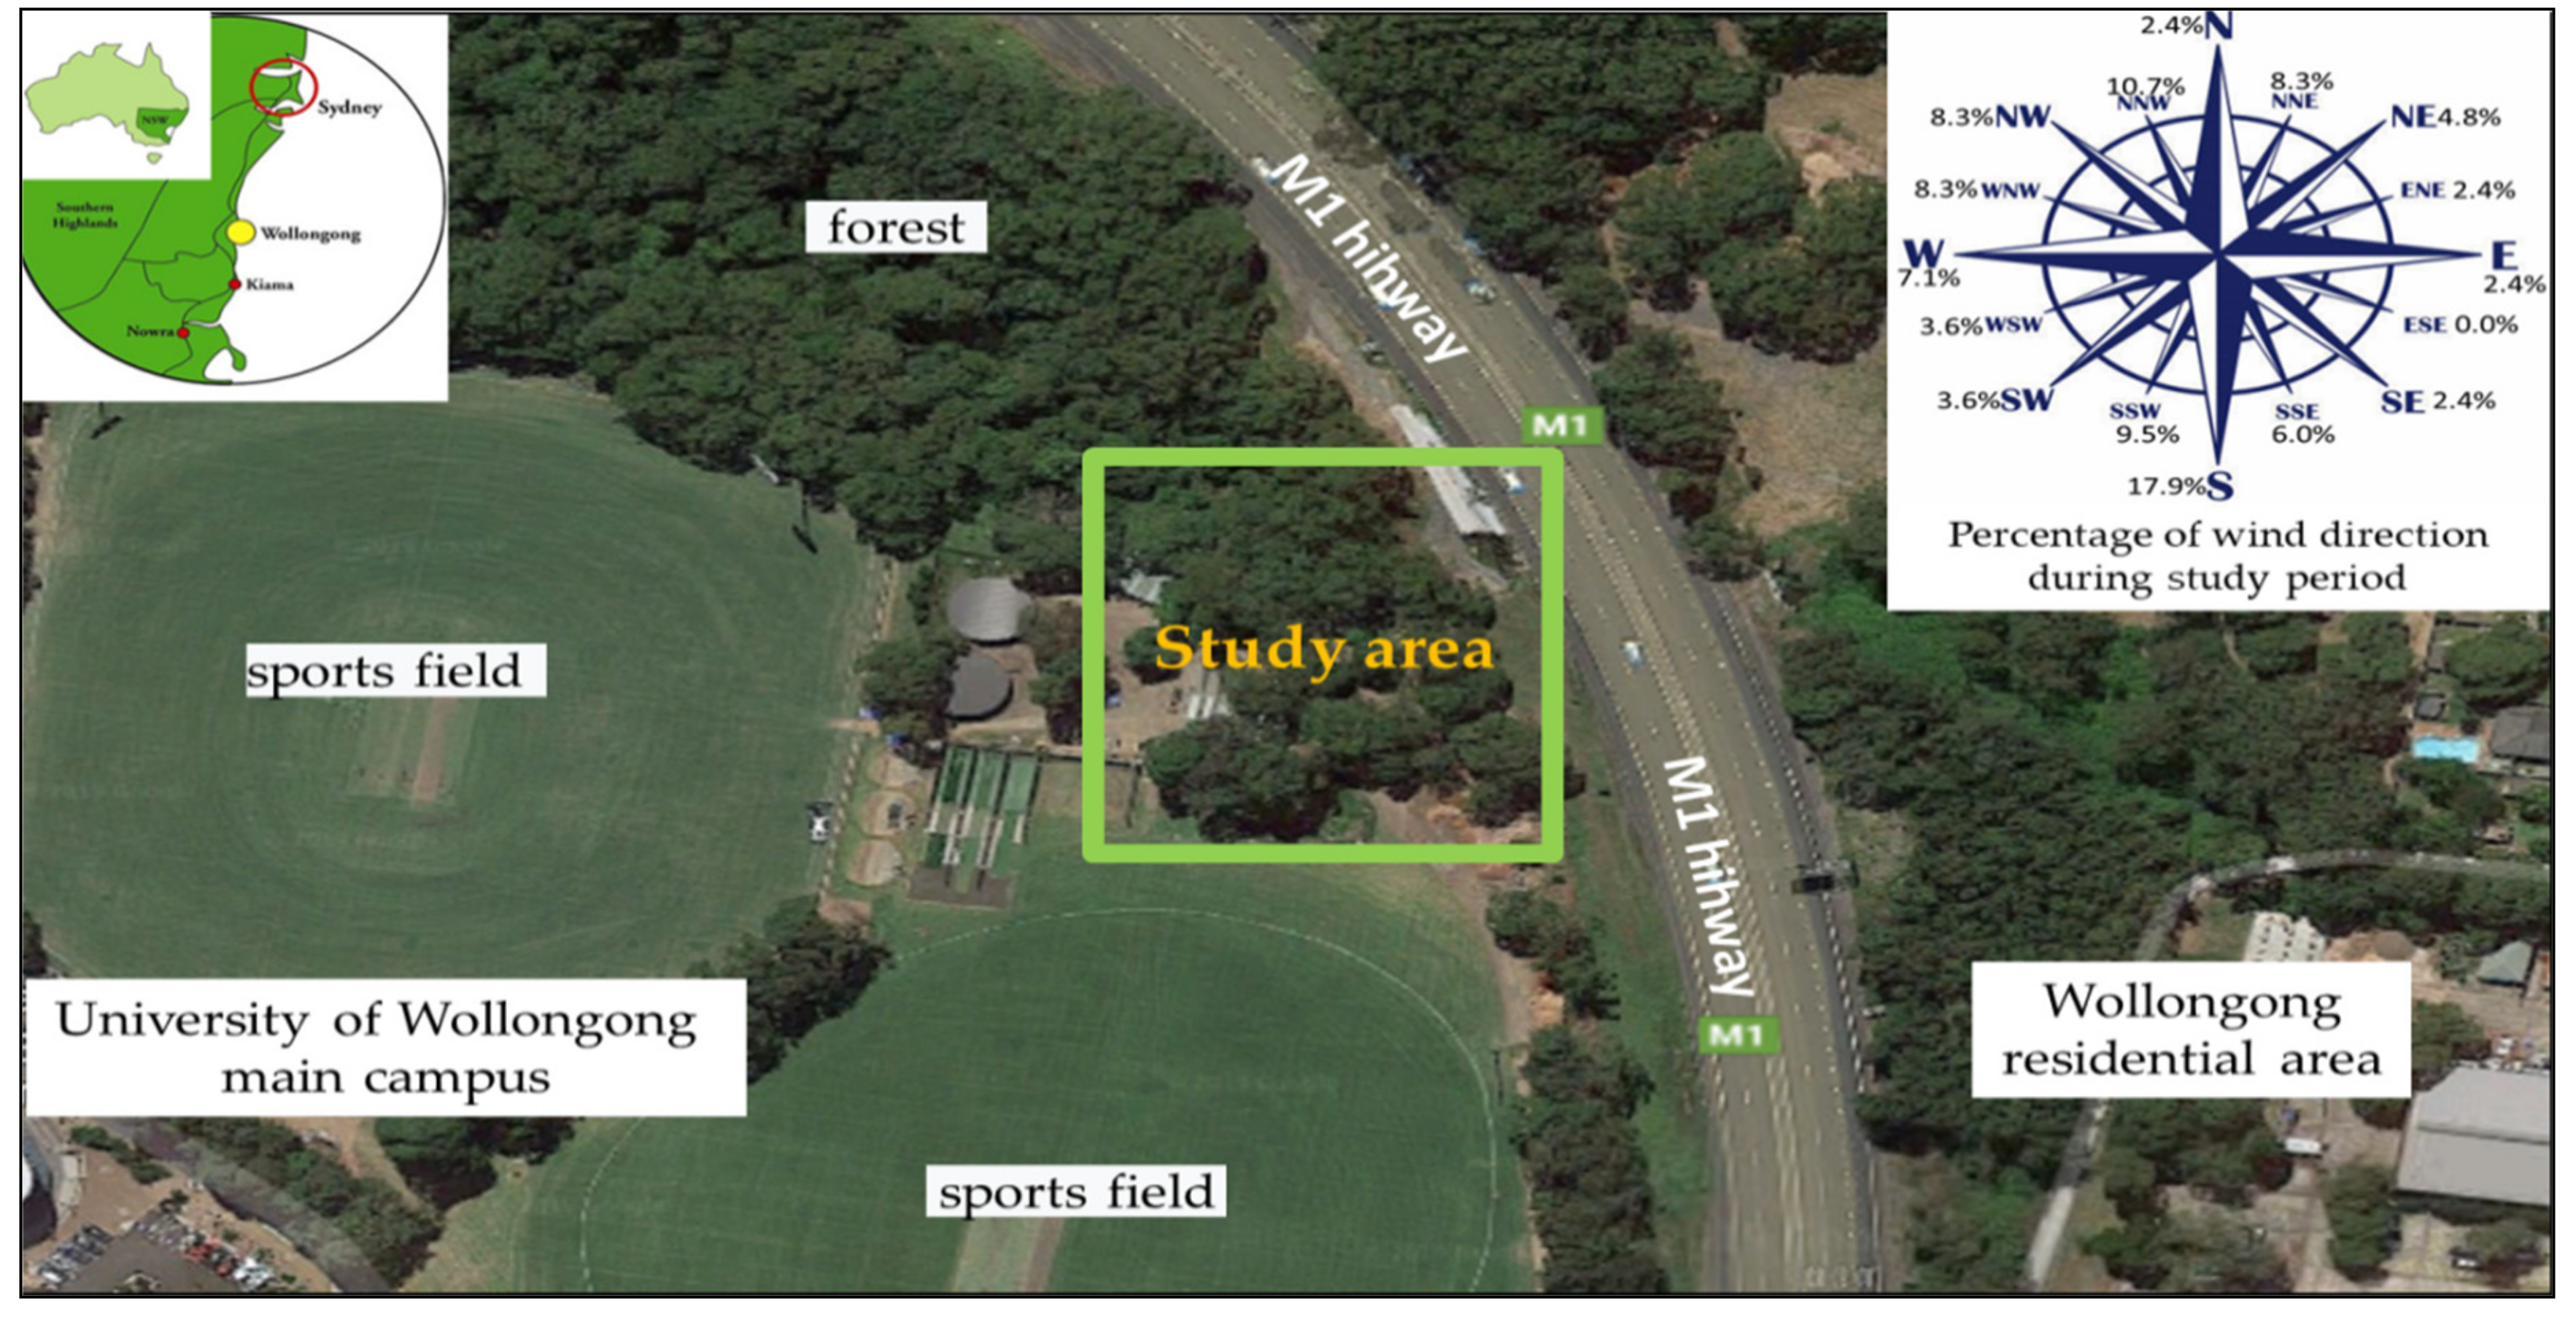
The study took place in April–May 2018 at the University of Wollongong’s main campus on the south east coast of Australia (Figure 1).
Wollongong is the third largest city in New South Wales. According to the World Health Organization, its annual average PM10 concentration is 17 µg m−3 while PM2.5 is 7 µg m−3, positioning Wollongong among medium polluted Australian cities, but among the least polluted cities when compared to Asia and Europe (data from 2016) [43]. The study site was located in the north-west of the campus, 50 m from the M1 highway (Princes Motorway). According to a station three km to the north, traffic volume in 2018 was 53,083 cars per day (54,553 on weekdays and 48,832 at weekends) [44]. In our study, the M1 highway was considered to be the major source of pollution, because 71.4% of time the wind was blowing from the direction of the highway. Selected plants were located in the lower part of a forest remnant. On the west side of study area were warehouses and two sport fields, while the nearest university buildings were about 400 m away. On the other side of the highway were residential buildings. The plants selected for this study were four Australian native woody species common to NSW. The Illawarra Flame Tree (Brachychiton acerifolius [A. Cunn. ex G. Don] Macarthur) has large, 3-5-lobed leaves which are 15 cm long and 12 cm wide. The Swamp Gum (Eucalyptus ovata Labill.) has rounded leaves, 19 × 8.5 cm. The Large Mock-olive (Notelaea longifolia Vent.) has narrow lanceolate leaves (16 × 6 cm) and Sweet Pittosporum (Pittosporum undulatum Vent.) has smooth and glossy leaves (15 × 5 cm) with wavy margins. The leaves of all selected species were hairless with non-serrated edges. All plants had been growing in vivo in the selected location and were approximately the same age (about 30 years old) and size., except for E. ovata, which was about five years old. All trees used were in good condition, i.e., healthy and free from pests.
2.2. Sample Collection
For the experiment, three samples of leaves of each species were harvested every week from 12 April 2018 to 10 May 2018 (five weeks) and daily from 27 April 2018 to 3 May 2018 (seven days) at 12 pm. Samples were harvested from the side of the tree that faced the road, at a height of 1.0 to 1.8 m above the ground, which corresponds to the height at which most air is inhaled by humans, and stored in paper bags at ambient temperature until analysis. Each sample consisted of three to seven leaves, depending on size, (for weeks n = 4 plant species × 3 samples × 5 weeks; for days n = 4 plant species × 3 samples × 7 days). Leaves were harvested at the same time of the day, regardless of weather conditions.
2.3. Quantitative Analysis of PM and Leaf Waxes
We followed a standard protocol for PM isolation by filtration [18]. For each sample, PM of three size fractions and two categories were determined. Each leaf sample was washed with water to obtain surface PM (SPM), which in natural conditions can be washed off by rain. Next, samples were washed with chloroform to obtain the PM contained in the epicuticular waxes (WPM). Both liquids were then passed through a 100 µm mesh sieve, before being filtered through membrane filters (Whatman, UK) with three pore sizes 10, 2.5 and 0.2 µm, respectively. This yielded three size fractions of PM: large (10−100 µm), coarse (2.5−10 µm) and fine (0.2−2.5 µm). The quantity of waxes was weighed after the evaporation of chloroform and collected (after filtration) in pre-weighed beakers. The area of the leaves in samples was measured with a LI-3000C Portable Area Meter (Lincoln, NE, USA). Finally, PM amounts and waxes were calculated to µg·cm−2 of leaf area.
2.4. Measurement of PM Concentration in Air and Ambient Weather Conditions
Measurements of ambient PM10 and PM2.5 concentrations were made using a TSI DustTrak DRX 8533 particulate monitor (Keison Products, UK). The measurements were made at three-minute intervals over one month. The instrument was placed 1.2 m above the ground, 50 m from the road, near the trees from which leaves were collected. Rainfall, wind speed and direction statistics were obtained from the nearest Bureau of Meteorology station [45], situated 10 m above sea level, in Bellambi about 4 km from the study area.
2.5. Statistical Analysis
One and two-way Analysis of Variance (ANOVA) with random effects were used to compare measurements of particulate matter (total PM, SPM, WPM in three size fractions as well as amount of waxes). Non-parametric Spearman’s correlation coefficients were calculated between the amounts of different types of PM on leaves, in the air and also weather conditions. Tukey’s honest significance (HSD) test (P = 0.05) was employed to assess the significance of differences among variants. The data are given as means with standard errors of the mean (± SE). Statistical analyses were conducted in JMP 13.0 Pro (SAS Institute Inc., Cary, NC, USA).
3. Results
3.1. Particulate Matter Accumulation
3.1.1. General PM Accumulation and Amount of Waxes
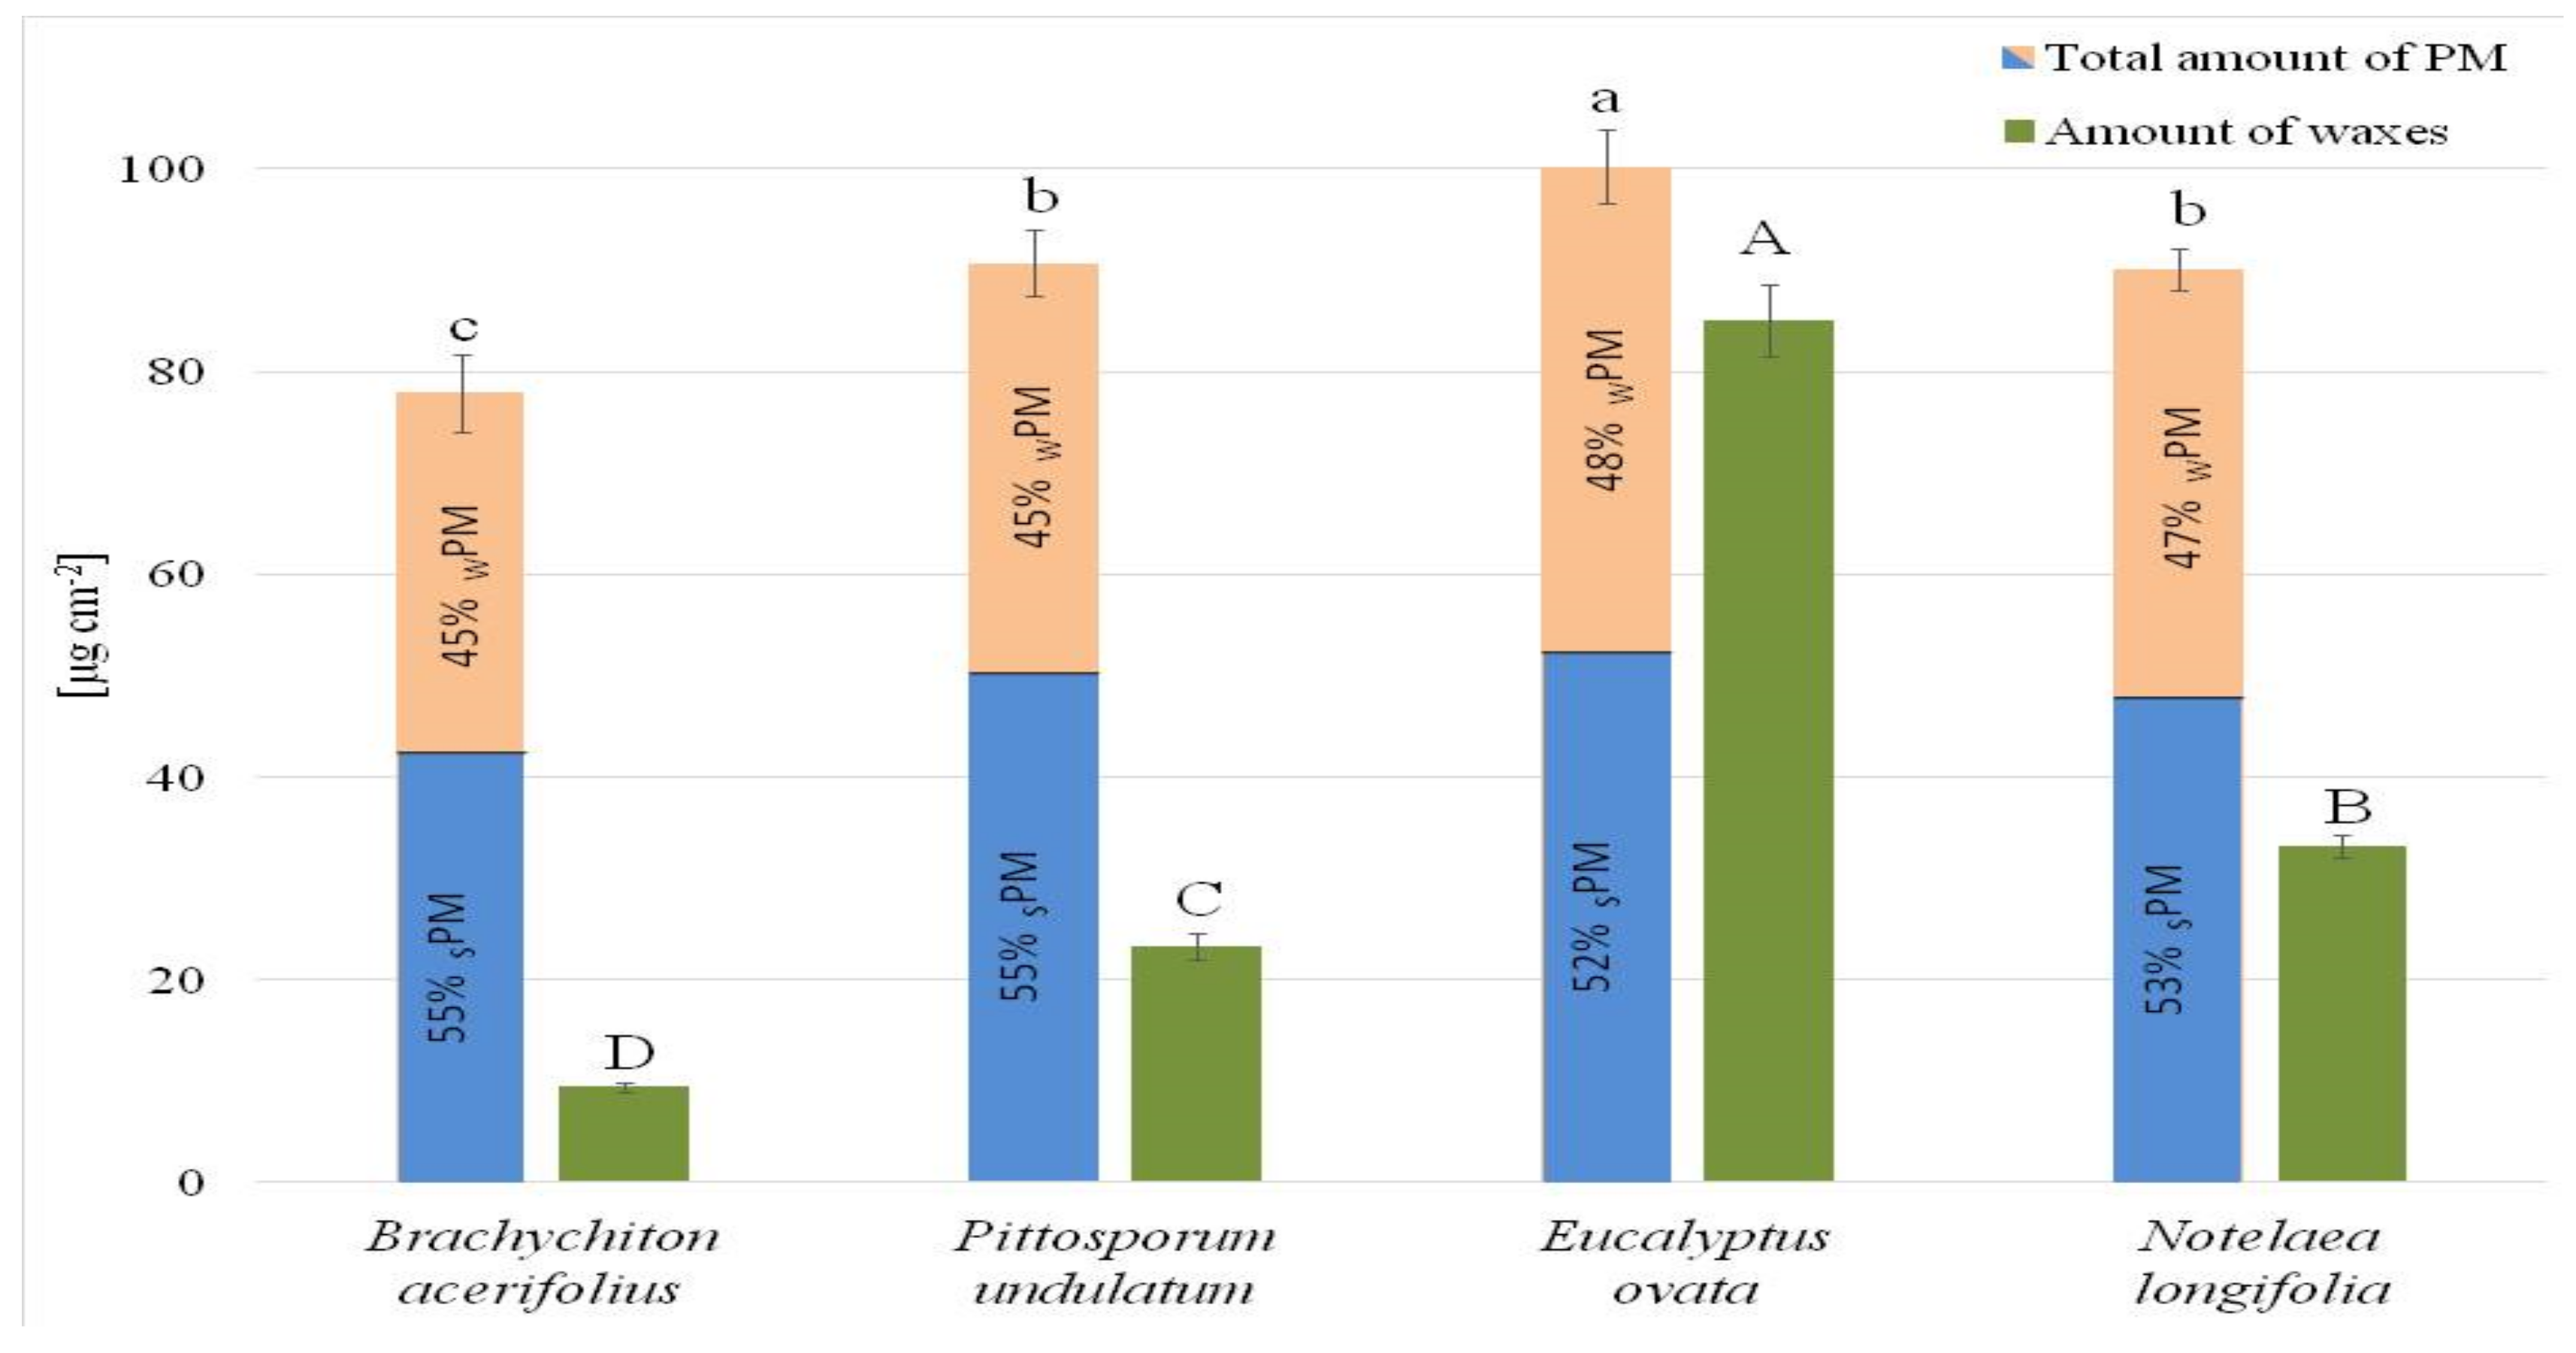
All species examined have the ability to accumulate PM on the leaf surface (Figure 2). On average, the highest amount of PM was accumulated by E. ovata. The amount of PM on the foliage of E. ovata exceeded by 10%, 15% and 20% PM accumulation on P. undulatum, N. longifolia and B. acerifolius respectively. All tested species accumulated most PM as SPM (Figure 2), the percentage of sPM was 55% in B. acerifolius and P. undulatum, while in N. longifolia it was 53% and, at 52%, slightly lower in E. ovata. The tree species examined also differed in the amount of waxes on the leaf surfaces (Figure 2). The heaviest wax layer was found on the leaves of E. ovata, it was higher by 88%, 73% and 59% than on leaves of B. acerifolius, P. undulatum and N. longifolia respectively.
3.1.2. Accumulation of Different PM Fractions during the Sampling Period
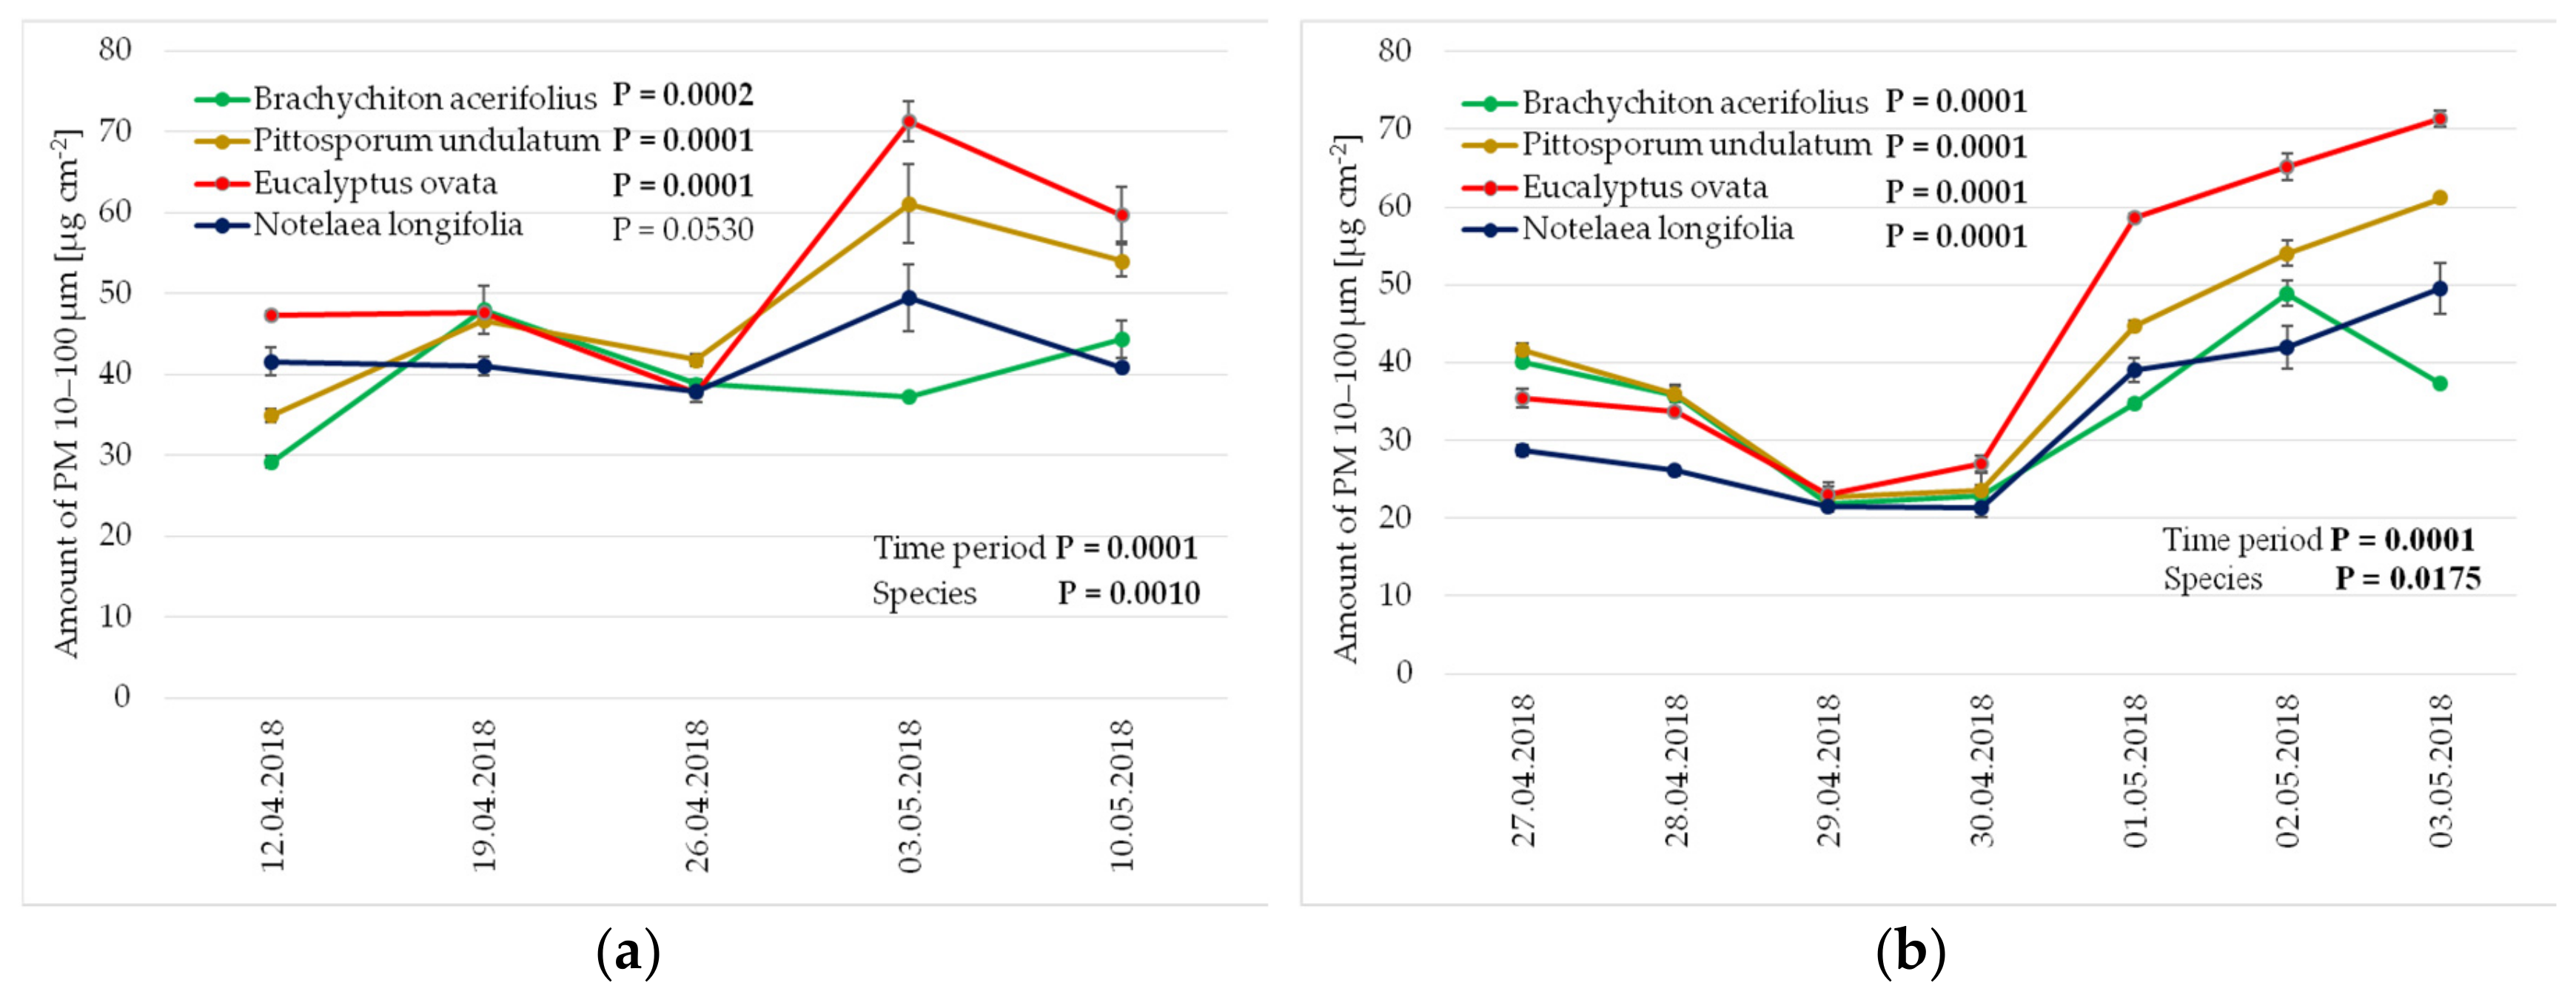
The amounts of all size fractions deposited on plant foliage changed significantly over the short term (days) for all species except for fine PM fraction on E. ovata leaves. Only large- and coarse-sized PM varied significantly in leaf deposition over the long term (weeks, Figure 3, Figure 4 and Figure 5). For large PM size, P. undulatum, B. acerifolius, and E. ovata all varied over the five weeks (Figure 3b), while for coarse PM, only P. undulatum and B. acerifolius varied significantly (Figure 4b).
Two clear peaks, when the level of large PM increased considerably compared to previous weeks, were recorded on 19 April 2018 (increases of 39%, 25% and 2% compared to the previous week in B. acerifolius, P. undulatum and E. ovata respectively) and on 3 May 2018 (an increase of 48% and 32% compared to the previous week in E. ovata and P. undulatum respectively). These two peaks were followed by decreases in large PM loads on the foliage in most species (Figure 3a). A seven-day intensive period of daily monitoring of large PM deposition on foliage, within the five-week period, revealed finer detail of the significant differences in accumulation of PM fraction 10–100 µm during the second increase in PM described above (Figure 3b). These revealed a similar higher content of large PM in different leaf samples over the weekly interval (more large PM on 3 May 2018 than 26/27 April 2018), but also showed a gradual decrease (43% on average) in large PM for the first three days after 27 April 2018 followed by a rapid increase between 30 April 2018 and 3 May 2018 (Figure 3b).
Coarse PM amounts on B. acerifolius and P. undulatum leaves reached a maximum between 19 April 2018 and 26 April 2018 (a 48% and 37% increase over the previous week in B. acerifolius and P. undulatum respectively), and then dropped in both species in the following weeks (Figure 4a). During the seven-day period, significant changes in the amounts of coarse PM were recorded in all species (Figure 4b). As in the case of weekly measurements, when measured daily, amounts of PM 2.5–10 µm deposited on foliage on 26/27 April 2018 and 3 May 2018 were similar, just slightly higher on the last date. Daily measurements, however, showed a significant decrease in coarse PM on foliage of all species between 28 April 2018 and 29 April 2018 (decreases between 35% and 49%, P. undulatum and B. acerifolius, respectively), with the load increasing from 1 May, reaching a peak on 2 May 2018 (Figure 4b).
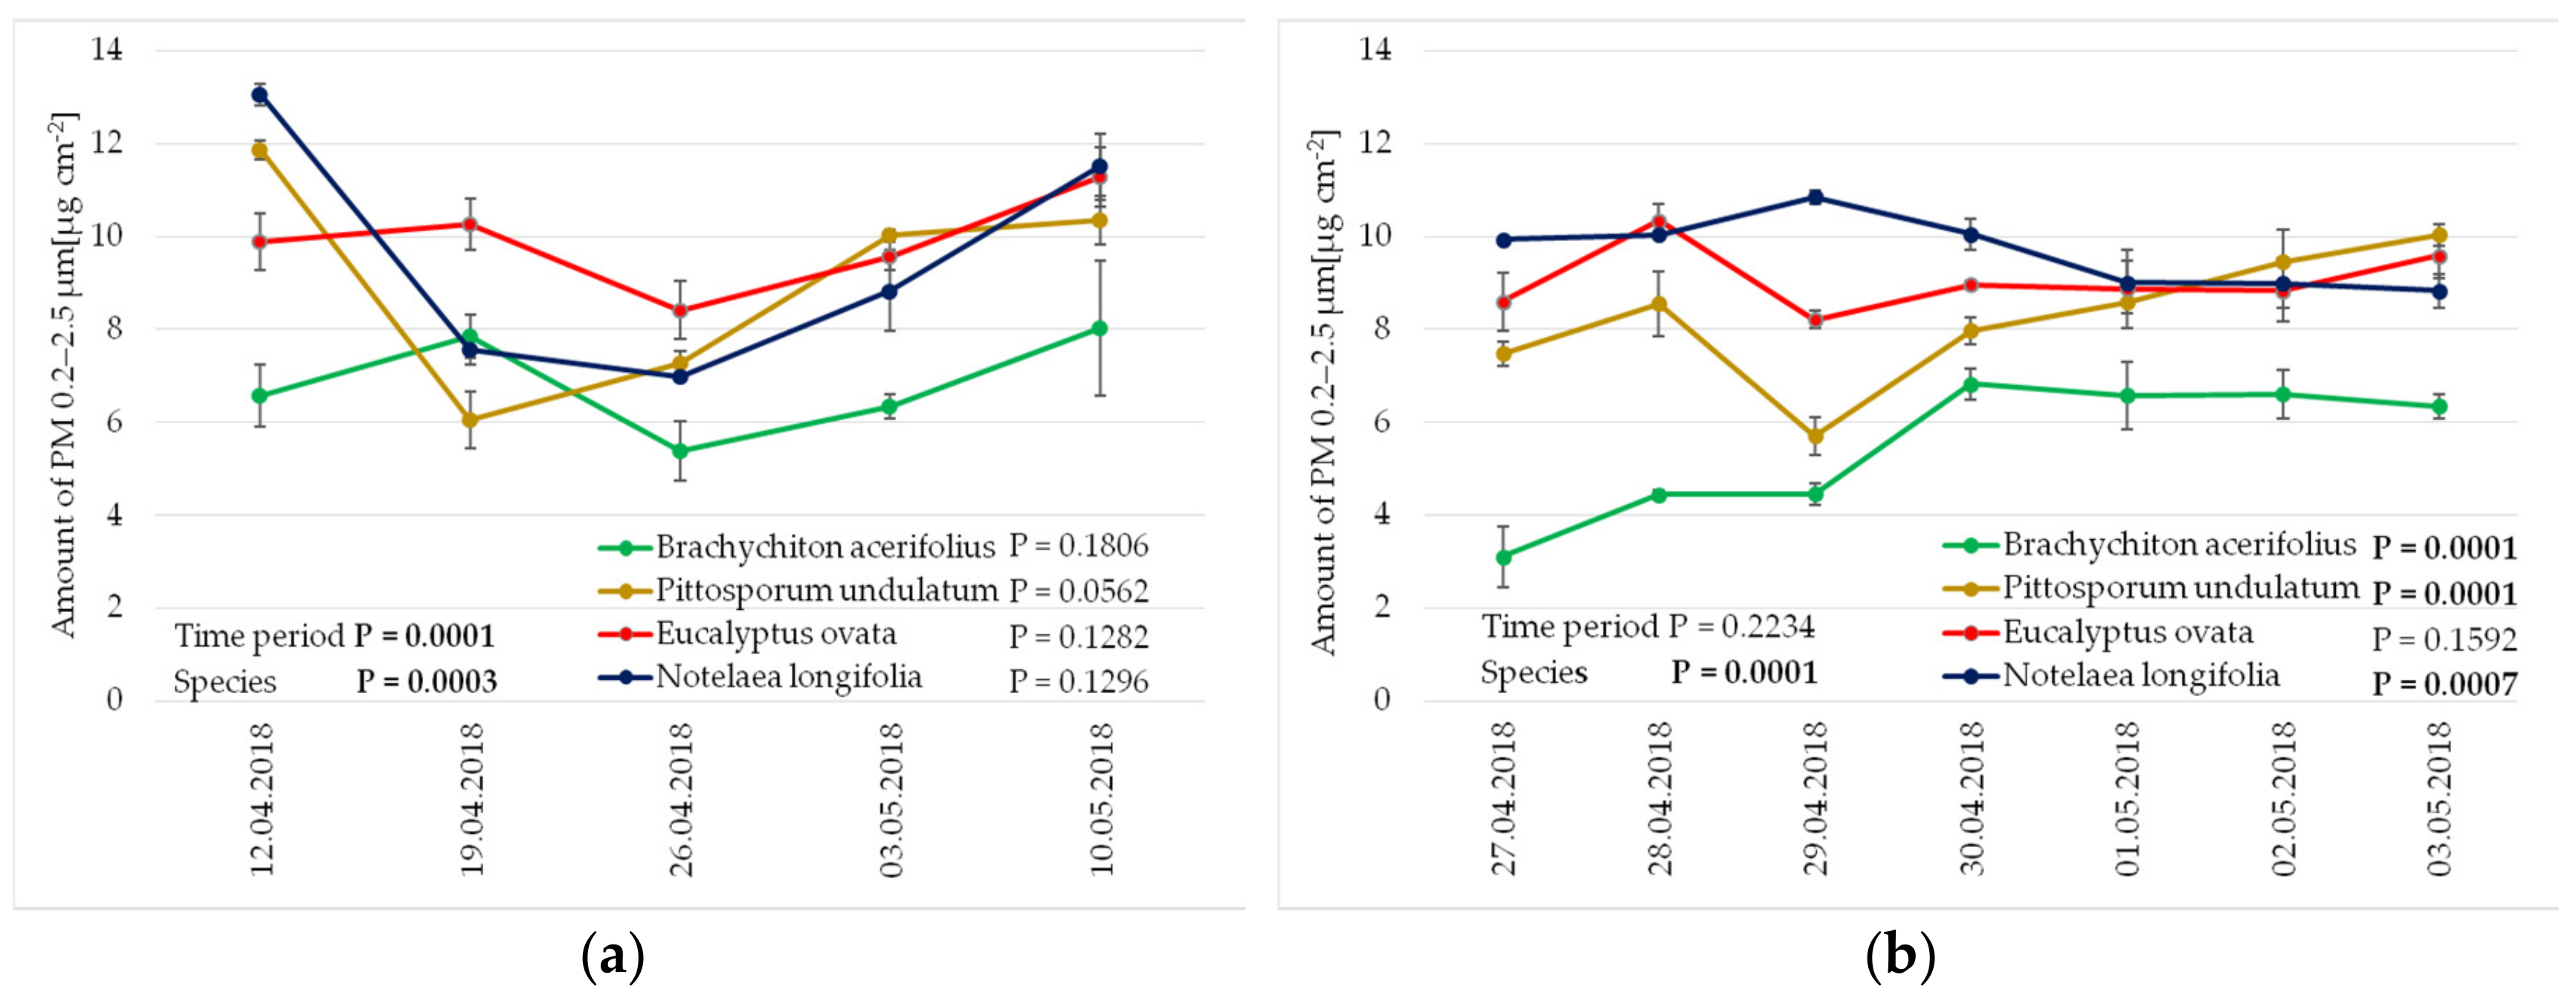
Accumulation of fine PM (0.2–2.5 µm) did not differ significantly between species during weekly measurements (Figure 5a). Daily measurements only showed a decrease in PM deposition on P. undulatum (33%), followed by an increase, a gradual increase up to 30 April for B. acerifolius, a slight increase in N. longifolia (8%) on 29 April 2018 (Figure 5b) and no change for E. ovata.
3.1.3. Accumulation of SPM and WPM during Time Period
The amounts of SPM and WPM, measured both weekly and daily (Figure 6a–d), followed similar trends as recorded for large PM (Figure 3).
Accumulation of sPM and WPM measured in weekly intervals on leaves of E. ovata and P. undulatum peaked twice (on 19 April 2018 and 3 May 2018), and in both cases this was followed by decreased PM load (Figure 6a,c). In the case of N. longifolia and B. acerifolius recorded changes in foliar PM deposition were less clear and not always significant (Figure 6a,c). Amounts of sPM and WPM obtained 26/27 April 2018 and 3 May 2018 were similar regardless of whether the measurements were made on a weekly or daily basis. Trends recorded during measurements taken in the seven day period were the same for all species (Figure 6b,d). During the first three days of measurements, SPM and WPM gradually decreased and reached the lowest accumulation on 29/30 April 2018. Subsequently SPM and WPM increased until a peak on 2/3 May 2018. The average difference between lowest and highest measurements of SPM and WPM was 53% and 43% for B. acerifolius; 51% and 50% for P. undulatum; 62% and 51% for E. ovata; 51 and 27% for N. longifolia (Figure 6b,d).
3.2. Amount of PM in Air and Weather Conditions during the Study Period
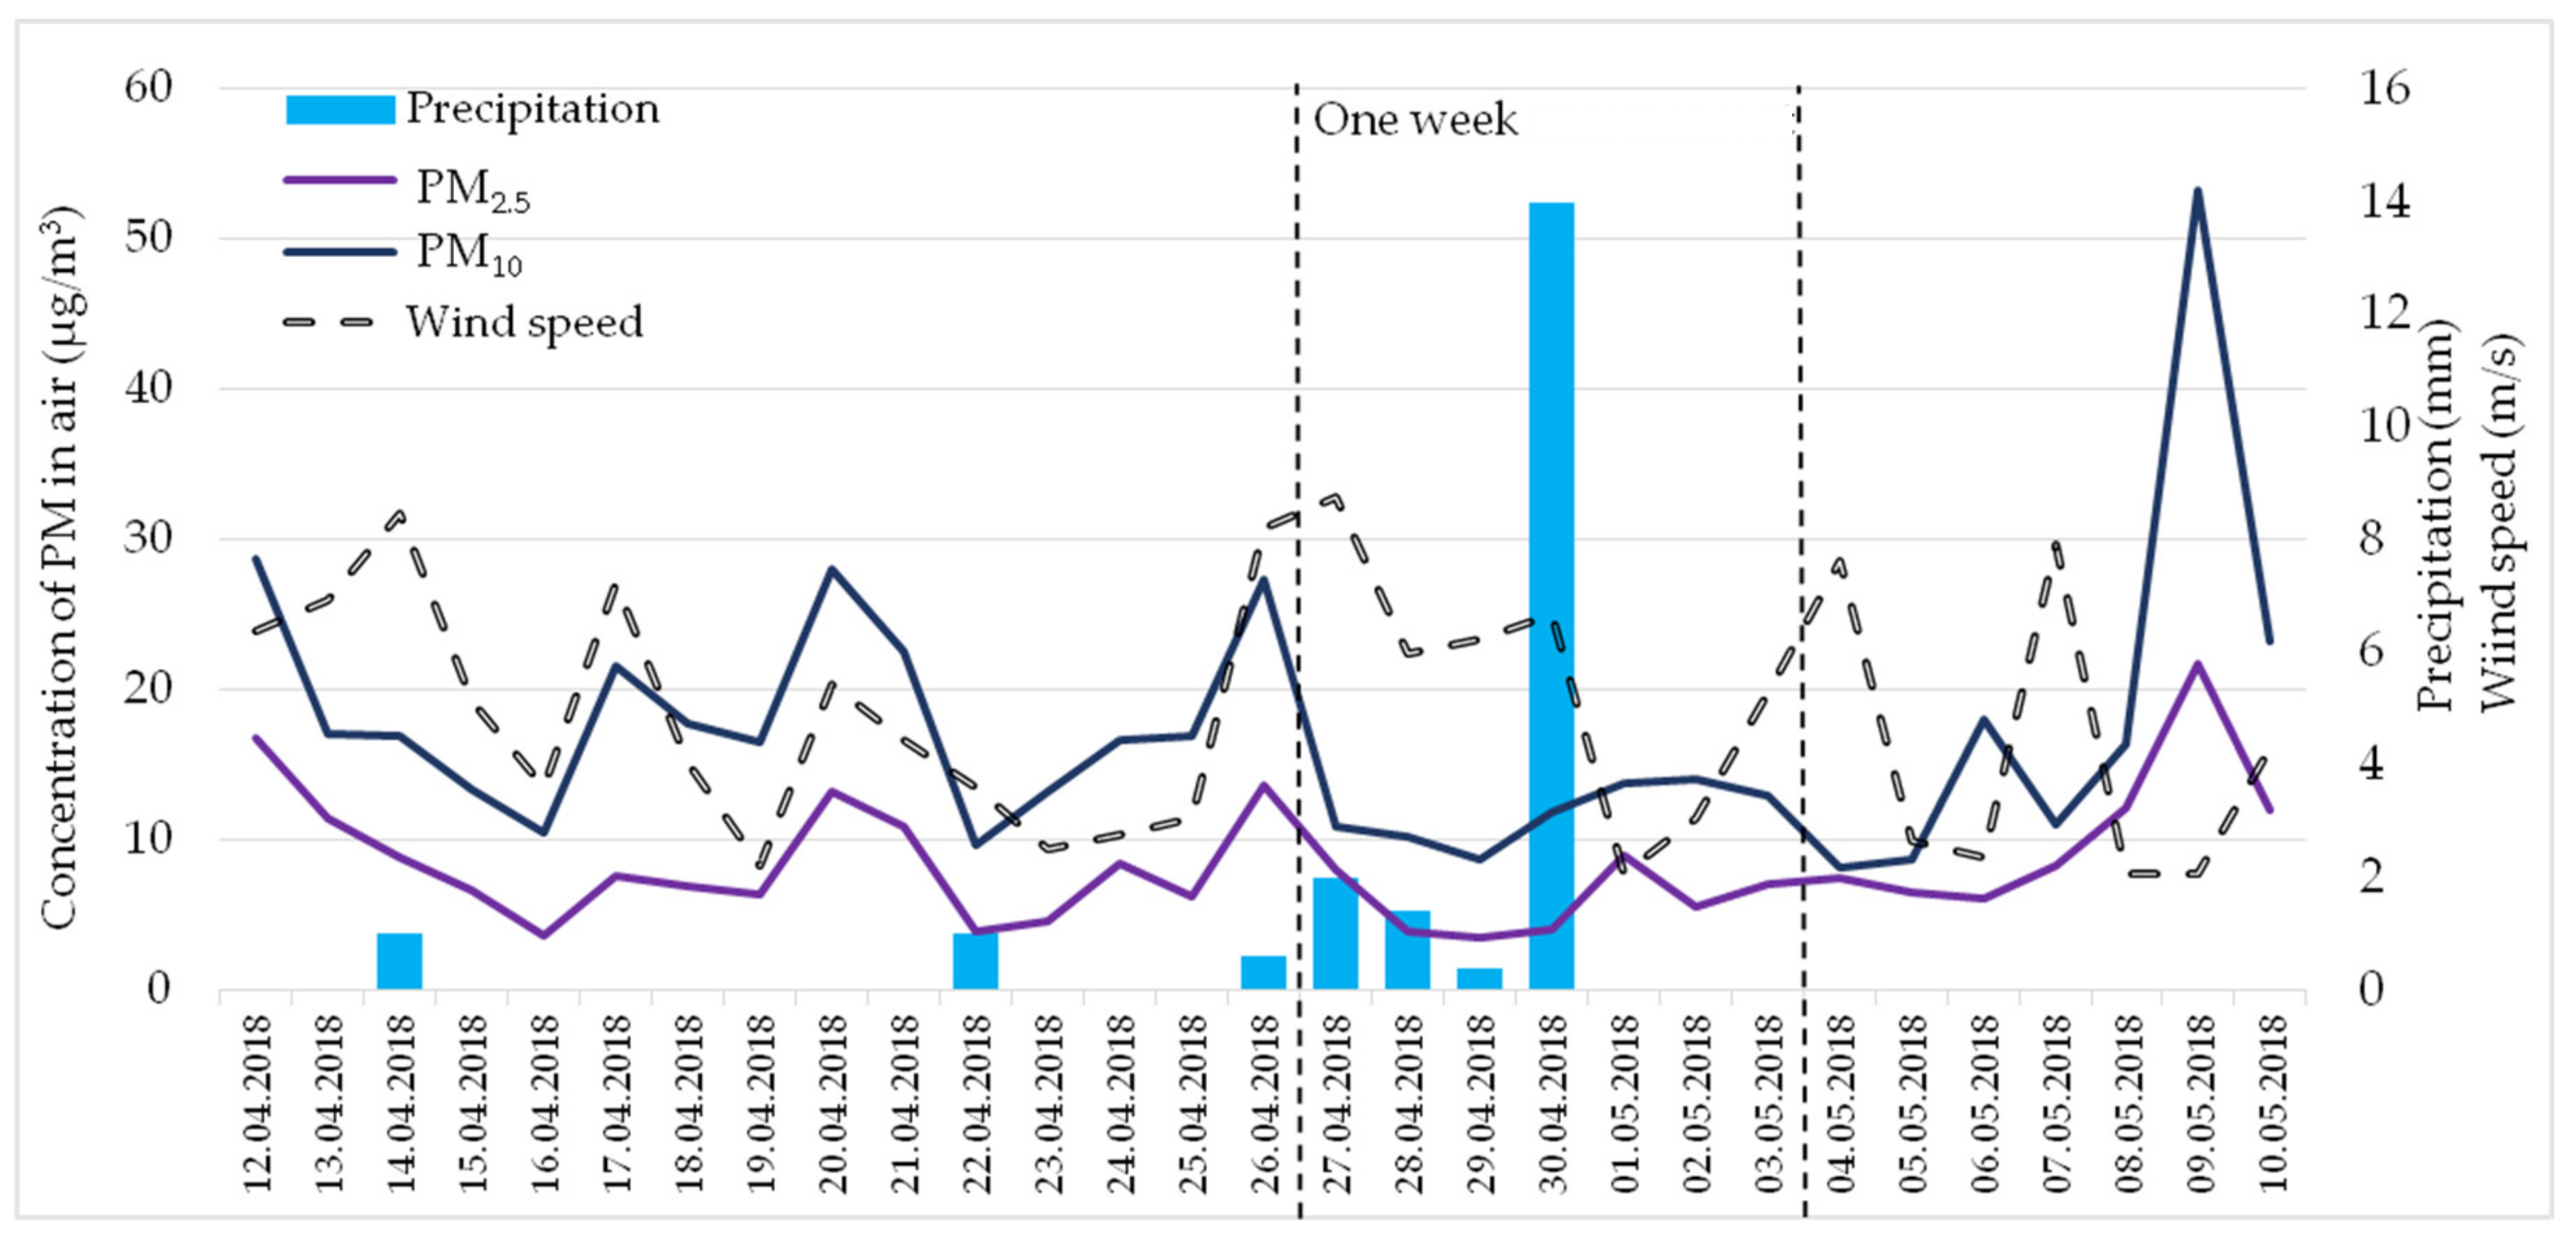
Monitoring of air pollution on location showed a highly variable concentration of PM10 and PM2.5 during the study period (Figure 7).
The air concentrations of PM10 (from 8.2 µg m−3 to 53.2 µg m−3) were always higher than those of PM2.5 (3.5 µg m−3 to 21.8 µg m−3), but both were affected by the level of precipitation and, to some degree, by wind speed. During rainy periods, the concentration of both PM fractions tended to decrease (e.g., 21–22 April; 26–30 April) followed by their gradual increase. Wind strength was not consistently related to PM concentrations. During periods of low rain and wind the air level of PM10 and PM2.5 increased (e.g., 17–20 April; 23rd–26 April; 5–9 May). The highest concentrations of PM10 and PM2.5 were recorded on 9 May, after a week without rain and after a few days with low wind speeds (Figure 7).
3.3. Correlation Analysis
Air concentrations of PM10 and PM2.5 were significantly positively correlated with all PM size fractions (10–100, 2.5–10 and 0.2–2.5) and categories (sPM and WPM), with only three exceptions recorded for fine PM (B. acerifolius for both PM10 and PM2.5, and N. longifolia for PM2.5). With only one exception P. unudulatum and PM10, correlations obtained for WPM were higher than SPM (Table 1). Correlation analysis also revealed that the accumulation of large PM (10–100 µm), SPM and WPM was significantly negatively correlated with amounts of rainfall in all examined species, with coarse PM (2.5–10 µm) in P. undulatum and N. longifolia also significantly negatively correlated with rainfall amount, but there were no correlations with precipitation for fine PM (0.2–2.5 µm) (Table 1).
Wind speed was also significantly negatively correlated with accumulation of large PM in P. undulatum, E. ovata and N. longifolia, with coarse PM for E. ovata and N. longifolia, with fine PM (P.undulatum), SPM (P. undulatum, E. ovata and N. longifolia) and WPM in E. ovata and N. longifolia.
4. Discussion
Native trees can perform a valuable service by reducing PM concentration in roadside air, but as our work shows, their interaction with PM is highly dynamic, altering in large amounts from day to day due to weather conditions such as rain and wind. Additionally, we confirm that not only does PM capture vary across species, but also the dynamics of deposition and wash off also vary and should be taken into consideration when choosing species for urban plantings. In this work, deposition of PM on leaves of four Australian native tree species was positively correlated with ambient air concentrations of PM2.5 and PM10, proving that plants remove PM pollution from the air. Regardless of the species, PM accumulated on the foliage in three size fractions (0.2–2.5, 2.5–10, 10–100 µm) and two categories (water-washable (SPM) and wax-embedded (WPM)). Significantly, the highest accumulation of total PM (0.2–100 µm) and simultaneously the greatest wax layer (WPM) were recorded for E. ovata, while the lowest, by one-fifth of total PM and an eighth of wax was B. acerifolius. These findings are in line with numerous other studies that demonstrate high positive correlation between PM accumulation and amount of wax on foliage [15,25]. However, in another Australian study, Leonard et al. (2016) [24], found that a Eucalyptus species (unidentified) was in the bottom two of 16 tree and shrub species in terms of total amount of PM accumulated on leaves. The high PM accumulation by E. ovata might be explained by the presence of oil glands on the leaf surfaces, supporting the hypothesis that leaf shape and morphological structures i.e., greater amounts of pubescence and rougher surfaces increase PM deposition on the foliage [16,20,23,25,46]. However, there is clearly much more work to do, and trait combinations may be more important than single characteristics such as oil glands or leaf hairs [24]. In contrast, Weerakkody et al. (2018) [47], found no correlation between PM accumulation and leaf surface characteristics. They concluded that PM load on foliage depends largely on individual leaf size irrespective of micro-morphology, but this may have been due to the particular leaf surface features of the species they studied. Many studies have shown that PM entrapment is greater in species with more leaf waxes, but in the current study P. undulatum and N. longifolia accumulated only slightly less PM than E. ovata, despite a much lighter wax layer. This contrasting pattern suggests that not only total wax content, but also its composition or structure, may be important. In the case of P. undulatum, high PM deposition may result from its leaf structure (wrinkled and folded inwards, resembling a small basin and therefore acting as a natural trap for PM). Similar leaf characteristics were previously noted in Syringa meyeri ‘Palibin’ C.K. Schneid., which also has curled edges and accumulates high quantities of PM [26]. B. acerifolius accumulated the least PM and also had least waxes. However, this species should be considered for air phytoremediation, because unlike most other trees grown in Australia, it sheds leaves in autumn. These leaves can be collected, or decay on the ground and PM can be permanently removed from the atmosphere.
Foliar PM accumulation did not appear to increase uniformly between rain or wind events. One reason for this may be that after a certain number of days or weeks without precipitation, leaves reach their maximum PM loading capacities [19]. The amount of PM on leaves at a given time is therefore the net result of its accumulation from the atmosphere, less runoff and/or resuspension [27], and is also a function of recent rain intensity and duration, wind speed and direction, leaf characteristics and PM concentration in the air [29,30,31,32,34]. In this study, the amount of PM on foliage of B. acerifolius, P. undulatum, E. ovata and N. Longifolia was analyzed over a long time period (when measurements were made weekly) and a short time period (when measurements were made daily). PM load on leaves of all tested species changed very dynamically, regardless of the frequency of measurements. The relatively big daily differences in PM deposition on foliage (33–35%) were particularly interesting and to some extent surprising. This is a new finding and demonstrates that the assessment of species’ potential for PM accumulation based on a single measurement (usually at the end of growing season) could be misleading. This is even more likely when plants are growing in different locations and are affected by different microclimatic conditions. Correlation analysis proved that the amount of PM on plant foliage is affected by rain and wind, with rain being more significant. Heavy rain and strong wind are likely to remove PM from foliage, while lighter rain and weaker wind may result in an increase PM load [32,33,34].
Rain and wind did not affect PM size fractions and categories in the same way. Large particles were the easiest to wash off and be resuspended from the leaf surface, while the fine PM fraction was almost unaffected by weather conditions. Przybysz et al. (2014) [29], also showed that the largest PM fraction is most easily removed by simulated precipitation and that the fine PM fraction seemed to adhere most strongly to the foliage surface. A more permanent accumulation of PM with a diameter of 0.2–2.5 µm is beneficial, because this PM fraction causes the greatest threat to human health [10,11,12]. Surprisingly, in all four species examined, precipitation had a negative effect on the retention of WPM as well as SPM. Previously, it was believed that unlike SPM, WPM was strongly immobilized in the waxes [15,18,23] and its resuspension was only possible after the desquamation (shedding) of waxes over the lifetime of a leaf, due to leaf aging, adverse weather conditions and exposure to contaminants [48,49]. This conclusion can be explained by the fact that in laboratory experiments (simulated rainfall), distilled water is used, which has a different composition and pH than natural rain. Additionally, in natural conditions, plants are affected simultaneously by several weather factors (e.g., precipitation, wind, changing temperature) during a rain event. Therefore, in our opinion, experiments with simulated rain do not accurately demonstrate the dynamics of PM accumulation, and wash-off results are therefore underestimates. Our observations to some extent confirm estimations of Schaubroeck et al. (2014) [35], who calculated that only 0.11% of annual dry deposition is deposited on plant foliage at the end of the growing season. Future experiments should take into the account the potential for significant inter-species variations in PM wash-off/resuspension [19], due to different micromorphologies of leaves. In addition, models should allow for water-insoluble particles that are dissolved in rainwater and removed early [50].
The effect of wind speed on PM retention by leaves was usually significantly negative, but in contrast to precipitation, plants differed in their responses to wind. The greatest impact of wind was recorded in E. ovata and N. longifolia (negative correlation with all PM fractions and categories, except the fine PM fraction), while P. undulatum was least affected and in B. acerifolius, there was no significant correlation. As all individuals of the examined species were growing in close proximity, the effect of wind was most probably determined by a combination of plant morphological characteristics and the composition and structure of wax layers. Wang et al. (2015) [33] showed that the resuspension of PM from Ligustrum lucidum by a wind of 11 m s−1 was small compared with total deposition and they predict that only wind stronger than this can have a significant impact on PM deposition. Our results suggest that effect of wind on PM resuspension cannot be averaged for all species. A lower effect of wind than rain on WPM is another interesting result of our work. Until now, it was believed that WPM were protected against precipitation, but could be resuspended by strong wind. This may be an interpretation bias, resulting from using distilled water in experiments with simulated rain. A factor that should be accounted for in in future experiments, is wind direction. According to Sgrigna et al. (2015) [51], it was not the wind speed, but its direction relative to main roads, that had most impact on the increase in PM load on studied plants.
The dynamics of accumulation, wash-off and resuspension of the accumulated PM are critical to the effect of plants on air quality. Wash-off and resuspension should be considered as a process akin to cleaning the filter and preparing the leaves for more deposition. These processes should be considered as beneficial in the planning of air phytoremediation in an urbanized area. This is especially critical for species that do not shed leaves during the year, such as those in this study: P. undulatum, E. ovata and N. longifolia. Additionally, as recorded in this work, accumulation of PM on foliage after rain is usually very high (e.g., high PM accumulation on 1 May after the rain event on 30 May). It can be explained by increased leaf ‘stickiness’ after precipitation. Rain also reduces the toxic effect on trees of contaminants accumulated on the foliage. Bell et al. (2011) [2], Gratani et al. (2000) [52], and Hanslin et al. (2017) [53] have recognized species-specific responses, mostly including growth inhibition, negative changes in gas exchange and leaves performance in urban plants exposed to air pollution. Moreover, when evergreen species retain foliage for more than a year, they may become so efficient in the retention of pollutants that they die because of an excessively heavy load of contaminants [54]. After rainfall, most of the runoff will be deposited on the ground. If the surface is open soil, or covered with vegetation, then the PM in the runoff will probably be immobilized there, whereas the runoff from paved areas is more likely to be resuspended by wind. However, the runoff of pollutants from leaf surfaces may cause environmental problems, such as leaching of bioavailable contaminants into soil and underground water, disturbing soil microflora, limiting plant growth and potentially posing a risk to human health [55].
5. Conclusions
Our study showed that the process of PM accumulation by vegetation is very dynamic, and differences in the PM load on the foliage can be large, even after one day. PM deposition on leaves was primarily affected by rain and to a lesser extent by wind, the latter was also more species-specific. The main fraction removed from leaf surfaces was the large PM fraction (10–100 µm), while the smallest PM fraction (0.2–2.5 µm) was retained more permanently. Surprisingly, precipitation also affected PM retention in waxes (WPM), which until now was believed to be not affected by rain. In our opinion, PM wash off and resuspension should be recognized as positive process, essential to recover the ability of plants to accumulate PM and to reduce phytotoxic effects of PM accumulated on leaf surfaces. This study also adds to the inventory of PM accumulation data for Australian tree species which might be considered for phytoremediation. The findings enhance the understanding of the complex interaction between plants, pollution and the atmosphere by adding a fourth variable, the weather, which, as demonstrated, has a strong influence on PM accumulation.
Author Contributions
Conceptualization, R.P.; methodology, R.P.; formal analysis, R.P.; writing-original draft preparation, R.P., A.P.; writing-review and editing, R.P., A.P, A.H.; visualization, R.P.; supervision, S.A.R.; project administration, R.P.
Funding
This research was supported in part by the Australian Government’s National Environmental Science Program through the Clean Air and Urban Landscapes Hub. A.H. is in receipt of an RTP scholarship from the Australian Government. R.P. visited Australia with the assistance of an Endeavour Fellowship and was hosted by Sharon Robinson from the School of Earth, Atmospheric and Life Sciences (SEALS), University of Wollongong.
Acknowledgments
The authors acknowledge the contribution to this work from the Centre for Atmospheric Chemistry, atmospheric measurement team at the University of Wollongong—Mitch Bowles, Hugh Forehead, Graham Kettlewell and Clare Murphy (Clare Paton-Walsh), School of Earth, Atmospheric and Life Sciences (SEALS).
Conflicts of Interest
The authors declare no conflict of interest.
References
- World Health Organization. Ambient Air Pollution: A Global Assessment of Exposure and Burden of Disease; WHO Press: Geneva, Switzerland, 2016. [Google Scholar]
- Bell, M.L.; Morgenstern, R.D.; Harrington, W. Quantifying the human health benefits of air pollution policies: Review of recent studies and new directions in accountability research. Environ. Sci. Policy 2011, 14, 357–368. [Google Scholar] [CrossRef]
- Farmer, A. Effects of particulates. In Air Pollution and Plant Life, 2nd ed.; Bell, J.N.B., Treshow, M., Eds.; John Wiley & Sons: Hoboken, NJ, USA, 2002; pp. 187–199. [Google Scholar]
- Lin, J.; Pan, D.; Davis, S.J.; Zhang, Q.; He, K.; Wang, C.; Streets, D.G.; Wuebbles, D.J.; Guan, D. China’s international trade and air pollution in the United States. Proc. Natl. Acad. Sci. USA 2014, 111, 1736–1741. [Google Scholar] [CrossRef] [PubMed]
- Beckett, K.P.; Freer-Smith, P.; Taylor, G. Urban woodlands: Their role in reducing the effects of particulate pollution. Environ. Pollut. 1998, 99, 347–360. [Google Scholar] [CrossRef]
- Bosko, M.L.; Varrica, D.; Dongorrá, G. Case study: Inorganic pollutants associated with particulate matter from an area near a petrochemical plant. Environ. Res. 2005, 99, 18. [Google Scholar] [CrossRef]
- Suzuki, K. Characterisation of airborne particulates and associated trace metals deposited on tree bark by ICP-OES, ICP-MS, SEM–EDX and laser ablation ICP-MS. Atmos. Environ. 2006, 40, 2626–2634. [Google Scholar] [CrossRef]
- Gunawardena, J.; Egodawatta, P.; Ayoko, G.A.; Goonetilleke, A. Role of traffic in atmospheric accumulation of heavy metals and polycyclic aromatic hydrocarbons. Atmos. Environ. 2012, 54, 502–510. [Google Scholar] [CrossRef] [Green Version]
- Alghamdi, M.A. Characteristics and risk assessment of heavy metals in airborne PM10 from a residential area of northern Jeddah city, Saudi Arabia. Pol. J. Environ. Stud. 2016, 25, 939–949. [Google Scholar] [CrossRef]
- Chen, W.; Zheng, R.; Baade, P.D.; Zhang, S.; Zeng, H.; Bray, F.; Jemal, A.; Yu, X.Q.; He, J. Cancer statistics in China, 2015. C.A. Cancer J. Clin. 2016, 66, 115–132. [Google Scholar] [CrossRef] [Green Version]
- Xing, Y.F.; Xu, Y.H.; Shi, M.H.; Lian, Y.X. The impact of PM2.5 on the human respiratory system. J. Thorac. Dis. 2016, 8, E69–E74. [Google Scholar] [CrossRef]
- Silva, R.A.; West, J.J.; Zhang, Y.; Anenberg, S.C.; Lamarque, J.-F.; Shindell, D.T.; Collins, W.J.; Dalsoren, S.; Faluvegi, G.; Folberth, G.; et al. Global premature mortality due to anthropogenic outdoor air pollution and the contribution of past climate change. Environ. Res. Lett. 2013, 8, 034005. [Google Scholar] [CrossRef]
- Popek, R.; Łukowski, A.; Bates, C.; Oleksyn, J. Particulate matter, heavy metals and polycyclic aromatic hydrocarbons accumulation on the leaves of Tilia cordata Mill. in five Polish cities with different level of air pollution. Int. J. Phytoremediation 2017, 19, 1134–1141. [Google Scholar] [CrossRef] [PubMed]
- Li, Y.; Wang, S.; Chen, Q. Potential of thirteen urban greening plants to capture particulate matter on leaf surfaces across three levels of ambient atmospheric pollution. Int. J. Environ. Res. Public Health 2019, 16, 402. [Google Scholar] [CrossRef] [PubMed]
- Popek, R.; Gawrońska, H.; Gawroński, S.W. The level of particulate matter on foliage depends on the distance from the source of emission. Int. J. Phytoremediation 2015, 17, 1262–1268. [Google Scholar] [CrossRef] [PubMed]
- Janhäll, S. Review on urban vegetation and particle air pollution–deposition and dispersion. Atmos. Environ. 2015, 105, 130–137. [Google Scholar] [CrossRef]
- Pugh, T.A.M.; MacKenzie, R.A.; Whyatt, D.J.; Hewitt, N.C. Effectiveness of green infrastructure for improvement of air quality in urban street canyons. Environ. Sci. Technol. 2012, 46, 7692–7699. [Google Scholar] [CrossRef]
- Dzierżanowski, K.; Popek, R.; Gawrońska, H.; Sæbø, A.; Gawroński, S.W. Deposition of particulate matter of different size fractions on leaf surfaces and in waxes of urban forest species. Int. J. Phytoremediation 2011, 13, 1037–1046. [Google Scholar] [CrossRef] [PubMed]
- Chen, L.; Liu, C.; Zhang, L.; Zou, R.; Zhang, Z.Q. Variation in tree species ability to capture and retain airborne fine particulate matter (PM2.5). Sci. Rep. 2017, 7, 3206. [Google Scholar] [CrossRef]
- Nguyen, T.; Yu, X.; Zhang, Z.; Liu, M.; Liu, X. Relationship between types of urban forest and PM2.5 capture at three growth stages of leaves. J. Environ. Sci-China. 2015, 27, 33–41. [Google Scholar] [CrossRef]
- Liang, D.; Ma, C.; Wang, Y.; Wang, Y.; Chen, Z. Quantifying PM2.5 capture capability of greening trees based on leaf factors analyzing. Environ. Sci. Pollut. Res. 2016, 23, 21176–21186. [Google Scholar] [CrossRef]
- Zhang, W.; Wang, B.; Niu, X. Relationship between leaf surface characteristics and particle capturing capacities of different tree species in Beijing. Forests 2017, 8, 92. [Google Scholar] [CrossRef]
- Popek, R.; Łukowski, A.; Karolewski, P. Particulate matter accumulation – further differences between native Prunus padus and nonnative Prunus Serotina. Dendrobiology 2017, 78, 85–95. [Google Scholar] [CrossRef]
- Leonard, R.J.; McArthur, C.; Hochuli, D.F. Particulate matter deposition on roadside plants and the importance of leaf trait combinations. Urban For. Urban Green. 2016, 20, 249–253. [Google Scholar] [CrossRef]
- Sæbø, A.; Popek, R.; Nawrot, B.; Hanslin, H.M.; Gawronska, H.; Gawroński, S.W. Plant species differences in particulate matter accumulation on leaf surfaces. Sci. Total. Environ. 2012, 427–428, 347–354. [Google Scholar] [CrossRef]
- Popek, R.; Gawrońska, H.; Sæbø, A.; Wrochna, M.; Gawroński, S.W. Particulate matter on foliage of 13 woody species: Deposition on surfaces and phytostabilisation in waxes—A 3–year study. Int. J. Phytoremediation 2013, 15, 245–256. [Google Scholar] [CrossRef]
- Xu, Y.; Xu, W.; Mo, L.; Heal, M.R.; Xu, X.; Yu, X. Quantifying particulate matter accumulated on leaves by 17 species of urban trees in Beijing, China. Environ. Sci. Pollut. Res. 2018, 25, 12545–12556. [Google Scholar] [CrossRef] [Green Version]
- Zhang, B.; Jiao, L.M.; Xu, G.; Zhao, S.L.; Tang, X.; Zhou, Y.; Gong, C. Influences of wind and precipitation on different–sized particulate matter concentrations (PM2.5, PM10, PM2.5–10). Meteorol. Atmos. Phys. 2017, 3, 383–392. [Google Scholar] [CrossRef]
- Przybysz, A.; Sæbø, A.; Hanslin, H.M.; Gawroński, S.W. Accumulation of particulate matter and trace elements on vegetation as affected by pollution level, rainfall and the passage of time. Sci. Total Environ. 2014, 481, 360–369. [Google Scholar] [CrossRef]
- Wang, L.; Gong, H.L.; Liao, W.; Wang, Z. Accumulation of particles on the surface of leaves during leaf expansion. Sci. Total Environ. 2015, 532, 420–434. [Google Scholar] [CrossRef]
- Cai, M.; Xin, Z.; Yu, X. Spatio–temporal variations in PM leaf deposition: A meta–analysis. Environ. Pollut. 2017, 231, 207–218. [Google Scholar] [CrossRef]
- Weerakkody, U.; Dover, J.W.; Mitchell, P.; Reiling, K. Evaluating the impact of individual leaf traits on atmospheric particulate matter accumulation using natural and synthetic leaves. Urban For. Urban Green. 2018, 30, 98–107. [Google Scholar] [CrossRef]
- Wang, H.; Shi, H.; Wang, Y. Effects of weather, time, and pollution level on the amount of particulate matter deposited on leaves of Ligustrum lucidum. Sci. World J. 2015, 935942. [Google Scholar] [CrossRef]
- Xu, X.; Zhang, Z.; Bao, L.; Mo, L.; Yu, X.; Fan, D.; Lun, X. Influence of rainfall duration and intensity on particulate matter removal from plant leaves. Sci. Total Environ. 2017, 609, 11–16. [Google Scholar] [CrossRef] [PubMed]
- Schaubroeck, T.; Deckmyn, G.; Neirynck, J.; Staelens, J.; Adriaenssens, S.; Dewulf, J.; Muys, B.; Verheyen, K. Multilayered modeling of particulate matter removal by a growing forest over time, from plant surface deposition to washoff via rainfall. Environ. Sci. Technol. 2014, 48, 10785–10794. [Google Scholar] [CrossRef] [PubMed]
- Liu, L.; Guan, D.; Peart, M.R.; Wang, G.; Zhang, H.; Li, Z. The dust retention capacities of urban vegetation—A case study of Guangzhou, South China. Environ. Sci. Pollut. Res. Int. 2013, 20, 6601–6610. [Google Scholar] [CrossRef] [PubMed]
- Zhang, H.; Wang, Y.; Hu, J.; Ying, Q.; Hu, X.M. Relationships between meteorological parameters and criteria air pollutants in three megacities in China. Environ. Res. 2015, 140, 242–254. [Google Scholar] [CrossRef]
- Tian, G.; Qiao, Z.; Xu, X. Characteristics of particulate matter (PM10) and its relationship with meteorological factors during 2001–2012 in Beijing. Environ. Pollut. 2014, 192, 266–274. [Google Scholar] [CrossRef] [PubMed]
- Duhanyan, N.; Roustan, Y. Below-cloud scavenging by rain of atmospheric gases and particulates. Atmos. Environ. 2011, 45, 7201–7217. [Google Scholar] [CrossRef]
- Blanco–Becerra, L.C.; Gáfaro–Rojas, A.I.; Rojas–Roa, N.Y. Influence of precipitation scavenging on the PM2.5/PM10 ratio at the Kennedy locality of Bogotá, Colombia. Rev. fac. ing. univ. Antioquia 2015, 76, 58–62. [Google Scholar]
- Czernecki, B.; Półrolniczak, M.; Kolendowicz, L.; Marosz, M.; Kendzierski, S.; Pilguj, N. Influence of the atmospheric conditions on PM10 concentrations in Poznań, Poland. J. Atmos. Chem. 2017, 74, 115–139. [Google Scholar] [CrossRef]
- Google Maps. Available online: https://www.google.com/maps (accessed on 11 October 2019).
- NSW Roads & Maritime Services, Traffic Volume Viewer. Available online: https://www.rms.nsw.gov.au/about/corporate-publications/statistics/traffic-volumes/aadt-map/index.html (accessed on 11 October 2019).
- Australian Government Bureau of Meteorology. Available online: http://www.bom.gov.au (accessed on 1 March 2019).
- WHO Global Ambient Air Quality Database (update 2018). Available online: https://www.who.int/airpollution/data/cities/en/ (accessed on 16 March 2019).
- Mo, L.; Ma, Z.; Xu, Y.; Sun, F.; Lun, X.; Liu, X.; Chen, J.; Yu, X. Assessing the capacity of plant species to accumulate particulate matter in Beijing, China. PLoS ONE 2015, 10, e0140664. [Google Scholar] [CrossRef]
- Weerakkody, U.; Dover, J.W.; Mitchell, P.; Reiling, K. Quantification of the traffic–generated particulate matter capture by plant species in a living wall and evaluation of the important leaf characteristics. Sci. Tot. Environ. 2018, 635, 1012–1024. [Google Scholar] [CrossRef] [PubMed]
- Kupčinskienė, E.; Huttunen, S. Long–term evaluation of the needle surface wax condition of Pinus sylvestris around different industries in Lithuania. Environ. Pollut. 2005, 137, 610–618. [Google Scholar] [CrossRef] [PubMed]
- Pal, A.; Kulshreshtha, K.; Ahmad, K.J.; Behl, K.M. Do leaf surface characters play a role in plant resistance to auto-exhaust pollution? Flora Morphol. Distrib. Funct. Ecol. Plants 2002, 197, 47–55. [Google Scholar] [CrossRef]
- Beckett, K.P.; Freer Smith, P.H.; Taylor, G. Effective tree species for local air quality management. J. Arboric. 2000, 26, 12–19. [Google Scholar]
- Sgrigna, G.; Sæbø, A.; Gawronski, S.; Popek, R.; Calfapietra, C. Particulate Matter deposition on Quercus ilex leaves in an industrial city of central Italy. Environ. Pollut. 2015, 197, 187–194. [Google Scholar] [CrossRef] [PubMed]
- Gratani, L.; Crescente, M.F.; Petruzzi, M. Relationship between leaf life–span and photosynthetic activity of Quercus ilex in polluted urban areas (Rome). Environ. Pollut. 2000, 110, 19–28. [Google Scholar] [CrossRef]
- Hanslin, H.M.; Przybysz, A.; Slimestad, R.; Sæbø, A. Stress acclimation and particulate matter accumulation in Pinus sylvestris saplings affected by moderate combinations of urban stressors. Sci. Total Environ. 2017, 593–594, 581–591. [Google Scholar] [CrossRef]
- Gawroński, S.W.; Gawrońska, H.; Lomnicki, S.; Sӕbo, A.; Vangronsveld, J. Plants in air phytoremediation. Adv. Bot. Res. 2017, 83, 319–346. [Google Scholar] [CrossRef]
- Ali, H.; Khan, E.; Sajad, S.A. Phytoremediation of heavy metals—Concepts and applications. Chemosphere 2013, 91, 869–881. [Google Scholar] [CrossRef]
Figure 1.
Map showing location of the study area with a wind rose showing percentage of wind direction during the study period. Satellite image from Google Maps; Google [42].
Figure 1.
Map showing location of the study area with a wind rose showing percentage of wind direction during the study period. Satellite image from Google Maps; Google [42].

Figure 2.
Average amount of PM (divided into SPM and WPM) and waxes on leaves of B. acerifolius, P. undulatum, E. ovata and N. longifolia over five weeks. PM and waxes values are expressed as µg per cm−2 of leaf. Data are means ± SE, n = 15. Different letters (lowercase for PM and capital for waxes) indicate statistical significance (P< 0.05).

Figure 3.
Amount of large PM fraction (10–100 µm) PM deposited on leaves of B. acerifolius, P. undulatum, E. ovata and N. longifolia during (a) five weeks and (b) seven days of measurements. Data are means ± SE, n = 3. P values in bold indicate statistical significance.
Figure 3.
Amount of large PM fraction (10–100 µm) PM deposited on leaves of B. acerifolius, P. undulatum, E. ovata and N. longifolia during (a) five weeks and (b) seven days of measurements. Data are means ± SE, n = 3. P values in bold indicate statistical significance.

Figure 4.
Amount of coarse PM fraction (2.5–10 µm) PM deposited on leaves of B. acerifolius, P. undulatum, E. ovata and N. longifolia during (a) five weeks and (b) seven days of measurements. Data are means ± SE, n = 3. P values in bold indicate statistical significance.
Figure 4.
Amount of coarse PM fraction (2.5–10 µm) PM deposited on leaves of B. acerifolius, P. undulatum, E. ovata and N. longifolia during (a) five weeks and (b) seven days of measurements. Data are means ± SE, n = 3. P values in bold indicate statistical significance.
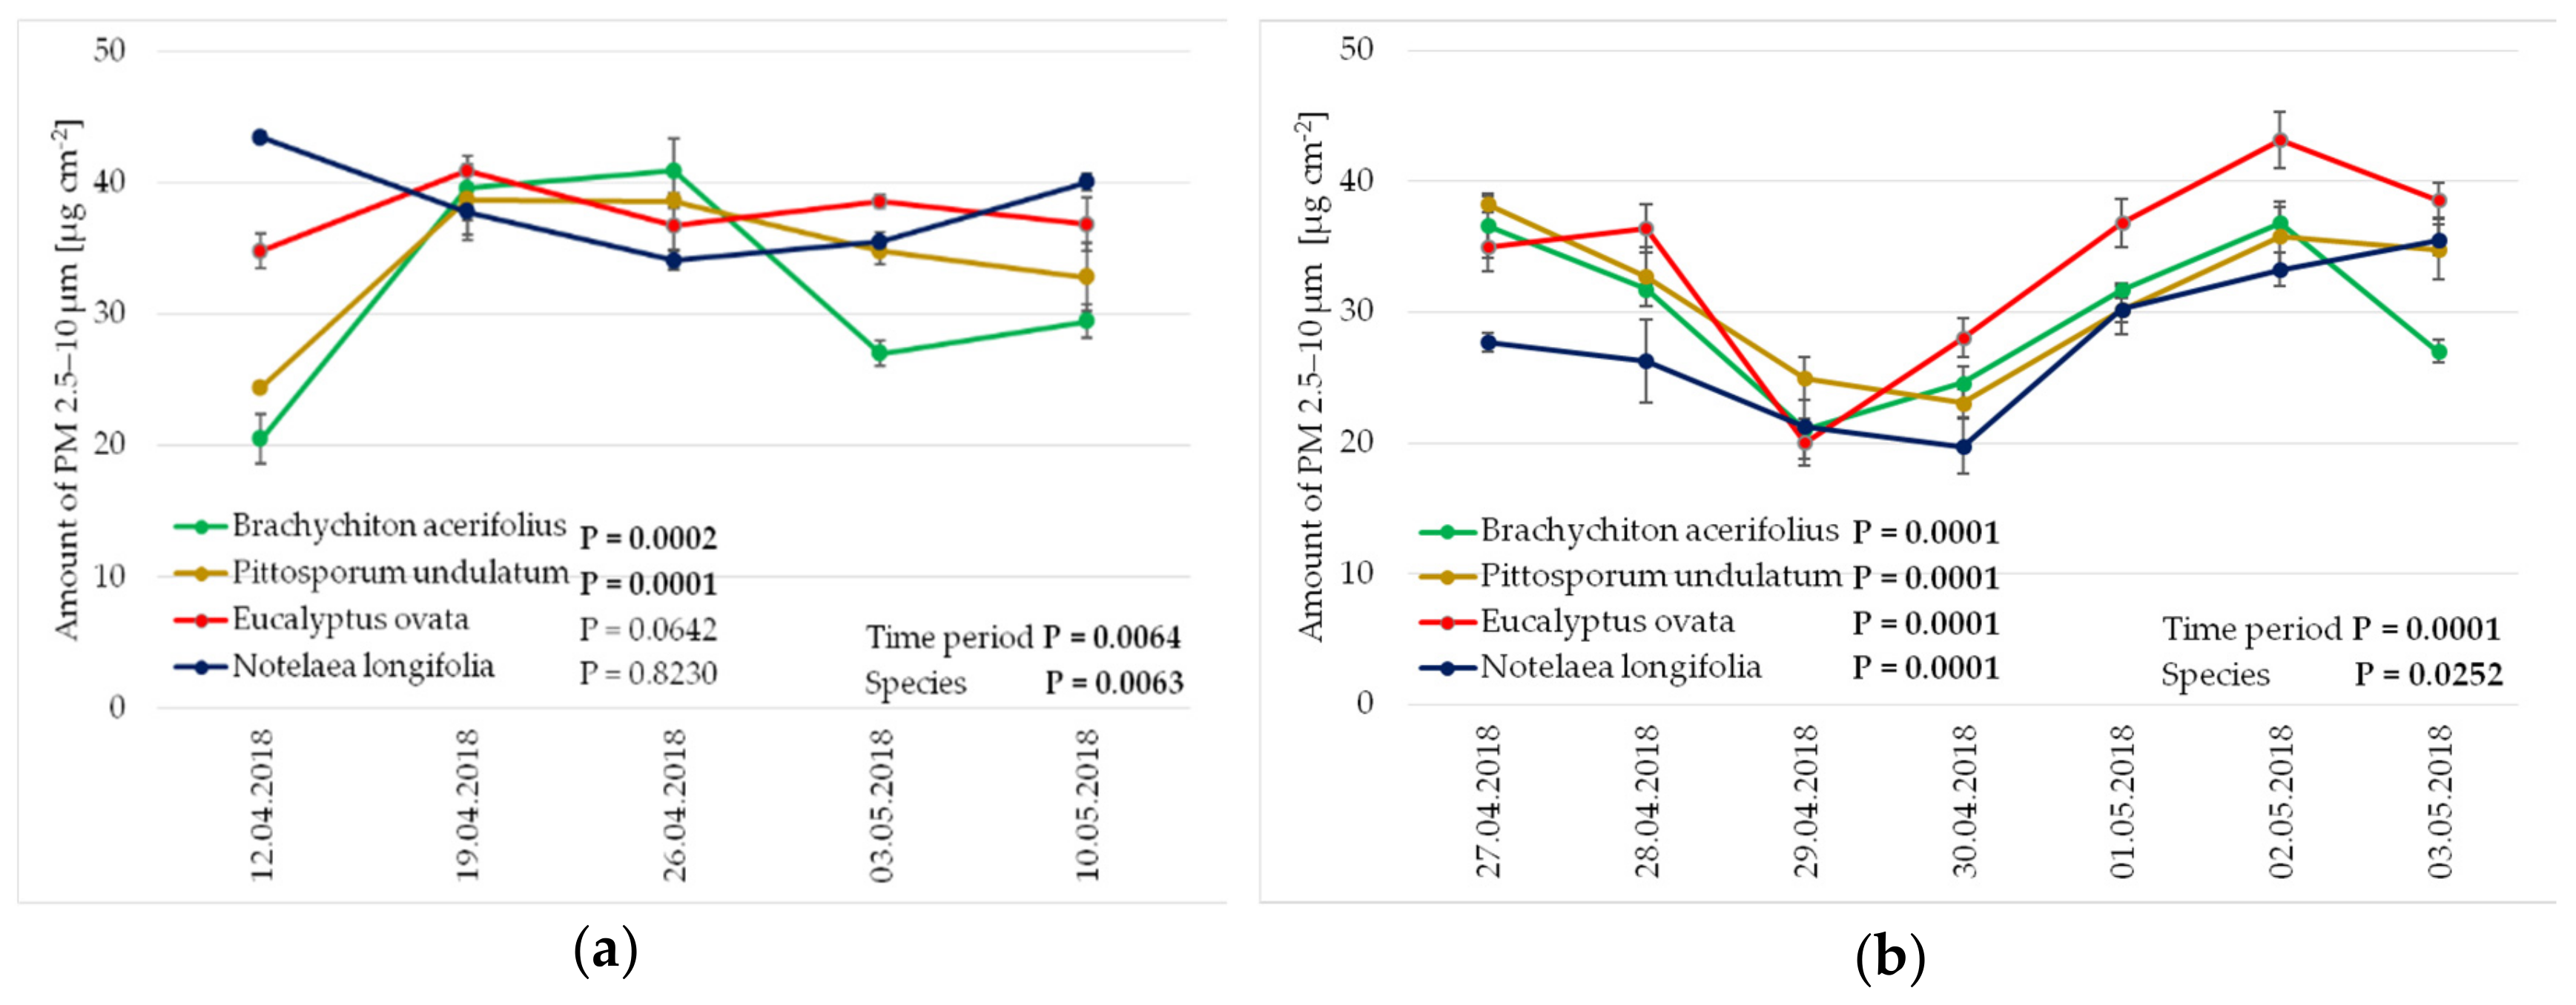
Figure 5.
Amount of fine PM fraction (0.2–2.5 µm) PM deposited on leaves of B. acerifolius, P. undulatum, E. ovata and N. longifolia during (a) five weeks and (b) seven days of measurements. Data are means ± SE, n = 3. P values in bold indicate statistical significance.
Figure 5.
Amount of fine PM fraction (0.2–2.5 µm) PM deposited on leaves of B. acerifolius, P. undulatum, E. ovata and N. longifolia during (a) five weeks and (b) seven days of measurements. Data are means ± SE, n = 3. P values in bold indicate statistical significance.

Figure 6.
Amount of SPM in (a) a five-week period and (b) a seven-day period, and WPM in (c) a five-week period and (d) a seven-day period on leaves of B. acerifolius, P. undulatum, E. ovata and N. longifolia during measurement period. Data are means ± SE, n = 3. P values in bold indicate statistical significance.
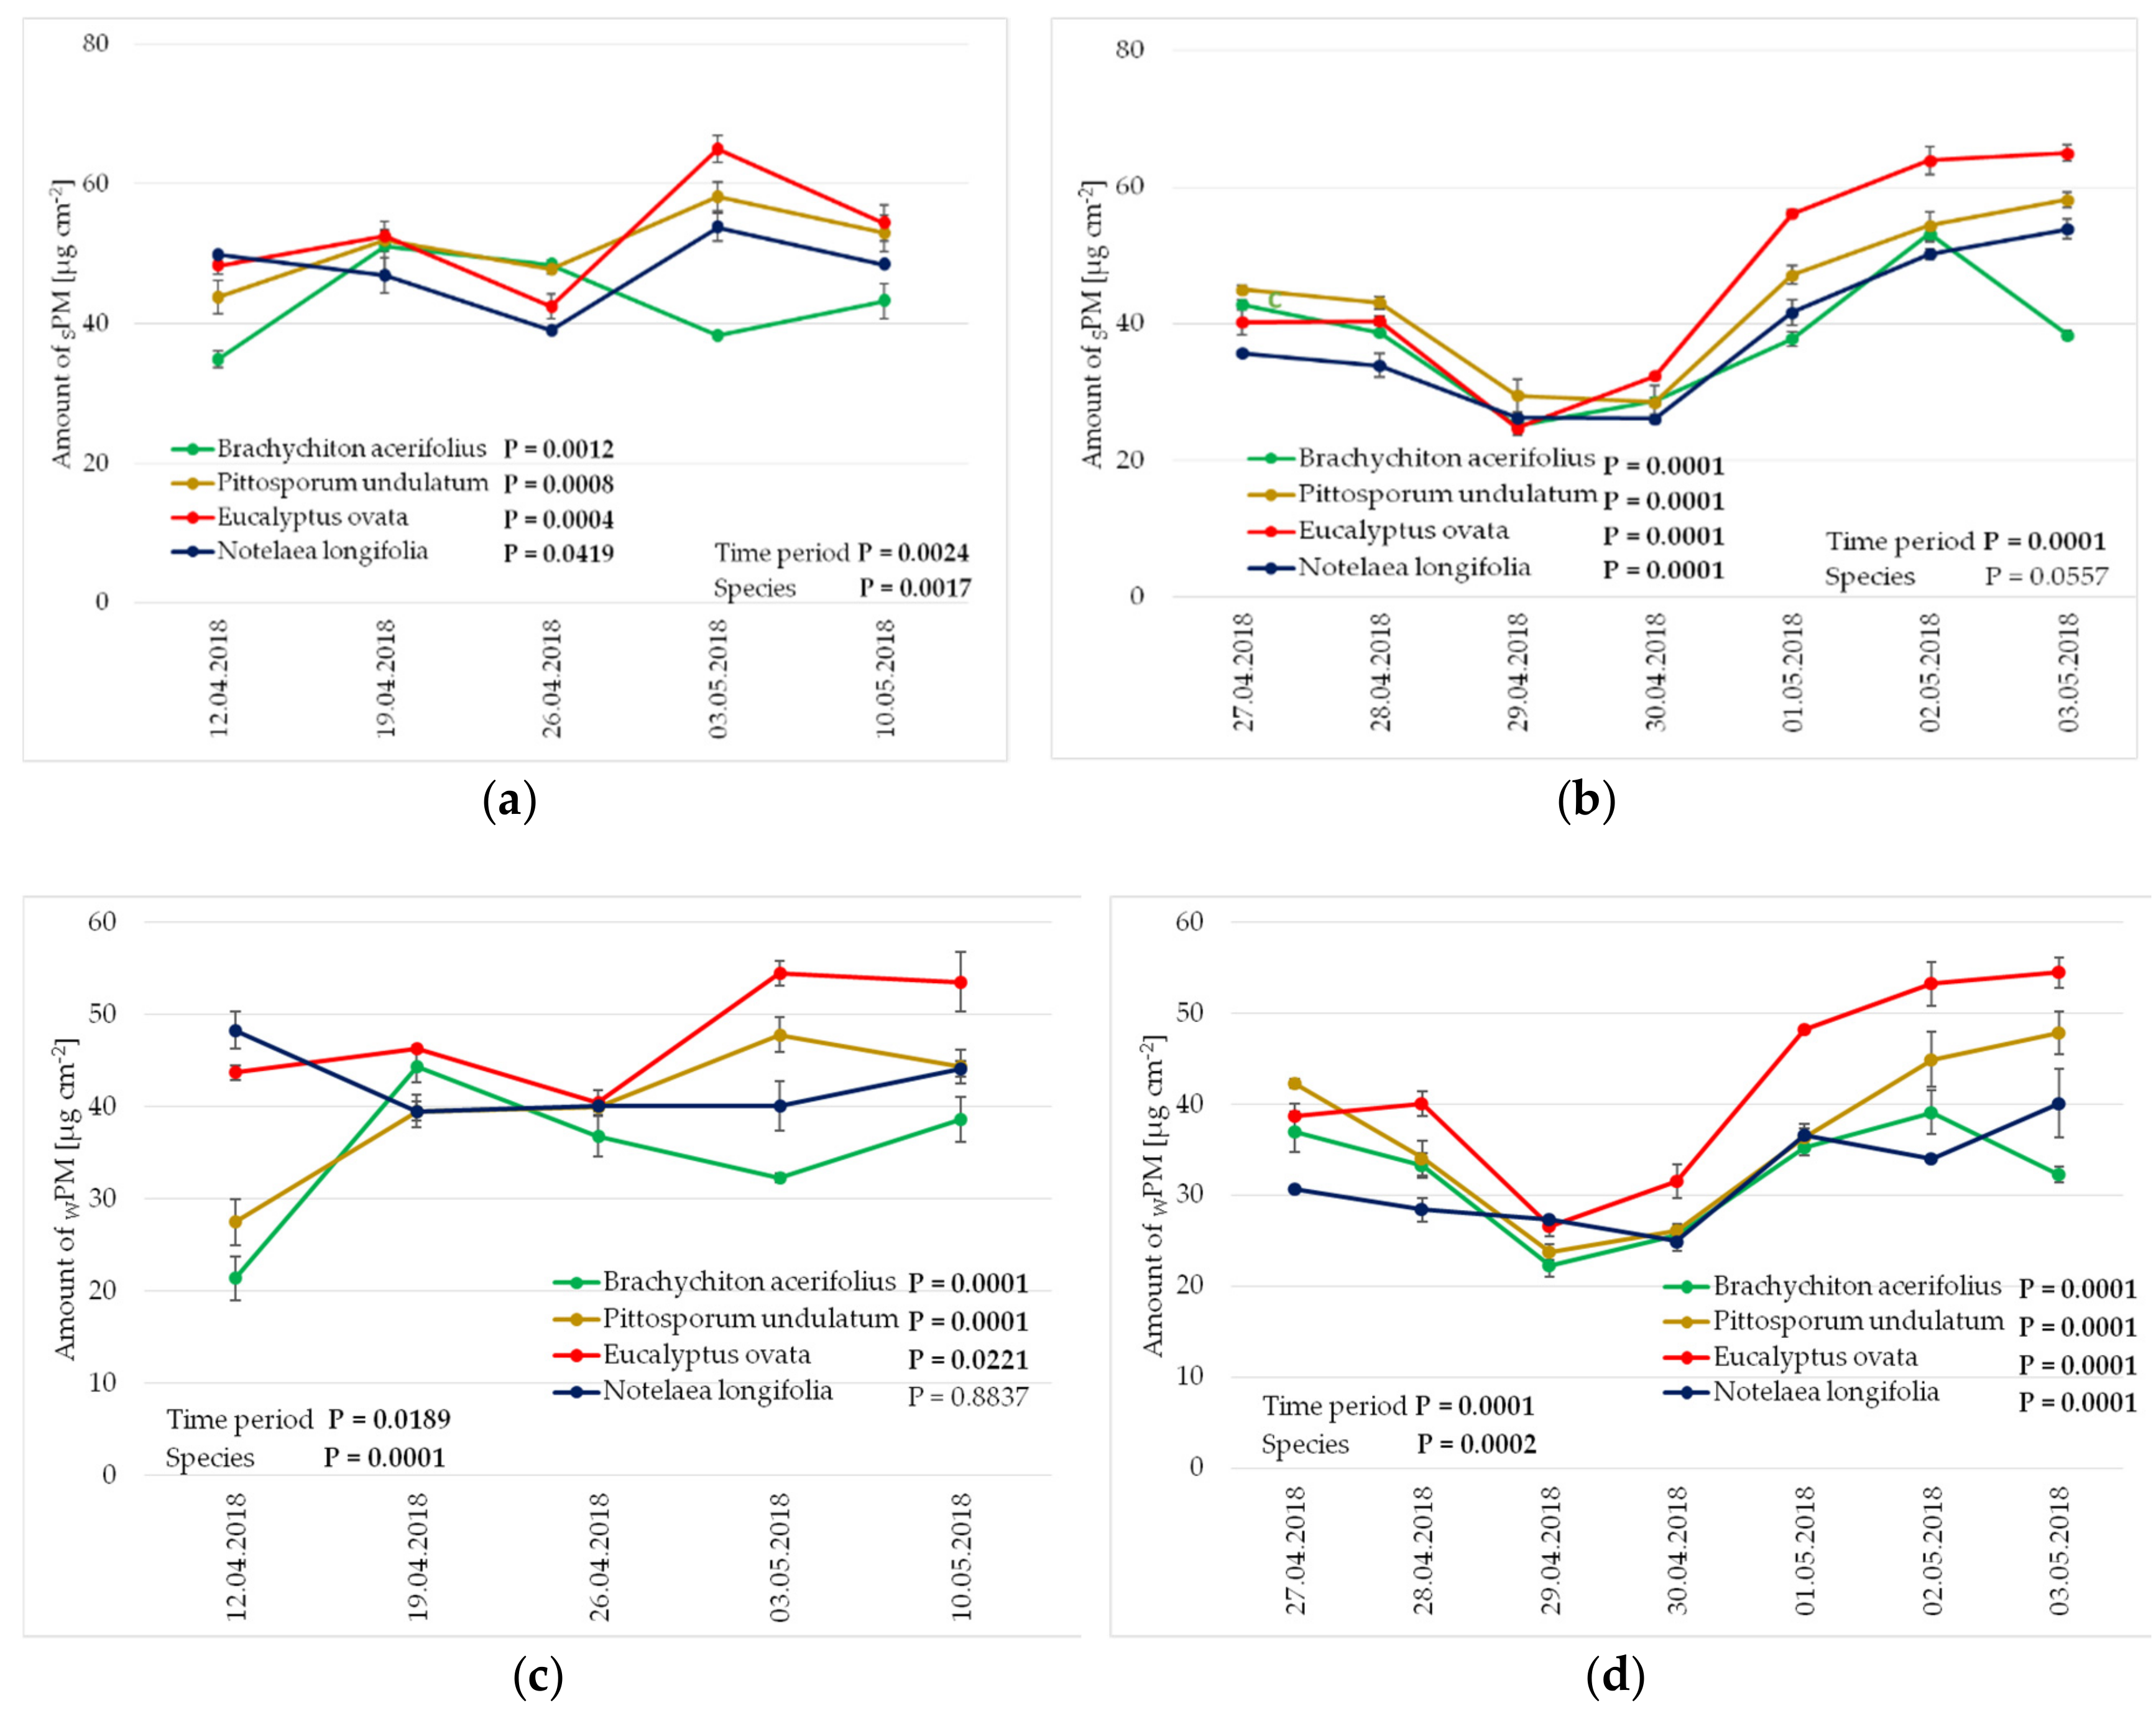
Figure 7.
Meteorological conditions (rainfall and wind speed) and concentration of PM10 and PM2.5 during the five-week period. Dashed lines show the seven-day period subject to daily analysis.
Figure 7.
Meteorological conditions (rainfall and wind speed) and concentration of PM10 and PM2.5 during the five-week period. Dashed lines show the seven-day period subject to daily analysis.


Table 1.
Correlation coefficients between meteorological conditions (rainfall and wind speed) and concentration of PM10 and PM2.5 in the air and the amount of PM (in three size fractions—fine, coarse and large—and the two types of PM—SPM and WPM) accumulating on leaves of four species of Australian trees. Results in bold are statistically significant.
| Factor | Species | PM Fraction | Type of PM | |||
|---|---|---|---|---|---|---|
| PM 10–100 µm | PM 2.5–10 µm | PM 0.2–2.5 µm | SPM | WPM | ||
| Rainfall | Brachychiton acerifolius | −0.56 | −0.37 | −0.15 | −0.49 | −0.48 |
| Pittosporum undulatum | −0.58 | −0.60 | −0.03 | −0.65 | −0.54 | |
| Eucalyptus ovata | −0.48 | −0.40 | −0.21 | −0.46 | −0.50 | |
| Notelaea longifolia | −0.57 | −0.62 | −0.04 | −0.58 | −0.60 | |
| Wind speed | Brachychiton acerifolius | −0.33 | −0.18 | −0.16 | −0.35 | −0.31 |
| Pittosporum undulatum | −0.45 | −0.06 | −0.57 | −0.45 | −0.27 | |
| Eucalyptus ovata | −0.63 | −0.44 | −0.39 | −0.61 | −0.59 | |
| Notelaea longifolia | −0.59 | −0.47 | −0.14 | −0.53 | −0.52 | |
| PM10 in air | Brachychiton acerifolius | 0.60 | 0.52 | −0.25 | 0.63 | 0.65 |
| Pittosporum undulatum | 0.54 | 0.48 | 0.67 | 0.57 | 0.54 | |
| Eucalyptus ovata | 0.45 | 0.54 | 0.57 | 0.47 | 0.57 | |
| Notelaea longifolia | 0.63 | 0.81 | 0.22 | 0.57 | 0.85 | |
| PM2.5 in air | Brachychiton acerifolius | 0.57 | 0.46 | −0.12 | 0.51 | 0.65 |
| Pittosporum undulatum | 0.64 | 0.54 | 0.47 | 0.64 | 0.66 | |
| Eucalyptus ovata | 0.54 | 0.50 | 0.50 | 0.52 | 0.62 | |
| Notelaea longifolia | 0.65 | 0.76 | 0.25 | 0.59 | 0.84 | |
© 2019 by the authors. Licensee MDPI, Basel, Switzerland. This article is an open access article distributed under the terms and conditions of the Creative Commons Attribution (CC BY) license (http://creativecommons.org/licenses/by/4.0/).
Share and Cite
MDPI and ACS Style
Popek, R.; Haynes, A.; Przybysz, A.; Robinson, S.A. How Much Does Weather Matter? Effects of Rain and Wind on PM Accumulation by Four Species of Australian Native Trees. Atmosphere 2019, 10, 633. https://doi.org/10.3390/atmos10100633
AMA Style
Popek R, Haynes A, Przybysz A, Robinson SA. How Much Does Weather Matter? Effects of Rain and Wind on PM Accumulation by Four Species of Australian Native Trees. Atmosphere. 2019; 10(10):633. https://doi.org/10.3390/atmos10100633
Chicago/Turabian StylePopek, Robert, Alison Haynes, Arkadiusz Przybysz, and Sharon A. Robinson. 2019. "How Much Does Weather Matter? Effects of Rain and Wind on PM Accumulation by Four Species of Australian Native Trees" Atmosphere 10, no. 10: 633. https://doi.org/10.3390/atmos10100633
Note that from the first issue of 2016, this journal uses article numbers instead of page numbers. See further details here.