Article

Near-Ground Profile of Bora Wind Speed at Razdrto, Slovenia

1
Center for Atmospheric Research, University of Nova Gorica, Vipavska 11c, 5270 Ajdovščina, Slovenia
2
Slovenian Environment Agency, 1000 Ljubljana, Slovenia
*
Author to whom correspondence should be addressed.
Atmosphere 2019, 10(10), 601; https://doi.org/10.3390/atmos10100601
Submission received: 28 August 2019 / Revised: 22 September 2019 / Accepted: 30 September 2019 / Published: 3 October 2019
(This article belongs to the Special Issue 10th Anniversary of Atmosphere: Climatology and Meteorology)

Abstract

:
Southwest Slovenia is a region well-known for frequent episodes of strong and gusty Bora wind, which may damage structures, affect traffic, and poses threats to human safety in general. With the increased availability of computational power, the interest in high resolution modeling of Bora on local scales is growing. To model it adequately, the flow characteristics of Bora should be experimentally investigated and parameterized. This study presents the analysis of wind speed vertical profiles at Razdrto, Slovenia, a location strongly exposed to Bora during six Bora episodes of different duration, appearing between April 2010 and May 2011. The empirical power law and the logarithmic law for Bora wind, commonly used for the description of neutrally stratified atmosphere, were evaluated for 10-min averaged wind speed data measured at four different heights. Power law and logarithmic law wind speed profiles, which are commonly used in high resolution computational models, were found to approximate well the measured data. The obtained power law coefficient and logarithmic law parameters, which are for modeling purposes commonly taken to be constant for a specific site, were found to vary significantly between different Bora episodes, most notably due to different wind direction over complex terrain. To increase modeling precision, the effects of local topography on wind profile parameters needs to be experimentally assessed and implemented.

1. Introduction

Bora is strong and gusty downslope wind with variable gust frequency, observed on the lee side of Dinaric Alps along the Adriatic coast [1]. The gusts may reach three to five times its average speed [2,3,4], and commonly exceed 30 m/s. Bora is common in Southwest Slovenia over the ridges of Trnovski gozd, Nanos, and the Javorniki Plateau, spreading into the Vipava valley and over the Karst towards the Bay of Trieste [5,6]. It generally appears in the presence of a low pressure center over the Adriatic or a high pressure cell over Central Europe or as combination of both [3,7,8]. Short Bora episodes may also occur during the passage of a cold front [9,10]. Bora episodes are more frequent and longer in the cold season, whereas in the summer, Bora is considerably weaker [11]. The dynamics of Bora has been investigated in a number of observational, theoretical, and modeling studies over the past decades. In an early comprehensive study [12], Bora was considered from a climatological, synoptic, and aerological point of view. Studies arising from the Alpine Experiment (ALPEX) project in 1981 provided more details on its basic properites at a number of sites [13,14], based on which a more appropriate description of dynamically generated wind (hydraulic and wave breaking theory) was developed [13,15,16].
Bora was so far primarily modeled using numerical models for description of two-dimensional airflow [14] and mesoscale numerical models, such as limited area models [4,17], which usually have a maximum resolution of 1 km, or up to 333 m in the regions with finest mesh [17,18]. Although these models are appropriate for the study of mesoscale phenomena, they have a limited capability to reproduce the phenomena on smaller scales and cannot capture flow details. Although Bora’s macroscale and mesoscale properties have been intensively studied [9,19], its microscale flow characteristics are still not fully investigated. That is primarily due to the lack of high temporal and spatial resolution measurements, needed to assess the turbulence properties of the wind. Recently, microscale properties of Bora have been investigated for different Bora types [20], confirming most of previous results related to Bora periodicity and turbulence properties [21,22]. Bora turbulence properties were studied in [23,24] as well, with a particular focus on turbulence intensity, Reynolds shear stress, and turbulence length scales. Research at specific regions in Croatia (Pometeno brdo near Split [22] and Maslenica [20]), revealed that the near-ground wind speed profile of Bora is in good agreement with the logarithmic law and power law description, which are commonly used in wind engineering. Thermal stratification during Bora episodes at these sites was found to be near-neutral, due to intensive mechanical mixing.
With continuous increase in computational power, the capability to apply computational fluid dynamics (CFD) models to atmospheric phenomena such as Bora is ever greater. High-resolution CFD models can reveal details of the flow up to tenths of meters and may be used to study Bora effects. Modeling of atmospheric boundary layer (ABL) flow and its phenomena requires an accurate description of the flow characteristics, such as the mean velocity profile and turbulence characteristics of the flow. In the case of Bora, which appears at specific locations, these characteristics strongly depend on local topography. The main aim of this study was to evaluate the applicability of wind profile laws, which are commonly used in computational wind engineering (CWE) models, to Bora wind and to determine power law coefficient and logarithmic law parameters for a specific site in Slovenia using in situ wind data. For the purpose of CFD modeling, we also investigated the dependence of logarithmic and power law parameters, which are commonly taken to be constant for a specific site, with respect to different mean Bora direction, different season, and different terrain conditions.

2. Methodology

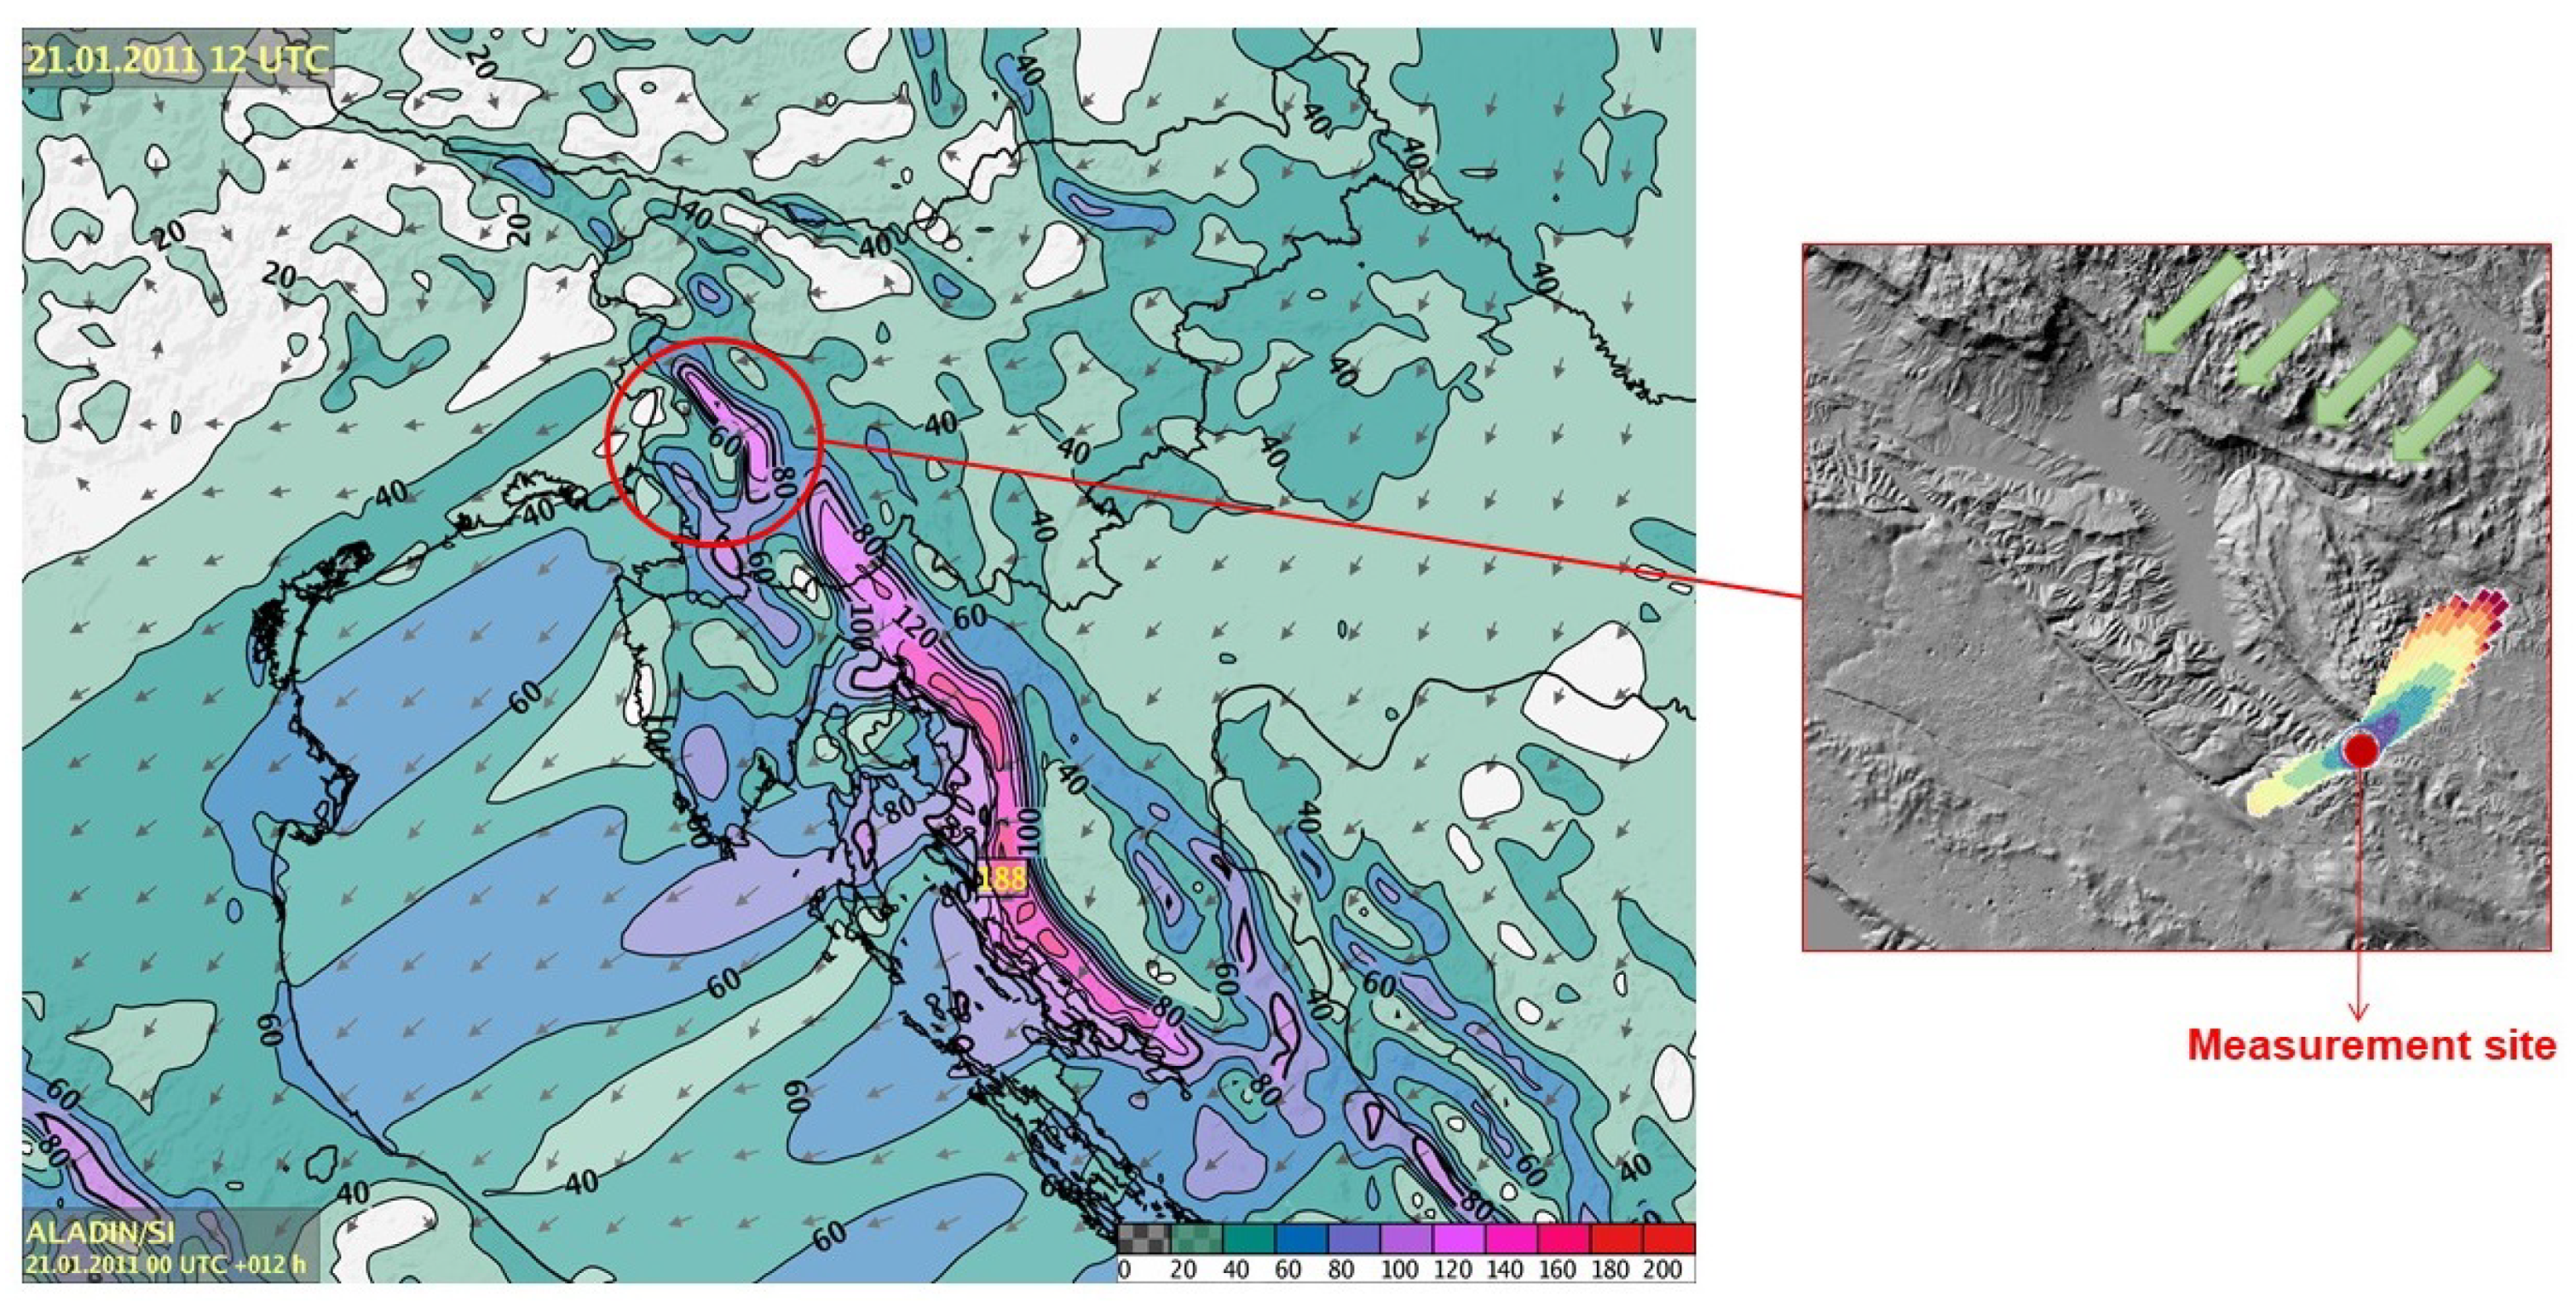
2.1. Instrumentation and Data Collection

Wind data was collected at the wind turbine site in Razdrto, Slovenia ( 45 45 N, 14 03 E), where a meteorological tower was placed in 2010–2011. The site is located in a gap between the Nanos and Javorniki plateau and is strongly exposed to Bora (Figure 1). The ten-minute average and standard deviation of wind speed and direction were recorded during the period from 14 April 2010 to 15 May 2011. Wind speed was measured using four cup anemometers at 20 m, 31 m, 40 m, and 41.7 m above the ground, whereas wind direction was obtained from a single wind vane placed at 40.9 m above the ground. Co-located to the wind vane was a temperature sensor as well. The reference height for selecting Bora episodes was chosen as 20 m above the ground, which was the lowest measuring point. Furthermore, the assumption was made that the wind direction (measured at the height of 40.9 m) was the same for all wind speed measuring heights. This assumption should not introduce significant errors, as the difference between the highest and lowest measurement point was only 21.7 m, which is in Bora-like wind conditions expected to be smaller then characteristic length scale [25,26]. There is no standard way to identify Bora episodes, and various criteria have been applied by different authors so far [20,22]. In our case, we used the following criteria.
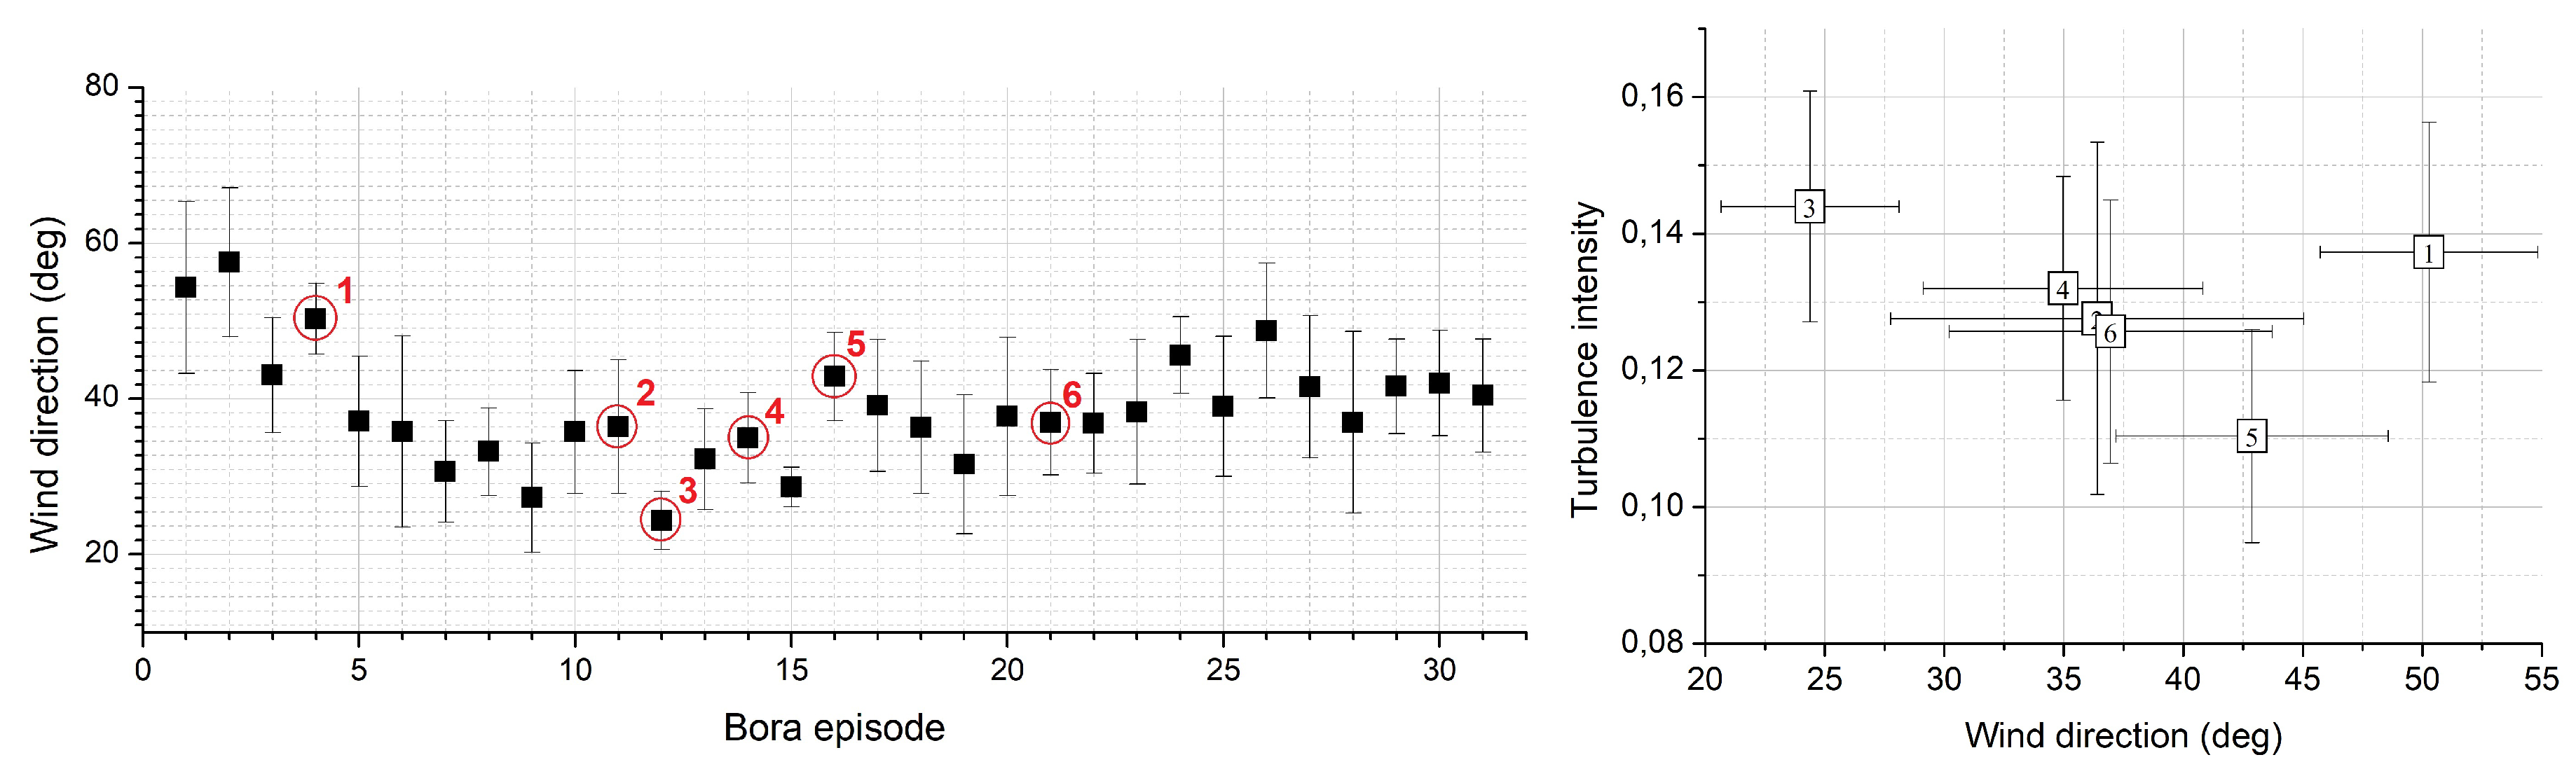
  • NE wind direction (0–90°, defined by the direction of the orographic barrier).
  • Minimum wind speed greater than 7 m/s at the reference height.
  • Mean wind speed of the whole episode greater than 10 m/s at the reference height.
  • Minimal duration of an episode has to be at least 12 h.
A candidate for a Bora episode is a time interval starting when conditions 1–3 are met, and becomes a true Bora episode when condition 4 is met as well. The Bora episode ends when one or more of the first three conditions are no longer met. Based on this criteria, 31 Bora episodes were identified. Mean wind speeds were found to be between 10 m/s and 14 m/s, whereas the mean wind directions ranged between 24 and 58 (Figure 2, left). Six out of these episodes, occurring in different seasons (spring, autumn, and winter), were selected as the representative examples of the whole dataset for detailed analysis. Their characteristics are summarized in the Table 1. The selected episodes were additionally confirmed as Bora by the synoptic situation at the time of their occurrence [28].

2.2. Data Analysis

The height range of interest for studying strong wind effects on human life and structures is approximately the first 100 m [29]. In this near-surface region, wind speed is generally increasing with height, which is described by empirical power law or by theoretically derived logarithmic law profiles. As the wind direction is well defined and does not change considerably during a Bora episode, it was taken to be constant and equal to its mean value (Table 1). The power law wind speed profile is described as
u ( z ) = u r z z r α ,
where u ( z ) is the estimated mean wind speed at the height of z meters above ground level, u r is the known wind speed at a reference height z r and α is an empirically derived coefficient. Under neutral atmospheric stability, the power law coefficient is approximately equal to 0.143, and the Equation (1) is called the 1/7 power law [30]. Although the power law is usually preferred in modeling applications because of its simplicity, it does not account for the surface roughness or for the zero plane displacement. An alternative solution is the use of the logarithmic law, especially for the description of the near ground atmosphere.
As the temperature was measured at only one height, atmospheric stability at the site could not be retrieved. We assumed that the atmosphere during Bora episodes is nearly neutrally stratified, as was also shown by several previous studies at other sites [20,22]. The logarithmic law wind speed profile used for Bora episodes is thus described as
u ( z ) = u * κ ln z d z 0 ,
where u * is the friction velocity, κ the Von Karman constant (approximately 0.41 [31]), d zero plane displacement, and z 0 the aerodynamic surface roughness length. In our case, zero-plane displacement was taken to be 0, as there are no significant flow obstacles for the incoming Bora (such as dense arrangement of high trees or buildings) in the terrain from the measuring site towards the NE (Figure 3, right). As the natural surfaces are almost never uniform and smooth, the roughness length z 0 describes the height at which the wind speed becomes zero. Approximate values of roughness lengths for various terrain types may be found in [26,29,32,33].
The parameters of both laws were obtained from a fit to experimental data. The fit was made for each 10-min averaged interval in an episode separately, and then the median and the arithmetic mean for the whole episode were calculated. Wind speed at the reference height ( z r ) was taken as the reference wind speed ( u r ). The power law coefficient α was obtained directly from the slope value of the linear fit to the logarithm of the power law,
α = ln u ( z ) / u r ln ( z / z r ) .
The roughness length ( z 0 ) and friction velocity ( u * ), which are the parameters of the logarithmic law (Equation (2)), were calculated from linear fit parameters ( y = a x + b ) to u vs. ln ( z ) as
u * = a · κ , z 0 = e b / a .

2.3. Terrain Characterization along the Upstream Bora Path

The power and logarithmic law were originally derived for homogeneous and flat terrains [34], so wind direction in complex terrain could considerably influence the parameters of these laws. As the Razdrto site is located in complex terrain, six representative Bora episodes were selected, so as to cover a a broad range of azimuth angles (between 24° and 50°), which correspond to different terrain topologies. Turbulence intensity, calculated as the ratio of standard deviation and the mean wind speed for each 10-min data interval of these episodes, was evaluated with respect to wind speed and wind direction (Figure 2, right). As no correlation between turbulence intensity and mean wind speed of Bora episodes was found, the main contribution to the variability of turbulence intensity was expected to be due to upstream terrain orography (Figure 4), with possible additional effects from vegetation coverage and the presence of other obstacles (Figure 3, right).
The orographic terrain complexity of a horizontal upstream distance of 4 km was quantitatively assessed using the variance of elevations (M) [35,36] and the rugosity index (C), calculated according to the authors of [37] as
C = 1 d / l ,
where d is the horizontal distance of the upstream path and l is the length of the elevation curve. Both parameters M and C (Figure 5) indicate that lower value of the incoming mean wind angle corresponds to greater terrain complexity.

3. Results

The distributions of power law coefficient ( α ), roughness length ( z 0 ), and friction velocity ( u * ) were obtained for each Bora episode separately, and their shapes do not differ considerably between the episodes. Cumulative distributions for the six selected Bora episodes are shown in Figure 6. Although the distributions of α and u * are Gaussian-like, the distribution of z 0 is nearly exponential. The mean characteristic values of the wind profile parameters for the Razdrto site were found to be 0.149 ± 0.055 for α and ( 0.842 ± 0.304 ) m/s for u * applying a Gaussian fit, and 0.123 m for z 0 applying an exponential fit. The obtained cumulative mean parameter values correspond to standard values for terrains with short grass and scattered trees [32], which accurately describe the terrain characteristics at Razdrto. The obtained value of power law coefficient is also comparable to the standard value of the 1/7th power law coefficient used to describe neutral atmospheric conditions [38]. The median, arithmetic mean, and strandard deviation of all parameters, as well as the quality of the fit r 2 averaged over all 10-min intervals in an episode, are listed in Table 2 for each Bora wind episode separately. Values of r 2 were found to be larger than 0.982, which indicates that both power law and logarithmic law for neutral atmosphere adequately described vertical profile of Bora mean wind speed. In the subsequent analysis, the median value of each parameter in a specific episode was used rather than arithmetic mean as median value better represented the properties of non-Gaussian-like distributions.

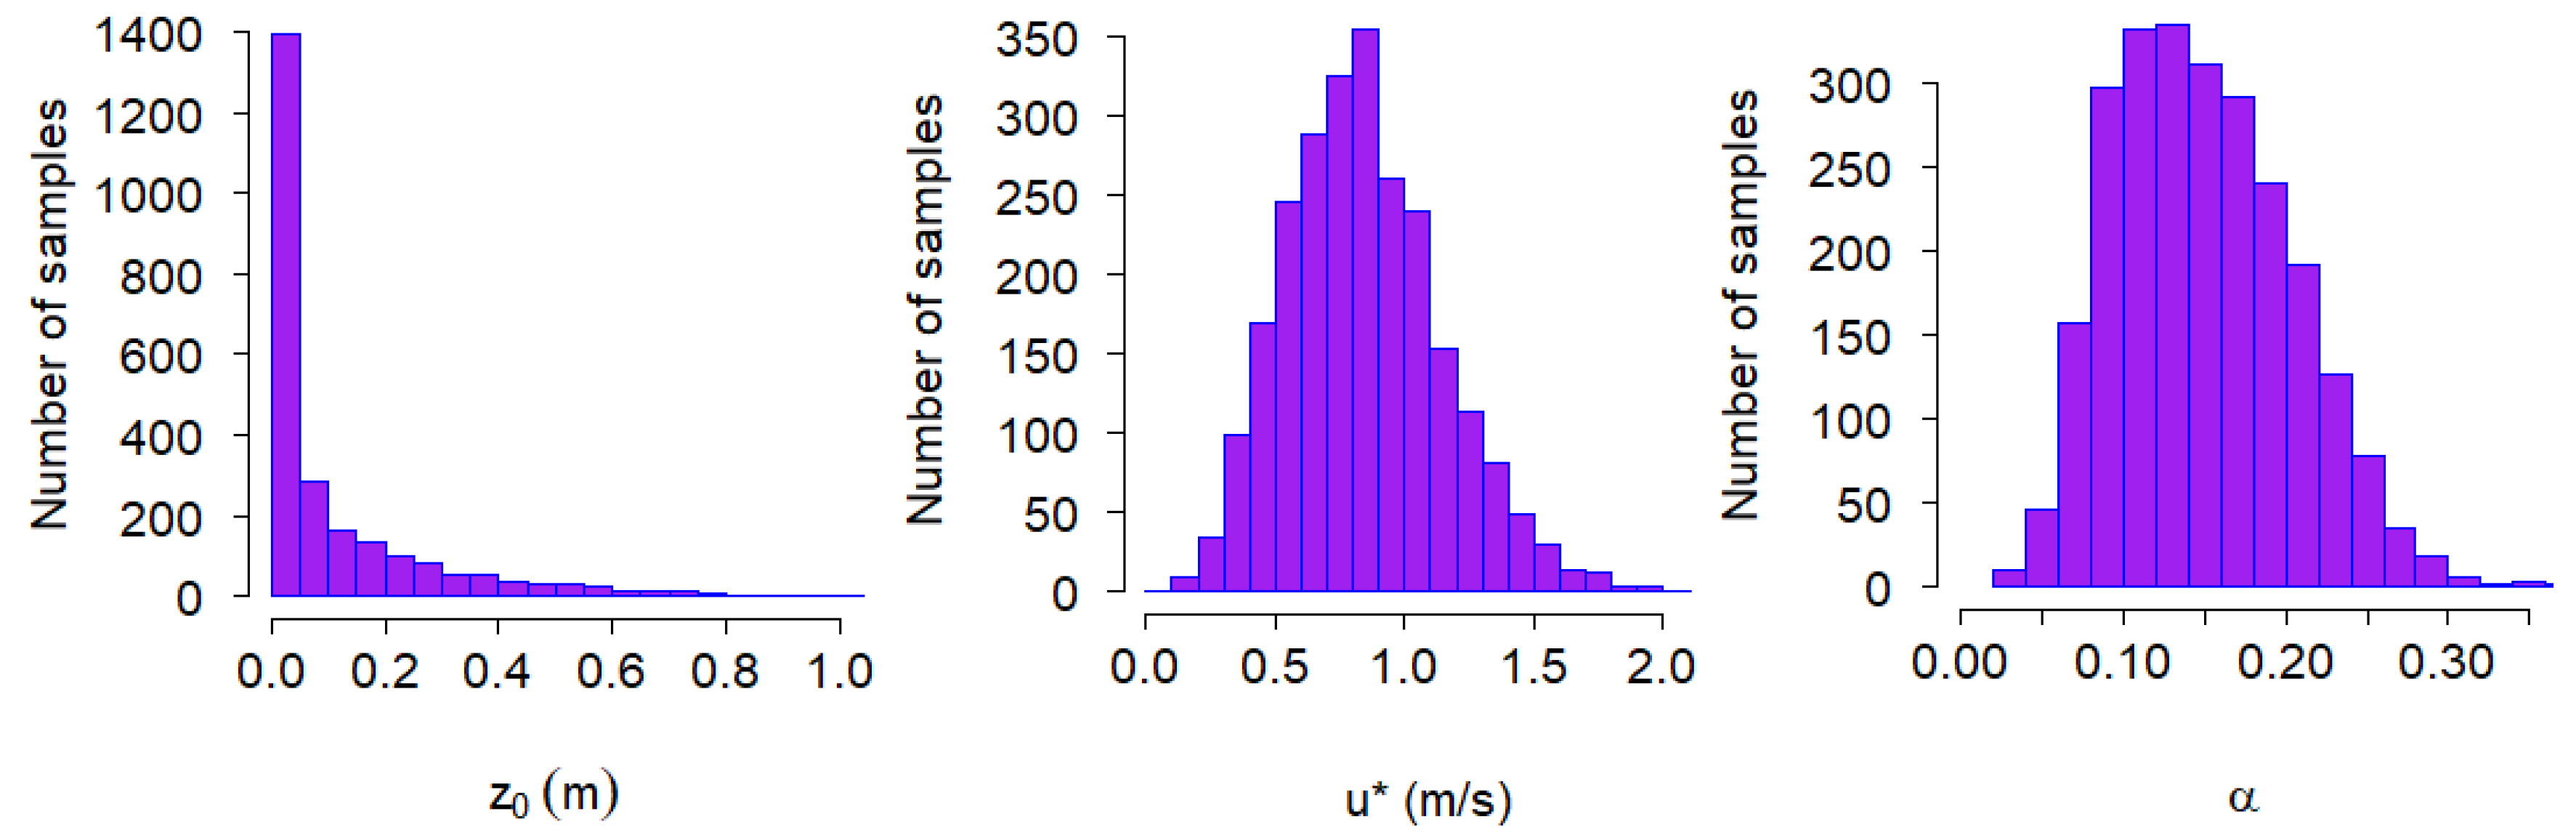
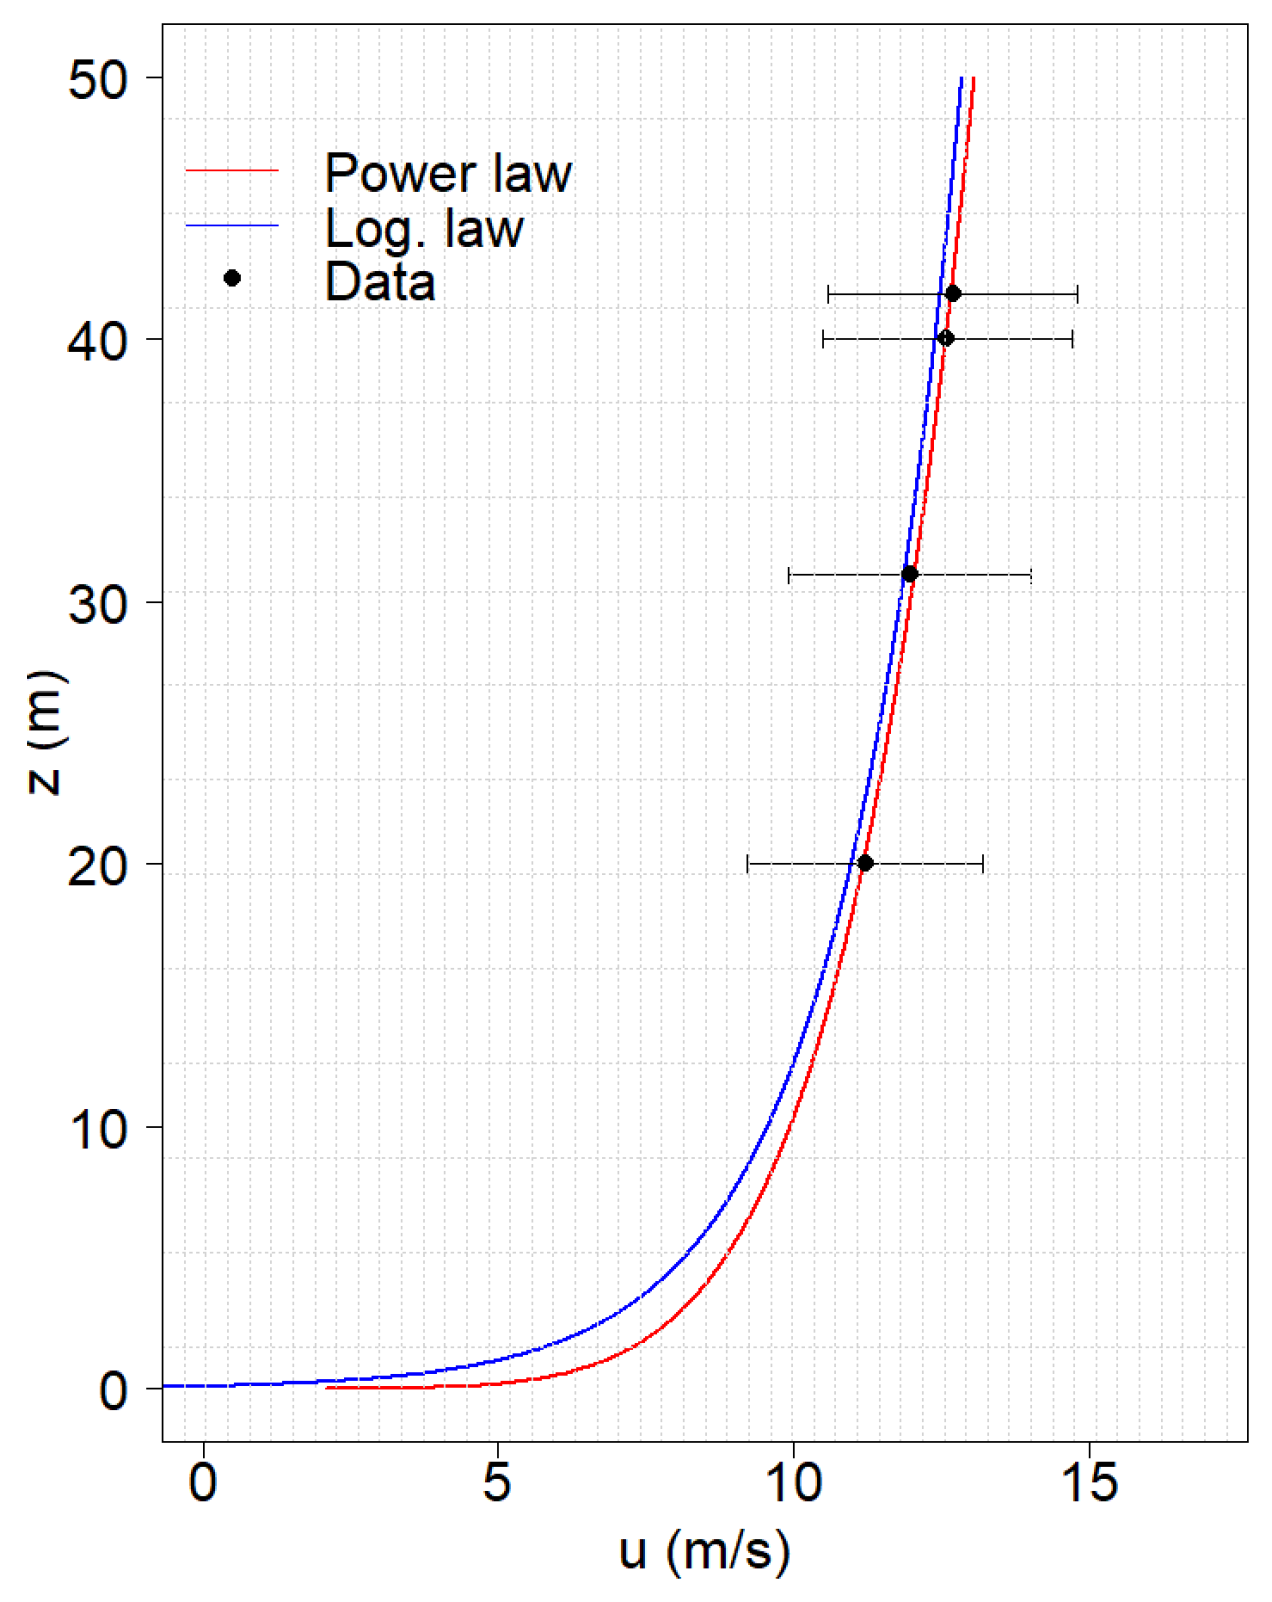
3.1. Power Law and Logarithmic Law Description of the Bora Wind Speed Profile

Based on the retrieved parameters from the fit of the logarithmic and power laws to Bora wind speed data, functional dependence of the mean vertical wind speed was calculated according to Equations (1) and (2). An example of power law and logarithmic law description of vertical wind speed profiles is shown in Figure 7, along with experimental wind data at four different heights. Both models reproduce the data very well with some disagreement at low heights (below ~20 m), which may be a consequence of the power law description not taking into account the topography of the surface.

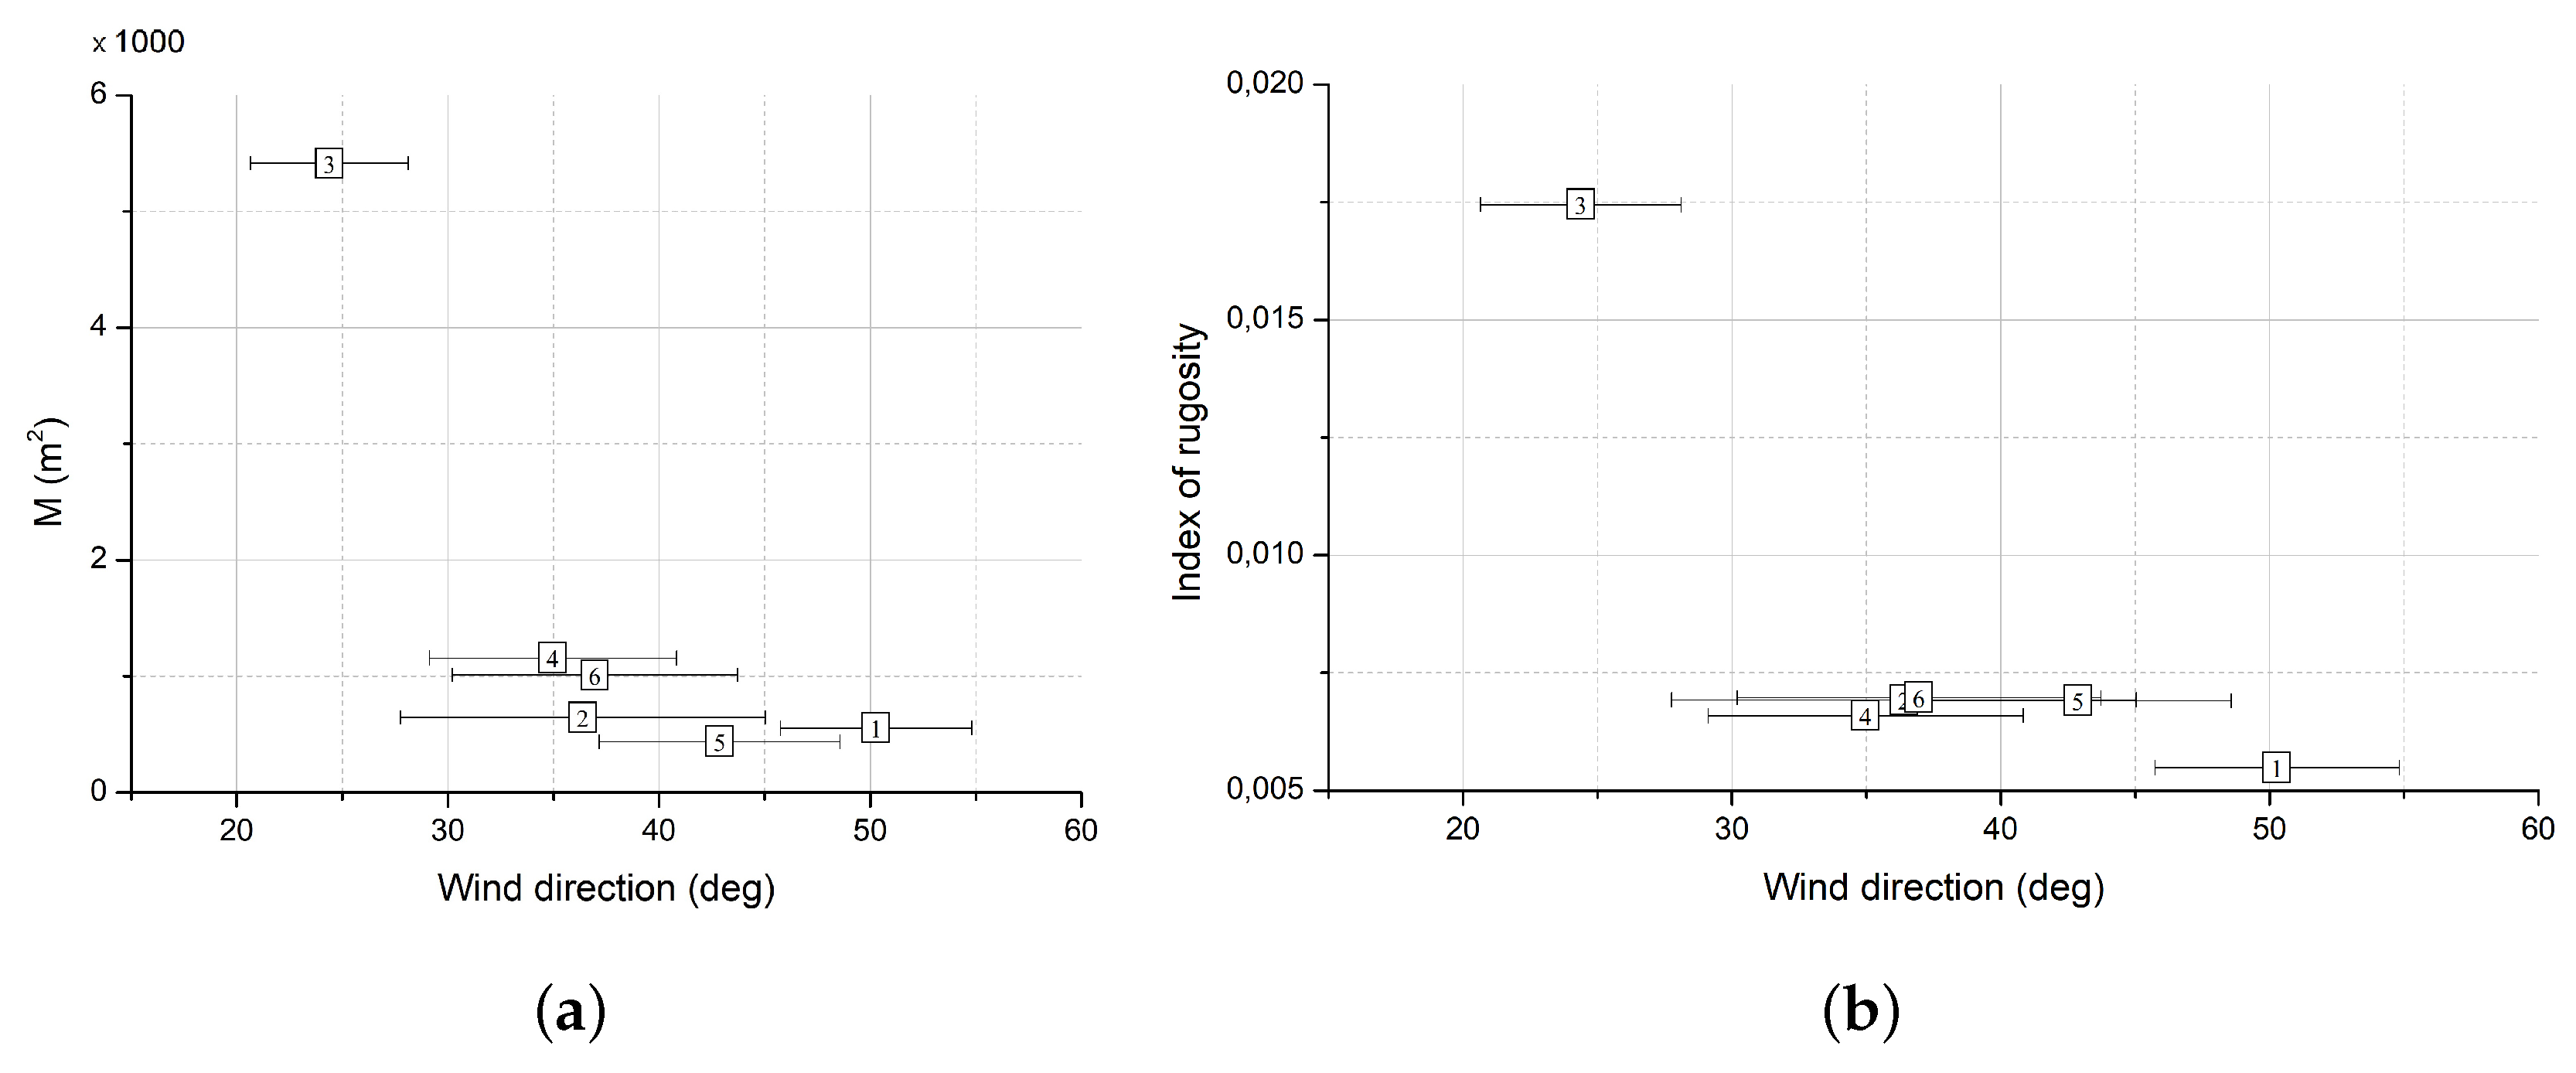
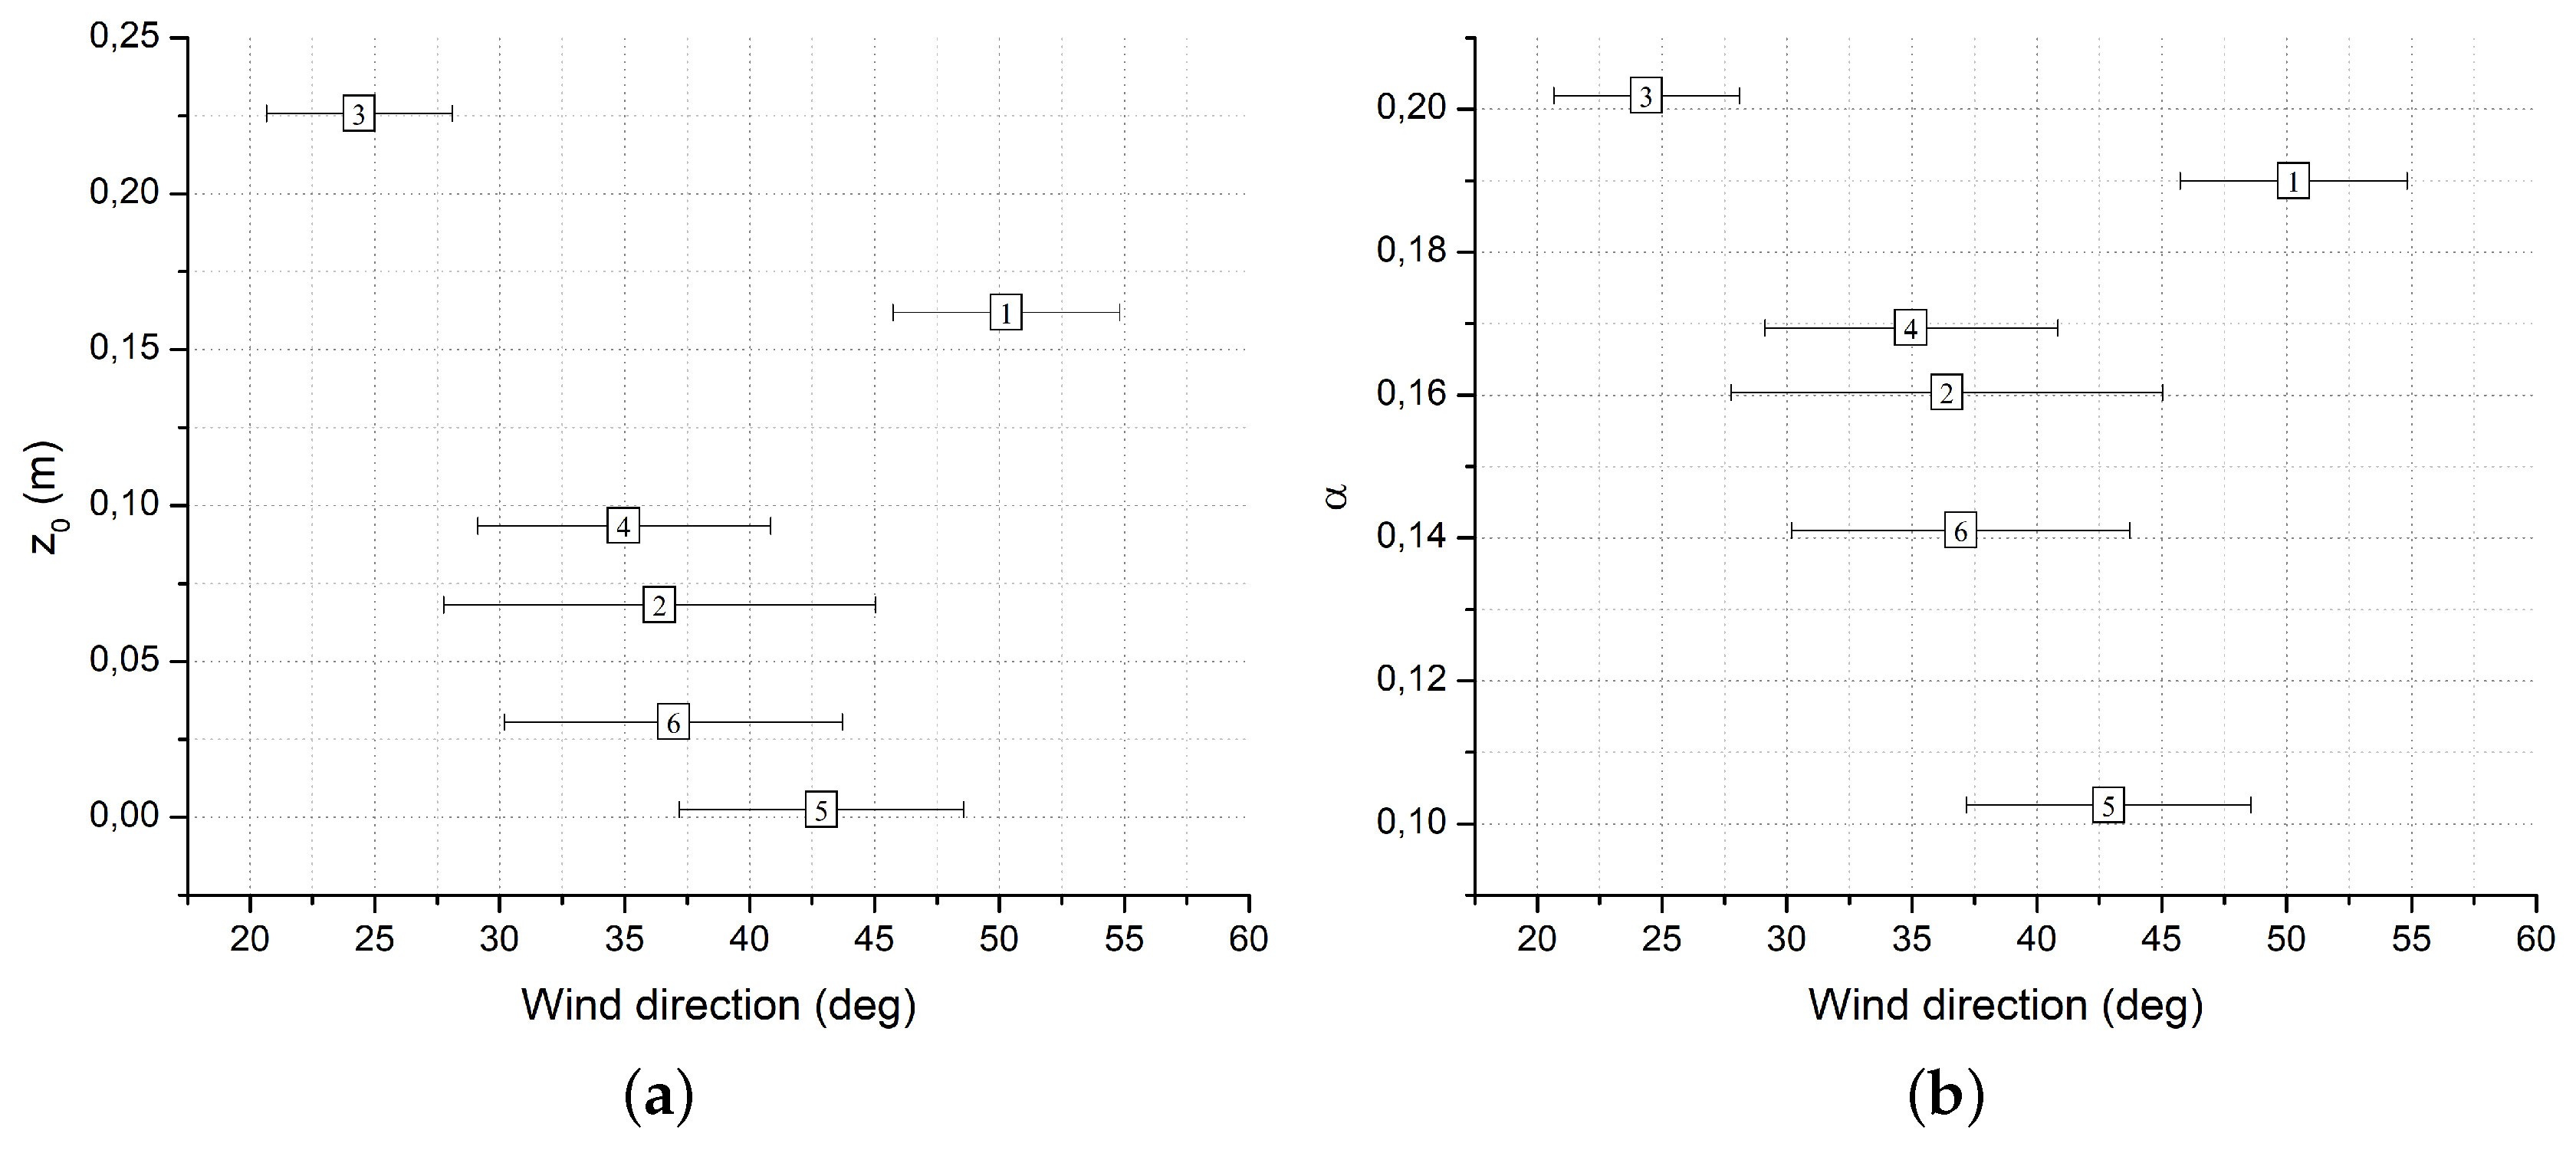
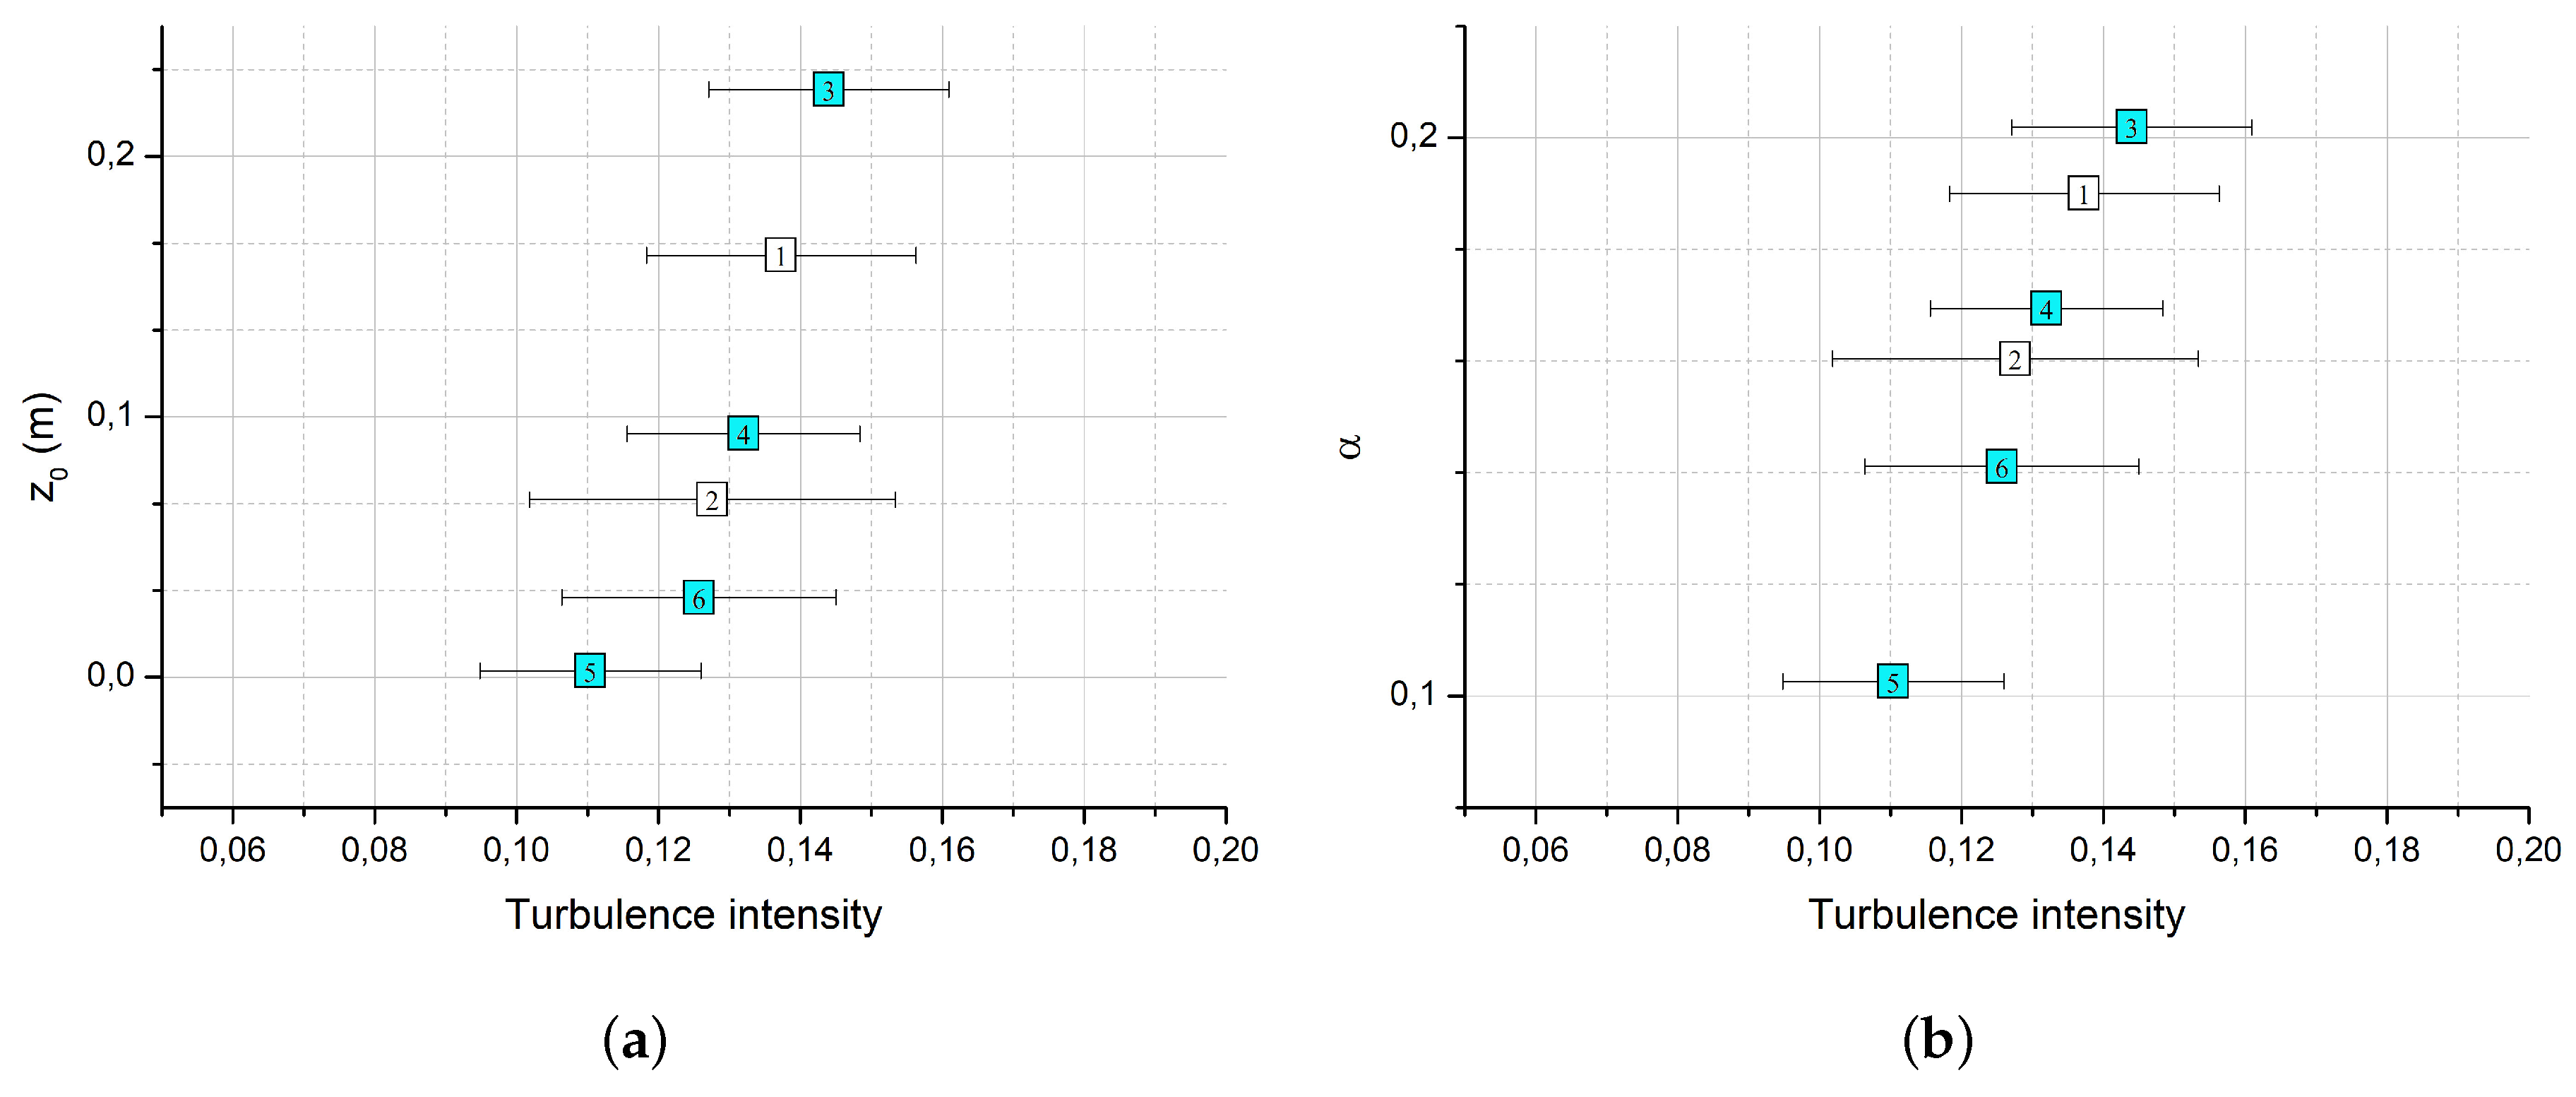
3.2. Variability of Model Parameters

The values of both the power law and logarithmic law parameters were found to vary significantly with the respect to different Bora wind episode (Table 2, Figure 8). The obtained values of surface roughness were found to range from 0.002 m to 0.226 m, values of friction velocity from 0.648 m/s to 1.109 m/s, and the values of power law coefficient from 0.103 to 0.202. According to the authors of [26,32,39], these ranges correspond to several terrain categories, from snow-covered crop stubble, to terrain with scattered trees and hedges. The observed variability may be due to various factors, such as season and time of day (which affect a number of meteorological parameters such as temperature), wind speed and direction (which is influenced by specific topography of terrain along the wind path), vegetation, the presence of other obstacles, and combinations of these [40,41].
As no correlation between wind speed and the obtained logarithmic and power law parameters was found, we investigated the impact of terrain orography, vegetation, and the presence of snow coverage. The episodes were grouped into three categories (1: high; 2; intermediate; and 3: low orographic terrain complexity) according to the index of rugosity C (Figure 5, right). The high complexity category contains the November 2010 episode; intermediate complexity contains the October 2010, December 2010, January 2011, and March 2011 episodes; and low complexity contains the May 2010 episode. Although the orographic complexity can account for high logarithmic and power law parameter values in the first category, it can not fully explain parameter variability in the second and relatively high parameter values in the third. These features may, however, be explained by turbulence intensity, which reflects all topological features of the terrain and not only the orographical ones. Logarithmic and power law parameter values were found to increase with turbulence intensity (Figure 9). Higher values of turbulence intensity may be associated with greater overall terrain complexity, which includes also the vegetation and obstacles along the upstream wind path.
The effect of vegetation was assessed using the episodes belonging to the categories of low and intermediate orographic terrain complexity, which can be characterized by scattered trees, bushes and grass along the approaching wind path. In all episodes, except in May 2010, when the grass was tall, the grass was either flattened or cut. May 2010 episode yielded the largest turbulence intensity and logarithmic and power law parameters out of all the episodes used in the assessment, which may be explained by the tall grass coverage in that season.
The effect of snow coverage was assessed using the episodes belonging to the category of intermediate orographic terrain complexity, where snow was present in all episodes, except the one in October 2010 [42]. The episode in January 2011, which had the lowest value of turbulence intensity, was the only one to yield roughness parameter comparable to its standard value for snow-covered surface [32]. Logarithmic and power law parameter values for the other three episodes with higher turbulence intensity were found to be higher than those for January. No differentiation between cases with and without snow coverage could be made (Figure 9), indicating that the effect of snow coverage was insufficient to describe the parameter variability.

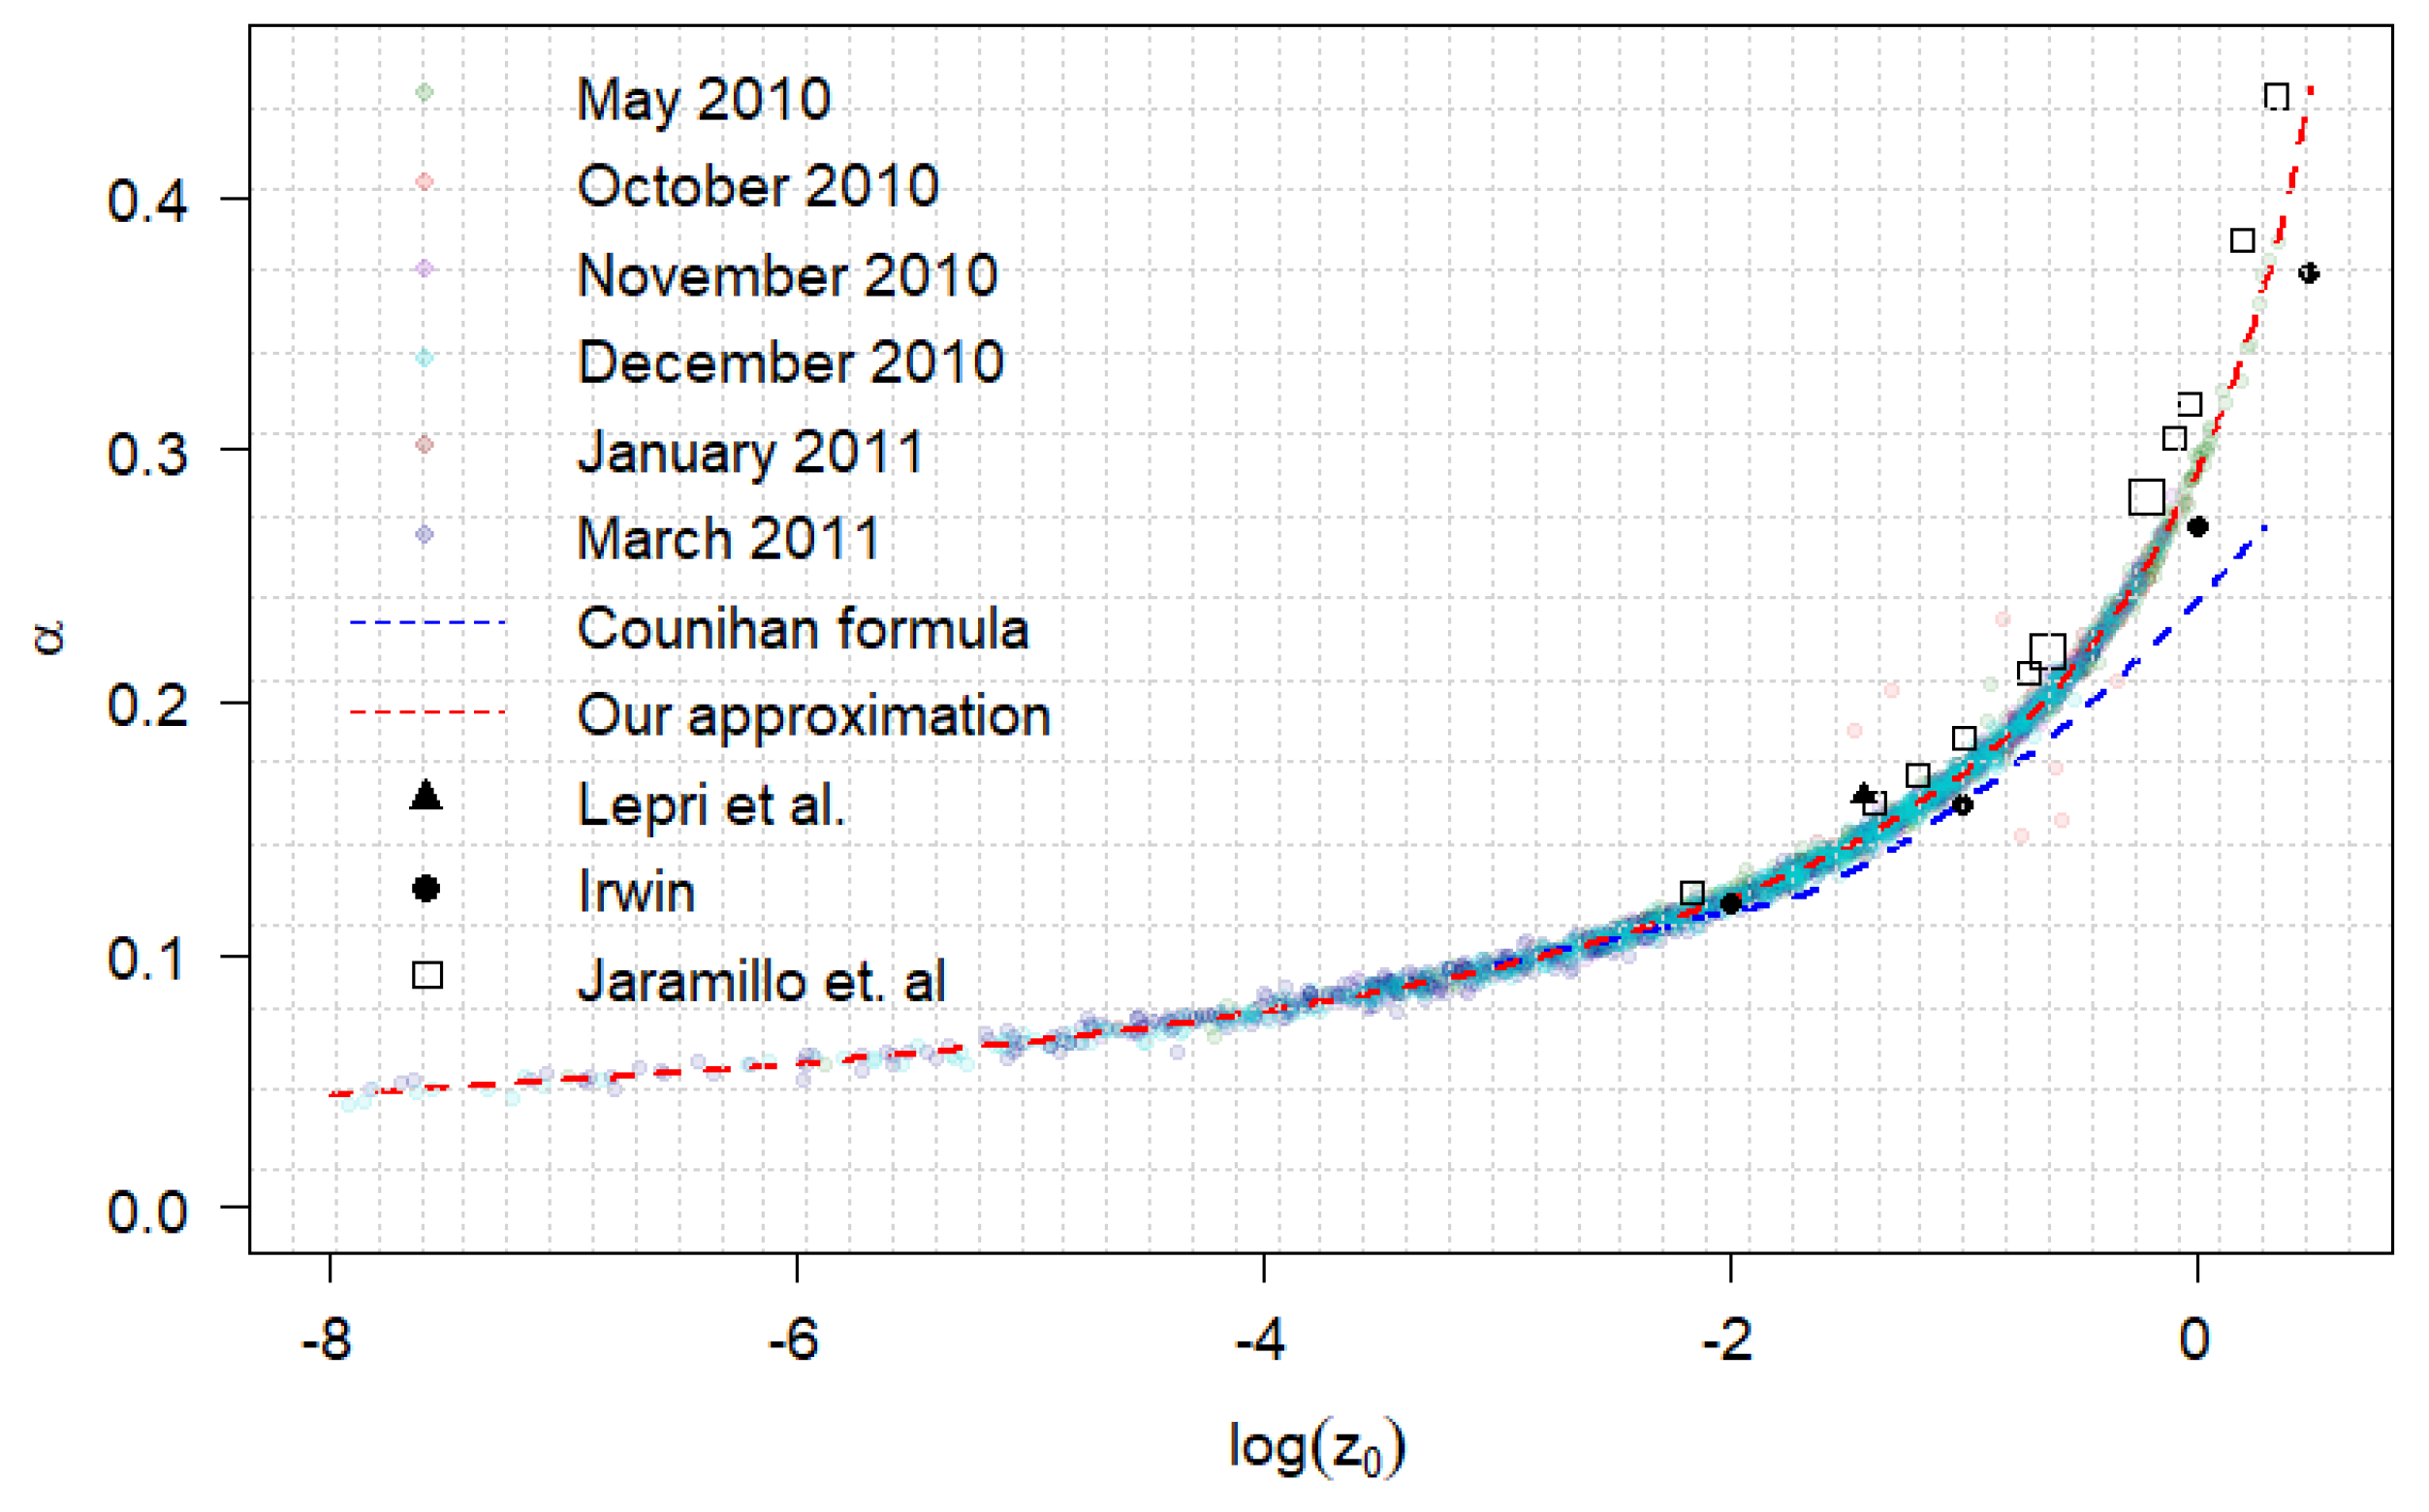
3.3. Relationships between Power Law and Logarithmic Law Coefficients

As power law coefficient is known to depend on terrain roughness [32], we investigated the relationship between power law coefficient and roughness length obtained from our data. One of the standard relations between the two parameters [43], for roughness length in the range 0.001 m < z 0 < 5 m , is
α = 0.096 ( log z 0 ) + 0.016 ( log z 0 ) 2 + 0.24 .
The relationship between the power law coefficient and roughness length obtained experimentally in our study is shown in Figure 10. Relation (3) agrees well with data for z 0 < 0.1 , but for higher values a considerable underestimation can be observed.
The data was found to be described accurately throughout the entire parameter range using the relation
α = a 1 + b log ( z 0 ) ,
which, in comparison to Equation (3), uses only two parameters instead of three. In our case, the parameter a = 0.29079 and b = −0.69019. To investigate a more general validity of this relation, the roughness length and power law exponent data obtained at various other sites [22,40,44] were also checked. As it was found to be in good agreement with our results (Figure 10), the parametrization of Equation (4) may be used for determining the terrain roughness length in neutrally stable atmosphere conditions not only at Razdrto, but also at other locations.
We also investigated the relation between the friction velocity, u * , and the surface roughness, z 0 , which is expected to be exponential for constant wind speeds (Equation (2)). The fit to the data using
z 0 = a · e b / u * ,
yielded different values ot the fitting parameters a and b for each Bora episode, and the approximate value of r 2 of the fit was ~0.5. An example of exponential fit to October 2010 Bora episode is shown in Figure 11, where a and b are equal to 25.36 and 5.12 , respectively, and r 2 = 0.5779 . We expect that poor relation between u * and z 0 is due to the dependence of the fitting parameter b on wind speed, which varies during each Bora episode.

4. Conclusions

In this study, an analysis of the Bora mean wind speed profile was given for specific region in Southwest Slovenia, which is strongly affected by Bora. The wind profile laws commonly used in CWE—the power law and the logarithmic law for neutral stability of the atmosphere—were investigated based on the available wind data at four different heights: 20 m, 31 m, 40 m, and 41.7 m above the ground level. Both power law and logarithmic law were found to fit the Bora mean wind speed profile very well, with the mean coefficient of determination greater than 0.98. These results, which agree with previous findings at other Bora affected sites [20,22], imply that both laws may be used as appropriate approximations for mean Bora profile in CWE models.
The parameters of both laws were found to vary significantly between different Bora events (surface roughness varies from 0.002 m to 0.226 m), so the usual practice of adopting constant values of power and logarithmic law parameters for computational wind engineering may in our case not be the most accurate choice. Parameter variability can be accounted for by different mean angle of the approaching wind (different topography of terrain along the path of Bora, which varied from 24° to 50°), and different terrain conditions during different seasons (grass coverage or snow coverage). It was found that variability of orography in combination with vegetation has a strong impact on the obtained parameters, however the effect of snow coverage was not possible to confirm.
If considering the whole dataset of Bora episodes, the mean value of the power law coefficient was found to be 0.149 ± 0.055 , which is consistent with standard value for neutral atmosphere of 0.143 [38] and describes the terrain covered by short grass [32]. The mean value of roughness length obtained from exponential fit to the distribution of all Bora events was found to be 0.123 m, which corresponds to terrain covered by scattered arrangement of trees [32]. Both values describe well the terrain surrounding the study site and may be used as reference parameters for modeling purposes. The variability of the power law and logarithmic law parameters suggests that they should be estimated carefully for more accurate modeling of realistic sites in complex terrain, taking into account different approaching wind directions. A functional relation with only two free parameters, which provides a better description of the relation between the power law and logarithmic law parameters in neutrally stratified atmosphere than Counihan’s formula, may be useful for the determination of surface roughnes parameter from wind speed measurements at two heights in the future.

Author Contributions

All authors made contributions to this research work and manuscript. In addition to manuscript preparation, M.B. contributed to data analysis, S.S. and K.B. contributed to research design, and B.S. contributed to the mezoscale modeling of Bora.

Funding

This research was funded by the Slovenian Research Agency (grant number P1-0385) and its Young Researcher program.

Acknowledgments

We acknowledge Aleš Pučnik and his company “Helikopter energija”, Postojna, Slovenija, for providing the raw wind data.

Conflicts of Interest

The authors declare no conflict of interest.

References

  1. Jurčec, V. On mesoscale characteristics of Bora conditions in Yugoslavia. In Weather and Weather Maps; Springer: Birkhäuser, Basel, 1981; pp. 640–657. [Google Scholar]
  2. Petkovšek, Z. Main Bora gusts–a model explanation. Geofizika 1987, 4, 41–50. [Google Scholar]
  3. Belušić, D.; Hrastinski, M.; Večenaj, Ž.; Grisogono, B. Wind regimes associated with a mountain gap at the northeastern Adriatic coast. J. Appl. Meteorol. Climatol. 2013, 52, 2089–2105. [Google Scholar] [CrossRef]
  4. Belusić, D.; Bencetić Klaić, Z. Mesoscale dynamics, structure and predictability of a severe Adriatic Bora case. Meteorol. Z. 2006, 15, 157–168. [Google Scholar] [CrossRef]
  5. Mole, M.; Wang, L.; Stanič, S.; Bergant, K.; Eichinger, W.E.; Ocaña, F.; Strajnar, B.; Škraba, P.; Vučković, M.; Willis, W.B. Lidar measurements of Bora wind effects on aerosol loading. J. Quant. Spectrosc. Radiat. Transf. 2017, 188, 39–45. [Google Scholar] [CrossRef]
  6. Pristov, N.; Petkovšek, Z.; Zaveršek, J. Some characteristics of Bora and its beginnings in Slovenia. Razprave 1989, 30, 37–52. [Google Scholar]
  7. Defant, F. Local winds. In Compendium of Meteorology; Springer: Boston, MA, USA, 1951; pp. 655–672. [Google Scholar]
  8. Henin, R. Dynamics of Bora Wind Over the Adriatic Sea: Atmospheric Water Balance and Role of Air-Sea Fluxes and Orography. Ph.D. Thesis, University of Bologna, Bologna, Italy, 2015. [Google Scholar]
  9. Grisogono, B.; Belusšić, D. A review of recent advances in understanding the mesoand microscale properties of the severe Bora wind. Tellus Dyn. Meteorol. Oceanogr. 2009, 61, 1–16. [Google Scholar] [CrossRef]
  10. Jurčec, V. The Adriatic frontal Bora type. Hrvat. Meteoroloski Cas. 1988, 23, 13–25. [Google Scholar]
  11. Petkovšek, Z. Burja v Sloveniji in nekoliko južneje. In Pol Stoletja Slovenskega Meteorološkega Društva; Bulletin of Slovenian Meteorological Society: Ljubljana, Slovenia, 2004; pp. 251–268. Available online: http://www.meteo-drustvo.si/zgodovina/pol-stoletja-smd/50let-publikacija/ (accessed on 20 May 2019).
  12. Yoshino, M. Local wind Bora; University of Tokyo Press: Tokyo, Japan, 1976. [Google Scholar]
  13. Smith, R.B. Aerial observations of the Yugoslavian Bora. J. Atmos. Sci. 1987, 44, 269–297. [Google Scholar] [CrossRef]
  14. Klemp, J.; Durran, D. Numerical modelling of Bora winds Numerische Modellierung der Bora. Meteorol. Atmos. Phys. 1987, 36, 215–227. [Google Scholar] [CrossRef]
  15. Smith, R.B. On severe downslope winds. J. Atmos. Sci. 1985, 42, 2597–2603. [Google Scholar] [CrossRef]
  16. Smith, R.B.; Sun, J. Generalized hydraulic solutions pertaining to severe downslope winds. J. Atmos. Sci. 1987, 44, 2934–2939. [Google Scholar] [CrossRef]
  17. Belušić, D.; Bencetić Klaić, Z. Estimation of Bora wind gusts using a limited area model. Tellus Dyn. Meteorol. Oceanogr. 2004, 56, 296–307. [Google Scholar] [CrossRef]
  18. Efimov, V.; Barabanov, V. Simulation of Bora in Novorossiysk. Russ. Meteorol. Hydrol. 2013, 38, 171–176. [Google Scholar] [CrossRef]
  19. Ivančan-Picek, B.; Ivatek-Šahdan, S.; Grubišić, V. Vertical structure of the Dinaric Alps flow during MAP IOP 15. Hrvat. Meteoroloski Cas. 2005, 40, 176–179. [Google Scholar]
  20. Šoljan, V.; Belušić, A.; Šarović, K.; Nimac, I.; Brzaj, S.; Suhin, J.; Belavić, M.; Večenaj, Ž.; Grisogono, B. Micro-Scale Properties of Different Bora Types. Atmosphere 2018, 9, 116. [Google Scholar] [CrossRef]
  21. Belušić, D.; Pasarić, M.; Orlić, M. Quasi-periodic Bora gusts related to the structure of the troposphere. QJR Meteorol. Soc. 2004, 130, 1103–1121. [Google Scholar] [CrossRef]
  22. Lepri, P.; Kozmar, H.; Večenaj, Ž.; Grisogono, B. A summertime near-ground velocity profile of the Bora wind. Wind Struct. 2014, 19, 505–522. [Google Scholar] [CrossRef]
  23. Lepri, P.; Večenaj, Ž.; Kozmar, H.; Grisogono, B. Near-ground turbulence of the Bora wind in summertime. J. Wind. Eng. Ind. Aerodyn. 2015, 147, 345–357. [Google Scholar] [CrossRef] [Green Version]
  24. Lepri, P.; Vecenaj, Z.; Kozmar, H.; Grisogono, B. Bora wind characteristics for engineering applications. Wind Struct. 2017, 24, 579–611. [Google Scholar]
  25. Flay, R.; Stevenson, D. Integral length scales in strong winds below 20 m. J. Wind. Eng. Ind. Aerodyn. 1988, 28, 21–30. [Google Scholar] [CrossRef]
  26. EN 1991–1–4:2005 (sl) Evrokod 1: Vplivi na Konstrukcije—1-4.del: Splošni Vplivi—Vplivi Vetra. Available online: https://www.gzs.si/zbornica_gradbenistva_in_industrije_gradbenega_materiala/vsebina/Gradbeni-standardi/Evrokodi-evropski-standardi (accessed on 8 August 2019).
  27. ALADIN: High Resolution Numerical Weather Prediction Project. Available online: http://www.umr-cnrm.fr/aladin/ (accessed on 19 September 2019).
  28. Slovenian Environment Agency: Monthly Bulletin. Available online: https://www.arso.gov.si/o%20agenciji/knji%c5%benica/mese%c4%8dni%20bilten/ (accessed on 20 May 2019).
  29. Holmes, J.D. Wind Loading of Structures; CRC Press: Boca Raton, FL, USA, 2015. [Google Scholar]
  30. Hsu, S.; Meindl, E.A.; Gilhousen, D.B. Determining the power-law wind-profile exponent under near-neutral stability conditions at sea. J. Appl. Meteorol. 1994, 33, 757–765. [Google Scholar] [CrossRef]
  31. Hughes, R.L. A mathematical determination of von Karman’s constant, K. J. Hydraul. Res. 2007, 45, 563–566. [Google Scholar] [CrossRef]
  32. Gipe, P. Wind Power: Renewable Energy for Home, Farm, and Business; Chelsea Green Publishing Company: White River Junction, VT, USA, 2004. [Google Scholar]
  33. Burton, T.; Sharpe, D.; Jenkins, N. Handbook of Wind Energy; John Wiley & Sons: Hoboken, NJ, USA, 2001. [Google Scholar]
  34. Manwell, J.F.; McGowan, J.G.; Rogers, A.L. Wind Energy Explained: Theory, Design and Application; John Wiley & Sons: Chichester, UK, 2010. [Google Scholar]
  35. Lu, H.; Liu, X.; Bian, L. Terrain complexity: Definition, index, and DEM resolution. Proc. SPIE 2007, 6753, 675323. [Google Scholar]
  36. Hoffman, R.; Krotkov, E. Terrain roughness measurement from elevation maps. Mob. Robot. Int. Soc. Opt. Photonics 1990, 1195, 104–114. [Google Scholar]
  37. Fuad, M.A.Z. Coral Reef Rugosity and Coral Biodiversity; Bunaken National Park: North Sulawesi, Indonesia, 2010. [Google Scholar]
  38. Touma, J.S. Dependence of the wind profile power law on stability for various locations. J. Air Pollut. Control. Assoc. 1977, 27, 863–866. [Google Scholar] [CrossRef]
  39. Bechrakis, D.; Sparis, P. Simulation of the wind speed at different heights using artificial neural networks. Wind Eng. 2000, 24, 127–136. [Google Scholar] [CrossRef]
  40. Irwin, J.S. A theoretical variation of the wind profile power-law exponent as a function of surface roughness and stability. Atmos. Environ. 1979, 13, 191–194. [Google Scholar] [CrossRef]
  41. Petersen, E.L.; Mortensen, N.G.; Landberg, L.; Højstrup, J.; Frank, H.P. Wind power meteorology. Part I: Climate and turbulence. Int. J. Prog. Appl. Wind. Power Convers. Technol. 1998, 1, 25–45. [Google Scholar]
  42. Slovenian Environment Agency: Archive of the Observed and Measured Meteorological Data for Slovenia. Available online: http://meteo.arso.gov.si/met/sl/archive/ (accessed on 20 May 2019).
  43. Counihan, J. Adiabatic atmospheric boundary layers: A review and analysis of data from the period 1880–1972. Atmos. Environ. 1975, 9, 871–905. [Google Scholar] [CrossRef]
  44. Jaramillo, O.; Borja, M. Bimodal versus Weibull wind speed distributions: An analysis of wind energy potential in La Venta, Mexico. Wind Eng. 2004, 28, 225–234. [Google Scholar] [CrossRef]
Figure 1. Left: ALADIN [27] mesoscale numerical model results for Bora event in January 2011 reveal the regions affected by Bora and its predominant wind direction. Right: The measurement site at Razdrto, Slovenia (600 m a.s.l.), marked by a red circle, is located in a gap between the Nanos plateu (1262 m) to the North and Goli vrh (710 m) to the south. The wind rose based on one year wind data (April 2010–May 2011) reveals two prevailing wind directions (SW and NE). Green arrows represent the direction of Bora.
Atmosphere 10 00601 g001
Figure 2. Mean wind direction with respect to different Bora episodes (left). Six out of these, marked with red circles, were used as representative cases, and their average turbulence intensity is found to vary with wind direction (right).
Atmosphere 10 00601 g002
Figure 3. The elevation map (left) and terrain at measurement site and its surroundings (right). The measurement site is marked by red circle, and the mean wind directions of each Bora episode are marked by white arrows with different line types.
Atmosphere 10 00601 g003
Figure 4. Upstream terrain elevation profiles along the mean Bora wind direction towards the measurement site for the selected Bora episodes.
Atmosphere 10 00601 g004
Figure 5. The complexity of terrain with the regards to different Bora mean wind direction, expressed by simple microrelief factor M [36] (a) and the index of rugosity [37] (b) for different Bora episodes: (1) May 2010, (2) October 2010, (3) November 2010, (4) December 2010, (5) January 2011 and (6) March 2011.
Atmosphere 10 00601 g005
Figure 6. Distributions of the roughness length z 0 (left), friction velocity u * (middle), and power law coefficient α (right) throughout all six investigated Bora episodes. Although the distributions of the power law coefficient and friction velocity are Gaussian-like, with means of 0.149 and 0.842 m/s, the distribution of the aerodynamic roughness length is nearly exponential with rate parameter λ = 8.161 and mean value 0.123 m.
Atmosphere 10 00601 g006
Figure 7. Comparison of the power law and logarithmic law description of vertical wind speed profiles for the whole Bora wind episode in December 2010. Both models reproduce the data very well, with some disagreement at low heights. Wind speed data measured at different heights is correlated with a correlation coefficient close to 1.
Atmosphere 10 00601 g007
Figure 8. Median values of roughness length (a) and power law coefficient (b) for different Bora episodes: (1) May 2010, (2) October 2010, (3) November 2010, (4) December 2010, (5) January 2011, and (6) March 2011.
Atmosphere 10 00601 g008
Figure 9. Median values of roughness length (a) and power law coefficient (b) with respect to mean turbulence intensity of different Bora episodes: (1) May 2010, (2) October 2010, (3) November 2010, (4) December 2010, (5) January 2011, and (6) March 2011. The episodes with the presence of snow are colored in light blue.
Atmosphere 10 00601 g009
Figure 10. Relationship between power law exponent and roughness length parameters of all Bora episodes. Each dot, for each Bora episode, represents logarithm of roughness length versus power law exponent, obtained by fitting method for the same 10-min averaged interval. The relation obtained in this study is compared to Counihan formula given in Equation (3), as well as to results of other investigations of these parameters [22,40,44].
Atmosphere 10 00601 g010
Figure 11. Surface roughness length z 0 as a function of friction velocity u * for six Bora episodes. Each point represents a 10-min averaged time interval. Intervals from the same episode have the same color. The curve represents exponential fit to the October 2010 Bora episode.
Atmosphere 10 00601 g011
Table 1. Selected Bora episodes at Razdrto between April 2010 and May 2011 and their characteristics.
Bora EventMay 2010October 2010November 2010
Date15 May 201025 October 2010–29 October 201028 November 2010–29 November 2010
Duration (h)15.00 87.67 16.34 
Wind direction (°)50.28 ± 4.54 36.39 ± 8.64 24.38 ± 3.73 
Wind speed (m/s)11.14 ± 2.12 13.03 ±2.42 12.21 ± 2.56 
Min. wind speed (m/s)7.21 7.51 7.23 
Max. wind speed (m/s)15.18 18.62 16.88 
Bora EventDecember 2010January 2011March 2011
Date25 December 2010–27 December 201020 January 2011–23 January 201127 February 2011–6 March 2011
Duration (h)49.00 88.84 158.17 
Wind direction (°)34.97 ± 5.85 42.87±5.70 36.95 ± 6.76 
Wind speed (m/s)11.21 ± 1.99 14.41 ± 3.12 13.18 ± 3.77 
Min. wind speed (m/s)7.19 7.31 7.22 
Max. wind speed (m/s)15.79 21.10 25.25 
Table 2. Values of the power law and logarithmic law fit parameters for 6 Bora episodes in 2010–2011. The median and arithmetic mean values of the power law coefficient ( α ), roughness length ( z 0 ) and friction velocity ( u * ) are given for all Bora episodes, along with the standard deviation and the mean values of r 2 .
α May 2010October 2010November 2010December 2010January 2011March 2011
Median0.189 0.160 0.202 0.169 0.103 0.141 
Arithmetic mean0.185 0.173 0.200 0.166 0.113 0.143 
Standard deviation0.049 0.061 0.033 0.047 0.041 0.048 
r 2 0.997 0.997 0.997 0.997 0.994 0.995 
z 0 (m)May 2010October 2010November 2010December 2010January 2011March 2011
Median0.162 0.068 0.226 0.093 0.002 0.031 
Arithmetic mean0.224 0.221 0.260 0.146 0.034 0.087 
Standard deviation0.226 0.337 0.177 0.160 0.081 0.130 
r 2 0.989 0.998 0.989 0.987 0.982 0.985 
u * (m/s)May 2010October 2010November 2010December 2010January 2011March 2011
Median0.879 0.945 1.109 0.839 0.648 0.804 
Arithmetic mean0.911 0.739 1.114 0.823 0.704 0.819 
Standard deviation0.265 0.283 0.305 0.232 0.283 0.303 
r 2 0.989 0.998 0.989 0.987 0.982 0.985 

