Article

Topographic Effects on Titan’s Dune-Forming Winds

by
Erik J. L. Larson
1,2
1
Department of Atmospheric and Oceanic Sciences, University of Colorado, Boulder, CO 80309, USA
2
Now at Department of Organismic and Evolutionary Biology, Harvard University, Cambridge, MA 02138, USA
Atmosphere 2019, 10(10), 600; https://doi.org/10.3390/atmos10100600
Submission received: 16 August 2019 / Revised: 25 September 2019 / Accepted: 1 October 2019 / Published: 3 October 2019
(This article belongs to the Special Issue Modeling and Simulation of Planetary Atmospheres)

Abstract

:
The Cassini mission made an unexpected discovery when it found evidence of linear dune fields on Titan’s surface. The orientation of the dunes and their interaction with topography allow scientists to estimate the dominant wind direction on the surface of Titan. There is some consensus in the community that the dune-forming winds must be net westerly, however, there is an active debate about the dune-forming wind regime. This debate has been guided by several studies of Earth dune fields considered analogous to the Titan dunes including those in Namibia, the Sahara, the Serengeti, and China. Complicating this active debate about the surface wind regime is the fact that global circulation models (GCMs) have historically not been able to reproduce westerly surface winds in the tropics. Here we use the Titan Community Atmosphere Model (CAM) to quantify the impact of topography and an added torque on Titan’s dune-forming winds. Dunes tend to form at higher elevations on Titan, and adding topography to the model alters the near-surface wind directions, making them more westerly and consistent with the dune orientations. The addition of topography and added torque create a wind regime that is consistent with linear dunes in areas of stabilized sediment.

1. Introduction

The Cassini mission made an unexpected discovery when it found evidence of linear dune fields on Titan’s surface [1,2]. The radar dark dunes have a mostly tropical distribution between +/−30° latitude that extends to all longitudes. Cassini has imaged thousands of dunes throughout its mission, many of which are observed to divert around topography. The crestline orientations of the dunes and their interaction with topography allow scientists to estimate the dominant wind direction on the surface of Titan. There is some consensus in the community that the dune-forming winds produce an eastward net transport, and are therefore predominantly westerly (West to East) [1,2,3,4,5,6].
The Titan surface wind regimes that have been proposed, mostly based on studies of morphologically similar Earth dune fields, are as follows: westerly winds with a fluctuating tidal component [1], bimodal (coming from two directions) westerly [2], bimodal easterly [5], unimodal westerly [4], bimodal and slightly westerly [6], and both unimodal and bimodal westerly winds [7]. Titan’s dunes have been proposed to be longitudinal, which only form in a specific type of wind regime with bimodal winds having roughly equal magnitudes and divergence angles of greater than 90° [8]. In which case, some of these theories are in conflict with maximum gross bedform-normal transport theory (MGBNT) for the alignment in a given wind regime [9,10]. It is not certain that Titan’s dunes are longitudinal, however, and there are other ways to form linear dunes. For example, in areas with stabilized sediment, linear dunes form downwind of the sediment source [4].
There is an active debate about the dune-forming wind regimes. This debate has been guided by several studies of Earth dune fields considered analogous to the Titan dunes including those in Namibia, the Sahara, the Serengeti, and China [1,2,4]. The linear dunes have been considered analogs to Namibian dunes due to morphological similarities [2]. The presence and morphology of these dunes can aid our understanding of the dune-forming winds on Titan. Complicating this active debate about the surface wind regime is the fact that global circulation models (GCMs) have historically not been able to reproduce westerly (prograde) surface winds in the tropics [5,11,12,13,14].
Several GCMs have offered detailed results of the surface wind patterns and how they relate to the dunes across different orbital periods [5,6,15]. There are currently three leading hypotheses that overcome the apparent discrepancy between GCM surface winds and dune orientations. First, one GCM found that despite predominantly easterly winds near equinox, there is a brief period of fast westerlies [6]. The usual surface winds in this GCM are easterly and usually around 1 m/s, however near equinox there are strong westerly winds of a slightly higher magnitude, 1.5 m/s. Although westerly winds are rare, their increased velocity allows them to carry sand grains while the weaker easterly winds cannot, thus building the dunes [6]. This is based on the principle that the potential saltation flux is proportional to the cube of friction velocity, thus the sand flux is very sensitive to the wind strength [16,17]. Other studies suggested that Titan’s dunes form over orbital time scales and may not be in equilibrium with the current wind regime [15,18]. Finally, there is a hypothesis that gust fronts from convective storms drive dune formation [19].
In this paper we present results from the Titan Community Atmosphere Model (CAM) GCM that includes the effects of topography and zonal nudging. We show that these model additions can change our simulated surface wind pattern, creating large areas with westerlies in the tropics that are more consistent with dune formation theories.

2. Description of the Model

In this study we use the Titan CAM model which is based on NCAR’s Community Atmospheres Model (CAM v.3) [11,12]. We run the model at 4 × 5° resolution. This GCM uses a finite volume scheme and two stream radiative transfer. In this study we run simulations with two variations to the Titan CAM model; topography and a zonal wind torque term.
The topographic map, generated by the Cassini radar team, was reduced to 4 × 5° resolution and incorporated into our model [20]. Since these simulations were carried out, an updated version of the topographic map was published [21]. The most notable updates include higher coverage at the poles, improved fits to the global shape, and finer resolution of interpolation. The higher polar coverage and finer resolution do not affect this study, as it focuses on the tropics and reduces the resolution of the topography. The global shape is improved slightly, and the depth of Xanadu is slightly increased, which could create small quantitative differences. However, these differences would not qualitatively change the results or conclusions of this paper.
We also experiment with adding a torque term to the zonal wind. This torque was originally incorporated into the model to accelerate the zonal winds to match the observed super-rotation [12]. The CAM v3 model has a well-known problem of an overly dissipative dynamical core that creates zonal wind profiles that are an order of magnitude lower than observations. This torque term was empirically determined to match the vertical profile of the observed zonal wind. See [12] for a longer discussion of the torque term, zonal wind profile, and angular momentum. The added zonal torque is maximum at the equator and has a gaussian dependence on latitude with an e-folding distance of 30°. The equatorial (EQ) torque is pressure dependent and decreases to zero at the surface (146,594 Pa). This torque term is a relatively small, but constant correction to the zonal wind. Near Titan’s surface, the magnitude of the added torque term is 104 times smaller than the maximum tidal torques. However, the tidal torques tend to cancel out over a Titan day, while this added torque is constant in time and has a net effect of accelerating the winds. An unintentional but interesting side effect of adding topography to the model is that the surface pressure is no longer uniform, and the added torque accelerated the winds according to the surface elevation. The added torque changes sign from prograde to retrograde at pressures below 146,594 Pa. At lower pressures (higher elevations), the torque is prograde (westerly). Figure 1 shows the added torque in our lowest model layer at 170 m altitude (above the surface elevation). Warm colors are prograde and cool colors are retrograde directions.

3. Results

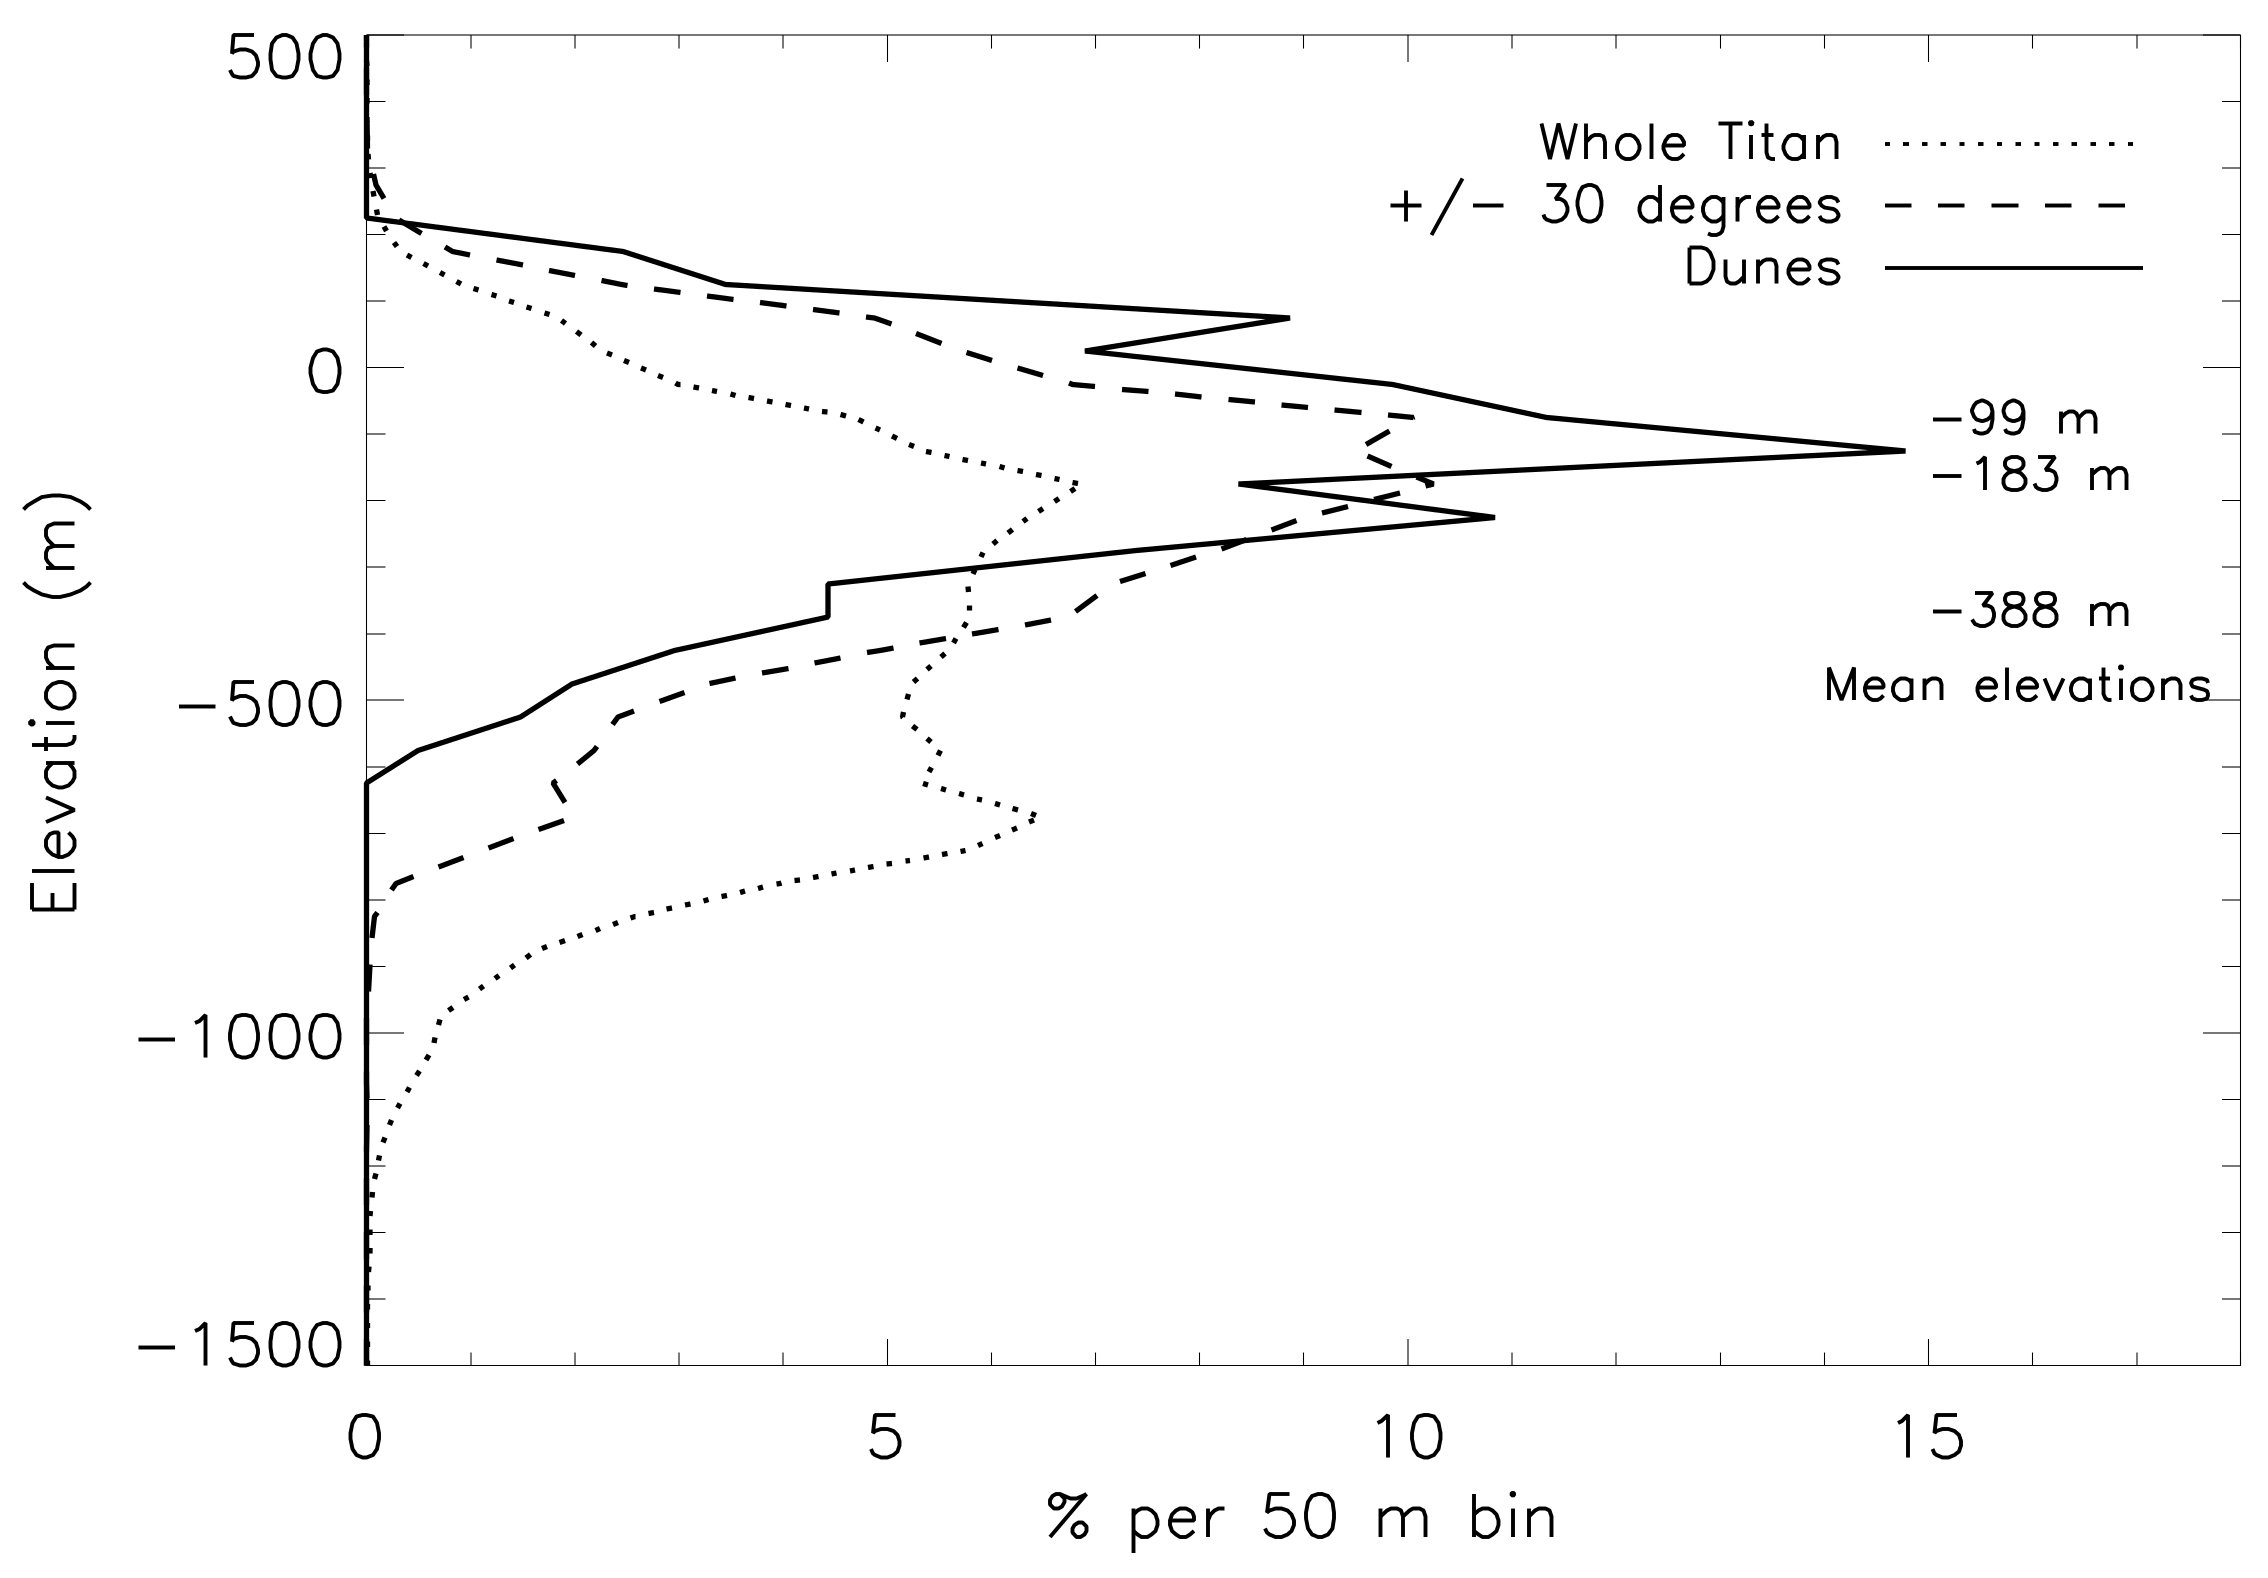
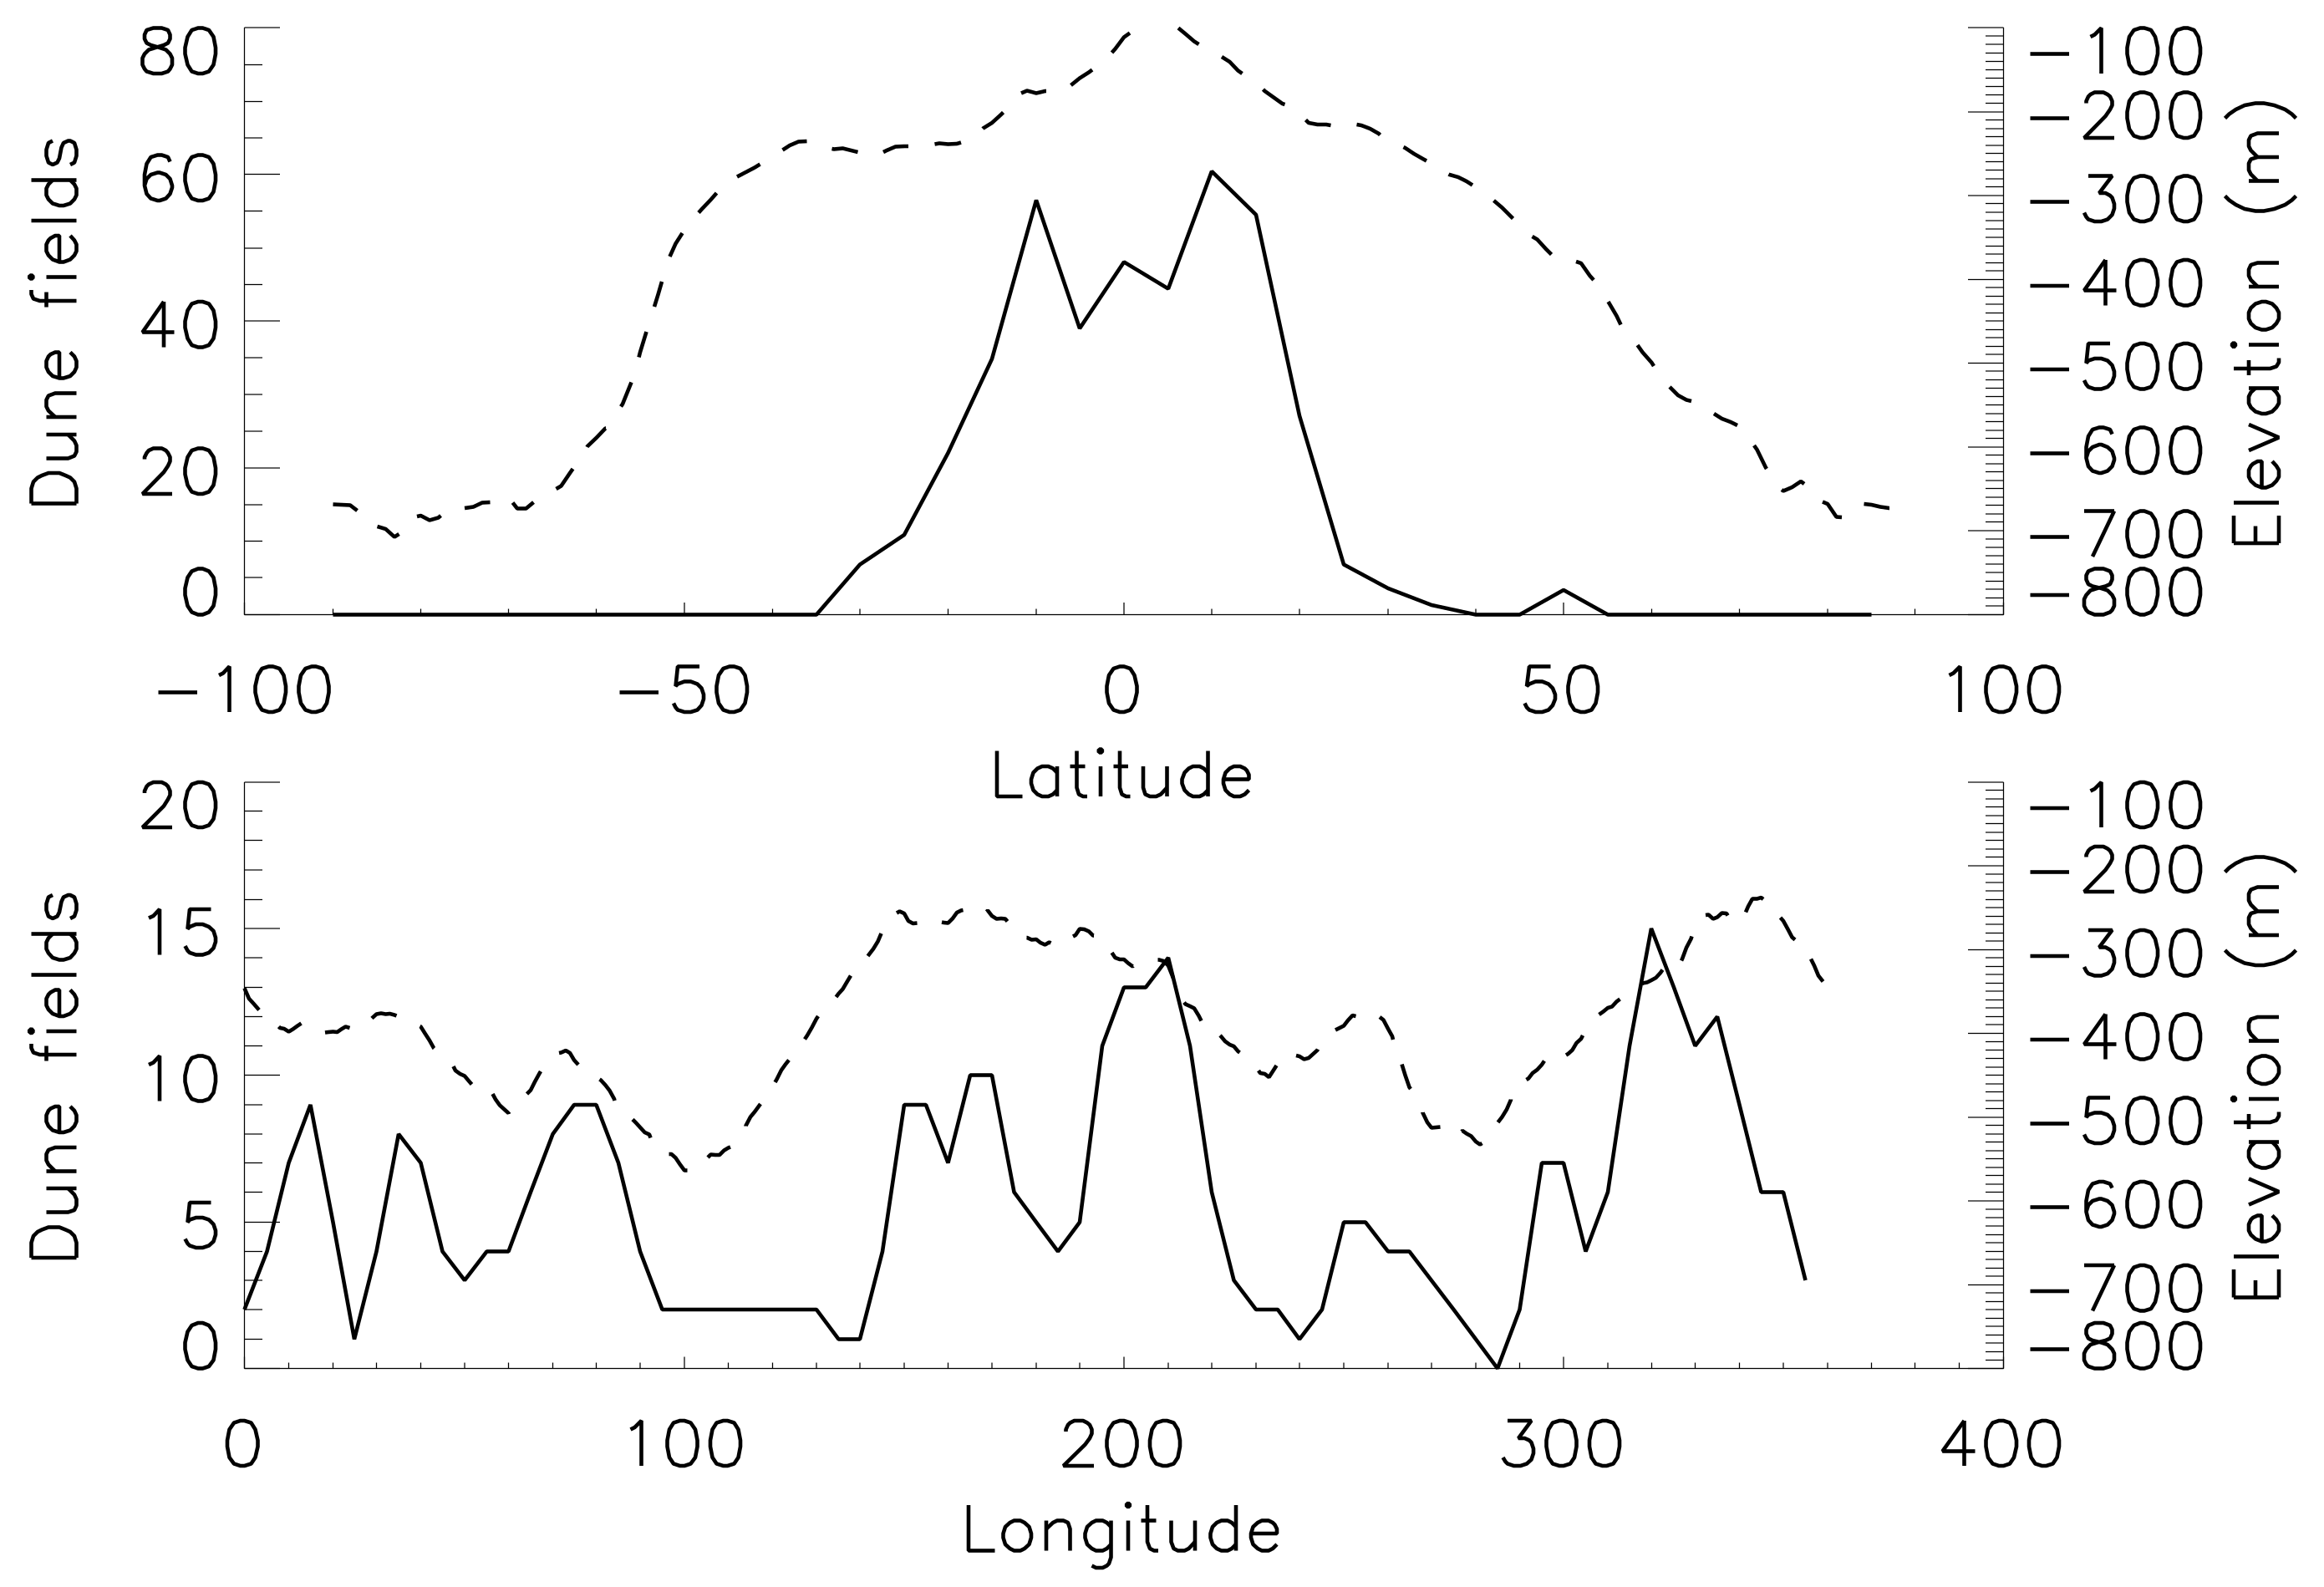
3.1. Dune Location Analysis

We overlay the dune orientation directions [22] onto the topographic map provided by the Cassini Radar team [20] in Figure 2. The topography in this map has been binned at 1° resolution. A histogram of the elevations of all Titan latitudes below 30° and those locations with dunes present shows that dunes tend to lie at higher elevations (Figure 3). The mean elevation of the dunes compared with a 2575 km spheroid is −99 m. The mean elevation of equatorial region (+/− 30°) is −183 m, and the mean elevation for all of Titan is at –388 m. Titan’s dune fields lie at significantly higher elevations (p < 0.01) than most of the tropics (+/− 30°). Other studies have also found that dune locations are correlated with topographic highs in the equatorial regions [21]. However, the dunes may lie in local basins, as is the case with sand seas on Earth spanning an area greater than 12,000 km2 [23] as well as the similarly large north polar sand seas on Mars [24]. Thus, our analysis is not necessarily at odds with Le Gall et al. [25] who argued that dune fields lie at low elevations. Their paper looked at each dune field in detail, while we investigate on a much larger scale. Titan’s dunes appear to be interrupted (deflected or truncated) by steep slopes, even if the change in elevation is small, but they may not be affected by large changes in elevation over long distances, i.e., low slopes [20]. The goal of this paper is to investigate the dune-forming winds with a GCM that runs at 4 × 5° latitude x longitude resolution, so modeling the dune fields at higher resolution is beyond the scope of this study.
Figure 4 shows the latitudinal and longitudinal distribution of the dune fields. The dashed lines in Figure 4 show the mean elevation in 1° bins. Surface zonal mean elevation is relatively high in the tropics and midlatitudes and low at the poles. The meridional mean surface elevation and number of grid cells with dune fields seem to follow a similar pattern of highs and lows.
For a dune to form there needs to be sufficient sediment supply and suitable wind conditions. These conditions appear to be more prevalent at low latitudes and high elevations on Titan. It has been proposed that wetlands or moist conditions may suppress dune formation at low elevations [26].

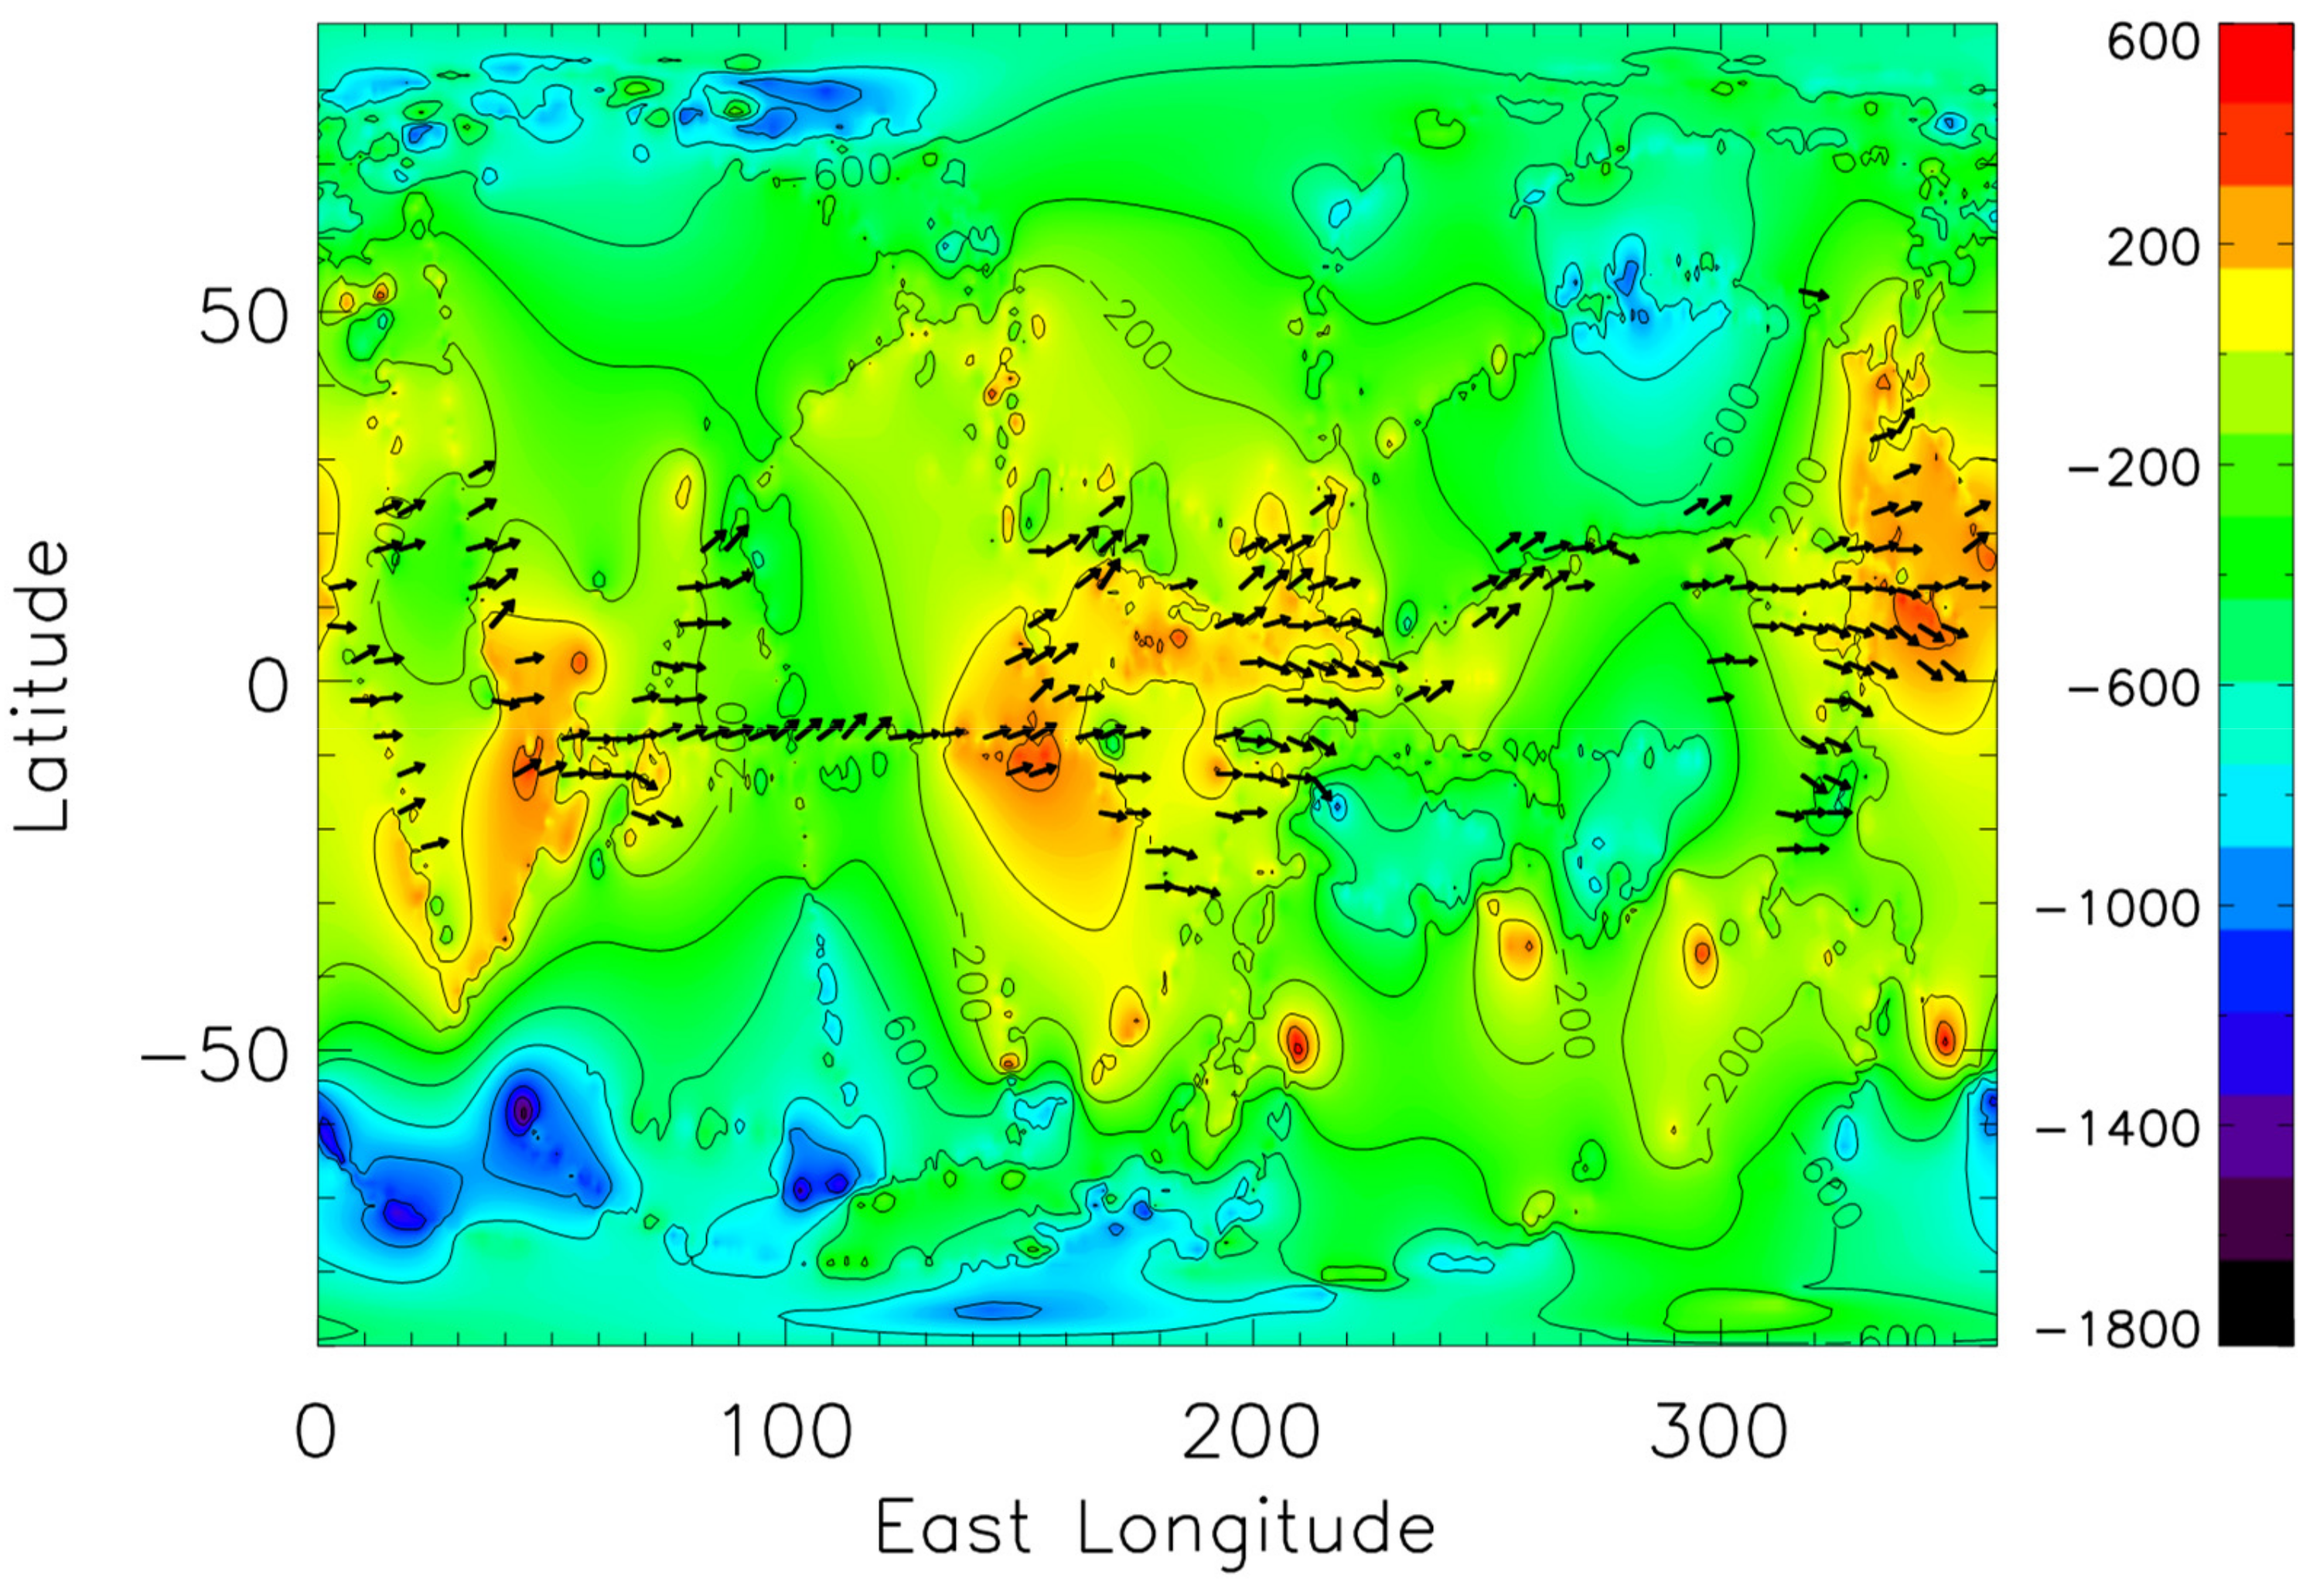
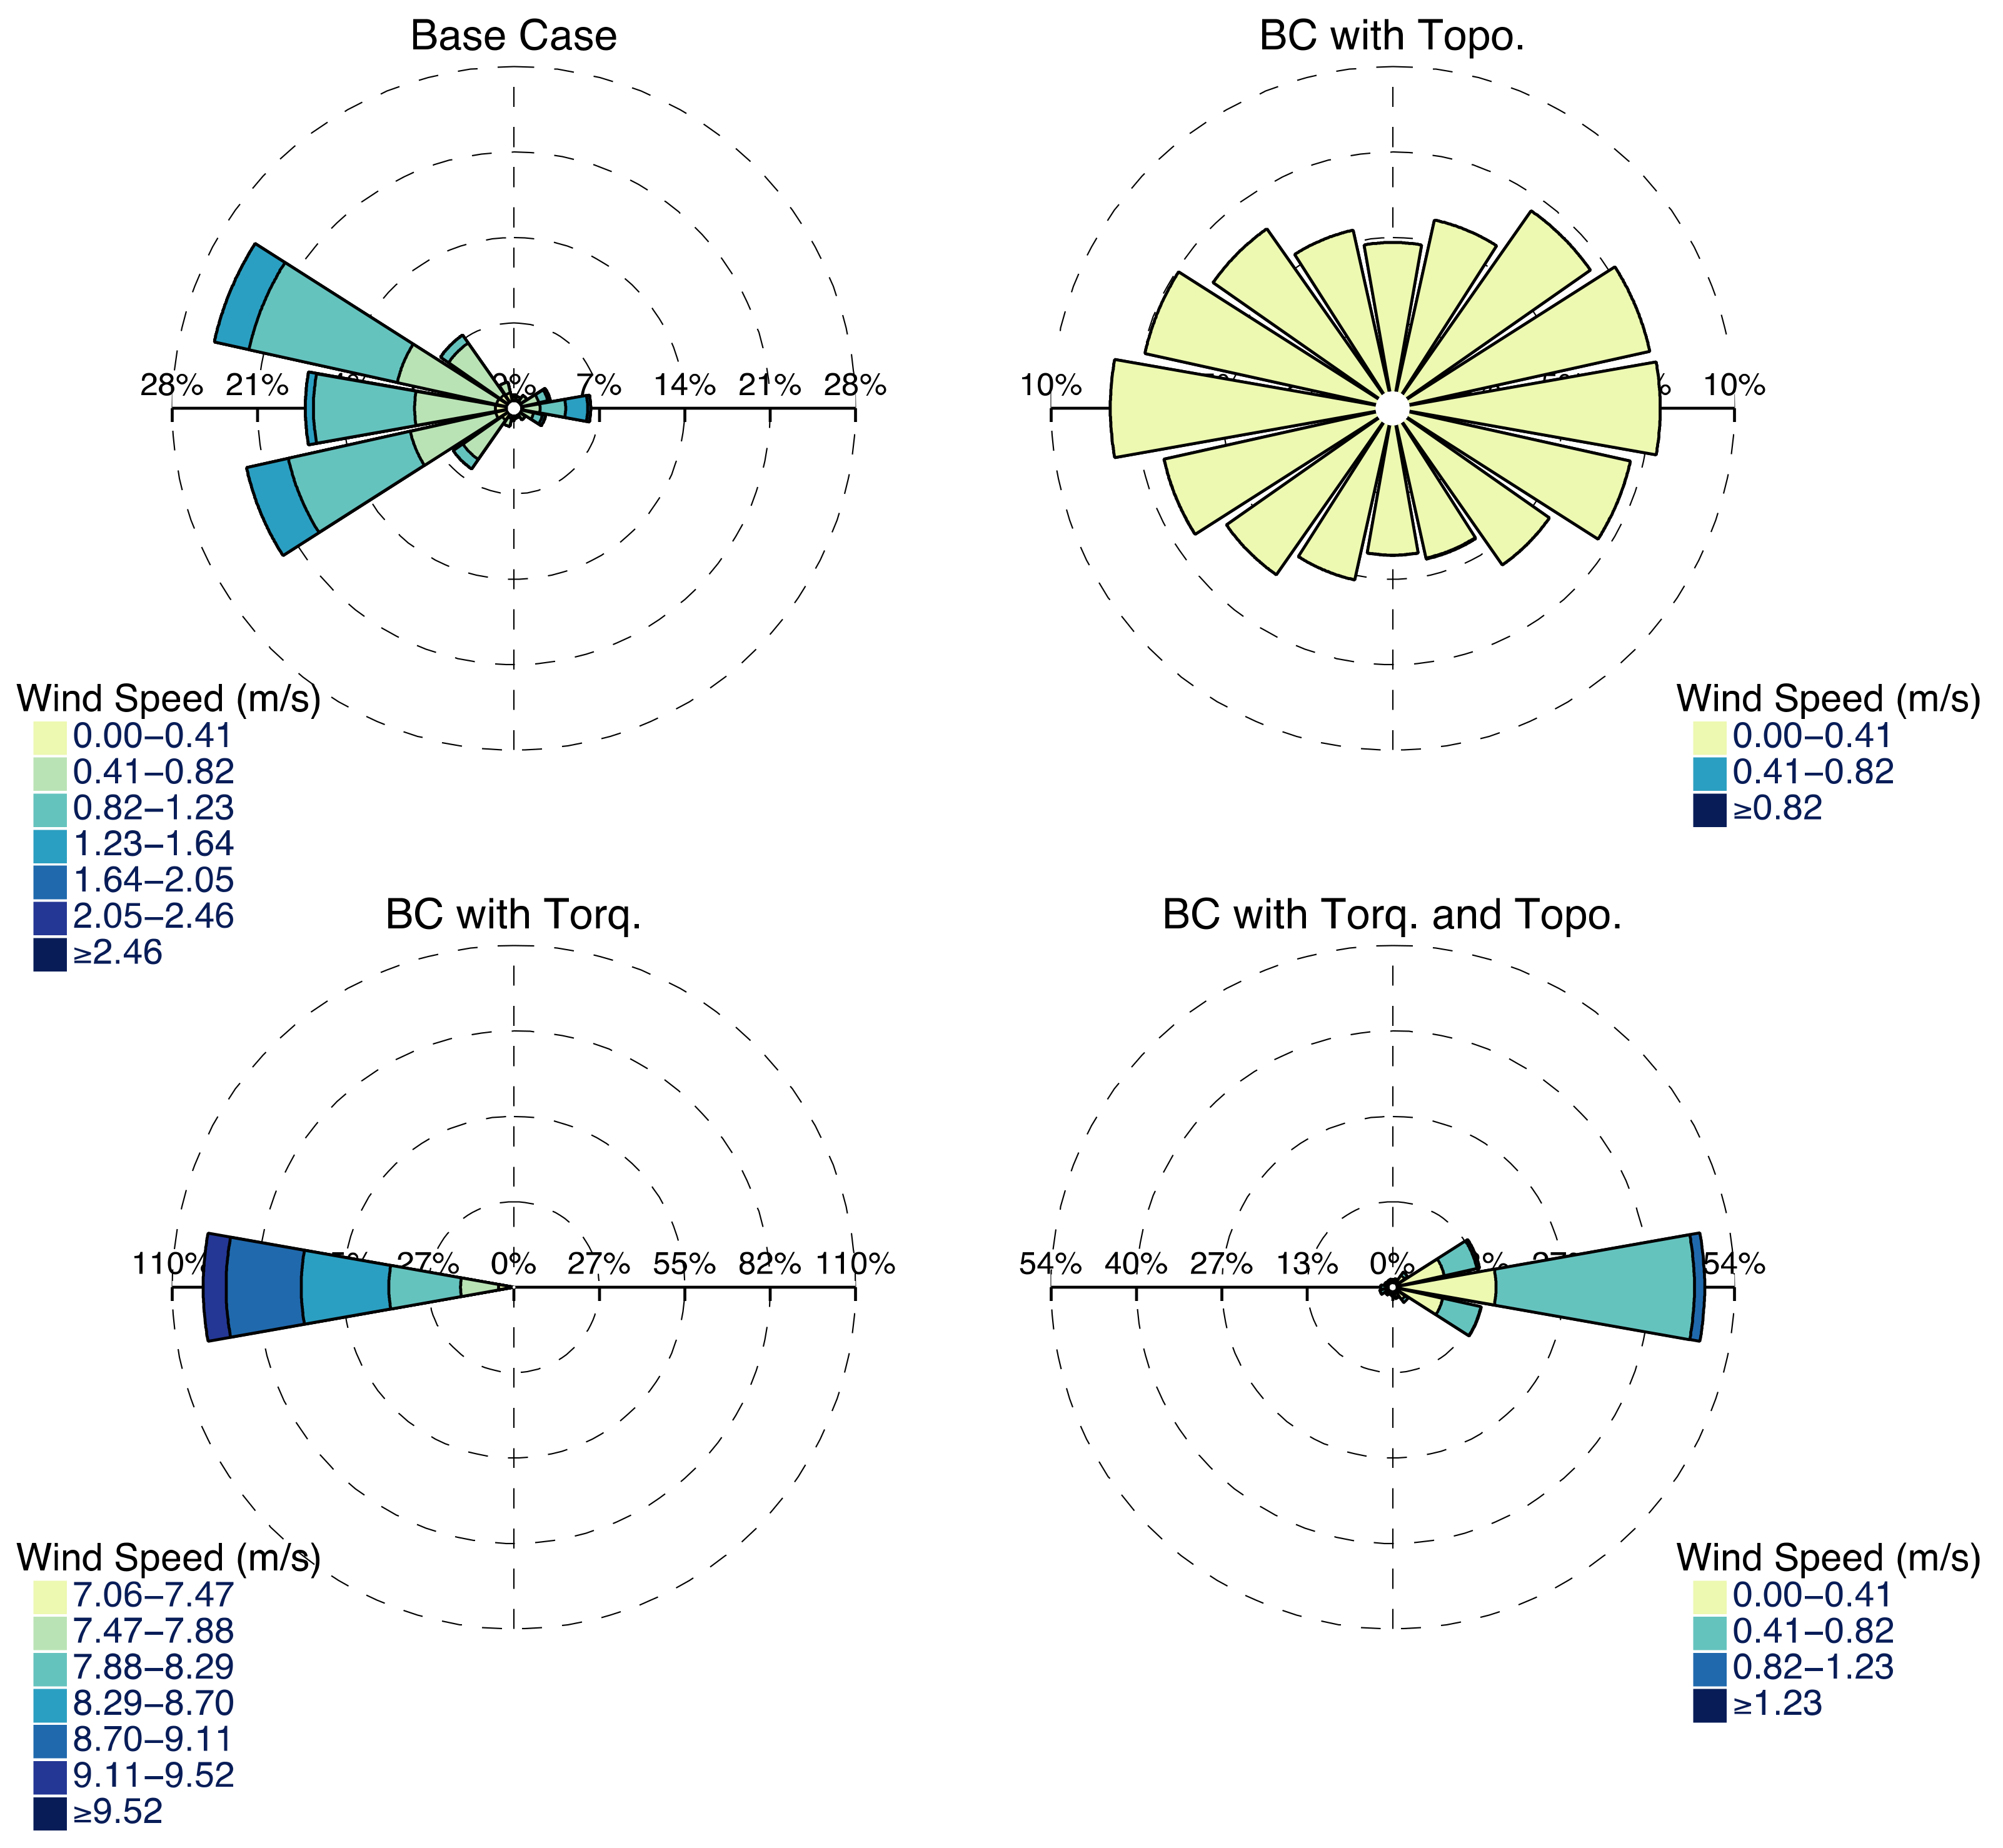
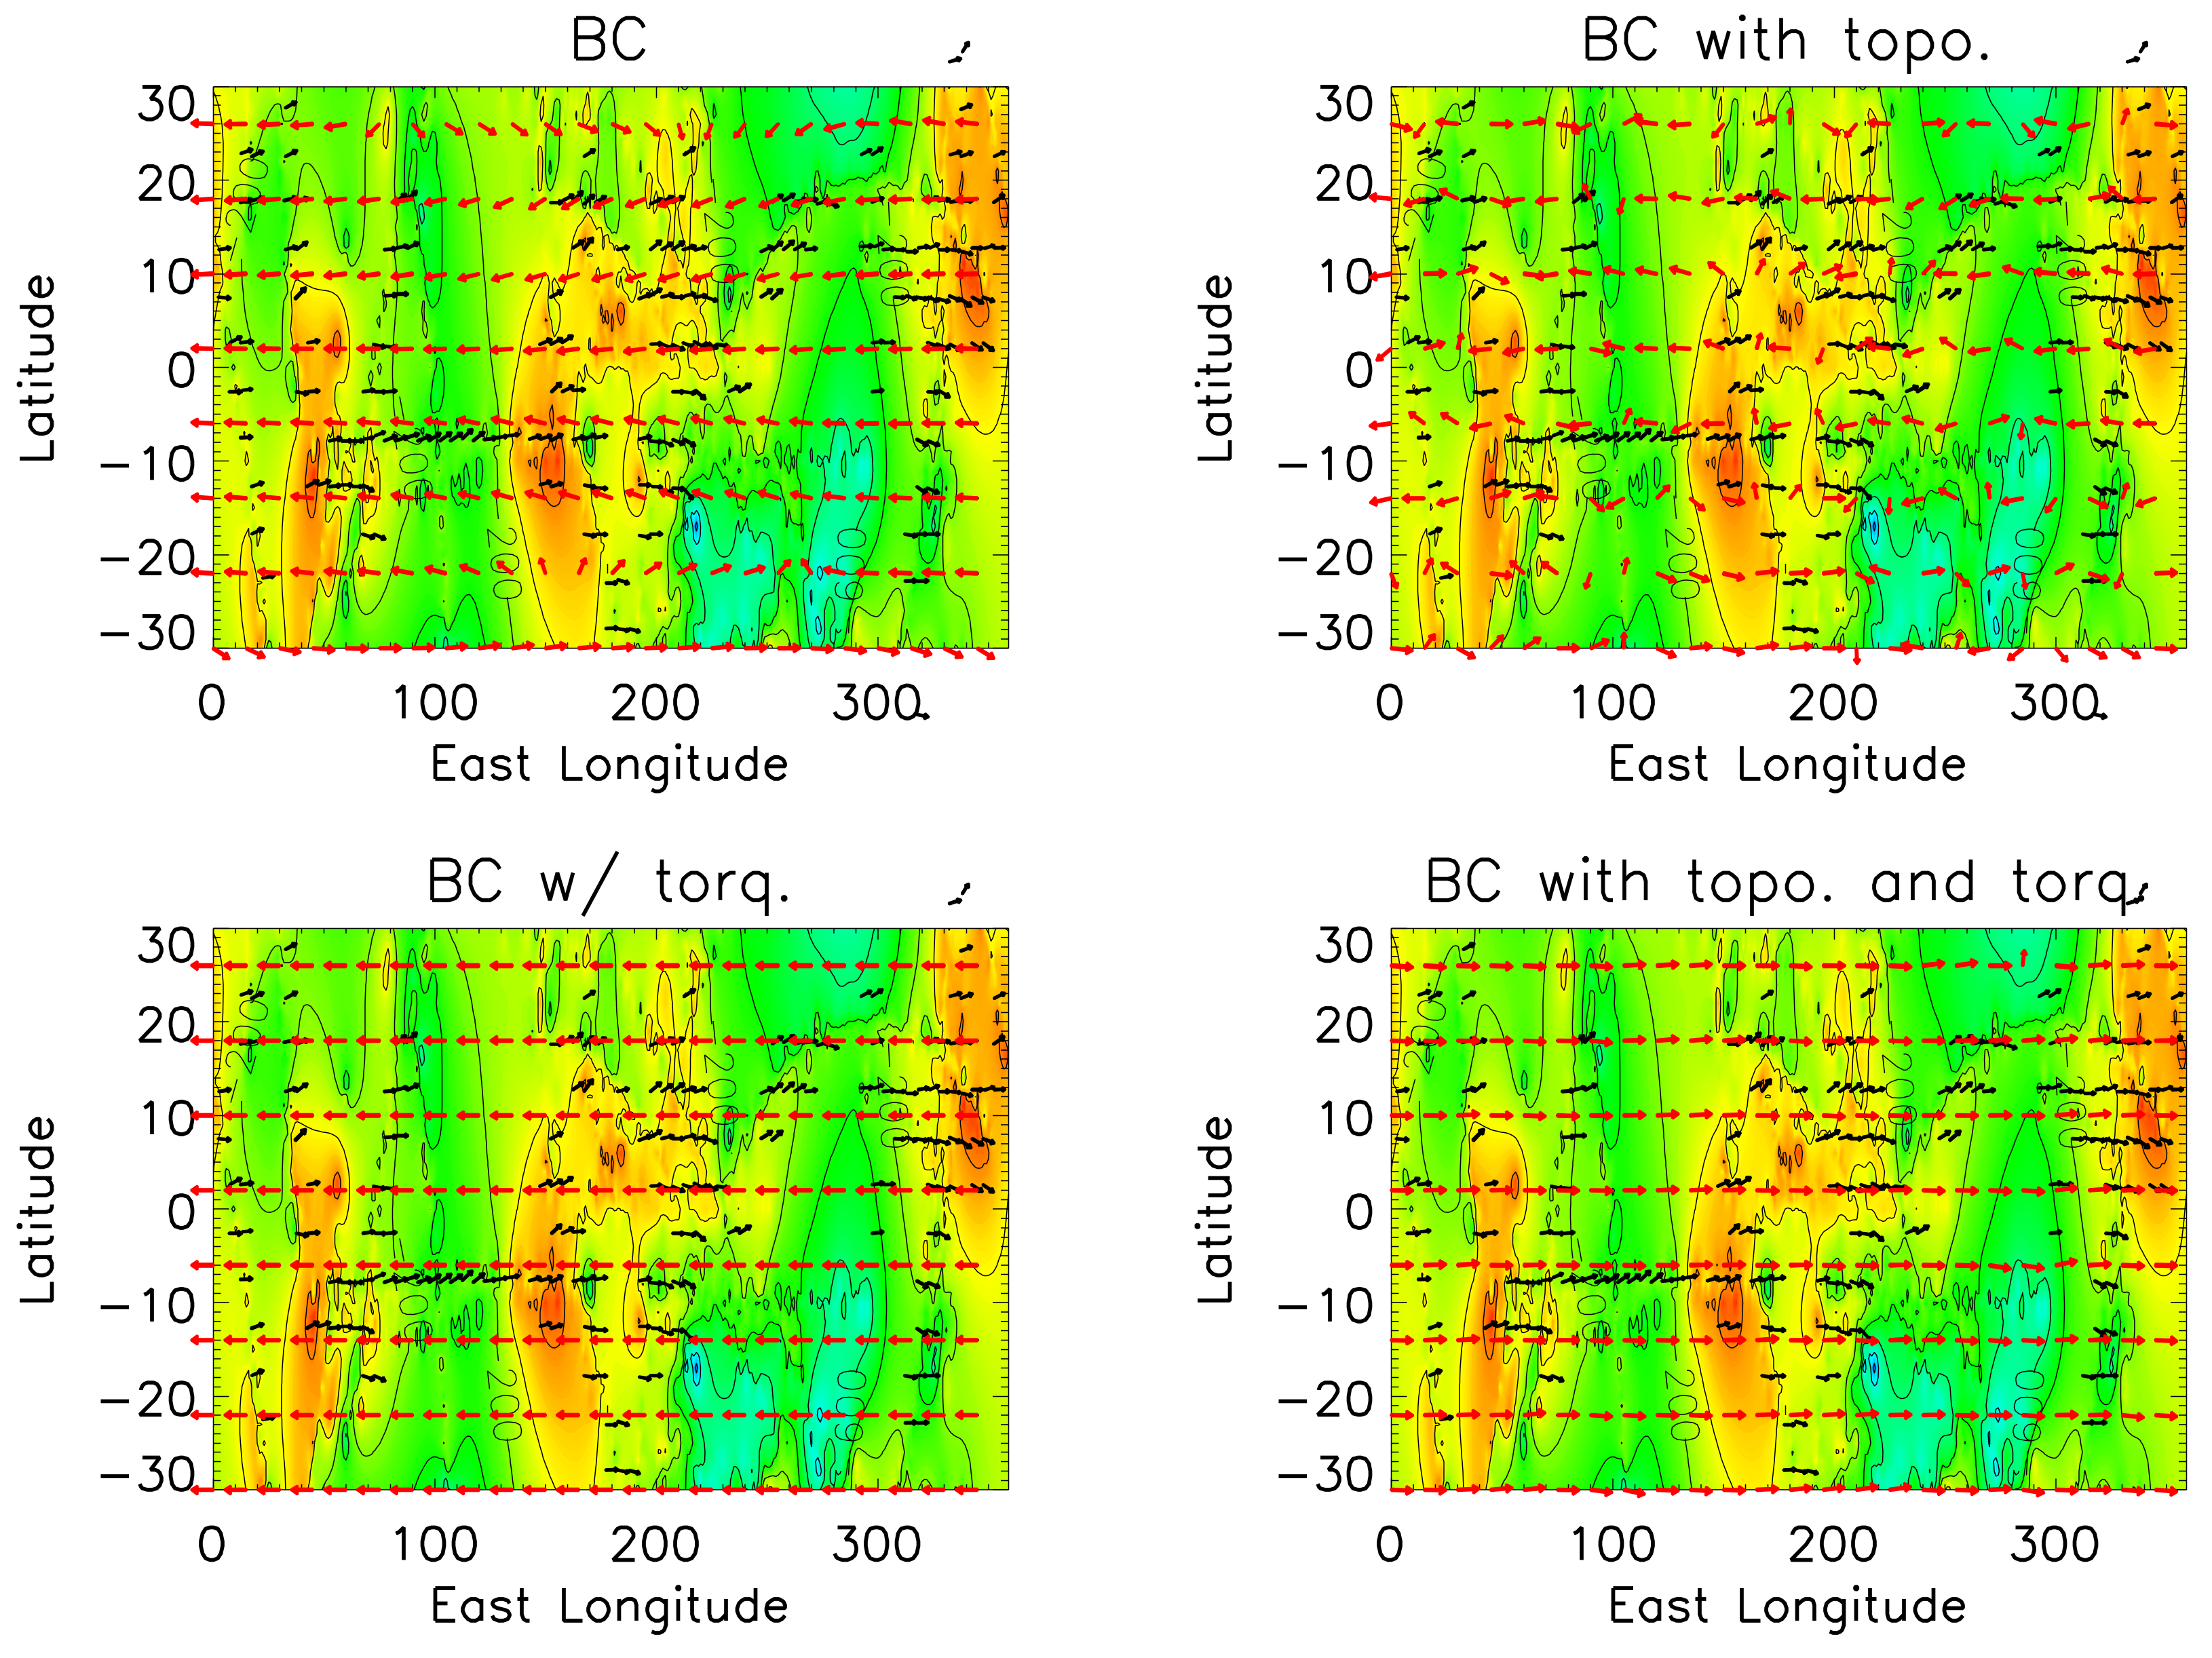
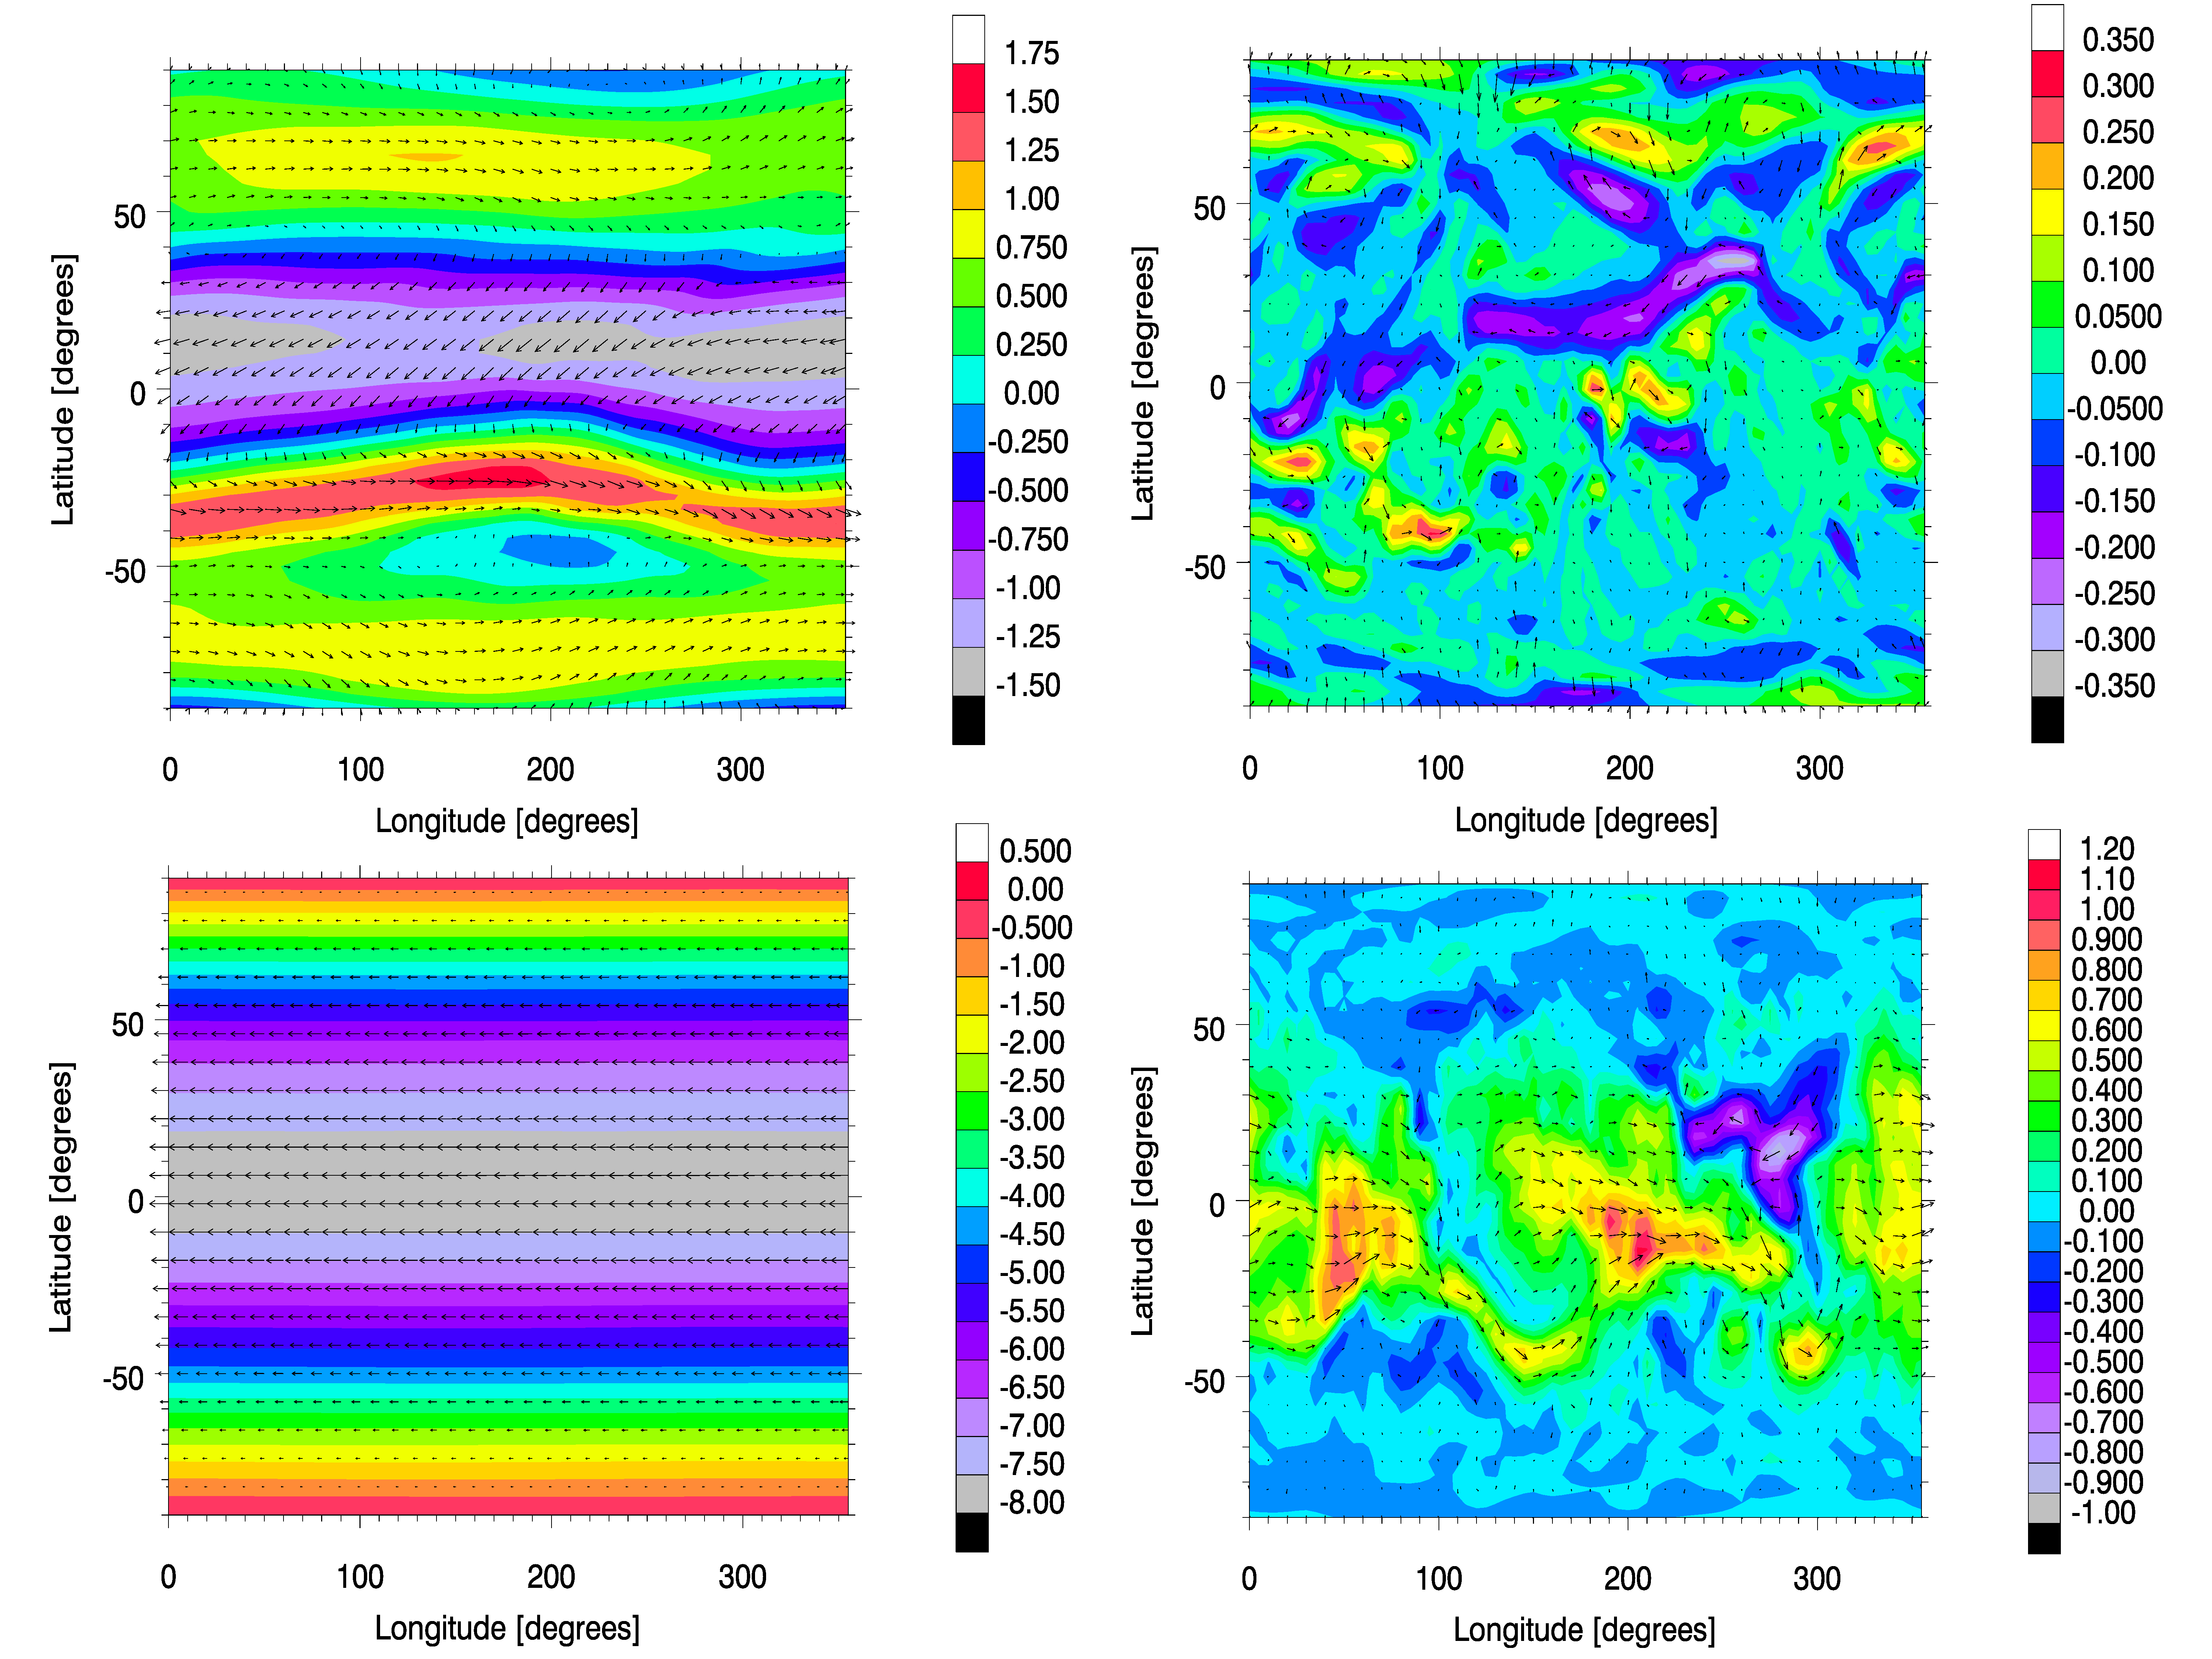
3.2. GCM Simulations of the Near-Surface Winds

We run four simulations at 4 × 5° resolution to explore our two model additions mentioned above, topography and added torque. The simulations are 1) the base case model (BC), 2) the BC with topography, 3) the BC with added torque, and 4) the BC with added torque and topography. Figure 5 shows the near-surface zonal winds (color) and wind directions (arrows) on Titan averaged over an Earth year during the Northern hemisphere winter for each simulation. The near-surface winds are from our lowest model layer midpoint at 170 m altitude.
In our base case model, we see few areas with annual average prograde westerly near-surface winds at low latitudes (Figure 5, upper left). We do have bands of westerly winds in the midlatitudes that fluctuate seasonally, however they rarely lie within 30° of the equator. The tropics in this simulation have easterly winds which are inconsistent with the wind direction from the Huygens probe descent [27] as well as the dune-forming wind theories discussed above. The Huygens probe (10.5° S, 192° W) reached a maximum horizontal velocity of 0.73 m/s toward the east in the last half kilometer of altitude, however, at 130 m above the surface, similar in height to our lowest model layer (170 m), the Huygens probe was moving at 0.3 m/s to the east [27,28]. This is within the range of wind velocities in our base case simulation, but in the opposite direction. Analysis of the Huygens probe wind suggested that its velocity switched direction twice in the last 5 kilometers of descent, which is inconsistent with an Ekman spiral, and likely due to the weak Coriolis force [29].
Adding realistic topography to our model drastically changes the near-surface winds (Figure 5, upper right). Topography reduces the magnitude of the winds by about a factor of five, however, the winds change direction to be more consistent with dune orientations. Much of the tropics in this simulation have prograde westerlies with average wind velocities up to 0.3 m/s, with some areas of the tropics still producing easterly winds with similar magnitudes. The westerlies in this simulation are more consistent with the Huygens probe direction near the surface [28]. The Huygens probe velocities are near the high end of the velocities in this simulation, however, given the coarse grid used and time averaging, we cannot say that they are inconsistent. Thus, we find that topography may play a necessary role in shaping the surface winds on Titan that form dunes.
Furthermore, the addition of topography and added torque has the interesting effect of creating easterly winds at low elevations, but westerly winds at higher elevations where dunes are located (Figure 5, bottom right). The added torque is relatively small, however the interaction with topography creates a wind pattern that is very consistent with the dune orientations. Large areas of the tropics, especially those at higher elevations, and with dunes present, have westerly winds up to 1.1 m/s in this simulation. These winds are consistent in direction and velocity with the Huygens measurements. There is also a positive correlation between the wind speed in this simulation and dune presence. The correspondence in this simulation of westerly winds with the dune locations may suggest an as yet unknown physical process, such as downslope winds that may play an important role in dune formation.
The addition of the added torque (Figure 5, bottom left) to our base case model creates easterly winds of several meters per second. These near-surface winds are inconsistent with all of the dune-forming wind theories, which require net westerly winds, in direction and magnitude as well as the Huygens descent probe tracking. The wind pattern in this simulation aligns with the imposed torque in the model with winds occurring the strongest at the equator and decreasing with latitude. This simulation is inconsistent with Titan’s dune-forming winds.
Westerly winds may not be sufficient to form Titan’s dunes. It has been shown that for longitudinal dunes, nearly equal bimodal winds are required with divergence angles greater than 90° [9]. However, it is unclear if Titan’s dunes are longitudinal or stabilized linear dunes [4]. Figure 6 shows rose diagrams compiled over a Titan year for the whole tropics. The wind pattern for the base case model (upper left) is bimodal with both directions being easterly and about 68° apart. The simulation with topography (upper right) has a multitude of directions, but at any given location, the winds are predominantly bimodal with angles greater than 90°. It appears that the forced dynamics (bottom two panels, Figure 6) remove much of the bimodality that is shown to create longitudinal dunes. The added torque in the bottom two simulations acts in different directions due to the pressure dependence of the torque term. Much of the tropics are at high elevations and experience a prograde torque. This bimodality is important for determining the type of dunes created. Thus, only the simulation with topography is consistent with longitudinal dune formation and westerly surface winds. However, as noted above, there are other methods of creating linear dunes, such as by stabilizing sediment.
Dune formation occurs due to a spatial or temporal decrease in the sand-carrying capacity of the wind in areas with strong enough wind that sand can be mobilized [30]. Given Titan’s fairly weak winds, a minimum condition needed for dune formation is sufficient wind speed to lift sand particles. That threshold wind speed is debated, but could be <1 m/s [17,31]. Histograms of our simulated wind speeds at all locations (clear) and those with dunes (shaded) are shown in Figure 7. We find that on average, dunes are present in grids with slightly higher wind speeds in our simulations, however the correlation is low, 0.01–0.2. This is not surprising, as many other factors control dune presence including sediment availability and sufficiently low sediment cohesion. This could also potentially be due to the fact our model resolution does not resolve the local winds. The wind speeds shown here are averaged over several Titan days and are less than the maximum instantaneous wind speeds that would actually move the sediment. Furthermore, recent laboratory analysis suggests that sustained movement of grains on Mars, and presumably on Titan, can be maintained by impacts from saltating grains, which requires lower wind speeds than direct fluid drag [32].

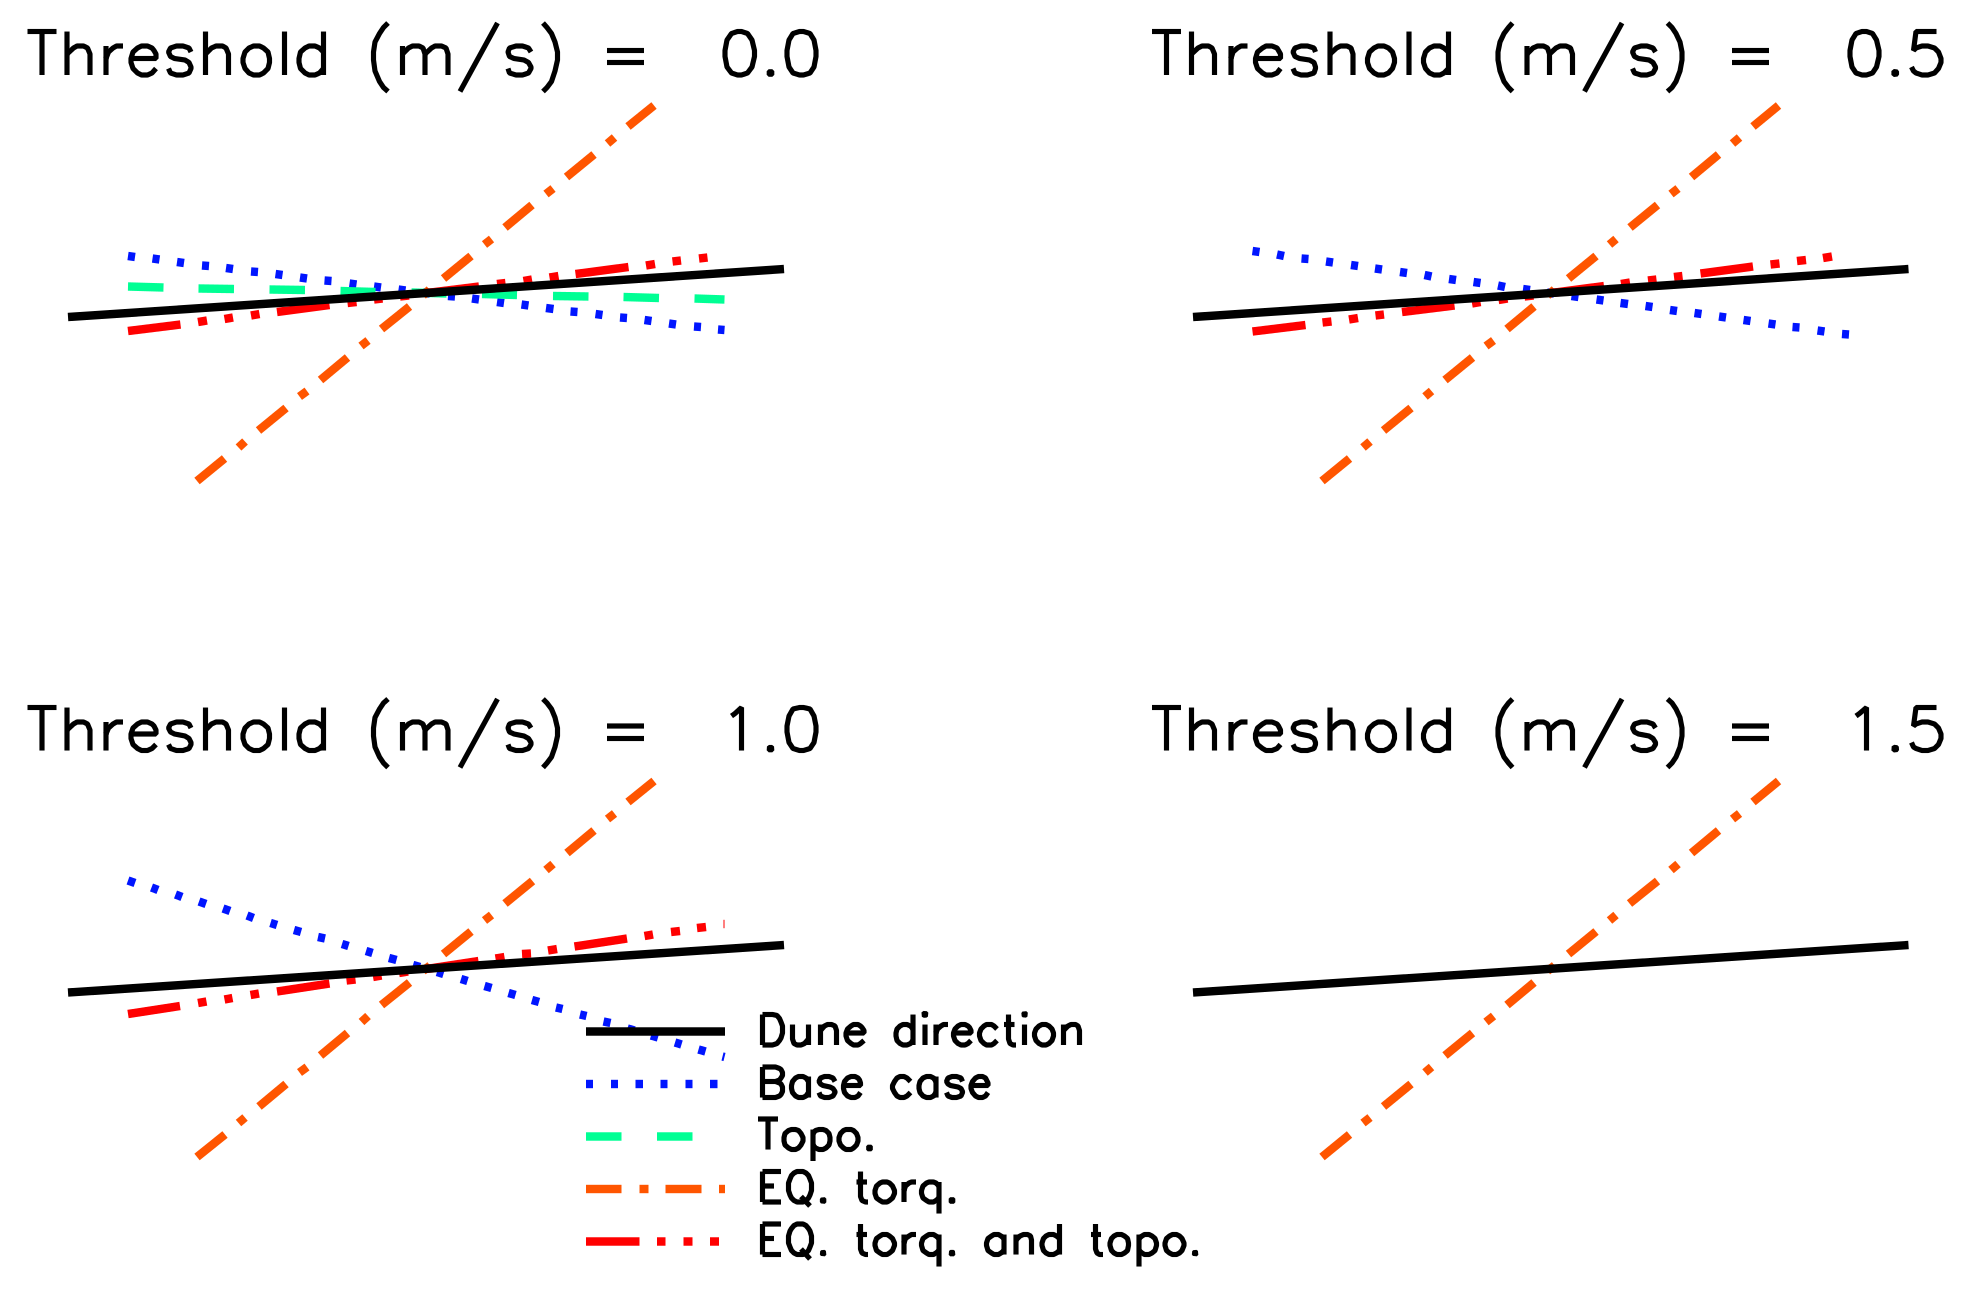
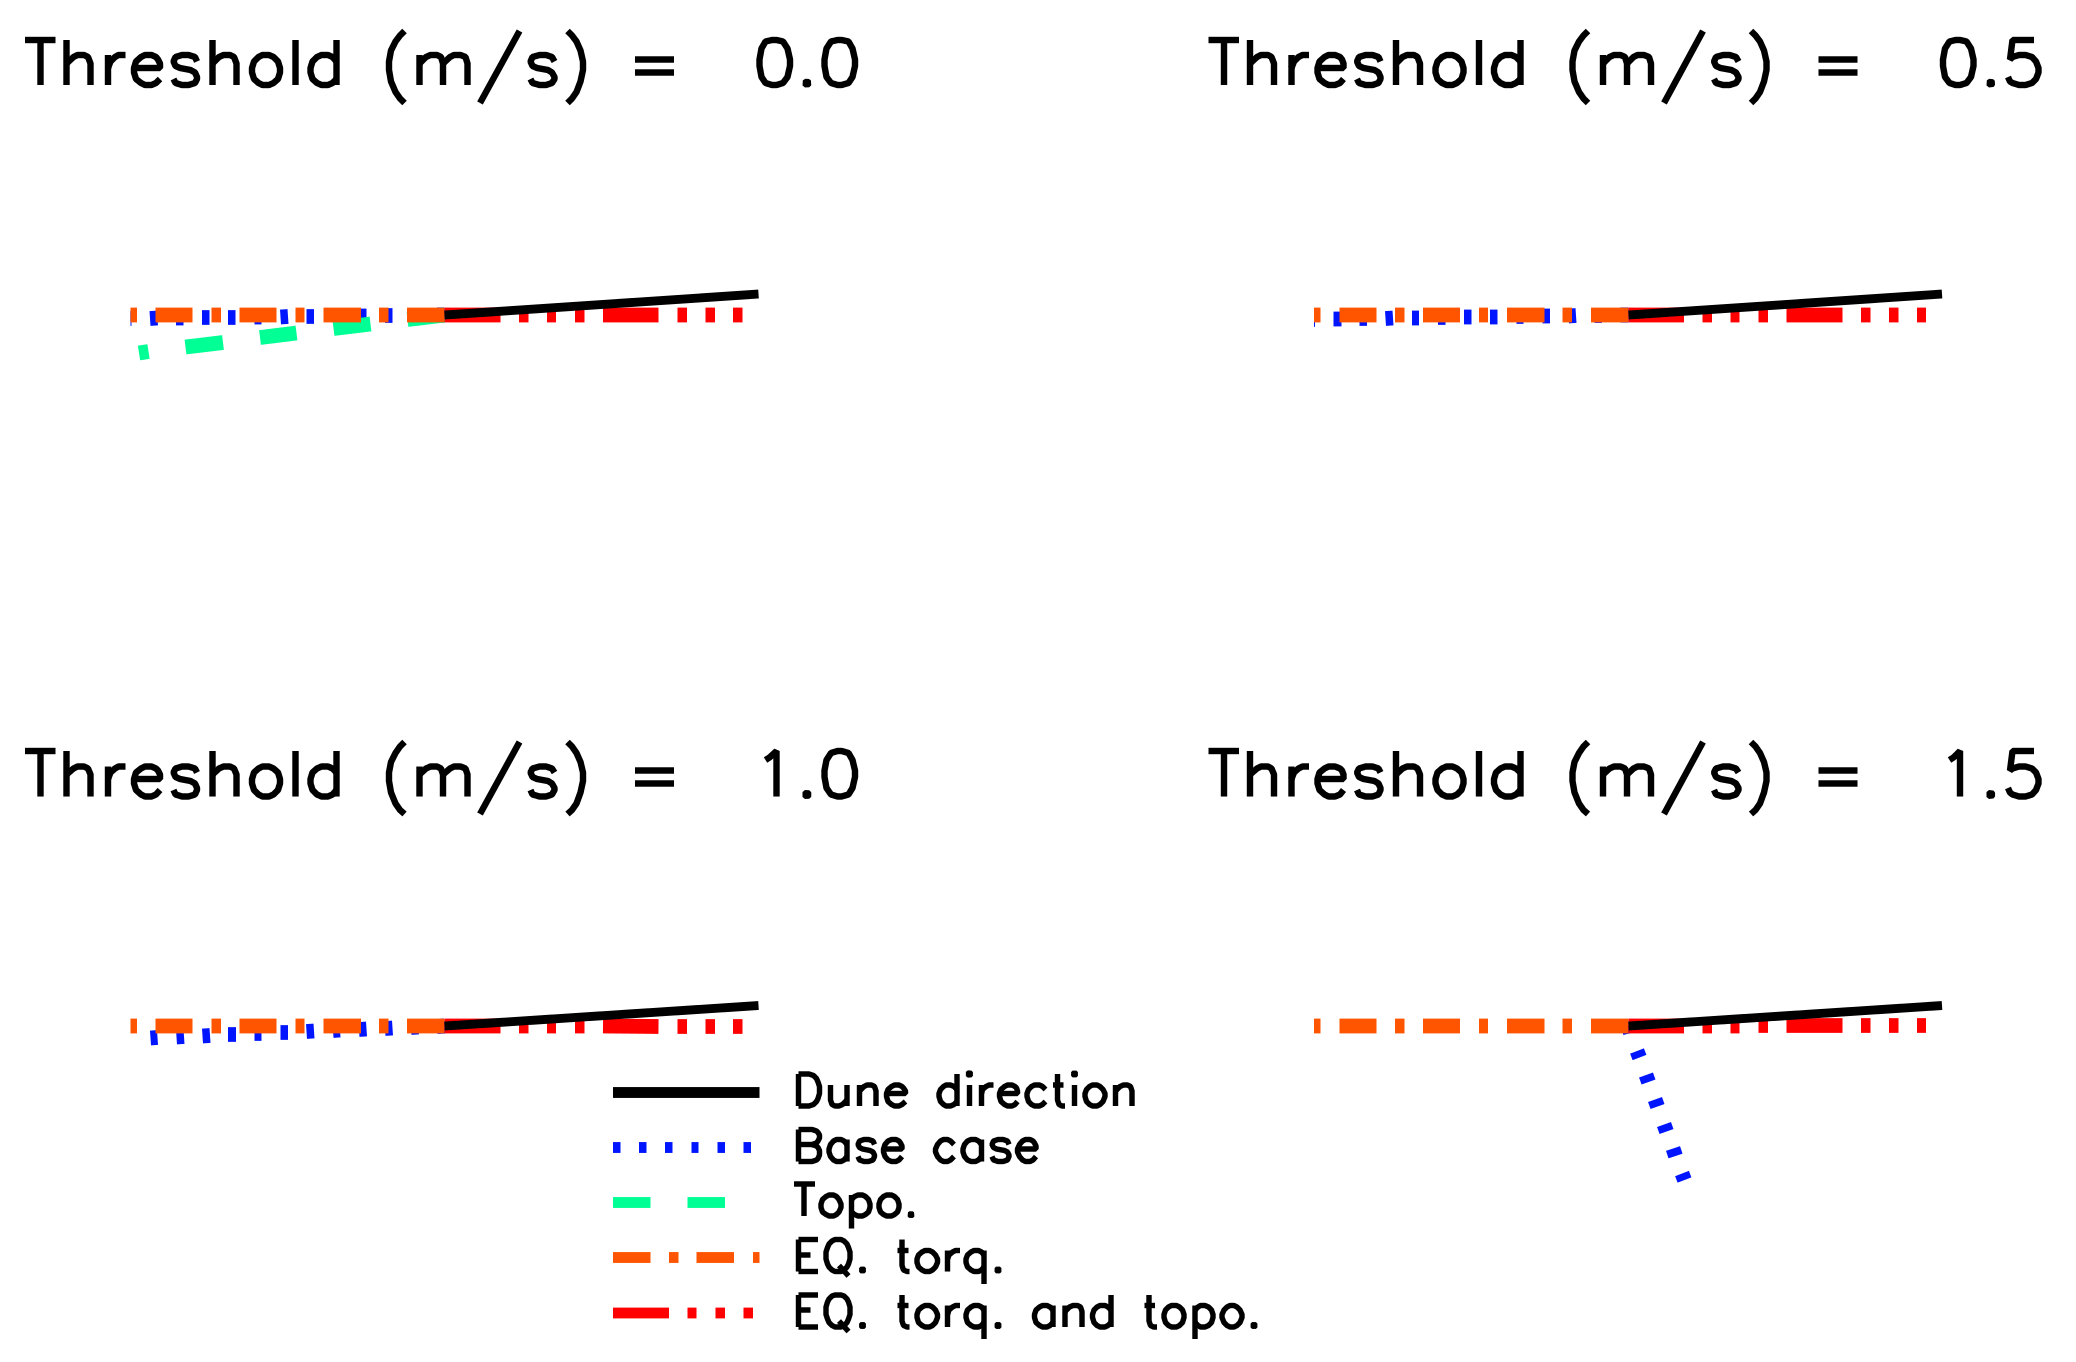
3.3. Resultant Drift Direction and Maximum Gross Bedform-Normal Transport

The resultant drift direction (RDD) is the mean direction of the potential sand transport over a period of time, typically at least one Earth year (following the terminology and method of [30]). The movement of sediment depends on the surface wind speed and the threshold speed for saltation. We calculate the RDD in a manner similar to that used in [5]. We assume that the threshold friction speed scales logarithmically with altitude and is a function of our lowest model layer winds at 170 m above the surface. In Figure 8 we plot rose diagrams of the mean RDD for all grid boxes with dunes present in our four simulations from four different threshold speeds for saltation as well as the observed mean dune crestline orientations. The winds in most simulations transport sediment in the opposite direction of the dune crestline orientations. The dune crestlines point in the direction of the expected average prevailing winds based on analysis of the dune interaction with topography [22]. However, the base case simulation with a high wind threshold and the simulation with added torque and topography, have RDDs that are consistent with the dune crestline orientations, meaning they transport sediment in the direction of the dune crestline orientation. This is further evident in Figure 9, which maps the RDD directions from each simulation onto the elevation and dune orientation map in Figure 2. The RDD directions here are plotted every other latitude bin and every third longitude bin.
Dune formation theory suggests that linear dunes can form in two modes depending on the sediment stability. If the sediment is unstable, dunes will orient themselves perpendicular to the direction of gross transport of sediment, which is typically different than the RDD [9,10]. Dunes in areas of stable sediment grow from a sediment source in a “fingering mode” and align with the RDD [33]. Rubin and Hesp described the transition from transverse to linear dunes where the stability of the sediment changes in the Qaidam Basin, China, which has a unimodal wind regime. The maximum gross bedform-normal transport (MGBNT) orientations for our simulated winds are calculated following the methods of [10]. Figure 10 shows the mean MGBNT for our different model simulations averaged over all the dune locations. We find that all of our simulations predict the mean dune crestlines that are within 45° to those observed on the surface assuming bedform instability. If we consider the 0 m/s threshold speed to lift particles, we see that the addition of topography (green dashed line) improved the consistency between the simulated and observed dune orientations. The addition of only the added torque alone decreased the consistency of the predicted bedform allometry. The closest predicted orientation to the dune crestlines was the simulation with topography and added torque.
Our simulations that are most consistent with longitudinal dunes based on the obliquity angle are the simulations with topography and added torque, however this simulation lacks strong bimodality. The lack of bimodality is at odds with the longitudinal dunes proposed by Radebaugh et al. [7]. However, the E.Q. torq. and topo. simulation results do fit with the Rubin and Hesp idea that linear dunes can be aligned parallel to the main wind direction [4]. The dunes in their study are transverse until they encounter a stabilizing agent, which forces them to align to the RDD.

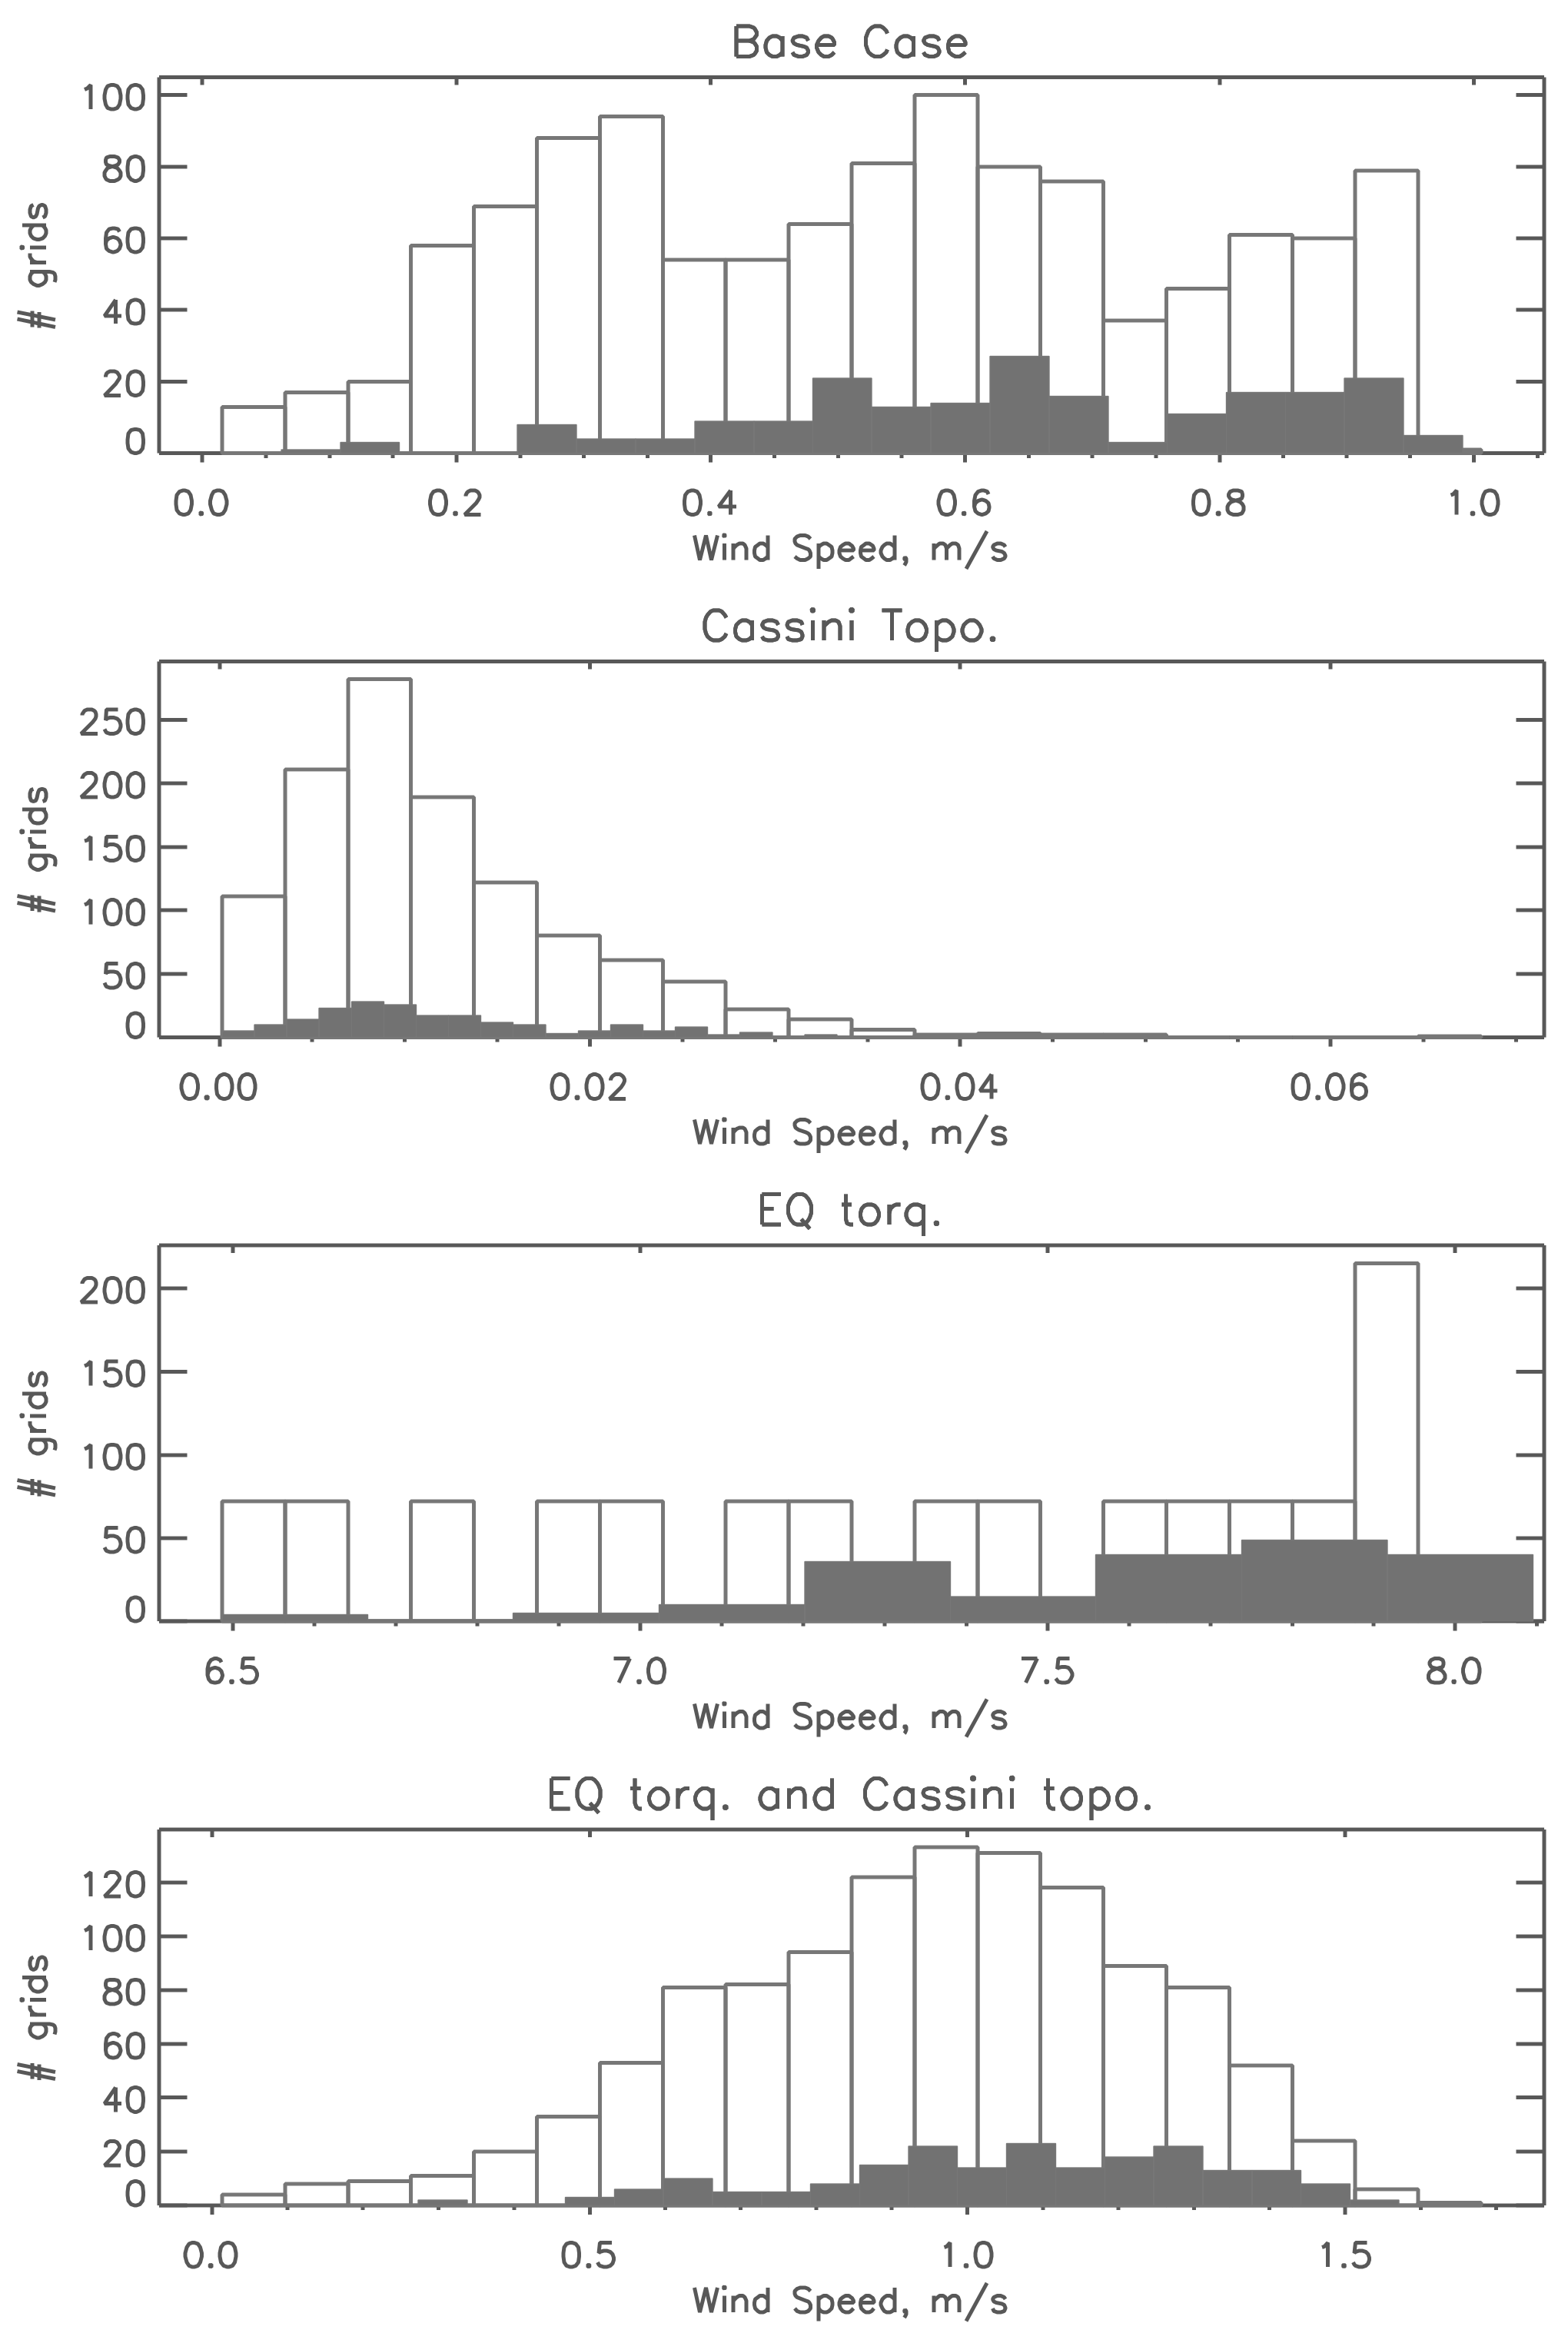
3.4. Statistical Analysis

To quantitatively test the correlation between our model predictions and the dunes we use two tests. First, we perform a point-biserial correlation between dune presence and model wind speed. Point-biserial correlation is statistical test that determines the correlation coefficient between a continuous and dichotomous variable. This tests whether dunes occur at locations with high wind speeds. The second test compares our simulated RDD with the observed dune orientations. We measure these directions in degrees from 0 to 360°. To compare the consistency between our parameters and dune orientations we take the cosine of the difference angle (difference in angle between RDD and dune orientation). This gives us a value of −1, when the vectors are 180° apart and 1 when the vectors are aligned. The mean cosine of the difference angle for each simulation is presented in Table 1.
The correlations between wind speed and dune presence are all positive, but 0.25 or less, as is expected given that we have no information of sediment supply or cohesion. The simulations suggest that there is a weak but positive relationship between the presence of dunes and the simulated wind speed. The mean cosine of the difference angle indicates the correspondence of the simulated wind direction and the dune orientation. Simulations with higher values have surface wind fields that are more consistent with patterns suggested by the dunes. Our added torque and topography simulation has a mean cosine of the difference angle of 0.95 between the RDD and dune directions. Given the course resolution, this suggests that globally, dunes are responding to regional wind patterns that are affected by the large-scale topography and that the added torque is a useful predictor of dune orientations. Adding topography improved this alignment compared with the base case as more of the winds became westerly. The RDD and dune orientations were least aligned in the simulation with added torque and no topography.

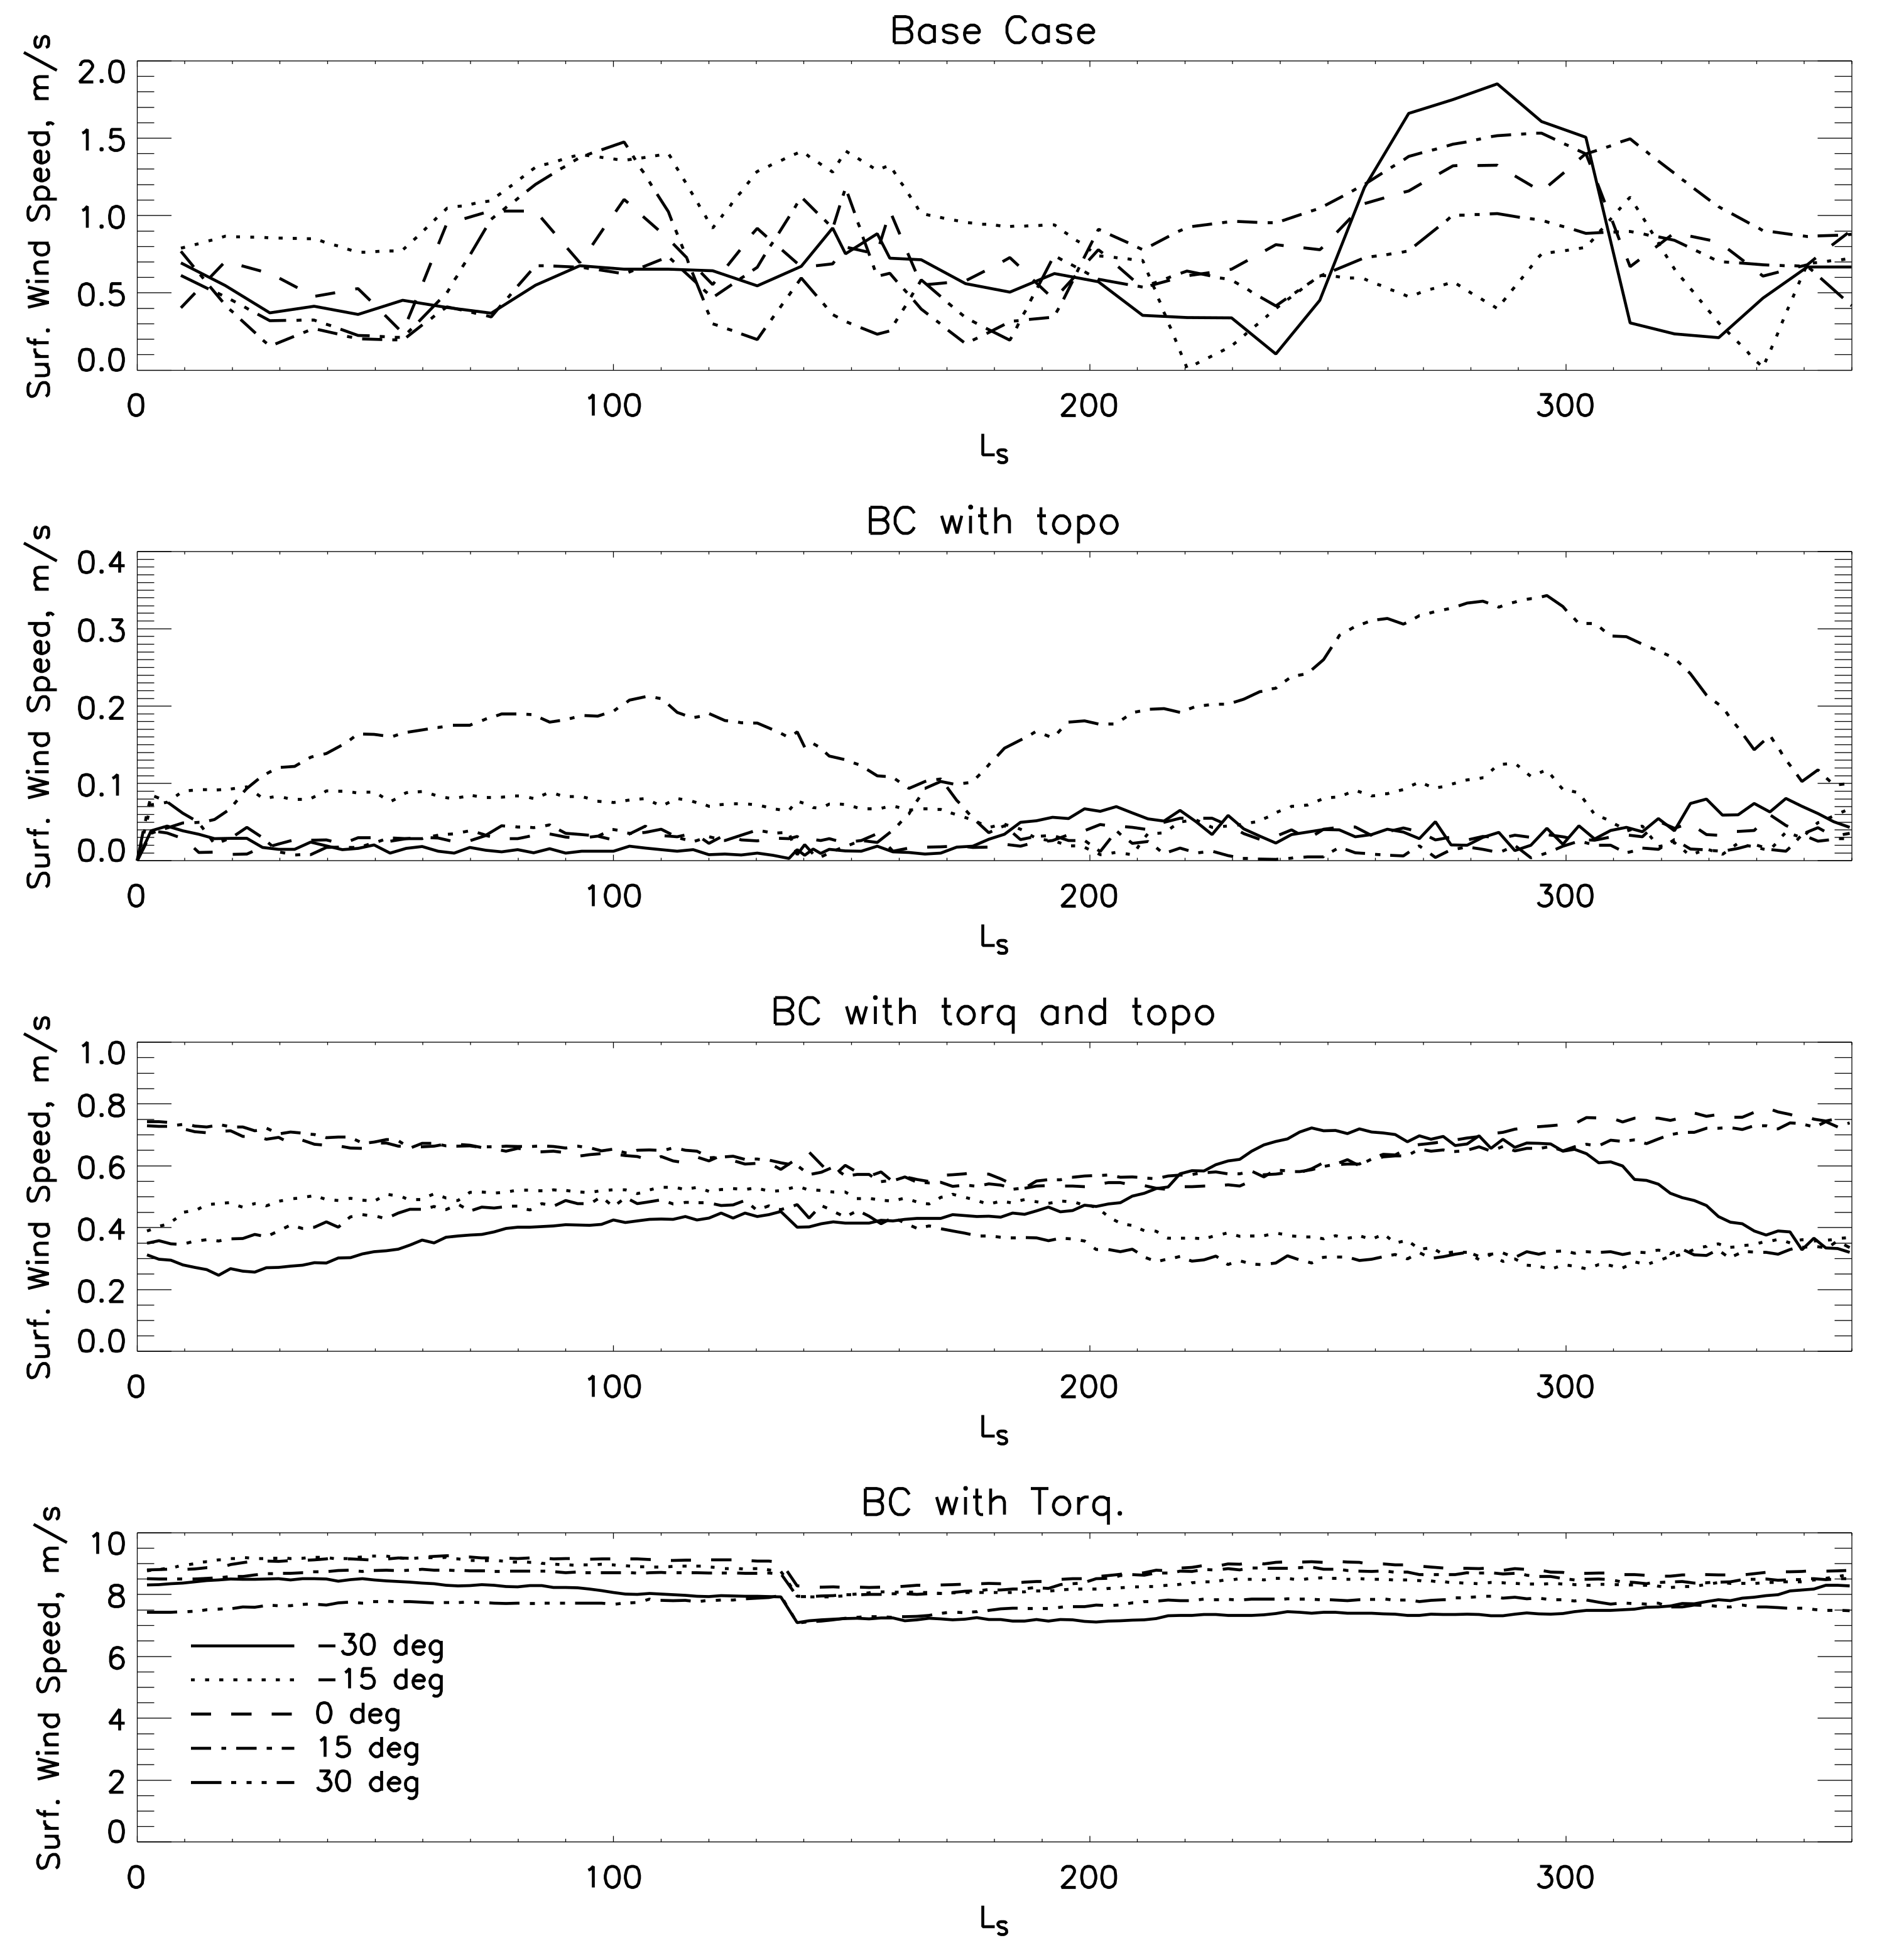
3.5. Time Analysis of Surface Winds

One hypothesis of dune formation on Titan comes from Tokano [6], who argued that relatively strong westerly winds around the equinoxes are responsible for creating the dunes. Throughout most of the year in their simulations the winds are easterly and less than 1 m/s, however around the equinoxes the wind changes to westerly and increases up to 1.5 m/s. If the saltation threshold for Titan sediment is between 1 and 1.5 m/s, then the dunes will only respond to the short window of westerly winds. We investigate this hypothesis in our model. In Figure 11 we present the zonal wind throughout a Titan year at 5 different latitudes, −30°, −15°, 0°, 15°, and 30°. Our simulations do not produce stronger zonal winds near equinox, however there is substantial variability in the base case model. The strongest winds in our base case model occur at +/−30° latitude near the summer solstice. The simulations with added torque do not display as strong of a seasonal cycle in wind speed and direction.

4. Conclusions

Past work [5,34] has shown the importance of topography in determining surface wind patterns on Titan, and authors [21] have shown that Titan’s dunes lie at high elevations. This work establishes the important role that topography plays in determining the surface winds at dune locations and shows that the addition of topography improves the correlations between dune presence and westerly winds, the predominant direction expected from dune observations [2]. Furthermore, the addition of a pressure dependent torque on the zonal winds creates a surface wind regime that is very consistent with the formation of stabilized linear dunes.
We find that our base case simulation produces predominantly easterly winds in the tropics, which are inconsistent with dune patterns on Titan. The inclusion of topography in our GCM changes the wind regime, creating more westerly winds. With the included topography, our simulated winds are bimodal and consistent with longitudinal dune formation over areas with unstable sediment. Observations suggest that the morphology of dunes on Titan may be most consistent with longitudinal dunes as well [1]. However, the average tropical wind in this simulation is only 0.3 m/s, which is much weaker than in our base case simulation and may not be sufficient to transport sand particles.
The addition of topography and a torque correction term that depends on elevation and latitude creates a wind pattern in which the mean wind direction matches the dune orientations to a remarkable degree (mean cosine of the difference angle of 0.95). The added torque is prescribed to compensate for the overly dissipative dynamical core, but that does not mean it cannot be informative for the dune-forming winds. This high degree of consistency between the winds and dune orientations may indicate a physical process that is shaping the dunes, or that improvements to the current dynamical core may generate a wind regime that is consistent with Titan dune formation. Such a process could be downslope winds.
The addition of this added torque reduces the modality of the wind, thus making it inconsistent with MGBNT theory for unstable bedforms. It is not certain how much of a constraint bimodality is for Titan’s dune-forming winds. Unimodal winds can also produce linear dunes when the sediment is locally stabilized [4]. The stability of Titan’s sediment is currently unconstrained.
Furthermore, the presence of dunes only in highlands may indicate the presence of widespread wetlands at low elevations on Titan where either the sediment supply is low, or the cohesion has increased sufficiently to hinder saltation. The future mission (recently selected by NASA), “Dragonfly”, is likely to provide new knowledge about the surface of Titan.
This paper highlights the importance of topography in models of Titan’s surface wind. Topography, even at course 4 × 5° resolution, was necessary to form wind patterns that were consistent with dune morphology. However, the dunes on Titan are responding to the local winds which are variable on a much smaller scale than we are currently able to model. Thus, much higher resolution GCMs or mesoscale models are required to resolve this interaction between the dune-forming winds and topography.

Author Contributions

E.J.L.L. designed the experiment and was the leading author on the manuscript.

Funding

This research received no external funding

Acknowledgments

The author would like to thank Brian Toon, Jim Friedson, and Lori Fenton for their helpful comments on this manuscript.

Conflicts of Interest

The authors declare no conflict of interest.

References

  1. Lorenz, R.D. The Sand Seas of Titan: Cassini RADAR Observations of Longitudinal Dunes. Science 2006, 312, 724–727. [Google Scholar] [CrossRef] [PubMed] [Green Version]
  2. Radebaugh, J.; Lorenz, R.D.; Lunine, J.I.; Wall, S.D.; Boubin, G.; Reffet, E.; Kirk, R.L.; Lopes, R.M.; Stofan, E.R.; Soderblom, L.; et al. Dunes on Titan observed by Cassini Radar. Icarus 2008, 194, 690–703. [Google Scholar] [CrossRef]
  3. Barnes, J.W.; Brown, R.H.; Soderblom, L.; Sotin, C.; Le Mouèlic, S.; Rodriguez, S.; Jaumann, R.; Beyer, R.A.; Buratti, B.J.; Pitman, K.; et al. Spectroscopy, morphometry, and photoclinometry of Titan’s dunefields from Cassini/VIMS. Icarus 2008, 195, 400–414. [Google Scholar] [CrossRef]
  4. Rubin, D.M.; Hesp, P.A. Multiple origins of linear dunes on Earth and Titan. Nat. Geosci. 2009, 2, 653–658. [Google Scholar] [CrossRef]
  5. Tokano, T. Dune-forming winds on Titan and the influence of topography. Icarus 2008, 194, 243–262. [Google Scholar] [CrossRef]
  6. Tokano, T. Relevance of fast westerlies at equinox for the eastward elongation of Titan’s dunes. Aeolian Res. 2010, 2, 113–127. [Google Scholar] [CrossRef]
  7. Radebaugh, J.; Lorenz, R.; Farr, T.; Paillou, P.; Savage, C.; Spencer, C. Linear dunes on Titan and earth: Initial remote sensing comparisons. Geomorphology 2010, 121, 122–132. [Google Scholar] [CrossRef]
  8. Rubin, D.M.; Ikeda, H. Flume experiments on the alignment of transverse, oblique, and longitudinal dunes in directionally varying flows. Sedimentology 1990, 37, 673–684. [Google Scholar] [CrossRef]
  9. Rubin, D.M.; Hunter, R.E. Bedform Alignment in Directionally Varying Flows. Science 1987, 237, 276–278. [Google Scholar] [CrossRef]
  10. Fenton, L.K.; Michaels, T.I.; Beyer, R.A. Inverse maximum gross bedform-normal transport 1: How to determine a dune-constructing wind regime using only imagery. Icarus 2014, 230, 5–14. [Google Scholar] [CrossRef]
  11. Friedson, A.J.; West, R.A.; Wilson, E.H.; Oyafuso, F.; Orton, G.S. A global climate model of Titan’s atmosphere and surface. Planet. Space Sci. 2009, 57, 1931–1949. [Google Scholar] [CrossRef]
  12. Larson, E.J.L.; Toon, O.B.; Friedson, A.J. Simulating Titan’s aerosols in a three dimensional general circulation model. Icarus 2014, 243, 400–419. [Google Scholar] [CrossRef]
  13. Lebonnois, S.; Burgalat, J.; Rannou, P.; Charnay, B. Titan global climate model: A new 3-dimensional version of the IPSL Titan GCM. Icarus 2012, 218, 707–722. [Google Scholar] [CrossRef]
  14. Newman, C.E.; Lee, C.; Lian, Y.; Richardson, M.I.; Toigo, A.D. Stratospheric superrotation in the TitanWRF model. Icarus 2011, 213, 636–654. [Google Scholar] [CrossRef]
  15. McDonald, G.D.; Hayes, A.G.; Ewing, R.C.; Lora, J.M.; Newman, C.E.; Tokano, T.; Lucas, A.; Soto, A.; Chen, G. Variations in Titan’s dune orientations as a result of orbital forcing. Icarus 2016, 270, 197–210. [Google Scholar] [CrossRef]
  16. Bagnold, R.A. The Physics of Blown Sand and Desert Dunes; Methuen: London, UK, 1941. [Google Scholar]
  17. Lorenz, R.D. Physics of saltation and sand transport on Titan: A brief review. Icarus 2014, 230, 162–167. [Google Scholar] [CrossRef]
  18. Ewing, R.C.; Hayes, A.G.; Lucas, A. Sand dune patterns on Titan controlled by long-term climate cycles. Nat. Geosci. 2015, 8, 15–19. [Google Scholar] [CrossRef]
  19. Charnay, B.; Barth, E.; Rafkin, S.; Narteau, C.; Lebonnois, S.; Rodriguez, S.; Courrech du Pont, S.; Lucas, A. Methane storms as a driver of Titan’s dune orientation. Nat. Geosci. 2015, 8, 362–366. [Google Scholar] [CrossRef]
  20. Lorenz, R.D.; Stiles, B.W.; Aharonson, O.; Lucas, A.; Hayes, A.G.; Kirk, R.L.; Zebker, H.A.; Turtle, E.P.; Neish, C.D.; Stofan, E.R.; et al. A global topographic map of Titan. Icarus 2013, 225, 367–377. [Google Scholar] [CrossRef] [Green Version]
  21. Corlies, P.; Hayes, A.G.; Birch, S.P.D.; Lorenz, R.; Stiles, B.W.; Kirk, R.; Poggiali, V.; Zebker, H.; Iess, L. Titan’s Topography and Shape at the End of the Cassini Mission: CORLIES ET AL: TITAN’S TOPOGRAPHY. Geophys. Res. Lett. 2017, 44, 11,754–11,761. [Google Scholar] [CrossRef]
  22. Lorenz, R.D.; Radebaugh, J. Global pattern of Titan’s dunes: Radar survey from the Cassini prime mission: PATTERN OF TITAN’S DUNES. Geophys. Res. Lett. 2009, 36. [Google Scholar] [CrossRef]
  23. Wilson, I.G. Ergs. Sediment. Geol. 1973, 10, 77–106. [Google Scholar] [CrossRef]
  24. Tanaka, K.; Rodriguez, J.; Skinnerjr, J.; Bourke, M.; Fortezzo, C.; Herkenhoff, K.; Kolb, E.; Okubo, C. North polar region of Mars: Advances in stratigraphy, structure, and erosional modification. Icarus 2008, 196, 318–358. [Google Scholar] [CrossRef]
  25. Le Gall, A.; Hayes, A.G.; Ewing, R.; Janssen, M.A.; Radebaugh, J.; Savage, C.; Encrenaz, P. Latitudinal and altitudinal controls of Titan’s dune field morphometry. Icarus 2012, 217, 231–242. [Google Scholar] [CrossRef]
  26. Neish, C.D.; Lorenz, R.D. Elevation distribution of Titan’s craters suggests extensive wetlands. Icarus 2014, 228, 27–34. [Google Scholar] [CrossRef]
  27. Kazeminejad, B.; Atkinson, D.H.; Pérez-Ayúcar, M.; Lebreton, J.-P.; Sollazzo, C. Huygens’ entry and descent through Titan’s atmosphere—Methodology and results of the trajectory reconstruction. Planet. Space Sci. 2007, 55, 1845–1876. [Google Scholar] [CrossRef]
  28. Karkoschka, E. Titan’s meridional wind profile and Huygens’ orientation and swing inferred from the geometry of DISR imaging. Icarus 2016, 270, 326–338. [Google Scholar] [CrossRef]
  29. Tokano, T. Near-surface winds at the Huygens site on Titan: Interpretation by means of a general circulation model. Planet. Space Sci. 2007, 55, 1990–2009. [Google Scholar] [CrossRef]
  30. Fryberger, S.G.; Ahlbrandt, T.S.; Andrews, S. Origin, sedimentary features, and significance of low-angle eolian “sand sheet” deposits, Great Sand Dunes National Monument and vicinity, Colorado. J. Sediment. Res. 1979, 49, 733–746. [Google Scholar] [CrossRef]
  31. Burr, D.M.; Bridges, N.T.; Marshall, J.R.; Smith, J.K.; White, B.R.; Emery, J.P. Higher-than-predicted saltation threshold wind speeds on Titan. Nature 2015, 517, 60–63. [Google Scholar] [CrossRef]
  32. Sullivan, R.; Kok, J.F. Aeolian saltation on Mars at low wind speeds: Low Speed Aeolian Saltation on Mars. J. Geophys. Res. Planets 2017, 122, 2111–2143. [Google Scholar] [CrossRef]
  33. Courrech du Pont, S.; Narteau, C.; Gao, X. Two modes for dune orientation. Geology 2014, 42, 743–746. [Google Scholar] [CrossRef] [Green Version]
  34. Tokano, T. Mountain torque and its influence on the atmospheric angular momentum on Titan. Icarus 2012, 220, 863–876. [Google Scholar] [CrossRef]
Figure 1. Added torque (m/s2) in our lowest model layer at 170 m altitude. Warm colors are prograde (westerly) and cool colors are retrograde directions.
Atmosphere 10 00600 g001
Figure 2. Titan surface topography (m) created by the Cassini Radar Team [20] overlain with dune orientations [22].
Atmosphere 10 00600 g002
Figure 3. Hypsometry of 1 × 1° grid cells at dune locations, less than 30° latitude, and of all Titan.
Atmosphere 10 00600 g003
Figure 4. Profiles of the area-weighted number of 5° bins with dune fields (solid) and the area-weighted mean elevation in 1° bins (dashed) in latitude (top) and longitude (bottom).
Atmosphere 10 00600 g004
Figure 5. Zonal winds (m/s, colors) with wind vectors over plotted for the four simulations. The color bar indicates magnitudes for the zonal wind component. Note the change in scale. Clockwise from the upper left, they are: 1) the base case model (BC), 2) BC with topography, 3) BC with topography and torque, 4) BC with torque.
Atmosphere 10 00600 g005
Figure 6. Downwind wind rose diagrams (wind directions from the center out) for the tropics (+/−30°) for one Titan year. Placement is the same as Figure 5. Note the changes in scale.
Atmosphere 10 00600 g006
Figure 7. Average wind speed histograms of the simulations during one Titan year. Outlines indicate all of Titan, while the shaded region indicates grid cells with dunes.
Atmosphere 10 00600 g007
Figure 8. Direction of mean sand transport at grid cells with dunes present for four different threshold wind speeds. The north–south and east–west transport vectors are averaged for each grid cell with dunes present. This indicates the mean direction of sediment transport. Considering that most dune orientations indicate a westerly resultant drift direction (RDD), this indicates how well our average equatorial wind regime at dune locations matches the dune orientations and how that changes as a function of saltation threshold.
Atmosphere 10 00600 g008
Figure 9. RDD vectors for each simulation with wind threshold of 0 m/s overlaying the topographic map with dune orientation vectors from Figure 2.
Atmosphere 10 00600 g009
Figure 10. Average predicted dune bedform crestline orientations from our four simulations at the grid cells with dunes present along with the dune orientation direction. Similar to Figure 8, the north–south and east–west crestline vectors are averaged for each grid cell with dunes present, then the average bedform crestline is calculated. This indicates the mean direction of sediment transport. This figure indicates how well our average equatorial wind regime at dune locations matches the average dune alignment and how that changes as a function of saltation threshold.
Atmosphere 10 00600 g010
Figure 11. Zonal wind speed over one Titan year in the four simulations. From the top down, they are the base case model (BC), BC with topography, BC with topography and added torque, and BC with added torque. Not the difference in scale.
Atmosphere 10 00600 g011
Table 1. Statistical tests comparing our simulated model parameters with dune presence and orientation for a threshold speed of 0 m/s.
Statistical TestBase CaseTopographyEQ TorqueTopography and Torque
Wind speed and dune pres. cor.0.240.010.250.20
RDD and dune dir. delta cos.−0.86−0.24−0.960.95

