Article

Comparative Mitogenome Analysis of Two Native Apple Snail Species (Ampullariidae, Pomacea) from Peruvian Amazon

1
Facultad de Ciencias Biológicas, Universidad Nacional Mayor de San Marcos, Av. Carlos Germán Amezaga 375, Lima 15081, Peru
2
Museo de Historia Natural, Universidad Nacional Mayor de San Marcos, Av. Arenales 1256, Lima 15046, Peru
3
Department of Natural History, NTNU University Museum, Norwegian University of Science and Technology, Erlings Skakkes gate 47B, 7012 Trondheim, Norway
4
Department of Marine Zoology, Senckenberg Research Institute, 60325 Frankfurt am Main, Germany
5
Department of Plant and Environmental Protection Services, University of Hawaii at Manoa, Honolulu, HI 96822, USA
6
U.S. Department of Agriculture-Agricultural Research Service, Daniel K. Inouye U.S. Pacific Basin Agricultural Research Center, Tropical Pest Genetics and Molecular Biology Research Unit, Hilo, HI 96720, USA
*
Author to whom correspondence should be addressed.
Genes 2023, 14(9), 1769; https://doi.org/10.3390/genes14091769
Submission received: 13 July 2023 / Revised: 22 August 2023 / Accepted: 31 August 2023 / Published: 7 September 2023
(This article belongs to the Special Issue Mitochondrial DNA Replication and Transcription)

Abstract

:
Apple snails of the genus Pomacea Perry, 1810 (Mollusca: Caenogastropoda: Ampullariidae) are native to the Neotropics and exhibit high species diversity, holding cultural and ecological significance as an important protein source in Peru. However, most genetic studies in Pomacea have focused mostly on invasive species, especially in Southeast Asia, where they are considered important pests. In this study, we assembled and annotated the mitochondrial genomes of two Pomacea species native to the Peruvian Amazon: Pomacea reevei Ampuero & Ramírez, 2023 and Pomacea aulanieri (Deville & Hupé, 1850). The mitogenomes of P. reevei and P. aulanieri comprise 15,660 and 16,096 bp, respectively, and contain the typical 37 genes of the animal mitochondria with a large control region of 292 bp in P. reevei and 524 bp in P. aulanieri—which fall within the range of what is currently known in Pomacea. Comparisons with previously published mitogenomes in Pomacea revealed differences in the overlapping of adjacent genes, the size of certain protein-coding genes (PCGs) and the secondary structure of some tRNAs that are consistent with the phylogenetic relationships between these species. These findings provide valuable insights into the systematics and genomics of the genus Pomacea.

Graphical Abstract

1. Introduction

The members of the genus Pomacea Perry, 1810 (Mollusca: Canogastropoda: Ampullariidae) are commonly known as apple snails and can be found in freshwater habitats such as small ponds, lakes, swamps and canals, extending throughout the Neotropical Region, from Argentina to southeast US and the Caribbean Islands [1]. However, in recent decades, certain species such as Pomacea canaliculata (Lamarck, 1822) or Pomacea maculata Perry, 1810 have gained growing importance as invasive species, becoming pests of high economic impact on natural habitats and agricultural areas, particularly in China and Southeast Asia [2].
Given the utility of mitochondrial DNA in elucidating animal systematics and evolutionary patterns [3,4,5], these studies have been primarily based on mitochondrial markers. Therefore, mitochondrial genomes have been made available for invasive species such as P. canaliculata [6,7], P. maculata [8] and Pomacea diffusa Blume, 1957 [9,10]. Comparative analyses between Pomacea mitochondrial genomes have provided new insights into their genetic diversity [11,12]. However, in order to gain a comprehensive understanding of the genus, we need to extend this type of study to native Pomacea species by sequencing and comparing their mitochondrial genomes.
Hayes et al. [13] identified four large clades within Pomacea based on three nuclear genes, as well as the mitochondrial markers COI and 16S rRNA: the widespread P. canaliculata group, including similar species such as P. maculata [14] and Pomacea occulta Yang & Yu, 2019 [15]; the Pomacea bridgesii group, including P. diffusa; and the more restricted Effusa and Flagellata clades.
In the Peruvian Amazon, where apple snails are commonly referred to as “churos”, nearly 20 Pomacea species have been reported. However, our understanding of their taxonomy and evolutionary relationships remains limited [16], gaining more attention only in recent times [17,18,19]. While the phylogenetic relationships of certain Peruvian species such as Pomacea aulanieri (Deville & Hupé, 1850) of the P. bridgesii clade and the newly described Pomacea reevei Ampuero & Ramírez 2023 of the P. canaliculata clade have been recently elucidated by employing mitochondrial markers [18], the integration of mitochondrial genome information has the potential to offer fresh perspectives on their evolution and phylogenetics. Therefore, the aim of this study was to assemble and annotate the first mitochondrial genome of two native species of Pomacea from the Peruvian Amazon: P. reevei and P. aulanieri.

2. Materials and Methods

2.1. Sample Collection and DNA Extraction

Samples of P. reevei and P. aulanieri were bought from local fishermen from Loreto, Peru (Napo and Huallaga basins, respectively). The identification of the specimens was based on shell morphology and anatomical characteristics and corroborated using molecular data [18]. Furthermore, P. reevei has recently been identified and described as a new species [19]. They were relaxed using ethanol, euthanized through thermal shock (4 °C) and then fixed and preserved in 96% ethanol [20]. Genomic DNA (gDNA) was extracted from 1 cm3 of tissue using the E.Z.N.A. Mollusc DNA Kit (OMEGA Bio-tek, Norcross, GA, USA). Concentration and quality of gDNA were measured using the Nanodrop Lite Spectrophotometer. DNA integrity was verified using 1% agarose gel electrophoresis. Voucher specimens (Figure S1) were deposited in the Museo de Historia Natural of the Universidad Nacional Mayor de San Marcos, Lima, Peru.

2.2. Genome Sequencing and Assembly

The whole genomes of P. reevei and P. aulanieri were sequenced by Macrogen Inc. (Seoul, South Korea) using an Illumina NovaSeq 6000 platform. Before sequencing, gDNA integrity was verified using TapeStation gDNA Screen Tape on the 4200 TapeStation System. Approximately 5 Gb of raw data from 150 bp paired-end reads were generated for each sample. Raw data quality was evaluated using FastQC (https://www.bioinformatics.babraham.ac.uk/projects/fastqc/, accessed on 15 October 2022) and processed using Fastp [21] by removing reads with >40% bases with Phred quality < Q15, trimming adapter sequences with >6 bases and trimming polyG tails. Mitogenome assemblies were obtained using GetOrganelle [22] with the Pomacea canaliculata mitochondrial genome (KU052865.1) as a starting reference. Bandage [23] was used to verify if the assembly graph was circular.

2.3. Annotation of Mitochondrial Genome and Predictions of Secondary Structures

The MITOS2 web server (http://mitos2.bioinf.uni-leipzig.de/index.py, accessed on 18 February 2023) [24] was used to predict the protein-coding genes (PCGs), transfer RNAs (tRNAs) and ribosomal RNAs (rRNAs). The annotation of the tRNAs was confirmed using ARWEN 1.2 (http://130.235.244.92/ARWEN/index.html, accessed on 18 February 2023) [25]. Protein-coding genes were manually corrected by searching for open reading frameworks (ORFs) with the NCBI tool ORFfinder (https://www.ncbi.nlm.nih.gov/orffinder/, accessed on 18 February 2023). Secondary structure of the RNAs was inferred using R2DT (https://rnacentral.org/r2dt, accessed on 19 February 2023) [26] and manually optimized using the 12S rRNA Eukaryote reference model [27] and the 16S rRNA Mollusca and Toxoplasma gondii (Nicolle & Manceaux, 1908) reference models [28,29]. Potential secondary structure of the control region (CR) was predicted using the RNAfold web server (http://rna.tbi.univie.ac.at//cgi-bin/RNAWebSuite/RNAfold.cgi, accessed on 19 February 2023). All secondary structures were drawn using Inkscape 1.1 (http://www.inkscape.org/, accessed on 25 February 2023). The mitochondrial genome maps of both species were drawn using the CGView tools [30] available at the web server Proksee (https://proksee.ca/, accessed on 26 February 2023). The mitochondrial genome and annotation files of P. canaliculata (KJ739609.1), P. diffusa (MF373586.1), P. maculata (MF401379.1) and P. occulta (KR350466.1) were retrieved from GenBank. We performed a re-annotation of these mitochondrial genomes using MITOS2 Web Server [24] and ORFfinder to verify current annotations.

2.4. Comparative Analysis

Nucleotide composition was calculated using MEGA X [31] for complete mitogenomes, PCGs, tRNAs, rRNAs and CR. Compositional asymmetry was calculated using the formulas for AT-skew = (A − T)/(A + T) and GC-skew = (G − C)/(G + C) [32]. Relative synonymous codon usage (RSCU) values were calculated using MEGA X [31]. Nucleotide diversity (π) was determined using DnaSP6 [33] with a sliding window analysis of 200 bp and a step size of 25 bp. Overall mean p-distance was calculated for each PCG using MEGA X [31]. The nonsynonymous nucleotide substitutions per nonsynonymous site (Ka), the synonymous nucleotide substitutions per synonymous site (Ks) and the ratio of nucleotide nonsynonymous to synonymous substitutions (Ka/Ks) were calculated for each PCG using DnaSP6 [33].

2.5. Phylogenetic Analysis

The phylogenetic analyses included 35 sequences of Caenogastropoda species and two outgroup species: Haliotis rubra Leach, 1814 (AY588938) and Aplysia californica Cooper, 1863 (AY569552). Orthologs of the nucleotide sequences of the 13 PCGs, 12S rRNA and 16S rRNA were individually aligned using Muscle 3.8 [34] implemented in Aliview 1.27 [35]. Ambiguous aligned regions were identified and removed using Gblocks 0.91b [36] under relaxed conditions in PhyloSuite v1.2.3 [37]. Individual gene alignments were concatenated using PhyloSuite v1.2.3 [37]. PartitionFinder2 v2.1.1 [38] in PhyloSuite v1.2.3 [37] was used to determine the best partitioning scheme and substitution model. Maximum Likelihood (ML) analysis was performed using IQ-TREE 2.1.2 [39] on the CIPRES Science Gateway web server [40], with 10,000 ultrafast bootstrap replicates. Bayesian Inference (BI) analysis was performed using MrBayes 3.2 [41] on the CIPRES Science Gateway web server [40], with two independent runs of four Markov Chain Monte Carlo (MCMC) chains running for 2 million generations and sampling every 1000 generations with a burn-in of 25%. The resulting phylogenetic trees were visualized through FigTree v1.4.3 [42] and edited with Inskape 1.1. (http://www.inkscape.org/, accessed on 25 March 2023).

3. Results and Discussion

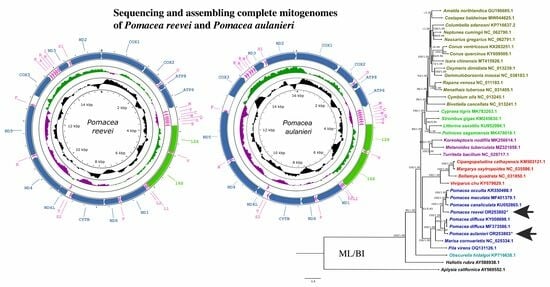
3.1. Organization and Structure of the Mitogenomes

The mitochondrial genomes of P. reevei and P. aulanieri (GenBank accession numbers OR253802 and OR253803, respectively) contained the typical 37 genes (13 PCGs, two rRNAs and 22 tRNAs) and a large non-coding region known as the CR (Figure 1, Table 1 and Table 2), although circular assemblies were not achieved, due to repetitive sequences within this region. Previous studies in Pomacea also failed to recover the complete CR [12] or have not reported it [11]. Most genes, including all PCGs and rRNAs, were encoded on the heavy strand (H-strand), whereas eight tRNAs (tRNA-Met, tRNA-Tyr, tRNA-Cys, tRNA-Trp, tRNA-Gln, tRNA-Gly, tRNA-Glu, tRNA-Thr) were located on the light strand (L-strand). The lengths of both mitogenomes were similar: 15,660 bp in P. reevei and 16,096 bp in P. aulanieri. These values closely matched previous reports in other Pomacea species, where lengths between 15,516 (P. occulta) and 16,373 bp (P. diffusa) have been reported [6,7,8,9,10,11,12]. Both mitogenomes showed identical gene arrangements, which are consistent with other Ampullaridae species. Including the CR, 24 intergenic regions were identified in P. reevei, ranging from 2 to 292 bp, for a total of 714 bp (4.6% of mitogenome), whereas 25 intergenic regions were identified in P. aulanieri, ranging from 3 to 524, for a total of 1081 bp (6.7% of mitogenome). The intergenic regions represented 4.8% of the mitogenome in P. canaliculata [6], 3.5% in P. maculata [12] and 10.1% in P. diffusa [12].
The longest overlapping region was found between NAD5/tRNA-Phe in P. aulanieri (21 bp), although this overlapping was only 2 bp in P. reevei. This overlapping has also been reported in P. diffusa [11], with a similar length (20 bp) to P. aulanieri, but not in P. canaliculata, P. maculata nor P. occulta [11,12]. Both P. reevei and P. aulanieri also showed an overlapping region of 7 bp between NAD4L/NAD4 that has been reported in other Ampullariidae such as Marisa cornuarietis (Linnaeus, 1758) [43] and P. diffusa [11], as well as other Caenogastropoda [44,45,46]. The re-annotation of the mitogenomes of P. canaliculata, P. maculata and P. occulta in the present study showed that these species also had this overlapping, although it had not been previously reported [6,7,11,12]. P. aulanieri additionally showed two small overlapping regions between tRNA-Pro/NAD6 (1 bp) and tRNA-Ser1/NAD2 (1 bp). The overlapping between NAD1/tRNA-Pro reported for P. canaliculata, P. maculata and P. occulta [6,7,11,12] has not been found in P. reevei nor P. aulanieri. The protein-coding genes, rRNAs and tRNAs comprised 71.78%, 14.37% and 9.36% of the whole mitochondrial genome of P. reevei, respectively. Similar values were observed in P. aulanieri, where protein-coding genes, rRNAs and tRNAs represented 69.93%, 14.34% and 9.23%, respectively.

3.2. Nucleotide Composition

The base composition of the mitogenomes of P. reevei (30.10% A, 44.88% T, 13.14% C, 15.87% G) and P. aulanieri (29.48% A, 39.37% T, 14.83% C, 16.32% G) was similar (Table 3), showing a high content of A + T (70.98% in P. reevei and 68.85% in P. aulanieri), a negative AT-skew (−0.15 in P. reevei and −0.14 in P. aulanieri) and a positive GC-skew (0.09 in P. reevei and 0.05 in P. aulanieri). Comparing the different sets of elements of the mitogenome, the CR (77.4%) showed the highest A + T content in P. reevei, whereas in P. aulanieri, the tRNAs (71.58%) and the CR (71.56%) showed the highest values. In both mitogenomes, the lowest A+T content was found in the PCGs. The PCGs also showed the lowest AT-skew, whereas the rRNAs had the highest AT-skew in both mitogenomes. Interestingly, although the GC-skew values were positive for the whole mitogenome, PCGs, rRNAs and tRNAs of P. reevei and P. aulanieri, the CR of the former showed a positive value, whereas in the latter, this region had a negative value. This difference in the GC-skew of the CR can also be observed in Figure 1.
The comparison of the A + T content (Figure 2), between P. reevei, P. aulanieri and other species of Pomacea, showed that the A + T content of P. reevei (70.98%) was similar to species such as P. canaliculata (71.69%), P. maculata (72.31%) and P. occulta (71.93%), whereas the A+T content of P. aulanieri (68.85%) was the lowest among the compared species and similar to P. diffusa (69.49%). A similar pattern was found after comparing the A+T content of the PCGs, rRNAs, tRNAs and especially the CR, where P. reevei (77.40%), P. canaliculata (79.39%), P. maculata (85.82%) and P. occulta (86.57%) of the P. canaliculata clade showed high values, in contrast to P. aulanieri (71.56%) and P. diffusa (73.70%) of the P. bridgesii clade, although these values could be affected by the recovered length of the CR in each species.
Negative AT-skew values were observed for the whole mitogenome, protein-coding genes and tRNAs of all Pomacea, whereas positive values were observed in the rRNAs (Figure 3). Although the CR of P. reevei and P. aulanieri showed a negative AT-skew, in other species, this value was positive (e.g., P. canaliculata or P. diffusa). A similar pattern was observed in the GC-skew (Figure 4), where the whole mitogenomes and most of the features (PCGs, rRNAs and tRNAs) showed positive values, except for the CR of P. aulanieri and P. diffusa. Perna and Kocher [32] suggested that differences in the number and direction of AT-skew and GC-skew values reflect variations in selective pressures and nucleotide substitution processes. Additionally, the positive AT-skew values of rRNAs and slightly negative values for tRNAs contrast with the strongly negative values of PCGs. Therefore, this finding may be a signal of the strong selective pressures that force PCGs to eliminate deleterious mutations.

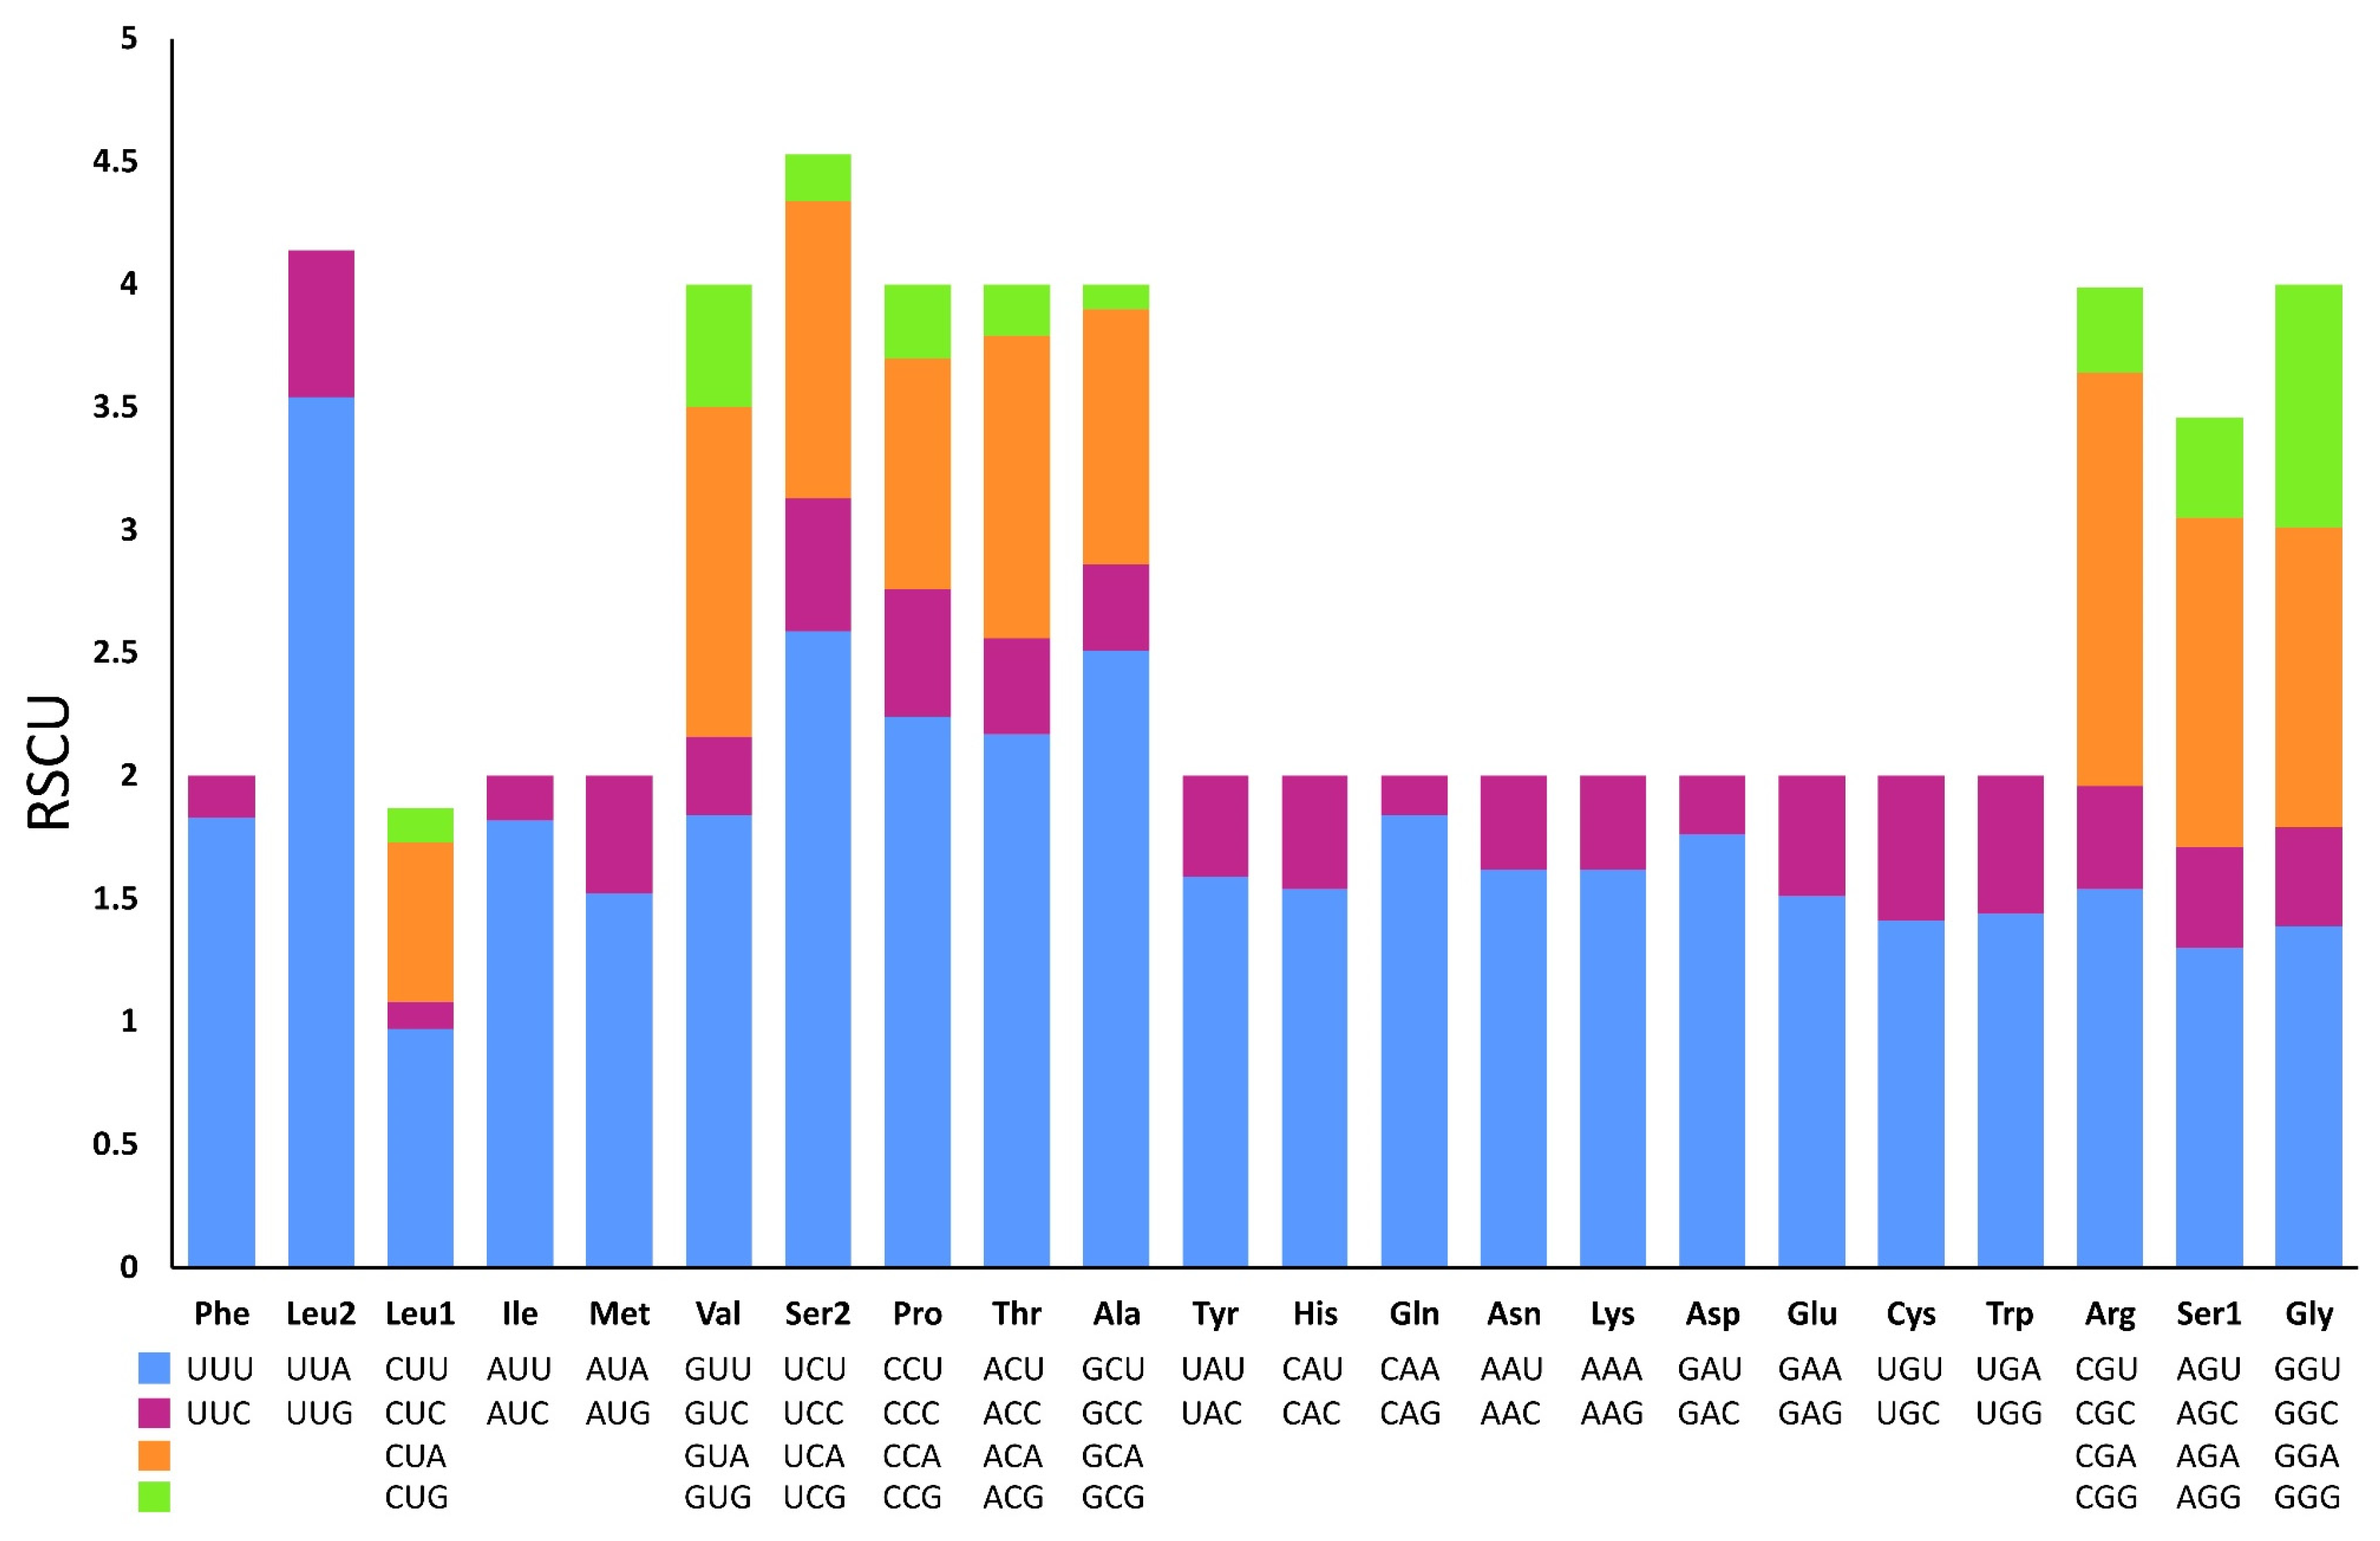
3.3. Protein-Coding Genes and Codon Usage

The length of the PCGs ranged from 159 bp (ATP8) to 1707 bp (NAD5) in P. reevei and the same was observed in P. aulanieri, but NAD5 was slightly longer (1728 bp). A comparison of the length of all PCGs among reported Pomacea mitogenomes [6,7,8,9,10,11,12] revealed that the size of COI (1536 bp), COII (687 bp), ATP8 (159 bp), NAD6 (495 bp), CytB (1140 bp), NAD4L (297 bp), COIII (780 bp) and NAD3 (354 bp) is conserved among all species. The ATP6 of most Pomacea showed the same length (699 bp), with the exception of P. diffusa (714 bp). In NAD1, NAD4 and NAD5, we identified three groups: (1) P. reevei, with 939, 1374 and 1707 bp; (2) P. maculata, P. canaliculata and P. occulta, with 960, 1368 and 1710 bp; and (3) P. aulanieri and P. diffusa, with 945, 1362 and 1728 bp, respectively. The most conspicuous variation in size was found in NAD2: 1062 bp (P. canaliculata and P. maculata), 1065 bp (P. occulta), 1071 bp (P. diffusa) and 1074 bp (P. reevei and P. aulanieri).
The start codon in all PCGs of both species was the same (ATG), similar to reports from P. diffusa [9] and Marisa cornuarietis [43], although in P. canaliculata, P. maculata and P. occulta, the start codon of COIII was ATA. The most common stop codon was TAA, found in 12 proteins of P. reevei and 9 of P. aulanieri. Only ATP6 in P. reevei used TAG, whereas ATP8, ATP6, NAD3 and NAD2 ended with this stop codon in P. aulanieri. Most Pomacea species also showed a preference for TAA as a stop codon [11,12].
Excluding the stop codons, 3734 and 3739 codons were identified in the mitogenome of P. reevei and P. aulanieri, respectively. The codon usage pattern analysis of the PCGs in P. reevei (Table 4, Figure 5) showed that the most frequent amino acids were Leu (16.6%), Ser (14.18%) and Phe (9.1%), and the least used were Cys (1.18%) and Arg (1.5%). The most frequently detected codons in P. reevei were UUA (Leu2) and UUU (Phe), whereas the least common codon was CGG (Arg). Similar values were observed in P. aulanieri (Table S1, Figure S2), although here, CGC (Arg) was the least frequently used codon. In both species, all amino acids have their preferred codons.
Sun et al. [47] indicated that nucleotide compositional asymmetry in the coding strand could affect codon and amino acid usage. Therefore, we expected that based on the negative AT-skew and positive GC-skew of the Pomacea mitogenome, amino acids coded by GT-rich codons might be more frequently used than AC-rich codons. We corroborated this in both species (P. reevei and P. aulanieri), since the most abundant amino acids were Leu2 (TTN) and Phe (TTN). Yang et al. [11] found that in Pomacea, codons ending in A or T were more frequent than those ending in C or G. This pattern was found in this study, since in P. reevei and P. aulanieri codons ending in T (47.2% and 43.9%, respectively) and A (35.4% and 33.3%, respectively) collectively represent more than half of all codons.

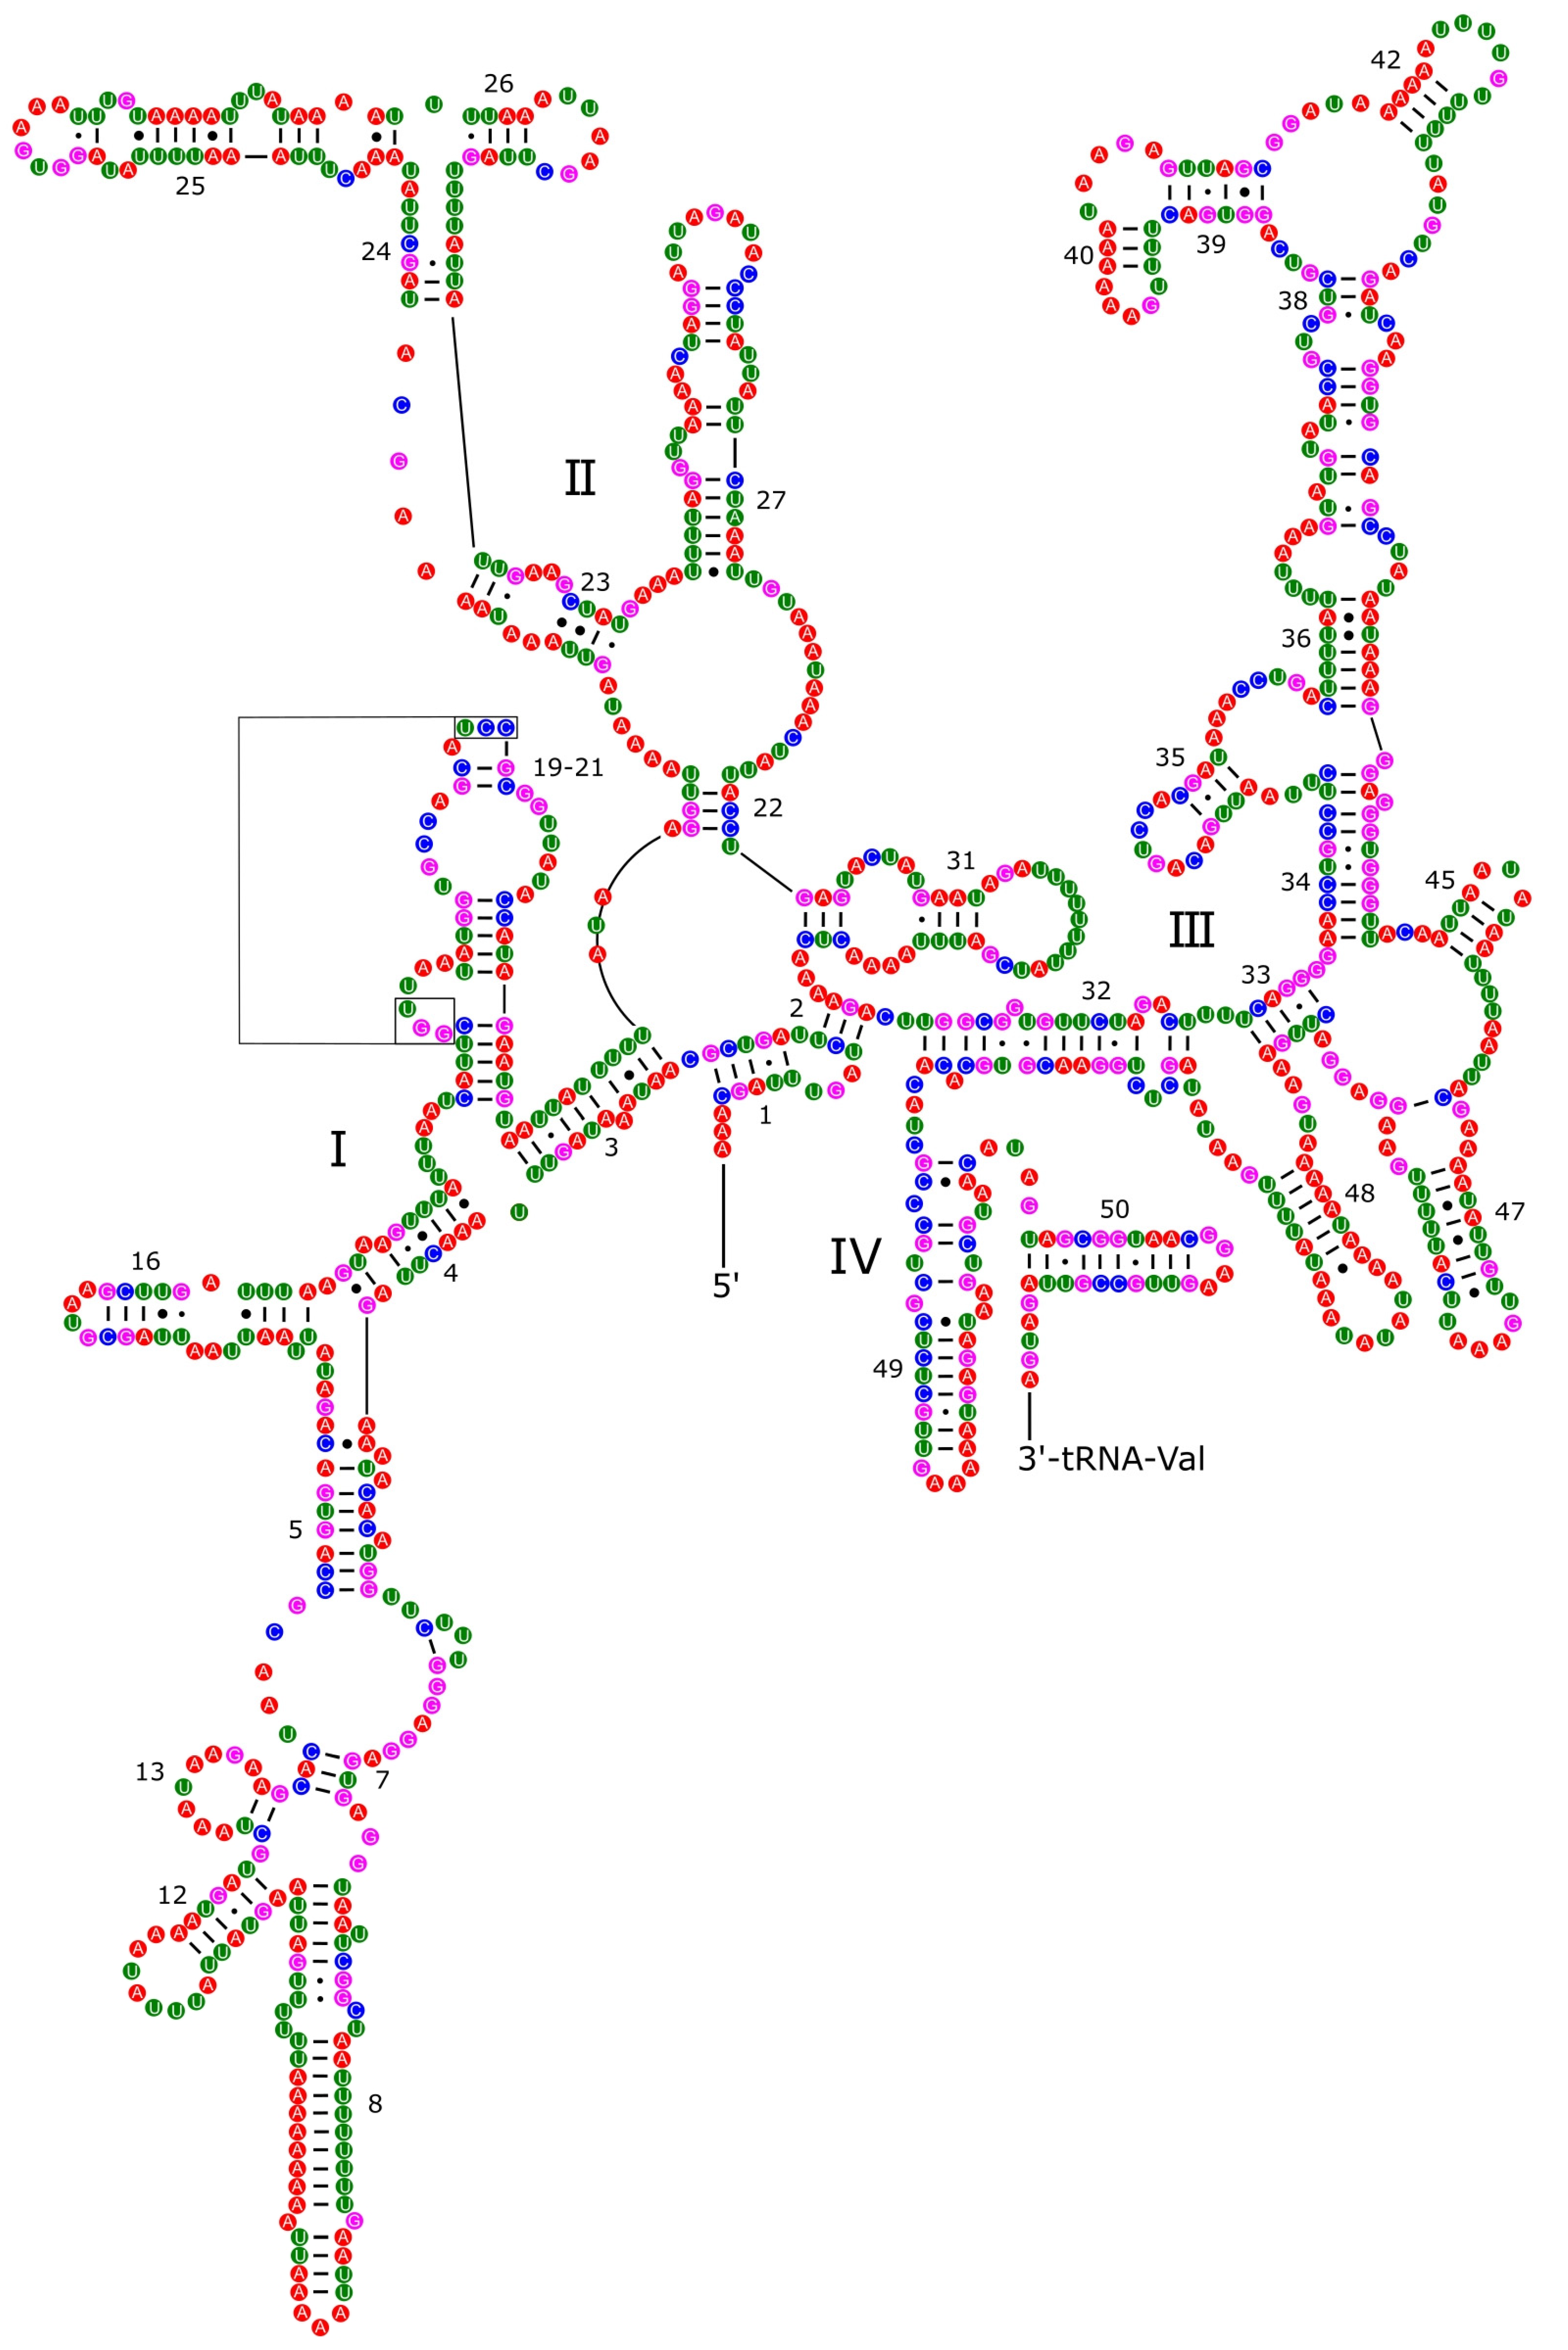
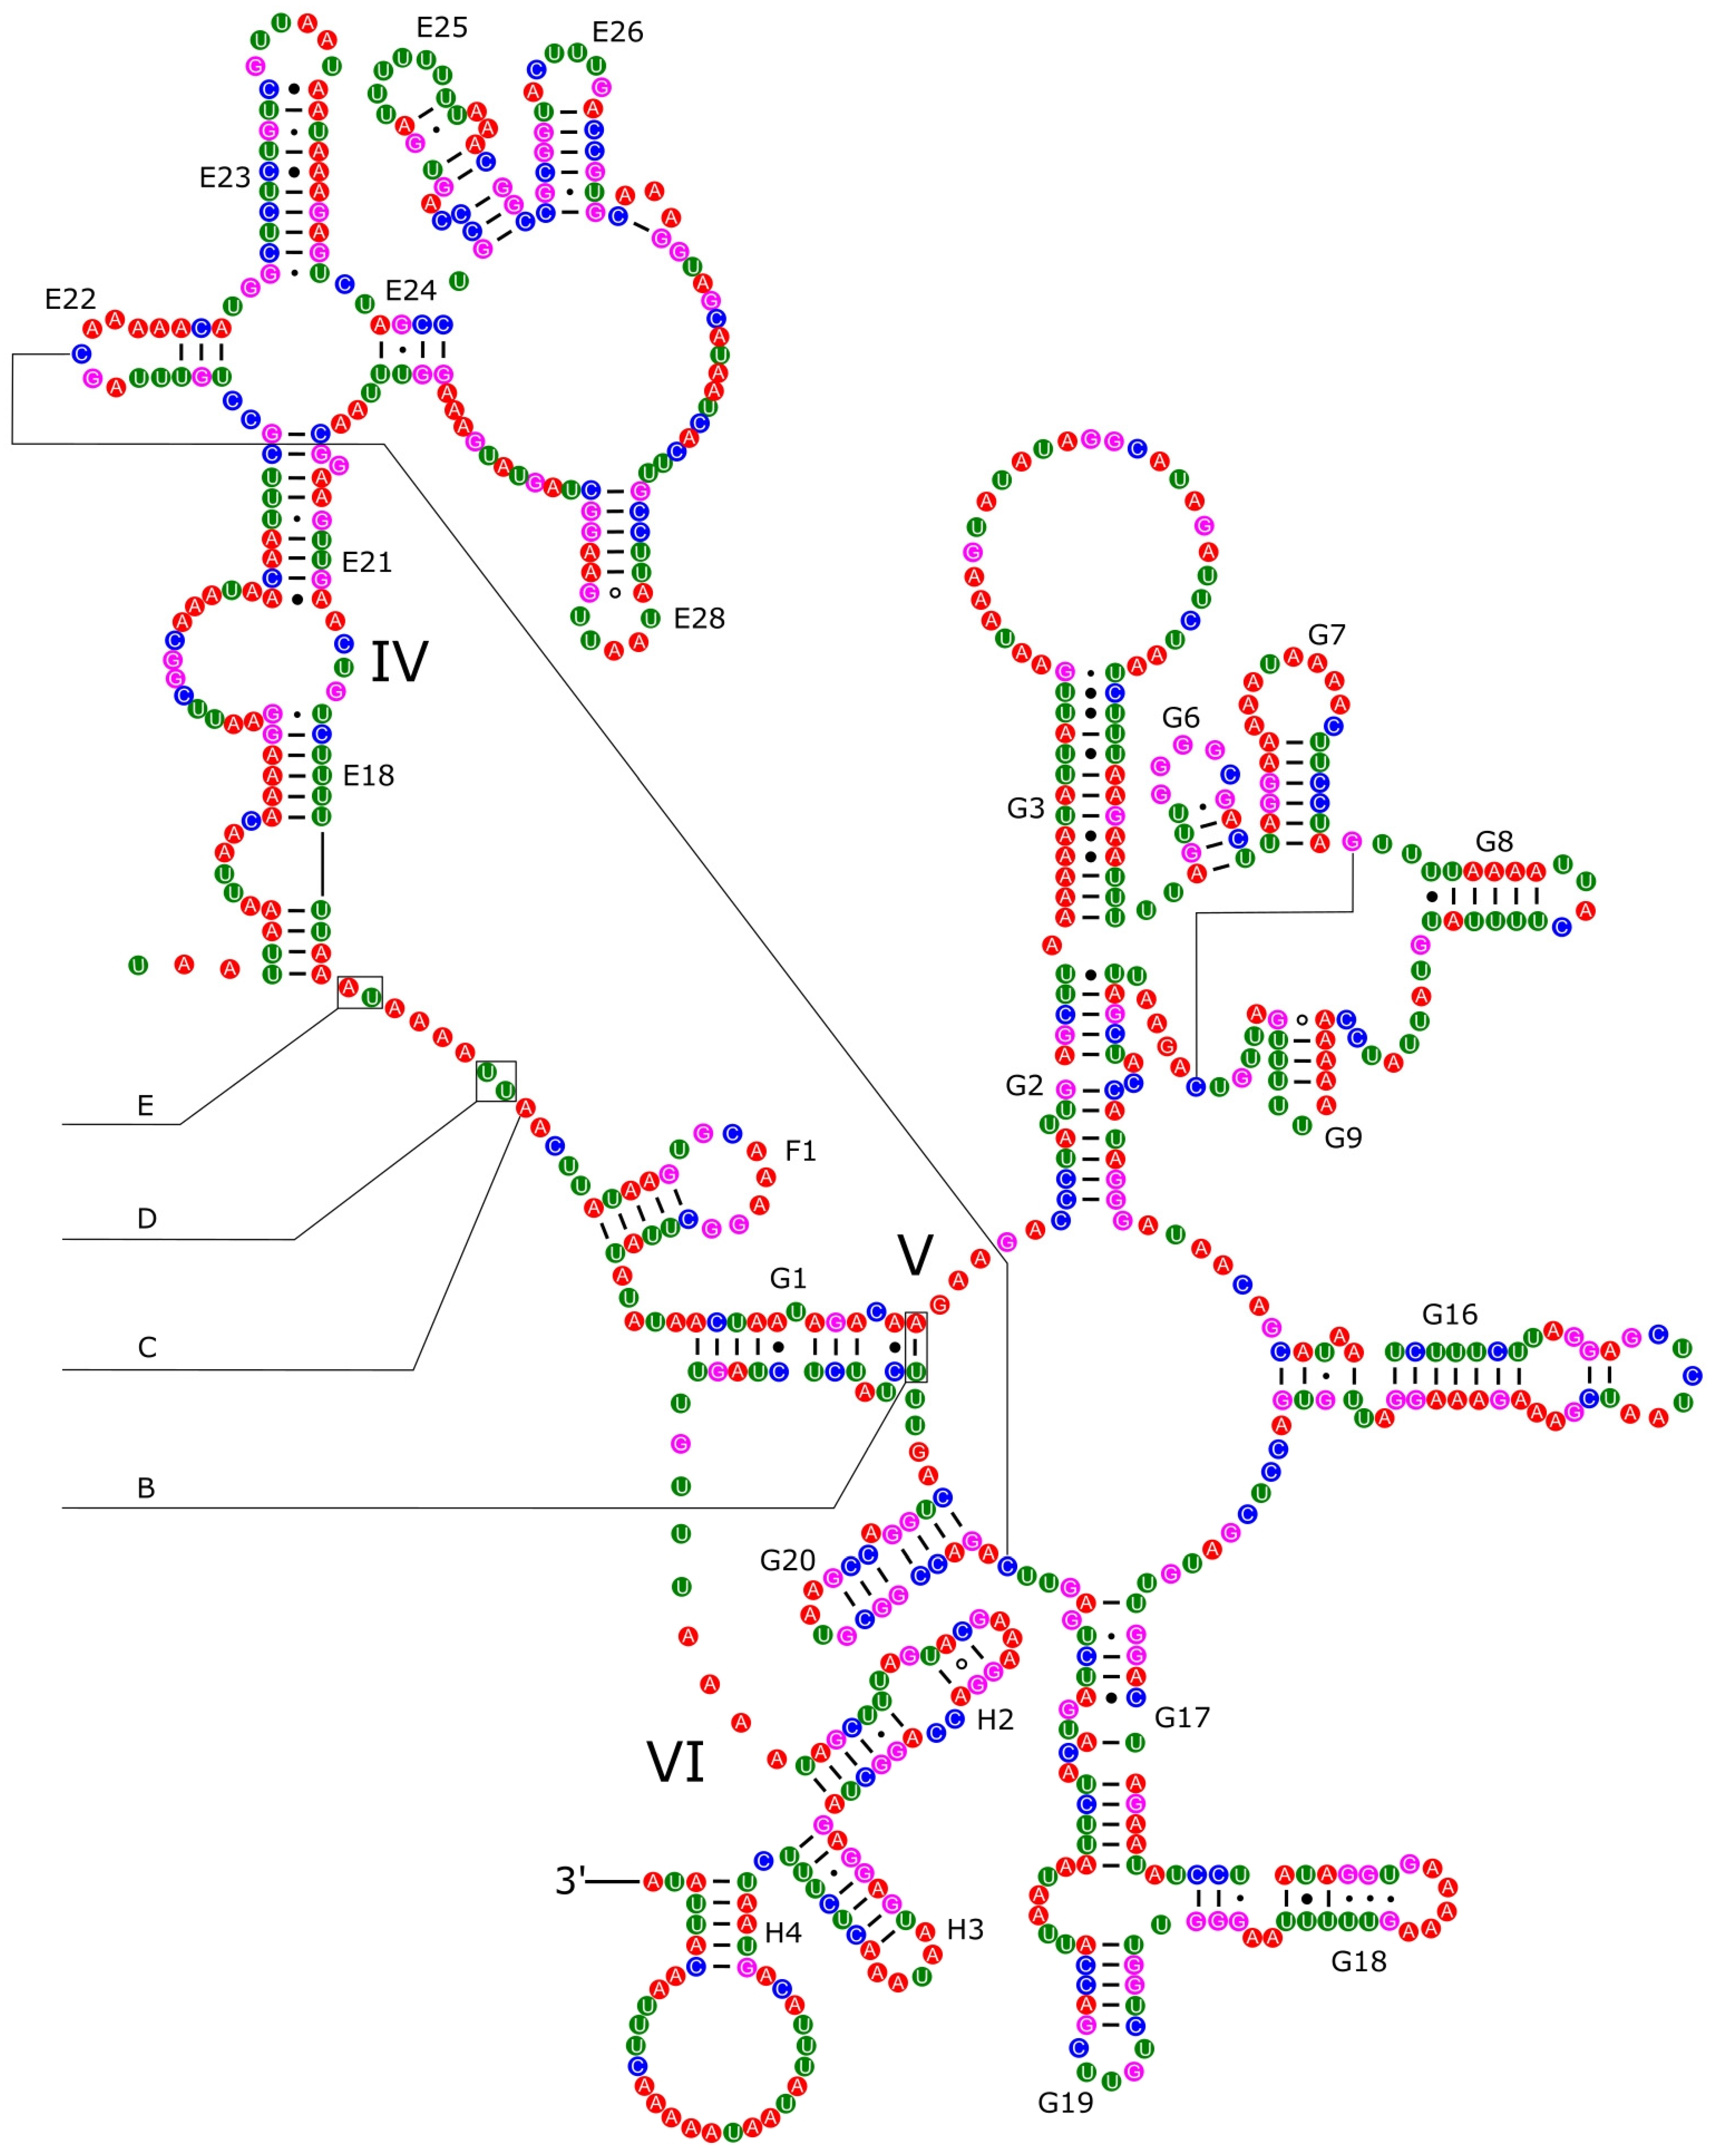
3.4. Ribosomal and Transfer RNA Genes

Similar to other Pomacea species, the mitochondrial genome of P. reevei and P. aulanieri contained two ribosomal RNA. The 12S rRNA had a length of 909 bp in P. reevei and 960 bp in P. aulanieri, whereas the length of 16S rRNA was 1340 bp in P. reevei and 1348 bp in P. aulanieri. Based on the 12S rRNA and 16S rRNA length in Pomacea, three groups can be identified: (1) P. reevei, with a length of 909 and 1340 bp, respectively; (2) P. maculata, P. canaliculata and P. occulta, with a range of lengths of 929–936 and 1331–1336 bp, respectively; and (3) P. aulanieri and P. diffusa, with a range of lengths of 952–958 and 1346–1348 bp, respectively.
Secondary structures of ribosomal RNAs have been poorly explored among mollusks and the structures presented here for P. reevei and P. aulanieri are the first inferred within Pomacea. The secondary structure of the 12S rRNA of P. reevei (Figure 6) and P. aulanieri (Figure S3) had an identical organization of four structural domains, with Domain III as the most conserved region, allowing its successful PCR across a wide variety of taxa [48]. Here, we found that the structure of Domain III in P. reevei and P. aulanieri is similar to previous reports in other mollusks [27,49,50,51]. On the other hand, Domains I and II have been poorly studied and they were difficult to infer in both species. Simon et al. [48] indicated that these regions showed less homoplasy than Domains III and IV so they could be more phylogenetically informative and particularly useful for resolving ancient evolutionary relationships.
The 16S rRNA had a length of 1340 bp in P. reevei (Figure 7 and Figure 8) and 1348 bp in P. aulanieri (Figures S4 and S5), showing the same organization, with six structural domains. These secondary structures agree with the mollusk consensus structure proposed by Lydeard et al. [28], and they have the same number of stems and loops as the models inferred for the Caenogastropoda Cacozeliana lacertina (now Cacozeliana granarium (Kiener, 1841)) and Paracrostoma paludiformis (currently Brotia paludiformis (Solem, 1966)) (available at https://crw-site.chemistry.gatech.edu/, accessed on 10 March 2023). Smith and Bond [52] observed that among spiders, the secondary structure of 16S rRNA could be phylogenetically useful at higher taxonomic levels, whereas the loops, as the most variable regions, could be used at family level relationships. No study has evaluated the phylogenetic signal of the secondary structure of the 16S rRNA among Caenogastropoda.
The length of the tRNAs varied from 62 to 73 bp in P. reevei (Table 1), and from 62 to 74 bp in P. aulanieri (Table 2), a wider range than in P. canaliculata, P. maculata and P. occulta (64–70 bp), but smaller than in P. diffusa (62–76 bp). Comparing the length variation along the whole set of 22 tRNAs in Pomacea, only tRNA-Asp had the same length in all species, whereas the most variable tRNAs were tRNA-Ile (70–76 bp), tRNA-Ala (68–74 bp) and tRNA-Thr (66–71 bp).
Most tRNAs showed the typical clover leaf secondary structure, with four arms and loops. However, both tRNA for Serine in P. reevei showed a large loop instead of the typical stem-loop structure in the DHU domain (Figure 9), whereas in P. aulanieri, only tRNA-Ser2 showed this loop (Figure S6). Yang et al. [12] reported a similar loop in the tRNA-Ser1 of P. maculata, but Yang et al. [11] indicated that all tRNAs in P. canaliculata, P. maculata and P. diffusa had the typical clover leaf structure. However, after inferring the secondary structure of the tRNA of P. canaliculata (KJ739609.1), P. maculata (MF401379.1), P. occulta (KR350466.1) and P. diffusa (MF373586.1) using ARWEN 1.2 [25], we found that in the first three species, the tRNA-Ser1 had a loop in the DHU domain, whereas in P. diffusa, tRNA-Ser2 had a loop in the same domain. Therefore, both P. aulanieri and P. diffusa of the P. bridgesii clade had a loop in tRNA-Ser2, whereas P. reevei, P. canaliculata, P. maculata and P. occulta of the P. canaliculata clade had a loop in tRNA-Ser1, although P. reevei also had a loop in tRNA-Ser2.

3.5. Control Region

The largest intergenic region of the mitochondrial genome of both species was located between tRNA-Phe and COIII and showed all the specific characteristics for the CR [53,54]: (i) represents the longest intergenic region; (ii) shows a high A+T content; (iii) has a potential secondary structure; and (iv) contains repetitive elements. We retrieved a CR length of 294 bp in P. reevei and 524 bp in P. aulanieri. Both are within the reported range in Pomacea, from 141 bp (P. occulta) to 806 bp (P. diffusa). In another Ampullariid, Marisa cornuarietis, this region is considerably smaller (63 bp) [43]. Brauer et al. [54] also found interspecific differences in the CR length of Conus, with the size of this region in Conus consors Sowerby I, 1833 (698 bp) being five-fold longer than in Conus textile Linnaeus, 1758 or Conus borgesi Trovão, 1979. The CR in Conus quercinus Lightfoot, 1786 is even longer (943 bp) [46]. Within Pomacea, species from the P. bridgesii clade (e.g., P. aulanieri) seem to have a longer CR than those of the P. canaliculata clade (e.g., P. reevei).
A repetitive unit of 12 bp (ACATACATACAT) was manually identified in the CR of P. reevei, with eight repetitions on the H-strand and three repetitions on the L-strand. A repeat unit was also found in the CR of P. aulanieri, with a length of 23 bp (ATATAATCTCTATATGTGTATGG) and six copies on the H-strand. Different repetitive units have been reported in Pomacea: 5 copies of GATACTATAATATAAA (16 bp) in P. occulta [8]; 13 copies on the H-strand and 11 repeats on the L-strand of AAGATACTATAATATA (16 bp) in P. maculata [12]; 11 repeats of TAAGATATAAAGAAACTAAGAGA (23 bp) in P. canaliculata [7]; and 19 copies on the H-strand and 18 repeats on the L-strand of ATCTATACATAC (12 bp) in P. diffusa [9]. Maynard et al. [55] found many AT repeats in the Haliotis rubra mitogenome, suggesting that if the number of AT repeats were polymorphic, it could become a marker for individual typing. The variations observed in the number and motif of the repetitive units of the mitochondrial CR of Pomacea suggest that it would be valuable to evaluate alternative strategies to resolve this repetitive region, such as long read sequencing [56].
The inferred secondary structure of the CR of P. reevei and P. aulanieri showed differences in the number and organization of stems and loops between both species (Figure 10). Similar differences have been found between the CR of Conus consors, C. borgesi and C. textile [54]. It has been suggested that stem-loop structures may start replication in animal mitochondria [57], but they have been poorly studied in molluscan mitochondrial genomes.

3.6. Genetic Variation among Pomacea

The plot of sequence variation exhibited a variable nucleotide diversity along Pomacea mitogenomes (Figure 11). The overall mean p-distance calculated for each protein-coding gene ranged from 0.127 (COI) to 0.244 (ATP8), with other genes such as NAD2 (0.213), NAD6 (0.206), NAD5 (0.198) or NAD1 (0.190) also showing elevated values. In contrast, the ribosomal RNAs showed lower variability values: 0.139 (12S rRNA) and 0.136 (16S rRNA), whereas the CR displayed the highest value of the whole mitogenome (0.435). Castellana et al. [58] found among vertebrates that COI, COII and COIII were the most conserved mitochondrial genes, contrasting with the ATP8 and NAD genes that were the most variable, whereas CytB and ATP6 showed intermediate values. Peretolchina et al. [59] compared four mitogenomes among Caenogastropoda family Baicaliidae and found little variability among COI, recommending instead COII and COIII for phylogenetic studies and CytB and NAD genes for population studies. Here, in Pomacea, we found similar patterns, with ATP8, CytB and NAD genes being the most variable, and COI, COII and COIII as the most conserved. Fonseca et al. [60] suggested that the phylogenies inferred from NAD5 are the most topologically concordant with the one produced by the whole mitogenome. Although we have not tested this for Pomacea, the high variability of this gene suggests it could be useful for phylogenetic studies, along with other genes such as CytB or NAD1. We found in Pomacea that all PCGs had Ka/Ks values below 1 (Figure S7), indicating that they were evolved under purifying selection. Among the 13 PCGs, COI showed the slowest evolutionary rate, whereas NAD6 had the fastest rate, which is concordant with a previous study in the three invasive Pomacea species [11].
In this study, we have found many differences in the mitogenome structure in Pomacea such as the presence and length of overlapping regions, PCG lengths, COIII start codons, tRNA length range, secondary structures of tRNAs for Serine and ribosomal RNA lengths, summarized in Table 5. These differences are concordant with the topology of the molecular phylogeny (Figure 12), although P. reevei of the P. canaliculata clade showed some similarities to P. bridgesii clade species such as P. aulanieri.

3.7. Phylogenetic Analysis

The phylogenetic trees recovered using Maximum Likelihood (ML) and Bayesian Inference (BI) showed an almost identical topology, except for Costapex baldwinae Harasewych, Uribe & Fedosov, 2020 within Neogastropoda (Figure 12 and Figure S8). The inference generated with BI exhibited higher support values than ML, and it was used to represent the evolutionary relationships of Caenogastropoda (Figure 12), whereas the ML tree is shown in Figure S8. Most clades on Figure 12 showed a high support (BI: 1, ML: >90), with the exception of Ampullarioidea + Viviparoidea (BI: 0.83, ML:61), which have been classified with Obscurella hidalgoi (Crosse, 1864) (Cyclophoroidea) within Architaenioglossa, although the monophyly of this group has not been recovered using mitogenomes [61].
Although mitogenome sequence KY008698.1 is identified in GenBank as P. bridgesii (Reeve, 1856), it was published as P. diffusa [10] and posteriorly analyzed with this species name [11,12]. We compared this sequence with P. diffusa MF373586.1 and found that the only difference was on the sizes of the CR, being longer in KY008698.1 due to the higher number of repetitive units. Therefore, we concluded that both sequences represent the mitogenome of P. diffusa.
The phylogenetic relationships within Ampullariidae were recovered with the highest support values, both in the BI and ML trees, with Pomacea recovered as monophyletic. Within Pomacea, we recovered two main clades: (1) P. canaliculata, P. maculata, P. occulta and P. reevei; and (2) P. diffusa and P. aulanieri. Hayes et al. [13] identified four groups within Pomacea based on nuclear and mitochondrial markers: (1) P. canaliculata clade, (2) P. bridgesii clade, (3) Effusa clade and (4) Flagellata clade. Posteriorly, P. maculata was differentiated within the P. canaliculata clade [14], and Ramírez et al. [18] recovered P. reevei (as Pomacea sp. 1) within the P. canaliculata clade and P. aulanieri within the P. bridgesii clade. These phylogenetic relationships are confirmed here based on mitochondrial genomes, and agree with previous results [11,12]. So far, recovered Pomacea mitogenomes have been restricted to the P. canaliculata and P. bridgesii clades, but no mitogenome is available for the Effusa or Flagellata clade.

4. Conclusions

Mitochondrial genomes in Pomacea are highly variable compared to other snail genera. We found striking variations in CR length between P. reevei and P. aulanieri. Moreover, compared with previously published mitogenomes, we found differences in the organization and structure of features such as the PCGs and tRNAs, consistent with the phylogenetic relationships between the P. canaliculata and P. bridgesii clades. A similar comparison with other Pomacea clades, as well as other Ampullariidae genera, would provide new insights into the evolution of these freshwater snails.
We show that comparative analysis of mitochondrial sequences can help us to better understand the evolutionary relationships within the Pomacea genus. Thus, we want to highlight the importance of generating more whole-genome sequence data in order to represent the remaining Pomacea species.

Supplementary Materials

The following supporting information can be downloaded at https://www.mdpi.com/article/10.3390/genes14091769/s1, Figure S1: Shells of voucher specimens. A. Pomacea reevei Ampuero & Ramírez, 2023 (Voucher ID: AE152NBI, GenBank Accession Number: OR253802) from Bandeja Isla, Napo river, Loreto region, Peru (2°8′2.78″ S, 74°13′16.91″ W). B. Pomacea aulanieri (Deville & Hupé, 1850) (Voucher ID: Z23HYP, GenBank Accession Number: OR253803) from Paranapura river ca. Huallaga river, Yurimaguas, Loreto region, Peru (5°52′19.3″ S, 76°7′55.1″ W). Scale bars: 20 mm. Figure S2: Relative synonymous codon usages (RSCU) in the mitogenome of P. aulanieri. Figure S3: Secondary structure of the 12S rRNA of P. aulanieri. Domains are indicated with Roman numbers and helices are numbered following Hickson et al. [27]. Figure S4: Secondary structure of the I–III domains of the 16S rRNA of P. aulanieri. Domains are indicated with Roman numbers and helices are numbered following Wuys et al. [29]. Figure S5: Secondary structure of the IV–VI domains of the 16S rRNA of P. aulanieri. Domains are indicated with Roman numbers and helices are numbered following Wuys et al. [29]. Figure S6: Secondary structures of the tRNA genes in the mitogenome of P. aulanieri. Figure S7: Evolutionary rate of the Pomacea mitogenomes published in GenBank and those from this work. Ka is the nonsynonymous nucleotide substitutions per nonsynonymous site, Ks is the synonymous nucleotide substitutions per synonymous site and Ka/Ks is ratio of nucleotide nonsynonymous to synonymous substitutions. Figure S8: Phylogenetic relationships of Caenogastropoda species based on protein-coding genes and ribosomal RNAs inferred using Maximum Likelihood (ML). Numbers on branches are bootstrap values. Pomacea species sequenced in this study are marked with an asterisk. Table S1: Codon count and relative synonymous codon usage in the mitochondrial genome of P. aulanieri. The asterisk (*) in the table indicates the stop codon.

Author Contributions

Conceptualization, R.R. and A.M.; writing—original draft preparation, A.M.; writing—review and editing, R.R.; methodology, validation and formal analyses, R.R., A.M., J.M., J.L.R., R.S.-R., R.B., F.R., A.A., N.O. and C.C.; project administration and funding acquisition, R.R. All authors have read and agreed to the published version of the manuscript.

Funding

This research was supported by the Universidad Nacional Mayor de San Marcos—RR N° 005557-2022-R, project number B22100301, RR N° 05753-2021-R (B21100471), and RR N° 03202-R-18 (B18100781). The APC was funded by Universidad Nacional Mayor de San Marcos.

Institutional Review Board Statement

Not applicable.

Informed Consent Statement

Not applicable.

Data Availability Statement

All mitogenome sequences generated in this study were deposited in GenBank under accession numbers OR253802 and OR253803.

Acknowledgments

We are grateful to R. Chujutalli and M. Solis for their help in the collection of material. We are grateful to four reviewers whose comments helped to improve the manuscript, as well as to J. C. Brealey, J. R. Applebaugh and F. A. Capps for improving the English.

Conflicts of Interest

The authors declare no conflict of interest.

References

  1. Hayes, K.A.; Cowie, R.H.; Jørgensen, A.; Schultheiß, R.; Albrecht, C.; Thiengo, S.C. Molluscan models in evolutionary biology: Apple snails (Gastropoda: Ampullariidae) as a system for addressing fundamental questions. Am. Malacol. Bull. 2009, 27, 47–58. [Google Scholar] [CrossRef]
  2. Cowie, R.H.; Hayes, K.A.; Strong, E.E.; Thiengo, S.C. Nonnative apple snails: Systematics, distribution, invasion history and reasons for introduction. In Biology and Management of Invasive Apple Snails; Joshi, R.C., Cowie, R.H., Sebastian, L.S., Eds.; Philippine Rice Research Institute (PhilRice), Filipinas: Muñoz, Philippines, 2017; pp. 3–32. [Google Scholar]
  3. Rawlings, T.A.; Hayes, K.A.; Cowie, R.H.; Collins, T.M. The identity, distribution, and impacts of non-native apple snails in the continental United States. BMC Evol. Biol. 2007, 7, 97. [Google Scholar] [CrossRef]
  4. Liu, X.; Zhou, Y.; Oulang, S.; Wu, X. Phylogeographic patterns and demographic history of Pomacea canaliculata and Pomacea maculata from different countries (Ampullariidae, Gastropoda, Mollusca). Nat. Conserv. 2019, 36, 71–92. [Google Scholar] [CrossRef]
  5. Zhao, B.; Luo, M.; Zhang, Z.; Liu, Y.; Deng, Z.; Gong, X. Genetic Diversity of Two Globally Invasive Snails in Asia and Americas in Relation with Agricultural Habitats and Climate Factors. Diversity 2022, 14, 1069. [Google Scholar] [CrossRef]
  6. Zhou, X.; Chen, Y.; Zhu, S.; Xu, H.; Liu, Y.; Chen, L. The complete mitochondrial genome of Pomacea canaliculata (Gastropoda: Ampullariidae). Mitochondrial DNA Part A 2016, 27, 884–885. [Google Scholar] [CrossRef]
  7. Yang, H.; Zhang, J.E.; Deng, Z.; Luo, H.; Guo, J.; He, S.; Luo, M.; Zhao, B. The complete mitochondrial genome of the golden apple snail Pomacea canaliculata (Gastropoda: Ampullariidae). Mitochondrial DNA Part B 2016, 1, 45–47. [Google Scholar] [CrossRef]
  8. Yang, Q.; Liu, S.; Song, F.; Li, H.; Liu, J.; Liu, G.; Yu, X.P. The mitochondrial genome of Pomacea maculata (Gastropoda: Ampullariidae). Mitochondrial DNA Part A 2015, 27, 2895–2896. [Google Scholar] [CrossRef]
  9. Liu, S.; Yang, Q.; He, C.; Yu, X. The complete mitochondrial genome of Pomacea diffusa (Gastropoda: Ampullariidae). Mitochondrial DNA Part B 2017, 2, 491–492. [Google Scholar] [CrossRef]
  10. Guo, J.; Yang, H.; Zhang, C.; Xue, H.; Xia, Y.; Zhang, J.E. Complete mitochondrial genome of the apple snail Pomacea diffusa (Gastropoda, Ampullariidae) with phylogenetic consideration. Mitochondrial DNA Part B 2017, 2, 865–867. [Google Scholar] [CrossRef]
  11. Yang, H.; Zhang, J.E.; Xia, J.; Yang, J.; Guo, J.; Deng, Z.; Luo, M. Comparative characterization of the complete mitochondrial genomes of the three apple snails (Gastropoda: Ampullariidae) and the phylogenetic analyses. Int. J. Mol. Sci. 2018, 19, 3646. [Google Scholar] [CrossRef]
  12. Yang, Q.; Liu, S.; Song, F.; Liu, G.F.; Yu, X.P. Comparative mitogenome analysis on species of four apple snails (Ampullariidae: Pomacea). Int. J. Biol. Macromol. 2018, 118, 525–533. [Google Scholar] [CrossRef] [PubMed]
  13. Hayes, K.A.; Cowie, R.H.; Thiengo, S.C. A global phylogeny of apple snails: Gondwanan origin, generic relationships, and the influence of outgroup choice (Caenogastropoda: Ampullariidae). Biol. J. Linn. Soc. 2009, 98, 61–76. [Google Scholar] [CrossRef]
  14. Hayes, K.A.; Cowie, R.H.; Thiengo, S.C.; Strong, E.E. Comparing apples with apples: Clarifying the identities of two highly invasive Neotropical Ampullariidae (Caenogastropoda). Zool. J. Linn. Soc. 2012, 166, 723–753. [Google Scholar] [CrossRef]
  15. Yang, Q.; Yu, X. A new species of apple snail in the genus Pomacea (Gastropoda: Caenogastropoda: Ampullariidae). Zool. Stud. 2019, 58, 13. [Google Scholar] [CrossRef]
  16. Ramírez, R.; Paredes, C.; Arenas, J. Moluscos del Perú. Revista de Biología Tropical 2003, 51 (Suppl. 3), 225–284. [Google Scholar]
  17. Ramírez, R.; Solis, M.; Ampuero, A.; Morín, J.; Jimenez-Vasquez, V.; Ramirez, J.; Congrains, C.; Temoche, H.; Shiga, Y.B. Identificación molecular y relaciones evolutivas de Pomacea nobilis, base para la autenticación específica del churo negro de la Amazonia peruana. Revista Peruana de Biología 2020, 27, 139–148. [Google Scholar] [CrossRef]
  18. Ramírez, R.; Ramírez, J.L.; Rivera, F.; Justino, S.; Solis, M.; Morín, J.; Ampuero, A.; Mendivil, A.; Congrains, C. Do not judge a snail by its shell: Molecular identification of Pomacea (Ampullariidae) species, with particular reference to the Peruvian Amazonian giant apple snail. Archiv für Molluskenkunde 2022, 151, 7–17. [Google Scholar] [CrossRef]
  19. Ampuero, A.; Ramirez, R. Description of two new species of apple snail (Ampullariidae: Pomacea) from Peruvian Amazonia. Zootaxa 2023, 5258, 76–98. [Google Scholar] [CrossRef]
  20. Sturm, C.F.; Mayhew, R.; Bales, B.R. Field and laboratory methods in malacology. In The Mollusks: A Guide to Their Study, Collection, and Preservation; Sturm, C.F., Pearce, T.A., Valdes, A., Eds.; American Malacological Society: Pittsburgh, PA, USA, 2006; pp. 9–31. [Google Scholar]
  21. Chen, S.; Zhou, Y.; Chen, Y.; Gu, J. fastp: An ultra-fast all-in-one FASTQ preprocessor. Bioinformatics 2018, 34, 884–890. [Google Scholar] [CrossRef]
  22. Jin, J.; Yu, W.; Yang, J.; Song, Y.; dePamphilis, C.W.; Yi, T.; Li, D. GetOrganelle: A fast and versatile toolkit for accurate de novo assembly of organelle genomes. Genome Biol. 2020, 21, 241. [Google Scholar] [CrossRef]
  23. Wick, R.R.; Schultz, M.B.; Zobel, J.; Holt, K.E. Bandage: Interactive visualization of de novo genome assemblies. Bioinformatics 2015, 31, 3350–3352. [Google Scholar] [CrossRef] [PubMed]
  24. Donath, A.; Jühling, F.; Al-Arab, M.; Bernhart, S.H.; Reinhardt, F.; Stadler, P.F.; Middendorf, M.; Bernt, M. Improved annotation of protein-coding genes boundaries in metazoan mitochondrial genomes. Nucleic Acids Res. 2019, 47, 10543–10552. [Google Scholar] [CrossRef] [PubMed]
  25. Laslett, D.; Canbäck, B. ARWEN, a program to detect tRNA genes in metazoan mitochondrial nucleotide sequences. Bioinformatics 2008, 24, 172–175. [Google Scholar] [CrossRef] [PubMed]
  26. Sweeney, B.A.; Hoksza, D.; Nawrocki, E.P.; Ribas, C.E.; Madeira, F.; Cannone, J.J.; Gutell, R.; Maddala, A.; Meade, C.D.; Williams, L.D.; et al. R2DT is a framework for predicting and visualising RNA secondary structure using templates. Nat. Commun. 2021, 12, 3494. [Google Scholar] [CrossRef]
  27. Hickson, R.E.; Simon, C.; Cooper, A.; Spicer, G.S.; Sullivan, J.; Penny, D. Conserved Sequence Motifs, Alignment, and Secondary Structure for the Third Domain of Animal 12S rRNA. Mol. Biol. Evol. 1996, 13, 150–169. [Google Scholar] [CrossRef] [PubMed]
  28. Lydeard, C.; Holznagel, W.E.; Schnare, M.N.; Gutell, R.R. Phylogenetic Analysis of Molluscan Mitochondrial LSU rDNA Sequences and Secondary Structures. Mol. Phylogenet. Evol. 2000, 15, 83–102. [Google Scholar] [CrossRef]
  29. Wuys, J.; De Rijk, P.; Van de Peer, Y.; Winkelmans, T.; De Watcher, R. The European large subunit ribosomal RNA database. Nucleic Acids Res. 2001, 29, 175–177. [Google Scholar]
  30. Stothard, P.; Grant, J.R.; Van Domselaar, G. Visualizing and comparing circular genomes using the CGView family of tools. Brief. Bioinform. 2019, 20, 1576–1582. [Google Scholar] [CrossRef]
  31. Kumar, S.; Stecher, G.; Li, M.; Knyaz, C.; Tamura, K. MEGA X: Molecular evolutionary genetics analysis across computing platforms. Mol. Biol. Evol. 2018, 35, 1547–1549. [Google Scholar] [CrossRef]
  32. Perna, N.T.; Kocher, T.D. Patterns of nucleotide composition at fourfold degenerate sites of animal mitochondrial genomes. J. Mol. Evol. 1995, 41, 353–359. [Google Scholar] [CrossRef]
  33. Rozas, J.; Ferrer-Mata, A.; Sánchez-Delbarrio, J.C.; Guirao-Rico, S.; Librado, P.; Ramos-Onsins, S.E.; Sánchez-Gracia, A. DnaSP v6: DNA Sequence Polymorphism Analysis of Large Dataset. Mol. Biol. Evol. 2017, 34, 3299–3302. [Google Scholar] [CrossRef]
  34. Edgar, R.C. MUSCLE: Multiple sequence alignment with high accuracy and high throughput. Nucleic Acids Res. 2004, 32, 1792–1797. [Google Scholar] [CrossRef] [PubMed]
  35. Larsson, A. AliView: A fast and lightweight alignment viewer and editor for large datasets. Bioinformatics 2014, 30, 3276–3278. [Google Scholar] [CrossRef] [PubMed]
  36. Talavera, G.; Castresana, J. Improvement of Phylogenies after Removing Divergent and Ambiguously Aligned Blocks from Protein Sequence Alignments. Syst. Biol. 2007, 56, 564–577. [Google Scholar] [CrossRef] [PubMed]
  37. Zhang, D.; Gao, F.; Jakovlić, I.; Zou, H.; Zhang, J.; Li, W.X.; Wang, G.T. PhyloSuite: An integrated and scalable desktop platform for streamlined molecular sequence data management and evolutionary phylogenetics studies. Mol. Ecol. Resour. 2020, 20, 348–355. [Google Scholar] [CrossRef]
  38. Lanfear, R.; Frandsen, P.B.; Wright, A.M.; Senfeld, T.; Calcott, B. PartitionFinder 2: New Methods for Selecting Partitioned Models of Evolution for Molecular and Morphological Phylogenetic Analyses. Mol. Biol. Evol. 2017, 34, 772–773. [Google Scholar] [CrossRef]
  39. Nguyen, L.; Schmidt, H.A.; Von Haeseler, A.; Minh, B.Q. IQ-TREE: A fast and effective stochastic algorithm for estimating maximum likelihood phylogenies. Mol. Biol. Evol. 2015, 32, 268–274. [Google Scholar] [CrossRef]
  40. Miller, M.A.; Pfeiffer, W.; Schwartz, T. Creating the CIPRES Science Gateway for inference of large phylogenetic trees. In Proceedings of the Gateway Computing Environments Workshop (GCE), New Orleans, LA, USA, 14 November 2010. [Google Scholar] [CrossRef]
  41. Ronquist, F.; Teslenko, M.; Van Der Mark, P.; Ayres, D.L.; Darling, A.; Höhna, S.; Larget, B.; Liu, L.; Suchard, M.A.; Huelsenbeck, J.P. MrBayes 3.2: Efficient Bayesian Phylogenetic Inference and Model Choice Across a Large Model Space. Syst. Biol. 2012, 61, 539–542. [Google Scholar] [CrossRef]
  42. Rambaut, A. FigTree v1.4.4. 2018. Available online: http://tree.bio.ed.ac.uk/software/figtree/ (accessed on 30 May 2022).
  43. Wang, M.; Qiu, J. Complete mitochondrial genome of the giant ramshorn snail Marisa cornuarietis (Gastropoda: Ampullariidae). Mitochondrial DNA 2014, 27, 1734–1735. [Google Scholar] [CrossRef]
  44. Bandyopadhyay, P.K.; Stevenson, B.J.; Ownby, J.P.; Cady, M.T.; Watkins, M.; Olivera, B.M. The mitochondrial genome of Conus textile, coxI-coxII intergenic sequences and Conoidean evolution. Mol. Phylogenetics Evol. 2008, 46, 215–223. [Google Scholar] [CrossRef]
  45. Rawlings, T.A.; Macinnis, M.J.; Bieler, R.; Boore, J.L.; Collins, T.M. Sessile snails, dynamic genomes: Gene rearrangements within the mitochondrial genome of a family of caenogastropod molluscs. BMC Genom. 2010, 11, 440. [Google Scholar] [CrossRef] [PubMed]
  46. Gao, B.; Peng, C.; Chen, Q.; Zhang, J.; Shi, Q. Mitochondrial genome sequencing of a vermivorous cone snail Conus quercinus supports the correlative analysis between phylogenetic relationships and dietary types of Conus species. PLoS ONE 2018, 13, e0193053. [Google Scholar] [CrossRef]
  47. Sun, S.; Li, Q.; Kong, L.; Yu, H. Multiple reversals of strand asymmetry in molluscs mitochondrial genomes, and consequences for phylogenetic inference. Mol. Phylogenetics Evol. 2018, 118, 222–231. [Google Scholar] [CrossRef] [PubMed]
  48. Simon, C.; Frati, F.; Beckenbach, A.; Crespi, B.; Liu, H.; Flook, P. Evolution, weighting, and phylogenetic utility of mitochondrial gene sequences and a compilation of conserved PCR primers. Ann. Entomol. Soc. Am. 1994, 87, 651–701. [Google Scholar] [CrossRef]
  49. Medina, M.; Collins, T.M.; Walsh, P.J. Mtdna Ribosomal Gene Phylogeny of Sea Hares in the Genus Aplysia (Gastropoda, Opisthobranchia, Anaspidea): Implications for Comparative Neurobiology. Syst. Biol. 2001, 50, 7676–7688. [Google Scholar] [CrossRef]
  50. Vogler, R.E.; Beltramino, A.A.; Strong, E.E.; Rumi, A.; Peso, J.G. Insights into the Evolutionary History of an Extinct South American Freshwater Snail Based on Historical DNA. PLoS ONE 2016, 11, e0169191. [Google Scholar] [CrossRef]
  51. Guzmán, L.B.; Vogler, R.E.; Beltramino, A.A. The mitochondrial genome of the semi-slug Omalonyx unguis (Gastropoda: Succineidae) and the phylogenetic relationships within Stylommatophora. PLoS ONE 2021, 16, e0253724. [Google Scholar] [CrossRef]
  52. Smith, S.D.; Bond, J.E. An analysis of the secondary structure of the mitochondrial large subunit rRNA gene (16S) in spiders and its implications for phylogenetic reconstruction. J. Arachnol. 2003, 31, 44–54. [Google Scholar] [CrossRef]
  53. Soroka, M. Characteristics of mitochondrial DNA of unionid bivalves (Mollusca: Bivalvia: Unionidae). II. Comparison of complete sequences of maternally inherited mitochondrial genomes of Sinanodonta woodiana and Unio pictorum. Folia Malacol. 2010, 18, 189–209. [Google Scholar] [CrossRef]
  54. Brauer, A.; Kurz, A.; Stockwell, T.; Baden-Tillson, H.; Heidler, J.; Wittig, I.; Kauferstein, S.; Mebs, D.; Stöcklin, R.; Remm, M. The Mitochondrial Genome of the Venomous Cone Snail Conus consors. PLoS ONE 2012, 7, e51528. [Google Scholar] [CrossRef]
  55. Maynard, B.T.; Kerr, L.J.; Mckiernan, J.M.; Jansen, E.S.; Hanna, P.J. Mitochondrial DNA sequence and gene organization in the Australian blacklip abalone Haliotis rubra (Leach). Mar. Biotechnol. 2005, 7, 645–658. [Google Scholar] [CrossRef] [PubMed]
  56. Ramón-Laca, A.; Gallego, R.; Nichols, K.M. Affordable de novo generation of fish mitogenomes using amplification-free enrichment of mitochondrial DNA and deep sequencing of long fragments. Mol. Ecol. Resour. 2023, 23, 818–832. [Google Scholar] [CrossRef] [PubMed]
  57. Clayton, D.A. Replication and transcription of vertebrate mitochondrial DNA. Annu. Rev. Cell Biol. 1991, 7, 453–478. [Google Scholar] [CrossRef]
  58. Castellana, S.; Vicario, S.; Saccone, C. Evolutionary Patterns of the Mitochondrial Genome in Metazoa: Exploring the Role of Mutation and Selection in Mitochondrial Protein–Coding Genes. Genome Biol. Evol. 2011, 3, 1067–1079. [Google Scholar] [CrossRef] [PubMed]
  59. Peretolchina, T.E.; Sitnikova, T.Y.; Sherbakov, D.Y. The complete mitochondrial genomes of four Baikal molluscs from the endemic family Baicaliidae (Caenogastropoda: Truncatelloida). J. Molluscan Stud. 2020, 86, 201–209. [Google Scholar] [CrossRef]
  60. Fonseca, M.M.; Lopes-Lima, M.; Eackles, M.S.; King, T.L.; Froufe, E. The female and male mitochondrial genomes of Unio delphinus and the phylogeny of freshwater mussels (Bivalvia: Unionida). Mitochondrial DNA B 2016, 1, 954–957. [Google Scholar] [CrossRef]
  61. Osca, D.; Templado, J.; Zardoya, R. Caenogastropod mitogenomics. Mol. Phylogenetics Evol. 2015, 93, 118–128. [Google Scholar] [CrossRef]
Figure 1. Graphical map of the mitochondrial genomes of Pomacea reevei and Pomacea aulanieri.
Genes 14 01769 g001
Figure 2. A + T content of the mitochondrial genome of P. aulanieri, P. canaliculata, P. diffusa, P. maculata, P. occulta and P. reevei. (PCGs: Protein-Coding Genes).
Genes 14 01769 g002
Figure 3. AT-skew of the mitochondrial genome of P. aulanieri, P. canaliculata, P. diffusa, P. maculata, P. occulta and P. reevei. (PCGs: Protein-Coding Genes).
Genes 14 01769 g003
Figure 4. GC-skew of the mitochondrial genome of P. aulanieri, P. canaliculata, P. diffusa, P. maculata, P. occulta and P. reevei. (PCGs: Protein-Coding Genes).
Genes 14 01769 g004
Figure 5. Relative synonymous codon usages (RSCU) in the mitogenome of P. reevei.
Genes 14 01769 g005
Figure 6. Secondary structure of the 12S rRNA of P. reevei. Domains are indicated with Roman numbers and helices are numbered following Hickson et al. [27].
Genes 14 01769 g006
Figure 7. Secondary structure of the I–III domains of the 16S rRNA of P. reevei. Domains are indicated with Roman numbers and helices are numbered following Wuys et al. [29].
Genes 14 01769 g007
Figure 8. Secondary structure of the IV–VI domains of the 16S rRNA of P. reevei. Domains are indicated with Roman numbers and helices are numbered following Wuys et al. [29].
Genes 14 01769 g008
Figure 9. Secondary structures of the tRNA genes in the mitogenome of P. reevei.
Genes 14 01769 g009
Figure 10. Secondary structure of the control region of P. reevei and P. aulanieri.
Genes 14 01769 g010
Figure 11. Nucleotide diversity (π) among the Pomacea mitogenomes available in GenBank and the mitogenomes included in this study.
Genes 14 01769 g011
Figure 12. Phylogenetic relationships of Caenogastropoda species based on protein-coding genes and ribosomal RNAs, inferred with Bayesian Inference. Numbers on branches are Maximum Likelihood bootstrap values (left) and posterior probabilities from BI (right). Pomacea species sequenced in this study are marked with an asterisk.
Genes 14 01769 g012
Table 1. Organization of the mitochondrial genome of P. reevei.
GeneStrandPositionSize (bp)Intergenic LengthAnticodonStart CodonStop Codon
COIH1–1536153618-ATGTAA
COIIH1555–224168714-ATGTAA
tRNA-AspH2256–2323680GTC--
ATP8H2324–24821598-ATGTAA
ATP6H2491–318969933-ATGTAG
tRNA-MetL3223–32886639CAT--
tRNA-TyrL3328–33936638GTA--
tRNA-CysL3432–3493623GCA--
tRNA-TrpL3497–3562668TCA--
tRNA-GlnL3571–3633635TTG--
tRNA-GlyL3639–37046626TCC--
tRNA-GluL3731–3797670TTC--
12S rRNAH3798–47069090---
tRNA-ValH4707–4772660TAC--
16S rRNAH4773–611213400---
tRNA-Leu1H6113–6175630TAG--
tRNA-Leu2H6176–6241660TAA--
NAD1H6242–718093913-ATGTAA
tRNA-ProH7194–7260670TGG--
NAD6H7261–775549510-ATGTAA
CytBH7766–890511403-ATGTAA
tRNA-Ser2H8909–89736535TGA--
tRNA-ThrL9009–9074667TGT--
NAD4LH9082–9378297−7-ATGTAA
NAD4H9372–10,745137438-ATGTAA
tRNA-HisH10,784–10,849660GTG--
NAD5H10,850–12,5561707−2-ATGTAA
tRNA-PheH12,555–12,622680GAA--
CR-12,623–12,9142920---
COIIIH12,915–13,69478027-ATGTAA
tRNA-LysH13,722–13,7876617TTT--
tRNA-AlaH13,805–13,8726821TGC--
tRNA-ArgH13,894–13,963702TCG--
tRNA-AsnH13,966–14,0387315GTT--
tRNA-IleH14,054–14,123700GAT--
NAD3H14,124–14,47735440-ATGTAA
tRNA-Ser1H14,518–14,584670GCT--
vNAD2H14,585–15,65810742-ATGTAA
Table 2. Organization of the mitochondrial genome of P. aulanieri.
GeneStrandPositionSize (bp)Intergenic LengthAnticodonStart CodonStop Codon
COIH1–1536153635-ATGTAA
COIIH1572–225868727-ATGTAA
tRNA-AspH2286–2353680GTC--
ATP8H2354–251215930-ATGTAG
ATP6H2543–324169928-ATGTAG
tRNA-MetL3270–33326321CAT--
tRNA-TyrL3354–34186522GTA--
tRNA-CysL3441–35026222GCA--
tRNA-TrpL3525–35906625TCA--
tRNA-GlnL3616–36816626TTG--
tRNA-GlyL3708–37746734TCC--
tRNA-GluL3809–3873650TTC--
12S rRNAH3874–48339600---
tRNA-ValH4834–4900670TAC--
16S rRNAH4901–624813480---
tRNA-Leu1H6249–6312640TAG--
tRNA-Leu2H6313–6381690TAA--
NAD1H6382–73269459-ATGTAA
tRNA-ProH7336–740267−1TGG--
NAD6H7402–789649510-ATGTAA
CytBH7907–9046114015-ATGTAA
tRNA-Ser2H9062–91276629TGA--
tRNA-ThrL9157–92277110TGT--
NAD4LH9238–9534297−7-ATGTAA
NAD4H9528–10,889136210-ATGTAA
tRNA-HisH10,900–10,964650GTG--
NAD5H10,965–12,6921728−21-ATGTAA
tRNA-PheH12,672–12,740690GAA--
CR-12,741–13,2645240-
COIIIH13,265–14,04478065-ATGTAA
tRNA-LysH14,110–14,1766810TTT--
tRNA-AlaH14,187–14,2607445TGC--
tRNA-ArgH14,306–14,3746910TCG--
tRNA-AsnH14,385–14,4557127GTT--
tRNA-IleH14,483–14,552705GAT--
NAD3H14,558–14,91135439-ATGTAG
tRNA-Ser1H14,951–15,02070−1GCT--
NAD2H15,020–16,09310743-ATGTAG
Table 3. Nucleotide composition of the mitogenome of P. reevei and P. aulanieri.
FeatureLengthA%T%C%G%%A + T%G + CAT-SkewGC-Skew
Whole mitogenome
P. reevei15,66030.1040.8813.1415.8770.9829.02−0.1520.094
P. aulanieri16,09629.4839.3714.8316.3268.8531.15−0.1440.048
PCGs
P. reevei11,24127.5242.4513.9516.0869.9830.02−0.2130.071
P. aulanieri11,25626.8740.7015.6716.7667.5732.43−0.2050.033
rRNAs
P. reevei225137.2335.4111.2816.0872.6327.370.0250.175
P. aulanieri230836.7434.8411.9216.5171.5828.420.0270.162
tRNAs
P. reevei146535.7736.0411.9516.2571.8128.19−0.0040.153
P. aulanieri148534.2835.3512.9317.4469.6330.37−0.0150.149
CR
P. reevei29236.6440.759.2513.3677.4022.60−0.0530.182
P. aulanieri52433.4038.1716.6011.8371.5628.44−0.067−0.168
Table 4. Codon count and relative synonymous codon usage in the mitochondrial genome of P. reevei. The asterisk (*) in the table indicates the stop codon.
CodonCountRSCUCodonCountRSCUCodonCountRSCUCodonCountRSCU
UUU(F)3111.83UCU(S)1202.59UAU(Y)1081.59UGU(C)311.41
UUC(F)290.17UCC(S)250.54UAC(Y)280.41UGC(C)130.59
UUA(L)3673.54UCA(S)561.21UAA(*)121.85UGA(W)751.44
UUG(L)620.6UCG(S)90.19UAG(*)10.15UGG(W)290.56
CUU(L)1000.97CCU(P)742.24CAU(H)611.54CGU(R)221.54
CUC(L)100.11CCC(P)170.52CAC(H)180.46CGC(R)60.42
CUA(L)670.65CCA(P)310.94CAA(Q)691.84CGA(R)231.68
CUG(L)140.14CCG(P)100.3CAG(Q)60.16CGG(R)50.35
AUU(I)2811.82ACU(T)832.17AAU(N)1121.62AGU(S)601.3
AUC(I)280.18ACC(T)160.39AAC(N)260.38AGC(S)190.41
AUA(M)1621.52ACA(T)471.23AAA(K)811.62AGA(S)621.34
AUG(M)510.48ACG(T)80.21AAG(K)190.38AGG(S)190.41
GUU(V)1141.84GCU(A)1462.51GAU(D)651.76GGU(G)811.39
GUC(V)190.32GCC(A)190.35GAC(D)90.24GGC(G)230.4
GUA(V)831.34GCA(A)601.04GAA(E)621.51GGA(G)701.22
GUG(V)310.5GCG(A)60.1GAG(E)190.49GGG(G)570.99
Table 5. Comparison of mitogenome features in Pomacea, where (+) indicates presence and (−) indicates absence of the feature.
FeatureP. reeveiP. aulanieriP. diffusaP. canaliculataP. maculataP. occulta
Overlapping NAD5/tRNA-Phe+++
Overlapping NAD1/tRNA-Pro+++
ATP6 length (bp)699699714699699699
NAD1 length (bp)939945945960960960
NAD2 length (bp)107410741071106210621065
NAD4 length(bp)137413621362136813681368
NAD5 length (bp)170717281728171017101710
Start codon COIIIATGATGATGATAATAATA
Range of tRNAs length (bp)121315777
Tallo D en tRNA-Ser1++
Tallo D en tRNA-Ser2+++
12S rRNA length (bp)909960952929936934
16S rRNA length (bp)134013481346133413361331
Disclaimer/Publisher’s Note: The statements, opinions and data contained in all publications are solely those of the individual author(s) and contributor(s) and not of MDPI and/or the editor(s). MDPI and/or the editor(s) disclaim responsibility for any injury to people or property resulting from any ideas, methods, instructions or products referred to in the content.

